system performance improvement briefs - hud … quality and analysis for system performance...
TRANSCRIPT

1
INTRODUCTION To improve system performance for people experiencing homelessness, Continuums of Care (CoC) need to understand how well their system is doing on HUD’s System Performance Measures. This type of system evaluation should include an assessment of whether data quality problems are affecting the accuracy of their System Performance Measures (SPM) report. It also should include an analysis by population, project, and other factors to determine which areas of their system have the largest impact on performance. This brief gives key steps to analyzing the SPM and troubleshooting data quality issues known to influence performance results.
How to Use This Brief
This brief is for staff and committees interpreting the CoC’s performance data and for Homeless Management Information System (HMIS) Lead Agency staff responsible for generating the SPM report. It is part of a series of system performance resources and should be read in conjunction with two companion briefs: CoC Data Quality, which provides a framework for understanding, monitoring, and improving overall data quality so information is reliable and accurate; and Strategies for System Performance Improvement, which identifies high-impact strategies for improving performance year-round.
Communities can use these resources in different ways. A CoC might conduct performance analysis prior to selecting a system improvement strategy, which will help to focus efforts on the most impactful approaches. A community less confident about the accuracy of its data or analytics capabilities might choose to implement strategies to improve system performance, while continuing to monitor and improve data quality. Whatever a CoC’s system improvement approach, HUD expects that performance data will be used in ongoing system planning efforts.
UNDERSTANDING THE
SYSTEM PERFORMANCE
MEASURES The SPMs are designed to measure a community’s performance as a coordinated system.
Measure 3 (number of homeless persons) directly assesses a CoC’s progress toward eliminating homelessness, by counting the number of people experiencing homelessness both at a point in time and over the course of a year. The other measures help communities understand how well they are reducing the number of people becoming homeless (Measures 2 and 5) and helping people become quickly and stably housed (Measures 1, 4, and 7). Measure 6 helps communities understand both of these goals for families and youth defined as homeless under other federal laws
System Performance Improvement Briefs Data Quality and Analysis for
System Performance Improvement July 2017
Contents
▪ Understanding the SystemPerformance Measures
▪ Diagnosing SystemPerformance
▪ Measure-by-Measure SystemPerformance Diagnosis
2
(Category 3). No CoC has been approved to serve this group of persons so data is not being collected for Measure 6. As shown in the figure above, the measures must be analyzed together for an accurate picture of system performance.
CoCs should develop and implement strategies to improve performance. The Strategies for System Performance Improvement brief can assist CoCs in this process. CoCs then need to continue to assess data quality and analyze performance to determine whether performance improvement strategies are having the intended effect.
HUD developed the seven SPMs using data elements available in HMIS; definitions and a more thorough explanation of each measure, including its expected outcome and client universe, are available in HUD’s System Performance Measures Introductory Guide. To help CoCs understand how to calculate the measures, HUD developed whiteboard CoC System Performance Measures Videos. The System Performance Measure Programming Specifications and Table Shells provide additional documentation about the data collected and analyzed in the SPM report.
HUD places particular emphasis on three of the measures: length of time persons remain homeless (Measure 1), successful placement in and retention of housing (Measure 7), and returns to homelessness (Measure 2). These measures evaluate a homeless assistance system’s performance on the most effective practices currently known, and assess results of HUD investments.
DIAGNOSING SYSTEM PERFORMANCE Understanding system performance is a broader task than the CoC merely running a SPM report annually. To confidently submit system-wide data, the CoC must monitor system performance regularly and frequently, and put significant effort into understanding the results it is submitting. With deeper understanding of the results, the measures can be the foundation for a data quality plan, inform system planning activities and resource investments, inform local evaluation criteria, and be used to monitor the results of system-wide changes.
Looking Beyond Project Data to the System as a Whole
A CoC is used to evaluating project-level performance by looking at individual outcomes such as exits to and retention of permanent housing, length of stay in the project, and increase in income. These reports measure the effectiveness of a project at serving participants while they are enrolled. But they do not tell the whole story. Individual projects may have high performance on their defined outcomes even while the system as a whole does a poor job of preventing and ending homelessness in the community. An individual project cannot measure participants’ overall experience of homelessness and the homeless system as they move from one project to another, nor can it measure whether persons assisted by a project later return to another project elsewhere in the system.
The SPMs use data about people’s interactions with multiple projects across the homeless system to evaluate whether the system is making homelessness rare, brief, and non-recurring. The SPM report calculates how long people are homeless in all the projects they receive services from in the system, whether they successfully exit the homeless system to permanent housing, and whether they later return to homelessness after exiting to permanent housing. This evaluation of HMIS records across the system is very different from reporting on project-level outcomes. Understanding the difference between these two types of data is key when reviewing data quality and analyzing its impact on the CoC’s performance.
Assessing Data Quality in the System Performance Measures Report
The SPMs rely on data from a CoC’s HMIS. The annual SPM report covers the federal fiscal year (October 1 through September 30) and includes data from that reporting period and up to two years prior to that period.

3
Although the SPM report covers a relatively long timeframe, the number of HMIS data elements it analyzes are limited to just a handful that are relevant to each measure. This means that as a CoC reviews its data quality and performance, it does not need to consider every single data element over the entire time its HMIS has been active. Instead, it can filter its review of data quality and performance to just that limited set of data elements related to the measures. The relevant data elements and timeframes required for each measure analyzed in the SPM report are shown in Chart A: Critical System Data for the System Performance Measure Report.

4
Chart A: Critical System Data for the System Performance Measure Report
Measure 1: Length of
Homelessness
Measure 2: Returns to
Homelessness
Measure 3: Number of
People
Measure 4: Income
Measure 5: First-time
Homelessness
Measure 7: Successful
Placements
Client Universe: Each measure looks at a different pool of clients – clients who entered, exited, or were active in any of the included project types during the reporting period or prior periods
Active during the reporting
period
Exited to a permanent
destination 1 and 2 reporting
periods prior
Active during the reporting
period
Active during the reporting
period
Entered a project during the reporting
period
Exited a project during the reporting
period
Data Analysis Period: CoCs will need to consider data quality for the full data analysis period to fully understand the report results
Reporting period, plus a
2-year lookback
1 and 2 periods ago through
current reporting
period
Reporting period
Reporting period
Reporting period, plus a
2-year lookback
Reporting period
Project Type Groupings: Some measures look at one project at a time, while others cluster multiple project types together. If enrollments overlap, it may have an impact on results
ES and SH ES, SH, and TH
SO ES SH TH PH
ES SH TH ES, SH, and TH
SH, TH, RRH, and PSH (CoC funded only)
ES, SH, and TH ES, SH, TH, and PH
SO ES, SH, TH, and RRH PSH and OPH
Conflicting Enrollments: Enrollments in these project types that overlap with the included project types will cause the overlapping time in the included project type to be deleted from the measure
PSH RRH (after residential move-in) OPH
Data Elements Included in the Measure: Each Measure relies on only a handful of data elements. When considering data quality to improve the accuracy of the report, prioritize review of these data elements for the data analysis period. Please note: The data elements outlined below are based on the 2017 HMIS Data Standards. See the 2017 HMIS Data Dictionary for more information about changes to data element 3.10 and 3.20.
2.4: Project Type X X X X X X
2.5: Method for Tracking Emergency Shelter Utilization
X
2.6 Federal Partner Funding Source
X
3.3 Date of Birth X
3.10 Project Start Date X X X X X X
3.11 Project Exit Date X X X X X X
3.12 Destination X X
4.2 Income and Sources X
3.20 Housing Move-in Date X

5
Causes of Data Quality Issues and Their Solutions
Ensuring HMIS data are complete and accurate, and the HMIS contains data for all people experiencing homelessness in the CoC are priorities for HUD and for CoCs. HUD has a number of resources to assist CoCs with improving their data quality including, the HMIS Data Quality Framework which is contained in the HMIS Standard Reporting Terminology Glossary, the CoC Data Quality brief, and the HUD System Performance Measures: Guidance to Check SPM Data and Have Confidence in Numbers webinar.
Data quality issues can have several common causes, each prompting a different solution:
▪ Programming: The SPM report is a very complex, looking across enrollments in a relatively new way. Local HMIS vendors have worked diligently with CoCs to program their reports based on HUD programming specifications, but there can still be errors. A CoC with any of the programming errors identified below should contact its HMIS vendor before attempting to further analyze its results.
▪ Coverage: If some of a CoC’s providers are not participating in the HMIS, it will be difficult to determine whether the data accurately reflect what is happening across the system. The results will reflect only those projects that are participating, which could have different utilization or outcomes than the non-participating projects. This factor is especially important for emergency shelter and street outreach projects, because data from these projects play an essential role in understanding length of time homeless (Measure 1) and returns to homelessness (Measure 2). A CoC must reach out to these projects to make the case for them to enter data into HMIS.
▪ Project Setup: A project that is set up incorrectly in the HMIS will cause inaccurate results in the SPM report. o Projects must be assigned the correct Project Type (Data Element 2.4): An incorrect project type can lead to
an incorrect calculation of a measure, potentially skewing the results. A CoC must review the project types described in the HMIS Project Descriptor Data Elements Manual and use the HMIS Project Set Up Tool to ensure the project is set up correctly (see “Project Type Groupings” in Appendix B). Note that changing a project’s type in HMIS without closing and re-opening the project can create many data quality problems which may not be correctable. A CoC with incorrect project types should work with its HMIS vendor or submit a question to HUD via the Ask A Question desk on the HUD Exchange to receive appropriate guidance.
o Emergency shelter projects must be assigned the correct Method for Tracking Emergency Shelter Utilization (Data Element 2.5): The HMIS is programmed differently when reporting on active clients and bed nights in “night-by-night” and “entry/exit” shelters. Choosing the wrong method for tracking utilization will lead to problems generating an accurate SPM report.
o Projects must be associated with the correct Federal Partner Funding Source (Data Element 2.6): Some measures are limited to projects with specific funding sources. Accurately setting up this information in HMIS ensures such projects are included in the SPM report correctly.
▪ Data Completeness, Accuracy, Timeliness, and Consistency: Accurate client-level data must be gathered about each client served in the data analysis period, for each data element relevant to the respective measure. The data must also be entered into the HMIS correctly. Correct entry and exit dates, destination, income and sources, and residential/housing move-in dates are the most crucial data elements for the SPM results. Client identifier information used for deduplicating clients across project enrollments is also important for a CoC to review. Without accurate deduplication results, the measures may not reflect the reality of system use.
Data Quality Reporting for the System Performance Measures Report in HDX
Using the HMIS Data Quality Framework, HUD has added a new data quality tab to the SPM module that CoCs use to report their SPMs in the Homelessness Data Exchange (HDX). The addition of data quality elements is a starting place for improving the accuracy of the measures. Over time, HUD intends to increase the depth and scope of the data quality review, using the HMIS Data Quality Framework as a base.

6
The initial information reported in the data quality tab is broken down by year and by project type or groups of project types. HMIS participation (coverage rate) is prepopulated from the Housing Inventory Count (HIC) data in HDX. The other information for the tab is generated from the HMIS Data Quality Report. This information is number of people served; total number of leavers; and number of leavers with destination at exit of Don’t Know, Refused, or Missing. HDX automatically calculates a destination error rate from this information. CoCs should use the HMIS Data Quality Report as part of their data quality plan to identify and resolve data quality issues, particularly issues related to these three pieces of information required for the SPMs data quality tab.
Analyzing Performance in the System Performance Measures Report
The SPM report is a starting point for performance analysis, which can be conducted in conjunction with other available reports (e.g., the Annual Performance Report (APR), the Annual Homeless Assessment Report (AHAR), Point-in-Time (PIT) count data) and local data sources (e.g., coordinated entry data, vendor- and CoC-designed reports) to identify factors contributing to performance results. Levels of data analysis and sample evaluation questions are outlined below.
Type of Analysis Sample Analysis Questions
Population Level Does outcome achievement vary within populations or subpopulations?
Project Level Do certain projects of the same project type achieve relatively better/worse outcomes?
Trends Over Time Is performance improving, staying the same, or getting worse from year to year?
Service Use Patterns What are the characteristics of participants in each group, what types of services are they receiving, and which providers are they working with?
MEASURE-BY-MEASURE SYSTEM PERFORMANCE DIAGNOSIS The following steps can be used to generate the SPM and supporting reports, which a CoC can use either for ongoing data quality review or as a test prior to its required annual submission of the SPM report to HUD. Review of data quality in the SPM report should be incorporated into the CoC’s data quality plan. Ideally, the review would be conducted quarterly, although some CoCs might decide to conduct the review semiannually. To allow adequate time for review prior to the CoC’s annual submission—and correction of any issues diagnosed in the review—the SPM report should be generated 90 days before the due date.
Step One: Prepare to Run the SPM Report
▪ Review each project in the HMIS to confirm that it is set up correctly.
▪ Make sure all projects have completed their data entry into the HMIS for the reporting period. Timely data entry is crucial to producing accurate reports.
▪ If any data are uploaded into the HMIS, rather than entered manually, or if reports are pulled from a centralized data warehouse, make sure uploads and warehousing processes are up-to-date.
▪ If there are projects that have closed during the relevant period, ensure that all clients have been exited.
▪ Deduplicate client records if the HMIS requires a manual review and merging process.
▪ Identify any HMIS coverage issues that could affect the interpretation of each SPM.
Step Two: Run the SPM Report and Supporting Reports
▪ SPM Report: To be able to observe the direction the system is moving on each measure, the CoC should run the full system-wide report for the current reporting period and the prior reporting period, at a minimum.

7
o HUD has not required that HMIS vendors build in the capacity to filter results by populations, sub-geographies, or a subset of projects. Some systems may support this type of filtering, which can provide useful data to consider in the analysis phase, however filtered results must be interpreted with caution.
▪ Annual Performance Report (APR) or Consolidated Annual Performance and Evaluation Report (CAPER): The APR and CAPER provide a project-level version of many of the SPM. They can help a CoC identify which projects or project types might be driving particular performance issues.
Because some populations can be more challenging to serve than others, CoCs should use APR and CAPER data as a starting point for asking questions and developing an understanding of performance. Communities should use caution when comparing results of specific projects so they do not draw the wrong conclusions or create a disincentive to serve participants with the highest needs. A CoC’s project-level performance expectations should vary based on the project type, its role in the system, and the target group served. For example, it is not appropriate to expect the same performance on returns to homelessness for emergency shelters as for permanent housing projects. Performance results should be adjusted to factor in such variances.
▪ Annual Homeless Assessment Report (AHAR) and Point-in-Time (PIT) Count: The AHAR and PIT count data can provide additional information related to the length of time homeless and persons served measures. Reviewing the results of those reports for the period relevant to the SPM report can be a useful comparison. Because the AHAR has the same coverage issues as the SPM report, a CoC should identify whether lack of participation in HMIS by some projects will affect interpretation of each measure. The reports have different approaches to measuring a person’s length of time homeless (Measure 1). The SPM report will include time that a person was homeless in the previous year if the person was in an episode of homelessness at the start of the data analysis period, The AHAR does not use this approach, instead including data only from the period of the report.
▪ Local reports: A CoC also should review any local HMIS vendor- or CoC-created reports that could help it interpret system performance. These might include master lists and coordinated entry reports.
Step Three: Examine the reported results, by measure, to assess whether those results reflect data
quality or performance issues
In this troubleshooting step, a CoC reviews the results for each SPM, looking sequentially for errors in programming, and then at data quality.
Programming Assessment
▪ The CoC confirms that programming errors are not producing an inaccurate SPM. If they are, there is no need to proceed with further analysis until those errors are resolved by the HMIS vendor.
Data Quality Assessment
▪ The CoC assesses whether data quality, including project setup errors, are having a significant impact on the results. If so, the CoC must take steps to correct data quality where possible and to strengthen its data quality plans and monitoring in the future. If communities are unable to correct inaccurate data from previous years, the first several years of their SPMs may be too compromised by data quality problems to accurately depict their system’s performance.

8
Step Four: Analyze system performance
Again, for each measure, a CoC reviews the results, this time with the aim of understanding which population(s), project(s), or other factors are having the biggest impact on performance.
Performance Analysis
▪ A CoC can use its SPM report to consider actual system performance, including how project performance and system substructures may be affecting overall system performance. Based on an understanding of current performance, the CoC can develop project and system improvement strategies and commensurate performance targets for future years. The Strategies for System Performance Improvement brief provides guidance on identifying and implementing the improvement strategies with the highest impact on performance.
The following sections review Steps Three and Four for Measures 1, 7 and 2, marked by a symbol to indicate those measures on which HUD places particular emphasis. The sections also review programming and data quality considerations in Step Three for Measures 3, 4 and 5.
Measure 1: Length of Time Persons Remain Homeless For this measure, key issues are typically that the length of time people in the community remain homeless is longer or shorter than expected.
Programming Assessment
▪ The average and median results for Metrics 1.1a and 1.1b (i.e., the length of time participants are served in ES and SH, with and without 3.917 Living Situation data) cannot be longer than the results for Metrics 1.2a and 1.2b, respectively (i.e., the length of time participants are served in ES, SH, and TH, with and without 3.917 data).
9
Data Quality Assessment
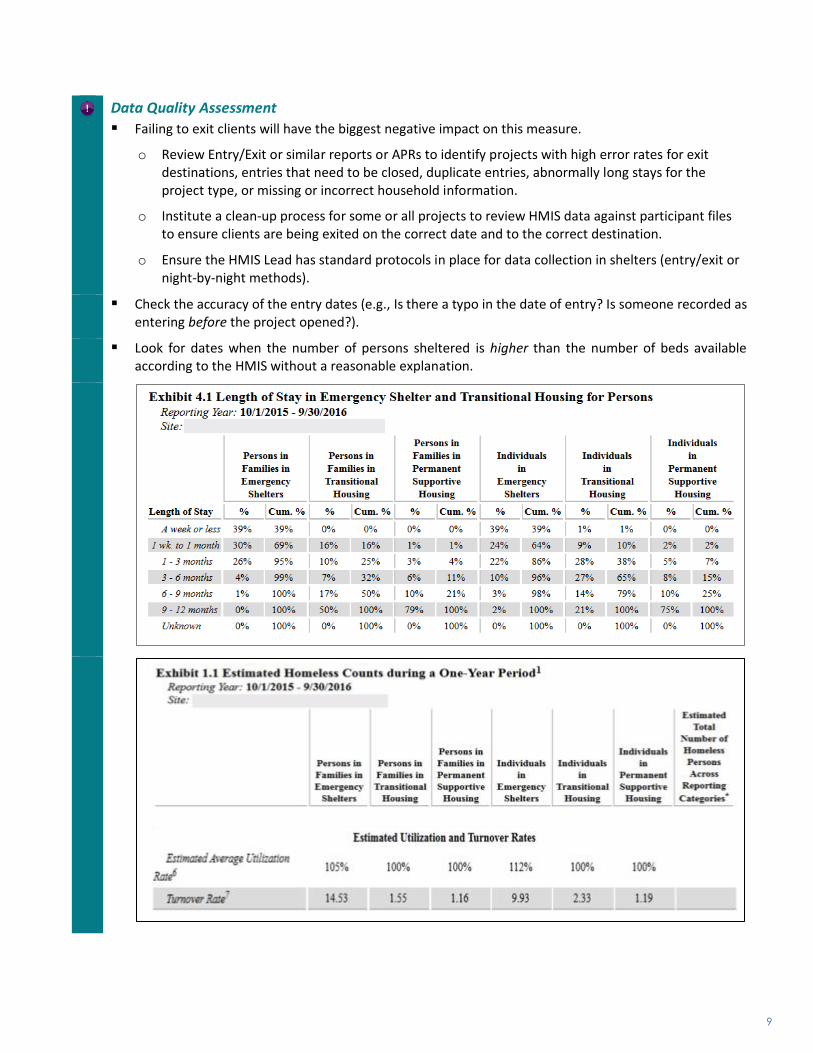
▪ Failing to exit clients will have the biggest negative impact on this measure.
o Review Entry/Exit or similar reports or APRs to identify projects with high error rates for exitdestinations, entries that need to be closed, duplicate entries, abnormally long stays for theproject type, or missing or incorrect household information.
o Institute a clean-up process for some or all projects to review HMIS data against participant filesto ensure clients are being exited on the correct date and to the correct destination.
o Ensure the HMIS Lead has standard protocols in place for data collection in shelters (entry/exit ornight-by-night methods).
▪ Check the accuracy of the entry dates (e.g., Is there a typo in the date of entry? Is someone recorded asentering before the project opened?).
▪ Look for dates when the number of persons sheltered is higher than the number of beds availableaccording to the HMIS without a reasonable explanation.

10
Performance Analysis
▪ Population-level analysis: CoCs can review the AHAR to understand length of stay by household type. The AHAR reports length of stay by the average number of persons served by a bed in a year. As an example, if there is an average of 7.06 persons in families in an ES bed in a year, that translates into an average length of stay in the bed of 1.7 months (12 months divided by 7.06 persons). The AHAR also reports length of stay by time period (e.g., 2% of persons in families were in shelter 1 week or less, 6% were in shelter 1 week to 1 month). Remember that the AHAR lengths of stay are truncated and represent only the number of days people are homeless within the 12-month period covered by each AHAR.
▪ The AHAR also reports the average number of persons served by a bed in a year, as well as cumulative number of days (reported in ranges) that individuals and families stay in ES and TH within each fiscal year. CoCs should use this information to explore various drivers of longer stays in homelessness. For example, families may have very long ES and TH stays relative to individuals. Discussions with providers serving families may reveal that procedures for accessing permanent housing reward long shelter stays (e.g., graduation from a service project), which discourages families from exiting on their own or accepting RRH assistance.
▪ Project-level analysis: CoCs can use the APR and CAPER results to compare projects of the same type to determine which have longer lengths of stay. CoCs can then explore why clients are remaining in these projects instead of accessing permanent housing assistance. Is it because of providers’ policies and procedures? System bottlenecks? Or other factors that can be addressed?
▪ Patterns in populations: CoCs can analyze PIT count data and other local reporting such as master lists to begin to understand the experiences of those who are chronically homeless. CoCs may also consider additional ad hoc reporting using HMIS data to look at the cluster of long- and short-stayers in the system: What are the characteristics of people in each group, and what types of services are they using? Which providers are they working with? Can the community better target permanent housing interventions to long-stayers and diversion strategies to short-stayers?

11
Measure 2: Returns to Homelessness
Programming Assessment
▪ The SPM report cannot show that there are returns within a category that has a universe of “0” clients. Similarly, the total percentage of returns cannot exceed 100%.

12
Data Quality Assessment
▪ Check that entries and exits are being entered in a timely manner. Projects that delay entry of intake or exit data can cause inaccurate results and inconsistencies when the measures are run year after year.
▪ Ensure any data from sources that must be uploaded to the HMIS are properly uploaded.
Performance Analysis
There are not existing project-level or national reports that can report returns to homelessness by population or project type. Deeper dives into this measure will rely on local reports to address the following questions:
▪ Population-level analysis: Does one population have a relatively higher rate of return? Within a population, does a subpopulation or specific set of characteristics have a higher rate of return? Are there providers that are successful at serving people with these characteristics so they do not return? Based on this information, can the CoC learn anything about factors contributing to returns for this group?
▪ Project-level analysis: Do returns vary by project type or by specific project? Is variation explained by the population targeted for the project type or specific project?
▪ Changes in returns over time: Is there a high level of returns within the first 6 months of exit to permanent housing? Is that true across projects or only for certain projects? High rates of returns in 6 months may indicate that the homeless system needs to do more to support people, whereas high rates of return after 24 months may indicate economic problems or environmental factors. Are trends in successful returns linked to performance on other measures, such as the rate of successful placements? Is the rate of return of placements increasing or decreasing? Are placements in permanent housing stable?
▪ Patterns of use: Are returns to certain exit destinations higher than for other destinations? Does this vary by project type or specific project? Based on this information, can the CoC learn anything about factors contributing to returns? For example, are a lot of people returning to homelessness after living with family or friends? Is more family intervention and mediation support necessary, or were these placements wrongly classified as permanent destinations?

13
Measure 7: Successful Placements at System Exit
Programming Assessment
Metric 7a.1 – Change in exits to permanent housing destinations
Metric 7b.1 – Change in exits to permanent housing destinations
Metric 7b.2 – Change in exit to retention of permanent housing
▪ The SPM report cannot show that there are placements within a category that has a universe of “0” clients. Similarly, the total percentage of placements cannot exceed 100%.
Data Quality Assessment
▪ If placement results on the SPM report are lower than expected based on individual project APRs (Q23), this may not be the result of a data quality issue. Measure 7 looks at unduplicated clients across project types and does not count a placement until the participant has completely finished participation with the “system” of projects (i.e., after the participant is completely exited from any ES, SH, TH, or RRH project for the reporting period). This may result in fewer system-level placements than total project-level placements.
Performance Analysis
▪ Population-level analysis: CoCs can review APRs from several projects serving different populations to determine whether one population or subpopulation has a relatively higher rate of successful placements (Q23). Which groups of people have moved successfully into housing? What are the characteristics of the individuals or families in that group, what type of assistance did they receive,

14
Performance Analysis and which providers are they working with? Based on this information, can the CoC make any determinations about factors contributing to successful housing placements for this group? If available, coordinated entry data can also be used to assess the broader picture of how people are moving through the system.
▪ Project-level analysis: Similarly, the CoC can assess APRs to determine whether successful placements (Q23) vary by project type, or by specific project. Consider the relative utilization rate of projects in the portfolio, and why some have lower rates than others. To what extent are projects employing a Housing First approach? Is there a need to build capacity of providers to more effectively support households to move off the street (Metric 7a.1) and into permanent housing (Metric 7b.1), or to retain individuals in PSH (Metric 7b.2)?
▪ Trends over time: Is the rate of successful placements increasing or decreasing? If the rate of successful placements is declining, the CoC can look to APRs to locate providers that may be able to help determine why. Are trends in successful placements linked to performance on other measures, such as the rate of returns to homelessness?
▪ Patterns of use: The CoC can review the HIC and local grants to determine whether there are gaps in available interventions that may affect movement into permanent housing (or movement off the streets in Metric 7a.1)? For example, does the CoC have sufficient street outreach to cover areas where significant numbers of unsheltered persons are found? Does the CoC have enough permanent housing resources to place clients into RRH or PSH? The CoC can look to local reporting from the coordinated entry system to reveal bottlenecks, service gaps, and barriers to permanent housing by subpopulation, project, or project type.
▪ Cost analysis: What amount of funding is being invested in each project and project type within the CoC’s portfolio? This analysis can be conducted by different sources of funding or for total project costs. What is the cost per permanent housing exit from each project or project type? Which projects have a relatively large investment of funds but relatively poor placement outcomes? [See the Homeless System Evaluator Tool from the National Alliance to End Homelessness for tips on estimating costs.]

15
Measure 3: Number of People Experiencing Homelessness
Programming Assessment
Metric 3.1 – Change in PIT Counts
Metric 3.2 – Change in Annual Counts
▪ The unduplicated count of homeless persons shown as the universe for Metrics 3.1 and 3.2 must be at least as large as the largest number served in ES, SH, or TH and not larger than the sum of people served in ES, SH, and TH.
Data Quality Assessment
▪ If the annual count of homeless persons (Metric 3.2) is less than or not reasonably larger than the PIT count (Metric 3.1), given the number of projects entering data, compared with the number of homeless persons who were counted in non-participating facilities (where people being served in these facilities are counted only on the PIT count), make sure all HMIS projects on the CoC’s HIC for ES, SH, and TH are included in the projects pulled for Measure 3.
▪ Use the AHAR, master lists, and other annualized counts of sheltered homeless people as a “reasonableness test.” If the annual count is higher than expected or increasing over time, make sure clients are being exited, and re-check open entries to ensure clients were in a project during the SPM report timeframe.

16
Data Quality Assessment
NOTE: This measure counts only people experiencing sheltered homelessness in a project entering data into HMIS. Some CoCs may also have literally homeless people who are unsheltered and known to street outreach or coordinated entry projects.
Measure 4: Employment and Income Growth
Programming Assessment
▪ Review the SPM report to ensure that the number of adult system stayers is consistent acrossMetrics 4.1, 4.2, and 4.3 and that the number of adult system leavers is consistent across Metrics4.4, 4.5, and 4.6.
Measure 4: Employment and Income Growth for Homeless Persons in CoC Program-funded Projects.

17
Programming Assessment
▪ The SPM report cannot show increased earnings within a category that has a universe of “0” clients. Similarly, the percentage of people with increased earnings in each category cannot exceed 100%.
▪ The number of adults with increased total income cannot be less than the larger of either the number of people with increased employment income or the number of people with non-employment cash income.

18
Data Quality Assessment
▪ If the SPM report produces an error message, confirm that funding source and grant start dates are correct in HMIS. Measure 4 cannot be generated without those data, and missing information can cause the report to produce an error message.
▪ If the percentage of adults who were able to increase income over time is lower (or higher) than expected, review the APR income questions (Q16, Q18, and Q19) for each project to identify projects that are having a disproportionate impact on this measure, and review project setup information to ensure only CoC Program–funded projects are included in the report.
▪ If changes in income are lower than expected, ensure all projects are entering annual updates in a timely fashion (30 days before or after anniversary of entry date).
Measure 5: Number of People Experiencing Homelessness for the First Time
Programming Assessment
Metric 5.1 – Change in the number of persons entering ES, SH, and TH projects with no prior enrollments in HMIS
Metric 5.2 – Change in the number of persons entering ES, SH, TH and PH projects with no prior enrollments in HMIS
▪ Review the SPM report to ensure that the number of people with an HMIS record in the prior 24 months (the sum of the number of people who had been in HMIS in the prior 24 months and the number of people who had not been in HMIS in the prior 24 months) does not exceed the universe.
▪ The universe in Metric 5.2 cannot be less than the universe in Metric 5.1.

19
Data Quality Assessment
▪ For Metric 5.2, use information from the local coordinated entry process to review the number of people who have not had previously had contact with the homeless assistance system. If the number of persons entering permanent housing projects without a prior stay in ES, SH, or TH is higher than expected based on the coordinated entry reporting or other local reporting, the CoC may need to resolve a coverage issue or work closely with projects that are using “side doors” to entry.
Measure 6: Placements and Returns for People Identified as Homeless under Category 3
At this time, no CoCs are approved to serve people homeless under Category 3 in CoC-funded project.