systematic analysis of abc transporters in …
TRANSCRIPT
Virginia Commonwealth University Virginia Commonwealth University
VCU Scholars Compass VCU Scholars Compass
Theses and Dissertations Graduate School
2013
SYSTEMATIC ANALYSIS OF ABC TRANSPORTERS IN SYSTEMATIC ANALYSIS OF ABC TRANSPORTERS IN
STREPTOCOCCUS SANGUINIS STREPTOCOCCUS SANGUINIS
Sawsan Atia Virginia Commonwealth University
Follow this and additional works at: https://scholarscompass.vcu.edu/etd
Part of the Medicine and Health Sciences Commons
© The Author
Downloaded from Downloaded from https://scholarscompass.vcu.edu/etd/3054
This Thesis is brought to you for free and open access by the Graduate School at VCU Scholars Compass. It has been accepted for inclusion in Theses and Dissertations by an authorized administrator of VCU Scholars Compass. For more information, please contact [email protected].

©Sawsan Atia, 2013
All Right Reserved
SYSTEMATIC ANALYSIS OF ABC TRANSPORTERS IN
STREPTOCOCCUS SANGUINIS
A thesis submitted in partial fulfillment of the requirements for the degree of Master of Science
at Virginia Commonwealth University.
By
SAWSAN SALMAN ATIA MUBARAK
M.S., Baghdad University, Iraq, 2000
B.S., Baghdad University, Iraq, 1991
Director: DR. PING XU
Associate Professor of Oral & Craniofacial Molecular Biology and
Microbiology & Immunology
Virginia Commonwealth University
Richmond Virginia
April 2013

I
Acknowledgements
It is a great pleasure to give respect to those who made this thesis possible. I owe sincere
thankfulness to my research advisor, Ping Xu, who allowed me the opportunity to work on a
project and guided me throughout my journey in lab. I would also like to show my gratitude to
all my colleagues in the lab: Dr. Xiuchun Ge, Dr. Lei Chen, Victoria Stone, Alleson Dobson,
Tara Jeneille Nulton, Karra Evens, Gregory Mayes, and Jenishkumar Patel, for all of their
assistance and encouragement with this project. I would especially like to thank Victoria for her
help and moral support, understanding and encouragement I felt when working on my project. I
would like to thank Dr. Greg Buck and Dr. Daniel Conrad with their lab members for their
assistance and for allowing me to use their spectrofluorescence reader for a long time.
I am sure that my journey would not have been possible without family support that
always believed in me. I could not also have accomplished this project without their love,
prayers and continuous support. I would especially like to thank my mother for encouraging and
inspiring me to continue my education in the sciences.
I would like to show my gratitude and my respect to the J. William Fulbright Foreign
Scholarship Board (FSB) for awarding me this grant. My selection for a Fulbright award is in
itself, an achievement for which I can be proud. Lastly, I would like to express my gratitude to
Virginia Commonwealth University for supporting and assisting me to complete my degree.
II
Table of Contents
Page
List of Tables…………………………………………………………………………….III
List of Figures……………………………………………………………………………IV
List of abbreviations……………………………………………………………………...V
Abstract………………………………………………………………………………….VI
1. Introduction………………………………………………………………………….1
2. Materials and Methods……………………………………………………………...14
Bacterial strains, media, and growth conditions……………………………………25
Determination of pH range for S. sanguinis growth………………………………..25
Acid sensitivity assay……………………………………………………………….26
Carbohydrate fermentation assay………………………………………………...…26
Growth on carbohydrate substrates.………………………………………………...27
Examination of intracellular pH by fluorescence probe…………………………….27
Toxicity of BCECF…………………………………………………………………28
3. Results………………………………………………………………………………29
4. Discussion…………………………………………………………………………..62
5. References…………………………………………………………………………..71
III
List of Tables
Page
Table 1: Bacterial strains and ABC mutant genes used in this study………………………..15
Table 2: Carbon source utilization by S. sanguinis and eight ABC transporter mutants….....40
IV
List of Figures
Page
Figure 1: The structure of ABC transporters……………………………..………………….8
Figure 2: Construction of single gene deletion mutants into SK36
chromosome………………………………………………………………………………....23
Figure 3: The growth rate characteristics for wild type and control strains……………..….30
Figure 4: The growth rate characteristics of selected ABC transporter mutants
………………………………………………………………………………………………..33
Figure 5: The gene locus encoding the acid sensitive mutants….………………………....35
Figure 6: The growth rate characteristics for the rest of the mutants in the operon………...37
Figure 7: Growth profiles of acid sensitive ABC transporter mutants on different carbon
sources…………………………………………………………………………………..……42
Figure 8: Growth profile of the neighboring gene mutants in the operon on different carbon
sources……………………………………………………………………………….….……46
Figure 9: Comparison of intracellular pH and extracellular pH of S. sanguinis
……….……………………………………………………………………………..………..55
Figure 10: Comparison of the intracellular pH of the two mutants…………………..…….57
Figure 11: Statistical comparison of intracellular pH for the wild type and two
mutants......................................................................................................................................60
V
LIST OF ABBREVIATIONS
% Percentage
ABC ATP-binding cassette
BHI Brain heart infusion
BLAST Basic local alignment search tool
CFU colony forming unit
DNA deoxyribonucleic acid
hr hour
min minute
ml milliliter
O. D. Optical density
O/N overnight
oC degress Celsius
PBS phosphate buffered saline
PCR polymerase chain reaction
TCS Two Component System
Wt/Vol Weight/ volume
µg microgram
µl microliter
VI
ABSTRACT
SYSTEMATIC ANALYSIS OF ABC TRANSPORTERS IN
STREPTOCOCCUS SANGUINIS
By Sawsan S. Atia, M.S.
A thesis submitted in partial fulfillment of the requirements for the degree of Master of Science
at Virginia Commonwealth University.
Virginia Commonwealth University,
April 2013
Major Director: Dr. Ping Xu
Associate Professor of Oral & Craniofacial Molecular Biology and
Microbiology & Immunology
The bacterium Streptococcus sanguinis is a primary member of the human oral
microflora and also has been recognized as a key player in the bacterial colonization of the
mouth. It is considered the most common viridians streptococcal species implicated in infective
endocarditis. In all kingdoms of life, ATP binding cassette (ABC) transporters are essential to
many cellular functions. Sequencing of the SK36 genome provided the opportunity to study
ABC transporter mutants and their relationship with acidity of the oral environment. Despite
numerous studies that have focused on carbohydrate uptake systems in closely related
streptococcal species such as S. mutans, S. pneumonia and S. pyogenes, the mechanism of the
VII
response of these ABC transporters to acidic conditions in S. sanguinis is still unknown. The
capability of S. sanguinis to adapt in these harsh environments suggests this bacterium is capable
of responding to various environmental stimuli. The purpose of this study was to examine ABC
mutants to identify functions that contribute to acid tolerance in S. sanguinis.
This study demonstrates that two acid-sensitive mutant genes, SSA_1507 and SSA_1508,
identify genes involved in acid tolerance. The two mutants grew on different sugars and none of
them showed a defect in sugar utilization at acid pH. We couldn’t recognize any significant
differences in sugar uptake for the two acid sensitive mutants or in mutants of their neighboring
genes. Thus, the observed acid sensitivity is not due to a failure to take up any of the common
sugars tested. The cytoplasmic pH of S. sanguinis was studied with the fluorescent pH indicator
(BCECF) and SK36 was observed to have a wider pH range than either of the two acid-sensitive
mutants SSA_1507 or SSA_1508. In these two mutants, intracellular pH was not as well
maintained. At all pH values tested, the mutants displayed a lower intracellular pH than the wild
type. These observations indicate that the cell membrane of these two mutants is unable to
protect the interior components from adverse effects of higher pH values and lower pH values,
and prove that these two mutant genes SSA_1507 and SSA_1508 are unable to grow in lower pH
values. These results support a role for these ABC transporters in proton pump or export and
indicate that the mutants are less able to pump out protons.
1
1. Introduction
Streptococcus sanguinis is a gram-positive facultative anaerobe bacterium and is one of the
pioneer colonizers of the human oral cavity (1, 2). In most cases, these oral streptococci produce
green pigment or alpha-hemolysis on blood agar and are often considered as one of the viridans
group streptococci that have the ability to oxidize hemoglobin in erythrocytes by secretion of
H2O2 (2,3,4). The viridans streptococci are the most common cause of native-valve infective
endocarditis. Among those bacteria isolated from patients with endocarditis, S. bovis, S. mutans
and S. sanguinis are the most common (1, 5).
In the oral streptococci, the mechanisms by which different sugars are being transported are of
specific interest because of the contribution of fermentable carbohydrates to the acid in dental
plaque. This process produces enamel demineralization and can result in dental caries. Many
studies have noted that bacterial cells use a variety of different mechanisms for the uptake of
sugars, and cells have the capacity to use various carbohydrates as carbon and energy sources
employing various transport proteins and catabolic enzymes for the metabolism of the different
carbohydrates. A specific species may exhibit several different processes acting on the same or
different sugars (6, 7, 8 ). Earlier studies have shown that viridans streptococci, such as S.
gordonii, S. mitis and S. sanguinis, and some rods such as Actinomyces spp., serve as precursor
bacteria that initiate the formation of dental plaque. These early colonizers generate a scaffold
for the extension of secondary colonizers that give rise to a diverse biofilm community (9).
These viridans streptococci, referred to as the non-mutans streptococci, are distinct from the
mutans streptococci (MS).
The streptococci have been forced to develop different mechanisms to cope with the stress
induced by declining pH values in their environment. One of streptococci species is S. mutans. S.
mutans is considered to be the most important pathogen in dental caries. An important
2
mechanism in its cariogenicity is the ability to tolerate acid stress and the production of acid
from carbohydrates. While S. sanguinis compete with S. mutans for survival in the oral cavity, S.
mutans is more acid resistant than S. sanguinis. Since acid tolerance contributes to the ability of
S. sanguinis cells to adapt and to compete with S. mutans in the plaque environment, we were
interested in the role of ABC transporters in responding to environmental stimuli and in finding
more acid tolerant mutants than the wild type strain in order to antagonize S. mutans and reduce
caries.
Acid Tolerance:
Adaptation of oral bacteria to low pH is a strategy employed by streptococcal species to
resist the inimical influences of acidification of the human mouth. Many researchers have
suggested that oral streptococci retain several acid adaptive strategies, some of which are
distributed among all of the species and some that are unique. In order to exist in the oral cavity,
bacterial cells must be able to tolerate rapid and large environmental fluctuation in pH, nutrient
source and availability (10). Also, there are some protective mechanisms that appear to be
specific to certain species, such as ammonia production from urea by S. salivarius and arginine
by S. sanguinis, S. gordonii and S. rattus (10). Additionally, malolactic fermentation (MLF) was
recently identified as a major system for alkali production by Streptococcus mutans (11)
Other studies have identified another protective mechanism which is called the acid
tolerance response (ATR). It has been proposed that the survival rate of bacteria is increased
after challenge at lethal acid pH if the bacteria were first subjected to a period of mild sublethal
acidic conditions (12, 13, 14, 15). It was noticed in these studies that the range of pH and lethal
3
pH that trigger the ATR are characteristic for each species and are indicative of their acid
resistance capacity. It has been suggested that the F0 F1 ATPase is one of the systems used by
bacteria to respond to acidic pH. ATP is hydrolyzed to generate a proton gradient for a variety of
transport processes and adjusts the intracellular pH via proton extrusion. In other studies dealing
with the regulation of S. mutans acid tolerance by GcrR, a response regulator, it was proposed
that a drop in dental plaque pH stimulates an adaptive acid-tolerance response in S. mutans that
allows it to survive acid challenge at pH 3.0. These studies also concluded that GcrR plays a vital
role in S. mutans colonization of the tooth surface and later on pathogenesis of this bacterium,
which is considered a primary causative agent of human dental caries (16, 17). In many
streptococci species, the intracellular pH varies in response to extracellular pH, with the
organisms working to maintain a pH of 0.5 to 1 unit above the external environment. For
instance, in the highly acid-tolerant S. mutans, the optimal pH for the F-ATPase enzyme is 6.0,
while in the lesser acid tolerant S. salivarius and S. sanguinis, the pH optima of the ATPase
enzymes are 7.0 and 7.5, respectively (9, 18, 19).
The bacterial cells of non-mutans streptococci (Streptococcus sanguis [now S. sanguinis],
Streptococcus gordonii, Streptococcus oralis and Streptococcus mitis) that grown at pH 7.0
showed 71% viability after acidification at pH 4.0 for 60 min, while the cells of mutans
streptococci (S. mutans) were not killed by acidification (20). It has also been noticed that non-
mutans bacteria were capable of increasing their acid tolerance and acidogenicity in response to
environmental acidification and moreover, it has been proposed that one of mechanisms in the
acid adaptation observed in non-mutans streptococci could involve the induction of H+ -ATPase.
H+ ATPase is recognized to maintain intracellular pH suitable for metabolic reactions by
expelling protons across the cell membrane against environmental acidification. Other
4
mechanisms in acid adaptation could also include arginine deiminase or synthesis of stress
proteins, as have been observed in non-mutans streptococci. Ultimately, these adaptive responses
were similar to those found in the strains of mutans streptococci and Enterococcus hirae,
although the cells of non-mutans streptococci were less acidogenic and acid-tolerant than mutans
streptococci.
Systems of sugar uptake transporters
Earlier studies identified a high number of carbohydrate transport systems, which are
generally in the ATP-binding cassette (ABC) superfamily or the phosphotransfer-driven group
translocators (PTS, Phesphoenolpyruvate: sugar phosphotransferase system) (21, 22, 23).
Previous studies have shown that the PTS system is composed of four proteins, which transfer a
phosphoryl group from PEP to an entering sugar parallel with membrane translocation (24, 25).
They have also noted that utilization of ABC transporter carbohydrates requires more energy
than those that are substrates for PTS, both for transportation and for modification of
carbohydrates once they are intracellular. Although PTS substrates are known to be size-
restricted, the ABC transporters are able to import longer and more varied carbohydrate linkages.
The same studies demonstrated that growth on eight carbohydrates in vitro is affected by
mutation of more than one transporter system (24, 25).
It is generally agreed that ABC importers and PTS are particularly attractive drug targets,
since both mechanisms are unique to prokaryotes. Also, it has been proposed that PTS and ABC
importers might be used as novel drug delivery systems. Many publications suggest that ABC
sugar transporters are necessary for full virulence for most bacteria- for example, Streptococcus
pneumoniae in mouse models of infection (26, 27, 28). However, their influence might be
5
defeated by the significant potential for redundancy in sugar uptake. Additionally, S. mutans also
has a non-PTS sugar uptake system involving a multiple sugar metabolism (msm) operon. This
operon is responsible for the uptake and metabolism of a variety of sugars (such as melibiose,
raffinose, and isomaltosaccharides) and is unique because it is the first binding protein-
dependent sugar uptake system described to be involved in the uptake and metabolism of
multiple sugars. In addition, it represents the first model of this kind of transporter in Gram-
positive bacteria (29).
It is crucial to mention that the profusion of sugar transport systems places the streptococci,
together with clostridia and enterococci, among the species with the highest numbers of
carbohydrate uptake systems (30). In addition to the systems have been mentions above, sugar
substrates can also be taken up by galactoside-pentose hexuronide (GPH) translocators.
Typically, GPH translocators are electrochemical transporters; they catalyze the uptake of sugars
in symport with monovalent cations (H+, Na
+). This system is also involved in the regulation of
a variety of metabolic and transcriptional processes (31). It also has been determined that
galactose is not transported through the PTS transport system in S. mutans. This sugar might be
transported via an ABC or a GPH transporter.
ABC transporters:
In all kingdoms of life, ATP binding cassette (ABC) transporters are essential to many
cellular functions. It is believed that the ABC transporter superfamily is more prevalent in
bacteria than other types of transporters. Its structure comprises one of the largest protein group
families and displays a shared global organization (31, 32, 33, 34). The common feature of all
6
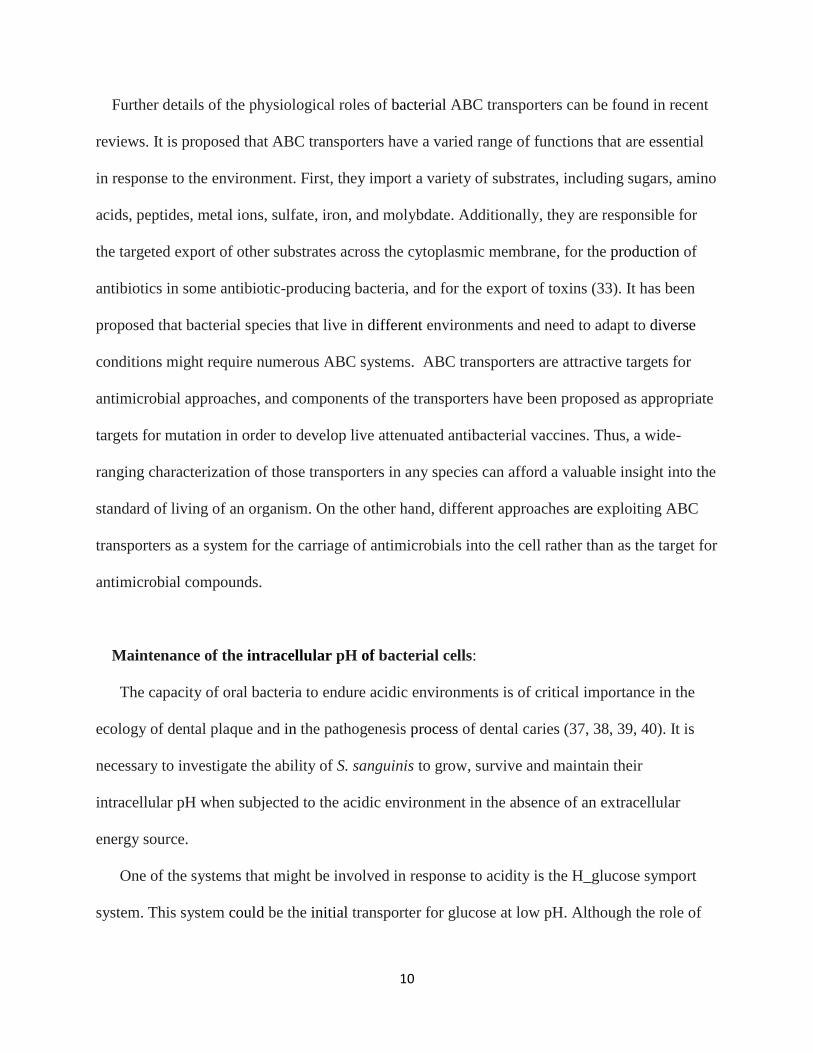
ABC transporters is that they consist of two distinct domains, a nucleotide binding domain that
binds ATP, and a transmembrane domain (TMD). The alpha-helical TMD is embedded in the
membrane, where it recognizes various substrates and transports them across the membrane.
This domain has variable sequence and structure, depending on the substrate to be translocated.
The ATP binding cassette (ABC domain) is located on the cytoplasmic side of the membrane
and is highly conserved. Most exporters consist of dimers of polypeptides in which the TMD
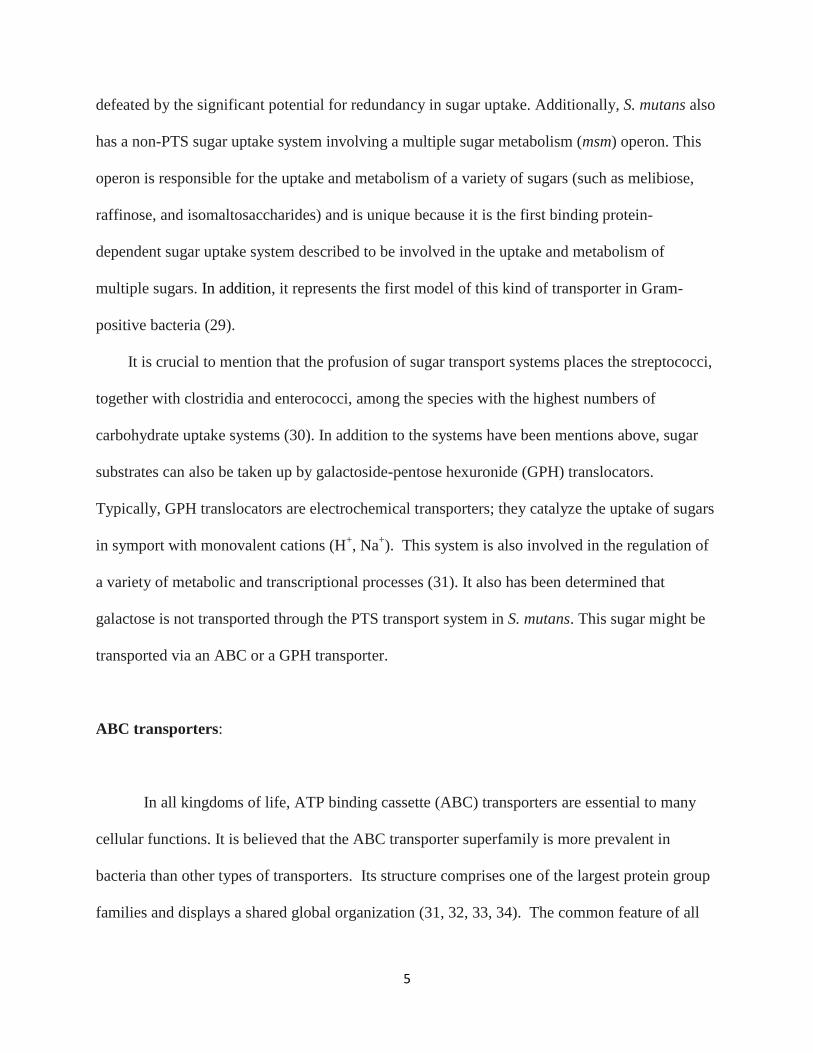
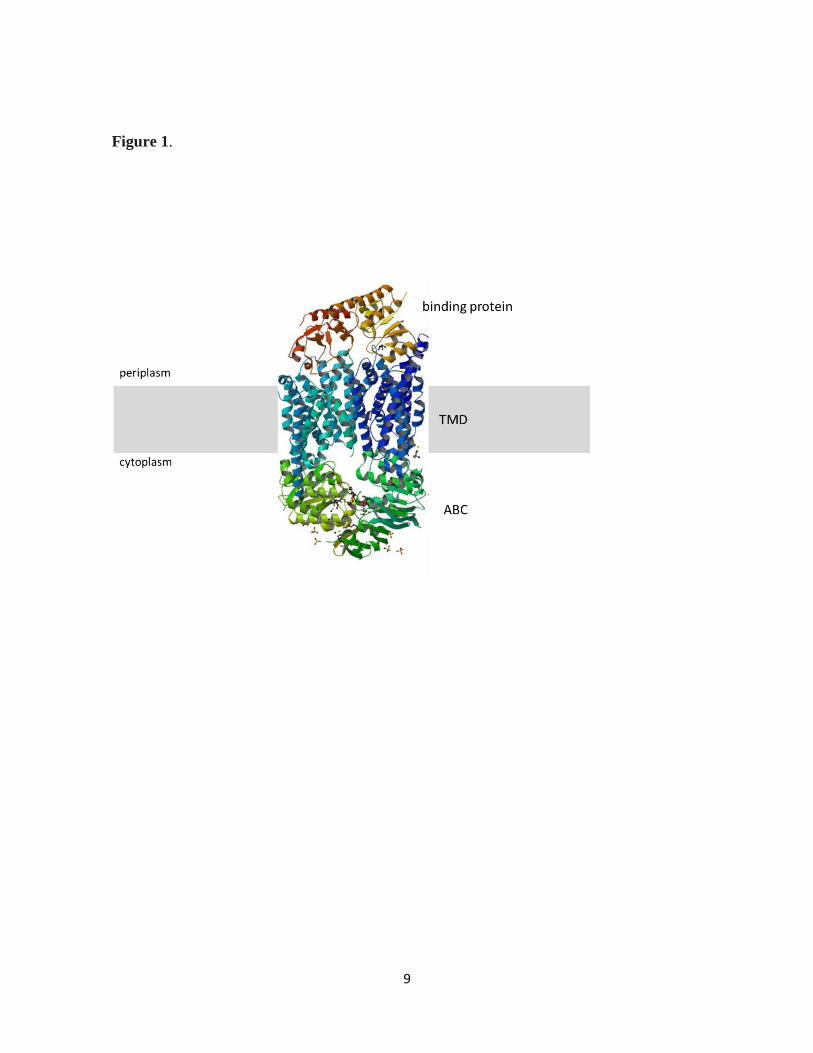
and ABC domains are fused as a single polypeptide chain (Figure 1). Additional features of
ABC transporters may be present, depending on whether the transporter functions as an importer
or an exporter. Importers have an extra-cytoplasmic solute-binding receptor that can be a
lipoprotein or oligoprotein assembly anchored to the external surface of the cytoplasmic
membrane that interacts with a specific substrate molecule in the periplasm for delivery to the
appropriate ABC transporter. This provides specificity and maintains the direction of transport
into the cell (35). Exporters, or the other hand, generally have an extra intracellular domain that
connects the membrane-spanning domain to the ABC domain. These protein subunits combine
in order to form an active ABC transporter. Studies in S. mutans based on the genome sequence
identified sixty apparent ABC transporter systems, but only three of these are involved in
carbohydrate uptake (32). In contrast, there are more than 150 genes related to ABC transporters
in S. sanguinis. This means a wider range of substrates might be transported through them and
potentially gives them the ability to withstand various stress conditions.
It has been noted that ABC transporters are the only class of transporters with specificity for
larger substrates like oligosaccharides, and they also display higher expression under several
tested conditions. This suggests that they might be involved in transporting multiple substrates.
The availability of bioinformatics genome data allowed demonstration that these transport
7
systems and their operons were components of the adaptable part of the bacterial genome (21).
These data also revealed that bacterial carbohydrate uptake operons are functional units and
include genes for glycosyl-hydrolases for generation of mono- or disaccharides in addition to the
genes for their transporters. These enzymes are useful for the steps of metabolism linking the
sugar to glycolysis and a regulator. It has been proposed that these bacteria that exploit ATP as a
sole energy source have ATP pumps but lack channels and electrochemical driven transport.
It has also been noted that genes for both PTS systems and ABC transporters are high in terms of
the genome size and that there is a significant effect of many of these carbohydrate uptake
systems in virulence. These systems have been shown to have a role in bacterial physiology
during carriage and the regulation of invasive disease (21).
Transporters involved in carbohydrate uptake within the ABC superfamily can be divided into
two families, the carbohydrate uptake transporter-1 and -2 (CUT1 and CUT2) families. While
CUT1 systems are largely concerned with oligosaccharide uptake, CUT2 systems frequently
reveal specificity for monosaccharides (such as ribose, galactose, xylose, and rhamnose) and
ribonucleosides that contain 2-deoxyribonucleosides, but not ribose or nucleobases. In the high
G+C Gram-positive bacteria, most of the sugar transporters are either secondary carriers (48%)
or ABC-type transporters (50%). An ABC transporter that contributes to the uptake of
ribonucleosides has also been described, thus extending the range of substrates transported by
members of the ABC transporter superfamily (36, 35).

8
Figure 1: The structure of ABC transporters. Shown is the structure of a typical ABC importer,
BtuCD, in complex with its periplasmic binding protein BtuF (PDB 2QI9). The gray box
indicates the cytoplasmic membrane. The Transmembrane domain (TMD), Nucleotide-binding
domain (ABC) and periplasmic binding protein are indicated.
9
Figure 1.
10
Further details of the physiological roles of bacterial ABC transporters can be found in recent
reviews. It is proposed that ABC transporters have a varied range of functions that are essential
in response to the environment. First, they import a variety of substrates, including sugars, amino
acids, peptides, metal ions, sulfate, iron, and molybdate. Additionally, they are responsible for
the targeted export of other substrates across the cytoplasmic membrane, for the production of
antibiotics in some antibiotic-producing bacteria, and for the export of toxins (33). It has been
proposed that bacterial species that live in different environments and need to adapt to diverse
conditions might require numerous ABC systems. ABC transporters are attractive targets for
antimicrobial approaches, and components of the transporters have been proposed as appropriate
targets for mutation in order to develop live attenuated antibacterial vaccines. Thus, a wide-
ranging characterization of those transporters in any species can afford a valuable insight into the
standard of living of an organism. On the other hand, different approaches are exploiting ABC
transporters as a system for the carriage of antimicrobials into the cell rather than as the target for
antimicrobial compounds.
Maintenance of the intracellular pH of bacterial cells:
The capacity of oral bacteria to endure acidic environments is of critical importance in the
ecology of dental plaque and in the pathogenesis process of dental caries (37, 38, 39, 40). It is
necessary to investigate the ability of S. sanguinis to grow, survive and maintain their
intracellular pH when subjected to the acidic environment in the absence of an extracellular
energy source.
One of the systems that might be involved in response to acidity is the H_glucose symport
system. This system could be the initial transporter for glucose at low pH. Although the role of
11
ABC transporters in the response to acidity is not established yet, ABC transporters are proposed
to be energetic for high-affinity and high-capacity transport of carbohydrates and a key
contributor to acidogenesis (37, 41, 42). Work on a wide range of microorganisms has led to a
number of conclusions about bacterial pH homeostasis. For example, there is no magic value of
intracellular pH which all organisms must achieve, organisms exhibit different abilities to
regulate their cytoplasmic pH, and anaerobic organisms exhibit a greater range of value of
intracellular pH over which growth will occur than do aerobic organisms. For neither class of
these organisms do we have reasonable description of the mechanism of control of cytoplasmic
pH (43, 44, 45). Streptococci metabolize dietary sugars to create ATP and yield organic acids
and then maintain an intracellular pH by through a proton-translocating ATPase. Acidic
extracellular pH moderates the physiological activity of oral microorganisms, but in the absence
of dietary sugars between meals the relationship between intracellular pH and extracellular pH is
unclear (46).
A variety of methods have been developed to measure intracellular pH in bacteria. These
include nuclear magnetic resonance techniques, pH-sensitive fluorescent probes, and analysis of
the distribution of (radiolabeled) weak acids or weak bases. Another method that has been
introduced to allow fast and noninvasive determination of intracellular pH is suited for direct
analysis of individual bacterial cells present in a complex environment. Noninvasive
measurement of intracellular pH on a single-cell level with green fluorescent protein was used to
measure intracellular pH in both Gram-positive and Gram-negative bacterial cells (47). This has
been done by introducing specific amino acid substitutions to the chromophore, causing the
resulting protein to alter its excitation spectrum according to the pH of the surrounding
environment.
12
In other studies, efflux of the pH-sensitive fluorescent dye 2′ , 7′ -bis-(2-carboxyethyl)-5
(and- 6) carboxyfluorescein ( BCECF) has been used to measure intracellular pH in eukaryotic
and bacterial cells (46). This highly sensitive probe is introduced into the bacteria using the
membrane-permeable acetoxymethyl ester BCECF-AM. In streptococcal cells, it was found that
in the absence of glucose, the background fluorescence of S. mutans, S. sanguinis, S. salivarius
and S. sobrinus was low after incubation with BCECF-AM for 20 min. at 35 degrees Celsius (°C)
(46). This raised the possibility of using BCECF for determination of the intracellular pH of oral
streptococci strains. The intracellular pH of the bacteria is determined by creating a relationship
between the fluorescence ratio 505/450 and pH using the ionophore nigericin (48, 49, 50, 51).
Purpose of Study
ABC transporter function might affect the lifestyle of S. sanguinis by increasing the capacity
of this organism to live in the acidity of oral cavity. ABC transporters have previously been
observed to affect virulence and might affect the degree of pathogenesis of S. sanguinis.
Previous work in our lab investigated the roles of two-component systems (TCS) in acid stress.
TCS serve as a response coupling mechanism that allows organisms to sense a wide range of
signals and respond to stress conditions. It has been demonstrated previously that mutants
affecting two response regulators in S. sanguinis, SSA_0204 and SSA_0217, are more resistant
than wild type to acid stress. Microarray analysis of the genes affected by the SSX_0204
mutation showed that gene SSA_0260 was regulated by this response regulator and plays a role
in acid tolerance (52). The SSA_0260 gene product is annotated as an ABC type metal
transporter. This led to an interest in a comprehensive survey of all ABC transporter genes in S.
sanguinis and determining whether there was a relationship with the acid tolerance.
13
The complete genome sequence of S. sanguinis SK36 strain was determined at VCU (4).
The genome sequence provides an opportunity to greatly advance our understanding of this
organism by enabling the construction of a comprehensive set of genome-wide mutants. The
genome encodes 2,274 predicted proteins, sixty-one tRNAs, and four rRNA operons, from which
one hundred and fifty genes have been identified that encode putative ABC transporters (4).
Each of the genes was systematically inactivated and replaced by an antibiotic resistance gene
cassette, and all of these mutants were confirmed by sequencing. This comprehensive mutant
library provides a unique resource to perform a systematic analysis in order to investigate the
effect of genetic mutations on ABC transporter function and the behavior of S. sanguinis SK36
in the acid environment.
This study consisted of the screening of 150 ABC transporter mutants of S. sanguinis
SK36 for acid tolerance. Growth of the mutants was assessed along with the different types of
carbon sources that might be related to acid tolerance. Determination of intracellular pH in S.
sanguinis mutants that were found to be involved or correlated with acid tolerance in S.
sanguinis was also examined.
14
2. Materials and Methods
Bacterial strains and mutants
SK36 used in this study was isolated from human dental plaque (53) and originally acquired
from Drs. Kilian & Holmgren of Arhaus University, Denmark. Single gene deletion mutants for
the SK36 strain of S. sanguinis were created previously using a PCR-based recombinant method
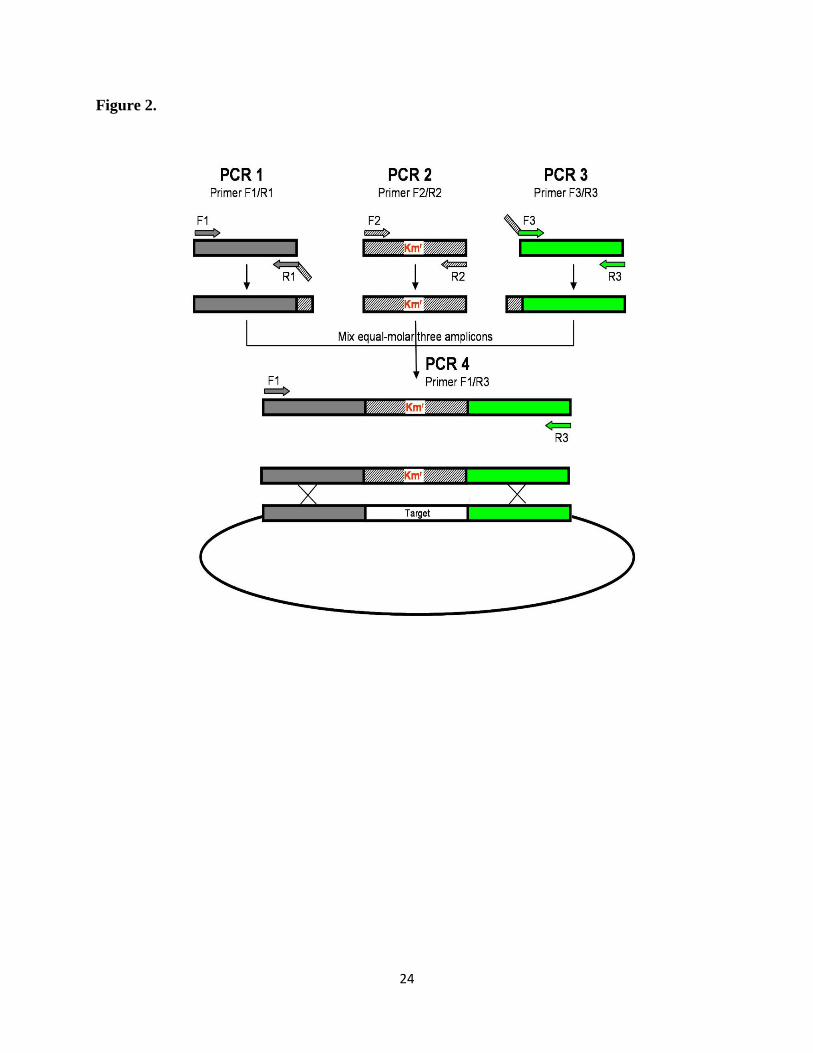
employing liner DNA for gene deletion in vitro (4). For each target gene three sets of primers
(F1/R1, F2/R2, and F3/R3) were designed to amplify a linear DNA fragment containing a
kanamycin resistance cassette (54) flanked by upstream and downstream sequences of the
targeted gene (Figure 2). The 5’ ends of the F2 and R2 primers of the kanamycin cassette were
designed to complement the sequences of DNA that flank the target gene. The linear
recombinant PCR amplicons containing the kanamycin cassette flanked by S. sanguinis DNA
were introduced into competent S. sanguinis cells by transformation and integrated into the S.
sanguinis genome via double crossover recombination (1). A genome-wide mutant library
containing 2,048 deletion mutants was constructed using a 96 well high-throughput format (4, 7).
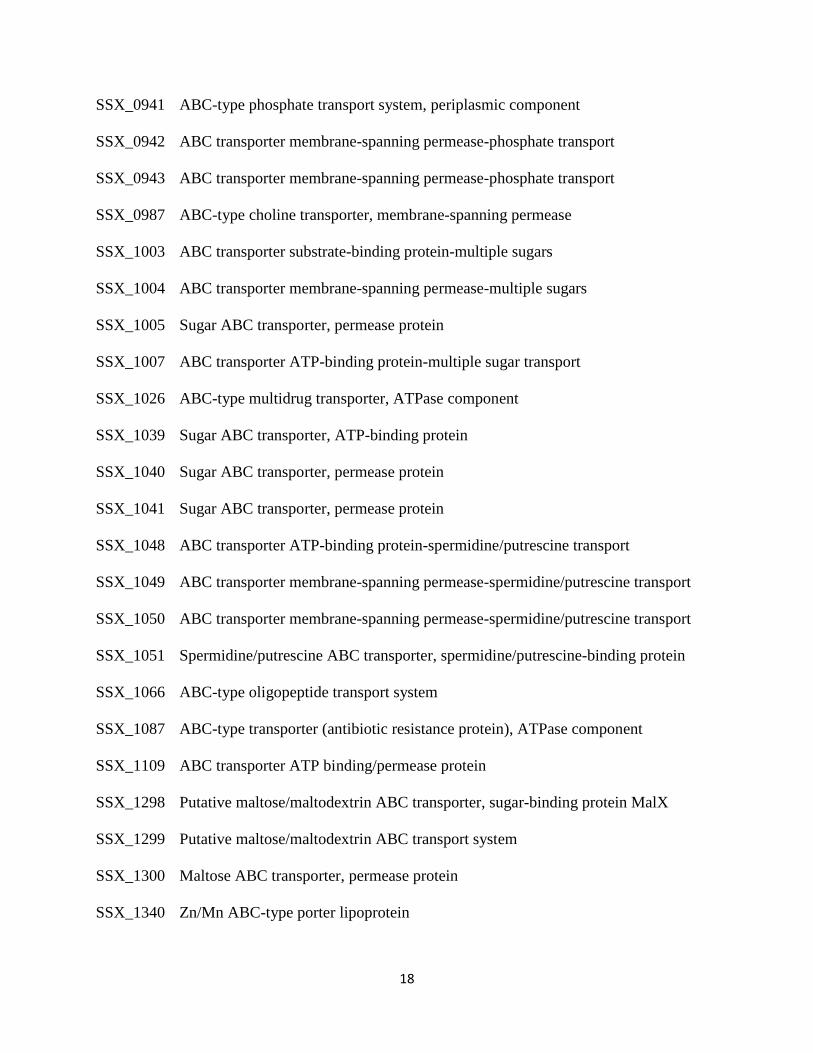
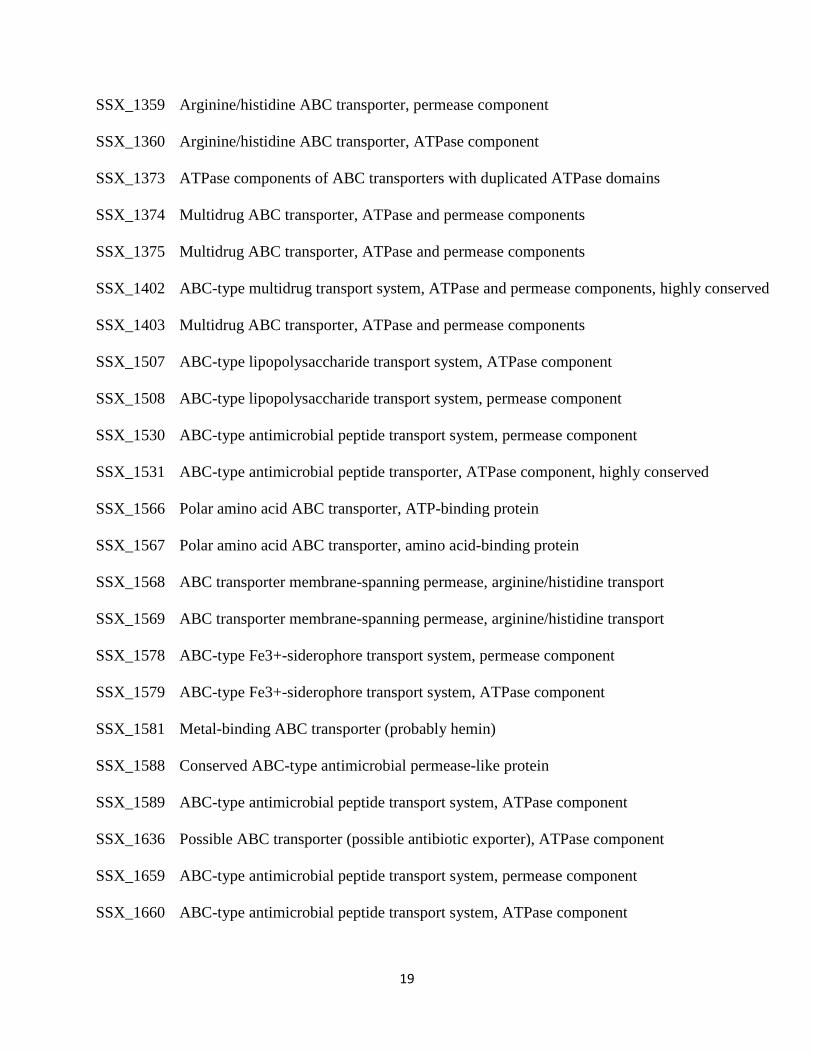
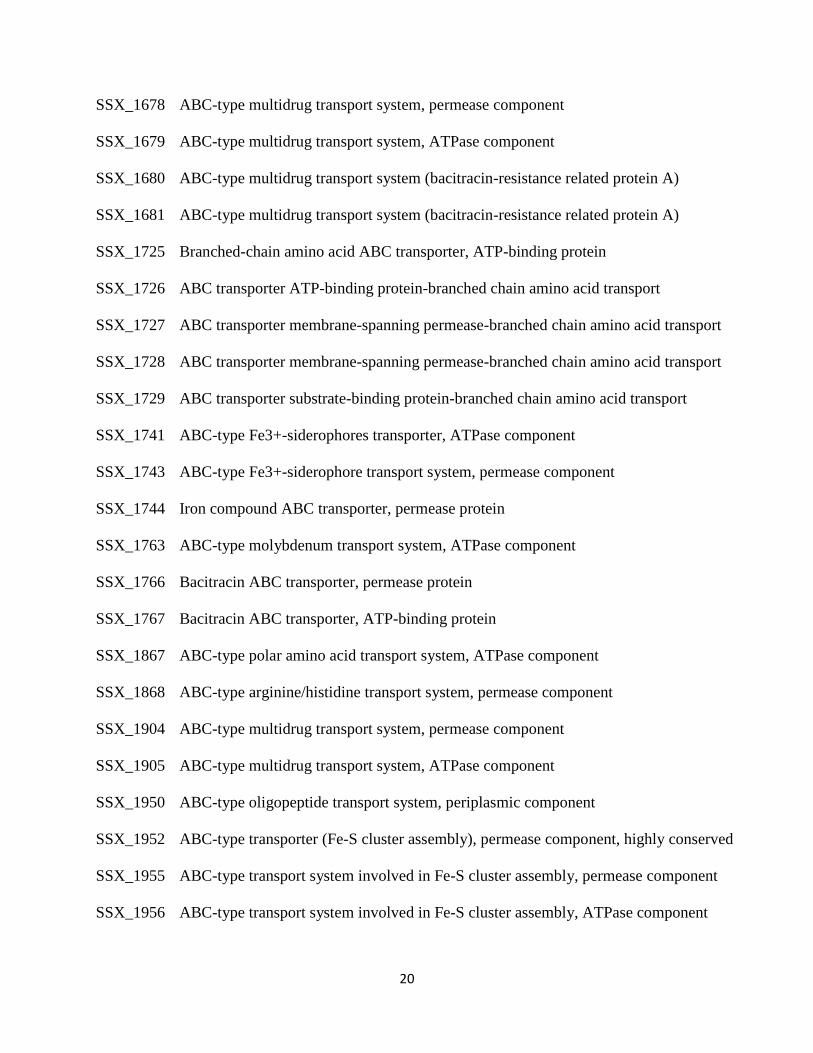
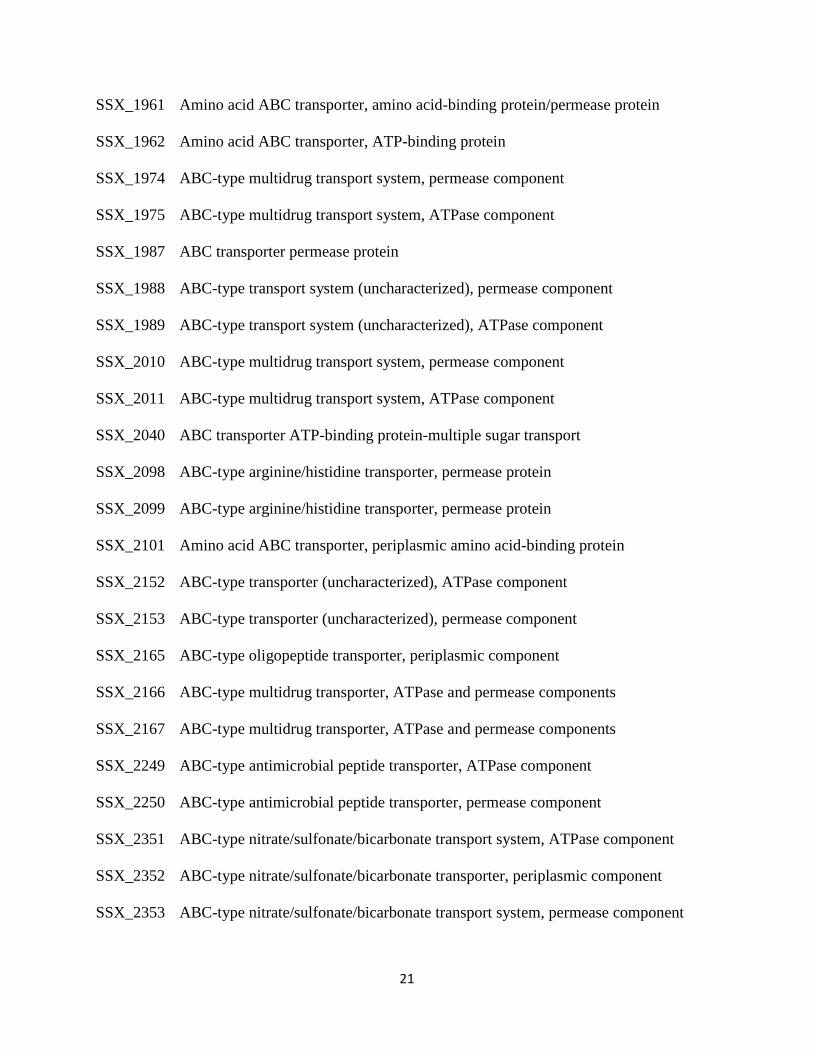
Genes of SK36 are designated as “SSA” followed by the corresponding gene number while
mutants are indicated by “SSX” followed by the gene number. The 150 mutants in genes
identified as ABC transporters investigated in this study are shown in Table 1, along with control
strains.
15
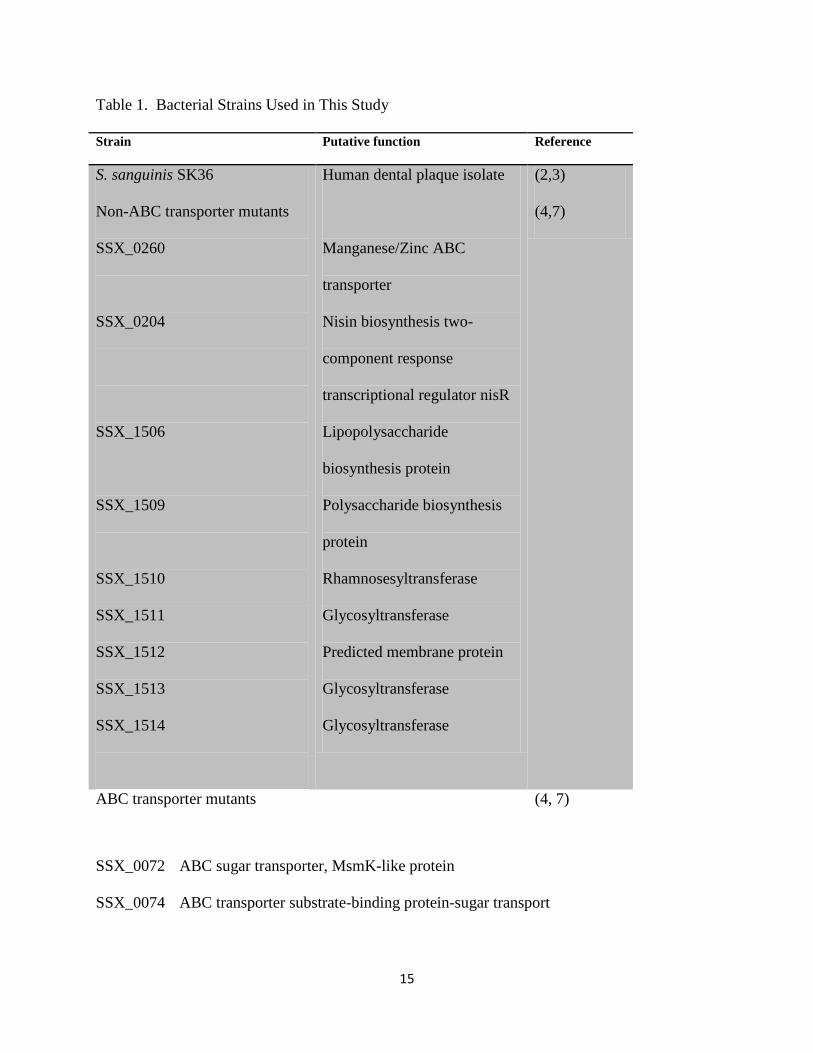
Table 1. Bacterial Strains Used in This Study
Strain Putative function Reference
S. sanguinis SK36
Non-ABC transporter mutants
SSX_0260
SSX_0204
SSX_1506
SSX_1509
SSX_1510
SSX_1511
SSX_1512
SSX_1513
SSX_1514
Human dental plaque isolate
Manganese/Zinc ABC
transporter
Nisin biosynthesis two-
component response
transcriptional regulator nisR
Lipopolysaccharide
biosynthesis protein
Polysaccharide biosynthesis
protein
Rhamnosesyltransferase
Glycosyltransferase
Predicted membrane protein
Glycosyltransferase
Glycosyltransferase
(2,3)
(4,7)
ABC transporter mutants (4, 7)
SSX_0072 ABC sugar transporter, MsmK-like protein
SSX_0074 ABC transporter substrate-binding protein-sugar transport
16
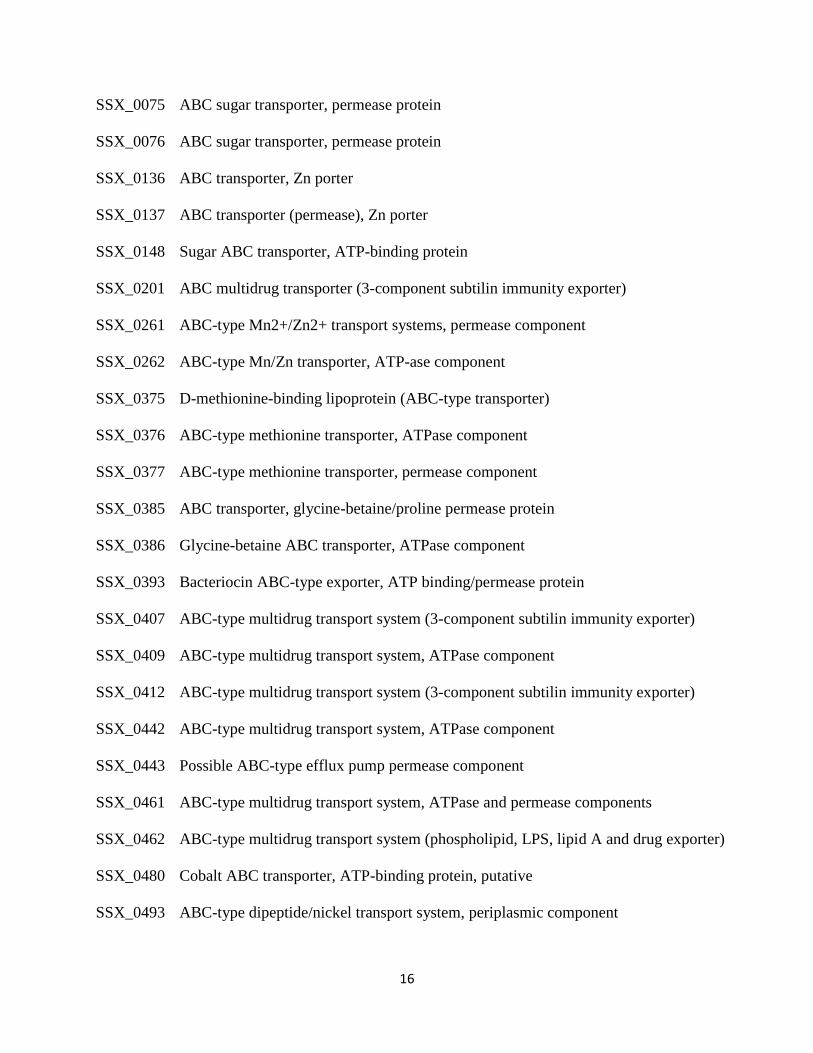
SSX_0075 ABC sugar transporter, permease protein
SSX_0076 ABC sugar transporter, permease protein
SSX_0136 ABC transporter, Zn porter
SSX_0137 ABC transporter (permease), Zn porter
SSX_0148 Sugar ABC transporter, ATP-binding protein
SSX_0201 ABC multidrug transporter (3-component subtilin immunity exporter)
SSX_0261 ABC-type Mn2+/Zn2+ transport systems, permease component
SSX_0262 ABC-type Mn/Zn transporter, ATP-ase component
SSX_0375 D-methionine-binding lipoprotein (ABC-type transporter)
SSX_0376 ABC-type methionine transporter, ATPase component
SSX_0377 ABC-type methionine transporter, permease component
SSX_0385 ABC transporter, glycine-betaine/proline permease protein
SSX_0386 Glycine-betaine ABC transporter, ATPase component
SSX_0393 Bacteriocin ABC-type exporter, ATP binding/permease protein
SSX_0407 ABC-type multidrug transport system (3-component subtilin immunity exporter)
SSX_0409 ABC-type multidrug transport system, ATPase component
SSX_0412 ABC-type multidrug transport system (3-component subtilin immunity exporter)
SSX_0442 ABC-type multidrug transport system, ATPase component
SSX_0443 Possible ABC-type efflux pump permease component
SSX_0461 ABC-type multidrug transport system, ATPase and permease components
SSX_0462 ABC-type multidrug transport system (phospholipid, LPS, lipid A and drug exporter)
SSX_0480 Cobalt ABC transporter, ATP-binding protein, putative
SSX_0493 ABC-type dipeptide/nickel transport system, periplasmic component
17
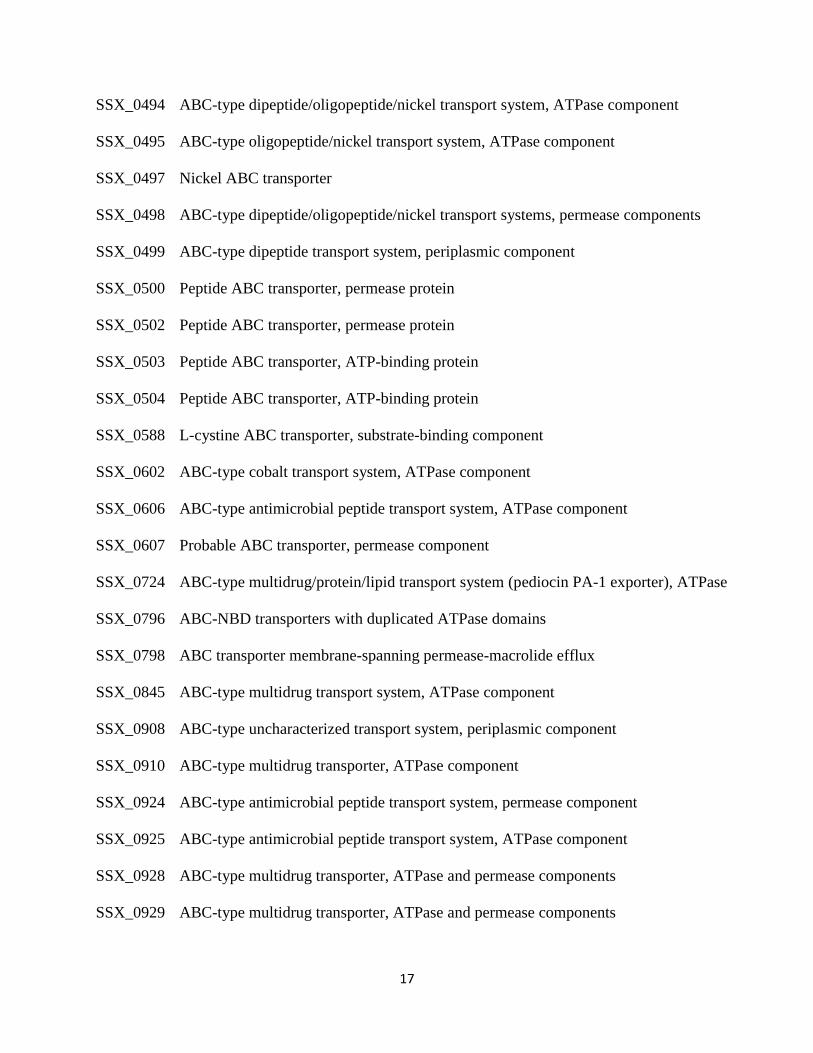
SSX_0494 ABC-type dipeptide/oligopeptide/nickel transport system, ATPase component
SSX_0495 ABC-type oligopeptide/nickel transport system, ATPase component
SSX_0497 Nickel ABC transporter
SSX_0498 ABC-type dipeptide/oligopeptide/nickel transport systems, permease components
SSX_0499 ABC-type dipeptide transport system, periplasmic component
SSX_0500 Peptide ABC transporter, permease protein
SSX_0502 Peptide ABC transporter, permease protein
SSX_0503 Peptide ABC transporter, ATP-binding protein
SSX_0504 Peptide ABC transporter, ATP-binding protein
SSX_0588 L-cystine ABC transporter, substrate-binding component
SSX_0602 ABC-type cobalt transport system, ATPase component
SSX_0606 ABC-type antimicrobial peptide transport system, ATPase component
SSX_0607 Probable ABC transporter, permease component
SSX_0724 ABC-type multidrug/protein/lipid transport system (pediocin PA-1 exporter), ATPase
SSX_0796 ABC-NBD transporters with duplicated ATPase domains
SSX_0798 ABC transporter membrane-spanning permease-macrolide efflux
SSX_0845 ABC-type multidrug transport system, ATPase component
SSX_0908 ABC-type uncharacterized transport system, periplasmic component
SSX_0910 ABC-type multidrug transporter, ATPase component
SSX_0924 ABC-type antimicrobial peptide transport system, permease component
SSX_0925 ABC-type antimicrobial peptide transport system, ATPase component
SSX_0928 ABC-type multidrug transporter, ATPase and permease components
SSX_0929 ABC-type multidrug transporter, ATPase and permease components
18
SSX_0941 ABC-type phosphate transport system, periplasmic component
SSX_0942 ABC transporter membrane-spanning permease-phosphate transport
SSX_0943 ABC transporter membrane-spanning permease-phosphate transport
SSX_0987 ABC-type choline transporter, membrane-spanning permease
SSX_1003 ABC transporter substrate-binding protein-multiple sugars
SSX_1004 ABC transporter membrane-spanning permease-multiple sugars
SSX_1005 Sugar ABC transporter, permease protein
SSX_1007 ABC transporter ATP-binding protein-multiple sugar transport
SSX_1026 ABC-type multidrug transporter, ATPase component
SSX_1039 Sugar ABC transporter, ATP-binding protein
SSX_1040 Sugar ABC transporter, permease protein
SSX_1041 Sugar ABC transporter, permease protein
SSX_1048 ABC transporter ATP-binding protein-spermidine/putrescine transport
SSX_1049 ABC transporter membrane-spanning permease-spermidine/putrescine transport
SSX_1050 ABC transporter membrane-spanning permease-spermidine/putrescine transport
SSX_1051 Spermidine/putrescine ABC transporter, spermidine/putrescine-binding protein
SSX_1066 ABC-type oligopeptide transport system
SSX_1087 ABC-type transporter (antibiotic resistance protein), ATPase component
SSX_1109 ABC transporter ATP binding/permease protein
SSX_1298 Putative maltose/maltodextrin ABC transporter, sugar-binding protein MalX
SSX_1299 Putative maltose/maltodextrin ABC transport system
SSX_1300 Maltose ABC transporter, permease protein
SSX_1340 Zn/Mn ABC-type porter lipoprotein
19
SSX_1359 Arginine/histidine ABC transporter, permease component
SSX_1360 Arginine/histidine ABC transporter, ATPase component
SSX_1373 ATPase components of ABC transporters with duplicated ATPase domains
SSX_1374 Multidrug ABC transporter, ATPase and permease components
SSX_1375 Multidrug ABC transporter, ATPase and permease components
SSX_1402 ABC-type multidrug transport system, ATPase and permease components, highly conserved
SSX_1403 Multidrug ABC transporter, ATPase and permease components
SSX_1507 ABC-type lipopolysaccharide transport system, ATPase component
SSX_1508 ABC-type lipopolysaccharide transport system, permease component
SSX_1530 ABC-type antimicrobial peptide transport system, permease component
SSX_1531 ABC-type antimicrobial peptide transporter, ATPase component, highly conserved
SSX_1566 Polar amino acid ABC transporter, ATP-binding protein
SSX_1567 Polar amino acid ABC transporter, amino acid-binding protein
SSX_1568 ABC transporter membrane-spanning permease, arginine/histidine transport
SSX_1569 ABC transporter membrane-spanning permease, arginine/histidine transport
SSX_1578 ABC-type Fe3+-siderophore transport system, permease component
SSX_1579 ABC-type Fe3+-siderophore transport system, ATPase component
SSX_1581 Metal-binding ABC transporter (probably hemin)
SSX_1588 Conserved ABC-type antimicrobial permease-like protein
SSX_1589 ABC-type antimicrobial peptide transport system, ATPase component
SSX_1636 Possible ABC transporter (possible antibiotic exporter), ATPase component
SSX_1659 ABC-type antimicrobial peptide transport system, permease component
SSX_1660 ABC-type antimicrobial peptide transport system, ATPase component
20
SSX_1678 ABC-type multidrug transport system, permease component
SSX_1679 ABC-type multidrug transport system, ATPase component
SSX_1680 ABC-type multidrug transport system (bacitracin-resistance related protein A)
SSX_1681 ABC-type multidrug transport system (bacitracin-resistance related protein A)
SSX_1725 Branched-chain amino acid ABC transporter, ATP-binding protein
SSX_1726 ABC transporter ATP-binding protein-branched chain amino acid transport
SSX_1727 ABC transporter membrane-spanning permease-branched chain amino acid transport
SSX_1728 ABC transporter membrane-spanning permease-branched chain amino acid transport
SSX_1729 ABC transporter substrate-binding protein-branched chain amino acid transport
SSX_1741 ABC-type Fe3+-siderophores transporter, ATPase component
SSX_1743 ABC-type Fe3+-siderophore transport system, permease component
SSX_1744 Iron compound ABC transporter, permease protein
SSX_1763 ABC-type molybdenum transport system, ATPase component
SSX_1766 Bacitracin ABC transporter, permease protein
SSX_1767 Bacitracin ABC transporter, ATP-binding protein
SSX_1867 ABC-type polar amino acid transport system, ATPase component
SSX_1868 ABC-type arginine/histidine transport system, permease component
SSX_1904 ABC-type multidrug transport system, permease component
SSX_1905 ABC-type multidrug transport system, ATPase component
SSX_1950 ABC-type oligopeptide transport system, periplasmic component
SSX_1952 ABC-type transporter (Fe-S cluster assembly), permease component, highly conserved
SSX_1955 ABC-type transport system involved in Fe-S cluster assembly, permease component
SSX_1956 ABC-type transport system involved in Fe-S cluster assembly, ATPase component
21
SSX_1961 Amino acid ABC transporter, amino acid-binding protein/permease protein
SSX_1962 Amino acid ABC transporter, ATP-binding protein
SSX_1974 ABC-type multidrug transport system, permease component
SSX_1975 ABC-type multidrug transport system, ATPase component
SSX_1987 ABC transporter permease protein
SSX_1988 ABC-type transport system (uncharacterized), permease component
SSX_1989 ABC-type transport system (uncharacterized), ATPase component
SSX_2010 ABC-type multidrug transport system, permease component
SSX_2011 ABC-type multidrug transport system, ATPase component
SSX_2040 ABC transporter ATP-binding protein-multiple sugar transport
SSX_2098 ABC-type arginine/histidine transporter, permease protein
SSX_2099 ABC-type arginine/histidine transporter, permease protein
SSX_2101 Amino acid ABC transporter, periplasmic amino acid-binding protein
SSX_2152 ABC-type transporter (uncharacterized), ATPase component
SSX_2153 ABC-type transporter (uncharacterized), permease component
SSX_2165 ABC-type oligopeptide transporter, periplasmic component
SSX_2166 ABC-type multidrug transporter, ATPase and permease components
SSX_2167 ABC-type multidrug transporter, ATPase and permease components
SSX_2249 ABC-type antimicrobial peptide transporter, ATPase component
SSX_2250 ABC-type antimicrobial peptide transporter, permease component
SSX_2351 ABC-type nitrate/sulfonate/bicarbonate transport system, ATPase component
SSX_2352 ABC-type nitrate/sulfonate/bicarbonate transporter, periplasmic component
SSX_2353 ABC-type nitrate/sulfonate/bicarbonate transport system, permease component
22
SSX_2366 ABC-type cobalt transport system, ATPase component
SSX_2367 ABC-type cobalt transport system, ATPase component
SSX_2376 ABC transporter with duplicated ATPase domains
SSX_2377 ABC transporter, permease component (possible copper exporter)
23
Figure 2: Construction of single gene deletion mutants. Illustrated below is a schematic
representation of the method for replacing a target gene with the insertion of a kanamycin (KM)
resistance gene cassette into the SK36 chromosome (4).
24
Figure 2.
25
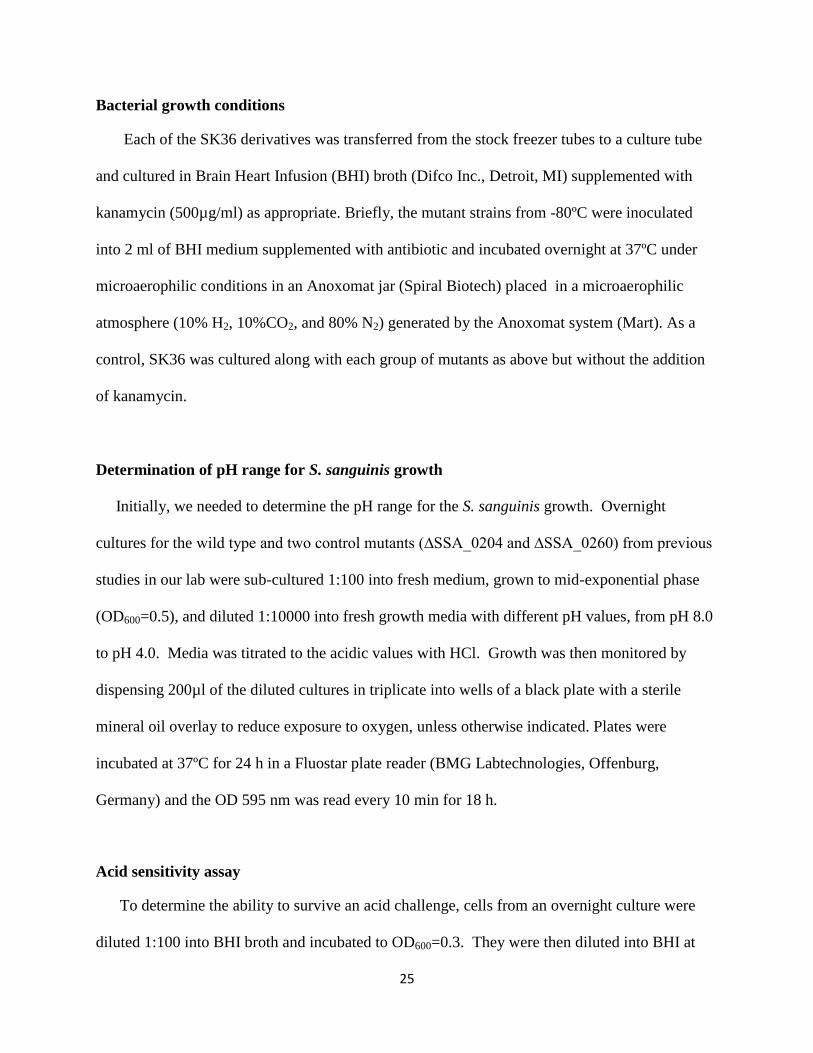
Bacterial growth conditions
Each of the SK36 derivatives was transferred from the stock freezer tubes to a culture tube
and cultured in Brain Heart Infusion (BHI) broth (Difco Inc., Detroit, MI) supplemented with
kanamycin (500µg/ml) as appropriate. Briefly, the mutant strains from -80ºC were inoculated
into 2 ml of BHI medium supplemented with antibiotic and incubated overnight at 37ºC under
microaerophilic conditions in an Anoxomat jar (Spiral Biotech) placed in a microaerophilic
atmosphere (10% H2, 10%CO2, and 80% N2) generated by the Anoxomat system (Mart). As a
control, SK36 was cultured along with each group of mutants as above but without the addition
of kanamycin.
Determination of pH range for S. sanguinis growth
Initially, we needed to determine the pH range for the S. sanguinis growth. Overnight
cultures for the wild type and two control mutants (∆SSA_0204 and ∆SSA_0260) from previous
studies in our lab were sub-cultured 1:100 into fresh medium, grown to mid-exponential phase
(OD600=0.5), and diluted 1:10000 into fresh growth media with different pH values, from pH 8.0
to pH 4.0. Media was titrated to the acidic values with HCl. Growth was then monitored by
dispensing 200µl of the diluted cultures in triplicate into wells of a black plate with a sterile
mineral oil overlay to reduce exposure to oxygen, unless otherwise indicated. Plates were
incubated at 37ºC for 24 h in a Fluostar plate reader (BMG Labtechnologies, Offenburg,
Germany) and the OD 595 nm was read every 10 min for 18 h.
Acid sensitivity assay
To determine the ability to survive an acid challenge, cells from an overnight culture were
diluted 1:100 into BHI broth and incubated to OD600=0.3. They were then diluted into BHI at
26
two different pH values, either a normal pH around pH 7.6 or BHI broth that had been acidified
with HCL to pH 5.8. Growth was then monitored by dispensing 200µl of the diluted cultures in
triplicate into wells of a black plate with a sterile mineral oil overlay to reduce exposure to
oxygen. Plates were incubated at 37ºC for 18 h in a Fluostar plate reader (BMG labtechnologies,
Offenburg, Germany) with reading every 10 min at OD 595 nm.
Carbohydrate fermentation assay
To evaluate sugar uptake and fermentation, the production of acid from sugar was
determined using different carbohydrates. The bacteria were cultured in BHI pH 7.6 as described
previously to mid-exponential phase. The cells were harvested by centrifugation at 4,000 x g at
4ºC, washed twice with sterile saline, resuspended in 3M phenol red broth (0.1 mg/ml) (BBLTM
,
Becton, Dickinson company, Sparks, MD, USA) and aliquots (0.5ml) were distributed into
microcentrifuge tubes . Sugars were added to a final concentration of 0.5% (wt/vol) and then
incubated for 2 h at 37ºC. Fermentation was scored positive if phenol red changed to orange or
yellow, this would be indicative of pH lower than 6.8. All the carbohydrates used in fermentation
and growth assays were purchased from Fisher Scientific (Fair Lawn, New Jersey, USA) or
Sigma-Aldrich Co. (St. Louis, MO, USA).
Growth on carbohydrate substrates
For monitoring growth analysis on different sugars, the control strain and mutants were
grown in BHI pH 7.6 as described previously to mid-exponential phase. The cells were
harvested by centrifugation at 4,000 x g at 4ºC, washed twice with sterile saline, and resuspended
in 600µl semi defined growth media, CDM, adjusted with HCl to two different pH values; pH
7.6 and pH 6.3 (52). In this medium we had to use pH 6.3 for acidic conditions because the cells
27
wouldn’t grow in this medium at pH 5.8. CDM is comprised of the following biochemically
defined low molecular weight constituents: L-Glutamic acid ( 2 g), L-Cysteine (0.2 g), L-
Leucine (0.9 g), NH4Cl (1 g), K2HPO4 (2.5 g), KH2PO4 (2.5 g), NaHCO3 (4 g), MgSO4 (1.2 g),
MnCl2 (0.02 g), FeSO4 (0.02 g), Na-pyruvate (0.6 g), Riboflavin (1.0 mg), thiamine (0.5 mg), D-
Biotin (0.1 mg), Nicotinic acid (1.0 mg), P-amino-benzoic acid (0.1 mg), Ca-pantothenate (0.5
mg), Pyridoxal (1.0 mg), and Folic acid (0.1 mg). Different carbohydrates were added from a
20% stock to a final concentration of 0.5% and growth was then monitored by dispensing 200µl
of the two different CDM cultures in triplicate into wells of a black plate with a sterile mineral
oil overlay to reduce exposure to oxygen. Plates were incubated at 37ºC for 18 h in a reader. OD
600nm was measured every 10 minutes.
Examination of intracellular pH by fluorescence probe
Cell suspensions of S. sanguinis (5×10⁸ cells/ml) were prepared using 100mM of 2-(N-
morpholino) ethane sulfonic acid (MES) pH 5.0-6.5 and HEPES pH 7.5-8.0. The buffers were
titrated to the desired pH using 3M NaOH. The cell suspensions were incubated with 0.5µM
BECEF-AM (stock solution 1 mM in DMSO, Molecular Probes, Inc., Eugene, Ore.) at 37ºC for
15 min prior to examination. The suspension was then centrifuged at 4000 rpm for 10 min at 4ºC.
The pellet was resuspended and washed three times with sterile saline before final resuspension
in buffers (4ml) with the desired pH.
The fluorescence excitation spectra of BCECF were recorded using a spectrophotometer with
double monochromators and automatic correction for variations in the excitation source.
Excitation was performed at the wavelengths 440-505 nm and the emission wavelength was set
at 535 nm. The ratio of fluorescence of BCECF at 505-440 nm is a function of pH. The slit
width for the excitation and emission monochromators was 5 nm and10 nm, respectively. To
28
relate the fluorescence ratio 505/440 to pH, the ionophore nigericin (final concentration 5 µM,
Sigma-Aldrich, Co., St. Louis, MO, USA) and KCl (final concentration 100mM) were added to
the suspension, which eliminates the pH gradient across the bacterial cell membrane. The
intracellular pH was then fixed at the extracellular pH; the fluorescence ratio at different pH
values was obtained. A calibration curve of fluorescence ratio as a function of pH was then
constructed and prepared for individual experiments using the method of least squares from
which the intracellular pH of the sample was determined.
BCECF toxicity testing
The possible toxicity of BCECF was tested by comparing the surviving fractions of both wild
type and mutant bacteria incubated with and without BCECF-AM. A cell suspension was
prepared as described above using 100 mM MES pH 6.5. The suspension was divided into two
equal fractions, one of which was incubated with 0.5µM BCECF-AM. The two suspensions were
kept at 37ºC for 15 min. Samples of 100µl were removed from the suspensions and diluted in
buffer to obtain a cell density of 2 × 10⁴ cells/ml. Twenty microliters of the diluted suspensions
was seeded on BHI agar. After 24 h of microaerophilic incubation, the colonies formed on the
dishes were counted.
29
3. RESULTS
Determination of pH range for S. sanguinis growth
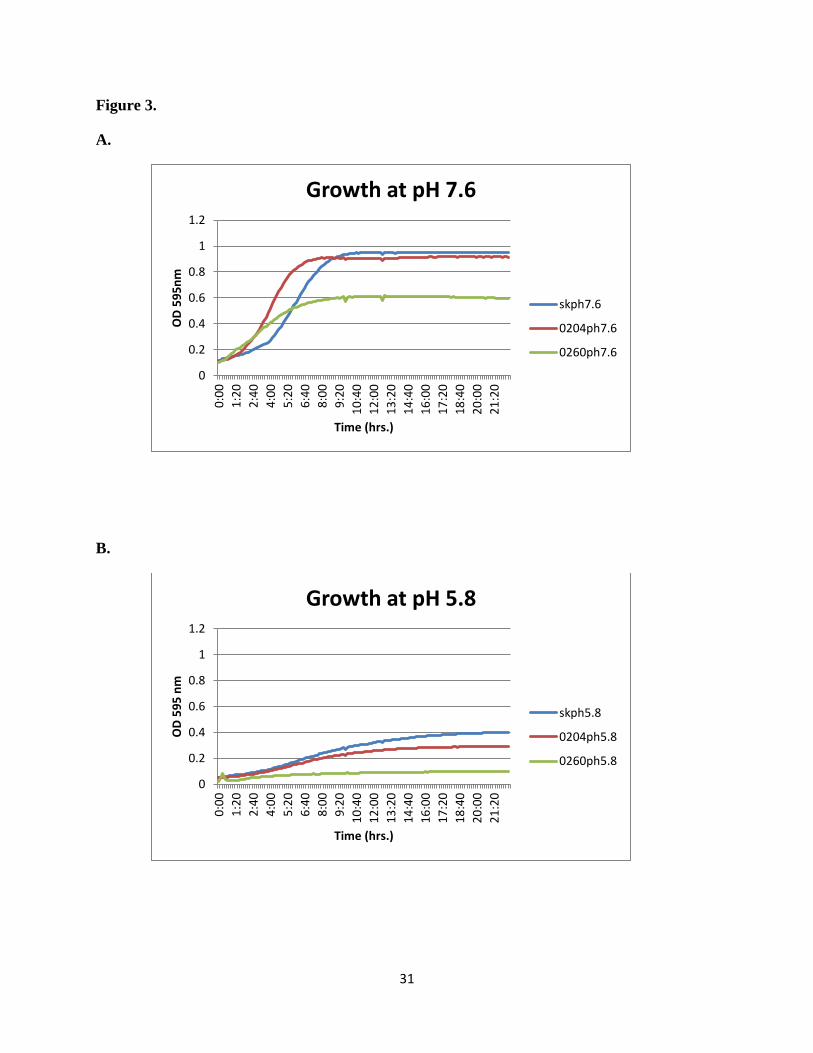
The growth rates of SK36 and two control strains were examined during incubation at a full
range of pH values from pH 8.0 to pH 4.0 in BHI broth at 37
C. Strain ∆SSX_0204 is a TCS
mutant that was previously shown to be more acid resistant, while strain ∆SSA_0260 is acid-
sensitive and lies in a gene that encodes an ABC type metal transporter (52). The cell density
was monitored by spectophotometer at 595 nm. Figure 3 shows the growth rate results at the two
specific pH values that were chosen for the acid sensitivity assay because there was no growth at
pH values outside of this range in either direction. The wild type and ∆SSX_0204 strains had
similar cell densities and grew better than the ∆SSX_0260 even at normal pH, and this latter
strain showed a more severe growth defect at acidic pH than either wild type or ∆SSX_0204
(Figure 3).
Acid sensitivity screen
The growth rates of the 150 mutants in genes previously identified in our laboratory as
putative ABC transporters were compared to the wild type SK36 and the two control mutants
described above, ∆SSX_0204 and ∆SSX_0260. Bacterial growth was examined during
incubation at two different pH values in BHI broth (pH 7.6 and pH 5.8) at 37ºC. The cell density
was monitored by spectrophotometer at 595 nm. Out of the 150 putative ABC transporter
mutants, we found only two, ΔSSX_1507 and ΔSSX_1508, that showed increased sensitivity to
acidic stress. The results in Figure 4 show the growth results for these two ABC transporter
mutants as well as the control strains and two other representative mutants from the collection.

30
Figure 3: Growth rate characteristics for wild type strain S. sanguinis SK36 and two control
strains. Growth in BHI at normal pH (A; pH 7.6) and the acid limit for the wild type strain (B;
pH 5.8) is shown for SK56 and mutants ∆SSX_0204 and ∆SSX_0260). Results shown are the
average of three individual repeats for each strain.
31
Figure 3.
A.
B.
0
0.2
0.4
0.6
0.8
1
1.20
:00
1:2
0
2:4
0
4:0
0
5:2
0
6:4
0
8:0
0
9:2
0
10
:40
12
:00
13
:20
14
:40
16
:00
17
:20
18
:40
20
:00
21
:20
OD
59
5n
m
Time (hrs.)
Growth at pH 7.6
skph7.6
0204ph7.6
0260ph7.6
0
0.2
0.4
0.6
0.8
1
1.2
0:0
0
1:2
0
2:4
0
4:0
0
5:2
0
6:4
0
8:0
0
9:2
0
10
:40
12
:00
13
:20
14
:40
16
:00
17
:20
18
:40
20
:00
21
:20
OD
59
5 n
m
Time (hrs.)
Growth at pH 5.8
skph5.8
0204ph5.8
0260ph5.8
32
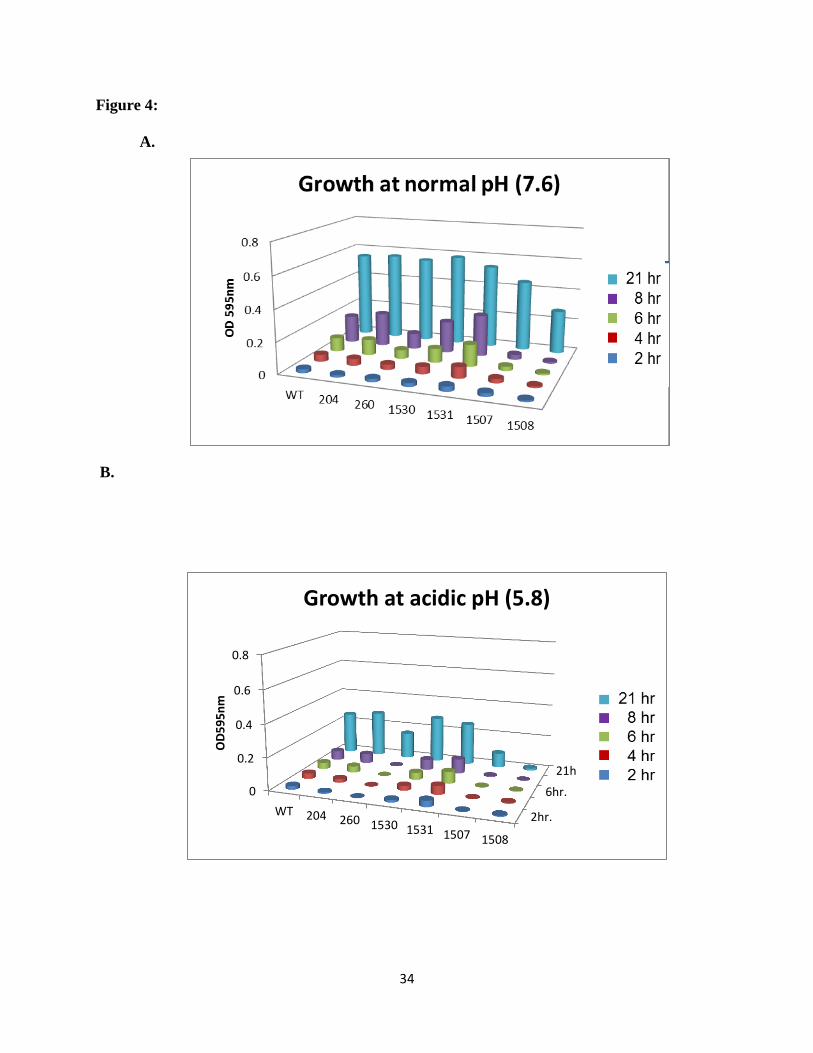
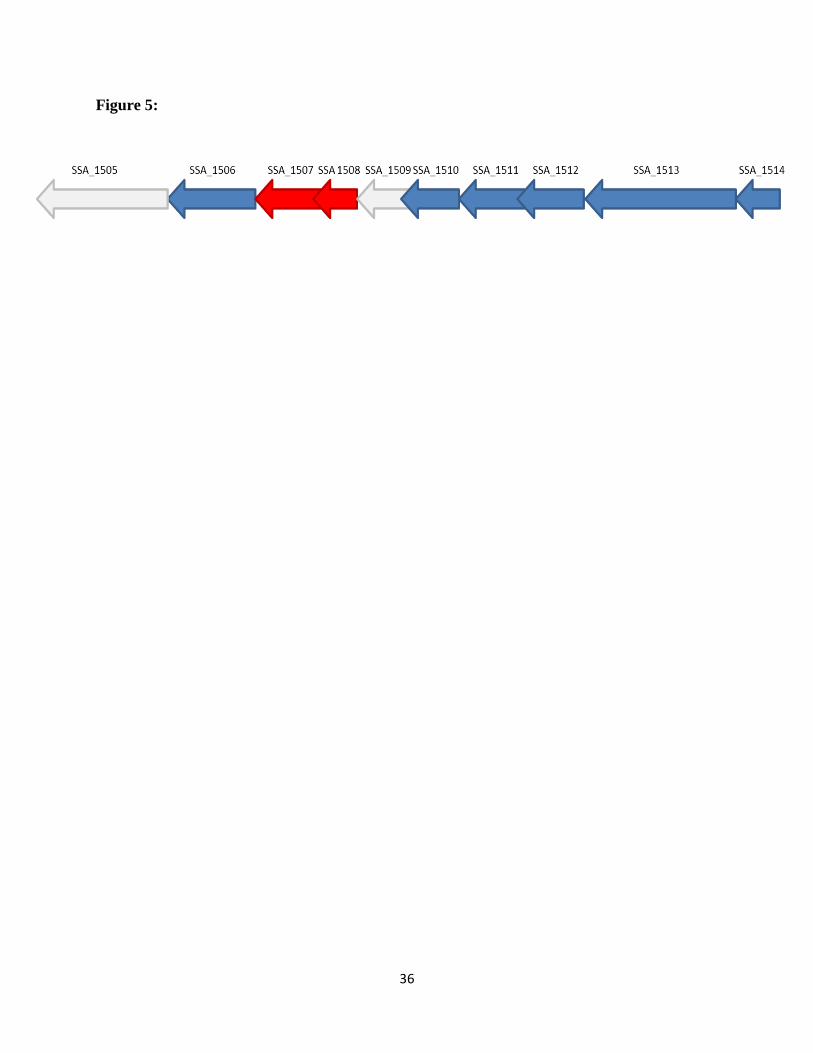
Strain ΔSSX_1507 and ΔSSX_1508 grew slower than the controls, even at normal pH, and
showed a severe growth defect at acidic pH. The genes deleted in these two mutants, SSA_1507
and SSA_1508, are adjacent genes in the same operon, predicted to encode for the cytoplasmic
and membrane components of an ABC type lipopolysaccharide transporter. A BLAST search
reveals that SSA_1507 belongs to the ABC-ATPase superfamily of proteins and encodes a
protein with characteristic motifs including a predicted ATP-binding site, ABC transporter
signature motif, walker A/P-loop, Q-loop/lid, walker B, D-loop, and H-loop/switch region.
SSA_1508 encodes a protein that belongs to the ABC_2membrane superfamily, which plays a
role in capsular polysaccharide export. Both have numerous close homologs in other
streptococcal species. They lie within an operon of genes with putative functions involved in
polysaccharide biosynthesis and transport. This locus is illustrated in Figure 5. We tested the
other available mutants in this gene cluster; none of them exhibited an acid sensitive phenotype
(Figure 6).
33
Figure 4: The growth rate characteristics of selected ABC transporter mutant strains. The two
acid sensitive mutants and two representative nonsensitive mutants are shown in comparison
with the wild type strain S. sanguinis SK36 and control strains (0204 and 0260) at A: pH 7.6, B:
pH 5.8 in BHI medium. Results were obtained from average of three individual repeats for each
strain.
34
Figure 4:
A.
B.
2hr.
6hr.
21hr.
0
0.2
0.4
0.6
0.8
WT 204 260 1530 1531 1507 1508
OD
59
5n
m
Growth at acidic pH (5.8)
2hr.
4hr
6hr.
8hr
21hr.
35
Figure 5. The gene locus encoding the acid-sensitive. The arrows indicate the direction of the
genes from 5’ to 3’. Gene numbers are indicated above the arrows. The red arrows represent the
candidate genes SSA_1507, SSA_1508, which were found to be acid sensitive; the grey arrows
represent genes for which mutants were not available for testing.
36
Figure 5:

37
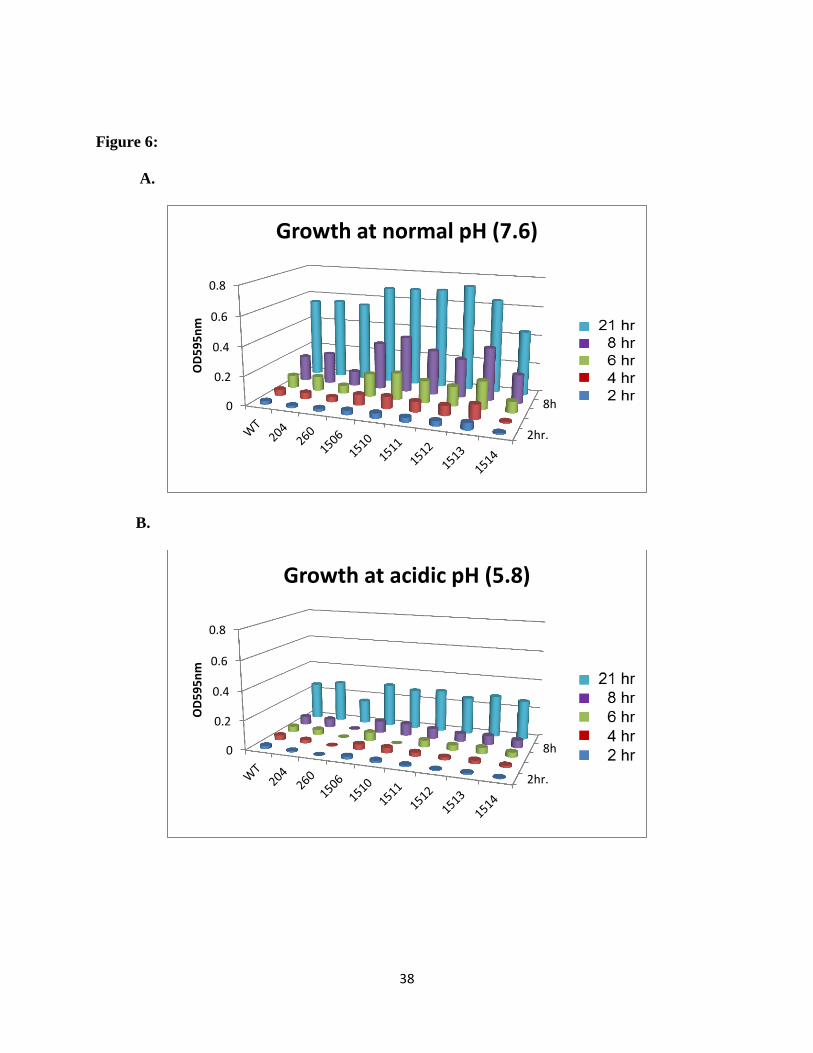
Figure 6: The growth rate characteristics are shown for the rest of the ABC transporter mutant
genes in the operon. Comparison with the wild type strain S. sanguinis SK36 and control strain
(0204 and 0260) at A: pH 7.6, B: pH 5.8 in BHI medium. Results were obtained from average of
three individual repeats for each mutant strain.
38
Figure 6:
A.
B.
2hr.
8hr0
0.2
0.4
0.6
0.8
OD
59
5n
m
Growth at normal pH (7.6)
2hr.
4hr
6hr.
8hr
21hr.
2hr.
8hr0
0.2
0.4
0.6
0.8
OD
59
5n
m
Growth at acidic pH (5.8)
2hr.
4hr
6hr.
8hr
21hr.
39
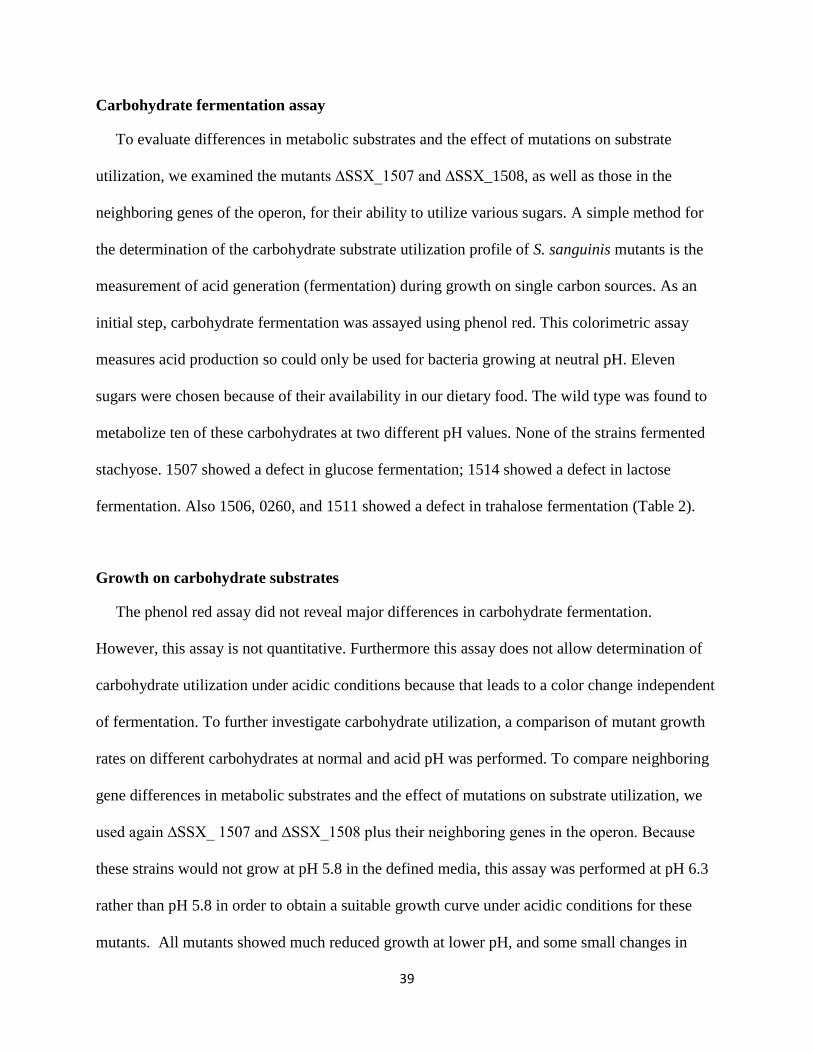
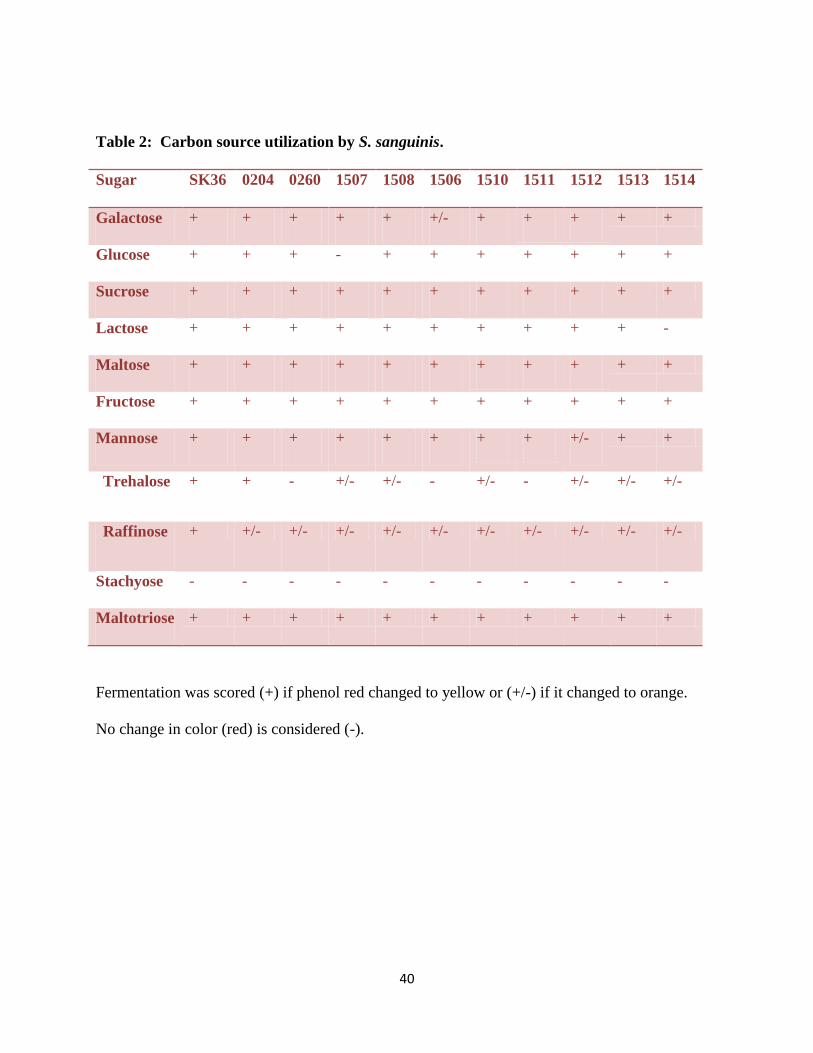
Carbohydrate fermentation assay
To evaluate differences in metabolic substrates and the effect of mutations on substrate
utilization, we examined the mutants ∆SSX_1507 and ∆SSX_1508, as well as those in the
neighboring genes of the operon, for their ability to utilize various sugars. A simple method for
the determination of the carbohydrate substrate utilization profile of S. sanguinis mutants is the
measurement of acid generation (fermentation) during growth on single carbon sources. As an
initial step, carbohydrate fermentation was assayed using phenol red. This colorimetric assay
measures acid production so could only be used for bacteria growing at neutral pH. Eleven
sugars were chosen because of their availability in our dietary food. The wild type was found to
metabolize ten of these carbohydrates at two different pH values. None of the strains fermented
stachyose. 1507 showed a defect in glucose fermentation; 1514 showed a defect in lactose
fermentation. Also 1506, 0260, and 1511 showed a defect in trahalose fermentation (Table 2).
Growth on carbohydrate substrates
The phenol red assay did not reveal major differences in carbohydrate fermentation.
However, this assay is not quantitative. Furthermore this assay does not allow determination of
carbohydrate utilization under acidic conditions because that leads to a color change independent
of fermentation. To further investigate carbohydrate utilization, a comparison of mutant growth
rates on different carbohydrates at normal and acid pH was performed. To compare neighboring
gene differences in metabolic substrates and the effect of mutations on substrate utilization, we
used again ∆SSX_ 1507 and ∆SSX_1508 plus their neighboring genes in the operon. Because
these strains would not grow at pH 5.8 in the defined media, this assay was performed at pH 6.3
rather than pH 5.8 in order to obtain a suitable growth curve under acidic conditions for these
mutants. All mutants showed much reduced growth at lower pH, and some small changes in
40
Table 2: Carbon source utilization by S. sanguinis.
Sugar SK36 0204 0260 1507 1508 1506 1510 1511 1512 1513 1514
Galactose + + + + + +/- + + + + +
Glucose + + + - + + + + + + +
Sucrose + + + + + + + + + + +
Lactose + + + + + + + + + + -
Maltose + + + + + + + + + + +
Fructose + + + + + + + + + + +
Mannose + + + + + + + + +/- + +
Trehalose + + - +/- +/- - +/- - +/- +/- +/-
Raffinose + +/- +/- +/- +/- +/- +/- +/- +/- +/- +/-
Stachyose - - - - - - - - - - -
Maltotriose + + + + + + + + + + +
Fermentation was scored (+) if phenol red changed to yellow or (+/-) if it changed to orange.
No change in color (red) is considered (-).
41
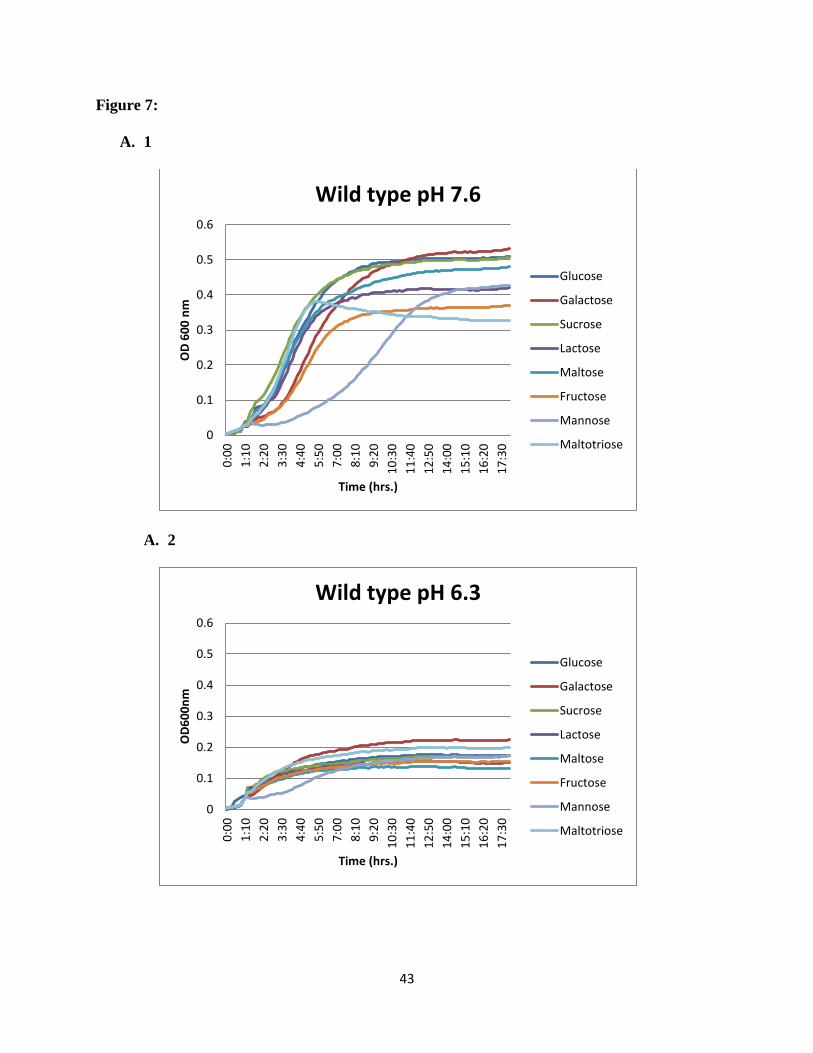
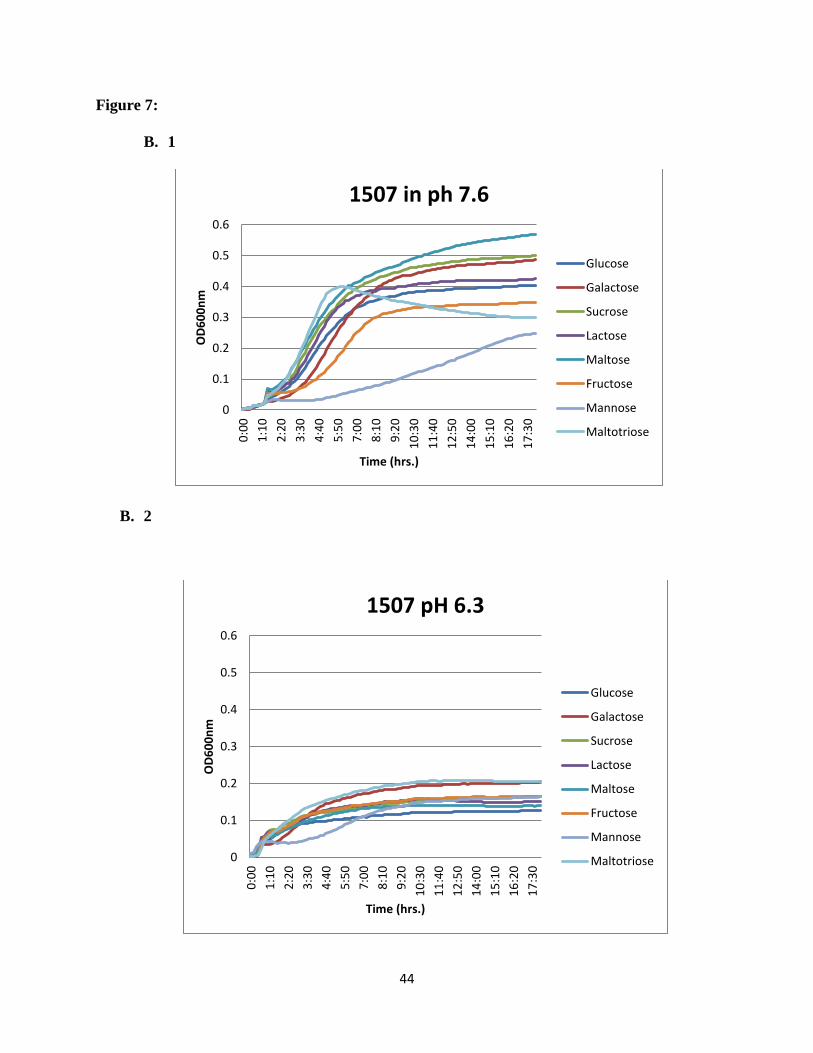
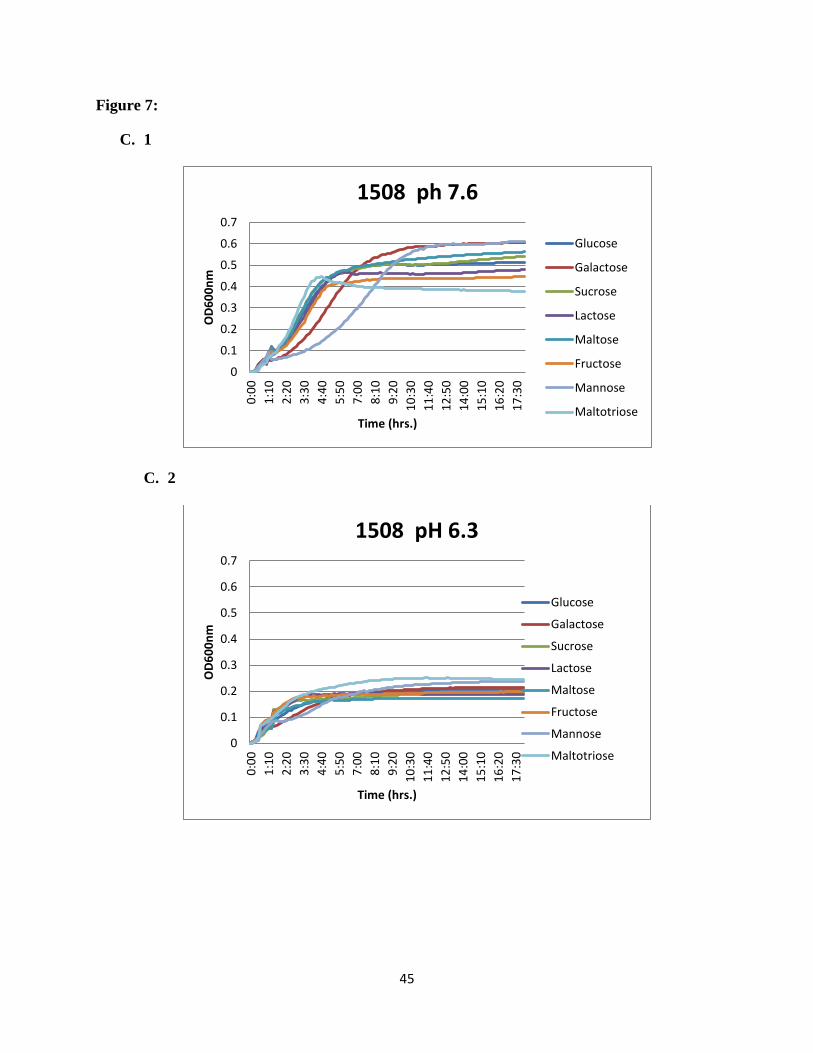
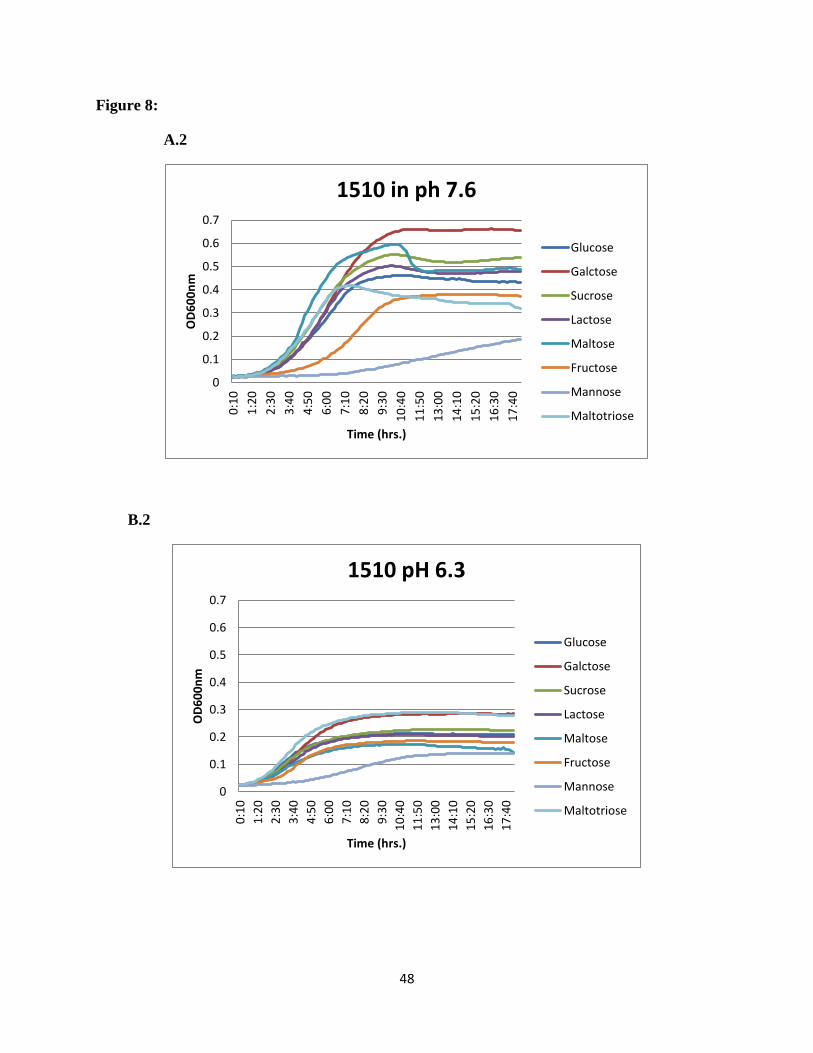
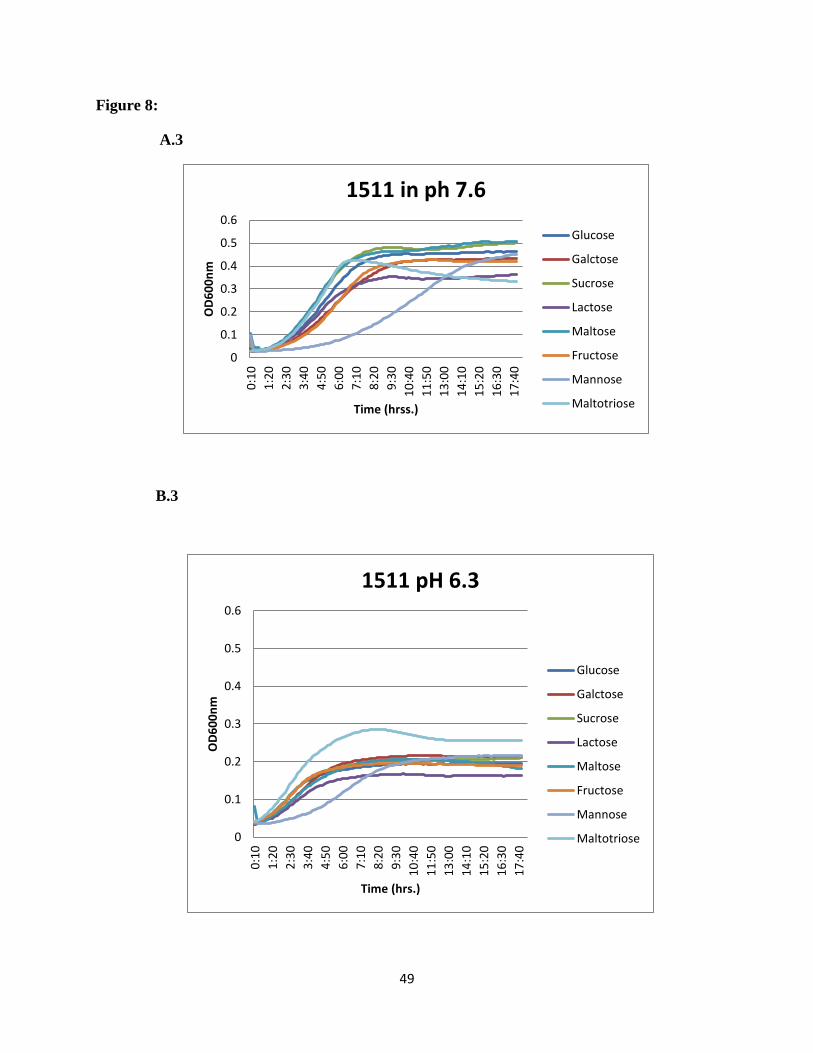
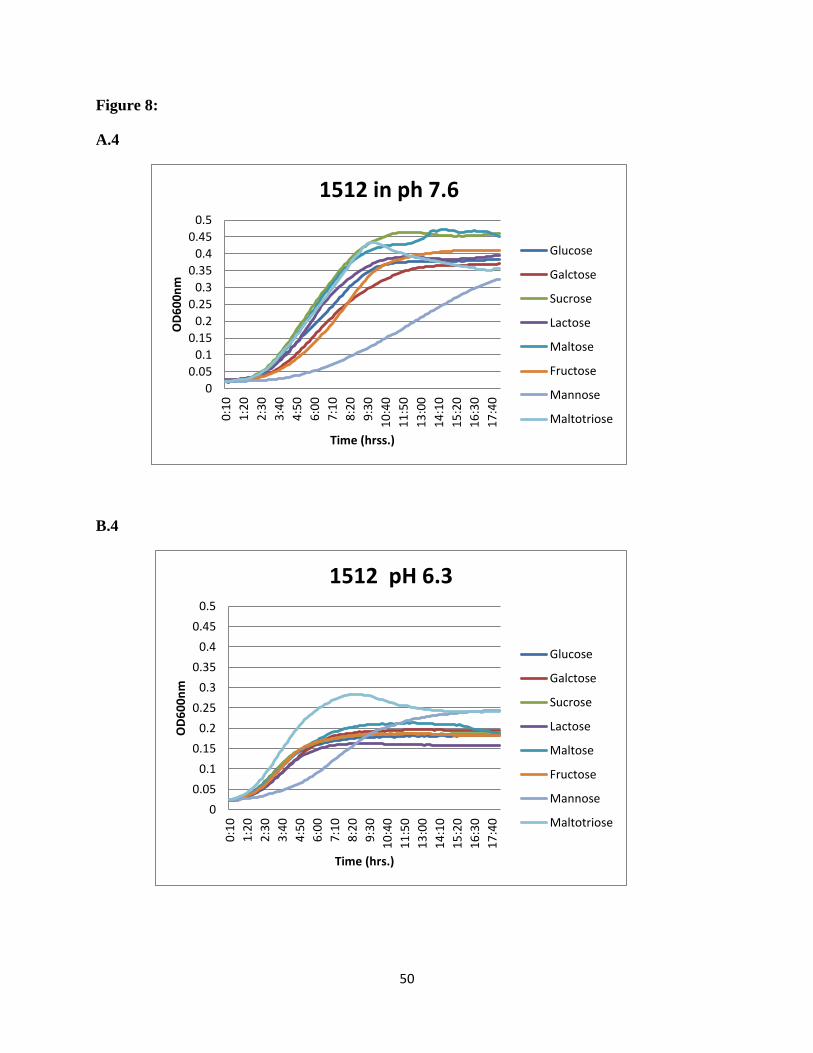
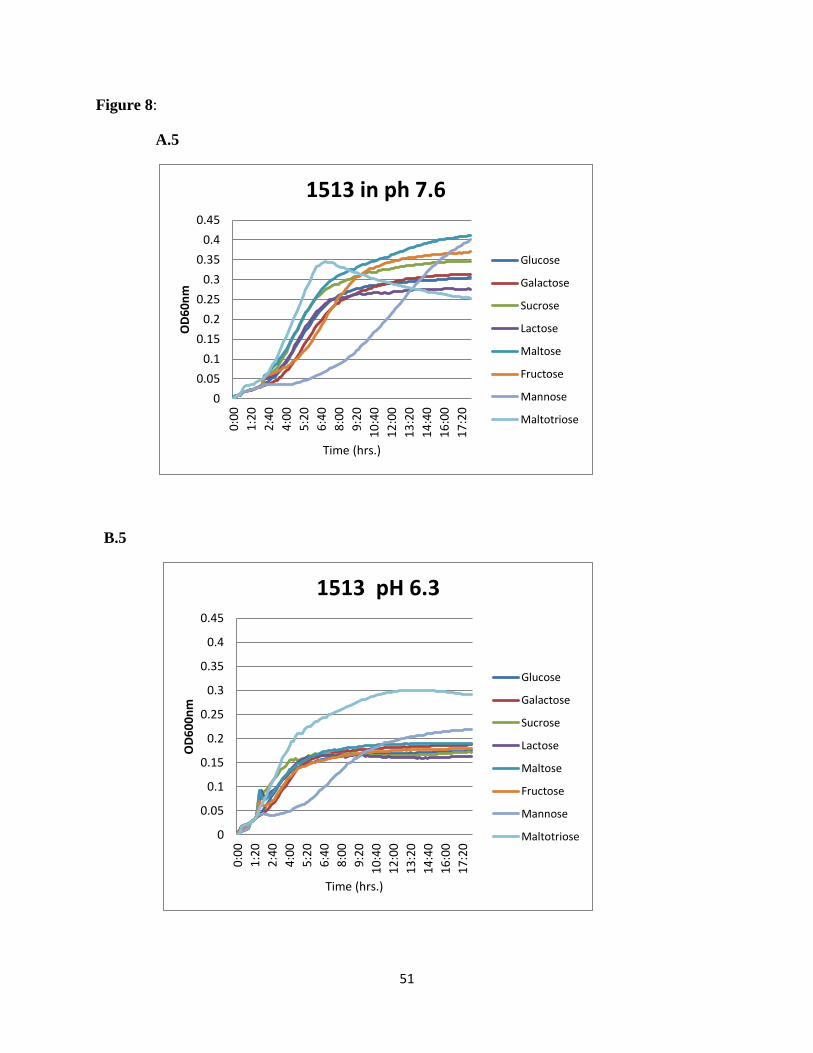
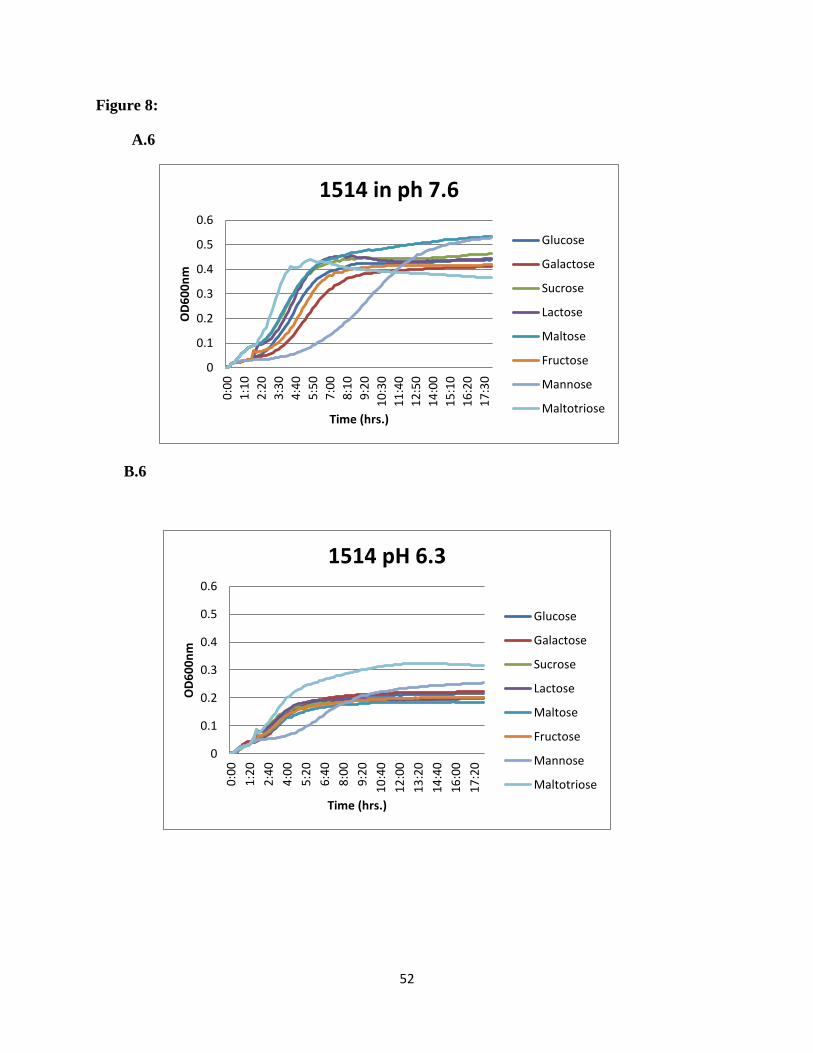
preferred sugars were seen between the wild type and the mutants. Comparison of growth rates
showed that for the wild type (SK36) glucose was the sugar supporting growth best at normal
pH. At acid pH, growth was reduced in all carbohydrates and galactose showed the highest
growth rate. For SSX_1507, at normal pH maltose and galactose supported the highest growth
rates, while maltotriose and galactose supported the higher growth rates at acidic pH. For
SSX_1508, galactose supported the highest growth rate at normal pH (Figure 7), while
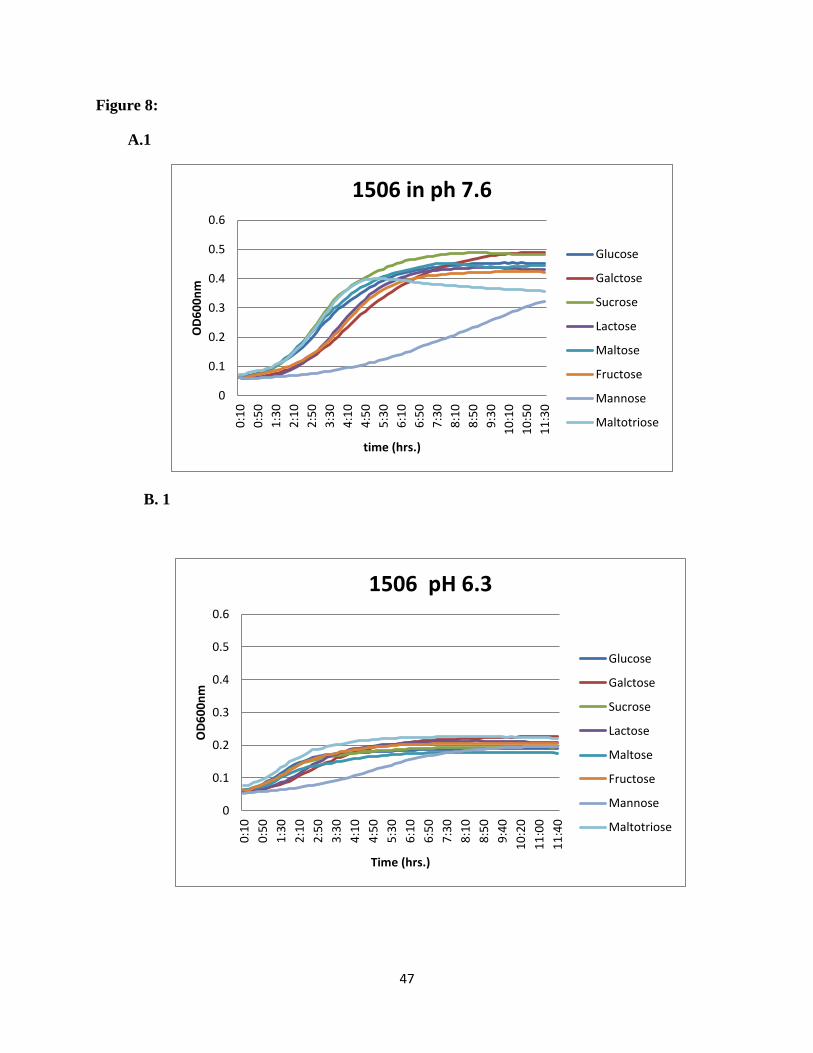
maltotriose was the preferred sugar at acidic pH. For the rest of the mutants in the region e.g.
SSX_1506, SSX_1510, SSX_1511, SSX_1512, SSX_1513, and SSX_1514, galactose was the
most preferred sugar at normal pH and maltotriose showed higher utilization at acidic pH
(Figure 8).
42
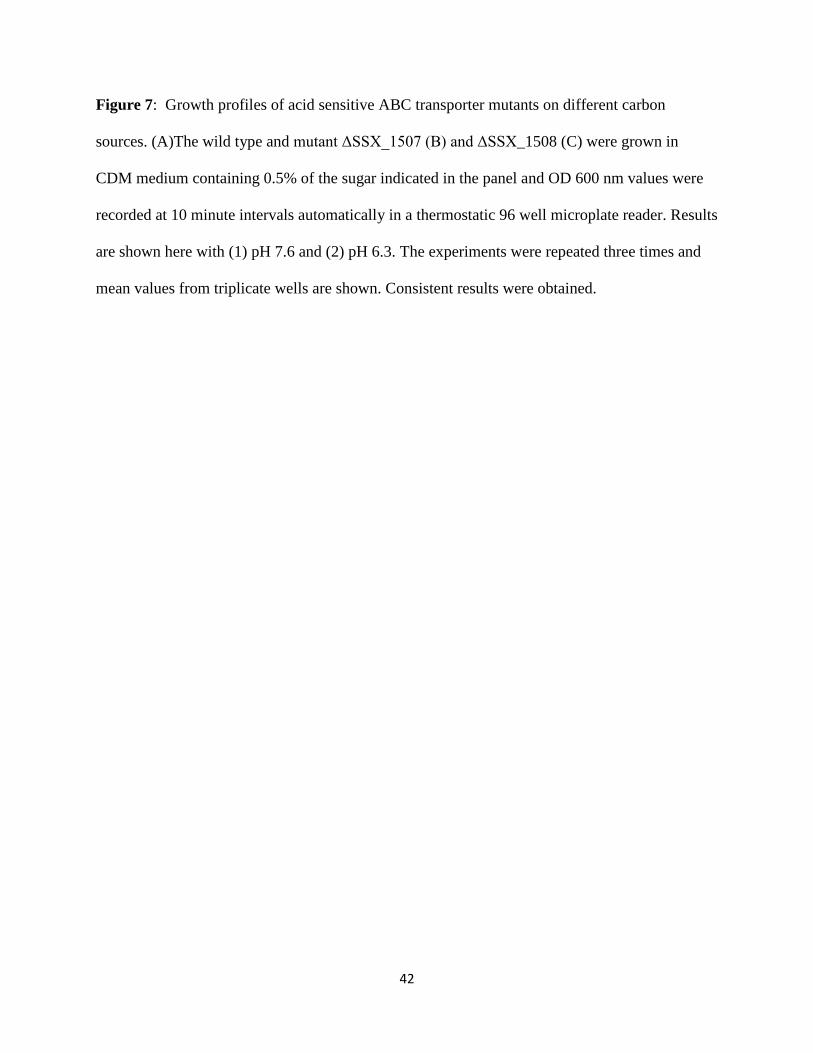
Figure 7: Growth profiles of acid sensitive ABC transporter mutants on different carbon
sources. (A)The wild type and mutant ΔSSX_1507 (B) and ΔSSX_1508 (C) were grown in
CDM medium containing 0.5% of the sugar indicated in the panel and OD 600 nm values were
recorded at 10 minute intervals automatically in a thermostatic 96 well microplate reader. Results
are shown here with (1) pH 7.6 and (2) pH 6.3. The experiments were repeated three times and
mean values from triplicate wells are shown. Consistent results were obtained.
43
Figure 7:
A. 1
A. 2
0
0.1
0.2
0.3
0.4
0.5
0.60
:00
1:1
0
2:2
0
3:3
0
4:4
0
5:5
0
7:0
0
8:1
0
9:2
0
10
:30
11
:40
12
:50
14
:00
15
:10
16
:20
17
:30
OD
60
0 n
m
Time (hrs.)
Wild type pH 7.6
Glucose
Galactose
Sucrose
Lactose
Maltose
Fructose
Mannose
Maltotriose
0
0.1
0.2
0.3
0.4
0.5
0.6
0:0
0
1:1
0
2:2
0
3:3
0
4:4
0
5:5
0
7:0
0
8:1
0
9:2
0
10
:30
11
:40
12
:50
14
:00
15
:10
16
:20
17
:30
OD
60
0n
m
Time (hrs.)
Wild type pH 6.3
Glucose
Galactose
Sucrose
Lactose
Maltose
Fructose
Mannose
Maltotriose
44
Figure 7:
B. 1
B. 2
0
0.1
0.2
0.3
0.4
0.5
0.6
0:0
0
1:1
0
2:2
0
3:3
0
4:4
0
5:5
0
7:0
0
8:1
0
9:2
0
10
:30
11
:40
12
:50
14
:00
15
:10
16
:20
17
:30
OD
60
0n
m
Time (hrs.)
1507 in ph 7.6
Glucose
Galactose
Sucrose
Lactose
Maltose
Fructose
Mannose
Maltotriose
0
0.1
0.2
0.3
0.4
0.5
0.6
0:0
0
1:1
0
2:2
0
3:3
0
4:4
0
5:5
0
7:0
0
8:1
0
9:2
0
10
:30
11
:40
12
:50
14
:00
15
:10
16
:20
17
:30
OD
60
0n
m
Time (hrs.)
1507 pH 6.3
Glucose
Galactose
Sucrose
Lactose
Maltose
Fructose
Mannose
Maltotriose
45
Figure 7:
C. 1
C. 2
0
0.1
0.2
0.3
0.4
0.5
0.6
0.7
0:0
0
1:1
0
2:2
0
3:3
0
4:4
0
5:5
0
7:0
0
8:1
0
9:2
0
10
:30
11
:40
12
:50
14
:00
15
:10
16
:20
17
:30
OD
60
0n
m
Time (hrs.)
1508 ph 7.6
Glucose
Galactose
Sucrose
Lactose
Maltose
Fructose
Mannose
Maltotriose
0
0.1
0.2
0.3
0.4
0.5
0.6
0.7
0:0
0
1:1
0
2:2
0
3:3
0
4:4
0
5:5
0
7:0
0
8:1
0
9:2
0
10
:30
11
:40
12
:50
14
:00
15
:10
16
:20
17
:30
OD
60
0n
m
Time (hrs.)
1508 pH 6.3
Glucose
Galactose
Sucrose
Lactose
Maltose
Fructose
Mannose
Maltotriose
46
Figure 8: Growth profiles of the neighboring gene mutants on different carbon sources. Growth
was monitored in microplate reader at pH 7.6 and pH 6.3. OD600 was measured every 10min.
Mean values from three replicate wells are shown. A1 to A6 at pH 7.6 and B1 to B6 at pH 6.3.
47
Figure 8:
A.1
B. 1
0
0.1
0.2
0.3
0.4
0.5
0.6
0:1
0
0:5
0
1:3
0
2:1
0
2:5
0
3:3
0
4:1
0
4:5
0
5:3
0
6:1
0
6:5
0
7:3
0
8:1
0
8:5
0
9:3
0
10
:10
10
:50
11
:30
OD
60
0n
m
time (hrs.)
1506 in ph 7.6
Glucose
Galctose
Sucrose
Lactose
Maltose
Fructose
Mannose
Maltotriose
0
0.1
0.2
0.3
0.4
0.5
0.6
0:1
0
0:5
0
1:3
0
2:1
0
2:5
0
3:3
0
4:1
0
4:5
0
5:3
0
6:1
0
6:5
0
7:3
0
8:1
0
8:5
0
9:4
0
10
:20
11
:00
11
:40
OD
60
0n
m
Time (hrs.)
1506 pH 6.3
Glucose
Galctose
Sucrose
Lactose
Maltose
Fructose
Mannose
Maltotriose
48
Figure 8:
A.2
B.2
0
0.1
0.2
0.3
0.4
0.5
0.6
0.70
:10
1:2
0
2:3
0
3:4
0
4:5
0
6:0
0
7:1
0
8:2
0
9:3
0
10
:40
11
:50
13
:00
14
:10
15
:20
16
:30
17
:40
OD
60
0n
m
Time (hrs.)
1510 in ph 7.6
Glucose
Galctose
Sucrose
Lactose
Maltose
Fructose
Mannose
Maltotriose
0
0.1
0.2
0.3
0.4
0.5
0.6
0.7
0:1
0
1:2
0
2:3
0
3:4
0
4:5
0
6:0
0
7:1
0
8:2
0
9:3
0
10
:40
11
:50
13
:00
14
:10
15
:20
16
:30
17
:40
OD
60
0n
m
Time (hrs.)
1510 pH 6.3
Glucose
Galctose
Sucrose
Lactose
Maltose
Fructose
Mannose
Maltotriose
49
Figure 8:
A.3
B.3
0
0.1
0.2
0.3
0.4
0.5
0.6
0:1
0
1:2
0
2:3
0
3:4
0
4:5
0
6:0
0
7:1
0
8:2
0
9:3
0
10
:40
11
:50
13
:00
14
:10
15
:20
16
:30
17
:40
OD
60
0n
m
Time (hrss.)
1511 in ph 7.6
Glucose
Galctose
Sucrose
Lactose
Maltose
Fructose
Mannose
Maltotriose
0
0.1
0.2
0.3
0.4
0.5
0.6
0:1
0
1:2
0
2:3
0
3:4
0
4:5
0
6:0
0
7:1
0
8:2
0
9:3
0
10
:40
11
:50
13
:00
14
:10
15
:20
16
:30
17
:40
OD
60
0n
m
Time (hrs.)
1511 pH 6.3
Glucose
Galctose
Sucrose
Lactose
Maltose
Fructose
Mannose
Maltotriose
50
Figure 8:
A.4
B.4
0
0.05
0.1
0.15
0.2
0.25
0.3
0.35
0.4
0.45
0.50
:10
1:2
0
2:3
0
3:4
0
4:5
0
6:0
0
7:1
0
8:2
0
9:3
0
10
:40
11
:50
13
:00
14
:10
15
:20
16
:30
17
:40
OD
60
0n
m
Time (hrss.)
1512 in ph 7.6
Glucose
Galctose
Sucrose
Lactose
Maltose
Fructose
Mannose
Maltotriose
0
0.05
0.1
0.15
0.2
0.25
0.3
0.35
0.4
0.45
0.5
0:1
0
1:2
0
2:3
0
3:4
0
4:5
0
6:0
0
7:1
0
8:2
0
9:3
0
10
:40
11
:50
13
:00
14
:10
15
:20
16
:30
17
:40
OD
60
0n
m
Time (hrs.)
1512 pH 6.3
Glucose
Galctose
Sucrose
Lactose
Maltose
Fructose
Mannose
Maltotriose
51
Figure 8:
A.5
B.5
0
0.05
0.1
0.15
0.2
0.25
0.3
0.35
0.4
0.450
:00
1:2
0
2:4
0
4:0
0
5:2
0
6:4
0
8:0
0
9:2
0
10
:40
12
:00
13
:20
14
:40
16
:00
17
:20
OD
60
nm
Time (hrs.)
1513 in ph 7.6
Glucose
Galactose
Sucrose
Lactose
Maltose
Fructose
Mannose
Maltotriose
0
0.05
0.1
0.15
0.2
0.25
0.3
0.35
0.4
0.45
0:0
0
1:2
0
2:4
0
4:0
0
5:2
0
6:4
0
8:0
0
9:2
0
10
:40
12
:00
13
:20
14
:40
16
:00
17
:20
OD
60
0n
m
Time (hrs.)
1513 pH 6.3
Glucose
Galactose
Sucrose
Lactose
Maltose
Fructose
Mannose
Maltotriose
52
Figure 8:
A.6
B.6
0
0.1
0.2
0.3
0.4
0.5
0.60
:00
1:1
0
2:2
0
3:3
0
4:4
0
5:5
0
7:0
0
8:1
0
9:2
0
10
:30
11
:40
12
:50
14
:00
15
:10
16
:20
17
:30
OD
60
0n
m
Time (hrs.)
1514 in ph 7.6
Glucose
Galactose
Sucrose
Lactose
Maltose
Fructose
Mannose
Maltotriose
0
0.1
0.2
0.3
0.4
0.5
0.6
0:0
0
1:2
0
2:4
0
4:0
0
5:2
0
6:4
0
8:0
0
9:2
0
10
:40
12
:00
13
:20
14
:40
16
:00
17
:20
OD
60
0n
m
Time (hrs.)
1514 pH 6.3
Glucose
Galactose
Sucrose
Lactose
Maltose
Fructose
Mannose
Maltotriose
53
Examination of intracellular pH by fluorescence probe
In the absence of an obvious difference in sugar utilization, we wished to investigate the
ability of the acid-sensitive mutants to maintain their intracellular pH when subjected to the
acidic environment in the absence of an extracellular energy source. Before examination of
intracellular pH, we determined the toxicity of BCECF. Bacteria were treated with BCECF and
survival was measured by determination of S. sanguinis colony-forming units (CFU) on agar
plates.
It was found that no significant differences were obtained between the surviving fractions of
bacterial cells (wild type and mutants) incubated for up to 30 minutes with or without BCECF-
AM. Thus, we concluded that BCECF did not appear toxic at least for the course of the 30
minute treatment used in the fluorescence assay. In our assay, the BCECF treated samples were
examined immediately after resuspension such that any leaked BCECF was determined.
Next, we determined whether BCECF can be used to measure the intracellular pH of S.
sanguinis. Cell suspensions were prepared in buffer with a pH varying between 4.0 and 8.0. The
intracellular pH at various extracellular pH values was then determined. During the incubation in
BCECF-AM, BCECF accumulated in the bacteria, leaving them suitably fluorescent after 15
minutes. Calibration of the intracellular pH of each sample was performed in the presence of the
ionophore nigericin and KCl. Addition of nigericin and KCl led to a rapid change in the
fluorescence intensity at the pH-dependent wavelengths of BCECF. The magnitude of this
change was proportional to the difference between the pH of the external medium and the
intracellular pH. After changing the pH of the sample, a calibration curve was constructed that,
in all cases, had a correlation coefficient R ≥ 0.9 (Figure 9B). This allowed a determination of
the intracellular pH of S. sanguinis at different extracellular pH values (Figure 9B). A similar
54
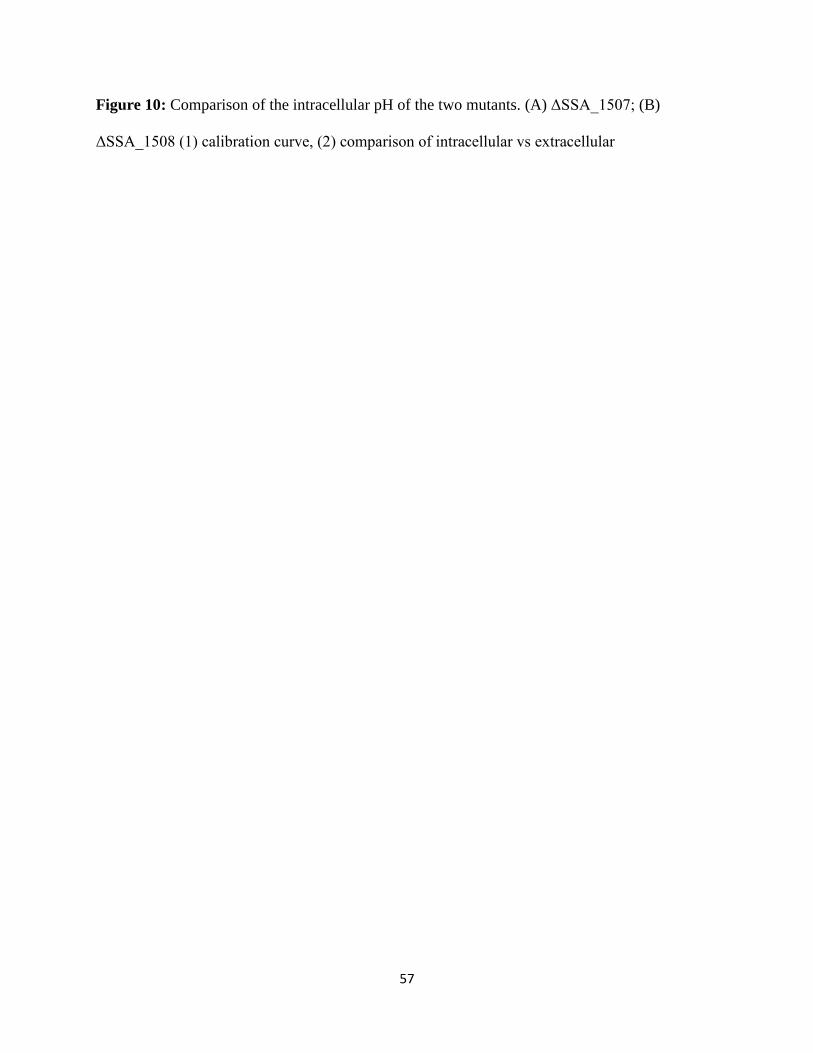
analysis was carried out on the two acid-sensitive mutants 1507 and 1508 (Figure 10). These
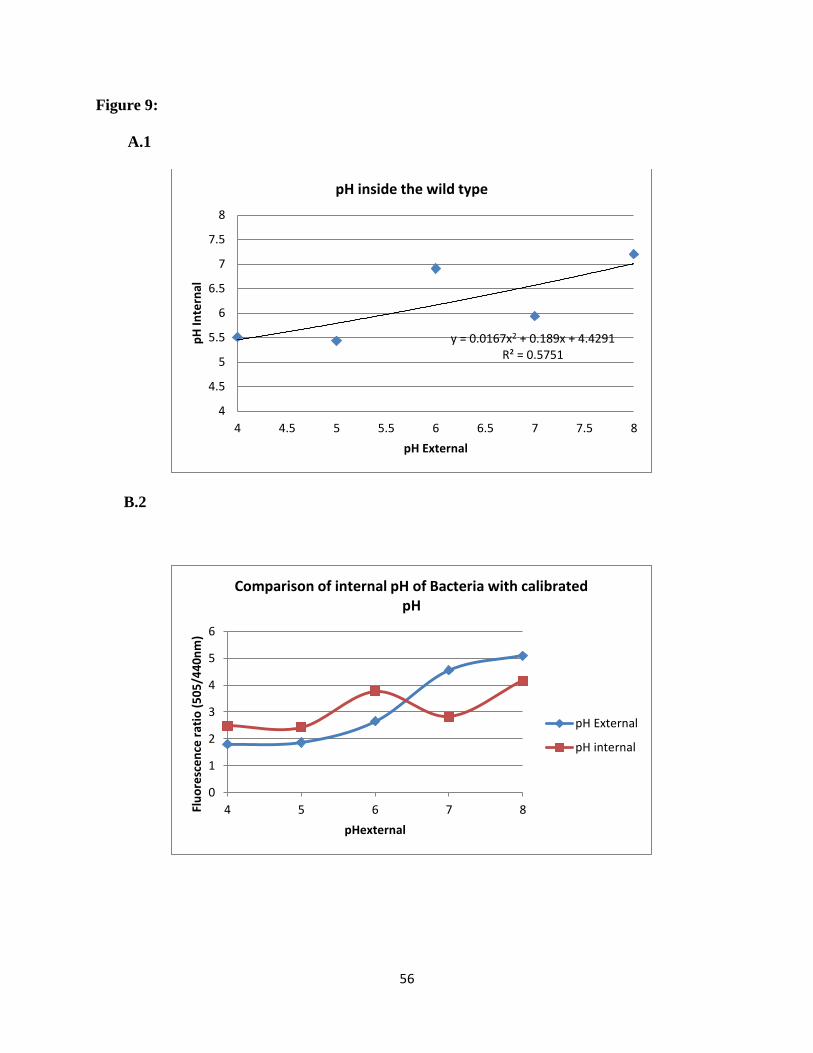
results are summarized in Figure 11. As can be seen in Figure 9A, a good correlation was
obtained between the intracellular pH and extracellular pH determined using BCECF. This
indicates that the fluorescent probe BCECF along with nigericin calibration can be used to
measure the intracellular pH of these bacteria. In the case of wild type bacteria over all
extracellular pH range from pH 4.0-8.0, the intracellular pH, they were maintained bacteria
between pH 5.5 and 7.2. The internal pH increased with increasing extracellular pH except when
the extracellular pH reached 7.0, where the intracellular pH dropped to 6.0. This was because the
pH gradient under the zero around extracellular pH 7.0 (48). At an extracellular pH of 8.0, the
pH values were inverted with the interior being close to neutral (pH 7.2). The results for the two
mutants can be seen in Figure 10. Over the extracellular pH range from 4.0-8.0, both
ΔSSA_1507 and ΔSSA_1508 exhibited a more acidic internal pH than the wild type. The
∆SSA_1507 mutant maintained pH range of an internal pH 5.1 - 6.5, ∆SSA_1508 maintained an
internal pH of 5.1-6.8. As we seen for the wild type, at an extracellular pH of 7.0 the pH values
inverted. In this case, however, the interior was acidic with an intracellular pH of 5.6. In
summary, at all pH values tested the mutant gene strains maintained a lower intracellular pH than
the wild type. These results are summarized in Figure 11. The differences in the intracellular pH
values for wild type and two mutants were found statistically significant. These results suggest
the presence of a proton pump and indicate that the mutants are less able to pump out protons.
55
Figure 9: The intracellular pH compared with the extracellular pH of wild type S. sanguinis. (A)
Calibration curve. The intracellular pH was obtained using BCECF as a pH sensitive probe. (B)
The comparison between the Fluorescence intensity ratio 505/440 for bacterial cells and the
calibration curve reading. Correlation coefficient R= 0.9, from which the intracellular pH was
derived from the calibration of extracellular pH.
56
Figure 9:
A.1
B.2
y = 0.0167x2 + 0.189x + 4.4291 R² = 0.5751
4
4.5
5
5.5
6
6.5
7
7.5
8
4 4.5 5 5.5 6 6.5 7 7.5 8
pH
Inte
rnal
pH External
pH inside the wild type
0
1
2
3
4
5
6
4 5 6 7 8Flu
ore
sce
nce
rat
io (
50
5/4
40
nm
)
pHexternal
Comparison of internal pH of Bacteria with calibrated pH
pH External
pH internal
57
Figure 10: Comparison of the intracellular pH of the two mutants. (A) ΔSSA_1507; (B)
ΔSSA_1508 (1) calibration curve, (2) comparison of intracellular vs extracellular
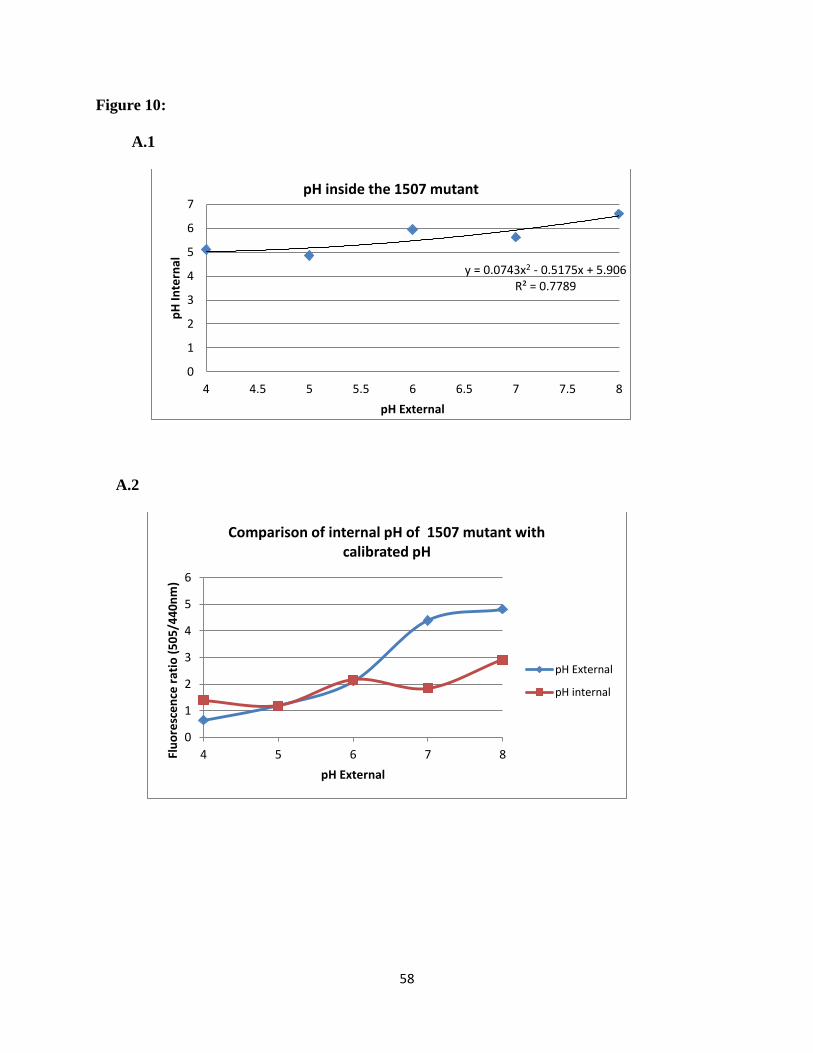
58
Figure 10:
A.1
A.2
y = 0.0743x2 - 0.5175x + 5.906 R² = 0.7789
0
1
2
3
4
5
6
7
4 4.5 5 5.5 6 6.5 7 7.5 8
pH
Inte
rnal
pH External
pH inside the 1507 mutant
0
1
2
3
4
5
6
4 5 6 7 8Flu
ore
sce
nce
rat
io (
50
5/4
40
nm
)
pH External
Comparison of internal pH of 1507 mutant with calibrated pH
pH External
pH internal
59
Figure 10:
B.1
B.2
y = 0.103x2 - 0.839x + 6.847 R² = 0.8208
0
1
2
3
4
5
6
7
8
4 4.5 5 5.5 6 6.5 7 7.5 8
pH
Inte
rnal
pH External
pH inside the 1508 mutant
0
1
2
3
4
5
4 5 6 7 8
Flu
ore
sce
nce
rat
io (
50
5/4
40
nm
)
pH External
Comparison of internal pH of mutant(1508) with calibrated pH
pH External
pH internal
60
Figure 11: Comparison of intracellular pH for the wild type and the mutants. The experiments
were conducted with three individual repeats for each strain. Standard deviations were indicated.
The p-values of statistical significant differences were determined for comparing the wild type
with the mutants.
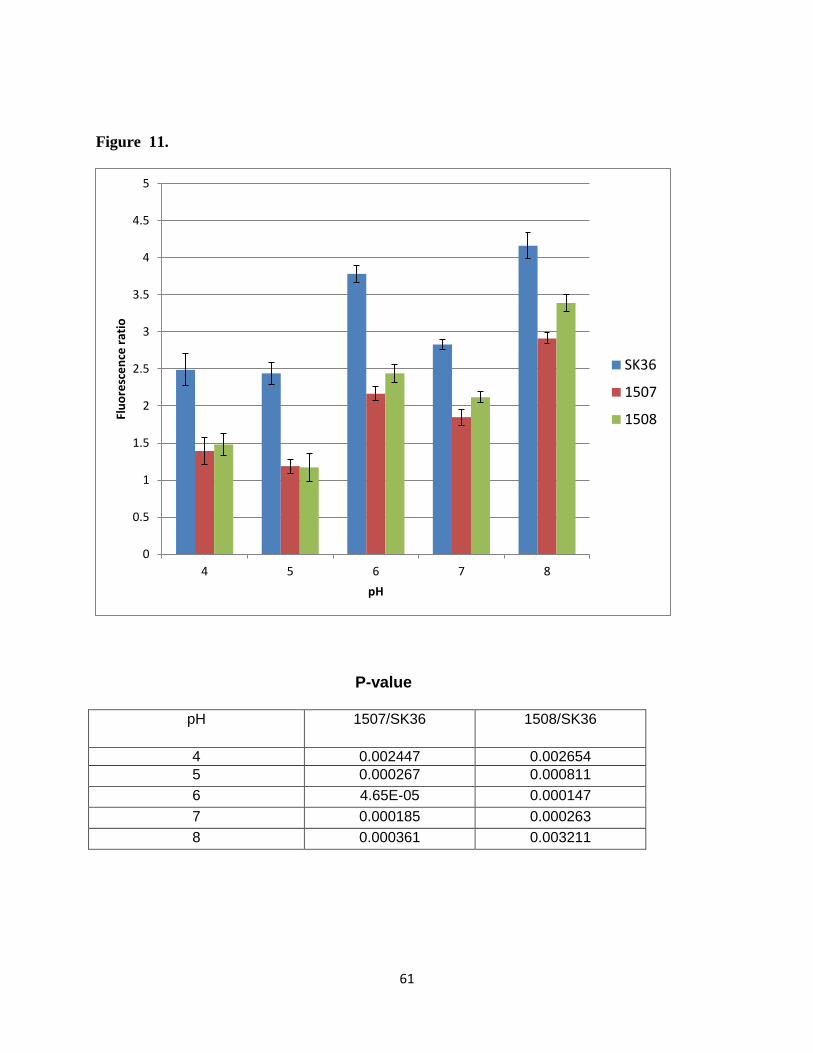
61
Figure 11.
P-value
pH 1507/SK36 1508/SK36
4 0.002447 0.002654 5 0.000267 0.000811 6 4.65E-05 0.000147 7 0.000185 0.000263 8 0.000361 0.003211
0
0.5
1
1.5
2
2.5
3
3.5
4
4.5
5
4 5 6 7 8
Flu
ore
sce
nce
rat
io
pH
SK36
1507
1508
62
4. DISCUSSION
The gram-positive bacterium S. sanguinis, a member of the human pioneer oral
microflora, has been recognized as a key player in bacterial colonization of the mouth. It has
been reported that non-mutans streptococci were dominant in dental plaque (55). It is also the
most common viridians streptococcal species implicated in infective endocarditis (5). S.
sanguinis has been shown to compete against the major cariogenic species, S. mutans, that is
well-adapted to the various hostile environmental conditions of the mouth. It has been thought
that the molecular mechanisms that allow these two bacterial species to resist these conditions
are important characteristics, but the underlying mechanisms are poorly understood (56). These
organisms likely exploit a variety of physiological features for survival in the mouth. These
bacteria are known to be voracious in their ability to consume dietary sugars, so they must be
able to cope with the acid production that is the outcome of their metabolism (57). It has been
noticed that an antagonistic relationship between S. sanguinis and S. mutans was an important
feature in this environmental niche. Since the acid tolerance contributes to the ability of S.
sanguinis cells to adapt and to compete with S. mutans in the plaque environment, it is important
to figure out this mechanism and identify genes involved in acid tolerance in S. sanguinis.
Understanding its regulation could enhance the process by which development of therapeutics
targets the streptococcal caries-forming process.
One of the processes important for these bacteria is acid resistance. Acid tolerance in
plaque bacteria is considered necessary for the formation of caries. Several studies have
emphasized that organisms with higher pH limits for growth are unable to respond to acidic
environments in order to survive, whereas the more aciduric organisms would possess or acquire
acid tolerance (58, 59). Many early colonizing streptococcal species in plaque, such as S.
63
sanguinis, S. gordonii and S. oralis are able to ferment carbohydrates into metabolic acids,
ultimately lowering the plaque pH (60). Also, a recent review mentions that non-mutans
streptococci are considered a major bacterial group in plaque associated with white spots on
teeth, and the dissolution of enamel can be traced to the members of these early microfloras (55).
This review emphasized an extended ecological plaque hypothesis in which the entire
consortium of acidogenic bacteria contributes to the caries process. The hostile environment
inside the mouth (pH 3.0 to 4.0) requires that S. sanguinis adapt and thrive under these
conditions, suggesting that this microorganism is capable of sensing and responding to different
environmental stimuli through specific mechanisms (55).
Various mechanisms are likely to participate in the bacterial resistance response to the
acidic stress of the oral environmental niche. The main mechanism by which the streptococcal
species are considered to survive acid stress is their ability to remove protons from the cytoplasm
by a membrane-bound enzyme, ATPase or F-ATPase. It has been proven that proton
translocation by F 1F 0 ATPase is of the one key mechanisms for regulating intracellular pH; this
enzyme pumps protons back out of the cell in order to protect the interior from adverse
influences of acidification (57) . Similarly, it has been determined that the F 1F 0 ATPase plays a
major role in H. pylori survival in a wide pH gradient from two to seven (61). Some earlier
studies showed that the Mg2 (+)-dependent proton-translocating ATPase was also found to play
an important role in acid tolerance in different strains, e.g. Salmonella typhimurium (62).
Ultimately, it has been determined that there are multiple mechanisms exploited by different
organisms for survival in acid. For example, S. salivarius degrades urea to ammonia and S.
sanguinis produces ammonia by arginolysis, and many more examples can be found in the
literature (10).
64
One of the mechanisms known to play a role in environmental stress response is the TCS
(a signal transduction system). It has been proposed that this system regulates gene expression
and thus allows the adaptation to a changing environment (63). Previous studies in our lab
carried out by J. Patel et al. (52) examined 29 genes involved in TCS including 15 putative
response regulators and 14 putative sensor kinases. These studies identified one TCS response
regulator gene, SSA_0204, involved in an acid stress response. One of the genes regulated by
this response regulator was SSA_0260, a component of an ABC type metal transporter.
Mutation of this gene resulted in a strain that was sensitive to acidic stress. This suggested a role
for ABC transporters in acid tolerance. Further interest in ABC transporters was spurred by a
recent study with a Brucella abortus ABC transporter ATPase gene, in which it was shown that
inactivation of this gene generated a novel rough mutant strain with attenuated virulence,
suggesting the potential of at least some ABC transporters as future vaccine candidates (64)
The principal goal of our study was to expand our screening and look at all ABC
transporter genes in the single gene mutant library that was constructed in our laboratory, in
order to determine whether there were additional mutants in ABC transporter genes that were
more sensitive to acidic conditions and to determine the contribution of each gene identified in
this screen to the acid stress response in S. sanguinis. In our screening, the 150 annotated ABC
transporter mutants were assessed for their ability to withstand acidic environmental stress. We
found that only two ABC mutants (SSX_1507& SSX1508) were more sensitive to acidic
conditions than the wild type S. sanguinis SK36 cells. These two adjacent genes were annotated
as components of a lipopolysaccharide ABC transporter system, the ATPase and a permease.
We were therefore encouraged to include these mutants in further studies.
In this study we focused on the sugar uptake mechanism in relationship to acidity and
65
acid tolerance and examined the growth rate on eleven different sugars for the wild type strain
and each of the genes in the operon that included the two acid sensitive ABC transporter
mutants. The ability of oral streptococci to transport and metabolize a wide variety of sugars,
especially at low pH, allows these bacteria to grow in the oral cavity (65). A complication in
analysis of sugar uptake systems is that many transporters have multiple substrates, and many
sugars are transported by more than one system. Many studies have addressed this question
regarding diversity of transporter systems in the uptake of different substrates in a wide range of
microorganisms. For example, in Streptococcus pneumoniae a genomic survey allowed
recognition of seven carbohydrate ABC transporters in this particular bacterium, and this might
serve as a reference for related species (21). It has also been confirmed that the number of
substrates is much higher than the number of carbohydrate transporters, indicating that each
transporter can be used for multiple substrates (65). In Streptomyces coelicolor, transcriptional
analysis revealed expression of a large number of solute binding proteins in response to
environmental stress, which confers specificity to a small number of ABC transporters (34). The
ATPase component, which is required to energize the transport of substrate, does not contribute
to solute specificity (35).
One of the main features in S. mutans is their ablility to transport sugars by more than
one system e.g. the phosphoenolpyruvate- phosphotransferase system (PTS) and ATP-binding
cassette (ABC) transporters. The ABC transporters are believed to play a more important role in
sugar transport under stress conditions because they showed increased transcription levels under
several tested conditions (31). Our results in growth rate analysis with 11 different sugars
showed that S. sanguinis is able to utilize at least ten of these as substrates at two different pH
values (Figure 7). This is a hallmark of bacteria adapted to ecological niches providing a wide
66
variety of carbon sources, such as the oral cavity, which contain food and host-derived sugars.
Another interesting observation is that no significant differences were observed between the
mutants and the wild type in their utilization of different sugars at two different pH values except
that maltotriose showed a higher utilization in the mutants compared with wild type. In other
words, none of the mutants showed a specific defect in sugar utilization at two different pH
values. Therefore, the observed acid sensitivity is not due to a failure to take up any of the
common sugars tested. We also identified some sugars that are weakly metabolized by S.
sanguinis. Slow acid production from trehalose and raffinose was demonstrated for mutants in
this study and low but detectable growth could also be detected.
It must be noted that assays used in this work are metabolic assays and do not detect
carbohydrate uptake rate directly. Our assays thus miss any sugar uptake that would not feed into
carbon metabolism. An example of this is stachyose, which cannot be metabolized, since genes
required for stachyose catabolism might be missing. Construction of mutants in these two ABC
transporter genes does not permit identification of the substrate specificity for these two mutant
genes. For those sugars which were inefficiently metabolized, fermentation by phenol red assay
proved to be suitable for detection but it is considered not quantitative and did not allow
determination of utilization under acidic conditions. For those substrates more efficiently
metabolized, analysis of growth kinetics was the most sensitive assay method and allowed a
comparison of growth rates on different carbohydrates under two conditions. No distinct
phenotype was observed in our mutants for this ABC transporter system possibly due to the
presence of other redundant sugar transporter systems in the bacterial genome. Construction of
double mutants might be useful, due to uptake of the same substrate by different transporters,
which could compensate for growth in single mutants. Our observations based on analysis of
67
growth rate for the two acid-sensitive mutants showed that this defect might not be related
directly with ABC sugar uptake systems but it might be related with sugar export permeases,
which is more consistent with the results of the BLAST search. For future plans, understanding
S. sanguinis growth on different natural substrates may help in finding a correlation between
carbon source availability and the acidic tolerance.
Our observations are consistent with studies by Alexander on two closely related ABC
transporters in S. mutans (35). It has been proposed that the ATPase genes of these ABC
transporters can interact with either their own or an alternative transporter complex. They also
observed that no significant differences were seen in the transport of different sugars by mutants
in these genes.
Many investigators have proposed other mechanisms involved in the acid stress
response. Non-mutans streptococci have been shown to be capable of increasing their acid
tolerance in response to environmental acidification and this acid adaptation can involve the
induction of H+-ATPase, arginine deiminase and synthesis of stress proteins (20). One model
proposed for the regulation of streptococcal cytoplasmic pH is by changes in the amount and
activity of the H+-ATPase; this occurs when the enzyme biosynthesis is stimulated due to a down
shift in cytoplasmic pH. A further explanation regarding the regulation of cytoplasmic pH
proposes that bacteria change their fermentation to the pathway producing lactate in order to
maintain intracellular pH near neutral (43). The question still rises in our study is how does this
ABC transporter mutant gene get its energy and support the low level growth observed for
substrates like mannose or trehalose under acidic conditions. One of the possibilities is that it
may get energy from another ATPase gene associated with a different ABC transporter to which
the strain can respond weakly. Another possibility is that the formation of specific acid-regulated
68
proteins is required for survival in acid environments, and thus these might be lacking for our
two acid sensitive mutants, but the mechanism behind such a process is still unclear. We did not
recognize any relationship between a defect in sugar fermentation and response to acidity in
these two specific mutants.
Bacteria need to maintain their intracellular pH against extracellular pH extremes for
survival. Regulation of pH regulated genes has been studied primarily in S. typhimurium and
Escherichia coli, where lacZ fusions to pH-regulated genes have demonstrated that maximal
induction for each gene occurs in an internal the pH range of 5.5 to 6.0 (62). Previous
investigations of the intracellular pH of Gram-positive bacteria (P. acnes) have been conducted
using 31
P-NMR spectroscopy (48, 66) but the high cell densities required proved to be
inconvenient. Accordingly, an alternative was sought and the probe BCECF was chosen as a
suitable probe for measuring the intracellular pH of S. sanguinis. It well known that streptococci
have been forced to develop mechanisms to cope with the stress induced by declining pH values
in their environments. The purpose of this part of the study was to determine a possible
relationship between ABC transporter genes and maintenance of the intracellular pH.
Specifically, measurement of the intracellular pH of S. sanguinis was used to determine the role
of the two acid sensitive mutants in regulating the cytoplasmic pH of this bacterium. The assay
of BCECF as a suitable intracellular pH probe for S. sanguinis was determined. Initially, it was
confirmed that BCECF was not toxic (48, this study) at least for a time period required for pH
determination. Also, it was important to demonstrate that the intracellular pH in these bacteria
could be determined from the ratio of the fluorescence signal at the pH-sensitive wavelength
(505) and the fluorescence signal at the pH-insensitive wavelength (440). This ratio method
reduces problems due to the efflux of the fluorescent probe from the cells during the
69
measurement (67). In our experiments, good correlation was obtained. In this assay we had
some difficulties in the measurements. The ratio after the equilibration of intracellular pH and
extracellular pH could be fitted with a four parameter sigmoid function, y = a+ b/ {1+ exp [-(x-
c)/d]}, as previously reported by Breeuwer et. al. (67). It has been reported that reliable results
are obtained using BCECF when nigercin is utilized to calibrate the sample and extracellular
BCECF is removed. The variation of the intracellular pH of S. sanguinis as a function of
extracellular pH could was deduced from some of the experiments discussed here. The pH of the
natural environment of S. sanguinis lies between pH 5.0 and 9.0 (68) and the optimal growth
occurs at approximately pH 7.0. However, S. sanguinis can survive at a pH of up to 9.0 (68),
indicating that intracellular pH regulation over a wide pH range should be possible. It has been
noticed that S. sanguinis maintains a pH gradient, the inside being higher than surrounding, in
the range pH 5.5 to 7.2 also, the pH gradient is lower than zero at approximately pH 7.0. At an
extracellular pH greater than 7.0, this gradient inverts, the inside being more acidic, as has been
reported for other bacteria (43). Our observations have indicated that intracellular pH for the
wild type when we tested with BCECF probe begins around 5.5 and wild type SK36 cells
showed a suitable intracellular pH range in comparison with larger pH range outside the cells.
The mutant strains of SSX_1507 and SSX_1508 showed less ability to maintain their
intracellular pH range. In addition, at all pH values tested, the mutants maintained a lower
intracellular pH than the wild type.
Many streptococcal researchers have proposed the role for H+-ATPase in maintaining
the appropriate intracellular pH for metabolic reactions by expelling protons across the cell
membrane against environmental acidification (69). Hence, we investigated here the role of the
ATPase domain in one ABC transporter gene in regulating the intracellular pH and we have
70
showed that this ABC transporter contributes to the ability of these bacteria to maintain their
internal pH. It has been suggested that the capacity to maintain intracellular pH by ATPase genes
could also protect the cells from intracellular acidification and increase the acid tolerance.
In summary, the present study demonstrates that two ABC transporter mutants in S.
sanguinis are sensitive to acidic stress, and suggested that these transporters are related to the
export of protons. The mechanism form this remains to be determined. Since ABC transporter
genes are involved in the regulation of intracellular pH of this bacterium, a complete picture of
the regulatory network of pH-regulated transporter genes may reveal novel signaling pathways.
Furthermore, since these particular ABC transporter genes are predicted to be related to sugar
transport related, a complete transcription profile analysis of S. sanguinis genes involved in sugar
transport, metabolism and regulation during growth with different sugars under different stress
conditions may also provide an opportunity to advance our understanding of this bacterium.
71
5- REFERENCES
1. Ge X, Kitten T, Chen Z, Lee SP, Munro CL, Xu P. Identification of Streptococcus
sanguinis genes required for biofilm formation and examination of their role in
endocarditis virulence. Infect Immun. 2008 Jun; 76(6):2551-9.
2. Kilian M, Mikkelsen L, Henrichsen J. Taxonomic study of Viridans Streptococci.
Description of Streptococcus-Gorgonii Sp-Nov and Emended Descriptions of
Streptococcus-Sanguinis (White and Niven 1946), Streptococcus-Oralis (Bridge and
Sneath 1982), and Streptococcus-Mitis (Andrewes and Horder 1906). International
Journal of Systematic Bacteriology 1989; 39(4):471-484.
3. Kilian M, Holmgren K. Ecology and nature of immunoglobulin A1 protease-
producing Streptococci in the human oral cavity and pharynx. Infect Immun 1981;
31(3):868-873.
4. Xu P, Alves JM, Kitten T, Brown A, Chen Z, Ozaki LS et al. Genome of the
opportunistic pathogen Streptococcus sanguinis. J Bacteriol 2007; 189(8):3166-3175.
5. Mylonakis E, Calderwood SB. Infective endocarditis in adults. N Eng J Med 2001;
345(18):1318-1330.
6. Russell RR, Aduse-Opoku J, Sutcliffe IC, Tao L, Ferretti JJ. A binding protein-
dependent transport system in Streptococcus mutans responsible for multiple sugar
metabolism. J Biol Chem. 1992 Mar 5; 267(7):4631-7.
7. Chen L, Ge X, Dou Y, Wang X, Patel JR, Xu P. Identification of hydrogen peroxide
production-related genes in Streptococcus sanguinis and their functional relationship
with pyruvate oxidase. Microbiology. 2011 Jan; 157(Pt 1):13-20.
72
8. Poolman B. Transporters and their roles in LAB cell physiology. Antonie Van
Leewenhoek. 2002 Aug; 82(1-4):147-64.
9. Buckwalter CM, King SJ. Pneumococcal carbohydrate transport: food for thought.
Trends Microbiol. 2012 Nov; 20(11):517-22.
10. Quivey RG Jr, Kuhnert WL, Hahn K. Adaptation of oral streptococci to low pH. Adv
Microb Physiol. 2000; 42:239-74.
11. Sheng J, Baldeck JD, Nguyen PT, Quivey RGJr, Marquis RE. Alkali production
associated with malolactic fermentation by oral streptococci and protection against
acid, oxidative or starvation damage. Can J Microbiol. 2010 Jun; 56(7):539-47
12. Martin-Galiano AJ, Overweg K, Ferrándiz MJ, Reuter M, Wells JM, De la Camp
AG. Transcriptional analysis of the acid tolerance in Streptococcus pneumonia.
Microbiology. 2005 Dec; 151(Pt 12):3935-46.
13. Kempf B, Bremer E. Uptake and synthesis of compatible solutes as microbial stress
responses to high-osmolality environments. Arch Microbiol. 1998 Oct; 170(5):319-
30.
14. Rallu F, Gruss A, Ehrlich SD, Maquin E. Acid-and multistress-resistant mutants of
Lactococcus lactic: identification of intracellular stress signals. Mol Microbiol. 2000
Feb; 35(3):517-28.
15. McNeill K, Hamilton IR. Effect of acid stress on the physiology of biofilm cells of
Streptococcus mutans. Microbiology. 2004 Mar; 150(Pt 3): 735-42.
16. Dunning DW, McCall LW, Powell WF Jr. Arscott WT, McConocha EM, McClurg
Cd, Goodman SD, Sptafora GA. SIoR modulation of the Streptococcus mutans acid
73
tolerance response involoves the GcrR response regulator as an essential
intermediary. Microbiology. 2008 Apr; 154(Pt 4):1132-43.
17. Marion c, Aten Ae, Woodiga SA, King SJ. Identification of an ATPase, MsmK,
which energizes multiple carbohydrate ABC transporters in Streptococcus
pneumonia. Infect Immun. 2011 Oct; 79(10):4193-200.
18. Pe′rez-Sayans M, Somoza-Martin JM, Barros-Anqueira F, Diz PG, Rey JM, Garcia-
Garcia A. Multidrug resistance in oral squamous cell carcinoma: The role of vacuolar
ATPases. Cancer Lett. 2010 Sep 28; 295(2):153-43.
19. Pedersen PL. Transport ATPases into the year 2008: a brief overview related to
types, structures, functions and roles in health and disease. J Bioenerg Biomembr.
2007 Des; 39(5-6):349-55.
20. Takahashi N, Yamada T. Acid-induced acid tolerance and acidogenicity of non-
mutans streptococci. Oral Microbiol Immunol. 1999 Feb; 14(1):43-8.
21. Bidossi A, Mulas L, Decorosi F, Colomba L, Ricci S, Pozzi G, Deutscher J, Viti C,
Oqqioni MR. a functional genomics approach to establish the complement of
carbohydrate transporters in Streptococcus pneumonia. PloS One. 2012; 7(3):e33320.
22. Ponte-Sucre A. Availability and application of ATP-binding cassette (ABC)
transporter blockers. Appl Microbiol Biotechnol. 2007 Aug; 76(2):279-86.
23. Cuthbertson L, Kos V, Whitfield C. ABC transporters involved in export of cell
surface glycoconjugates. Microbiol Mol Biol Rev. 2010 Sep; 74(3):341-62.
24. Postma PW, Lengler JW, Jacobson GR. Phosphoenolpyruvate carbohydrate
phosphotransferase systems. In: Escherichia coli and Salmonella: cellular and
74
molecular biology. Neidhardt FC, Curtiss R III, Ingraham JL, Lin ECC, Low KB,
Magasanik B, et al., editors. Washington, DC: ASM Press, 1996:1149-1174.
25. Ellen S.Liberman and A S Bleiweis. Transport of glucose and mannose by a
common phosphoenolpyrovate-dependent phosphotransfrase system in Streptococcus
mutans GS5. Infect Immun, Mar. 1984, p.1106-1109.
26. Chimalapati S, Cohen JM, Camberlein E, MacDonald N, Durmort C, Vernet T,
Hermans PW, Mitchell T, Brown JS. Effects of deletion of the Streptococcus
pneumonia lipoprotein diacylglyceryl transferase gene Igt on ABC transporter
function and on growth in vivo. PloS One. 2012;7(7): e41393.
27. Ouskova G, Spellerberg B, Prehm P. Hyaluronan release from Streptococcus
pyogenes: export by an ABC transporter. Glycobiology. 2004 Oct; 14(10):931-8.
28. Barranqou R, Altermann E, Hutkins R, Cano R, Klaenhammer TR. Functional and
comparative genomic analyses of an operon involved in fructooligosaccharide
utilization by Lactobacillus acidophilus. Proc Natl Acad Sci U S A. 2003 Jul22;
100(15): 8957-62.
29. Lin Tao, Iain C Sutcliffe, R B Russell, and J J Ferretti. Cloning and expression of
the multiple sugar metabolism (msm) operons of Streptococcus mutans in
Heterologous Streptococcal hosts. Infect Immun Mar. 1993, p.1121-1125.
30. Lemos JA, Abranches J, Burne RA. Responses of cariogenic streptococci to
environmental stresses. Curr Issues Mol Biol. 2005 Jan; 7(1):95-107.
31. Ajdic D, Pham VT. Global Transcriptional analysis of Streptococcus mutans sugar
transporters using microarrays. J. Bacteriol. 2007 Jul; 189(14):5049-59.
75
32. Webb AJ, Hosie AH. A member of the second carbohydrate uptake subfamily of
ATP-binding cassette transporters is responsible for ribonucleoside uptake in
Streptococcus mutans. J Bacteriol. 2006 Des; 188(23):8005-12.
33. Garmory HS, Titball RW. ATP-binding cassette transporters are targets for the
development of antibacterial vaccines and therapies. Infect Immun. 2004 Dec;
72(12):6757-63.
34. Bertram R, Schlicht M, Mahr K, Nothaft H, Saier MH Jr, Titgemeyer F. In silico
and transcriptional analysis of carbohydrate uptake systems of Streptomyces
coelicolor A3 (2). J Bacteriol. 2004 Mar; 186(5):1362-73.
35. Webb AJ, Homer KA, Hosie AH. Two closely related ABC transporters in
Streptococcus mutans are involved in disaccharide and/or oligosaccharide uptake. J
Bacteriol. 2008 Jan; 190(1):168-78.
36. Lorca GL, Barabote RD, ZIolpolski V, Tran C, Winnen B, Hvorup RN, Stonestrom
AJ, Nguyen E, Huang LW, Kim DS, Saier MH JR. Transport capabilities of eleven
gram-positive bacteria: comparative genomic analysis. Biochim Biophys Acta. 2007
Jun; 1768(6):1342-66.
37. Nascimento MM, Lemos JA, Abranches J, Goncalves RB, Burne RA. Adaptive acid
tolerance response of Streptococcus sobrinus. J Bacteriol. 2004 Oct; 186(19):6383-
90.
38. Kitten T, Munro CL, Michalek SM, Macrina FL. Genetics characterization of a
Streptococcus mutans Lral family operon and role in virulence. Infect Immun. 2000
Aug; 68(8):4441-51.
76
39. Nakajo K, Takahashi N, Beighton D. Resistance to acidic enviroments of caries-
associated bacteria: Bifidobacterium dentium and Bifidobacterium longum. Caries
Res. 2010; 44(5):431-7.
40. Simark-Mattsson C, Jonsson R, Emilson CG, and Roos K. Final pH affects the
interference capacity of naturally occurring oral Lactobacillus strains against mutans
streptococci. Arch Oral Biol. 2009 Jun; 54(6):602-7.
41. Higgins CF. ABC transporters: from microorganisms to man. Annu Rev Cell Biol.
1992; 8:67-113.
42. Khandavilli S, Homer KA, Yuste J, Basavanna S, Mitchell T, Brown JS. Maturation
of Streptococcus pneumonia lipoproteins by a type II signal peptidase is required for
ABC transporter function and full virulence. Mol Microbiol. 2008 Feb; 67(3):541-57.
43. Ian R Booth. Regulation of cytoplasmic pH in bacteria. Microbiology Review, Dec.
1985, p.359-378.
44. Porcelli AM, Scotlandi K, Strammiello R, Gislimberti G, Baldini N, Rugolo M.
Intracellular pH regulation in U-2 OS human osteosarcoma cells transfected with P-
glycoprotein. Biochim Biophys Acta. 2002 Jan 30; 1542(1-3):125-38.
45. Braun FJ, Hegemann P. Direct measurement of cytosolic calcium and pH in living
Chlamydomonas reinhardtii cells. Eur J Cell Biol. 1999 Mar; 78(3):199-208.
46. Iwami Y, Kawarada K, Kojima I, Miyasawa H, Kakuta H, Mayanagi H, Takahashi
N. Intracellular and extracellular pHs of Streptococcus mutans after addition of acids
: loading and efflux of a fluorescent pH indicator in Streptococcal cells. Oral
Microbiol Immunol. 2002 Aug; 17(4):239-44.
77
47. Olsen KN, Budde BB, Siegumfeldt H, Rechinger KB, Jakobsen M, Ingmer H.
Noninvasive measurement of bacterial intracellular pH on a single-cell level with
green fluorescent protein and fluorescence ratio imaging microscopy. Appl Environ
Microbiol. 2002 Aug; 68(8):4145-7.
48. Futsaether CM, Kjeldstad B, Johnsson A. Measurement of the intracellular pH of
Propionibacterium acnes: comparison between the fluorescent probe BCECF and 3IP-
NMR spectroscopy. Can J Microbiol 1993:39(2):180-186.
49. Boyarsky G, Hanssen C, Clyne LA. Superiority of in vitro over in vivo calibration
of BCECF in vascular smooth muscle cells. FASEB J. 1996 Aug; 10(10):1205-12.
50. Ozkan P, Mutharasan R. A rapid method for measuring intracellular pH using
BCECF-AM. Biochim Biophys Act. 2002 Aug 15; 1572(1):143-8.
51. Grant RL, Acosta D. Ratiometric measurement of intracellular pH of cultured cells
with BCECF in a fluorescence multi-well plate reader. In Vitro Cell Dev Biol Anim.
1997 Apr; 33(4):256-60.
52. Patel J. R. (2010). Environmental responses of two-component system in
Streptococcus sanguinis. Master thesis. Virginia Commonwealth University. USA.
53. Asopa S, Patel A, Khan OA, Sharma R, Ohri SK. Non-bacterial thrombotic
endocarditis. Eur J Cardiothorac Surg 2007; 32(5):696-701.
54. Turner LS, Das S, Kanamoto T, Munro CL, Kitten T. Development of genetic tools
for in vivo virulence analysis of Streptococcus sanguinis. Microbiology 2009; 155(Pt
8):2573-2582.
55. Takahashi N, Nyvad B. The role of bacteria in the caries process: ecological
perspectives. J Den Res. 2011 Mar; 90(3):294-303.
78
56. Kolenbrander PE. Oral microbial communities: biofilms, interactions, and genetics
systems. Annu Rev Microbiol. 2000 54:413-37.
57. Quivey RG, Kuhnert WL, Hahn K. Genetics of acid adaptation in oral streptococci.
Crit Rev Oral Biol Med. 2001; 12(4):301-14.
58. Svensӓ ter G, Larsson UB, Greif EC, Cvitkovitch DG, Hamilton IR. Acid tolerance
response and survival by oral bacteria. Oral Microbiol Immunol. 1997 Oct;
12(5):266-73.
59. Curran TM, Lieou J, Marquis RE. Arginine deiminase system and acid adaptation of
oral streptococci. Appl Environ Microbiol. 1995 Dec; 61(12):4494-6.
60. Welin-Neilands J, Svensӓ ter G. Acid tolerance of biofilm cells of Streptococcus
mutans. Appl Environ Microbiol. 2007 73:5633-8.
61. McGowan CC, Cover TL, Blaser MJ. Analysis of F1F0-ATPase from Helicobacter
pylori. Infect Immun. 1997 65:2640-7.
62. Foster JW, Hall HK. Adaptive acidification tolerance response of Salmonella
typhimurium. J Bacteriol. 1990 Feb; 172(2):771-8.
63. Stock AM, Robinson VL, Goudreau PN. Two-component signal transduction. Annu
Rev Biochem. 2000; 69:183-215.
64. Zhang M, Han X, Liu H, Tian M, Ding C, Song J, Sun X, Liu Z, Yu S. Inactivation
of the ABC transporter ATPase gene in Brucella abortus strain 2308 attenuated the
virulence of the bacteria. Vet Microbiol. 2013 Feb 28. Pii: S0378-1135(13)00131-4.
65. De Vos WM. Gene expression systems for lactic acid bacteria. Curr Opin Microbiol
1999 2:289-295.
79
66. Kjeldstad B, Johnsson A. A 31P-NMR study of Propionibacterium acnes, including
effects caused by near- ultraviolet irradiation. Biochim Biophys Acta. 1987 Feb 18;
927(2):184-9.
67. Breeuwer P, Drocourt J, Rombouts FM, Abee T. A novel method for continuous
determination of the intracellular pH in bacteria with the internally conjugated.
68. Nakajo k, Komori R, Ishikawa S, Ueno T, Suzuki Y, Iwami Y, Takahashi N.
Resistance to acidic and alkaline environments in the endodontic pathogen
Enterococcus faecalis. Oral Microbiol Immunol. 2006 Oct; 21(5):283-8.
69. Kobayashi H. A proton-translocating ATPase regulates pH of the bacterial
cytoplasm. J Biol Chem 1985:260:72-76.
70. B Terleck YJ, NP Willett, and GD Shockman. Growth of several cariogenic
strains of oral streptococci in a chemically defined medium. Infect Immun, Apr
1975, p.649-655.