systematic discovery and characterization of fly micrornas using
TRANSCRIPT

Systematic discovery and characterization of fly microRNAs using 12 Drosophila genomes.
Alexander Stark*+1,2, Pouya Kheradpour*2, Leopold Parts1,4, Julius Brennecke3, Emily Hodges3,
Gregory J. Hannon3 and Manolis Kellis+1,2
1. Broad Institute of MIT and Harvard, Cambridge, MA 02141, USA 2. Computer Science and Artificial Intelligence Laboratory, Massachusetts Institute of Technology, Cambridge, MA 02139, USA. 3. Cold Spring Harbor Laboratory, Watson School of Biological Sciences and Howard Hughes Medical Institute, 1 Bungtown Road,
Cold Spring Harbor, NY 11724, USA 4. present address: Institute of Computer Science, University of Tartu, Estonia and Wellcome Trust Sanger Institute, Wellcome Trust
Genome Campus, Hinxton, Cambridge, CB10 1SA, UK
Running Title:
microRNA characterization in 12 Drosophila genomes
* shared first authors
+ corresponding authors:
Manolis Kellis 32 Vassar Street, 32G-564 Cambridge, MA 02139 Phone: 617-253-2419 Fax: 617-253-7512 [email protected]
Alexander Stark 32 Vassar Street, 32G-536 Cambridge, MA 02139 Phone: 617-253-3434 Fax: 617-253-7512 [email protected]
Keywords:
microRNAs, comparative genomics, miRNA star, microRNA targets, Drosophila

microRNA characterization in 12 Drosophila genomes
2
Abstract MicroRNAs (miRNAs) are short regulatory RNAs that inhibit target genes by complementary binding in
3’untranslated regions (3’UTRs). They are one of the most abundant classes of regulators, targeting a large fraction of all
genes, making their comprehensive study a requirement for understanding regulation and development.
Here we use 12 Drosophila genomes to define structural and evolutionary signatures of miRNA hairpins, which we
use for their de novo discovery. We predict more than 41 novel miRNAs, which encompass many unique families, and 28
of which we validate experimentally. We also define precise signals for the start position of mature miRNAs, which we use
to correct the annotation of previously known miRNAs, often leading to drastic changes in their target spectrum. We show
that miRNA discovery power scales with the number and divergence of species compared, suggesting that such
approaches can be successful in human as dozens of mammalian genomes become available.
Interestingly, for some miRNAs sense and anti-sense hairpins score highly and mature miRNAs from both strands
can indeed be found in vivo. Similarly, we find that multiple starts are indeed processed in the absence of precise signals
for the miRNA start, which strongly correlate with few target sites for these miRNAs. Lastly, we show that several miRNA
star sequences score highly and are likely functional. For miR-10 in particular, both arms show abundant processing, and
both show highly conserved target sites in Hox genes, suggesting a possible cooperation of the two arms, and their role
as a master Hox regulator.
Availability All data and predictions are available at http://compbio.mit.edu/fly/mirnas/.
microRNA characterization in 12 Drosophila genomes
3
Introduction Regulation of gene expression in response to developmental and environmental stimuli is central to animal
development. In addition to regulation at the transcriptional level, it is increasingly recognized that an important fraction of
regulation occurs post-transcriptionally, and to a large extent by microRNAs (miRNAs) (Alvarez-Garcia and Miska 2005;
Ambros 2004; Bartel 2004; Chen and Rajewsky 2007; Lai 2003; Plasterk 2006). These are short RNA genes that direct
the inhibition of target messenger-RNA expression via complementary binding sites in the 3’ untranslated region (3’UTR)
(reviewed in (Valencia-Sanchez et al. 2006; Zamore and Haley 2005)). miRNAs play an integral part of animal gene
regulatory networks. First, they are one of the most abundant classes of regulators, currently estimated to comprise 1%–
5% of animal genes (Bartel 2004; Bentwich et al. 2005; Berezikov et al. 2005). Second, they target a large fraction of all
genes, a typical miRNA regulating hundreds of target genes (Brennecke et al. 2005; Chan et al. 2005; Grun et al. 2005;
Krek et al. 2005; Xie et al. 2005). Third, as many genes contain target sites for several miRNAs, combinatorial control
similar to that known for transcription factors is likely to increase miRNA regulatory versatility (Hobert 2004). Finally,
several miRNAs are deeply conserved in the animal kingdom (e.g. let-7 (Pasquinelli et al. 2000)), suggesting an ancient
role similar to some transcription factors in the core of developmental regulatory kernels (Davidson and Erwin 2006).
Thus, a comprehensive understanding of all miRNAs and their targets in an animal genome presents a necessary
milestone in our understanding of gene regulation in animal genomes. This is especially true, as knowledge of the miRNA
sequence alone can allow the identification of the physiologically relevant target genes (e.g. miR-iab-4 (Ronshaugen et al.
2005; Stark et al. 2003), bantam (Brennecke et al. 2003), mir-9a (Li et al. 2006)). Although the first miRNA-target pair was
identified genetically more than a decade ago (Lee et al. 1993; Wightman et al. 1993), most miRNAs have since been
discovered by small RNA cloning, starting in 2001 (Lagos-Quintana et al. 2001; Lau et al. 2001; Lee and Ambros 2001).
Recent advances in massive parallel sequencing technologies have greatly increased the sensitivity of such approaches,
leading to the discovery of many novel miRNAs and suggesting that miRNA discovery in well-studied organisms is
reaching saturation (Berezikov et al. 2006b; Ruby et al. 2006). Nevertheless, miRNAs that are expressed in low levels,
only in a few cells, or under highly specific conditions remain difficult to detect experimentally (e.g. lsy-6 in C.elegans;
(Johnston and Hobert 2003; Ruby et al. 2006)). Ideally, computational approaches should be able to complement these
studies, and discover miRNAs directly from their sequence features in complete genomes. In contrast to experimental
approaches, which are inherently limited by the developmental stages and tissues surveyed, computational studies should
provide a global view of miRNAs regardless of their expression. Several structural features of miRNA hairpins have been
defined, and used to predict novel miRNA genes (reviewed in (Berezikov et al. 2006a)). However, in the absence of
sufficiently specific miRNA hairpin-characteristics (Ng Kwang Loong and Mishra 2007; Ritchie et al. 2007), these are
insufficient to recognize the small number of true miRNA genes amidst the enormous number of non-biological miRNA-like
hairpins in large animal genomes (see below and (Berezikov et al. 2006a)).
Comparative genomics provides an opportunity to discover functional miRNAs systematically, making use of their
conservation across multiple species. Comparative approaches have been applied to discover a wide range of functional
elements, including protein-coding genes, RNA genes, various classes of regulatory elements or motifs (e.g. reviewed in
(Miller et al. 2004)), and have also been used for the prediction of miRNA target genes (reviewed in (Lai 2004; Rajewsky

microRNA characterization in 12 Drosophila genomes
4
2006)). For miRNA identification, comparative approaches using a small number of species have led to the discovery
novel miRNAs in flies, worms and mammals (reviewed in (Berezikov et al. 2006a)). It is still unclear however, whether a
purely de-novo approach can be used to identify novel miRNAs with high specificity, and define their precise boundaries.
It is also unclear how discovery power scales with the number of sequenced species, and whether comparative genomics
can lead to functional insights on miRNA function beyond their discovery. The recent availability of 12 fully sequenced
Drosophila genomes spanning over 40 million years of evolution (Consortium 2007a; Consortium 2007b), provides a
unique opportunity to address these questions, providing a rich comparative genomics dataset, at a range of evolutionary
distances.
Drosophila melanogaster presents perhaps the most important model organism for understanding the basic
principles and molecular mechanisms of animal development. Similarly, Drosophila genetics has played an important role
in understanding the functional roles of animal miRNAs. Several miRNA loci were first discovered in the 90s by means of
gain-of-functions screens, and only later recognized to be miRNAs (e.g. miR-7 (Li and Carthew 2005), bantam (Brennecke
et al. 2003), miR-278 (Teleman and Cohen 2006)). Gain-of-function alleles also led to the discovery of regulatory motifs in
the 3’UTRs of several genes that were later identified as miRNA target sites (Lai 2002; Lai et al. 1998; Lai and Posakony
1997). The sequencing of Drosophila pseudoobscura (Richards et al. 2005) enabled the first comparative genomics
approaches in Drosophila, which proved successful in the identification of novel miRNAs (Lai et al. 2003), the prediction of
miRNA target genes (Enright et al. 2003; Grun et al. 2005; Stark et al. 2003), the refinement of rules for miRNA-target
recognition (Brennecke et al. 2005) and the description of global patterns of miRNA regulatory networks (Stark et al.
2005). Nevertheless, our picture on Drosophila miRNAs is far from complete. In fact, with 60 cloned miRNAs in the Rfam
miRNA registry (Griffiths-Jones et al. 2006), only half of the conservative upper estimate of 120 loci are known (Aravin et
al. 2003; Lai et al. 2003).
In this paper, we use 12 Drosophila genomes (Consortium 2007a; Consortium 2007b) to undertake a systematic
de novo discovery of miRNA genes and gain insights into miRNA biology. We define distinguishing properties of know
miRNA genes, both structural and evolutionary. We use these properties for the de-novo discovery of miRNA hairpins and
the prediction of the precise start position of mature miRNAs. Our methods predict more than 41 novel miRNAs, of which
28 are validated experimentally, and 19 more extend known miRNA families or cluster with known miRNAs. In 9 cases,
our prediction and validation correct the current Rfam annotation of the mature miRNAs by shifts of one or more bases,
leading to drastic differences in the set of predicted target genes. The novel predicted miRNAs lead to 37 novel miRNA
families with unique 5’ seed sequences, doubling the number of miRNA families, and thus the diversity of miRNA targeting
in Drosophila. Our results also lead to several new insights into miRNA biology. We find that in some cases, both sense
and anti-sense sequences have miRNA-like characteristics and can be processed into mature miRNAs. We also show
that a single hairpin can give rise to multiple mature miRNAs, whose abundance correlates with the strength of our
computational signals. We also show that miRNA star sequences can be functional. For example, for miR-10, a miRNA in
the Hox cluster, both miR-10 and miR-10* appear functional, with highly conserved target sites in multiple Hox genes. In
fact, miR-10* shows stronger evolutionary signals and is more abundant, suggesting it may be the primary product. Lastly,
we show that the newly discovered miRNAs target an overall similar gene set to known miRNAs, albeit in different
microRNA characterization in 12 Drosophila genomes
5
combinations stemming from distinct seeds. This implies a much denser miRNA regulatory network than previously
thought, with increased potential for combinatorial control.
Results
Structural and evolutionary properties of known miRNA hairpins
We studied the structural and evolutionary properties of the known Drosophila miRNAs to derive discriminating
features, which distinguish them from non-functional miRNA-like hairpins that occur frequently throughout the genome
(Figure 1). We compared the cloned miRNAs in Rfam release 9.0 (Griffiths-Jones et al. 2006) with hairpins in randomly
chosen genomic sequences, and with a subset of the random hairpins, selected to resemble known miRNAs in their
length and pairing characteristics (see methods).
We found several distinct structural characteristics of miRNA hairpins (Figure 1A,B). First, the length of miRNA
hairpins is much more precisely defined than that of random hairpins: 90% of all miRNA hairpins are between 73 and 102
nucleotides long, whereas 90% of random hairpins have lengths between 47 and 117 (2.4x larger range). Second, the
lengths of the arms and the hairpin loop are more restricted for miRNAs and show a clear trend to longer arms and shorter
loops on average: 90% of all miRNAs have arms lengths between 31 and 47 and loops between 4 and 26 nucleotides,
while random hairpins are much less defined. Thirdly, miRNA precursor sequences fold into significantly more stable
secondary structures than random hairpins, between 3 to 6 standard-deviations above what is expected given their
lengths and sequence composition. Fourth, miRNA hairpins have more symmetric loops but fewer asymmetric or bulged
loops than random hairpins of similar length. Such loop structures in the arms may direct hairpin cleavage, facilitate
asymmetric strand separation, or allow for efficient loading of mature miRNAs into effector complexes, processes which
are not yet fully understood (Han et al. 2006; Khvorova et al. 2003; Schwarz et al. 2003; Seitz and Zamore 2006).
We next assessed the evolutionary constraints of miRNAs in 12 Drosophila genomes (Consortium 2007a). We
aligned each of the 60 cloned miRNAs and their flanking regions across all 12 species (we determined the corresponding
sequence in each of the 12 genomes by Blast, as existing whole-genome alignments were not found to be reliable). These
alignments show a characteristic conservation profile, which closely follows the hairpin structure (Figure 1C), as previously
reported in flies and mammals (Berezikov et al. 2005; Lai et al. 2003). The loop and the flanking regions show abundant
mutations, insertions and deletions, while the arms are very highly conserved. In particular, while compensatory mutations
are frequently observed in other RNA genes, they are not found in miRNA hairpins, especially within the mature miRNA. In
fact, for all but 8 cloned miRNAs, the mature sequence shows a 100% conservation in all species where the
corresponding hairpin sequence can be found (Supplemental Table 1). For 4 of these 8 (miR-277, -2b-1, -305, -309), the
only sequence difference is found in the closely related Drosophila simulans or persimilis, which have been sequenced at
lower coverage, suggesting the differences may represent sequencing errors rather then evolutionary divergence. Perfect
conservation of the entire mature miRNAs might reflect additional functional constraints on the arm sequences beyond
simply stabilizing an RNA secondary structure (e.g. compensatory pairing of the miRNA 3’end (Brennecke et al. 2005)),

microRNA characterization in 12 Drosophila genomes
6
and has been found to extend across species as distant as worms and vertebrates in some cases (e.g. let-7 (Pasquinelli
et al. 2000)). In contrast, the high sequence divergence of the loop suggests that it may simply be a linker with no
additional functions.
Taken together, these structural and evolutionary features set real miRNA hairpins apart from random miRNA-like
hairpins. We next use combinations of these features for the genome-wide identification of Drosophila miRNAs.
Distinguishing Drosophila miRNA hairpins from random genomic hairpins
Discovering novel miRNA genes computationally is an enormous challenge: cloned miRNAs represent only 60 of
760,355 hairpins in the fly genome with miRNA-like properties (total length between ~60 and 120 nucleotides, arm length
>20 nucleotides, with at least 70% paired bases). Therefore, in addition to selecting for miRNA-like hairpins, several
additional features must be defined in order to achieve the needed discriminatory power of >99.99% specificity. For
example, a 0.5% false positive rate would result in 3,500 spurious predictions.
We tested how well each of the structural and evolutionary properties above discriminates between the known
miRNA hairpins and all miRNA-like hairpins in the genome (Figure 1E). For example, scoring the miRNA conservation
profile (Figure 1C) alone shows greater than 300-fold discrimination between miRNAs (70% pass) and other hairpins (only
0.2% pass) across 12 genomes. Our conservation profile score is related to the metric of arm vs. loop conservation ratio,
used for miRNA prediction in 2 Drosophila genomes (Lai et al. 2003), albeit much more precise – for comparison, the
previous metric shows an enrichment of only 19-fold across 12 genomes.
Amongst structural features, the free energy score of the hairpin, corrected for hairpin length and sequence
composition, is most discriminative with a 39-fold discrimination. The folding energy of the consensus sequence, which
measures structural conservation (Washietl et al. 2005), shows a 6-fold enrichment, followed by the overall loop-symmetry
(3 fold) and the extent of base-pairing in the hairpin arms (2.3 fold). Remaining features such as the length of the entire
hairpin, the arms, or the loop show only moderate contribution (<2 fold). We conclude that after selection for hairpin length
and stem pairing, the remaining contribution of structural features is only moderate.
Although several individual properties provide a significant discrimination, the specificity of even the best of them
is not sufficient to reliably predict miRNAs. Given the large number of genomic hairpins, many would be selected that
score well for that property but lack other miRNA characteristics and are likely false. For example, most of the 1,625
miRNA hairpins selected by the conservation profile above (99.8% rejection rate for random hairpins) are likely false: 40%
alone fall into exons or repeats or have accumulated mutations in their mature sequence. Therefore, several features
need to be combined to reach a sufficient discrimination power. To identify optimal combinations and weightings of these
features, we used a machine learning approach, using tallied votes of 500 independently constructed decision trees (see
Methods; (Breiman 2001)). The combined approach achieves more than 4,500-fold discrimination after cross-validation,
recovering 85% of known miRNAs in less than 0.02% of genomic hairpins.

microRNA characterization in 12 Drosophila genomes
7
Recovering known miRNA genes
To discover Drosophila miRNAs in the genome, we ranked all 760,355 miRNA-like hairpins in the entire genome
according to this combined score. The top ranking hairpins are strongly enriched in cloned Rfam miRNAs, whose
discovery rate plateaus at a score of 0.95 (Figure 2B). At this cutoff, our method results in 101 hairpins in the fly genome,
including 51 of the 60 cloned miRNAs (85%) and novel miRNA candidates with structural and conservation scores similar
to, and sometimes higher than, known miRNAs (Figure 2, Table 1). Upon inspection, of the remaining 9 cloned miRNAs
which are not recovered, miR-9b ranks only slightly below the cutoff (0.938; rank 111), miR-278 ranks 278th with
significantly lower conservation and structural scores, 4 appear conserved only in very close species (miR-303, -309, -
311, -312), and 2 contain very long insertions or deletions in at least one species (miR-6-2 and miR-31b); finally, miR-314
shows a notable D. melanogaster-specific sequence difference, substituting a highly-conserved U with a C (Supplemental
Figure S1).
Our top predictions also contain 9 of the 18 previously predicted but not yet cloned Rfam miRNAs (Lai et al.
2003). Of the 9 Rfam miRNAs which we do not recover, 2 are poorly conserved and found only in close species (miR-
310, -313), 2 have a highly conserved hairpin loop, which is very unusual for miRNAs (miR-100 and -125), and 1 has an
unusually large hairpin loop (miR-2c). The remaining 4 appear to be spurious (miR-280, -287, -288, -289) and, in contrast
to all other Rfam miRNAs (see below), none of them could be verified in a large scale sequencing effort for Drosophila
miRNAs (Ruby et al. 2007).
Strong support for our method and score cutoff stems from the genomic positions of the candidate hairpins, a
feature not used for scoring. We plotted the fraction of all hairpins residing in exons, introns, repeats and intergenic
regions as a function of the hairpin score (Figure 2C). Strikingly, while the occurrence of miRNA-like hairpins in the
genome is indistinguishable from a random distribution according to the overall region lengths, the top scoring hairpins lie
almost exclusively in introns and intergenic regions. Indeed, all known miRNA genes in animals lie in introns of protein
coding genes or as separate, intergenic transcription units. For scores below 0.95, the fraction of exonic and repeat
derived hairpins increases, and for scores below 0.80, it becomes indistinguishable from random, suggesting that any
remaining miRNAs in this score range represent only an extreme minority amidst mostly spurious candidates. We
conclude, that our approach successfully discriminates real miRNA hairpins from abundant spurious hairpins based on
patterns of evolutionary conservation and structural features.
Experimental validation of hairpin predictions
The top 101 hairpins include 41 novel miRNA candidates, for which several measures suggest that they represent
functional, novel miRNA genes, nearly doubling the number of miRNA genes in the fly. To experimentally validate our
predictions, we obtained 763,111 Solexa sequencing reads corresponding to 1524 distinct sequences from Drosophila
ovaries and testes that match our predictions (see Methods and Supplemental Data). We required multiple independent
reads of the mature miRNA and manually inspected the reads for miRNA-like processing, providing a very stringent
validation, essentially free of false positives (Ruby et al. 2006). 69 of our 101 predictions with scores ≥ 0.95 were
supported by 10 or more reads each, including 17 of the 41 novel predictions. In addition, when we required ≥ 3 reads per
microRNA characterization in 12 Drosophila genomes
8
hairpin position, our data supported 19 novel and 73 hairpins in total. In contrast, none of 500 random hairpins with scores
< 0.1 were supported by 3 or more reads. Indeed, only 2 matched to spurious reads that were each cloned only once. As
additional predicted miRNAs might be valid yet not expressed in ovaries or testes, we also intersected our predictions with
curated reads from 454 sequencing of small RNA libraries from several developmental stages and tissues (Table 1;
Figure 2A,B; intersection kindly performed by Graham Ruby, Eric Lai and David Bartel (Ruby et al. 2007)). In total, we
validate 84 of our 101 predictions (83%) with scores ≥ 0.95, including 24 of the 41 novel predictions (59%). At a less
stringent cutoff of 0.90, an additional 49 novel miRNA candidates are predicted, of which a total of 4 are validated (Figure
2b). This increases the number of cloned Drosophila miRNAs by 28 (47%) and suggests that our top predictions include
the vast majority of conserved miRNAs.
Additional evidence supports novel miRNAs are functional
We next evaluated the 61 candidate miRNAs, that did not intersect with sufficient sequencing reads (17 with
scores above 0.95 and an additional 44 with scores above 0.90; Table 1). We evaluated these using additional properties
of known miRNA genes, which were not used as features during the prediction of these hairpins. We found that indeed,
numerous candidates show several striking properties. For example, 17 of the 61 miRNAs are family members of known
Drosophila miRNA families, 4 have orthologs in mosquito, 6 in worm, and 5 in human. An additional 5 candidates do not
belong to known families but have predicted 5’ends (see below) with 7mers that scored equally high or higher than most
miRNAs (MCS ≥ 40; see below). We found that 3 of the 61 hairpins are clustered in the genome, a property of many
known miRNAs. Overall, 19 of the 61 hairpins are found in introns, common among miRNAs and suggestive of
transcription. Indeed, 5 of these and an additional 3 intergenic hairpins are expressed during embryogenesis, as revealed
a recent genome-wide expression study using tiling arrays (Manak et al. 2006). Even though this is not significantly more
than expected given the overall high prevalence of transcription (~1/6 intergenic probes), it demonstrates the presence of
hairpin transcripts necessary for miRNA processing.
We conclude that several of these candidate miRNAs may be functional. These are likely to be of low-abundance
(similar to worm lsy-6; (Johnston and Hobert 2003; Ruby et al. 2006)), or expressed in tissues or under conditions that
were not surveyed. We did not experimentally validate hairpin candidates with scores below 0.9, but several metrics
suggest they no longer include meaningful miRNAs at a reasonable rate. Amidst 386 hairpins scoring between 0.8 and
0.9, a considerable fraction (25%) falls within protein-coding exons, UTRs, and repeat elements, which are unlikely to
contain functional miRNA genes. Below 0.8, the fraction of annotated exons and repeat elements is indistinguishable
from random (Figure 2c). We conclude that few conserved miRNAs are missed by our analysis.
Overall, our analysis resulted in 28 novel miRNA genes with strong evolutionary conservation and experimental
support, and additional candidates. Given the recovery rate of 85% of cloned miRNAs, we estimate a total of
approximately 120 conserved miRNAs, which is similar to previous estimates based on comparative information (Lai et al.
2003), and the number of known miRNAs in worm (Ruby et al. 2006). Note however, that the observation that less deeply
conserved miRNAs are expressed at lower levels (see below and (Ruby et al. 2006)), does not allow an accurate
estimation of the number of non-conserved miRNAs.

microRNA characterization in 12 Drosophila genomes
9
High accuracy stems from feature set and number of species
Overall, our method recovers 85% of known miRNAs and at least 83% of all predictions are correct. This is
significantly higher than previous miRNA discovery efforts (Berezikov et al. 2006a), although these numbers are not
directly comparable across different species. This high accuracy stems from the features we define, the increased number
of species in our comparison, and the increased evolutionary distances they span.
To study the effect of evolutionary distance on our performance, we applied our methods to different subsets of
species and assessed the number of true miRNAs that were found among the top 100 predictions (Figure S3). For
pairwise comparisons, the discovery rate increases approximately linearly with the evolutionary distance of the two
species: close species in the melanogaster sub-group (D. simulans, sechelia, yakuba, and erecta) allow the discovery of
up to 49 valid miRNAs, those in the D. sophophora clade (D. persimilis, pseudoobscura, and willistonii) up to 73 and the
most remote species (D. mojavensis, virilis, and grimshawii) up to 76 among the top 100 predictions. For multi-species
comparisons, inclusion of all species at the same evolutionary distance cutoffs led to 49, 78, and 84 recovered miRNAs,
respectively (Figure S3).
To study the effect of our feature set and methodology, we compared the number of recovered miRNAs to those
predicted by (Lai et al. 2003), by using D. pseudoobscura as our only informant species. Lai and colleagues reported 208
predicted miRNAs, including 60 Rfam miRNAs, and 13 novel miRNAs reported by (Ruby et al. 2007). By comparison,
using the same rank cutoff, we recover a similar number of previously known miRNAs (n=61), but nearly twice as many
newly cloned ones (n=23). The difference is likely due to the new features we define, the new methods for combining
them, and also the new Rfam miRNAs available for training.
Finally, we asked whether clade-specific miRNAs could be discovered in clade-specific searches, evaluated using
a set of 28 miRNAs which are not conserved outside the melanogaster species (i.e. beyond D. ananassae), and a set of
32 miRNAs which are not conserved outside the the sophophora species (i.e. beyond D. willistoni). We tried 21 species
combinations, but we found only one case of a discovered clade-specific miRNA that was not found using all 12 species,
suggesting that clade-specific miRNAs are generally missed by this approach. Two factors contribute to this: first, the
currently sequenced species do not provide insufficient discovery power for clade-specific miRNAs, due to insufficient
genome-sequencing at short branch lengths; second, the conservation properties of clade-specific miRNAs are likely to
differ from the conservation properties of Rfam miRNAs, which are generally much more deeply conserved. Although we
retrained our features for each species combination, we only used Rfam miRNAs as our training set, likely biasing against
clade-specific structural and conservation patterns. It is likely that an improved understanding of the structural
requirements for precursor processing, a larger training set including clade-specific miRNAs, and additional sequencing of
closely related species will enable de novo discovery of additional miRNAs. However, it is currently unclear if structural
properties in the absence of evolutionary signatures can be sufficient to reliably detect truly species-specific miRNAs that
are diverged even between very close species (see (Bentwich et al. 2005) (Zhang et al. 2007) for such miRNAs in
primates).

microRNA characterization in 12 Drosophila genomes
10
In summary, we found that discovery power continued to increase with additional species and additional
evolutionary distance, without reaching saturation. Indeed, using 12 species always performed best, whether we
considered all miRNAs, or the clade specific sets. We thus expect that additional species will lead to continued increase in
discovery power, especially in the ability to discover clade-specific genes. Overall, for conserved miRNA genes, the 12
Drosophila species provided an ideal substrate for miRNA discovery, resulting in a highly accurate catalog of miRNAs.
Genomic clustering of novel miRNA genes and relationship with protein-coding genes
Many of the novel candidates show genomic clustering, a feature frequently observed among animal miRNAs.
Among the 28 validated novel miRNAs, 6 are clustered with known or novel miRNAs (Figure 2D,E). These include three
novel miRNAs within 4kb of miR-318, miR-279, and miR-210, respectively, one novel miRNA 500 nucleotides from miR-11
in the E2F intron, and two novel miRNAs within 1kb of each other in consecutive introns of CG31646. Among the 61 non-
validated candidates with scores above 0.90, three additional hairpins are within 3kb of each other. Given the abundance
of directed knockout experiments in Drosophila, recognizing clustered miRNAs is essential, as neighboring miRNAs will
undoubtedly influence knockout phenotypes, and sometimes may be primarily responsible for them.
We find that 14 of the 28 novel verified miRNAs are within introns of protein-coding genes (Figure 2D, Table 1),
also a common feature of animal miRNAs. For 10 of these, the miRNA is in the same strand as the host gene, suggesting
common transcriptional regulation (Baskerville and Bartel 2005). We particularly point out miR-1000, which lies within the
intron of mushashi (msi), an RNA-binding protein that has been reported to down-regulate proteins translationally (Okabe
et al. 2001). This novel miRNA might be involved in – or responsible for – the previously reported mushashi functions.
Similarly, miR-998 and -995 reside in the introns of the cell-cycle regulators E2F and cdc2c, respectively (Fig 2D), and are
likely involved in the regulation of cell division. Notably, their vertebrate homolog miR-29 has been implicated in cancer
(Pekarsky et al. 2006).
In the remaining 4 cases, intronic miRNAs lie on the opposite strand of annotated genes, suggesting expression
as independent transcription units (Aboobaker et al. 2005). For example, miR-964 and miR-959, both validated, lie on the
opposite strand of CG31646. Indeed, these are supported by reverse-strand cDNAs and ESTs, which are correlated to
each other in expression, but uncorrelated with CG31646.
Finally, two novel miRNAs overlap exons of previously annotated protein coding genes. Novel-60 overlapped the
annotated coding region of CG33311, and validated miR-996 resides in the annotated 5’UTR of CG31044 (Figure 2E). In
both cases, an independent analysis of protein-coding evolutionary constraint had in fact rejected these genes as unlikely
to encode for proteins (Lin et al., in preparation): 12-species alignments for both genes are littered with stop codons,
frame-shifting insertions and deletions, and non-conservative codon substitutions, suggesting they are not under protein-
coding selection. Consequently, the newly discovered miRNA genes provide an explanation for the previously observed
transcripts, which we conclude are not encoding proteins. This finding highlights the importance of systematic high-quality
annotation of both protein-coding and non-protein-coding genes, based on their specific evolutionary constraints. It also
illustrates the power of our unbiased genome-wide prediction of miRNAs that – unlike previous methods did not explicitly
exclude exons from thee regions searched.

microRNA characterization in 12 Drosophila genomes
11
Both strands can be transcribed and processed
Intuitively, one may expect that the reverse complementary sequence of a miRNA hairpin would also fold into an
equivalent hairpin. However, due to GU basepairs that translate into incompatible AC basepairs, and sequence-specific
energy terms, this is generally not the case. In fact, we found large differences between sense and anti-sense hairpins for
most cloned miRNAs: while 51 sense hairpins scored above 0.95, only 21 of the complementary reverse-strand hairpins
reached that score, and only 4 of 51 reverse complements scored more highly than the correct strand (Figure S2). While
the contribution of hairpin conservation is independent of the strand, high scores when considering a wide variety of
structural features including loop lengths, structure, and symmetry suggest that these anti-sense hairpins would constitute
bona-fide miRNAs if transcribed.
Expression data confirmed that both strands of a miRNA gene can be correctly processed into mature miRNAs,
and that they may be independently regulated. In four cases (miR-iab-4, miR-307, miR-124, and miR-305), sequencing
reads were found that corresponded to a correctly processed mature miRNA product for the reverse strand (Ruby et al.
2007), albeit at a much lower level than the forward-strand product. In all four cases, both forward and reverse strand
showed scores above 0.97 based on our evolutionary and structural metrics. For one case in particular (miR-iab-4), both
sense and anti-sense transcripts have been detected by in situ analyses in fly embryos (Bae et al. 2002), indicating robust
transcription of both strands. Interestingly, the two strands of miR-iab-4 are expressed in distinct and mutually exclusive
embryonic segments, suggesting independent regulation of two distinct miRNAs, likely with distinct functions.
We conclude that anti-sense transcription, whether fortuitous or regulated, can lead to functional processing of
anti-sense pre-miRNAs that resemble canonical miRNA hairpins into distinct mature miRNAs. The reverse-strand miRNAs
are likely to have distinct promoters and enhancers, and also a distinct target spectrum, since their 5’ends differ from the
forward strand, leading to increased versatility for miRNA regulation.
Accurate prediction of mature miRNAs
In addition to the discovery of miRNA genes themselves, comparative genomics can help pinpoint the exact
position of cleavage, allowing accurate prediction of the mature miRNA sequence. Knowledge about the precise 5’end is
particularly important because it dictates the core of the target recognition sequence (seed) (Brennecke et al. 2005;
Doench and Sharp 2004; Kiriakidou et al. 2004; Kloosterman et al. 2004; Lai 2002; Lewis et al. 2003; Stark et al. 2003).
As a likely consequence, miRNA 5’ends are under strong selection and exhibit higher processing accuracy than miRNA
star 5’ends or the two respective 3’ends (Ruby et al. 2006). Several distinctive evolutionary and structural features can be
used to identify the precise 5’end of mature miRNAs (Figure 3a). First, almost all mature miRNAs are perfectly conserved
(see above), such that the completely conserved sequence following the miRNA 5’end is much longer than for most other
positions in the hairpin. Second, as observed previously (Lau et al. 2001), more than 78% of Drosophila miRNA genes
start with a 5’Uridine (perhaps reflecting binding affinities of Argonaute proteins or preferred cleavage sites for RNAseIII
enzymes), while the overall frequency of Uridine in miRNA hairpins is only ~30%. Third, at the structural level, we found
that the number of paired bases in a 7 nucleotide window centered at the mature start is highly constrained, requiring at

microRNA characterization in 12 Drosophila genomes
12
least 2-3 paired bases, but typically excluding perfect pairing (100% of miRNAs had at least 2 base-pairs in that window;
95% had 3 or more; but only 25% had perfect pairing). This suggests that miRNA processing cannot occur within large
loops, and also that a certain thermodynamic instability is required between the miRNA 5’ends and the star sequence,
which is likely linked to the asymmetric strand loading of miRNAs into RISC (Khvorova et al. 2003; Schwarz et al. 2003).
In addition to these direct signals, computational prediction of mature miRNAs can use indirect signals, stemming
from the relationship of miRNAs with their target genes (Figure 3a). For example, the 7-mers complementary to miRNA
5’ends (seed matches) are abundant in 3’UTRs and highly preserved throughout evolution (Chan et al. 2005; Lewis et al.
2003; Stark et al. 2003; Xie et al. 2005). In contrast, 7-mers complementary to other parts of mature miRNAs are generally
under no selective constraint. Moreover, these 7-mer seed matches are generally avoided in 3’UTRs of ubiquitously
expressed genes, thus preventing their targeting by miRNAs, while 7-mers starting at other miRNA positions are generally
not avoided (Stark et al. 2005). Because overlapping 7-mers starting at adjacent nucleotide positions share a large
fraction of their occurrences, these conservation and avoidance properties showed a larger characteristic profile, peaking
at the true 5’end, and extending with moderate scores over multiple positions surrounding it. Interestingly the overall
profile was more discriminative than the measures at individual positions (Figure 3a).
Using these direct and indirect features of miRNA 5’ends, we developed a computational framework to predict
mature miRNAs (Figure 3b). We combined each of these properties and adjusted their relative contributions using a
support vector machine trained on a non-redundant set of cloned Drosophila miRNAs using cross-validation (see
methods). We found that the resulting score is much more accurate than either of the scores alone and can pinpoint
precise 5’ends for known and novel miRNA genes: When evaluated based on previously cloned miRNAs (see methods),
we found that our method pinpointed the exact start position in 47/60 cases (78%), and was within 1bp in 51/60 (85%).
Refined annotation of known miRNA genes leads to refined target spectrum
Among the 14 annotated but not previously cloned Rfam miRNAs, our predictions disagreed with the previous 5’
annotation in 9 cases, often by several nucleotides (Figure 3C). Comparison with the sequencing reads revealed that in
fact, for 6 of 9 cases our predictions provided a more accurate view of the 5’end than the previous annotation, pinpointing
their exact position in 4 cases, and falling within one nucleotide for the other 2 (in the 5 cases where our predictions
agreed with the previous annotation, sequencing confirmed 4 were exactly correct, and 1 was shifted by one nucleotide).
The revised 5’end annotation of Rfam miRNAs leads to dramatic changes in the inferred target spectrum,
according to our published method, which combines seed matches, extended pairing information, and evolutionary
conservation (Brennecke et al. 2005; Stark et al. 2005). Strikingly, we found that the overlap in predicted targets between
the old and new annotation is as low as 40% for an adjustment of +1 nucleotide, and it drops sharply to 1-5% target
overlap when the discrepancy increases to +2, +3, or more nucleotides (Figure 3C).
The revised 5’end annotations also suggest that several miRNAs need to be renamed, as they are now dissimilar
in sequence, family membership, and targeting properties from their currently annotated family members. In particular,
miR-2c is no longer a K-box miRNA, and miR-263a no longer matches miR-263b.
microRNA characterization in 12 Drosophila genomes
13
Our results emphasize the importance of high-confidence annotations of miRNA 5’ends to understand the target
spectrum, biological function, and family membership of a miRNA. They also illustrate the power of comparative methods
to reveal such information, solely based on the genome sequence, when experimental data are missing.
Novel miRNAs show fewer conserved targets and lower miRNA expression
Our prediction accuracy for mature miRNA gene boundaries relies on both structural features, and 7-mer based
scores derived from target 3’UTRs. Thus, for miRNAs with few or poorly conserved targets, our accuracy may diminish.
Indeed, for the 28 novel miRNAs, only 43% of our mature 5’end predictions were confirmed and a total of 61% were within
1 nucleotide. These show significantly fewer predicted targets on average than previously known miRNAs (100 vs. 154,
P<10-2, counting 5’dominant and 3’compensatory sites (Brennecke et al. 2005)), and in fact show much lower 7-mer-
based scores of motif conservation (MCS of 15 vs. 36; P<10-5).
We reasoned that these miRNAs may be of overall lower abundance, perhaps explaining why they have been
missed by earlier cloning attempts. In fact, these 28 novel miRNAs showed significantly fewer reads on average than
previously cloned miRNAs (700 vs. 4337; P<10-4). Overall, we found a strong correlation (Pearson coefficient: 0.72)
between the number of reads supporting a mature miRNA, and the genome-wide motif conservation score of the
corresponding 3’UTR motifs (Figure 3e).
This strong correlation suggests that the impact of miRNAs on average target 3’UTRs increases with their
abundance, stemming from either their overall expression levels, or range of expression across tissues or developmental
stages. miRNAs that are expressed at low levels in restricted domains are likely only able to interact with few genes such
that the number of targets but also the number of anti-targets is small. This scenario has for example been proposed as a
likely evolutionary mechanism for the emergence of novel miRNAs and their targets (Chen and Rajewsky 2007).
Novel miRNA families lead to increased potential for combinatorial regulation
To assess the impact of the new miRNA genes on the miRNA regulatory network, we determined targets of all
known and novel miRNAs, applying our previously published algorithm (Brennecke et al. 2005; Stark et al. 2005) and
using the validated 5’end for each miRNA. We find that despite the relatively smaller number of targets, the novel
miRNAs have a significant impact on the overall miRNA regulatory network.
First, they introduce many new miRNA families, as defined by shared 7-mer seeds in positions 2-8 of the mature
miRNA. The novel miRNAs were discovered by their structural and evolutionary signatures, rather than by their
(sequence) similarity to existing miRNAs, and this is reflected in the many unique seed-sequences they introduce. Most
novel validated miRNAs (n=28) have unique 5’ends, an additional 6 form new families, and only 3 extend existing families.
Thus, although the novel miRNAs introduce 50% more miRNA genes (from 61 to 94), they result in an even greater 70%
increase in the number of families (from 43 to 73).
Second, although the novel miRNAs introduce 3300 new target sites, these are heavily biased towards genes
already targeted by miRNAs. On one hand, the new miRNAs target known target categories such as developmental
genes, and exclude anti-target categories such as ribosomal genes (Stark et al. 2005). On the other hand, they show

microRNA characterization in 12 Drosophila genomes
14
great overlap with individual genes already targeted by miRNAs, leading to a denser regulatory network. It is already
known that the existing miRNAs network is dense, with most target genes targeted by multiple miRNAs (Enright et al.
2003; Grun et al. 2005; Krek et al. 2005; Stark et al. 2005). The novel miRNAs reinforce this dense network, leading to
>3000 new sites, but only a small number of novel target genes. Overall, the number of miRNA-targeted genes increases
only by a relatively modest 16%, from 3000 genes (21% of the genome) to 3500 genes (25% of the genome).
This effect is not additive, but it is combinatorial. Since the new miRNA genes introduce many new miRNA
families, they introduce new sets of target genes, which can be differentially regulated in response to developmental and
environmental stimuli; these are distinct from previous sets of targets, and cutting across them. The result is a
significantly higher potential for combinatorial regulation, giving opportunity for the precise regulation of individual subsets
of genes using different combinations of miRNAs, resulting in a much more versatile and precise network of miRNA
regulation.
A single miRNA gene can lead to multiple functional mature products
Our ability to score structural and evolutionary properties of the novel miRNAs, and correlate them with
sequencing reads, led to new insights into miRNA biogenesis and function. Interestingly, when our algorithm did not
predict a precise miRNA 5’end, the sequencing reads also showed several alternate mature products, with different
5’ends (Figure 3D). For example, the predicted alternate 5’end of miR-964, which is shifted by 1 nucleotide, is supported
by more than half of the reads supporting the annotated 5’end (3461 vs. 6393 in ovaries/testes and 29 vs. 57 otherwise).
Overall, when our algorithm predicted the correct 5’end, 90% of reads supported that start; when our algorithm did not
predict the correct start, only 78% of reads supported it (P=6x10⁻³), and a significant number of hairpins were in fact
processed into alternate mature products. Interestingly, more highly expressed miRNAs showed overall more accurate
processing (Pearson correlation 0.39), suggesting that inaccuracies may be tolerated for less abundant miRNAs (or young
miRNAs, which are not yet evolutionarily fixed (Chen and Rajewsky 2007)), while highly expressed miRNAs are under
strong selection for accurate processing. Overall, our results suggest that when the evolutionary signal is mixed, the
signals for processing are also less accurate. It is currently unclear if the alternate forms are regulated and functional, or
arise solely due to processing inaccuracies.
Similarly, in several cases, our algorithm yielded high scores for the miRNA* arm, suggesting these may also
have functional targets. While in most cases, the miRNA* arm showed no significant signal (Figure 3B), we found that for
10 miRNAs, the 5’end of the star sequence scored as highly as some miRNAs. Since our score is based on 7-mer
conservation and avoidance of target sites, these high scores suggest that the miRNA* may be functional. In fact, in 4
cases the miRNA* scored even more highly than the primary arm: two of these star products showed convincing similarity
to known miRNAs (miR-5 and -4, (Lai et al. 2004)), likely to contribute to the high scores. However, 7 of the 10 have
unique 5’ends such that high 7-mer scores cannot be attributed to a known miRNA, suggesting a distinct role of the star
arm in targeting 3’UTRs.
The sequencing reads strongly support these findings. The 10 miRNAs with high-scoring star sequences also
showed abundant reads from the star arm. For example, miR-5* is supported 1142 reads, far exceeding the abundance

microRNA characterization in 12 Drosophila genomes
15
of many miRNAs, and accounting for more than 1/4th of the mature reads obtained in the miR-5 locus (Figure 3D). On
average, the number of reads increases from 19 to 92 and the fraction of star reads among all reads of the hairpin
increases from 2% to 9%, suggesting an specifically increased preference of the star arm (Figure 3D). The abundance of
star sequences alone could be explained by RISC incorporation of star arms, due to the thermodynamic stability of the
miRNA-miRNA* duplex (Khvorova et al. 2003; Schwarz et al. 2003), and thus star sequences have not received much
attention in miRNA target prediction (Lai 2004; Rajewsky 2006). However, coupled with the observation that abundant
miRNA star sequences also show strong signals stemming from their interaction with target gene 3’UTRs, suggests they
may in fact have physiologically relevant targets.
miR-10 as a master Hox regulator
The miRNA miR-10, which lies in the Hox cluster, presents a particularly striking case of miRNA* functionality
(Figure 4). On one hand, the miRNA* sequence for miR-10 shows an even higher score than the mature miRNA itself, in
terms of structure, conservation, and also 7-mer motif conservation and avoidance (Figure 4a). Moreover, we found 34-
times as many products of miR-10* than miR-10 in our reads from ovaries and testes (306 vs. 9; Figure 4b) and this trend
also holds for other tissues (1319 vs. 189; (Ruby et al. 2007)). Further, an independent analysis of miRNA-miRNA*
duplex energy, showed that both miR-10 and miR-10* can be detected and suggested that both are likely incorporated
into RISC (Schwarz et al. 2003). We thus reason that miR-10* may be functional, and is in fact likely to represent the
primary product.
To infer the potential functional role of miR-10*, we studied its target spectrum, revealing striking insights. First,
miR-10* has nearly 10 times more targets than the annotated miR-10, suggesting it plays a major role in gene regulation
(Figure 4c). Moreover, these targets include several Hox genes, and in particular Abd-B and Ubx, which show highly
conserved canonical target sites (Figure 4D). This provides another example of regulatory relationships between Hox
miRNAs and Hox genes, highly reminiscent of two additional Hox miRNAs, miR-iab-4 in Drosophila, and miR-196 in
vertebrates (Ronshaugen et al. 2005; Stark et al. 2003; Yekta et al. 2004).
Unique to miR-10, however, both arms appear to be functional and appear to be targeting Hox genes: the
originally annotated miR-10 has a highly conserved compensatory target site in the 3’UTR of Sex-combs-reduced (Scr
(Brennecke et al. 2005); Figure 4D). To our knowledge, this is the first demonstration of functional relevance of both
miRNA arms, and their potential cooperative action, targeting similar genes.
Overall, our results suggest that miR-10, may in fact play the role of a master Hox regulator, which was previously
missed likely due to its incomplete annotation. The observation that both arms of a miRNA are expressed and have highly
conserved targets in similar processes suggests that miRNA-star arms might frequently be functional, with major
implications for the identification of functional miRNA targets, and overall role and versatility of miRNA regulation.
Discussion

microRNA characterization in 12 Drosophila genomes
16
A complete knowledge of all miRNAs is extremely important, especially in Drosophila where the study of mutants
from genetic screens heavily relies on accurate genome annotation and where powerful reverse genetics tools allow the
systematic analysis of miRNA functions. The recent availability of 12 closely related Drosophila genomes enables the use
of comparative genomics for recognizing miRNAs systematically, based on their structural and evolutionary signatures.
We report more than 41 novel predicted miRNAs, of which we validate 28 experimentally. In addition, the novel miRNAs
show several miRNA-like properties, which were not used in their discovery, including genomic clustering, family
membership, intronic occurrences, and transcription.
The newly discovered miRNAs significantly increase the number of miRNA genes known in the fly, from 60 prior
to this work, to 89 experimentally confirmed genes (a 50% increase), and 17 additional candidates. This increase is even
more drastic when considering miRNA families: the new miRNAs introduce 30 new miRNA families (a 70% increase),
resulting in increased versatility by forming new groups of potentially co-regulated target genes. Finally, we found that the
genes targeted by these new miRNAs heavily overlap with existing miRNA targets, resulting in a denser miRNA network.
In addition to miRNA annotation, we find that comparative genomics can lead to a deeper understanding of the
functions and biogenesis of miRNAs. We show that a single miRNA gene can give rise to several mature sequences:
first, both strands can be expressed and correctly processed; second, multiple mature products can be produced at small
offsets from the primary miRNA product; third, both arms of the miRNA hairpin can lead to mature miRNAs, with many
potential functional targets. These alternate mature forms are sometimes of surprisingly similar abundance, share similarly
strong evolutionary and structural signatures, and show similar relationships with target 3’UTRs. As these alternate forms
often have drastically different target gene spectra, they could be employed to increase the number of targets for each
miRNA gene, and may constitute a powerful evolutionary mechanism for the emergence of new miRNAs.
Particularly striking was the relationship between miRNAs and miRNA stars. For 13 miRNAs, both hairpin arms
scored highly, reflecting their interaction with miRNA targets and anti-targets, and indicating that star arms might have
previously overlooked functional roles. In the case of miR-10, located in the Hox cluster, we find highly conserved target
genes for both arms, targeting multiple distinct genes in the Hox cluster, suggesting miR-10 is a master regulator of Hox
genes, while previously, Hox miRNAs were assumed to only have a single dominant Hox target gene each (Ronshaugen
et al. 2005; Stark et al. 2003; Yekta et al. 2004). As miRNA and miRNA* are co-expressed, the potential of sharing a
functional target spectrum is intriguing and has major implications for miRNA targeting and biology.
Conversely, mature products from opposite miRNA strands have the potential of distinct regulatory domains. For
example, for the miR-iab locus, we predict high scores for both strands, and both are validated by sequencing reads as
expressed and correctly processed. These two strands are known to be transcribed in adjacent and non-overlapping
domains in fly embryos (Bae et al. 2002), suggesting distinct developmental functions for two miRNAs from a single locus.
In our study, we find four such examples of opposite-strand high-scoring miRNAs that are confirmed by sequencing reads.
The extent of this mechanism is still unclear, but reverse-strand expression may represent a novel biologically relevant
regulatory principle for miRNA genes and RNAs more generally.
The methods presented here are general, and applicable for the systematic annotation of any species. In
particular, this study can serve as a powerful model for the analysis of the human genome: the total evolutionary distance

microRNA characterization in 12 Drosophila genomes
17
across the 12 flies is comparable to the total evolutionary distance of the mammalian genomes, and given the much larger
number of 474 annotated human miRNAs (Griffiths-Jones et al. 2006), comparative approaches may reveal many new
insights into the biology, regulation, and targeting of human miRNAs. By measuring specific evolutionary constraints,
comparative studies can complement ongoing sequencing efforts by recognizing miRNA genes with low abundance or
tissue-specific expression, and resolve if sequencing reads matching hairpin structures constitute noise or functional
miRNAs (Berezikov et al. 2006a). More importantly though, they can reveal biological insights that are not directly
accessible from sequencing reads alone. More generally outside the realm of miRNAs, the ability to define precise
evolutionary and structural signatures for specific classes of RNA genes represents a powerful approach for the
systematic discovery of functional RNA genes and structures in any species.
Methods miRNA training sets
From miRBase release 9.0 (Griffiths-Jones et al. 2006), we selected all 60 Drosophila melanogaster miRNAs that have
been cloned. For both hairpin and mature prediction, miRNAs that may bias the score due to overfitting are excluded
when scoring the known miRNAs (see the appropriate section below for details).
Collecting all melanogaster hairpins
To identify miRNA-like hairpins, we ran RNAfold from the Vienna package (Hofacker et al. 1994) on 120 nt windows
(overlap of 90 nts) in the Drosophila melanogaster genome (rel 4). We considered all hairpins in each window (including
branching hairpins) and trimmed them to the end of the stem. We use these folds to infer the arms and loop of each
hairpin. As a lenient prescreening, we removed all hairpins shorter than 63 nts, with an arm of less than 20 nts or with less
than 70% arm base-pairing. We were left with all the known hairpins and an additional 760,000 potentially overlapping list
of putative miRNA hairpins.
Hairpin sequence alignments
For each melanogaster hairpin sequence, we selected the best BLAST (Altschul et al. 1997) match with E-value ≤ 1x10⁻⁵
in each of the 11 other genomes (CAF1 assemblies). We performed a multiple alignment of the corresponding sequences
plus 50 nt flanking sequence on each side using ClustalW (Thompson et al. 1994).
miRNA hairpin discovery
For each hairpin we derived several structural and conservation features. The most important of these features are
summarized in Figure 1E and the complete list of features is available in Supplemental Table 2. We scored the list of
760,355 putative miRNAs with a method similar to Random Forests (Breiman 2001). Using the combined conservation
and structural feature set, 500 decision trees were trained on the positive training set of 60 miRNAs and a different
randomly selected negative set of 250 of the remaining putative miRNAs. The final score for a hairpin was derived through
cross validation (the score of each hairpin is evaluated only by trees that exclude it, all redundant sequence similar
miRNAs and overlapping miRNAs). From all hairpins that overlap on the same strand, only the hairpin with the highest
score is kept. This can lead to known miRNAs having a slightly revised hairpin selected.

microRNA characterization in 12 Drosophila genomes
18
miRNA mature 5’ identification
For each position in the hairpin, we computed several features indicative of the start (5’end) of mature miRNAs. 7mer
scores are determined for the sequence complementary 7mers for each position in the hairpin. 7mer conservation scores
are motif-conservation scores (MCS) of 7mers calculated in all annotated 3’UTRs (FlyBase release 4.3) as described in
(Kellis et al. 2004; Kellis et al. 2003; Xie et al. 2005). Additionally, we assessed the avoidance of the 7mers in 3’UTRs of
global anti-target genes (Stark et al. 2005) by computing the deviation relative to all genes by Z-scores. In addition, we
considered the nucleotide to account for the U-bias often observed in mature miRNAs, the number of paired bases in a
window of 7 around the position, and others (see Supplemental Table 2). We excluded potential start positions for which
the corresponding miRNA would fall outside the hairpin or span the hairpin loop region (for positions in the left arm, we
required at least 15 nts before the start of the loop; for positions in the right arm, we allowed no more than a 3 nt overlap
with the loop and required at least 18 nts before the end of the hairpin). Within each hairpin, we linearly normalized each
feature to be from 0 to 1 and marked each known mature site as a positive and all remaining sites as negative. We
augmented the features for each position with the features of the position of the left and the right. We used the SVMlight
(Joachims 1999) package to train an SVM with default parameters (linear kernel and positive gain 1) on all the permissible
locations from all the known hairpins. The SVM scores for each hairpin are linearly normalized so that the scores of the
permissible regions have mean 0 and standard deviation 1. We predict the mature location by taking the permissible
location in each hairpin with the highest SVM score. Each hairpin is only scored by models trained on cloned Rfam
hairpins (Rfam 9.0), excluding itself and all family members. For evaluation (not training), we use the partly corrected
5’end annotation of (Ruby et al. 2007). To test if we predicted the star sequences, we determined the star sequence
based on the fold-back structure as a 2nt 5’overhang of the mature miRNA sequence.
Validation of novel miRNAs
To validate our predictions experimentally, we obtained 763,111 Solexa reads corresponding to 1524 distinct sequences
that matched to our predictions. These were cloned from adult Drosophila ovaries and testes as described previously
(Brennecke et al. 2007). We excluded short reads (<15 nucleotides) and those that matched the genome more than 3
times and aligned the remaining reads to the predicted hairpins. For validation, we required that at least one position in
the hairpin was supported by at least 10 reads and manually inspected the alignments for miRNA-like processing patterns
(e.g. dominant sequence, presence of star sequence, no sign of degradation products). In addition, we intersected the
predicted hairpins with curated sequencing reads of several Drosophila libraries kindly provided by Graham Ruby, David
Bartel and Eric Lai. To validate mature miRNA 5’end predictions, we used the curated mature miRNAs reported by (Ruby
et al. 2007), and refer to them by their newly assigned Rfam names (Griffiths-Jones et al. 2006). In figures 2-4, we report
the sum of reads from Solexa and 454 sequencing when showing individual miRNAs. However, given the large number of
Solexa reads stemming from only ovaries and testes, we report only the 454 read-count when comparing several
miRNAs.
miRNA recovery using different species sets
We investigated the dependency of genome-wide miRNA discovery on the number and evolutionary distance of the
contributing species. For this, we obtained all novel miRNAs defined by (Ruby et al. 2007), and tested how many we

microRNA characterization in 12 Drosophila genomes
19
recovered with our protocol when using selected subsets of species. In each case, we allowed for the optimal re-weighting
of feature contributions (e.g. to down-weight conservation features when comparing only close species, if appropriate).
Acknowledgements We are grateful to Graham Ruby and David Bartel (Whitehead Institute/HHMI) and to Eric Lai (Sloan-Kettering Institute)
for providing access to their sequencing data prior to publication. We thank Greg Hannon (CSHL) for support, Matt
Rasmussen, Mike Lin (CSAIL, Broad), and other members of the Kellis lab for helpful discussions and for sharing
unpublished data. AS and JB thank the Schering AG for postdoctoral fellowships. PK was supported in part by a National
Science Foundation Graduate Research Fellowship.
Figure Legends
Figure 1: Evolutionary and Structural properties of miRNA hairpins
A. Typical miRNA hairpin showing mature miRNA (red) and miRNA* (blue).
B. Structural properties of miRNA hairpins for cloned miRNAs (blue), random hairpins of similar lengths and arm pairing
(red) and random genomic hairpins (green; boxes denote 25 percentiles and the whiskers 95 percentiles). miRNAs show
more defined hairpin lengths (1) with longer arms (2) and shorter loops (3) than random hairpins. They are more stable
than random hairpins (z-scores denote standard deviations above minimum free folding energies of random hairpins with
identical lengths and composition; 4), contain fewer asymmetric (5) but more symmetric loops than random hairpins (6).
C. Alignment of a typical miRNA hairpin across 12 Drosophila genomes shows high conservation in the arms, whereas the
loop region and the surrounding sequence are poorly conserved (red: mature miRNA, blue: star sequence, “.()” denote
unpaired and paired nucleotides according to (Hofacker et al. 1994) ). We measure the conservation in 14 regions
distributed over the arms (4 each), loop (2) and flanking regions (2 each; indicated by vertical bars). The average
conservation in these regions the across non-redundant set of cloned Drosophila miRNAs shows a characteristic profile
(bottom) that closely follows the hairpin structure.
D. Conservation properties of miRNAs (box-and-whisker plots as in A). Cloned miRNAs show a significantly higher
correlation to the average conservation profile than the random sets (8). The structures of miRNAs hairpins are generally
more highly conserved than random hairpins as assessed by the minimum free energy of the consensus fold (9)
(Hofacker et al. 2002) or the structure conservation index (10) (Washietl et al. 2005).
E. Discriminatory power of individual features and combined score (features are numbered if in A-C). The enrichment
factor (right) indicates how much more miRNAs (black bars) than random hairpins (grey bars) are selected at the cutoff
that maximizes the information gain (Mitchell 1997). The numbers next to the bars indicate the total number of miRNAs
and random genomic hairpins that are predicted, suggesting that individual features predict many random hairpins in an
entire genome.

microRNA characterization in 12 Drosophila genomes
20
Figure 2: Novel Drosophila miRNAs
A. Prediction and validation of miRNA miR-190. miR-190 (black) is predicted in the intron of the cytoskeleton anchor
protein rhea (blue; UCSC browser screen-shot) in the direction of transcription, sequence alignment of miR-190 across 12
Drosophila genomes and conservation profile highlighting the mature miRNA (red) and the star sequence (blue; “.()”
notation as in Figure 1); experimental validation of miR-190 (total read counts shown to the right). Matching sequence
reads show a characteristic pattern of processing with the total reads obtained for the miRNA and the star sequence,
indicative of true Drosophila miRNAs.
B. Recovery of known novel miRNAs. Count of predicted miRNAs (y-axis) at different score cutoffs (x-axis), for cloned
(training set, blue), previously annotated but not cloned (red), novel and validated (green) and additional novel (yellow). At
a conservative cutoff of 0.95, we recover 51 (85%) of cloned and 9 previously annotated miRNAs among a total of 101
predictions. Of the 41 novel miRNAs, 24 (59%) are experimentally validated. A more lenient cutoff of 0.9 recovers only
one additional known miRNA among 50 additional predictions, 5 of which validate.
C. High-scoring hairpins are specific to introns and intergenic regions, and exclude exons, repeats and transposons.
Shown are percentages for each region (y-axis) for hairpin scores from 1.0 (best) to 0.0 (worst; x-axis). This is compared
to the ratios obtained for random hairpins (Random) and known miRNAs (Known). For scores below 0.8 the distribution of
hairpins is indistinguishable from random, arguing that no further conserved hairpins can be expected at a reasonable
frequency.
D. Examples of novel intronic 1(4 total) and clustered (6 total) miRNAs. miR-995, that is in an intron of cdc2c and miR-998
is ~500 nucleotides from miR-11 in the intron of Ef2.
E. Novel miRNAs explain transcript of erroneously annotated genes. CG31044 and CG33311 are likely the precursor
transcripts of miR-996, which is ~ 2.5 kb from miR-279 (a member of the same family) and Novel-60, which is ~1300
nucleotides from Novel-42.
Figure 3: Properties of mature miRNAs
A: Properties mature miRNA 5’ends. 7mers complementary to the start of mature miRNAs show a characteristic profile of
3’UTR motif conservation scores (MCS) and avoidance in 3’UTR of anti-target genes (normalized z-scores averaged over
non-redundant cloned miRNAs). miRNA 5’ends are followed by a long stretch of perfect conservation that corresponds to
the mature miRNA, and are in regions with constraint base-pairing. 78% of Drosophila miRNAs start with a Uridine,
whereas only ~30% of all hairpin positions are Uridine (boxes and whiskers denote 25 and 95 percentiles, for miRNA
5’ends (blue), random arm positions (red), random hairpin positions (green)).
B. Combined properties accurately highlight the start of mature miRNAs. For an average miRNA hairpin, SVM z-scores
that combine above properties strongly highlight the start of the mature sequence (red: scores above 1), whereas they are
low or negative (grey) throughout the remainder of the hairpin. Shown is the average z-score over all non-redundant
cloned Drosophila miRNAs along a representative hairpin (averages are calculated for each position after aligning all
miRNAs and miRNA*s separately at their starts).

microRNA characterization in 12 Drosophila genomes
21
C. Correction of Drosophila miRNA annotation. Predicted and validated changes of the mature sequence for miR-263a,
miR-274, miR-282, and miR-33 (black lines denote the MCS profile for the new start sites; grey and red denote old and
new sequences, respectively). These changes (between 1 and 4 nucleotides) shifted the target-spectrum of the miRNA
drastically (Venn diagrams), such that the target genes of the annotated (grey circles) and corrected sequences (red
circles) had generally little or no overlap.
D. miRNAs show alternate mature forms. miRNAs for which we correctly predict the 5’end show more precise processing
on average (90% of all reads supporting the mature 5’end at x=0; red). In contrast, the remaining miRNAs show a
significant drop of the central peak with more reads coming from other positions (78%, P=6x10⁻³; blue; left). The fraction of
reads supporting the star sequence (red; shown is the median percentage across all cloned miRNAs) increases for high
scoring stars, while the reads supporting the mature miRNA (black) drops (middle). Number of reads supporting different
5’end positions (mature and star sequences are shaded in red and blue, respectively; right). Novel miRNA miR-964 has 2
mature miRNAs at a ratio of 2:1: The major 5’end is supported by 6457 (6393 from ovaries/testes) reads, but we predict
position +1, which is supported by 3670 (3641 from ovaries/testes) reads. miR-5 and miR-5* are processed in a ratio of
4:1.
E. miRNA abundance correlates strongly with 3’UTR motif conservation. Shown is the number of 454 sequencing reads
for the dominant small RNA per hairpin and miRNA family (x-axis) versus the motif conservation score (MCS) of the
corresponding 3’UTR motif. A strong correlation between both measures is found with a Pearson correlation coefficient of
0.72). Colors denote Rfam miRNAs (previously cloned in black, others in grey) and novel validated miRNAs.
Figure 4: miR-10 and miR-10* target Hox genes
A. SVM z-scores indicate that miR-10 and miR-10* are both functional and that miR-10* is likely the major miRNA (green
and red are positive and negative scores, respectively).
B. Cloning confirms that both sequences are expressed but that miR-10* is more abundant (306/9 in ovaries/testes and
1319/189 otherwise), consistent with the z-scores. Shown is the number of total reads supporting each 5’end position
along the miRNA precursor hairpin (the more abundant miR-10* is shaded in red and miR-10 in blue).
C. Target genes of miR-10 and miR-10* are largely different. miR-10* targets 167 genes as compared to the 18 predicted
for miR-10, with only one overlapping gene (Venn diagrams).
D. miR-10 and miR-10* both target Hox genes. miR-10* has highly conserved canonical sites in the Hox genes
Abdominal-B (Abd-B) and Ultrabithorax (Ubx). miR-10 has a highly conserved compensatory target site in the Hox gene
Sex combs reduced (Scr; (Brennecke et al. 2005)). In the absence of sequence similar miRNAs, these sites argue that
both sequences are functioning by regulating Hox genes. This relationship is similar to that of other Hox miRNAs in fly and
mammals (Stark et al. 2003; Yekta et al. 2004).
Supplemental Figures

microRNA characterization in 12 Drosophila genomes
22
1. 12 species alignment of the miR-314 hairpin and flanking sequence. The mature miRNA and the star sequence are
highlighted in red and blue, respectively. Yellow and orange highlight a notable sequence melanogaster-specific sequence
difference, where a highly conserved U is changed to a C.
2. miRNAs can be processed from both strands. For most cloned Rfam miRNAs, the strand corresponding to the known
annotation scores much more highly than it’s reverse complement (scores below the diagonal; miR-9b being the only
notable exception). For some miRNAs, both strands score very highly, indicating that both have equivalent evolutionary
and structural properties and might be processed into miRNAs when transcribed. For miR-307, miR-124, miR-iab-4, and
miR-305, we indeed recovered reads from both strands, that display miRNA-like processing.
3. Performance with different Drosophila species. Shown are the numbers of known and validated miRNAs that are
recovered in the top 100 (left) or 200 (right) predictions for different combinations of the 12 Drosophila species (x-axis:
branch length as number of substitutions in neutral sequence). Grey indicates pairwise comparisons of Drosophila
melanogaster with all the other genomes, and black multi-species comparisons of Drosophila melanogaster with 1-11
additional species, that are added in the order of increasing evolutionary distance.
Table Legends
Table 1
Predicted miRNAs (score≥ 0.95). Sequencing validated either the genomic locus only (L), the hairpin with the correct
strand (H), and/or the predicted mature 5’end (M). ‘Species’ summarizes the number of species the hairpin is found in,
and a ‘+’ indicates if the mature miRNA was perfectly conserved across all those species (see methods). ‘Solexa’ and
‘454’ summarize the reads supporting the annotated mature 5’end from ovaries/testes libraries and from (Ruby et al.
2007), respectively.
Supplemental Table 1
Known Rfam and predicted miRNAs (score≥ 0.90). Cloned Rfam miRNAs used for training are starred. Sequencing
validated either the genomic locus only (L), the hairpin with the correct strand (H), and/or the predicted mature 5’end (M).
‘Species’ summarizes the number of species the hairpin is found in, and a ‘+’ indicates if the mature miRNA was perfectly
conserved across all those species (see methods). ‘Solexa’ and ‘454’ reads summarize the reads supporting the
annotated mature 5’end in ovaries/testes and from (Ruby et al. 2007), respectively.
Supplemental Table 2
miRNA hairpin features. Features used for the prediction of miRNA hairpins, the range of their values for cloned Rfam
miRNAs, random miRNA-like and random hairpins, and the discriminatory enrichment (see text).
Supplemental Table 3
microRNA characterization in 12 Drosophila genomes
23
Mature miRNA features. Features used for the prediction of mature miRNA 5’ends , the range of their values 5’ends of
cloned Rfam miRNAs and random positions, and the discriminatory enrichment (see text).
Supplemental Data Solexa sequencing reads matching to hairpins with scores above 0.90 aligned to the hairpin sequence. Shown is
the number of reads for each unique small RNA sequence (first column) and the number of times it matches to
the Drosophila melanogaster genome (Release 5). Header lines for each hairpin indicate are the score,
validation (LHM-notation, see Supplemental Table 1), genomic coordinates, and name.

microRNA characterization in 12 Drosophila genomes
24
References Aboobaker, A.A., P. Tomancak, N. Patel, G.M. Rubin, and E.C. Lai. 2005. Drosophila microRNAs exhibit diverse spatial
expression patterns during embryonic development. Proc Natl Acad Sci U S A. Altschul, S.F., T.L. Madden, A.A. Schaffer, J. Zhang, Z. Zhang, W. Miller, and D.J. Lipman. 1997. Gapped BLAST and
PSI-BLAST: a new generation of protein database search programs. Nucleic Acids Res 25: 3389-3402. Alvarez-Garcia, I. and E.A. Miska. 2005. MicroRNA functions in animal development and human disease. Development
132: 4653-4662. Ambros, V. 2004. The functions of animal microRNAs. Nature 431: 350-355. Aravin, A.A., M. Lagos-Quintana, A. Yalcin, M. Zavolan, D. Marks, B. Snyder, T. Gaasterland, J. Meyer, and T. Tuschl.
2003. The small RNA profile during Drosophila melanogaster development. Dev Cell 5: 337-350. Bae, E., V.C. Calhoun, M. Levine, E.B. Lewis, and R.A. Drewell. 2002. Characterization of the intergenic RNA profile at
abdominal-A and Abdominal-B in the Drosophila bithorax complex. Proc Natl Acad Sci U S A 99: 16847-16852. Bartel, D.P. 2004. MicroRNAs: genomics, biogenesis, mechanism, and function. Cell 116: 281-297. Baskerville, S. and D.P. Bartel. 2005. Microarray profiling of microRNAs reveals frequent coexpression with neighboring
miRNAs and host genes. Rna 11: 241-247. Bentwich, I., A. Avniel, Y. Karov, R. Aharonov, S. Gilad, O. Barad, A. Barzilai, P. Einat, U. Einav, E. Meiri et al. 2005.
Identification of hundreds of conserved and nonconserved human microRNAs. Nat Genet. Berezikov, E., E. Cuppen, and R.H. Plasterk. 2006a. Approaches to microRNA discovery. Nat Genet 38 Suppl 1: S2-7. Berezikov, E., V. Guryev, J. van de Belt, E. Wienholds, R.H. Plasterk, and E. Cuppen. 2005. Phylogenetic Shadowing and
Computational Identification of Human microRNA Genes. Cell 120: 21-24. Berezikov, E., F. Thuemmler, L.W. van Laake, I. Kondova, R. Bontrop, E. Cuppen, and R.H. Plasterk. 2006b. Diversity of
microRNAs in human and chimpanzee brain. Nat Genet 38: 1375-1377. Breiman, L. 2001. Random Forests. Machine Learning 45: 5-32. Brennecke, J., A.A. Aravin, A. Stark, M. Dus, M. Kellis, R. Sachidanandam, and G.J. Hannon. 2007. Discrete small RNA-
generating loci as master regulators of transposon activity in Drosophila. Cell 128: 1089-1103. Brennecke, J., D.R. Hipfner, A. Stark, R.B. Russell, and S.M. Cohen. 2003. bantam encodes a developmentally regulated
microRNA that controls cell proliferation and regulates the proapoptotic gene hid in Drosophila. Cell 113: 25-36. Brennecke, J., A. Stark, R.B. Russell, and S.M. Cohen. 2005. Principles of MicroRNA-Target Recognition. PLoS Biol 3:
e85. Chan, C.S., O. Elemento, and S. Tavazoie. 2005. Revealing Posttranscriptional Regulatory Elements Through Network-
Level Conservation. PLoS Comput Biol 1: e69. Chen, K. and N. Rajewsky. 2007. The evolution of gene regulation by transcription factors and microRNAs. Nat Rev Genet
8: 93-103. Consortium, D.C.G.S.a.A. 2007a. Evolution of Genes and Genomes in the Genus Drosophila. Nature in preparation. Consortium, D.C.G.S.a.A. 2007b. Initial comparative genomics analysis of 12 Drosophila genomes. Nature In preparation. Davidson, E.H. and D.H. Erwin. 2006. Gene regulatory networks and the evolution of animal body plans. Science 311:
796-800. Doench, J.G. and P.A. Sharp. 2004. Specificity of microRNA target selection in translational repression. Genes Dev 18:
504-511. Enright, A.J., B. John, U. Gaul, T. Tuschl, C. Sander, and D.S. Marks. 2003. MicroRNA targets in Drosophila. Genome
Biol 5: R1. Griffiths-Jones, S., R.J. Grocock, S. van Dongen, A. Bateman, and A.J. Enright. 2006. miRBase: microRNA sequences,
targets and gene nomenclature. Nucleic Acids Res 34: D140-144. Grun, D., Y.L. Wang, D. Langenberger, K.C. Gunsalus, and N. Rajewsky. 2005. microRNA Target Predictions across
Seven Drosophila Species and Comparison to Mammalian Targets. PLoS Comput Biol 1: e13. Han, J., Y. Lee, K.H. Yeom, J.W. Nam, I. Heo, J.K. Rhee, S.Y. Sohn, Y. Cho, B.T. Zhang, and V.N. Kim. 2006. Molecular
basis for the recognition of primary microRNAs by the Drosha-DGCR8 complex. Cell 125: 887-901. Hobert, O. 2004. Common logic of transcription factor and microRNA action. Trends Biochem Sci 29: 462-468. Hofacker, I.L., M. Fekete, and P.F. Stadler. 2002. Secondary structure prediction for aligned RNA sequences. J Mol Biol
319: 1059-1066. Hofacker, I.L., W. Fontana, P.F. Stadler, L.S. Bonhoeffer, M. Tacker, and P. Schuster. 1994. Fast folding and comparison
of RNA secondary structures. Monatshefte für Chemie / Chemical Monthly V125: 167.

microRNA characterization in 12 Drosophila genomes
25
Joachims, T. 1999. Making large-Scale SVM Learning Practical. In Advances in Kernel Methods - Support Vector Learning (eds. B. Schölkopf C. Burges, and A. Smola), pp. 41-56, Cambridge, Mass.
Johnston, R.J. and O. Hobert. 2003. A microRNA controlling left/right neuronal asymmetry in Caenorhabditis elegans. Nature 426: 845-849.
Kellis, M., N. Patterson, B. Birren, B. Berger, and E.S. Lander. 2004. Methods in comparative genomics: genome correspondence, gene identification and regulatory motif discovery. J Comput Biol 11: 319-355.
Kellis, M., N. Patterson, M. Endrizzi, B. Birren, and E.S. Lander. 2003. Sequencing and comparison of yeast species to identify genes and regulatory elements. Nature 423: 241-254.
Khvorova, A., A. Reynolds, and S.D. Jayasena. 2003. Functional siRNAs and miRNAs exhibit strand bias. Cell 115: 209-216.
Kiriakidou, M., P.T. Nelson, A. Kouranov, P. Fitziev, C. Bouyioukos, Z. Mourelatos, and A. Hatzigeorgiou. 2004. A combined computational-experimental approach predicts human microRNA targets. Genes Dev 18: 1165-1178.
Kloosterman, W.P., E. Wienholds, R.F. Ketting, and R.H. Plasterk. 2004. Substrate requirements for let-7 function in the developing zebrafish embryo. Nucleic Acids Res 32: 6284-6291.
Krek, A., D. Grun, M.N. Poy, R. Wolf, L. Rosenberg, E.J. Epstein, P. Macmenamin, I. da Piedade, K.C. Gunsalus, M. Stoffel et al. 2005. Combinatorial microRNA target predictions. Nat Genet 37: 495-500.
Lagos-Quintana, M., R. Rauhut, W. Lendeckel, and T. Tuschl. 2001. Identification of novel genes coding for small expressed RNAs. Science 294: 853-858.
Lai, E.C. 2002. Micro RNAs are complementary to 3' UTR sequence motifs that mediate negative post-transcriptional regulation. Nat Genet 30: 363-364.
Lai, E.C. 2003. microRNAs: Runts of the Genome Assert Themselves. Curr Biol 13: R925-936. Lai, E.C. 2004. Predicting and validating microRNA targets. Genome Biol 5: 115. Lai, E.C., C. Burks, and J.W. Posakony. 1998. The K box, a conserved 3' UTR sequence motif, negatively regulates
accumulation of enhancer of split complex transcripts. Development 125: 4077-4088. Lai, E.C. and J.W. Posakony. 1997. The Bearded box, a novel 3' UTR sequence motif, mediates negative post-
transcriptional regulation of Bearded and Enhancer of split Complex gene expression. Development 124: 4847-4856. Lai, E.C., P. Tomancak, R.W. Williams, and G.M. Rubin. 2003. Computational identification of Drosophila microRNA
genes. Genome Biol 4: R42. Lai, E.C., C. Wiel, and G.M. Rubin. 2004. Complementary miRNA pairs suggest a regulatory role for miRNA:miRNA
duplexes. Rna 10: 171-175. Lau, N.C., L.P. Lim, E.G. Weinstein, and D.P. Bartel. 2001. An abundant class of tiny RNAs with probable regulatory roles
in Caenorhabditis elegans. Science 294: 858-862. Lee, R.C. and V. Ambros. 2001. An extensive class of small RNAs in Caenorhabditis elegans. Science 294: 862-864. Lee, R.C., R.L. Feinbaum, and V. Ambros. 1993. The C. elegans heterochronic gene lin-4 encodes small RNAs with
antisense complementarity to lin-14. Cell 75: 843-854. Lewis, B.P., I.H. Shih, M.W. Jones-Rhoades, D.P. Bartel, and C.B. Burge. 2003. Prediction of mammalian microRNA
targets. Cell 115: 787-798. Li, X. and R.W. Carthew. 2005. A microRNA Mediates EGF Receptor Signaling and Promotes Photoreceptor
Differentiation in the Drosophila Eye. Cell 123: 1267-1277. Li, Y., F. Wang, J.A. Lee, and F.B. Gao. 2006. MicroRNA-9a ensures the precise specification of sensory organ
precursors in Drosophila. Genes Dev 20: 2793-2805. Manak, J.R., S. Dike, V. Sementchenko, P. Kapranov, F. Biemar, J. Long, J. Cheng, I. Bell, S. Ghosh, A. Piccolboni et al.
2006. Biological function of unannotated transcription during the early development of Drosophila melanogaster. Nat Genet 38: 1151-1158.
Miller, W., K.D. Makova, A. Nekrutenko, and R.C. Hardison. 2004. Comparative genomics. Annu Rev Genomics Hum Genet 5: 15-56.
Mitchell, T.M. 1997. Machine Learning. McGraw-Hill, New York. Ng Kwang Loong, S. and S.K. Mishra. 2007. Unique folding of precursor microRNAs: quantitative evidence and
implications for de novo identification. Rna 13: 170-187. Okabe, M., T. Imai, M. Kurusu, Y. Hiromi, and H. Okano. 2001. Translational repression determines a neuronal potential
in Drosophila asymmetric cell division. Nature 411: 94-98.

microRNA characterization in 12 Drosophila genomes
26
Pasquinelli, A.E., B.J. Reinhart, F. Slack, M.Q. Martindale, M.I. Kuroda, B. Maller, D.C. Hayward, E.E. Ball, B. Degnan, P. Muller et al. 2000. Conservation of the sequence and temporal expression of let-7 heterochronic regulatory RNA. Nature 408: 86-89.
Pekarsky, Y., U. Santanam, A. Cimmino, A. Palamarchuk, A. Efanov, V. Maximov, S. Volinia, H. Alder, C.G. Liu, L. Rassenti et al. 2006. Tcl1 expression in chronic lymphocytic leukemia is regulated by miR-29 and miR-181. Cancer Res 66: 11590-11593.
Plasterk, R.H. 2006. Micro RNAs in Animal Development. Cell 124: 877-881. Rajewsky, N. 2006. microRNA target predictions in animals. Nat Genet 38 Suppl 1: S8-S13. Richards, S., Y. Liu, B.R. Bettencourt, P. Hradecky, S. Letovsky, R. Nielsen, K. Thornton, M.J. Hubisz, R. Chen, R.P.
Meisel et al. 2005. Comparative genome sequencing of Drosophila pseudoobscura: chromosomal, gene, and cis-element evolution. Genome Res 15: 1-18.
Ritchie, W., M. Legendre, and D. Gautheret. 2007. RNA stem-loops: To be or not to be cleaved by RNAse III. Rna. Ronshaugen, M., F. Biemar, J. Piel, M. Levine, and E.C. Lai. 2005. The Drosophila microRNA iab-4 causes a dominant
homeotic transformation of halteres to wings. Genes Dev 19: 2947-2952. Ruby, J.G., C. Jan, C. Player, M.J. Axtell, W. Lee, C. Nusbaum, H. Ge, and D.P. Bartel. 2006. Large-scale sequencing
reveals 21U-RNAs and additional microRNAs and endogenous siRNAs in C. elegans. Cell 127: 1193-1207. Ruby, J.G., A. Stark, W.K. Johnston, M. Kellis, D.P. Bartel, and E.C. Lai. 2007. Evolution, Biogenesis, Expression, and
Target Predictions of a Substantially Expanded Set of Drosophila MicroRNAs. Genome Res submitted. Schwarz, D.S., G. Hutvagner, T. Du, Z. Xu, N. Aronin, and P.D. Zamore. 2003. Asymmetry in the assembly of the RNAi
enzyme complex. Cell 115: 199-208. Seitz, H. and P.D. Zamore. 2006. Rethinking the microprocessor. Cell 125: 827-829. Stark, A., J. Brennecke, N. Bushati, R.B. Russell, and S.M. Cohen. 2005. Animal MicroRNAs Confer Robustness to Gene
Expression and Have a Significant Impact on 3'UTR Evolution. Cell 123: 1133-1146. Stark, A., J. Brennecke, R.B. Russell, and S.M. Cohen. 2003. Identification of Drosophila MicroRNA Targets. PLoS Biol 1:
E60. Teleman, A.A. and S.M. Cohen. 2006. Drosophila lacking microRNA miR-278 are defective in energy homeostasis. Genes
Dev 20: 417-422. Thompson, J.D., D.G. Higgins, and T.J. Gibson. 1994. CLUSTAL W: improving the sensitivity of progressive multiple
sequence alignment through sequence weighting, position-specific gap penalties and weight matrix choice. Nucleic Acids Res 22: 4673-4680.
Valencia-Sanchez, M.A., J. Liu, G.J. Hannon, and R. Parker. 2006. Control of translation and mRNA degradation by miRNAs and siRNAs. Genes Dev 20: 515-524.
Washietl, S., I.L. Hofacker, and P.F. Stadler. 2005. Fast and reliable prediction of noncoding RNAs. Proc Natl Acad Sci U S A 102: 2454-2459.
Wightman, B., I. Ha, and G. Ruvkun. 1993. Posttranscriptional regulation of the heterochronic gene lin-14 by lin-4 mediates temporal pattern formation in C. elegans. Cell 75: 855-862.
Xie, X., J. Lu, E.J. Kulbokas, T.R. Golub, V. Mootha, K. Lindblad-Toh, E.S. Lander, and M. Kellis. 2005. Systematic discovery of regulatory motifs in human promoters and 3' UTRs by comparison of several mammals. Nature 434: 338-345.
Yekta, S., I.H. Shih, and D.P. Bartel. 2004. MicroRNA-directed cleavage of HOXB8 mRNA. Science 304: 594-596. Zamore, P.D. and B. Haley. 2005. Ribo-gnome: the big world of small RNAs. Science 309: 1519-1524. Zhang, R., Y. Peng, W. Wang, and B. Su. 2007. Rapid evolution of an X-linked microRNA cluster in primates. Genome
Res 17: 612-617.

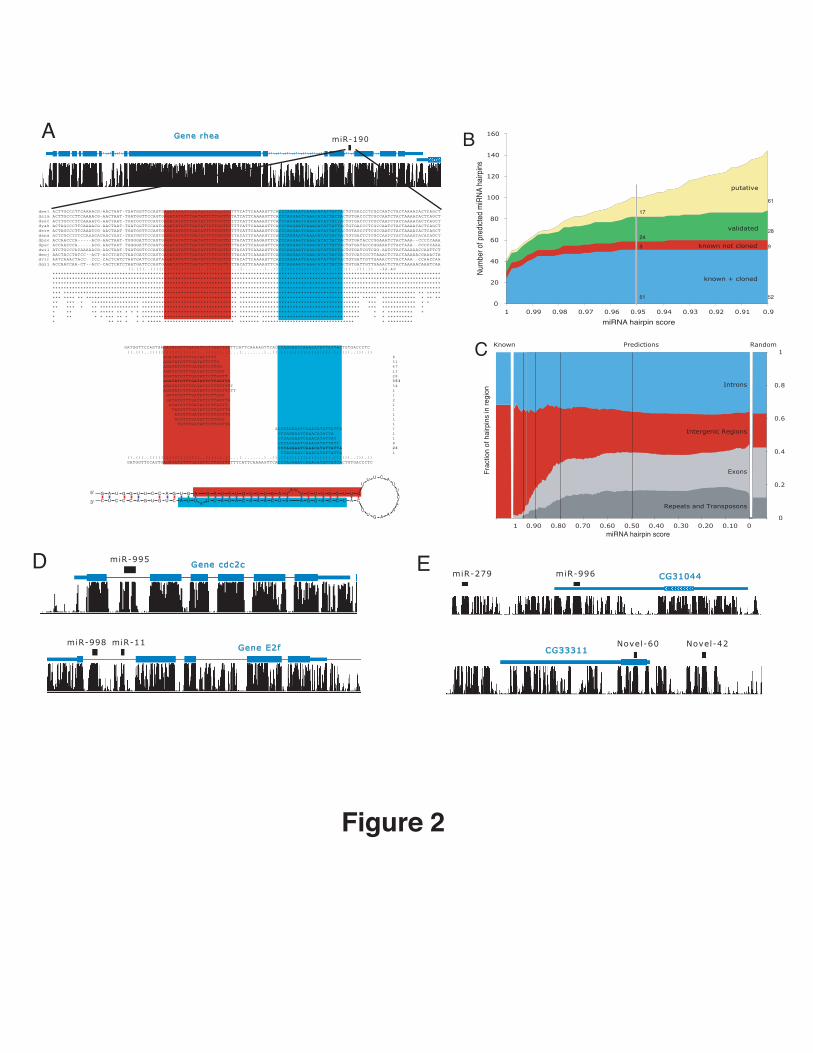
GGGCGAGAAAGGAGCCCAATA----GTGGGGATGTGGGGAAGGATGCTCTTTTCTGACTCTATTTTGTCGGCGAACATGGATCTAGTGCACGGTGG-TTCATGATTAAGTTCGTGACTAGATTTCATGCTCGTCTATTAAGTTGGGTCAGCACA-ACGAAGA----GAGCGGAGCTTTCCATCTC-GCGGGGATCGGAGGGAG-TCG- GGGCGAGAAAGGAGCCCAAAA----GTGGGGATGTGGGGAAGGATGCTCTTTTCTGACTCTATTTTGTCGGCGAACATGGATCTAGTGCACGGTGG-TTCATGATTAAGTTCGTGACTAGATTTCATGCTCGTCTATTAAGTTGGGTCAGCACA-ACGAAGA----GAGCGCAGCTTTCCATCTC-ACGGGGATCGGCGGGAG-TCG- GGGCGAGAAAGAAGCCCAAAA----GTGGGGATGTGGGGAAGGATGCTCTTTTCTGACTCTATTTTGTCGGCGAACATGGATCTAGTGCACGGTGG-TTCATGATTAAGTTCGTGACTAGATTTCATGCTCGTCTATTAAGTTGGGTCAGCACA-ACGAAGA----GAGCGGAGCTT-CCATCTC-ACGGGGATCGGCGGGAG-TCGT ---CGAGAAAGGAGCCCCAAATGTGGGGGGGATGTGGGGAAGGATGCTCTTTTCTGACTCTATTTTGTCGGCGAACATGGATCTAGTGCACGGTGG-TTCATGATTAAGTTCGTGACTAGATTTCATGCTCGTCTATTAAGTTGGGTCAGCACT-ACGAAGA----GAG-----CTTTCCATCTC-GCGGGGATCGGAGGGAGTTCGT GAGCGAGAAAGGAGCCCCACA----GCGGAGAAGTGGGGAAGGATGCTCTTTTCTGACTCTATTTTGTCGGCGAACATGGATCTAGTGCACGGTGG-TTCATGATTAAGTTCGTGACTAGATTTCATGCTCGTCTATTAAGTTGGGTCAGCACT-ACGAAGA----GAG-----CTTTCCATCTC-GCGGGGATCGGAACGGGATCGG CCACAAGTCGTGCTCTGGCAATGAGTGGAAAAGG----ATTTGGGGTCTTTTTCTGACTCTATTTTGTCGGCGAACATGGATCTAGTGCACGGTGT-TTCATGATTAAGTTCGTGACTAGATTTCATGCTCGTCTATTAAGTTGGGTCAGCACA-CCAAAGAGTCGGATAGTGGAGAGTCAACTA-ACTCCCATCCCTGCCC------ ---CCAGAGCCAGAGCCAGAGCCTGGGTCTGATCCGGCAGCGTTTGCTCTTCTCTGACTCTATTTTGTCGGCGAACATGGATCTAGTGCACGGTTG-TTCATGATTAAGTTCGTGACTAGATTTCATGCTCGTCTATTAAGTTGGGTCAACACA-ACGAACCGAAAGAGCAGAGCAACGCAGTTGTCGAAAATTGCACTCC------- ---ACAGTGCCAGAGCCAGAGCCTGGGTCTGATCCGGCAGCGTTTGCTCTTCTCTGACTCTATTTTGTCGGCGAACATGGATCTAGTGCACGGTTG-TTCATGATTAAGTTCGTGACTAGATTTCATGCTCGTCTATTAAGTTGGGTCAACACA-ACGAACCGAAAGAGCAGAGCAACGCAGTTGTCGAAAATTGCACTCC------- ---TGTGTGTGGATGGATGGATGGATGGAGTCCTTTCTATGTGGCAGCGTCTCTTGACTCTATTTTGTCGGCGAACATGGATCTAGTGCACGGTTTGTTCATGATTAAGTTCGTGACTAGATTTCATGCTCGTCTATTAAGTTGGGTCAGCACA-ACAAGAG--CGCAGCGGAGAGGGCAAACTATAATGCAGTTAATGTGAG----- AGGTCTCTACTGCAGCTGCTGCCTGATATTTCTTTT-----TTTTGCTCTTCTCTGACTCTATTTTGTCGGCGAACATGGATCTAGTGCACGGTTG-TTCATGATTAAGTTCGTGACTAGATTTCATGCTCGTCTATTAAGTTGGGTCAATACACACA-GCGAAAACATGGCCAAGAGACCATTACAAAGAGAAGAGCCAG------- TGATTTTTGATTTTTTTTTTTTTTT-TGTTTCGCTC-----TTTTGCTCTTCTCTGACTCTATTTTGTCGGCGAACATGGATCTAGTGCACGGTTG-TTCATGATTAAGTTCGTGACTAGATTTCATGCTCGTCTATTAAGTTGGGTCAACACACACACACACACACATAAAAGAAAAAC-ATGGCCAAGAGGCCATAATA------- ---TCTCTCGCCCACTTTCTAGCTTCAACTGCAACTGCAACTGCTGCTCTTTTCTGACTCTATTTTGTCGGCGAACATGGATCTAGTGCACGGTTG-TTCATGATTAAGTTCGTGACTAGATTTCATGCTCGTCTATTAAGTTGGGTCAACACACA-ACACAAAAAAAAAAGAGGAGAGC-AAAGCAAAGCAGTGAGGGTGG------ (((((((.((((.((.(((((.((((((((((((.(((((... .............))))))))))).)))))).))))).)).)))).))))))) **************************************************************************************************************************************************************************************************************** **************************************************************************************************************************************************************************************************************** ****************************************************************************************************************************************************************************************** ********************* ****************** * ******************************************************************************************************************************************************** ******** ********** * ******** ********** *** * * * ******* * ** ************************************************************************************************************************ ********* *** ** * * * **** * * * ** * * ** * *** * * * *** *** ** ************************************************** ***************************************************************** * *** *** ** ** * **** * * * * * ** * * * ** * * * ************************************************** ****************************************************** ******* ** * *** ** ** * * * * * * * ******* ****************************************** ****************************************************** ******* ** * * ** * * * * * ******* ****************************************** ****************************************************** **** ** * * * * * * * ** ****************************************** ***************************************************** *** ** * * * **************************************** **************************************************** ** *
dmeldsimdsecdyakderedanadpsedperdwildmojdvirdgri
A B
C
D E
Figure 1
UUGAC
UAC
GAAA
CCGGUUUUCGA
UU
UGGUUU
GACU
GU
UU
U U CAU
ACA
AGUU
GGAAGGAAUUCCAA
UUUU
UUUUGGAAAAAAGGCCUUGG
AAUUUUUU
G U C AA
3'
miR
NA
miR
NA*
Correlation with conservation profile� -1 1
MFE of the consensus fold� 80 10
Hairpin stability (MFE z-score)� 6 14
Right arm length� 20 70
Loop length0 120
Structure length20 130
Number of asymmetric loops0 14
Number of symmetric loops0 16
Structure conservation index0 2
cloned Rfam miRNAs miRNA-like hairpins random hairpins
(7) miRNA hairpin conservation profile
Conservation features
Structural features
51
42
36
52
55
43
48
56
59
59
35
142
24,574
131,707
110,295
13,885
262,543
412,772
547,327
548,799
147,352
1,625
0 10 20 30 40 50 60 70 80 90 100
Score
Cons. Profile
Arm / Loop Cons.
Arm Cons.
Struct. Cons.
Hairpin Energy
% Paired Bases
Arm length
Loop Length
Struct. Length
Loop Symmetry
Known (60) Random (760,355)
4551
327
19
5
6
39
2.3
1.7
1.4
1.4
3
Enrichment
5'
3'
3'
(1) (4)
(5)
(6)
(2)
(3)
(8)
(9)(9)
(1)
(2)
(3)
(4)
(7)
(10)

miRNA hairpin score
Num
ber o
f pre
dicte
d m
iRNA
hair
pins
Frac
tion
of h
airp
ins
in re
gion
miRNA hairpin score
0
0.2
0.4
0.6
0.8
1Random
00.100.200.300.400.500.600.700.800.90
Known Predictions
Repeats and Transposons
Exons
Introns
Intergenic Regions
0
20
40
60
80
100
120
140
160
1 0.99 0.98 0.97 0.96 0.95 0.94 0.93 0.92 0.91 0.9
putative
validated
known not cloned
known + cloned
miR-190Gene rhea
GATGGTTCCAGTGAGATATGTTTGATATTCTTGGTTGTTTCATTCAAAAGTTCACCCAGGAATCAAACATATTATTACTGTGACCCTC ((.(((..((((((((((((((((((..((((((.((...(........)..)).)))))))))))))))))).))))))..))).)) AGATATGTTTGATATTCTT 8 AGATATGTTTGATATTCTTG 31 AGATATGTTTGATATTCTTGG 47 AGATATGTTTGATATTCTTGGT 13 AGATATGTTTGATATTCTTGGTT 28 AGATATGTTTGATATTCTTGGTTG 353 AGATATGTTTGATATTCTTGGTTGT 34 AGATATGTTTGATATTCTTGGTTGTT 1 GATATGTTTGATATTCTTGGT 1 GATATGTTTGATATTCTTGGTTG 2 ATATGTTTGATATTCTTGGTT 1 TATGTTTGATATTCTTGGTTG 1 ATGTTTGATATTCTTGGTTG 1 ATGTTTGATATTCTTGGT 1 TGTTTGATATTCTTGGTTG 1 ACCCAGGAATCAAACATATTATTA 1 CCCAGGAATCAAACATATTA 1 CCCAGGAATCAAACATATTAT 1 CCCAGGAATCAAACATATTATT 8 CCCAGGAATCAAACATATTATTA 26 CCAGGAATCAAACATATTATTA 1 ((.(((..((((((((((((((((((..((((((.((...(........)..)).)))))))))))))))))).))))))..))).)) GATGGTTCCAGTGAGATATGTTTGATATTCTTGGTTGTTTCATTCAAAAGTTCACCCAGGAATCAAACATATTATTACTGTGACCCTC
dmel ACTTGCCCTTCAAAACG-AACTAAT-TGATGGTTCCAGTGAGATATGTTTGATATTCTTGGTTGTTTCATTCAAAAGTTCACCCAGGAATCAAACATATTATTACTGTGACCCTCGCCAATCTACTAAAACACTCAGCTdsim ACTTGCCCTTCAAAACG-AACTAAT-TGATGGTTCCAGTGAGATATGTTTGATATTCTTGGTTGTATCATTCAAAAGTTCACCCAGGAATCAAACATATTATTACTGTGACCCTCGCCAATCTACTAAAACACTCAGCTdsec ACTTGCCCTTCAAAATG-AACTAAT-TGATGGTTCCAGTGAGATATGTTTGATATTCTTGGTTGTTTCATTCAAAAGTTCACCCAGGAATCAAACATATTATTACTGTGACCCTCGCCAATCTACTAAAACACTCAGCTdyak ACTAGCCCTTCAAAACG-AACTAAT-TGATGGTTCCAGTGAGATATGTTTGATATTCTTGGTTGTTTCATTCAAAAGTTCACCCAGGAATCAAACATATTATTACTGTGACCCTCGCCAATCTACTAAAACACTCAGCTdere ACTAGCCCTTCAAATCG-AACTAAT-TGATGGTTCCAGTGAGATATGTTTGATATTCTTGGTTGTTTCATTCAAAAGTTCACCCAGGAATCAAACATATTATTACTGTAGCCTTCGCCAATCTACTAAAACACTCAGCTdana ACTCGCCTCTCCAAACACAACTAAT-TGATGGTTCCAGTGAGATATGTTTGATATTCTTGGTTGTTACATTCAAAAGTTCACCCAGGAATCAAACATATTATTACTGTGACTCTCGCCAATCTACTAAAATACACAGCTdpse ACCAACCCA-----ACG-AACTAAT-TGGGGATTCCAGTGAGATATGTTTGATATTCTTGGTTGTTACATTCAAGAGTTCACCCAGGAATCAAACATATTATTACTGTGATACCCGGAAATCTACTAAA--CCCCCAAAdper ACCAACCCA-----ACG-AACTAAT-TGGGGATTCCAGTGAGATATGTTTGATATTCTTGGTTGTTACATTCAAGAGTTCACCCAGGAATCAAACATATTATTACTGTGATACCCGGAAATCTACTAAA--CCCCCAAAdwil ATCTGCCCACAAAAACG-AACTAAT-TGATGGTCCCAGTGAGATATGTTTGATATTCTTGGTTGTTACATTCAAAAGTTCACCCAGGAATCAAACATATTATTACTGTGATCGTCGG-AATCTACTAAAAACCAATTCTdmoj AACTACCTATCC--ACT-ACCTCATCTAACGATTCCAGTGAGATATGTTTGATATTCTTGGTTGTTACATTCAAAAGTTCACCCAGGAATCAAACATATTATTACTGTGATCGCTTAAACTCTACTAAAAACGAAACTAdvir AATCAAACTACC--CCC-CACTCATCTAATGATTCCAGTAAGATATGTTTGATATTCTTGGTTGTTACATTCAAAAGTTCACCCAGGAATCAAACATATTATTACTGTGATTGTTGAAACTCTACTAAA--CCAACCAAdgri ACCAACCAA-CT--ACC-CACTCATCTAATGATTCCAGTGAGATATGTTTGATATTCTTGGTTGTTACATTCAAAAGTTCACCCAGGAATCAAACATATTATTACTGTGATTGTTGAAACTCTACTAAAAACAAATCAA ((.(((..((((((((((((((((((..((((((.((...(........)..)).)))))))))))))))))).))))))..))).)) -32.40 ******************************************************************************************************************************************* ******************************************************************************************************************************************* ******************************************************************************************************************************************* ******************************************************************************************************************************************* *** ************************************************************** *************************************************************** ** ***** *** **** ** ****************************************************** ******************************************* ***** ************ * ** ** ** *** * ***************** ********************************** ******************************************* *** ************ * * ** *** * ** ************** ********************************** ******************************************* *** ************ * * ** ** ***** ** * * * ********************************** ******************************************* * * ********* * * ** * * *** ** * * ********************************** ******* *********************************** * * ********* * ** ** * * * ***** ************************* ******* ********************************* * *********
G A U G G U U C C A G U G A G A U A U G U U U G A UA U
U C U U G G U U G
UU U C A
UUCA
AAAGU
U
CACCCAGGAAUCAAACAUAUUAUUACUGUGACCCUC
5'
3'
miR-279 miR-996 CG31044
miR-995
miR-11miR-998 Novel-42Novel-60
B
C
A
ED
1
Figure 2
61
28
9
52
17
249
51
Gene E2f CG33311
Gene cdc2c

Length of perfect conservation that follows0 45
Number of paired bases in window of 70 8
% Positions with U0 1
A
Figure 3
C
D E
B
UU
GCA
A
3'
miRNA
miRNA
AC
UAC
GAAAC
CGGUUUUCGAUU
UGGUUUGACUGU
UUU
UC
A UA C A A G
GU A G A U C A
U UU U G A A A G C U G A
U U U U
U
-1
0
1
-1
0
1
2
3
0
0.05
0.1
0.15
0.2
0.25
0.3
-4 -3 -2 -1 0 1 2 3 4
-0.3
-0.25
-0.2
-0.15
-0.1
-0.05
0
0.05
0.1
-4 -3 -2 -1 0 1 2 3 4
MCS
Arm Conservation
Loop-context
U-bias
Avoidance
0
0.05
0.1
0.15
0.2
0.25
0.3
miR-263a
C A G U U A A U G GG U U A A U G GA A U G G C A C
12988
norm
aliz
ed M
CS
-0.05
0
0.05
0.1
0.15
0.2
0.25
0.3
normalized MCS
miR-282
2730
0
A A A U C U A G C C UA A U C U A G CU A G C C U C U
norm
aliz
ed M
CS
11733
3
C G C A G G U G C A UA G G U G C A UG U G C A U U G
miR-33
-0.05
0
0.05
0.1
0.15
0.2
0.25
0.3
0.35
0.4
norm
aliz
ed M
CS
89204 68
3
U U U G U G A C-0.05
0
0.05
0.1
0.15
0.2
0.25
0.3
0.35
0.4
miR-274
norm
aliz
ed M
CS
U U C G U U U U G U G
+2+1 +3 +4
U U U U G U G A
Position relative to miRNA 5'end low scores
mature
mature
star
starstar
high scores
% r
eads
star
ting a
t posi
tion (
aver
age)
% r
eads
support
ing m
ature
or
star
0
5
10
-4 -2 0 2 4
80
85
90
95
miR-964
miR-5
+
**
Motif co
nse
rvat
ion s
core
(M
CS)
# sequencing reads
0
20
40
60
80
100
120
10 100 1000 10000 100000
GCUAAAAGGAACGAUCGUUGUGAUAUGAGUUGUUUCCUAACAUAUCACAGUGAUUUUCCUUUAUAACGC ((((((( ((((((((((((((( ))))))))))))))))))))))
0
1000
2000
3000
4000
5000
0
10
20
30
40
50
60
70
80
90
100
UUGCCUUAGAAUAGGGGAGCUUAACUUAUGUUUUUGAUGUUUAAGUUAAAAGCCUCUGUUCUAAGACAAU(((.(((((((((((((...((((((((.............))))))))...))))))))))))).))).
7000
6000
5000
6000
3000
2000
1000
0
G

A
Figure 4
B
D
C
3.5
3.5
CCACG
UCU
ACC
CUGUAGAUCCGAAUUUGUUUU
AUAC
U A G CUUU
AAGGACAAAUUCGGUUCUAGAG
AGGU
UU
GUGUGG5' 3'
�-
1.5
�-
0.5
0.5
1.5
2.5
*
�- 0.5
0.5
1.5
2.5
++
Dmel Dsim Dsec Dyak Dere Dana Dpse Dper Dwil Dmoj Dvir Dgri
ACAAAUUCGGAAGAUAAACAGGAAACAAAUUCGGAAGAUAAACAGGAAACAAAUUCGGAAGAUAAACAGGAAACAAAUUCGGAAUAUAAACAGGAAACAAAUUCGGAAGAUAAACAGGAAACAAAUUCGGAAGCUAAACAGGAAACAAAUUCGGAAGUCAAACAGGAAACAAAUUCGGAAGUCAAACAGGAAACAAAUUCGGAAAACAAACAGGGAACAAAUUCGGAGAUGAAACAGGGAACAAAUUCGGAGGAUAAACAGGAAACAAAUUCGGAGGAC-AACAGGAA*********** ****** *
AAAAAAAAAAAAAAAAGAGAAAAA *
AGAUAAAGAUAAAGAUAAAUAUAAAGAUAAAGCUAAAGUCAAAGUCAAAAACAAGAUGAAGGAUAAGGAC-A *
AGAUAA AAACAAAUUCGGA ACAGG
UGUUUAAGCCU UGUCC AGA CA
CGACCUCUCACC-AUCGAAUUUACGACCUCUCACC-AUCGAAUUUACGACCUCUCACC-AUCGAAUUUACGACCUCUCACC-AUCGAAUUUACGACCUCUCACC-AUCGAAUUUACGACCUCUCACC-AUCGAAUUUACAACCUCUCAGC-AUCGAAUUUACAACCUCUCAGC-AUCGAAUUUACGACCUCUCAAU-AUCGAAUUUACGACCUCUCAGC-AUCGAAUUUACGACCUCUCAGU-AUCGAAUUUA
Dmel Dsim Dsec Dyak Dere Dana Dpse Dper Dwil Dmoj Dvir Dgri CGACCUCUCAGC-AUCGAAUUUA ********** **********
UUGGAGAG UGGCUUAAAU AUCU C
C ACC A GACCUCUC AUCGAAUUU
Dmel Dsim Dsec Dyak Dere Dana Dpse Dper Dwil Dmoj Dvir Dgri
UAACUUAAAUAUAAAUAGAAUUUGUAACUUAAAUAUAAAUAGAAUUUGUAACUUAAAUAUAAAUAGAAUUUGUAACUUAAAUAUAAAUAGAAUUUGUAACUUAAAUAUAAAUAGAAUUUGUAACUUUAAUAUAAAUAGAAUUUGUAACUUAAAUAUAAAUAGAAUUUGUAACUUAAAUAUAAAUAGAAUUUGUAACUUUAAACUAAAUAGAAUUUGUAACUUAAAUAUAAAUAGAAUUUGUAACUUAAAUAUAAAUAGAAUUUGUAACUUAAAUAUAAAUAGAAUUUG****** ** *************
AAAAAAAAAAAAAAAUAAAAAAAAUAAAAAAAAAAA **
AUAAUAAUAAUAAUAAUAAUAAUAAUAAUAAUAAUA***
UUUUUUUUUUUU*
UUUUUUUUUUUU*
U AAA U AUA AACUU UA AA GAAUUUG
UUGGA AU UU CUUAAAC U GAG C GG
miR-10* -> Abd-B miR-10* -> Ubx miR-10 -> Scr
CCACGUCUACCCUGUAGAUCCGAAUUUGUUUUAUACUAGCUUUAAGGACAAAUUCGGUUCUAGAGAGGUUUGUGUGG(((((...(((((.((((.(((((((((((((............))))))))))))).)))).)).)))...)))))
miR-10 miR-10*
167 181
miR-10miR-10*0
200400600800
10001200140016001800