systematic discovery of uncharacterized ... -...
TRANSCRIPT

General rights Copyright and moral rights for the publications made accessible in the public portal are retained by the authors and/or other copyright owners and it is a condition of accessing publications that users recognise and abide by the legal requirements associated with these rights.
• Users may download and print one copy of any publication from the public portal for the purpose of private study or research. • You may not further distribute the material or use it for any profit-making activity or commercial gain • You may freely distribute the URL identifying the publication in the public portal
If you believe that this document breaches copyright please contact us providing details, and we will remove access to the work immediately and investigate your claim.
Downloaded from orbit.dtu.dk on: Sep 15, 2018
Systematic discovery of uncharacterized transcription factors in Escherichia coli K-12MG1655
Gao, Ye; Yurkovich, James T.; Seo, Sang Woo; Kabimoldayev, Ilyas; Dräger, Andreas; Chen, Ke; Sastry,Anand V.; Fang, Xin; Mih, Nathan; Yang, Laurence; Eichner, Johannes; Cho, Byung-Kwan; Kim,Donghyuk; Palsson, BernhardPublished in:Nucleic Acids Research
Link to article, DOI:10.1093/nar/gky752
Publication date:2018
Document VersionPeer reviewed version
Link back to DTU Orbit
Citation (APA):Gao, Y., Yurkovich, J. T., Seo, S. W., Kabimoldayev, I., Dräger, A., Chen, K., ... Palsson, B. O. (2018).Systematic discovery of uncharacterized transcription factors in Escherichia coli K-12 MG1655. Nucleic AcidsResearch, [gky752]. DOI: 10.1093/nar/gky752
Nucleic Acids Research, 2018 1doi: 10.1093/nar/gky752
Systematic discovery of uncharacterized transcriptionfactors in Escherichia coli K-12 MG1655Ye Gao1,2, James T. Yurkovich2,3, Sang Woo Seo4, Ilyas Kabimoldayev5, Andreas Drager6,7,Ke Chen2, Anand V. Sastry2, Xin Fang2, Nathan Mih2,3, Laurence Yang2, Johannes Eichner6,Byung-Kwan Cho8,9, Donghyuk Kim5,10,11,* and Bernhard O. Palsson2,3,8,12,*
1Division of Biological Sciences, University of California, San Diego, La Jolla, CA 92093, USA, 2Department ofBioengineering, University of California San Diego, La Jolla, CA 92093, USA, 3Bioinformatics and Systems BiologyProgram, University of California San Diego, La Jolla, CA 92093, USA, 4School of Chemical and BiologicalEngineering, Seoul National University, Seoul, Republic of Korea, 5Department of Genetic Engineering and GraduateSchool of Biotechnology, College of Life Sciences, Kyung Hee University, Yongin, Republic of Korea, 6ComputationalSystems Biology of Infection and Antimicrobial-Resistant Pathogens, Center for Bioinformatics Tubingen (ZBIT),72076 Tubingen, Germany, 7Department of Computer Science, University of Tubingen, 72076 Tubingen, Germany,8Novo Nordisk Foundation Center for Biosustainability, 2800 Kongens Lyngby, Denmark, 9Department of BiologicalSciences, Korea Advanced Institute of Science and Technology, Daejeon 34141, Republic of Korea, 10School ofEnergy and Chemical Engineering, Ulsan National Institute of Science and Technology (UNIST), Ulsan, Republic ofKorea, 11School of Biological Sciences, Ulsan National Institute of Science and Technology (UNIST), Ulsan, Republicof Korea and 12Department of Pediatrics, University of California, San Diego, La Jolla, CA 92093, USA
Received April 13, 2018; Revised July 11, 2018; Editorial Decision August 07, 2018; Accepted August 08, 2018
ABSTRACT
Transcriptional regulation enables cells to respondto environmental changes. Of the estimated 304 can-didate transcription factors (TFs) in Escherichia coliK-12 MG1655, 185 have been experimentally iden-tified, but ChIP methods have been used to fullycharacterize only a few dozen. Identifying these re-maining TFs is key to improving our knowledge ofthe E. coli transcriptional regulatory network (TRN).Here, we developed an integrated workflow for thecomputational prediction and comprehensive exper-imental validation of TFs using a suite of genome-wide experiments. We applied this workflow to (i)identify 16 candidate TFs from over a hundred un-characterized genes; (ii) capture a total of 255 DNAbinding peaks for ten candidate TFs resulting in sixhigh-confidence binding motifs; (iii) reconstruct theregulons of these ten TFs by determining gene ex-pression changes upon deletion of each TF and (iv)identify the regulatory roles of three TFs (YiaJ, YdcI,and YeiE) as regulators of L-ascorbate utilization, pro-ton transfer and acetate metabolism, and iron home-ostasis under iron-limited conditions, respectively.Together, these results demonstrate how this work-
flow can be used to discover, characterize, and eluci-date regulatory functions of uncharacterized TFs inparallel.
INTRODUCTION
Transcription factors (TFs) modulate gene expression in re-sponse to environmental perturbations by interacting witha combination of sigma factors, RNA polymerase (RNAP),activating metabolites, and inorganic compounds. Thesesignals collectively lead TFs to bind to specific DNA se-quences referred to as binding sequence motifs (1). Mi-croorganisms, therefore, can quickly adapt to diverse andextreme environmental conditions. In transcriptional regu-lation, genes are indirectly or directly regulated by one ormore TFs. A set of genes directly controlled by the sameTF are considered to belong to a regulon (2), with the com-plete set of regulons forming the transcriptional regulatorynetwork (TRN).
Databases such as EcoCyc (3,4), RegulonDB (5), andTEC (6) maintain large amounts of information about TFs.However, a complete TRN for individual organisms stilldoes not exist due to challenges outlined below.
Identifying all TFs
The genome-scale annotation of genes is required for theidentification of the complete set of TFs. The emergence of
*To whom correspondence should be addressed. Tel: +1 858 246 1625; Fax: +1 858 822 3120; Email: [email protected] may also be addressed to Donghyuk Kim. Tel: +82 52 217 2945; Fax: +82 52 217 3009; Email: [email protected]
C© The Author(s) 2018. Published by Oxford University Press on behalf of Nucleic Acids Research.This is an Open Access article distributed under the terms of the Creative Commons Attribution Non-Commercial License(http://creativecommons.org/licenses/by-nc/4.0/), which permits non-commercial re-use, distribution, and reproduction in any medium, provided the original workis properly cited. For commercial re-use, please contact [email protected]
Downloaded from https://academic.oup.com/nar/advance-article-abstract/doi/10.1093/nar/gky752/5078243by DTU Library - Technical Information Center of Denmark useron 03 September 2018
2 Nucleic Acids Research, 2018
high-throughput DNA sequencing has created a large num-ber of candidate protein-encoding DNA sequences, lead-ing to an increased demand for the discovery and annota-tion of protein functions. However, assigning a physiolog-ical function to the sequenced but uncharacterized genesis still a substantial challenge (7,8). For example, althoughEscherichia coli K-12 MG1655 has one of the most widely-studied genomes, a functional annotation is still missing forapproximately 30% of its genes (9). This lack of annota-tion includes an estimated 50–80 uncharacterized TFs inE. coli K-12 MG1655 (6). The percentage of uncharacter-ized genes in other strains is even higher. Thus, a new work-flow is needed to predict and validate a complete set of TFsin prokaryotes.
Characterizing transcription factor binding sites (TFBS)
Genome-wide characterization of TFBS is essential forthe reconstruction of a global TRN. Despite a significantamount of knowledge about microbial TFs in databases andthe literature, the binding activities of many TFs remain tobe discovered. Traditionally, TFBS are identified throughapproaches such as DNase I footprinting and electromobil-ity shift assays, which are limited to the interactions betweenTFs and single targets (10). With advances in genome-wideresearch technologies, many TFs have been experimentallyinvestigated using the systematic evolution of ligands byexponential enrichment (SELEX) and chromatin immuno-precipitation with microarray (ChIP-chip) or by sequencing(ChIP-seq) (6,11–16). Recently, the ChIP-seq protocol hasbeen combined with an exonuclease treatment (ChIP-exo)to reflect in vivo regulatory interactions between TFs andtarget genes at a single-base-pair resolution (17). Moreover,ChIP-exo can be easily applied to investigate differentialbinding patterns of the same TF under different environ-mental conditions (18–20). Thus, ChIP-exo provides us witha robust approach to characterize TFBS at the genome-scale.
Reconstructing TRNs
Several computational approaches have been developed forthe reconstruction of the TRN, including the use of geneexpression data (21,22), regulon-based associations (23),and integrated analysis with metabolic models (24). Theexpression data-driven approach for TRN reconstructionwas widely used to predict transcription factor activitiesin E. coli K-12 MG1655. Recently, we have supplementedChIP-exo with transcription profiling to describe the reg-ulons of major TFs, including Cra, ArgR, Fur, OxyR,SoxRS, OmpR, and GadEWX (20,25–29). Therefore, thiswell-described approach is successfully applied to TRN re-construction.
Here, we address these three challenges through the devel-opment of an integrated computational and experimentalworkflow to discover uncharacterized TFs in prokaryotes.Using E. coli K-12 MG1655 as an example, we combined apreviously published computational approach with biolog-ical knowledge to identify candidate TFs for experimentalvalidation. Given the resulting list of candidate TFs, we thenexamined their DNA-binding domains, predicted their ac-
tive conditions, and performed an in vivo experimental val-idation of predicted DNA-binding capabilities. This work-flow resulted in the elucidation of the biological functions ofthree uncharacterized TFs (YiaJ, YdcI, and YeiE) throughan in-depth analysis of mutant phenotypes. Together, theseresults demonstrate the utility of our systematic identifica-tion workflow and provide a roadmap for its use in otherorganisms.
MATERIALS AND METHODS
Identification of candidate TFs
This workflow combined the previously published machine-learning algorithm, TFpredict, with biological knowledgeto identify candidate TFs for experimental validation. TF-predict was originally trained to predict whether a eukary-otic protein was a TF (30). In brief, this algorithm takes aprotein sequence as input and outputs a quantified score inthe range [0,1] that represents the likelihood of the proteinbeing a TF, based on sequence homology; zero is unlikely,one is very likely. In this study, TFpredict was applied topredict candidate TFs in E. coli K-12 MG1655. To assesswhether the algorithm translates well from the eukaryoticrealm to bacteria, the data from the proteobacteria werecompiled for training. The details about the training dataare described below.
The proteobacteria protein sequences in UniProt werefiltered to meet the following criteria (31): (i) the proteinsequences have functional annotation for DNA-binding;(ii) the proteins were reviewed as non-hypothetical; (iii) theproteins were annotated by Gene Ontology (GO) term asbeing related to the regulation of transcription or nucleicacid binding transcription factor activity (32) and (iv) theproteins were filtered out to exclude any protein sequencesthat were annotated with non-TF keywords: kinase, ubiq-uitin, actin, antigen, biotin, histone, chaperone, tubulin,transmembrane protein, endonuclease, exonuclease, trans-lation initiation factor (Supplementary Figure S1). TFpre-dict was trained to rank order the candidate TFs. To evalu-ate whether the algorithm generalizes from eukaryotes toprokaryotes, model accuracy was rigorously assessed bycross-validation (Supplementary Figures S2 and S3). Theresults from the proteobacteria training set were compa-rable to those obtained from the eukaryotic training set,with a slight decrease in the area under the curve (AUC)due to the much smaller size of training data used. Thelarge eukaryotic training sets result in similar predictionperformance for all validated machine learning approaches.Hence, it is sufficient to choose the output of either ap-proach. For the proteobacteria training set, performancevaried. Instead of choosing one of approaches, we used aconsensus of the output from all of the available approachesto make the final prediction.
Additionally, the memory and run-time efficiency forTFpredict were improved, and all code and data havebeen made freely available on GitHub (https://github.com/draeger-lab/TFpredict/tree/prokaryote). The example sec-tion in the README summarizes the settings we usedto execute TFpredict. Documentation and installation in-structions are provided on the GitHub page.
Downloaded from https://academic.oup.com/nar/advance-article-abstract/doi/10.1093/nar/gky752/5078243by DTU Library - Technical Information Center of Denmark useron 03 September 2018
Nucleic Acids Research, 2018 3
The uncharacterized protein sequences of E. coli K-12MG1655 were the input data for TFpredict. The outputfrom TFpredict was a rank-ordered list of proteins withconfidence scores; some sequences could not be assigned aconfidence score due to a lack of homologs. The primary se-lection was made based on the confidence scores from TF-predict. Next, further classification of the primary selectionwas made based on the predicted interactions between can-didates and DNA sequences. This process not only removedsome false positives but also provided group-specific strate-gies to predict the experimental conditions for ChIP-exo.Finally, an initial subset of 16 candidates was selected forexperimental validation.
Bacterial strains, media, and growth conditions
All strains used in this study are E. coli K-12 MG1655and its derivatives, deletion strains and myc-tagged strains(Dataset S2). For ChIP-exo experiments, the E. coli strainsharboring 8-myc were generated by a � red-mediated site-specific recombination system targeting the C-terminal re-gion as described previously (33). For expression profil-ing by RNA-seq, deletion strains ΔydcI, ΔyeiE, ΔyafC,ΔyiaJ, ΔyheO, ΔybaO, ΔybaQ, ΔybiH, ΔyddM and ΔyiePwere also constructed by a � red-mediated site-specific re-combination system (34). For ChIP-exo experiments, glyc-erol stocks of E. coli strains were inoculated into M9minimal media (47.8 mM Na2HPO4, 22 mM KH2PO4,8.6 mM NaCl, 18.7 mM NH4Cl, 2 mM MgSO4 and0.1 mM CaCl2) with 0.2% (w/v) glucose. M9 minimal me-dia was also supplemented with 1 mL trace element solu-tion (100×) containing 1 g EDTA, 29 mg ZnSO4.7H2O, 198mg MnCl2.4H2O, 254 mg CoCl2.6H2O, 13.4 mg CuCl2 and147 mg CaCl2. The culture was incubated at 37◦C overnightwith agitation and then was used to inoculate the fresh me-dia (1/200 dilution). The volume of the fresh media was 150ml for each biological replicate. The fresh culture was incu-bated at 37◦C with agitation to the mid-log phase (OD600 ≈0.5). For RNA-seq expression profiling, glycerol stocks ofE. coli strains were inoculated into M9 minimal media withthe same carbon sources as used in the ChIP-exo experimentfor each candidate TF. The concentration of carbon sourceswas 0.2% (w/v). M9 minimal media was also supplementedwith 1 ml trace element solution (100×). The culture wasincubated at 37◦C overnight with agitation and then wasused to inoculate the fresh media. The fresh culture was in-cubated at 37◦C with agitation to the mid-log phase (OD600≈ 0.5).
Measurement of bacterial growth
The effects of iron-limited conditions on cell growth wereexamined by growing E. coli K-12 MG1655 and yeiE dele-tion strain under four media treatments: (i) M9 minimalglucose medium; (ii) M9 minimal glucose medium con-taining 0.2 mM of the iron chelating agent 2,2′-dipyridyl(DPD) (Fluka); (iii) M9 minimal glucose medium contain-ing 0.3 mM of DPD; (iv) M9 minimal glucose medium con-taining 0.4 mM DPD. Cells grown overnight on M9 mini-mal glucose medium at 37◦C with agitation were inoculatedinto these four kinds of fresh media. Aliquots of overnight
cell culture were diluted 1:200 into four types of fresh me-dia, then were incubated at 37◦C with agitation.
Similarly, to measure growth rate on low pH or acetatemedium, the culture was incubated at low pH or acetatemedium at 37◦C overnight with agitation and then was usedto inoculate the fresh media (1/200 dilution). The volume ofthe fresh media was 150 ml. The fresh culture was incubatedat 37◦C with agitation.
To measure growth on L-ascorbate, cells were grownanaerobically in medium containing L-ascorbate as de-scribed by the literature (35). Briefly, E. coli strains weregrown overnight on M9 minimal glucose medium, and thecells were suspended in M9 salts medium. The aliquots wereadjusted to 1.0, and 100 �L aliquots were inoculated into10 ml culture tubes (Fisher Scientific) that were filled tothe top with M9 minimal medium with a concentration of20 mM L-ascorbate. Then the culture tubes were capped,sealed with parafilm, and then incubated at 37◦C. All ofgrowth curves were measured by six independent experi-ments at least and recorded by OD600 using Thermo BIO-MATE 3S UV-visible spectrophotometer. The growth ratewas calculated with GrowthRates 2.0 (36). The significantdifference between wild type and deletion strain was deter-mined by the Student’s t test, P < 0.01.
ChIP-exo experiment
ChIP-exo experimentation was performed following theprocedures previously described (37). In brief, to iden-tify each candidate TF binding maps in vivo, the DNAbound to each candidate TF from formaldehyde cross-linked E. coli cells were isolated by chromatin immunopre-cipitation (ChIP) with the specific antibodies that specif-ically recognize myc tag (9E10, Santa Cruz Biotechnol-ogy), and Dynabeads Pan Mouse IgG magnetic beads(Invitrogen) followed by stringent washings as describedpreviously (38). ChIP materials (chromatin-beads) wereused to perform on-bead enzymatic reactions of the ChIP-exo method (17). Briefly, the sheared DNA of chromatin-beads was repaired by the NEBNext End Repair Mod-ule (New England Biolabs) followed by the addition of asingle dA overhang and ligation of the first adaptor (5′-phosphorylated) using dA-Tailing Module (New EnglandBiolabs) and NEBNext Quick Ligation Module (New Eng-land Biolabs), respectively. Nick repair was performed byusing PreCR Repair Mix (New England Biolabs). Lambdaexonuclease- and RecJf exonuclease-treated chromatin waseluted from the beads and overnight incubation at 65◦C re-versed the protein-DNA cross-link. RNAs- and Proteins-removed DNA samples were used to perform primer ex-tension and second adaptor ligation with following mod-ifications. The DNA samples incubated for primer exten-sion as described previously were treated with dA-TailingModule (New England Biolabs) and NEBNext Quick Lig-ation Module (New England Biolabs) for second adaptorligation. The DNA sample purified by GeneRead Size Se-lection Kit (Qiagen) was enriched by polymerase chain reac-tion (PCR) using Phusion High-Fidelity DNA Polymerase(New England Biolabs). The amplified DNA samples werepurified again by GeneRead Size Selection Kit (Qiagen)and quantified using Qubit dsDNA HS Assay Kit (Life
Downloaded from https://academic.oup.com/nar/advance-article-abstract/doi/10.1093/nar/gky752/5078243by DTU Library - Technical Information Center of Denmark useron 03 September 2018

4 Nucleic Acids Research, 2018
Technologies). Quality of the DNA sample was checked byrunning Agilent High Sensitivity DNA Kit using Agilent2100 Bioanalyzer (Agilent) before sequenced using HiSeq2500 (Illumina) following the manufacturer’s instructions.The antibody (NT63, Biolegend) that specifically recognizeRNA polymerase � was used to conduct the ChIP-exo ex-periment to detect the binding sites of RNA polymerase inE. coli K-12 MG1655. Each modified step was also per-formed following the manufacturer’s instructions. ChIP-exoexperiments were performed in biological duplicate.
RNA-seq expression profiling
Three milliliters of cells from mid-log phase culture weremixed with 6 ml RNAprotect Bacteria Reagent (Qiagen).Samples were mixed immediately by vortexing for 5 s, incu-bated for 5 min at room temperature, and then centrifugedat 5000g for 10 min. The supernatant was decanted andany residual supernatant was removed by inverting the tubeonce onto a paper towel. Total RNA samples were then iso-lated using RNeasy Plus Mini kit (Qiagen) following themanufacturer’s instruction. Samples were then quantifiedusing a NanoDrop 1000 spectrophotometer (Thermo Sci-entific) and quality of the isolated RNA was checked byrunning RNA 6000 Pico Kit using Agilent 2100 Bioanalyzer(Agilent). Paired-end, strand-specific RNA-seq library wasprepared using KAPA RNA Hyper Prep kit (KAPA Biosys-tems), following the instruction (39,40). Resulting librarieswere analyzed on an Agilent Bioanalyzer DNA 1000 chip(Agilent). Sequencing was performed on a Hiseq 2500 se-quencer at the Genomics Core facility of University of Cal-ifornia, San Diego.
Peak calling for ChIP-exo dataset
Peak calling was performed as previously described (37). Se-quence reads generated from ChIP-exo were mapped ontothe reference genome (NC 000913.2) using bowtie with de-fault options to generate SAM output files (Dataset S3)(41). MACE program was used to define peak candidatesfrom biological duplicates for each experimental condi-tion with sequence depth normalization (42). To reducefalse-positive peaks, peaks with signal-to-noise (S/N) ra-tio <1.5 were removed. The noise level was set to the top5% of signals at genomic positions because top 5% makesa background level in a plateau and top 5% intensitiesfrom each ChIP-exo replicates across conditions correlatewell with the total number of reads (37,43,44). The calcu-lation of S/N ratio resembles the way to calculate ChIP-chip peak intensity where IP signal was divided by Mocksignal. Then, each peak was assigned to the nearest gene.Genome-scale data were visualized using MetaScope (http://systemsbiology.ucsd.edu/Downloads/MetaScope).
Motif search from ChIP-exo peaks
The sequence motif analysis for TFs and �-factors was per-formed using the MEME software suite (45). For YdcI,YbiH, YbaQ, YeiE, YddM and YieP, sequences in bind-ing regions were extracted from the reference sequence(NC 000913.2).
Calculation of differentially expressed gene
Sequence reads generated from RNA-seq were mappedonto the reference genome (NC 000913.2) using bowtiewith the maximum insert size of 1000 bp, and two maximummismatches after trimming 3 bp at 3′ ends (Dataset S4) (41).SAM files generated from bowtie were then used for Cuf-flinks (http://cufflinks.cbcb.umd.edu) to calculate fragmentsper kilobase of exon per million fragments (FPKM) (46).Cufflinks was run with default options with the library typeof dUTP RNA-seq and the default normalization method(classic-fpkm). Expression with log2 fold change ≥ log2(1.5)and q-value ≤ 0.05 or log2fold change ≤ –log2(1.5) andq-value ≤ 0.05 was considered as differentially expressed.Genome-scale data were visualized using MetaScope.
COG functional enrichment
The regulons were categorized according to their annotatedclusters of orthologous groups (COG) category (47). Func-tional enrichment of COG categories in the target geneswas determined by performing a hypergeometric test, andP-value < 0.05 was considered significant.
Structural analysis of candidate TFs
Homology models of the candidate transcription factorsYdcI, YeiE and YiaJ were constructed using the SWISS-MODEL pipeline, which also carries out a prediction ofthe oligomeric state of the enzyme (48). Multiple templateswere analyzed, and inference of the oligomeric state wasbased on the reported interface conservation scores to ex-isting complexes of similar sequence identity. The structureswere annotated using information in UniProt (31) and visu-alized with VMD (49).
Phylogenetic tree analysis
The homolog sequences of candidate TF YdcI acrosscommon Gram-negative strains were searched in NCBIdatabases, to show the shared origin of them. The phylo-genetic tree (neighbor-joining without distance corrections)was generated by MUSCLE (50).
RESULTS
Establishing a workflow to discover uncharacterized tran-scription factors
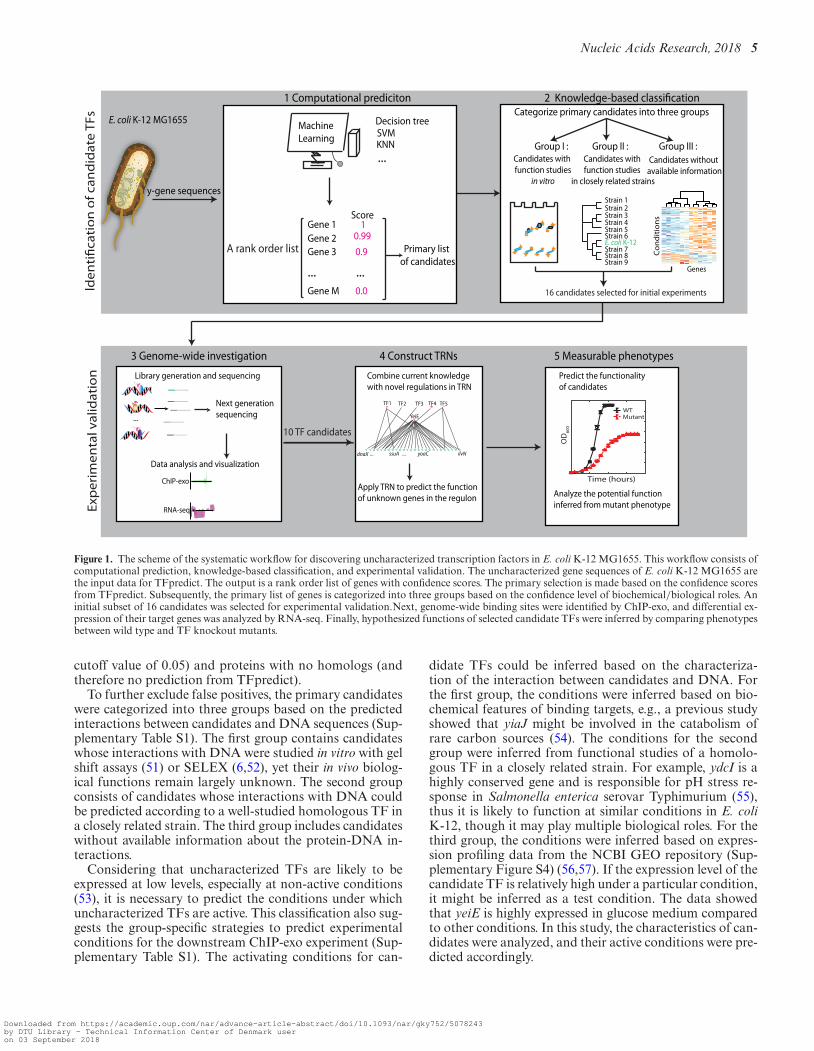
This workflow consisted of computational prediction,knowledge-based classification, and experimental valida-tion of candidate TFs at the genome-scale (Figure 1). TF-predict is a machine learning algorithm that uses sequencehomology to predict whether a given protein is a TF (30).The uncharacterized protein sequences in E. coli K-12MG1655 were evaluated using the model trained by TF-predict with the data from the proteobacteria (see Materi-als and Methods). The output from TFpredict was a rank-ordered list of uncharacterized candidates based on the like-lihood of their being a TF (Dataset S1). The initial outputfrom TFpredict was reduced down to 474 primary candi-dates by excluding the lowest confidence scores (arbitrary
Downloaded from https://academic.oup.com/nar/advance-article-abstract/doi/10.1093/nar/gky752/5078243by DTU Library - Technical Information Center of Denmark useron 03 September 2018
Nucleic Acids Research, 2018 5
lden
tific
atio
n of
can
did
ate
TFs
Exp
erim
enta
l val
idat
ion
E. coli K-12 MG1655Categorize primary candidates into three groups
Group I : Group II : Group III :
Con
dit
ion
s
Genes
Candidates with function studies
in vitro
Candidates with function studies
in closely related strains
Candidates without available information
16 candidates selected for initial experiments
10 TF candidates
Predict the functionality of candidates
Library generation and sequencing
Data analysis and visualization
Analyze the potential function inferred from mutant phenotype
1 Computational prediciton 2 Knowledge-based classification
Decision tree
KNN
WTMutant
Time (hours)
OD
600
3 Genome-wide investigation 4 Construct TRNs 5 Measurable phenotypes
Strain 1Strain 2Strain 3Strain 4Strain 5Strain 6E. coli K-12 Strain 7Strain 8Strain 9
ChIP-exo
RNA-seq
...
Next generationsequencing
Combine current knowledge with novel regulations in TRN
Apply TRN to predict the function of unknown genes in the regulon
YeiE
TF1 TF2 TF3 TF4 TF5
dnaX ilvNssuA... ... yoaC
SVM
...
A rank order list
Gene 1Gene 2Gene 3
Gene M
...
Score1
0.990.9
0.0
...
Primary list of candidates
MachineLearning
y-gene sequences
Figure 1. The scheme of the systematic workflow for discovering uncharacterized transcription factors in E. coli K-12 MG1655. This workflow consists ofcomputational prediction, knowledge-based classification, and experimental validation. The uncharacterized gene sequences of E. coli K-12 MG1655 arethe input data for TFpredict. The output is a rank order list of genes with confidence scores. The primary selection is made based on the confidence scoresfrom TFpredict. Subsequently, the primary list of genes is categorized into three groups based on the confidence level of biochemical/biological roles. Aninitial subset of 16 candidates was selected for experimental validation.Next, genome-wide binding sites were identified by ChIP-exo, and differential ex-pression of their target genes was analyzed by RNA-seq. Finally, hypothesized functions of selected candidate TFs were inferred by comparing phenotypesbetween wild type and TF knockout mutants.
cutoff value of 0.05) and proteins with no homologs (andtherefore no prediction from TFpredict).
To further exclude false positives, the primary candidateswere categorized into three groups based on the predictedinteractions between candidates and DNA sequences (Sup-plementary Table S1). The first group contains candidateswhose interactions with DNA were studied in vitro with gelshift assays (51) or SELEX (6,52), yet their in vivo biolog-ical functions remain largely unknown. The second groupconsists of candidates whose interactions with DNA couldbe predicted according to a well-studied homologous TF ina closely related strain. The third group includes candidateswithout available information about the protein-DNA in-teractions.
Considering that uncharacterized TFs are likely to beexpressed at low levels, especially at non-active conditions(53), it is necessary to predict the conditions under whichuncharacterized TFs are active. This classification also sug-gests the group-specific strategies to predict experimentalconditions for the downstream ChIP-exo experiment (Sup-plementary Table S1). The activating conditions for can-
didate TFs could be inferred based on the characteriza-tion of the interaction between candidates and DNA. Forthe first group, the conditions were inferred based on bio-chemical features of binding targets, e.g., a previous studyshowed that yiaJ might be involved in the catabolism ofrare carbon sources (54). The conditions for the secondgroup were inferred from functional studies of a homolo-gous TF in a closely related strain. For example, ydcI is ahighly conserved gene and is responsible for pH stress re-sponse in Salmonella enterica serovar Typhimurium (55),thus it is likely to function at similar conditions in E. coliK-12, though it may play multiple biological roles. For thethird group, the conditions were inferred based on expres-sion profiling data from the NCBI GEO repository (Sup-plementary Figure S4) (56,57). If the expression level of thecandidate TF is relatively high under a particular condition,it might be inferred as a test condition. The data showedthat yeiE is highly expressed in glucose medium comparedto other conditions. In this study, the characteristics of can-didates were analyzed, and their active conditions were pre-dicted accordingly.
Downloaded from https://academic.oup.com/nar/advance-article-abstract/doi/10.1093/nar/gky752/5078243by DTU Library - Technical Information Center of Denmark useron 03 September 2018

6 Nucleic Acids Research, 2018
To prioritize the candidate TFs for experimental valida-tion, an initial subset of 16 candidates was chosen fromthree groups (Table 1). Next, to examine whether selectedcandidates have DNA-binding peaks at the genome-scale,ChIP-exo experiments were conducted at predicted con-ditions. For those candidates having DNA-binding sites,the expression profiles upon deletion of each TF were fur-ther investigated. Combining DNA bindings from ChIP-exo with gene expression, the hypotheses for the regulatoryfunctions of candidate TFs were formed. To further testthe hypotheses, mutant phenotypes were measured and thenanalyzed under active conditions (Figure 1).
Capturing a genome-wide distribution of uncharacterizedtranscription factors (TFs)
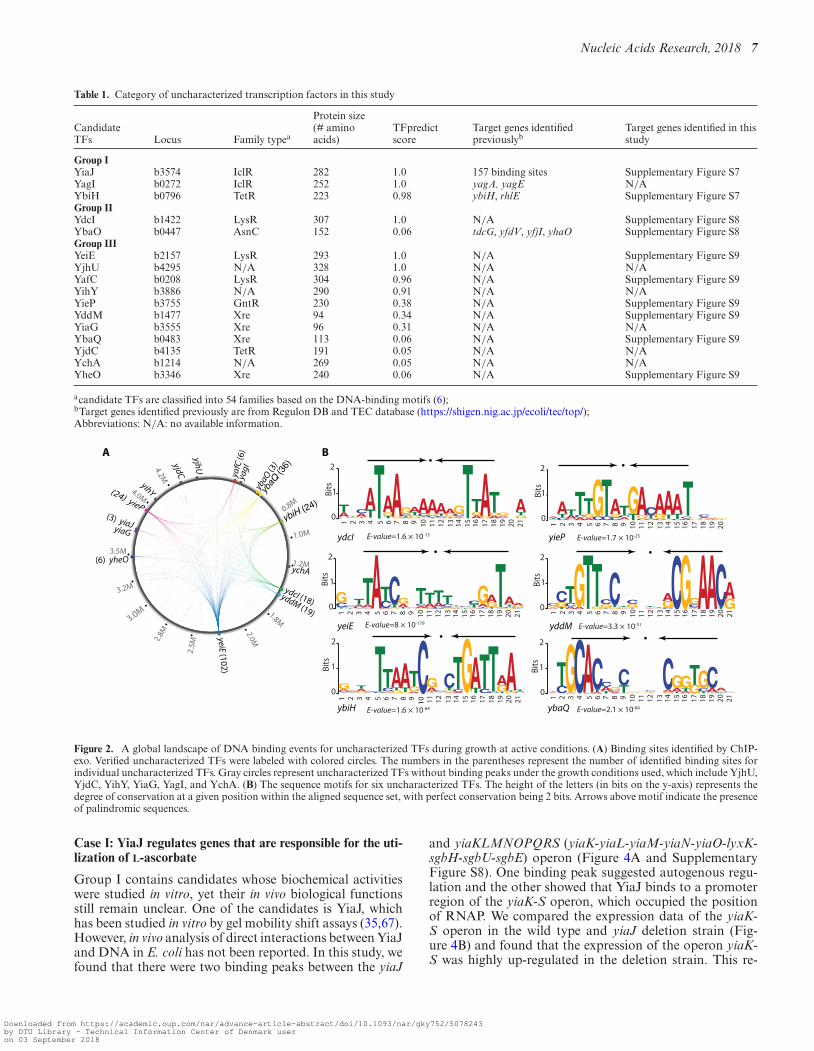
To validate the in silico predictions of candidate TFs, theChIP-exo experiment was employed to determine the in vivogenome-wide DNA-binding events of each candidate dur-ing growth under active conditions. The global binding pro-files for all candidates were examined using the peak callingalgorithm MACE (58) and confirmed that 10 out of 16 wereDNA-binding proteins (Figure 2A). A total of 255 repro-ducible binding peaks were identified for 241 unique bind-ing sites (Dataset S5). Of the six unconfirmed candidates,YagI and YjhU had high confidence scores (score > 0.8).Therefore, it is possible that these proteins are TFs, but arenot active under the basal condition used here.
Compared to known global TFs, these ten uncharacter-ized TFs exhibit some interesting regulatory features. First,they have more intragenic binding peaks and fewer peaks lo-cated within putative regulatory regions. The binding sitesfrom these confirmed TFs showed that only 41% (98 of 241)were located in putative regulatory regions (promoters and5′-proximal to coding regions). Second, individual unchar-acterized TFs had fewer binding peaks than those of globalTFs such as CRP, Lrp, Fnr, and ArcA (12,59,60). Most ofthe uncharacterized TFs have 3–25 binding sites under ac-tive conditions, while global TFs in E. coli usually have morethan 40 binding sites. Third, the uncharacterized TFs bindto more genes with putative functions (Supplementary Fig-ure S5). Finally, the average expression level of these un-characterized TFs is relatively lower than the majority ofglobal TFs. These observations are consistent with the pre-vious study showing that TF position in the TRN hierarchynetwork is correlated with its expression levels, its numberof target genes, and its scope of regulatory function (61).TFs in the top hierarchy usually have high protein concen-tration in the cell, and regulate a significant number of genesof diverse functions. On the contrary, these candidate TFsare likely located in the lower levels of the E. coli hierar-chical TRN, and may regulate local specific physiologicalfunctions instead of broad biological roles.
Next, for six of the ten confirmed TFs, the conservedbinding motifs were further analyzed using the MEME al-gorithm (E-value < 10−10) (Figure 2B) (62). Interestingly,the consensus binding motifs were palindromic, suggestinga dimeric protein conformation. Specifically, the transcrip-tional factor binding sites (TFBS) of YdcI and YbiH en-close AT-rich inverted repeats separated by 7-nt. This find-ing is consistent with the structural predictions (Supple-
mentary Table S2 and Supplementary Figure S6) that thesecandidate TFs likely form homodimers or tetramers, whichfacilitate tight binding to DNA molecules in the cell.
Interactions between uncharacterized TFs and RNA poly-merase (RNAP)
A transcriptional repressor down-regulates transcription bysteric exclusion of RNAP from the promoter regions. To de-termine the interaction between the uncharacterized TFsand RNAP, the binding sites of the uncharacterized TFswere compared with the –10 and –35 promoter elements oc-cupied by RNAP. Three interaction modes were observedbased on their relative location: (i) downstream (D): TFbinds downstream of the –10 and –35 promoter region (Fig-ure 3A); (ii) upstream (U): TF binds upstream of the –10and –35 promoter region (Figure 3B) and (iii) overlap (O):TF binding site coincides with the –10 and –35 promoterregion (Figure 3C). To further illustrate how different TF-RNAP interaction modes may affect TF function, the regu-latory effects on the target genes were characterized by theirdifferential expression in �TF strain with respect to WT.
To demonstrate how binding sites of uncharacterized TFsinteract with RNAP in vivo, four candidate TFs (YeiE,YieP, YiaJ, YafC) were used as representatives, since theyshowed a large number of binding sites. The most com-mon binding mode for these transcription factors is down-stream of the RNAP binding region. This binding modecommonly results in the repression of the target gene (13/19or 68%). For example, YeiE represses and binds down-stream of the RNAP binding region of the gene dcuC (Fig-ure 3A). However, the upstream binding mode is more com-monly activated, as shown by yoaC (Figure 3B). Three ofthe four binding sites that overlap with the RNAP bind-ing location lead to the repression of the target genes serC,yceA, and putA (Figure 3C). Genes having upstream, down-stream, or overlap modes from these four representativesmentioned earlier were determined (Figure 3D). This datasuggested that transcriptional regulation by uncharacter-ized TFs are likely mediated by using steric exclusion mech-anisms, though this pattern is not always true, as in gltF,rpmI, ilvN, and htpG. It is possible that other TFs are in-volved in the regulation of these target genes (Supplemen-tary Figure S7) (63–66). Together, these data demonstratedthat different sets of uncharacterized TFs have similar regu-latory mechanisms, though they may have different biolog-ical functions.
To confirm the regulatory roles of candidate TFs, threeof ten candidates identified by ChIP-exo (YiaJ, YdcI, YeiE)from three different groups were selected for further analy-sis, respectively. These three case studies illustrate how ex-perimental observations from ChIP-exo and RNA-seq canbe used to infer regulatory functions of a candidate TF. Thebinding sites of YiaJ and YdcI directly indicated their po-tential functions, so mutant phenotypes were used to val-idate biological roles. The genome-wide binding sites forYeiE showed that it is involved in diverse biological pro-cesses. Therefore, integration of expression profiling datawith ChIP-exo was used to infer its potential roles in ad-dition to mutant phenotype validation.
Downloaded from https://academic.oup.com/nar/advance-article-abstract/doi/10.1093/nar/gky752/5078243by DTU Library - Technical Information Center of Denmark useron 03 September 2018
Nucleic Acids Research, 2018 7
Table 1. Category of uncharacterized transcription factors in this study
CandidateTFs Locus Family typea
Protein size(# aminoacids)
TFpredictscore
Target genes identifiedpreviouslyb
Target genes identified in thisstudy
Group IYiaJ b3574 IclR 282 1.0 157 binding sites Supplementary Figure S7YagI b0272 IclR 252 1.0 yagA, yagE N/AYbiH b0796 TetR 223 0.98 ybiH, rhlE Supplementary Figure S7Group IIYdcI b1422 LysR 307 1.0 N/A Supplementary Figure S8YbaO b0447 AsnC 152 0.06 tdcG, yfdV, yfjI, yhaO Supplementary Figure S8Group IIIYeiE b2157 LysR 293 1.0 N/A Supplementary Figure S9YjhU b4295 N/A 328 1.0 N/A N/AYafC b0208 LysR 304 0.96 N/A Supplementary Figure S9YihY b3886 N/A 290 0.91 N/A N/AYieP b3755 GntR 230 0.38 N/A Supplementary Figure S9YddM b1477 Xre 94 0.34 N/A Supplementary Figure S9YiaG b3555 Xre 96 0.31 N/A N/AYbaQ b0483 Xre 113 0.06 N/A Supplementary Figure S9YjdC b4135 TetR 191 0.05 N/A N/AYchA b1214 N/A 269 0.05 N/A N/AYheO b3346 Xre 240 0.06 N/A Supplementary Figure S9
acandidate TFs are classified into 54 families based on the DNA-binding motifs (6);bTarget genes identified previously are from Regulon DB and TEC database (https://shigen.nig.ac.jp/ecoli/tec/top/);Abbreviations: N/A: no available information.
1.0M
1.2M
1.8M
2.0M
2.5M
2.8M
3.0M
3.2M
3.5M
4.0M
4.2M
yddM (19)
(6) yheO
ybaQ
(36)
ybaO (3
)
ychA
yafC
(6)
ybiH (24)
yjhU
yihY
yiaG
yjdC
yeiE (102)
yagI
(24) yieP
ydcI (18)
(3) yiaJ
B
0
1
2
Bits
1
TCAG
2
TCA
3
GAT
4
CTA
5
CT
6
AGCT
7
GTA
8
GTA
9
AGT
10
C
11
CTAG
12
G
TAC
13
AGTC
14
ACT
15
G
16
TA
17
CT
18
CT
19
TGA
20
GTA
21
G
CAT
E-value=1.6 × 10-64ybiH
E-value=1.6 × 10⁻¹³
CGATAGT
G
TACTATTGAGAATCGGTAGTCATCGAGCTACTGATACGTAGTGAAGTTCAGG G
TA
1 2 3 4 5 6 7 8 9 10 11 12 13 14 15 16 17 18 19 20 210
1
2
Bits
ydcI
TCGTGCG
CATCGATAACTGATCTAGCGAGACTGCATCATGACTAGTTGCGATCCTAGTGACGATGCTACTGA
1 2 3 4 5 6 7 8 9 10 11 12 13 14 15 16 17 18 19 20 21
0
1
2
Bits
E-value=8 × 10-179yeiE
AGCTGCACTAGTGTATGCGTCAGTATGCA
AGTAT
CGACG
TACGAATCGA
1 2 3 4 5 6 7 8 9 10 11 12 13 14 15 16 17 18 19 20 21
0
1
2
Bits
E-value=3.3 × 10-51yddM
C
ATCTAGCCAATCTACTACGATCATGT
A
GTGC
GACC
TAG
C
ATGGTATCGGTACTCGAGC
1 2 3 4 5 6 7 8 9 10 11 12 13 14 15 16 17 18 19 20 21
0
1
2
Bits
E-value=2.1 × 10-84ybaQ
G
CTACTAG
CATACTAGTCGCTCGAGACTTGCGAGATCCGAGTACTAACTT
C
GGACTAGC
TG0
1
2
Bits
E-value=1.7 × 10⁻²⁵yieP
A
0.8M
1 2 3 4 5 6 7 8 9 10 11 12 13 14 15 16 17 18 19 20
Figure 2. A global landscape of DNA binding events for uncharacterized TFs during growth at active conditions. (A) Binding sites identified by ChIP-exo. Verified uncharacterized TFs were labeled with colored circles. The numbers in the parentheses represent the number of identified binding sites forindividual uncharacterized TFs. Gray circles represent uncharacterized TFs without binding peaks under the growth conditions used, which include YjhU,YjdC, YihY, YiaG, YagI, and YchA. (B) The sequence motifs for six uncharacterized TFs. The height of the letters (in bits on the y-axis) represents thedegree of conservation at a given position within the aligned sequence set, with perfect conservation being 2 bits. Arrows above motif indicate the presenceof palindromic sequences.
Case I: YiaJ regulates genes that are responsible for the uti-lization of L-ascorbate
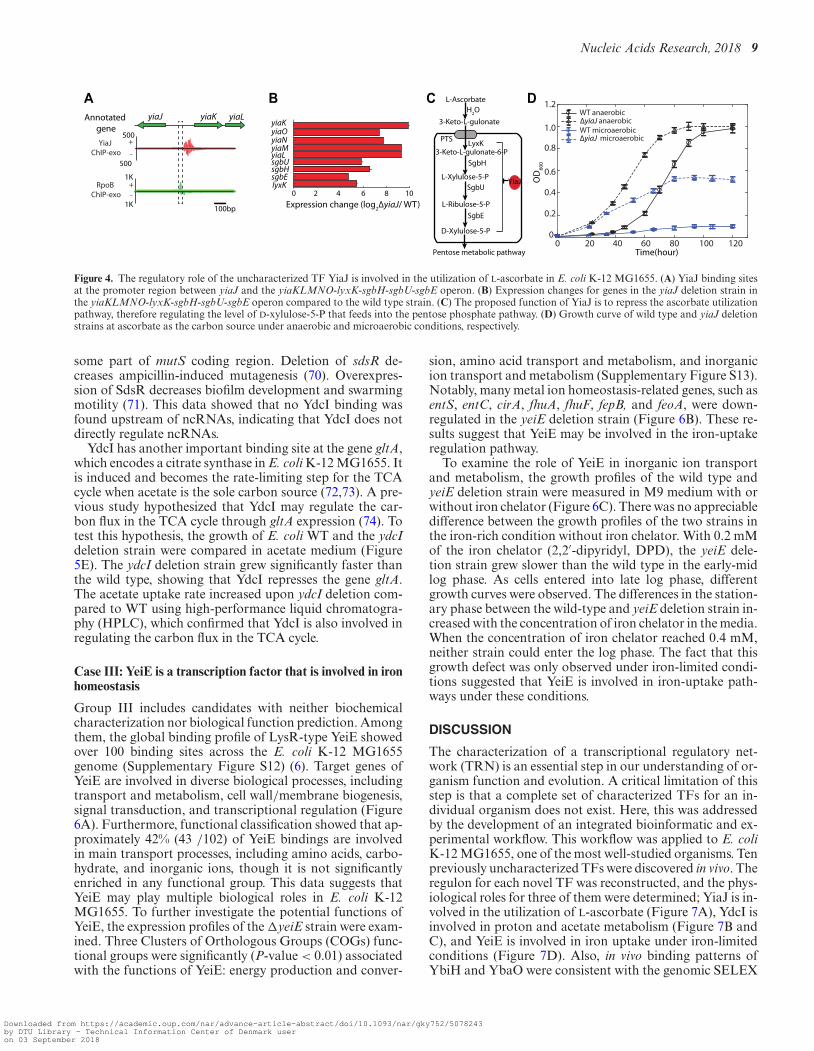
Group I contains candidates whose biochemical activitieswere studied in vitro, yet their in vivo biological functionsstill remain unclear. One of the candidates is YiaJ, whichhas been studied in vitro by gel mobility shift assays (35,67).However, in vivo analysis of direct interactions between YiaJand DNA in E. coli has not been reported. In this study, wefound that there were two binding peaks between the yiaJ
and yiaKLMNOPQRS (yiaK-yiaL-yiaM-yiaN-yiaO-lyxK-sgbH-sgbU-sgbE) operon (Figure 4A and SupplementaryFigure S8). One binding peak suggested autogenous regu-lation and the other showed that YiaJ binds to a promoterregion of the yiaK-S operon, which occupied the positionof RNAP. We compared the expression data of the yiaK-S operon in the wild type and yiaJ deletion strain (Fig-ure 4B) and found that the expression of the operon yiaK-S was highly up-regulated in the deletion strain. This re-
Downloaded from https://academic.oup.com/nar/advance-article-abstract/doi/10.1093/nar/gky752/5078243by DTU Library - Technical Information Center of Denmark useron 03 September 2018

8 Nucleic Acids Research, 2018
100bp
Annotated gene
Downstream (D)
pagPdcuC
YeiE ChIP-exo
RpoB ChIP-exo
500
5001K
1K
Overlapped (O)serCycaP
YeiE ChIP-exo
500
500
Annotated gene
RpoB ChIP-exo
100bp
500
500
Upstream (U)
500
500
1K
1K
YeiE ChIP-exo
RpoB ChIP-exo
Annotated gene
yoaB yoaC
100bp
A
B
C
+
+
+
+
+
+
-
-
-
-
-
-
D
U mode
D modeR A
R A
R - RepressionA - Activation
O mode
serCyceAputAhtpG
R A
YeiE
Nam
e of candidate TFs
dcuCmrdApflBmsbAcysJdnaG
yibQ
YeiE
YieP
ykgEcusAdauAyohJ
YiaJyiaK
mdtF
sodCrpmIgltFrpmJilvN
YafCyoaB
arcB YieP
uspFyoaC YeiE
glpDcysJ YafC
Nam
e of candidate TFs
Figure 3. Transcriptional regulation by the position of uncharacterizedTFs relative to the binding of RNA polymerase (RNAP), using bindingsites from YeiE, YieP, YiaJ, and YafC as representatives. (A) In the caseof dcuC, YeiE-binding is located downstream of the promoter. (B) YeiEbinds to the upstream site of the yoaC. (C) YeiE-binding region upstreamof serC overlaps with the promoter occupied by RNAP. (D) The bindingpositions of YeiE, YieP, YiaJ, and YafC from the promoter are categorizedaccording to the gene regulation. The abbreviations, D, U, and O indicatethe downstream, upstream, and overlapped position, respectively. R andA indicate the regulation modes: repression and activation, respectively.
sult suggests the repression function of YiaJ on the yiaK-S operon. A previous study showed that YiaJ might be in-volved in the utilization of an uncommon carbon sugar (54).To further identify the substrate catabolized by the yiaK-S operon, we compared the products of the yiaK-S operonwith the known operon ulaABCDEF encoding for catabolicenzymes in the utilization of L-ascorbate, and found that theyiaK-S operon encodes similar catabolic enzymes in the L-ascorbate degradation pathway. Thus, we proposed the reg-ulatory role of YiaJ in E. coli, based on the products ofthe yiaK-S operon (Figure 4C). When L-ascorbate is im-ported and converted to L-ascorbate-6-phosphate by thephosphotransferase system (PTS) in E. coli K-12 MG1655,expression of YiaJ would be repressed. Subsequently,lyxK, sgbH, sgbU, and sgbE encode four metabolic en-zymes, L-xylulose kinase, gulonate-6-phosphate, L-xyluose-5-phosphate-3-epime, and L-ribulose-5-phosphate-4-epime,respectively. They can eventually metabolize L-ascorbate-6-phosphate to D-xylulose-5-phosphate. Thus, E. colicould ferment L-ascorbate using a branch of the pentosemetabolic pathway (35).
To verify the function of the repressor YiaJ, the growthprofiles of the wild type and the yiaJ deletion strain weremeasured in L-ascorbate medium. The data showed that thedeletion of gene yiaJ allowed more rapid utilization of L-
ascorbate and reduced the lag phase compared to wild type(Figure 4D). Furthermore, growth profiles suggested thatthe yiaJ deletion strain allowed cells to grow on L-ascorbatemedium under microaerobic conditions, while the wild typecould not. This confirmed that YiaJ is a repressor of operonyiaK-S and that it influenced growth under microaerobicconditions.
Case II: YdcI is a transcription factor involved in pH home-ostasis and acetate metabolism
Group II consists of highly conserved candidate TFs, whichwere studied in a closely related species. The regulatoryfunction of the LysR-type regulator YdcI in E. coli K-12 MG1655 has not been studied with experimental ap-proaches (6). Thus, a ydcI myc-tagged strain was con-structed to detect 18 binding sites using ChIP-exo (Supple-mentary Figure S9).
Previous studies showed that YdcI is responsible for acidstress resistance in Salmonella enterica (55). The proteinidentity of YdcI was analyzed among multiple strains acrossGram-negative bacteria, which showed that YdcI encodesa highly conserved protein with related homologs presentin a range of Gram-negative bacterial genera (E. coli K-12MG1655, S. enterica, K. pneumoniae, and S. flexneri) (Fig-ure 5A, Supplementary Figure S10). Notably, YdcI fromE. coli K-12 MG1655 shares 80% of its identity with thatfrom Salmonella enterica. Given that the function of a pro-tein is tightly associated with its sequence, we can hypoth-esize that YdcI has similar biological roles in E. coli K-12MG1655.
To test our hypothesis, ChIP-exo experiments for YdcIwere conducted at different pH conditions (Figure 5B). Un-der low pH conditions, YdcI bound to 16 locations, andtwo-thirds of these binding peaks were found in intergenicregions. Under neutral or high pH conditions, YdcI boundto all sites identified at low pH conditions but had differen-tial binding intensity. Thus, the ratio of signal to noise (S/N)was analyzed. The data showed that YdcI had the highestaverage binding intensity at high pH medium (Figure 5C).More important, we found that four of the intergenic tar-get genes (nhaA, dtpA, lldP, and gltP) encode proton trans-porters, which play important roles in the acidic/alkalineconditions. Especially, as a major cation/proton antiporter,NhaA reveals a prominent role in alkaline pH homeostasis(68). Therefore, the growth phenotypes of the ydcI deletionstrain were examined at low pH, neutral pH, and high pHmedia (Figure 5D). At pH 5.5 or pH 8.5, the ydcI deletionstrain showed significant growth defects compared to thewild type. However, there was no defect observed at neutralpH conditions. These data confirmed that YdcI is requiredto maintain physiological activity at acidic/alkaline condi-tions in E. coli.
Additionally, there were two binding sites in the proxim-ity of known ncRNAs (Supplementary Figure S11A andB). In panel A, YdcI binding regulates the transcription ofnhaA encoding Na:H+ antiporter. There is a small RNAsokC annotated as antisense RNA sokC blocking mokCand hokC (69). In panel B, YdcI binds to the promoterregion of yobA. At the downstream of the binding event,there is a small RNA sdsR, which is the base-pair with
Downloaded from https://academic.oup.com/nar/advance-article-abstract/doi/10.1093/nar/gky752/5078243by DTU Library - Technical Information Center of Denmark useron 03 September 2018
Nucleic Acids Research, 2018 9
BA C D
Figure 4. The regulatory role of the uncharacterized TF YiaJ is involved in the utilization of L-ascorbate in E. coli K-12 MG1655. (A) YiaJ binding sitesat the promoter region between yiaJ and the yiaKLMNO-lyxK-sgbH-sgbU-sgbE operon. (B) Expression changes for genes in the yiaJ deletion strain inthe yiaKLMNO-lyxK-sgbH-sgbU-sgbE operon compared to the wild type strain. (C) The proposed function of YiaJ is to repress the ascorbate utilizationpathway, therefore regulating the level of D-xylulose-5-P that feeds into the pentose phosphate pathway. (D) Growth curve of wild type and yiaJ deletionstrains at ascorbate as the carbon source under anaerobic and microaerobic conditions, respectively.
some part of mutS coding region. Deletion of sdsR de-creases ampicillin-induced mutagenesis (70). Overexpres-sion of SdsR decreases biofilm development and swarmingmotility (71). This data showed that no YdcI binding wasfound upstream of ncRNAs, indicating that YdcI does notdirectly regulate ncRNAs.
YdcI has another important binding site at the gene gltA,which encodes a citrate synthase in E. coli K-12 MG1655. Itis induced and becomes the rate-limiting step for the TCAcycle when acetate is the sole carbon source (72,73). A pre-vious study hypothesized that YdcI may regulate the car-bon flux in the TCA cycle through gltA expression (74). Totest this hypothesis, the growth of E. coli WT and the ydcIdeletion strain were compared in acetate medium (Figure5E). The ydcI deletion strain grew significantly faster thanthe wild type, showing that YdcI represses the gene gltA.The acetate uptake rate increased upon ydcI deletion com-pared to WT using high-performance liquid chromatogra-phy (HPLC), which confirmed that YdcI is also involved inregulating the carbon flux in the TCA cycle.
Case III: YeiE is a transcription factor that is involved in ironhomeostasis
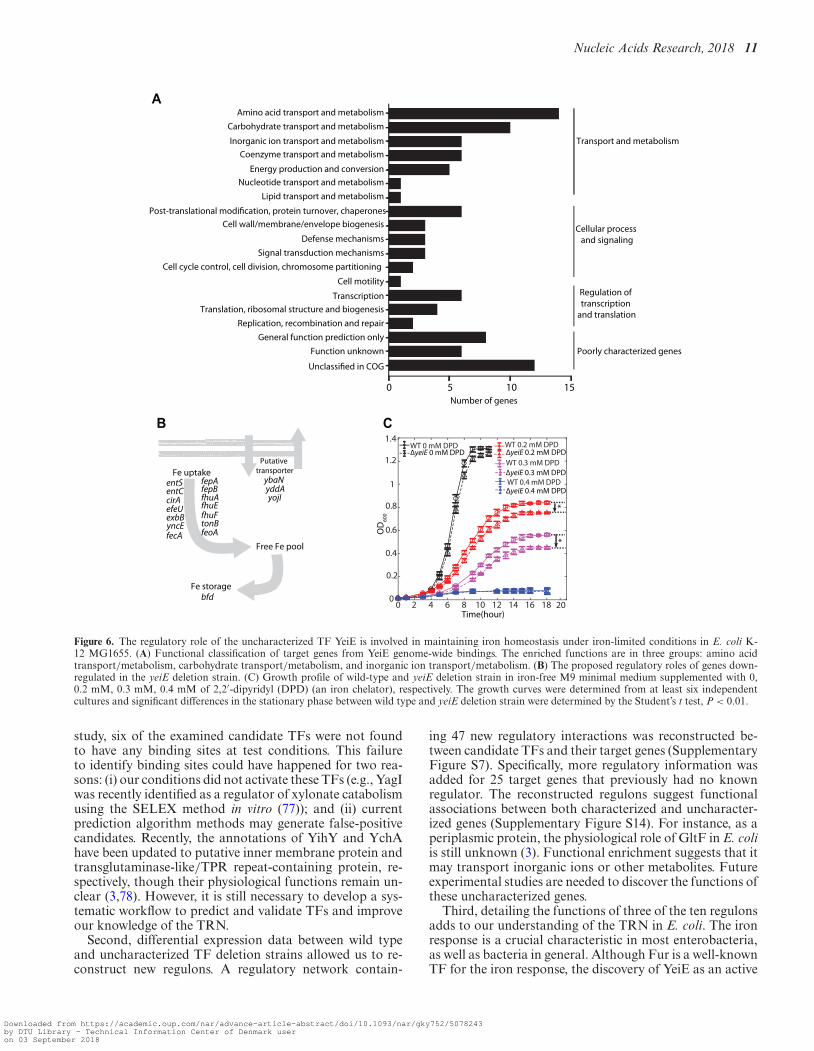
Group III includes candidates with neither biochemicalcharacterization nor biological function prediction. Amongthem, the global binding profile of LysR-type YeiE showedover 100 binding sites across the E. coli K-12 MG1655genome (Supplementary Figure S12) (6). Target genes ofYeiE are involved in diverse biological processes, includingtransport and metabolism, cell wall/membrane biogenesis,signal transduction, and transcriptional regulation (Figure6A). Furthermore, functional classification showed that ap-proximately 42% (43 /102) of YeiE bindings are involvedin main transport processes, including amino acids, carbo-hydrate, and inorganic ions, though it is not significantlyenriched in any functional group. This data suggests thatYeiE may play multiple biological roles in E. coli K-12MG1655. To further investigate the potential functions ofYeiE, the expression profiles of the �yeiE strain were exam-ined. Three Clusters of Orthologous Groups (COGs) func-tional groups were significantly (P-value < 0.01) associatedwith the functions of YeiE: energy production and conver-
sion, amino acid transport and metabolism, and inorganicion transport and metabolism (Supplementary Figure S13).Notably, many metal ion homeostasis-related genes, such asentS, entC, cirA, fhuA, fhuF, fepB, and feoA, were down-regulated in the yeiE deletion strain (Figure 6B). These re-sults suggest that YeiE may be involved in the iron-uptakeregulation pathway.
To examine the role of YeiE in inorganic ion transportand metabolism, the growth profiles of the wild type andyeiE deletion strain were measured in M9 medium with orwithout iron chelator (Figure 6C). There was no appreciabledifference between the growth profiles of the two strains inthe iron-rich condition without iron chelator. With 0.2 mMof the iron chelator (2,2′-dipyridyl, DPD), the yeiE dele-tion strain grew slower than the wild type in the early-midlog phase. As cells entered into late log phase, differentgrowth curves were observed. The differences in the station-ary phase between the wild-type and yeiE deletion strain in-creased with the concentration of iron chelator in the media.When the concentration of iron chelator reached 0.4 mM,neither strain could enter the log phase. The fact that thisgrowth defect was only observed under iron-limited condi-tions suggested that YeiE is involved in iron-uptake path-ways under these conditions.
DISCUSSION
The characterization of a transcriptional regulatory net-work (TRN) is an essential step in our understanding of or-ganism function and evolution. A critical limitation of thisstep is that a complete set of characterized TFs for an in-dividual organism does not exist. Here, this was addressedby the development of an integrated bioinformatic and ex-perimental workflow. This workflow was applied to E. coliK-12 MG1655, one of the most well-studied organisms. Tenpreviously uncharacterized TFs were discovered in vivo. Theregulon for each novel TF was reconstructed, and the phys-iological roles for three of them were determined; YiaJ is in-volved in the utilization of L-ascorbate (Figure 7A), YdcI isinvolved in proton and acetate metabolism (Figure 7B andC), and YeiE is involved in iron uptake under iron-limitedconditions (Figure 7D). Also, in vivo binding patterns ofYbiH and YbaO were consistent with the genomic SELEX
Downloaded from https://academic.oup.com/nar/advance-article-abstract/doi/10.1093/nar/gky752/5078243by DTU Library - Technical Information Center of Denmark useron 03 September 2018

10 Nucleic Acids Research, 2018
EStrain
Doubling Time (1/h)
WTΔydcI
0.25±0.070.35±0.05
0
0.1
0.2
0.3
0.4
0.5
0.6
0.7
0.8
0.9
WT_growthΔydcI_growth
35
30
25
20
15
10A
ceta
te c
once
ntra
tion
(mM
)
0 2 4 6 8 10 12 14 16Time (hour)
OD
600
ΔydcI_acetateWT_acetate
Acetate uptake rate
(mmol/gDCW/h)14.21±0.1016.02±0.30
pH5.5 pH7.0
Gro
wth
rae
(1/h
) 0.6
0.4
0.2
0
A
E. coli K-12 MG1655
Klebsiella pneumoniae Shigella flexneri
Salmonella enterica
Yersinia pestis
Ralstonia solanacearum
Geobacter sulfurreducens
Campylobacter hyointestinalis
Caulobacter crescentusVibrio cholerae
0 20 40 60 80 100
0.2Protein identity(%)
0M 4.6M0.5M 1M 1.5M 2M 2.5M 3M 4M3.5M
nhaAiraP
tomBgltA
ybhI wrbA trkG tppB yobFyobA
yojI gutM yhdVlldP
yicG gltP
9K
9K
(+)
(-)
9K
9K
(+)
(-)
9K
9K
(+)
(-)
pH 5.5 pH 7.0 pH 8.5
pH 5.5 pH 7.0 pH 8.5
Peak
Inte
nsity
(S/N
)
**
10-1
100
101
102
103
B
C
*
*
pH8.5
D
WTΔydcI
Figure 5. The regulatory role of the uncharacterized TF YdcI is involved in proton and acetate metabolism in E. coli K-12 MG1655. (A) Phylogenetic treesdisplaying the relatedness of YdcI from E. coli K-12 MG1655 and from Salmonella enterica. (B) Genome-wide YdcI DNA binding. YdcI binding across thegenome was compared under different pH conditions in E. coli K-12 MG1655 by ChIP-exo. (C) Peak intensity (Signal/Noise) of YdcI ChIP-exo bindingsites at pH 5.5, pH 7.0, and pH 8.5. Among the three different pH conditions, peak intensity was most active at pH 8.5 (* indicates rank sum test P-value< 0.05). (D) The growth rate of wild type and ydcI deletion strain at low pH, neutral pH, and high pH media. (E) Growth and acetate uptake rates of wildtype and ydcI deletion strains in acetate growth medium.
results, though the genome-wide binding profile of YbiHshowed some extra target genes (Supplementary Figure S8)(75,76). This suggests that the binding patterns of some reg-ulators are very consistent between in vivo and in vitro meth-ods. The results of this study have several notable implica-tions.
First, the ten newly identified TFs represent a 6% increaseto the 185 already known TFs. Furthermore, new knowl-edge about the co-binding of candidate TFs and knownTFs was provided at the genome-scale (Supplementary Fig-ure S7). This TF discovery workflow enables the system-atic examination of the remaining putative TFs identifiedby the initial computational step of the workflow. In this
Downloaded from https://academic.oup.com/nar/advance-article-abstract/doi/10.1093/nar/gky752/5078243by DTU Library - Technical Information Center of Denmark useron 03 September 2018
Nucleic Acids Research, 2018 11
0 5 10 15Number of genes
Amino acid transport and metabolismCarbohydrate transport and metabolism
Inorganic ion transport and metabolismCoenzyme transport and metabolism
Energy production and conversionNucleotide transport and metabolism
Lipid transport and metabolism
Post-translational modification, protein turnover, chaperonesCell wall/membrane/envelope biogenesis
Defense mechanismsSignal transduction mechanisms
Cell cycle control, cell division, chromosome partitioning
Cell motility
TranscriptionTranslation, ribosomal structure and biogenesis
Replication, recombination and repairGeneral function prediction only
Function unknown
Unclassified in COG
Transport and metabolism
Cellular process and signaling
Regulation of transcription
and translation
Poorly characterized genes
Time(hour)
OD
600
0
0.2
0.4
0.6
0.8
1
1.2
1.4WT 0 mM DPDΔyeiE 0 mM DPD
WT 0.2 mM DPD
WT 0.3 mM DPD
WT 0.4 mM DPD
ΔyeiE 0.2 mM DPD
ΔyeiE 0.3 mM DPD
ΔyeiE 0.4 mM DPD
0 2 4 6 8 10 12 14 16 18 20
B C
Fe uptake
Free Fe pool
Fe storagebfd
Putative transporter
ybaNyddAyojI
entSentCcirAefeUexbByncEfecA
fepAfepBfhuAfhuEfhuFtonBfeoA
A
*
*
Figure 6. The regulatory role of the uncharacterized TF YeiE is involved in maintaining iron homeostasis under iron-limited conditions in E. coli K-12 MG1655. (A) Functional classification of target genes from YeiE genome-wide bindings. The enriched functions are in three groups: amino acidtransport/metabolism, carbohydrate transport/metabolism, and inorganic ion transport/metabolism. (B) The proposed regulatory roles of genes down-regulated in the yeiE deletion strain. (C) Growth profile of wild-type and yeiE deletion strain in iron-free M9 minimal medium supplemented with 0,0.2 mM, 0.3 mM, 0.4 mM of 2,2′-dipyridyl (DPD) (an iron chelator), respectively. The growth curves were determined from at least six independentcultures and significant differences in the stationary phase between wild type and yeiE deletion strain were determined by the Student’s t test, P < 0.01.
study, six of the examined candidate TFs were not foundto have any binding sites at test conditions. This failureto identify binding sites could have happened for two rea-sons: (i) our conditions did not activate these TFs (e.g., YagIwas recently identified as a regulator of xylonate catabolismusing the SELEX method in vitro (77)); and (ii) currentprediction algorithm methods may generate false-positivecandidates. Recently, the annotations of YihY and YchAhave been updated to putative inner membrane protein andtransglutaminase-like/TPR repeat-containing protein, re-spectively, though their physiological functions remain un-clear (3,78). However, it is still necessary to develop a sys-tematic workflow to predict and validate TFs and improveour knowledge of the TRN.
Second, differential expression data between wild typeand uncharacterized TF deletion strains allowed us to re-construct new regulons. A regulatory network contain-
ing 47 new regulatory interactions was reconstructed be-tween candidate TFs and their target genes (SupplementaryFigure S7). Specifically, more regulatory information wasadded for 25 target genes that previously had no knownregulator. The reconstructed regulons suggest functionalassociations between both characterized and uncharacter-ized genes (Supplementary Figure S14). For instance, as aperiplasmic protein, the physiological role of GltF in E. coliis still unknown (3). Functional enrichment suggests that itmay transport inorganic ions or other metabolites. Futureexperimental studies are needed to discover the functions ofthese uncharacterized genes.
Third, detailing the functions of three of the ten regulonsadds to our understanding of the TRN in E. coli. The ironresponse is a crucial characteristic in most enterobacteria,as well as bacteria in general. Although Fur is a well-knownTF for the iron response, the discovery of YeiE as an active
Downloaded from https://academic.oup.com/nar/advance-article-abstract/doi/10.1093/nar/gky752/5078243by DTU Library - Technical Information Center of Denmark useron 03 September 2018

12 Nucleic Acids Research, 2018
RNApgltA
GltA
YdcI
yiaJ yiaK yiaL yiaM yiaN yiaO lyxK sgbH sgbU sgbE
RepressorOperon for utilization of L-ascorbate
TCA cycle
Citrate synthase
Repressor
YdcI
YdcI
HH+ H+
H+
H+
Acid Responses
?Transporters
H+
H+
H+
H+
H+
H+H+
nhaAdtpA
lldPgltP
?Fe uptakeFe storageRNAp
direct control
indirect controlFe transporter
?
unknown receptor(s)
YeiE RNAp
Metabolism (AAs, inorganic ions)Cellular process and signaling Other transcription process
A
B
CD
Figure 7. The model for the regulatory network integrating three candidate TFs (YiaJ, YdcI, and YeiE) and their biological functions in E. coli K-12MG1655. (A) YiaJ is a regulator that controls the operon yiaK-yiaL-yiaM-yiaN-yiaO-lyxK-sgbH-sgbU-sgbE in the catabolism pathway. (B) YdcI inhibitsthe transcription of target gene gltA, resulting in the down-regulation of citrate synthase that is required in the TCA cycle. (C) YdcI binds to genomic DNAand activates target genes nhaA, dtpA, lldP, and gltP that are responsible for proton transfer. (D) YeiE affects multiple transporters (amino acids, inorganicions, lipids) and metabolic processes, maintaining iron homeostasis at iron-limited conditions.
TF under low iron conditions adds to our understandingof the overall iron response (Figure 7D). Low iron levelsare especially important in understanding the interactionsbetween pathogens and hosts (79,80). Transcriptional regu-lation of ascorbate metabolism has been largely unknown,and the discovery of the role that YiaJ plays helps fill thisknowledge gap (Figure 7A). The transcriptional repressorYiaJ belongs to the IclR family and controls the hypothet-ical ascorbate transport system (named yiaMNO) and fourgenes (lyxK-sgbH-sgbU-sgbE) encoding ascorbate catalyticenzymes (6,81).
Although the strengths of the presented workflow weredemonstrated in the study, there is room for improvementto broaden the applicability of the workflow. More unchar-acterized TFs will be discovered after further experimentalvalidation. The characterization of more TFs in databaseswould allow for a larger training set, improving the predic-
tive power of machine learning methods like TFpredict. Onthe other hand, while ChIP-exo is commonly used for themapping of TF-DNA interactions, its application to the elu-cidation of regulon function is limited by the knowledge ofsuitable conditions that activate a target TF. For non-modelbacteria, the lack of biochemical/biological function stud-ies may limit the possibility of directly inferring the activeconditions from the functional studies. To address poten-tial issues with predicting experimental conditions underwhich a TF is expressed, previous studies have used con-servation analysis, expression profiling data, fitness scores,and investigated basal conditions to predict the conditionsfor candidate TFs (Supplementary Figure S15) (56,82–84).Furthermore, next-generation sequencing (NGS) technol-ogy has led to an explosion of genomic data, annotations,and expression studies (85), which would expand the avail-ability of the data resources.
Downloaded from https://academic.oup.com/nar/advance-article-abstract/doi/10.1093/nar/gky752/5078243by DTU Library - Technical Information Center of Denmark useron 03 September 2018

Nucleic Acids Research, 2018 13
In this study, we have presented a workflow for the sys-tematic discovery of uncharacterized TFs, which enables thereconstruction of their regulons. A study of an initial setof 16 candidate TFs demonstrated that the workflow couldsystematically elucidate TF functions in E. coli. This work-flow also provides a path for the discovery of uncharacter-ized gene functions that were found in the newly discoveredregulons. As more data is made available, the workflow pre-sented here may pave the way towards a more robust dis-covery of uncharacterized TFs.
DATA AVAILABILITY
The whole dataset of ChIP-exo and RNA-seq has been de-posited to GEO with the accession number of GSE111095.All code for the TFpredict algorithm trained on data fromproteobacteria is freely available on GitHub (https://github.com/draeger-lab/TFpredict/tree/prokaryote).
SUPPLEMENTARY DATA
Supplementary Data are available at NAR Online.
ACKNOWLEDGEMENTS
We thank Richard Szubin for help with ChIP-exo andRNA-seq library sequencing. We thank Zachary A. King,Justin Tan, and Amitesh Anand for helpful discussions.We thank Marc Abrams for reviewing and editing themanuscript.Author Contributions: Y.G., D.K. and B.O.P. designedthe study. Y.G. and D.K. performed experiments. J.T.Y.,A.D. and J.E. performed computational analysis. Y.G.,D.K., S.W.S., I.K., A.V.S. and X.F. did data analysis. K.C.and N.M. contributed to the protein structure analysis.Y.G., J.T.Y., B.K.C., D.K. and B.O.P. wrote the manuscript,with contributions from all other authors.
FUNDING
Novo Nordisk Foundation [NNF10CC1016517]; Basic Sci-ence Research Program through the National ResearchFoundation of Korea (NRF) funded by the Ministry ofEducation [NRF-2017R1C1B2002441]; Ministry of Foodand Drug Safety [17162MFDS601]. A.D. acknowledgessupport from the National Institutes of General MedicalSciences (NIH/NIGMS) grant [R01 GM070923]. Fund-ing for open access charge: Novo Nordisk Foundation[NNF10CC1016517].Conflict of interest statement. None declared.
REFERENCES1. Cannon,W., Claverie-Martin,F., Austin,S. and Buck,M. (1993) Core
RNA polymerase assists binding of the transcription factor �; 54 topromoter DNA. Mol. Microbiol., 8, 287–298.
2. Alkema,W.B.L., Lenhard,B. and Wasserman,W.W. (2004) Reguloganalysis: detection of conserved regulatory networks across bacteria:application to Staphylococcus aureus. Genome Res., 14, 1362–1373.
3. Keseler,I.M., Mackie,A., Santos-Zavaleta,A., Billington,R.,Bonavides-Martınez,C., Caspi,R., Fulcher,C., Gama-Castro,S.,Kothari,A., Krummenacker,M. et al. (2017) The EcoCyc database:reflecting new knowledge about Escherichia coli K-12. Nucleic AcidsRes., 45, D543–D550.
4. Keseler,I.M., Collado-Vides,J., Santos-Zavaleta,A., Peralta-Gil,M.,Gama-Castro,S., Muniz-Rascado,L., Bonavides-Martinez,C.,Paley,S., Krummenacker,M., Altman,T. et al. (2011) EcoCyc: acomprehensive database of Escherichia coli biology. Nucleic AcidsRes., 39, D583–D590.
5. Gama-Castro,S., Salgado,H., Santos-Zavaleta,A.,Ledezma-Tejeida,D., Muniz-Rascado,L., Garcıa-Sotelo,J.S.,Alquicira-Hernandez,K., Martınez-Flores,I., Pannier,L.,Castro-Mondragon,J.A. et al. (2015) RegulonDB version 9.0:high-level integration of gene regulation, coexpression, motifclustering and beyond. Nucleic Acids Res., 44, D133–D143.
6. Ishihama,A., Shimada,T. and Yamazaki,Y. (2016) Transcriptionprofile of Escherichia coli: genomic SELEX search for regulatorytargets of transcription factors. Nucleic Acids Res., 44, 2058–2074.
7. Galperin,M.Y. and Koonin,E.V. (2010) From complete genomesequence to ‘complete’ understanding? Trends Biotechnol., 28,398–406.
8. Liolios,K., Chen,I.-M.A., Mavromatis,K., Tavernarakis,N.,Hugenholtz,P., Markowitz,V.M. and Kyrpides,N.C. (2010) TheGenomes On Line Database (GOLD) in 2009: status of genomic andmetagenomic projects and their associated metadata. Nucleic AcidsRes., 38, D346–D354.
9. Chang,Y.-C., Hu,Z., Rachlin,J., Anton,B.P., Kasif,S., Roberts,R.J.and Steffen,M. (2016) COMBREX-DB: an experiment centereddatabase of protein function: knowledge, predictions and knowledgegaps. Nucleic Acids Res., 44, D330–D335.
10. Minchin,S.D. and Busby,S.J.W. (2009) Analysis of mechanisms ofactivation and repression at bacterial promoters. Methods, 47, 6–12.
11. Ogawa,N. and Biggin,M.D. (2012) High-throughput SELEXdetermination of DNA sequences bound by transcription factors invitro. Methods Mol. Biol., 786, 51–63.
12. Cho,B.-K., Barrett,C.L., Knight,E.M., Park,Y.S. and Palsson,B.Ø.(2008) Genome-scale reconstruction of the Lrp regulatory network inEscherichia coli. Proc. Natl. Acad. Sci. U.S.A., 105, 19462–19467.
13. Zhang,H., Yin,Y., Olman,V. and Xu,Y. (2012) Genomic arrangementof regulons in bacterial genomes. PLoS One, 7, e29496.
14. Elmas,A., Wang,X. and Samoilov,M.S. (2015) Reconstruction ofnovel transcription factor regulons through inference of their bindingsites. BMC Bioinformatics, 16, 299.
15. Cho,B.-K., Federowicz,S.A., Embree,M., Park,Y.-S., Kim,D. andPalsson,B.Ø. (2011) The PurR regulon in Escherichia coli K-12MG1655. Nucleic Acids Res., 39, 6456–6464.
16. Shimada,T., Ogasawara,H. and Ishihama,A. (2018) Single-targetregulators form a minor group of transcription factors in Escherichiacoli K-12. Nucleic Acids Res., 46, 3921–3936.
17. Rhee,H.S. and Pugh,B.F. (2012) ChIP-exo method for identifyinggenomic location of DNA-binding proteins withnear-single-nucleotide accuracy. Curr. Protoc. Mol. Biol.,doi:10.1002/0471142727.mb2124s100.
18. Beauchene,N.A., Myers,K.S., Chung,D., Park,D.M.,Weisnicht,A.M., Keles,S. and Kiley,P.J. (2015) Impact of anaerobiosison expression of the Iron-Responsive Fur and RyhB regulons. MBio,6, e01947-15.
19. Beauchene,N.A., Mettert,E.L., Moore,L.J., Keles,S., Willey,E.R. andKiley,P.J. (2017) O2 availability impacts iron homeostasis inEscherichia coli. Proc. Natl. Acad. Sci. U.S.A., 114, 12261–12266.
20. Kim,D., Seo,S.W., Gao,Y., Nam,H., Guzman,G.I., Cho,B.-K. andPalsson,B.O. (2018) Systems assessment of transcriptional regulationon central carbon metabolism by Cra and CRP. Nucleic Acids Res.,46, 2901–2917.
21. Fu,Y., Jarboe,L.R. and Dickerson,J.A. (2011) Reconstructinggenome-wide regulatory network of E. coli using transcriptome dataand predicted transcription factor activities. BMC Bioinformatics, 12,233.
22. Fang,X., Sastry,A., Mih,N., Kim,D., Tan,J., Yurkovich,J.T.,Lloyd,C.J., Gao,Y., Yang,L. and Palsson,B.O. (2017) Globaltranscriptional regulatory network for Escherichia coli robustlyconnects gene expression to transcription factor activities. Proc. Natl.Acad. Sci. U.S.A., 114, 10286–10291.
23. Zare,H., Sangurdekar,D., Srivastava,P., Kaveh,M. and Khodursky,A.(2009) Reconstruction of Escherichia coli transcriptional regulatorynetworks via regulon-based associations. BMC Syst. Biol., 3, 39.
24. Faria,J.P., Overbeek,R., Xia,F., Rocha,M., Rocha,I. and Henry,C.S.(2014) Genome-scale bacterial transcriptional regulatory networks:
Downloaded from https://academic.oup.com/nar/advance-article-abstract/doi/10.1093/nar/gky752/5078243by DTU Library - Technical Information Center of Denmark useron 03 September 2018

14 Nucleic Acids Research, 2018
reconstruction and integrated analysis with metabolic models. Brief.Bioinform., 15, 592–611.
25. Seo,S.W., Kim,D., Latif,H., O’Brien,E.J., Szubin,R. and Palsson,B.O.(2014) Deciphering Fur transcriptional regulatory network highlightsits complex role beyond iron metabolism in Escherichia coli. Nat.Commun., 5, 4910.
26. Seo,S.W., Kim,D., Szubin,R. and Palsson,B.O. (2015) Genome-widereconstruction of OxyR and SoxRS transcriptional regulatorynetworks under oxidative stress in Escherichia coli K-12 MG1655.Cell Rep., 12, 1289–1299.
27. Seo,S.W., Gao,Y., Kim,D., Szubin,R., Yang,J., Cho,B.-K. andPalsson,B.O. (2017) Revealing genome-scale transcriptionalregulatory landscape of OmpR highlights its expanded regulatoryroles under osmotic stress in Escherichia coli K-12 MG1655. Sci.Rep., 7, 2181.
28. Seo,S.W., Kim,D., O’Brien,E.J., Szubin,R. and Palsson,B.O. (2015)Decoding genome-wide GadEWX-transcriptional regulatorynetworks reveals multifaceted cellular responses to acid stress inEscherichia coli. Nat. Commun., 6, 7970.
29. Cho,S., Cho,Y.-B., Kang,T.J., Kim,S.C., Palsson,B. and Cho,B.-K.(2015) The architecture of ArgR-DNA complexes at thegenome-scale in Escherichia coli. Nucleic Acids Res., 43, 3079–3088.
30. Eichner,J., Topf,F., Drager,A., Wrzodek,C., Wanke,D. and Zell,A.(2013) TFpredict and SABINE: sequence-based prediction ofstructural and functional characteristics of transcription factors.PLoS One, 8, e82238.
31. Consortium,The UniProt (2017) UniProt: the universal proteinknowledgebase. Nucleic Acids Res., 45, D158–D169.
32. Ashburner,M., Ball,C.A., Blake,J.A., Botstein,D., Butler,H.,Cherry,J.M., Davis,A.P., Dolinski,K., Dwight,S.S., Eppig,J.T. et al.(2000) Gene ontology: tool for the unification of biology. The GeneOntology Consortium. Nat. Genet., 25, 25–29.
33. Cho,B.-K., Knight,E.M. and Palsson,B.O. (2006) PCR-based tandemepitope tagging system for Escherichia coli genome engineering.BioTechniques, 40, 67–72.
34. Datta,S., Costantino,N. and Court,D.L. (2006) A set ofrecombineering plasmids for gram-negative bacteria. Gene, 379,109–115.
35. Yew,W.S. and Gerlt,J.A. (2002) Utilization of L-ascorbate byEscherichia coli K-12: assignments of functions to products of theyjf-sga and yia-sgb operons. J. Bacteriol., 184, 302–306.
36. Hall,B.G., Acar,H., Nandipati,A. and Barlow,M. (2014) Growthrates made easy. Mol. Biol. Evol., 31, 232–238.
37. Seo,S.W., Kim,D., Latif,H., O’Brien,E.J., Szubin,R. and Palsson,B.O.(2014) Deciphering Fur transcriptional regulatory network highlightsits complex role beyond iron metabolism in Escherichia coli. Nat.Commun., 5, 4910.
38. Cho,B.-K., Kim,D., Knight,E.M., Zengler,K. and Palsson,B.O.(2014) Genome-scale reconstruction of the sigma factor network inEscherichia coli: topology and functional states. BMC Biol., 12, 4.
39. Ross,M.G., Russ,C., Costello,M., Hollinger,A., Lennon,N.J.,Hegarty,R., Nusbaum,C. and Jaffe,D.B. (2013) Characterizing andmeasuring bias in sequence data. Genome Biol., 14, R51.
40. Quail,M.A., Otto,T.D., Gu,Y., Harris,S.R., Skelly,T.F.,McQuillan,J.A., Swerdlow,H.P. and Oyola,S.O. (2011) Optimalenzymes for amplifying sequencing libraries. Nat. Methods, 9, 10.
41. Langmead,B., Trapnell,C., Pop,M. and Salzberg,S.L. (2009) Ultrafastand memory-efficient alignment of short DNA sequences to thehuman genome. Genome Biol., 10, R25.
42. Wang,L., Chen,J., Wang,C., Uuskula-Reimand,L., Chen,K.,Medina-Rivera,A., Young,E.J., Zimmermann,M.T., Yan,H., Sun,Z.et al. (2014) MACE: model based analysis of ChIP-exo. Nucleic AcidsRes., 42, e156.
43. Seo,S.W., Kim,D., Szubin,R. and Palsson,B.O. (2015) Genome-widereconstruction of OxyR and SoxRS transcriptional regulatorynetworks under oxidative stress in Escherichia coli K-12 MG1655.Cell Rep., 12, 1289–1299.
44. Ogasawara,H., Ohe,S. and Ishihama,A. (2015) Role of transcriptionfactor NimR (YeaM) in sensitivity control of Escherichia coli to2-nitroimidazole. FEMS Microbiol. Lett., 362, 1–8.
45. Bailey,T.L., Boden,M., Buske,F.A., Frith,M., Grant,C.E.,Clementi,L., Ren,J., Li,W.W. and Noble,W.S. (2009) MEME SUITE:tools for motif discovery and searching. Nucleic Acids Res., 37,W202–W208.
46. Trapnell,C., Williams,B.A., Pertea,G., Mortazavi,A., Kwan,G., vanBaren,M.J., Salzberg,S.L., Wold,B.J. and Pachter,L. (2010) Transcriptassembly and quantification by RNA-Seq reveals unannotatedtranscripts and isoform switching during cell differentiation. Nat.Biotechnol., 28, 511–515.
47. Tatusov,R.L., Galperin,M.Y., Natale,D.A. and Koonin,E.V. (2000)The COG database: a tool for genome-scale analysis of proteinfunctions and evolution. Nucleic Acids Res., 28, 33–36.
48. Biasini,M., Bienert,S., Waterhouse,A., Arnold,K., Studer,G.,Schmidt,T., Kiefer,F., Gallo Cassarino,T., Bertoni,M., Bordoli,L.et al. (2014) SWISS-MODEL: modelling protein tertiary andquaternary structure using evolutionary information. Nucleic AcidsRes., 42, W252–W258.
49. Humphrey,W., Dalke,A. and Schulten,K. (1996) VMD: visualmolecular dynamics. J. Mol. Graph., 14, 33–38.
50. Edgar,R.C. (2004) MUSCLE: multiple sequence alignment with highaccuracy and high throughput. Nucleic Acids Res., 32, 1792–1797.
51. Hellman,L.M. and Fried,M.G. (2007) Electrophoretic mobility shiftassay (EMSA) for detecting protein–nucleic acid interactions. Nat.Protoc., 2, 1849.
52. Riley,T.R., Slattery,M., Abe,N., Rastogi,C., Liu,D., Mann,R.S. andBussemaker,H.J. (2014) SELEX-seq: a method for characterizing thecomplete repertoire of binding site preferences for transcriptionfactor complexes. Methods Mol. Biol., 1196, 255–278.
53. Janga,S.C. and Contreras-Moreira,B. (2010) Dissecting theexpression patterns of transcription factors across conditions usingan integrated network-based approach. Nucleic Acids Res., 38,6841–6856.
54. Ibanez,E., Campos,E., Baldoma,L., Aguilar,J. and Badia,J. (2000)Regulation of expression of the yiaKLMNOPQRS operon forcarbohydrate utilization in Escherichia coli: involvement of the maintranscriptional factors. J. Bacteriol., 182, 4617–4624.
55. Jennings,M.E., Quick,L.N., Soni,A., Davis,R.R., Crosby,K.,Ott,C.M., Nickerson,C.A. and Wilson,J.W. (2011) Characterizationof the Salmonella enterica serovar Typhimurium ydcI gene, whichencodes a conserved DNA binding protein required for full acid stressresistance. J. Bacteriol., 193, 2208–2217.
56. Barrett,T., Wilhite,S.E., Ledoux,P., Evangelista,C., Kim,I.F.,Tomashevsky,M., Marshall,K.A., Phillippy,K.H., Sherman,P.M.,Holko,M. et al. (2013) NCBI GEO: archive for functional genomicsdata sets––update. Nucleic Acids Res., 41, D991–D995.
57. Trapnell,C., Williams,B.A., Pertea,G., Mortazavi,A., Kwan,G., vanBaren,M.J., Salzberg,S.L., Wold,B.J. and Pachter,L. (2010) Transcriptassembly and quantification by RNA-Seq reveals unannotatedtranscripts and isoform switching during cell differentiation. Nat.Biotechnol., 28, 511–515.
58. Wang,L., Chen,J., Wang,C., Uuskula-Reimand,L., Chen,K.,Medina-Rivera,A., Young,E.J., Zimmermann,M.T., Yan,H., Sun,Z.et al. (2014) MACE: model based analysis of ChIP-exo. Nucleic AcidsRes., 42, e156.
59. Federowicz,S., Kim,D., Ebrahim,A., Lerman,J., Nagarajan,H.,Cho,B.-K., Zengler,K. and Palsson,B. (2014) Determining the controlcircuitry of redox metabolism at the genome-scale. PLoS Genet., 10,e1004264.
60. Grainger,D.C., Hurd,D., Harrison,M., Holdstock,J. andBusby,S.J.W. (2005) Studies of the distribution of Escherichia colicAMP-receptor protein and RNA polymerase along the E. colichromosome. Proc. Natl. Acad. Sci. U.S.A., 102, 17693–17698.
61. Janga,S.C., Salgado,H. and Martınez-Antonio,A. (2009)Transcriptional regulation shapes the organization of genes onbacterial chromosomes. Nucleic Acids Res., 37, 3680–3688.
62. Bailey,T.L., Boden,M., Buske,F.A., Frith,M., Grant,C.E.,Clementi,L., Ren,J., Li,W.W. and Noble,W.S. (2009) MEME SUITE:tools for motif discovery and searching. Nucleic Acids Res., 37,W202–W208.
63. Lestienne,P., Plumbridge,J.A., Grunberg-Manago,M. andBlanquet,S. (1984) Autogenous repression of Escherichia colithreonyl-tRNA synthetase expression in vitro. J. Biol. Chem., 259,5232–5237.
64. Hommais,F., Krin,E., Coppee,J.-Y., Lacroix,C., Yeramian,E.,Danchin,A. and Bertin,P. (2004) GadE (YhiE): a novel activatorinvolved in the response to acid environment in Escherichia coli.Microbiology, 150, 61–72.
Downloaded from https://academic.oup.com/nar/advance-article-abstract/doi/10.1093/nar/gky752/5078243by DTU Library - Technical Information Center of Denmark useron 03 September 2018
Nucleic Acids Research, 2018 15
65. Lemke,J.J., Sanchez-Vazquez,P., Burgos,H.L., Hedberg,G., Ross,W.and Gourse,R.L. (2011) Direct regulation of Escherichia coliribosomal protein promoters by the transcription factors ppGpp andDksA. Proc. Natl. Acad. Sci. U.S.A., 108, 5712–5717.
66. Friden,P., Tsui,P., Okamoto,K. and Freundlich,M. (1984) Interactionof cyclic AMP receptor protein with the ilvB biosynthetic operon inE. coli. Nucleic Acids Res., 12, 8145–8160.
67. Ibanez,E., Campos,E., Baldoma,L., Aguilar,J. and Badia,J. (2000)Regulation of expression of theyiaKLMNOPQRS operon forcarbohydrate utilization inEscherichia coli: Involvement of the maintranscriptional factors. J. Bacteriol., 182, 4617–4624.
68. Krulwich,T.A., Sachs,G. and Padan,E. (2011) Molecular aspects ofbacterial pH sensing and homeostasis. Nat. Rev. Microbiol., 9,330–343.
69. Franch,T., Thisted,T. and Gerdes,K. (1999) Ribonuclease IIIprocessing of coaxially stacked RNA helices. J. Biol. Chem., 274,26572–26578.
70. Gutierrez,A., Laureti,L., Crussard,S., Abida,H., Rodrıguez-Rojas,A.,Blazquez,J., Baharoglu,Z., Mazel,D., Darfeuille,F., Vogel,J. et al.(2013) �-Lactam antibiotics promote bacterial mutagenesis via anRpoS-mediated reduction in replication fidelity. Nat. Commun., 4,1610.
71. Bak,G., Lee,J., Suk,S., Kim,D., Young Lee,J., Kim,K.-S., Choi,B.-S.and Lee,Y. (2015) Identification of novel sRNAs involved in biofilmformation, motility, and fimbriae formation in Escherichia coli. Sci.Rep., 5, 15287.
72. Walsh,K., Schena,M., Flint,A.J. and Koshland,D.E. Jr (1987)Compensatory regulation in metabolic pathways–responses toincreases and decreases in citrate synthase levels. Biochem. Soc.Symp., 54, 183–195.
73. Walsh,K. and Koshland,D.E. Jr (1985) Characterization ofrate-controlling steps in vivo by use of an adjustable expressionvector. Proc. Natl. Acad. Sci. U.S.A., 82, 3577–3581.
74. Nishio,Y., Suzuki,T., Matsui,K. and Usuda,Y. (2013) Metaboliccontrol of the TCA cycle by the YdcI transcriptional regulator inEscherichia coli. J. Microb. Biochem. Technol., 5, 59–67.
75. Shimada,T., Tanaka,K. and Ishihama,A. (2016) Transcription factorDecR (YbaO) controls detoxification of L-cysteine in Escherichiacoli. Microbiology, 162, 1698–1707.
76. Yamanaka,Y., Shimada,T., Yamamoto,K. and Ishihama,A. (2016)Transcription factor CecR (YbiH) regulates a set of genes affectingthe sensitivity of Escherichia coli against cefoperazone andchloramphenicol. Microbiology, 162, 1253–1264.
77. Shimada,T., Momiyama,E., Yamanaka,Y., Watanabe,H.,Yamamoto,K. and Ishihama,A. (2017) Regulatory role of XynR(YagI) in catabolism of xylonate in Escherichia coli K-12. FEMSMicrobiol. Lett., 364.
78. Brinza,L., Calevro,F. and Charles,H. (2013) Genomic analysis of theregulatory elements and links with intrinsic DNA structuralproperties in the shrunken genome of Buchnera. BMC Genomics, 14,73.
79. Kortman,G.A.M., Boleij,A., Swinkels,D.W. and Tjalsma,H. (2012)Iron availability increases the pathogenic potential of Salmonellatyphimurium and other enteric pathogens at the intestinal epithelialinterface. PLoS One, 7, e29968.
80. Skaar,E.P. (2010) The battle for iron between bacterial pathogens andtheir vertebrate hosts. PLoS Pathog., 6, e1000949.
81. Zhang,Z., Aboulwafa,M., Smith,M.H. and Saier,M.H. Jr (2003) Theascorbate transporter of Escherichia coli. J. Bacteriol., 185,2243–2250.
82. Moretto,M., Sonego,P., Dierckxsens,N., Brilli,M., Bianco,L.,Ledezma-Tejeida,D., Gama-Castro,S., Galardini,M., Romualdi,C.,Laukens,K. et al. (2016) COLOMBOS v3.0: leveraging geneexpression compendia for cross-species analyses. Nucleic Acids Res.,44, D620–D623.
83. Kolesnikov,N., Hastings,E., Keays,M., Melnichuk,O., Tang,Y.A.,Williams,E., Dylag,M., Kurbatova,N., Brandizi,M., Burdett,T. et al.(2015) ArrayExpress update–simplifying data submissions. NucleicAcids Res., 43, D1113–D1116.
84. Price,M.N., Wetmore,K.M., Waters,R.J., Callaghan,M., Ray,J.,Liu,H., Kuehl,J.V., Melnyk,R.A., Lamson,J.S., Suh,Y. et al. (2018)Mutant phenotypes for thousands of bacterial genes of unknownfunction. Nature, 557, 503–509.
85. Tripathi,R., Sharma,P., Chakraborty,P. and Varadwaj,P.K. (2016)Next-generation sequencing revolution through big data analytics.Front. Life Sci., 9, 119–149.
Downloaded from https://academic.oup.com/nar/advance-article-abstract/doi/10.1093/nar/gky752/5078243by DTU Library - Technical Information Center of Denmark useron 03 September 2018