systematic interpretation of ecg and...
TRANSCRIPT

13 Systematic Interpretation of ECG and Review
Although some new concepts are introduced, this chapter largely reviews what has already been introduced and provides a framework for systematic evaluation of ECGs. A variety of parameters (PR interval, QRS duration, relationship of P waves to QRS complexes, etc.) must be evaluated for proper ECG interpretation. The task can seem overwhelming and mistakes wil l be made i f a systematic strategy is not used. The part icular system used is probably not as important as is the use of an approach that is organized and inclusive. This chapter wil l describe a logical system that, after determination of rate, begins with examination of the P waves and proceeds to the r ight. Table 13.1 summarizes the steps. The capitalized words highl ight which areas of interpretat ion are covered during each step. We wil l return to this system fol lowing a brief review of T wave patterns.
T Waves In previous chapters a variety of T wave patterns were encountered, and they are summarized in Figure 13.1. Very small (posit ive or negative) or virtual ly absent T waves fal l into the “nonspecif ic T wave abnormality” category. Deep, symmetrical ly inverted T waves represent either ischemia or the repolarization abnormali t ies (“strain”) associated with hypertrophy. In order to be considered indicative of strain they must appear in leads showing R waves meeting voltage cri teria for hypertrophy. As ischemia commonly occurs in hypertrophied hearts i t is sti l l not possible to rule out ischemia in such cases.
Deep or shallow T wave inversions can also occur with an evolving ST segment elevation myocardial infarction (STEMI). The ST segments may sti l l be elevated (although not as much as during the acute phase) or may have returned to baseline.
Tall , peaked T waves occur with early hyperkalemia or very early in the course of a STEMI.
Systematic Interpretation of ECGs: the P QRS-T Method I t is important to perform all of the steps shown in Table 13.1, but temporary deviation from the pattern is often useful for exploring particular issues. For example, the discovery of negative P waves in lead II should lead to a search for the cause (technical problem, rhythm disturbance, etc.). Once an explanation is found return to the P wave step and continue from there. An advantage of this system is that a l ist of questions to answer need not be memorized. As one moves systematically forward from P waves to T waves al l of the pert inent issues (rhythm, hypertrophy, ischemia/infarct, etc.) wil l be addressed.
Use the method described above (or any other comprehensive and systematic method) to interpret the cardiograms that follow. Most of these ECGs are complex and would chal lenge the average physician. They are intentional ly complicated in order to review as much as possible and to help insti l l an appreciat ion of the value of a systematic approach to ECG
P.151
Table 13.1 Systematic Examination of ECG
Rate What is the rate? For many purposes it is sufficient, at least initially, to simply establish if it is slow, fast or normal. RHYTHM Is the rate (rhythm) regular? RHYTHM
P waves Are they positive in lead II? RHYTHM Are they unusually tall or wide in lead II? HYPERTROPHY Is the negative part of the P in lead V1 1 mm wide and deep? HYPERTROPHY Is the PR interval normal and consistent? RHYTHM, av blocks Is one P present for each QRS complex? RHYTHM, av blocks
QRS complexes
Is the QT interval normal? QT prolongation, drug EFFECTS, electrolyte disturbances Are abnormal Q waves present? INFARCT, conduction DEFECTS Is the QRS wide in any of the limb leads? RHYTHM, conduction defects What is the axis (for many purposes it is not necessary to determine degrees)? AXIS, conduction defects Are any of the criteria for LVH met? HYPERTROPHY Is the height of the R waves in V1 ≥ the depth of the S waves? HYPERTROPHY, infarct low voltage?
ST segments and T waves
Are the ST segments elevated or depressed? ISCHEMIA/infarction, conduction defects, HYPERTROPHY Are the T waves normal in appearance and orientation? ISCHEMIA/infarction, CONDUCTION defects, hypertrophy, electrolyte disturbances

analysis. Most ECGs are not as diff icult as these examples; in many areas of cl inical practice, i t is common to encounter cardiograms devoid of abnormalit ies that may simply be described as normal sinus rhythm, normal QRS complex configuration, normal ST segments and T waves .
Do not be discouraged i f the exact cause of al l of the abnormalit ies is not readi ly apparent. Part icularly when f irst start ing out one of the main skil ls is to recognize that something is abnormal and seek appropriate guidance. For example, i f whi le working in a stress lab you encounter a resting ECG that you recognize as abnormal but are not sure what the problem is i t is usually appropriate to seek guidance before proceeding with the test. As you encounter various abnormali t ies in the f ield and discuss cardiograms with col leagues your ECG knowledge wil l grow.
Figure 13.2 shows a normal sinus rhythm with complete heart block and an idioventricular escape rhythm, left axis deviation.
Rate: The atr ial rate is 91 and regular, the ventr icular rate is 26 beats per minute (bpm) and regular.
P: The P waves are upright and of normal appearance. Many of the P waves are not fol lowed by QRS complexes, those that are have dif fering PR intervals (the P-P intervals are consistent). The atr ial rates and ventr icular rates are regular and seem to have no relationship to each other; the atr ial rate is faster than the ventricular rate. The rhythm is complete (third degree) atrioventr icular block.
QRS-T: The QRS complexes are wide and bizarre in appearance and have a left bundle branch block morphology (QS in V1, wide R in V6). Given that the rhythm is complete heart block, this l ikely represents an idioventr icular escape rhythm. If one P wave preceded each QRS complex in a normal fashion, then the same QRS morphology would represent left bundle branch block. As the appearance of the QRS is explained by the idioventr icular rhythm, this is not a conduction defect, although some cl inicians would add the term “with a left bundle branch block morphology” to the interpretation to infer where in the ventr icles the idioventr icular rhythm is originat ing. The QS complexes or small r waves and ST segment elevations in the r ightward precordial leads are explained by the abnormal conduction of the ventr icular beats (analogous to what occurs with left bundle branch block); the QS complexes in leads III and aVF are not due to an old inferior wall infarct (although it would be reasonable for the beginning/intermediate student of ECG to assume that they are) but are associated with the abnormal conduction of the idioventr icular rhythm. The axis is left axis deviation (approximately -60); since the altered mean QRS vector is explained
P.152
P.153
Figure 13.1 T waves. A: Nonspecific. B: Ischemia or “strain” (hypertrophy). C: Evolving infarct. D: Hyperkalemia or very early infarct.
P.154

by the ventr icular origin of the impulses, this does not imply a left anterior hemiblock.
Figure 13.3 shows normal sinus rhythm with frequent premature atr ial complexes (PACs) and a ventr icular couplet, old inferior wall infarct, and persistent S waves in the lateral precordial leads.
Rate: The rhythm is very irregular with an average rate of about 90 bpm.
P: The P waves are upright in lead II, more than one P wave morphology is seen, and some QRS complexes do not appear to be preceded by P waves. This would be a good point to determine why these things are so. It might help to f irst establish what the normal P wave morphology is. Inspection of the lead II rhythm str ip is helpful is establ ishing the rhythm. Starting with the f i f th complex a series of QRS complexes that are regularly occurring and associated with P waves with consistent and normal appearance and consistent PR intervals is seen. This is the underlying rhythm. Having established the normal R-R interval and P wave morphology, it becomes evident that several of the QRS complexes in the rhythm str ip appear early. Some of them have narrow QRS complexes that look l ike the normal QRSs in this lead and are preceded by P waves that do not look l ike the normal P waves; these are PACs. The second QRS complex in this str ip has a narrow QRS, but does not appear to be preceded by a P wave. Careful inspection of the T wave after the f irst QRS complex shows that the “missing” P wave is sit t ing on top of this T wave, so this is also a PAC. Toward the middle of the rhythm str ip two consecutive, early, wide, and bizarre appearing QRS complexes not preceded by P waves appear; these are premature
Figure 13.2
Figure 13.3
P.155
ventricular complexes (PVCs), and since two with similar appearance occur consecutively this is a “uniform couplet.” Leads I, I I I , and aVL show an irregular baseline that appears similar to that seen with atr ial f ibri l lat ion (A-Fib). Combined with the irregularity of this strip, i t might seem reasonable to suspect A-Fib; however, given the regular appearance of P waves and the explanation of the rhythm irregulari t ies due to PACs and PVCs it becomes apparent that this is not the rhythm. The baseline irregulari t ies seen in these leads are from arti fact produced by poor skin preparation prior to placement of the electrodes or perhaps from patient tremor. The three leads that show this art i fact all share the left arm electrode, so i t might help to replace this electrode or establ ish i f a left upper extremity tremor is present.
QRS-T: With the exception of the two PVCs, the QRS complexes are of a normal duration. The axis is approximately -30 and the r waves are tal ler than the s waves are deep in lead II, so the axis may be considered normal. Signif icant Q waves are seen in the inferior leads. The lateral precordial leads (V5 and V6) show S waves.
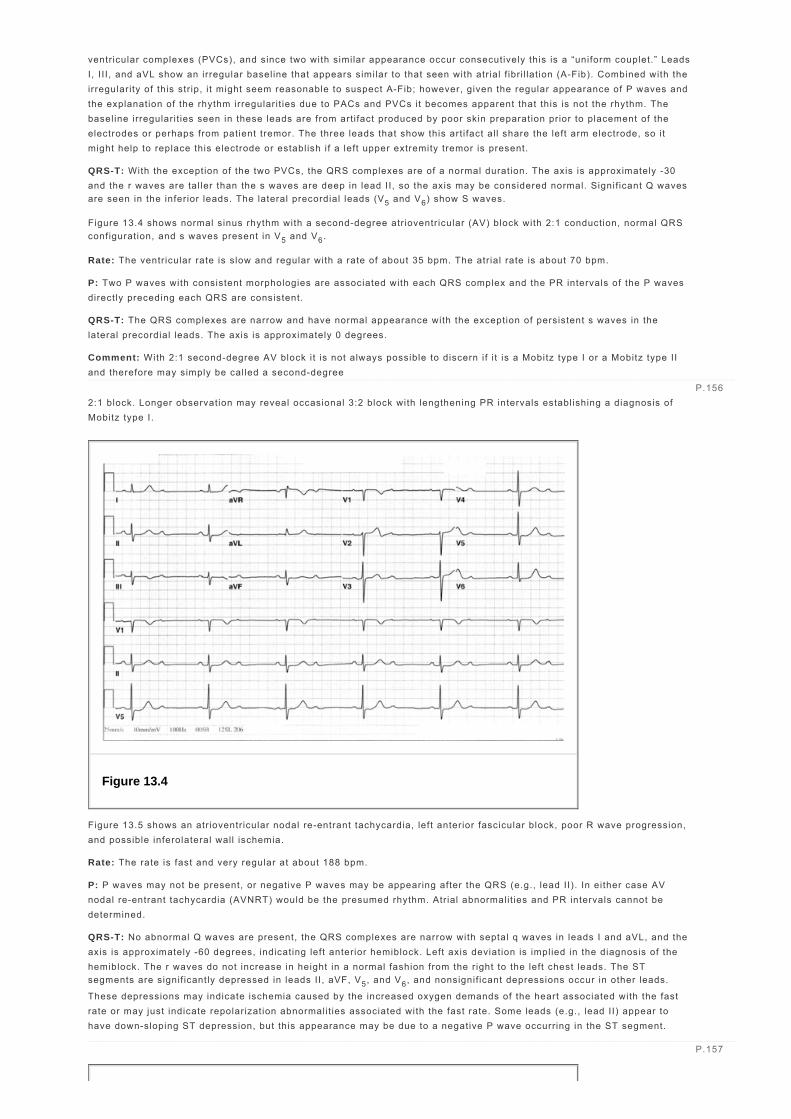
Figure 13.4 shows normal sinus rhythm with a second-degree atr ioventr icular (AV) block with 2:1 conduction, normal QRS configuration, and s waves present in V5 and V6.
Rate: The ventr icular rate is slow and regular with a rate of about 35 bpm. The atr ial rate is about 70 bpm.
P: Two P waves with consistent morphologies are associated with each QRS complex and the PR intervals of the P waves directly preceding each QRS are consistent.
QRS-T: The QRS complexes are narrow and have normal appearance with the exception of persistent s waves in the lateral precordial leads. The axis is approximately 0 degrees.
Comment: With 2:1 second-degree AV block i t is not always possible to discern i f i t is a Mobitz type I or a Mobitz type II and therefore may simply be cal led a second-degree 2:1 block. Longer observation may reveal occasional 3:2 block with lengthening PR intervals establ ishing a diagnosis of Mobitz type I .
Figure 13.5 shows an atrioventr icular nodal re-entrant tachycardia, left anterior fascicular block, poor R wave progression, and possible inferolateral wall ischemia.
Rate: The rate is fast and very regular at about 188 bpm.
P: P waves may not be present, or negative P waves may be appearing after the QRS (e.g., lead II). In either case AV nodal re-entrant tachycardia (AVNRT) would be the presumed rhythm. Atr ial abnormalit ies and PR intervals cannot be determined.
QRS-T: No abnormal Q waves are present, the QRS complexes are narrow with septal q waves in leads I and aVL, and the axis is approximately -60 degrees, indicating left anterior hemiblock. Left axis deviation is implied in the diagnosis of the hemiblock. The r waves do not increase in height in a normal fashion from the r ight to the left chest leads. The ST segments are signif icantly depressed in leads II , aVF, V5, and V6, and nonsignif icant depressions occur in other leads.
These depressions may indicate ischemia caused by the increased oxygen demands of the heart associated with the fast rate or may just indicate repolarization abnormalit ies associated with the fast rate. Some leads (e.g., lead II) appear to have down-sloping ST depression, but this appearance may be due to a negative P wave occurring in the ST segment.
P.156
Figure 13.4
P.157

Figure 13.6 shows a normal sinus rhythm and Wolff-Parkinson-White (WPW).
Rate: Regular at about 70 bpm.
P: The P waves are of modest size, but posit ive in leads II , I I I , and aVF. The P waves in lead I I may appear to be biphasic, but the negative deflection is actual ly the beginning of the QRS complex. This can be establ ished using the rhythm str ips by comparing where the QRS complex begins in lead V5 (where i t is obvious) with the same time point in the lead II rhythm
str ip (bottom three l ines). Having established where the QRS begins in lead II i t becomes apparent that the PR interval is short. A short PR interval should be a signal to look for causes such as WPW.
QRS-T: The QRS duration is prolonged and several leads (e.g., I, V2) show the distinct ive “delta wave” slurr ing at the
beginning of the QRS. This establishes the tr iad (short PR, wide QRS, delta wave) of WPW. Left axis deviation (-60 degrees) is present, so it might be reasonable to assume a left anterior hemiblock; however, due to the abnormal ventricular activation associated with WPW the usual cri teria for hemiblocks cannot be used. Leads II I and aVF may appear to have Q waves, but in fact t iny R waves are present. The ST segments are elevated in several leads and the T waves are inverted in leads I and aVL. This is a “pseudoinfarction” associated with WPW, not an actual infarct.
Figure 13.7 shows a normal sinus rhythm, r ight atr ial abnormality, old septal wall infarct, prolonged QT interval, and diffuse nonspecif ic ST-T abnormali t ies.
Rate: Regular at about 91 bpm.
Figure 13.5
P.158

Figure 13.6
Figure 13.7
P.159

P: The P waves are taller than 2.5 mm in lead II, indicating r ight atrial abnormali ty.
QRS-T: The axis is normal and about +60 degrees. The QT interval appears to be more than half of the R-R interval, indicating possible prolongation of the QT. The rate-corrected QT interval (QTc) is >440 ms (approximately 475 ms), confirming a prolonged QT interval. Signif icant Q waves are present in V1 and V2, indicating an old infarct of the septum. The modest ST segment elevations in the septal leads (V1 and V2) are consistent with the diagnosis of old septal wall
infarct. Mild T wave inversions are present in numerous leads, but the shape and depth of these inversions is not specif ic for any part icular abnormali ty within the context of this ECG.
Figure 13.8 shows a normal sinus rhythm, complete r ight bundle branch block, and old inferior wall infarct.
Rate: Regular at about 62 bpm.
P: The P wave morphology in lead II is normal, and one P wave is associated with each QRS in a normal fashion.
QRS-T: The axis is normal at about +60 degrees. The QRS duration is >120 ms in some of the l imb leads. This should inst igate a search for left bundle branch block (LBBB) or r ight bundle branch block (RBBB). An rSR' is present in V1 and V6
shows an S wave; therefore, an RBBB pattern is present. Signif icant Q waves appear in al l of the inferior leads, suggesting an old infarct. ST segment depression and T wave inversions are present in the right chest leads secondary to the RBBB.
Figure 13.8
P.160
Figure 13.9

Figure 13.9 shows sinus tachycardia versus sinoatr ial (SA) nodal re-entrant tachycardia versus ectopic atr ial tachycardia, complete left bundle branch block.
Rate: Very regular at about 136 bpm.
P: The P wave morphology in lead II and the other inferior leads is diff icult to discern as the P waves appear to be merging with the preceding T waves; P waves are clearly visible in V1 and have a normal relat ionship to the QRS complexes. The
very regular rhythm and the rate would favor a diagnosis of SA nodal re-entrant tachycardias instead of sinus tachycardia (although it could be a sinus tachycardia). If the P waves are not posit ive in the inferior leads (dif f icult to tell in this ECG), ectopic atr ial tachycardia is favored.
QRS-T: The axis shows left axis deviation (LAD) at about -60 degrees. The QRS duration is >120 ms in some of the l imb leads. This should instigate a search for LBBB or RBBB. A wide R is present in V6 and a QS pattern is seen in V1;
therefore, an LBBB pattern is present. ST segment elevat ions are present in the r ight chest leads secondary to the LBBB.
Figure 13.10 shows a junctional escape rhythm (ectopic atr ial bradycardia) and normal QRS complex configuration.
Rate: Regular at about 52 bpm.
P: The P waves are negative in the inferior leads, implying a junctional rhythm.
QRS-T: The axis is normal at about +30 degrees. The QRS complexes are normal in ampli tude, duration, and appearance. The ST segments and T waves are normal.
Figure 13.11 shows atrial f ibr i l lat ion with moderate ventr icular response and acute inferior and anterolateral wall infarct.
Rate: Very irregular at about 90 bpm.
P: Regularly occurring, organized atr ial activi ty is not present, and the ventr icular rhythm is grossly irregular.
QRS-T: The axis is normal at about +30 degrees. Signif icant Q waves are present in the inferior leads. The ST segments are signif icantly elevated in the inferior leads and V3 to V6, indicating an acute STEMI; the ST segment is signif icantly
depressed in aVL likely due to remote ischemia.
Figure 13.12 shows a normal sinus rhythm with f irst-degree AV block and frequent premature atr ial complexes sometimes occurring in a bigeminal pattern, biatr ial abnormali ty, left anterior fascicular block, and evolving ST segment elevation infarct or ischemia.
Rate: The rate is normal (77 bpm); some beats occur early. What is causing the early beats can be explored here. Note that the P wave morphologies of the early beats are different from the norm (this is particularly evident in lead V1), these beats are PACs. From the middle to the end
of the rhythm str ip PACs are occurring every other beat, thus atr ial bigeminy is present at that t ime.
P.161
Figure 13.10
P.162
P.163
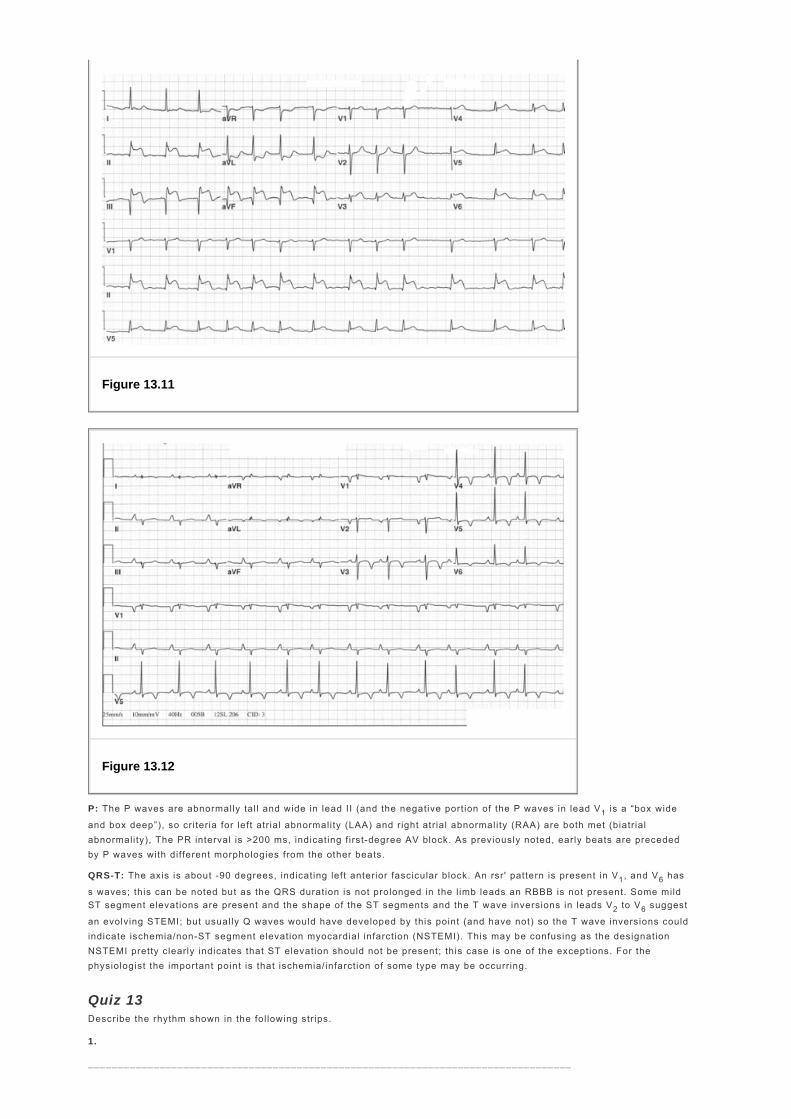
P: The P waves are abnormally tal l and wide in lead II (and the negative portion of the P waves in lead V1 is a “box wide
and box deep”), so cri teria for left atr ial abnormality (LAA) and r ight atrial abnormali ty (RAA) are both met (biatr ial abnormality), The PR interval is >200 ms, indicating f irst-degree AV block. As previously noted, early beats are preceded by P waves with different morphologies from the other beats.
QRS-T: The axis is about -90 degrees, indicating left anterior fascicular block. An rsr' pattern is present in V1, and V6 has
s waves; this can be noted but as the QRS duration is not prolonged in the l imb leads an RBBB is not present. Some mild ST segment elevations are present and the shape of the ST segments and the T wave inversions in leads V2 to V6 suggest
an evolving STEMI; but usual ly Q waves would have developed by this point (and have not) so the T wave inversions could indicate ischemia/non-ST segment elevation myocardial infarction (NSTEMI). This may be confusing as the designation NSTEMI pretty clearly indicates that ST elevation should not be present; this case is one of the exceptions. For the physiologist the important point is that ischemia/infarction of some type may be occurring.
Quiz 13 Describe the rhythm shown in the fol lowing strips.
1.
_________________________________________________________________________________
Figure 13.11
Figure 13.12

_________________________________________________________________________________
View Answer
2.
_________________________________________________________________________________
_________________________________________________________________________________
View Answer
3.
_________________________________________________________________________________
_________________________________________________________________________________
View Answer
4.
_________________________________________________________________________________
_________________________________________________________________________________
P.164

View Answer
5.
_________________________________________________________________________________
_________________________________________________________________________________
View Answer
6.
_________________________________________________________________________________
_________________________________________________________________________________
View Answer
7.
_________________________________________________________________________________
_________________________________________________________________________________
P.165

View Answer
8.
_________________________________________________________________________________
_________________________________________________________________________________
View Answer
9.
_________________________________________________________________________________
_________________________________________________________________________________
View Answer
10.
_________________________________________________________________________________
_________________________________________________________________________________
View Answer
P.166
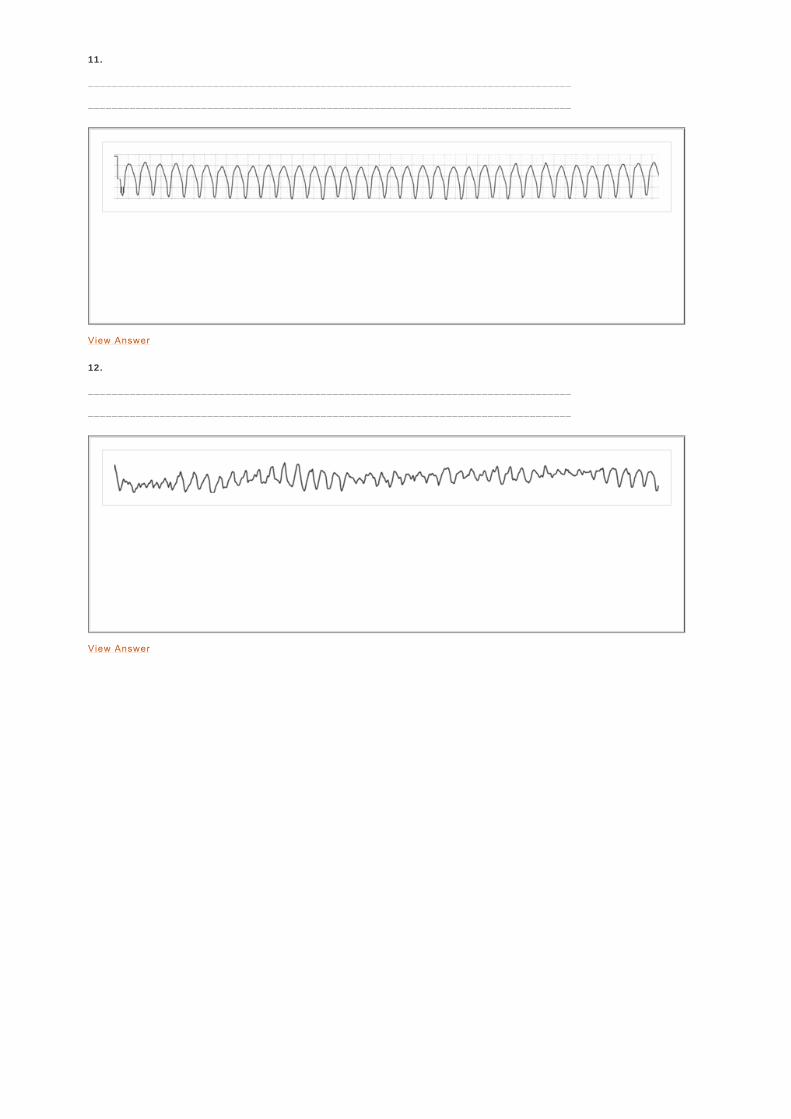
11.
_________________________________________________________________________________
_________________________________________________________________________________
View Answer
12.
_________________________________________________________________________________
_________________________________________________________________________________
View Answer