s&z ch 4: difference equationsdjjr-courses.wdfiles.com/local--files/225:difference... · web...
TRANSCRIPT

S&Z Ch 4: Difference Equations
Created Friday, January 02, 2009. Last modified Thursday, February 12, 2009
IdeasDo this chapter in conjunction with system dynamics models? Two sessions. Then do Schelling with exercises?
AssignmentRead chapter. Write up responses to example problems on page 49.
Rhetorical Tasks1. Simple examples.2. Notation3. The Math4. Equilibrium5. Stocks and Flows6.
Concepts and VocabularyNotation, subscripts, equilibrium, period, stable/unstable, first order/second order, etc., nonlinear, iteration, rule of 72, limit as n goes to infinity, 45 degree line, critical mass,
Lecture
1. Consider the following sequence of numbers
1 1 2 3 5 8 …
2. Three dots = ellipsis = "and so on"
3. Let's refer to each of these as an "sequence member."
4. And so let's call the first one "sequence member 1" and so on
Sequence Member 1 1Sequence Member 2 1Sequence Member 3 2
5. But I tire of writing out "sequence member" so I'm going to abbreviate it "s"
s4 3s5 5s6 8
6. But now I want to offer some typographical signal that the "s" is an abbreviation and the digit is a part of a numbering system. And so I write the digits as a subscript.
document.docx 1 12 February 2009

s7 13s8 21s9 34
7. Obviously, the index can be any number, but I don't want to have to write out millions of terms of the sequence. So, by convention, I write the subscript generically as "I":
si , i = 1,2,3,…
8. We will frequently use "I" in this style to stand for "any old element of the sequence" while we use the subscript "n" to refer to a particular element.
9. In particular, if I wanted to say that one element was equal to the one before it times 2, I could write
sn+1=2×sn
10. Let's talk about your bank account. Suppose you are getting 2% interest each year. Let's say your initial deposit is p0 (p stands for principal). How much will we have in the bank after the first year?
p0=p0+0.2× p0
11. or
p1=1.02× p0
12. and
p2=1.02× p1=1.02×1.02× p0=1.022× p0
13.
Examples
4.1 A totalitarian country that prohibits migration has a birth rate b and a death rate d. How does the population change from one year to the next?
Let Pi be the population in year i. Then
Pi+1=(1+b−d )Pi
4.2 There are no births in a Shaker community, only R recruits per year. The death rate is d. What is the difference equation that describes this situation?
Let Pi be the population in year i. Then
Pi+1=(1−d ) Pi+R
4.3 The Eastville School Committee is agrees to an annual $200 per year salary increase for each Eastville teacher. Express this as a difference equation.
We assume that this means this increase will occur every year. Let S i be the teacher salary in year i.
document.docx 2 12 February 2009
Si+1=S i+200
4.4 The Westtown School committee is more generous. It agrees to a 5.5% cost-of-living increase per year, plus a one time only $200 adjustment for past sins of omission. Express this as a difference equation.
Let S0 be the starting salary. Let's assume that the "adjustment" is added after last year's salary is increased for cost of living. Then
S1=(1+0.055)S0+200
In year 2 we have
S2=(1+0.055)S1 ¿(1+0.055)(1+0.055)S0+(1+0.055)200
And then, in year I,
Si ¿(1+0.055)i−1((1+0.055)S¿¿0+200)¿
Extra credit: how much would it be worth to teachers if the one time adjustment were made before the first COLA rather than after.
document.docx 3 12 February 2009

y=mx+b
y-axis
x-axis
rise
run
m is the "slope"
b is the "y intercept"
slope = rise / run
y-axis
x-axis
rise
runrise equals run so slope is 145
Equilibria and Difference Equations
Prefatory Notes
Generic Equation for a Straight Line
The "45 Degree Line"
Step 1 : General form of a difference equation
Pn=aPn-1 + b
The next value equals something times the previous value plus some increment.
In our compound interest example, a was 1 plus the interest rate and b was zero. In our population models, a was 1 plus the birth rate minus the death rate and b was the recruitment or immigration per time period. In our weasel examples a was 1 plus the reproduction rate and b was the number killed each year by hunters.document.docx 4 12 February 2009

Pn+1-axis
pn-axis
b
The line pn+1=a pn + b
Pn is C
Pn+1 is D
C
Step 2. Plot the change from step to step
pn+1=apn+b
This looks a lot like the equation for a line (if we think of pn+1 as y and pn as x). This makes sense since the very essence of difference equations is to express the next value as a function of the previous value (we might write next=f(previous) and this is the same as we do for a line: y=f(x)).
This is an odd little graph. How would we use it? Let's suppose some pn is some number C. We locate this on the horizontal axis. Then, to find pn+1 we go up to the line and across to the corresponding value on the vertical axis. Call this number D.
What comes next? Now D will be pn and we'll seek the next value. We locate D on the horizontal axis and repeat the process.
document.docx 5 12 February 2009

CD CD
CD
The system "steps along" this line
Now we know three points – three "states" of the system in succession. If we look up at the line and imagine how we have "moved" along it, we can depict how the system has moved.
Now
Step 3. Recall that at equilibrium, the system stays the same from one period to the next.
Call the value at which the system settles pe "p sub e" or the equilibrium value. It is still governed by the generic difference equation but it looks like this
pe=ape+b
This can be solved for pe:
pe=b1−a
document.docx 6 12 February 2009

Pn+1
pn
Pn+1=pn
And, the equation can be written out in our usual terms, it looks like this
pn+1=pn
But this is just the equation for a "45 degree line" – a line with slope 1 that goes through the origin (that is, the point 0,0).
Any time the system is at equilibrium it will be somewhere on this line – since, by definition, equilibrium is when pn=pn+1
Thus, if we draw a 45 degree line on the graph we drew above, we can locate the equilibrium.
Note that in the example above our line had a slope of less than 1. What happens if we have a line with a slope greater than 1?
document.docx 7 12 February 2009
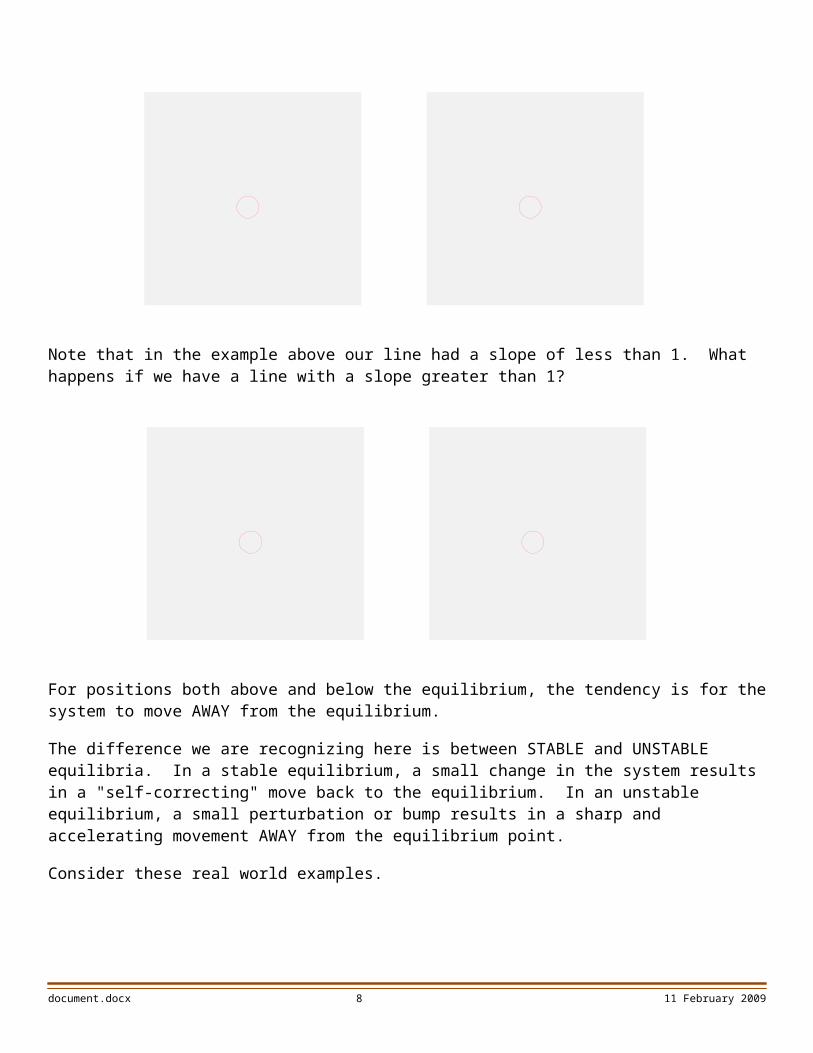
For positions both above and below the equilibrium, the tendency is for the system to move AWAY from the equilibrium.
The difference we are recognizing here is between STABLE and UNSTABLE equilibria. In a stable equilibrium, a small change in the system results in a "self-correcting" move back to the equilibrium. In an unstable equilibrium, a small perturbation or bump results in a sharp and accelerating movement AWAY from the equilibrium point.
Consider these real world examples.
http://demo.physics.uiuc.edu/lectdemo/descript/801/comp.jpg
http://www.answers.com/topic/unstable-equilibrium
http://content.answers.com/main/content/img/
oxford/Oxford_Sports/0199210896.stable-equilibrium.1.jpg
document.docx 8 12 February 2009

http://serc.carleton.edu/introgeo/models/EqStBOT.html
http://phys101.blogspot.com/2006/04/question-stable-and-unstable.html
http://echo.epfl.ch/VICAIRE/mod_3/chapt_9/pictures/f15.jpg
What Can We Learn from the Slope of the Pn+1=f(Pn) Line?
Something we've seen graphically is very interesting. When the line describing our difference equation crosses the 45 degree line with slope less than one we get a stable equilibrium. When the line crosses with a slope greater than one we get an unstable equilibrium.
Let's think for a second whether there is any intuition in this. Recall that
pe=b1−a
Consider a point one unit away from Pe. Since the slope of the line is a the next point would be Pe+a. If a<1 then our new point is closer to Pe than Pe+1 was. If a>1 then the new point is further away.
What is a is negative? If we move one unit away from equilibrium, what happens? Our next point is at Pe+a but this is on the other side of Pe since a is negative. A little thinking will get us to the fact that the point after this will again be to the right of Pe. With a negative sloping line our sequence oscillates. But does it converge or diverge. It turns out that the same rule holds as before. For absolute value greater than 1 we get divergence (an unstable equilibrium) and for absolute value less than 1 we get convergence (stable equilibrium).
document.docx 9 12 February 2009

Pn+1
pn
Pn+1
pn
Let's try our step by stepping with the following two diagrams
document.docx 10 12 February 2009

Pn+1
pn
Pn+1
pn
Practice
1. Consider the difference equation pn+ 1=1.1 pn−10
a) What are the first five values if p0=2?
b) Plot pn+1 vs. pn
2. Assume that this chart represents the difference equation pn+1=pn−pn−1
a) What are the first four values if p0=3 and p1=5?
a) ?
b) ?
c) ?
d)
document.docx 11 12 February 2009

Pn+1
pn
Pn+1
pn
3. Assume that this chart represents the difference equation pn+ 1=5 pn−10
c) What are the first five values if p0=2?
d) What are the first five values if p0=3?
e) What are the first five values if p0=1?
f) What are the first five values if p0=4?
g) Use this equation (p60) to calculate the equilibrium value
Pe=b1−a
h) Use the above information to draw in the "step diagram" for the results of parts a and b above.
4. Assume that this chart represents the difference equation pn+ 1=0.9 pn+25
b) What are the first four values if p0=150?
e) What are the first four values if p0=240?
f) What are the first four values if p0=300?
g) What are the first four values if p0=350?
h) Use this equation (p60) to calculate the equilibrium value
Pe=b1−a
i) Use the above information to draw in the "step diagram" for the results of parts b and c above.
document.docx 12 12 February 2009

Pn+1
pn
A
B
CD
Pn+1
pnA B C
5. Based on what we have learned about how the slope affects the type of equilibrium, draw arrows on the black line in this diagram to indicate where the system would go in the four labeled sections
6. Use the "step" method to figure out how this system behaves for each of the three labeled initial points in the diagram below.
document.docx 13 12 February 2009

Pn+1
pn
pn
7. Consider the curve below.
a) Think about the fundraising example used in the book (pp64ff). Describe the donation incentives that would give rise to this curve.
b) Based on our finding that a curve crossing the 45 degree line at slope less than one represents a stable equilibrium and one that crosses at slope steeper than 1 an unstable, put arrows on the curve showing how the system would behave.
8. Consider the curve below.
a) What are the first four values if p0=4?
b) What are the first four values if p0=0.5?
c) What are the first four values if p0=7?
d) What are the first four values if p0=9?
document.docx 14 12 February 2009
P n+1

7.8. Notation
13.1. Use mnemonics whenever possible13.2. Subscripts represent instances of repeated observations or measurements of "same" thing13.3. Three dots13.4. Review subscript and variable conventions. ABC, XYZ, ijk.
13.4.1. i, j, k subscripts13.4.2. x,y,z generic variables13.4.3. n, m, k as the number of elements in a collection subscripted by i, j, k13.4.4. Bold upper case for vectors13.4.5. With two variables x, y, y is usually the one plotted vertically and the one expressed in terms of
the other: y=mx+b13.4.6. Order of operations and parentheses
13.4.6.1. Exponentiation, Multiplication, Addition, Negation; work from the inside out14. Do examples using just S0 and S1.15. Generalize the idea of using subscripts n and n-1. Explain each piece of this equation.
Sn= (1+R )Sn−1 for all n≥116. Review examples on page 52 and define what "nonlinear" means.17. Solving difference equations18. Find the general solution for Sn.19. Using EXCEL 20. Avoiding "off by one" errors by being careful about which end of period things happen in.21. Equilibrium
21.1. Examples of equilibrium21.1.1. Bicycle wheel that ends up stem down, marble in bottom of bowl, "water finds it own level,"
piece of wood floating in a body of water, rocking boat settles down, chemical reaction balances forward and backward reaction, body of water and water vapor in the air, driving on one side of the road
21.2. Total lack of normative content!21.3. Suppose we have a system in which the rule is that each year we add 5% and alternate the sign of our total.
Thus, in year one we have 1, in year two -1.05, in year three –(1.05)(-1.05) and so on.
0 1 2 3 4 5 6 7 8 9 10 11 12 13 14 15 16 17 18 19 200
0.5
1
1.5
2
2.5
3
document.docx 15 12 February 2009

0 1 2 3 4 5 6 7 8 9 10 11 12 13 14 15 16 17 18 19 200
0.5
1
1.5
2
2.5
3
21.4. Several generic possibilities.21.4.1. Constant21.4.2. Linear growth or decline21.4.3. Asymptotic growth or decline21.4.4. Exponential growth or decline21.4.5. Oscillation
21.5. Practice21.6. Multiple Variable Difference Equations21.7. From difference equations to stock and flow models
stockt+1=stock t+inflow t−outflow t21.8.
4.5 A well-incubated staphylococcus population doubles in about 1 hour. How does the population change from one time period to the next?Let P0 b e the initial population. Then
P1=2 P0And
Pi=2i Pi−1
Multiple
document.docx 16 12 February 2009

Difference Equation Lab
Part I Excel Tools
Excel Skills Introduced/ReviewedAbsolute/relative cell referencesAutofill for formulasNumber formattingXY ScatterplotsTweaking graph layoutRenaming worksheetsAdding a new worksheetAdding spin button control to a worksheet
Step by Step Instructions
1. Open a new spreadsheet and name the worksheets "Ex 1" "Ex 2" "Ex 3" "Ex 4"and "Ex 5"(sic1). You may have to insert a new sheet. Hover over the * to the right of the last worksheet tab to see what command it implements.
2. Open Stokey & Zeckhauser p 49. Go to worksheet "Ex 1".
3. Set up your worksheet as shown here (extend the years out to 20 using autofill):
A B C D E F1 Death Rate .052 Birth Rate .033 Initial Pop 10045 Year Population6 07 18 2
4. Highlight cells B1 and B2 and click on the % button up in the number panel in the ribbon.
5. In cell B6 type the formula
=B$3
1 Note that here and elsewhere I sometimes INCORRECTLY put the period or comma OUTSIDE the quotation marks. This IS wrong, but I do it so that you won’t think I am saying that you have to put a comma or period at the end of the worksheet name.
document.docx 17 12 February 2009

And in the cell B7 type the formula2
=B6-B1*B6+B2*B6
Hit Enter. Select B7 and autofill down. Examine the contents of cell B8. Is the formula correct?
NOTE: When we autofill a formula, Excel updates the cell references as we move down or across. Sometimes we want this to be the case (as when our formula says "add up the two numbers to the right") but sometimes we do not (as in this case where we always want the formula to refer to cells B1 and B2). To accomplish this we create an "absolute cell reference" by putting a dollar sign in front of the row or the column or both. In this case, our formula should have been
=B6-B$1*B6+B$2*B6
6. We don't need to put a dollar sign in front of the B since we are not planning on dragging the formula across. Fix this in cell B7 and drag the formula down again.
7. Since we don't like the idea of fractional people, let's get rid of the decimal places. Highlight B6 to B26 and click on "Number" up in the middle panel of the ribbon and select the item at the bottom of the drop down menu "More Number Formats."
8. Make the selections as shown and click OK.
9. Now highlight the cell range A5 to B26 and select "Insert" on the menu bar. The ribbon will show you some chart options:
10. Stop and Think. Do you know the difference between column, bar, and scatter charts?
2 If you notice that you can simplify this and write =B6*(1-B$1+B$2) that's OK too.
document.docx 18 12 February 2009
11. Select scatter. In a scatter chart the data contains both the x and the y coordinates. In column, line, and bar charts Excel just uses only y data and numbers the x-categories 1,2,3,4,5,… (you can supply other labels for the categories, but the point is that Excel is not thinking of the horizontal (for column and line, vertical for bar) axis as numerical data.
12. Here are our scatterplot choices:
13. These differ in terms of whether a line connects the points, whether the line is smoothed or not and whether the points are indicated with a marker. We'll select the second option. The result may look something like this. We’ll do some tweaking. First thing, is adjust the size so it’s about 3 inches wide.
14. Select the chart if it is not already selected. Some context menu options will appear up on the menu bar:
15. Select layout. We will futz with the axis labels and chart title and legend.
16. Use the Axis Titles button to put a title below the primary horizontal axis. It should say "Year". Then do the same for the primary vertical axis; it should be "Population". Single click on the chart title and change it to "Population of a Totalitarian Country". We only have one variable so the legend is not so important. Single click and delete it. Next click on the chart area and grab a handle on the right side to stretch it out to fill the space where the legend was.
17. Our horizontal axis goes up to 30 or 40 but our data only goes to 20. Click on the Axes button and Primary Horizontal Axis and More Primary Horizontal Axis options. Change the maximum on this axis to 20.
document.docx 19 12 February 2009

18. Single click on one of the data points in the chart to select the data series and then right click and select "Format Data Series."
19. Under marker options pick a 5 pt circle and under marker fill select no fill and under line style select line weight 1.5. Click OK.
20. Your result should now look something like this
0
20
40
60
80
100
120
0 5 10 15 20
Popu
latio
n
Year
A Totalitarian Country
21. To prepare your results for printing, select a range of cells that contains all the work and the chart and then click on Page Setup and then on the ribbon under Page Layout select Print Area and Set Print Area. Then, under orientation, select landscape. Then click on the Print Titles button and the Header/Footer tab in the dialog box that pops up. Click on the Custom Header… button and put your name and document title on the right side of the header as shown. Click OK and and OK and then print your results.
document.docx 20 12 February 2009

22. Go to worksheet "Ex 2" and set it up for the second example on page 49 – the initial values are up to you – I've used 500, 25, and 4%.
23. Enter the correct formula in cell B7 and use autofill to populate the rest of the cells.
24. Go back to the first worksheet and select the chart and click copy (or control-c).
25. Return to Ex 2 and off to the side of the data click and paste.
26. Right click the chart and "Select Data…" In this dialog box, the data on which the chart is based is highlighted. Notice that it refers back to the other worksheet and Excel jumps back to that sheet. Leaving the data range highlighted, click on the Ex 2 sheet tab. Excel should update the data range so that it now refers to the Shaker data of this example. If not, make sure the data range in the dialog box is highlighted and select the data in THIS worksheet – cells A5 to A25 and then click OK.
27. Click on the chart title to make appropriate changes.
28. Prepare for printing as above and print results.
29. LATER: Repeat similar steps for examples 3, 4, and 5 on page 49.
document.docx 21 12 February 2009

Adding Controls to Make It a “Live” Simulation
30. Go back to Ex. 1. Look up at the top of the menu bar to see if you have the “developer tab” in your ribbon:
31. If not go to the and click “Excel Options” at the bottom of the context menu and click “Show developer tab in ribbon”
32. Let your mouse hover over this icon to get its name. Click it to reveal the “controls” you can insert into your worksheet. Hover over each to get its name.
33. Select the “spin button” and draw/click one to the right of your system parameter
34. A control allows us to build an interface for interacting with a user (you). The spin button control allows us to change the value of a cell it is connected with. We have to “format” the control, telling it what cell it controls and how it should behave. Right click on the control and select “format control” and set it as shown below.
document.docx 22 12 February 2009

35. Click OK and then unselect the button by clicking anywhere else. Now that its handles are gone, the control is in active mode (rather than edit mode). Play with it to see the value of cell c1 change.
36. Spin buttons can only run through integers so we have to do a little further bit of processing here. Let’s replace the contents of cell B1 with the formula
=C1/100
Now play with your spin button and notice what happens.
37. Let’s do a few things to improve the look of our tool. First, center the contents of C1. Then increase the height of rows A, B, and C so that the spin button will fit neatly within a single row. It may expand when you do this so you’ll have to right click it to get handles and then adjust it back to a smaller size. While you are doing this, move it so that it covers the number showing in C1.
38. Repeat this process to create a spin button for the birth rate and one for the initial population. Note that the latter is not a percentage so we can link it directly to D2. I would suggest that this spin button run from 100 to, say, 1000 with an incremental change of 100.
39. Your final version should look like this
document.docx 23 12 February 2009

Problem Set Exercises
1. Implement the Endowment Fund example (p 64) in Excel. Create a data table with a spin button that let’s you control the return on investment, the level of withdrawal, and contributions. Chart Endowment vs. Time.
2. Use Excel to do the two practice problems on p 66.
3. Use Excel to implement the workers/children example on pp66ff. Use controls to let you play with the survival rates and fertility variables.
4. Use Excel to explore the army manpower example on p69ff
What to Turn InSingle sheet printout from each of examples 1-3.Single sheet printout from each problem above. On these printouts, handwrite any comments/explanations about what the model tells you about the behavior of the system.
document.docx 24 12 February 2009

1. Describe in words – in terms of how interest gets added to your account – why you would prefer %5 interest compounded daily rather than %5 interest compounded weekly.
2. Per 51.9, describe 5 situations in a field of personal interest in which difference equation logic would be applicable.
3. Two sample problems on page 66 (only do as much as we are currently equipped to do).
h1=0.9×h0+800
hn=0.9×hn−1+800
Pn=2×Pn−1−100W
4. Compute the next five terms of each of the following sequences from the given information.3
(a) x0 = 10, xn+1 = xn + 4
0
5
10
15
20
25
30
35
0 2 4 6
Valu
e
TImePeriod
(b) y0 = −1, yn+1 =1/yn
-1.2
-1
-0.8
-0.6
-0.4
-0.2
0
0 2 4 6
Valu
e
TImePeriod
(c) x0 = 40, xn+1 = 2xn − 20
3 Some of these problems borrowed from http://math.furman.edu/~dcs/book/c1pdf/sec14.pdf
document.docx 25 12 February 2009

0
100
200
300
400
500
600
700
0 2 4 6
Valu
e
TImePeriod
(d) z0 = 2, zn+1 = zn2 - zn
0
0.5
1
1.5
2
2.5
0 2 4 6
Valu
e
TImePeriod
(e) x0 = 2, x1 = 3, xn+2 = xn+1 + xn
0
5
10
15
20
25
0 2 4 6
Valu
e
TImePeriod
(f) x0=15 , xn=13xn−1+2
02468
10121416
0 2 4 6
Valu
e
TImePeriod
document.docx 26 12 February 2009

5. A population of weasels is growing at rate of 3% per year. Let wn be the number of weasels n years from now and suppose that there are currently 350 weasels.
(a) Write a difference equation which describes how the population changes from year to year.wn=1.03
n×350(b) Solve the difference equation of part (a). If the population growth continues at the rate of 3%, how many
weasels will there be 15 years from now?w15=1.03
15×350¿1.558×350
¿545(c) Plot wn versus n for n = 0, 1, 2, . . . , 100.
0
1,000
2,000
3,000
4,000
5,000
6,000
7,000
8,000
0 20 40 60 80 100
Year
Weasels
(d) How many years will it take for the population to double?
700=1.03n×350700350
=1.03n
2=1.03n
log 2=n log1.03
log 2log 1.03
=n≈23.5 years
log ab=b loga
(e) Find limn→∞
wn. What does this say about the long-term size of the population? Will this really happen?
6. If the rate of growth of the weasel population in Problem 5 was 5% instead of 3%, how many years would it take for the population to double?
log 2log 1.05
=n≈14.2 years
7. Suppose that the weasel population of Problem 5 would grow at a rate of 3% a year if left to itself, but poachers kill 6 weasels every year for their fur.
(a) Write a difference equation which describes how the population changes from year to year
.w1=1.03 (w0−6 )
document.docx 27 12 February 2009

w2=1.03 (w1−6 )=1.03 (1.03 (w0−6 )−6)=1.032w0−1.032×6−1.03×6
w3=1.03 (w2−6 )=1.03 (1.032w0−1.032×6−1.03×6−6 )
wn=1.03 (wn−1−6 )
(b) Solve the difference equation of part (a). How many weasels will there be in 15 years?wn=1.03
n×350 wn=1.03 (wn−1−6 )
(c) Find limn→∞
wn. What does this say about the long-term size of the population?(d) Will the population eventually double? If so, how long will this take?(e) Plot ωn versus n for n = 0, 1, 2, . . . , 100.
0
1,000
2,000
3,000
4,000
5,000
6,000
7,000
8,000
0 10 20 30 40 50 60 70 80 90 100
Year
Weasels
W problem 5
W problem 7
8. Suppose that the weasel population of Problem 5 would grow at a rate of 3% a year if left to itself, but poachers kill 15 weasels every year for their fur.
(a) Write a difference equation which describes how the population changes from year to year.
document.docx 28 12 February 2009

wn=1.03 (wn−1−15 )
(b) Solve the difference equation of part (a). How many weasels will there be in 15 years?(c) Find lim
n→∞wn. What does this say about the long-term size of the population?
(d) Will the population eventually double? If so, how long will this take(e) Will the population eventually die out? If so, how long will this take?(f) Plot wn versus n for n = 0, 1, 2, . . . , 100.
0
1,000
2,000
3,000
4,000
5,000
6,000
7,000
8,000
0 10 20 30 40 50 60 70 80 90 100
Year
Weasels
W problem 5
W problem 7
W problem 8
document.docx 29 12 February 2009