szabat et al cell metabolism 2015
TRANSCRIPT

Article
Reduced Insulin Productio
n Relieves EndoplasmicReticulum Stress and Induces b Cell ProliferationGraphical Abstract
Highlights
d Acute reduction of insulin production reverses baseline ER
stress
d Loss of insulin production reduces Trib3 and hyper-activates
Akt
d Reduced insulin production increases b cell proliferation cell
autonomously
d Insulin knockout induces glucagon mis-expression via
hyperglycemia
Szabat et al., 2016, Cell Metabolism 23, 1–15January 12, 2016 ª2016 Elsevier Inc.http://dx.doi.org/10.1016/j.cmet.2015.10.016
Authors
Marta Szabat, Melissa M. Page,
Evgeniy Panzhinskiy, ..., Corey Nislow,
Timothy J. Kieffer, James D. Johnson
In Brief
Szabat et al. show that the normally high
rate of insulin production acts as a brake
on adult b cell proliferation in mice.
Reducing this burden via acute deletion
of the insulin gene relieves baseline ER
stress, increases mitogenic signaling,
and promotes cell-cycle progression in a
cell-autonomous manner.
Please cite this article in press as: Szabat et al., Reduced Insulin Production Relieves Endoplasmic Reticulum Stress and Induces b Cell Proliferation,Cell Metabolism (2016), http://dx.doi.org/10.1016/j.cmet.2015.10.016
Cell Metabolism
Article
Reduced Insulin Production RelievesEndoplasmic Reticulum Stressand Induces b Cell ProliferationMarta Szabat,1 Melissa M. Page,1 Evgeniy Panzhinskiy,1 Søs Skovsø,1 Majid Mojibian,1 Juan Fernandez-Tajes,2
Jennifer E. Bruin,1 Michael J. Bround,1 Jason T.C. Lee,1 Eric E. Xu,3 Farnaz Taghizadeh,1 Shannon O’Dwyer,1
Martijn van de Bunt,2 Kyung-Mee Moon,4 Sunita Sinha,5 Jun Han,6 Yong Fan,7 Francis C. Lynn,3 Massimo Trucco,7
Christoph H. Borchers,6 Leonard J. Foster,4 Corey Nislow,5 Timothy J. Kieffer,1 and James D. Johnson1,*1Department of Cellular and Physiological Sciences, Diabetes Research Group, Life Sciences Institute, University of British Columbia,
BC V6T1Z3, Canada2Wellcome Trust Centre for Human Genetics, University of Oxford, Oxford OX3 7BN, UK3Child and Family Research Institute, University of British Columbia, BC V5Z 4H4, Canada4Centre for High-Throughput Biology5Faculty of Pharmaceutical Sciences
University of British Columbia, BC V6T 1Z3, Canada6UVic-Genome BC Proteomics Centre, University of Victoria, BC V8Z 7X8, Canada7Institute of Cellular Therapeutics, Allegheny Health Network, Pittsburgh, PA 15212-4772, USA
*Correspondence: [email protected]
http://dx.doi.org/10.1016/j.cmet.2015.10.016
SUMMARY
Pancreatic b cells are mostly post-mitotic, but it isunclear what locks them in this state. Perturbationsincluding uncontrolled hyperglycemia can drive b
cells into more pliable states with reduced cellularinsulin levels, increased b cell proliferation, andhormone mis-expression, but it is unknown whetherreduced insulin production itself plays a role. Here,we define the effects of �50% reduced insulin pro-duction in Ins1�/�:Ins2f/f:Pdx1CreERT:mTmG miceprior to robust hyperglycemia. Transcriptome, prote-ome, and network analysis revealed alleviation ofchronic endoplasmic reticulum (ER) stress, indi-cated by reduced Ddit3, Trib3, and Atf4 expression;reduced Xbp1 splicing; and reduced phospho-eIF2a. This state was associated with hyper-phos-phorylation of Akt, which is negatively regulatedby Trib3, and with cyclinD1 upregulation. Remark-ably, b cell proliferation was increased 2-fold afterreduced insulin production independently of hyper-glycemia. Eventually, recombined cells mis-ex-pressed glucagon in the hyperglycemic state. Weconclude that the normally high rate of insulinproduction suppresses b cell proliferation in a cell-autonomous manner.
INTRODUCTION
Pancreatic b cells are long-lived specialized secretory cells
tasked with the production of all circulating insulin, which is
essential for healthy long-term survival (Mezza and Kulkarni,
2014). When stressed, b cells can exit their mature differentiated
state into states of dysfunction and dedifferentiation, including
conditions wherein b cells have little to no insulin protein (Szabat
et al., 2012; Weir et al., 2013). Dedifferentiation has been
proposed as an important mechanism of b cell dysfunction in
diabetes (Akirav et al., 2008; Brereton et al., 2014; Guo et al.,
2013; Talchai et al., 2012; Wang et al., 2014; Weir et al., 2013)
but remains poorly understood. For example, it is not clear
whether the loss of insulin production in adult b cells is causally
linked to proliferation, dedifferentiation, or transdifferentiation
(Szabat et al., 2012). The inverse relationship between differenti-
ation and proliferation is illustrated by the demonstration that
halting proliferation in a human b cell line dramatically increased
insulin content (Scharfmann et al., 2014), but it is not known
whether inhibiting insulin production alone might be sufficient
to increase adult b cell proliferation. Germ-line disruption of
both insulin genes in mice caused severe diabetes and neonatal
death, precluding analysis of adult b cells in that model (Duvillie
et al., 2002). In post-natal mice, near complete b cell ablation
increases b cell proliferation (Nir et al., 2007) and plasticity of
other islet cell types (Chera et al., 2014; Thorel et al., 2010), but
it is not clear to what extent the effects in these acute injury
models are due to the loss of insulin, rather than the loss of b
cells. To address the question of whether the burden of produc-
ing large quantities of insulin normally suppresses proliferation in
a cell-autonomous manner, one must acutely reduce insulin in
adult b cells. Such an animal model would provide, for the first
time, an opportunity to study the fates of cells that had lost their
ability to produce their primary secreted protein.
In the present study, we use transcriptomics, proteomics, and
metabolomics to define systems-wide changes that accompany
the acute loss of insulin production in adult mouse b cells
following deletion of two floxed Ins2 alleles in mice already
lacking both Ins1 alleles. This unbiased survey identified a
reversal of baseline ER stress in cells with reduced insulin pro-
duction. We observed a significant increase in proliferation
prior to the inevitable robust hyperglycemia in this model and
Cell Metabolism 23, 1–15, January 12, 2016 ª2016 Elsevier Inc. 1
A
B
C
H
L
N
Q R
O
S
P
M
I JK
D E
F
G
(legend on next page)
2 Cell Metabolism 23, 1–15, January 12, 2016 ª2016 Elsevier Inc.
Please cite this article in press as: Szabat et al., Reduced Insulin Production Relieves Endoplasmic Reticulum Stress and Induces b Cell Proliferation,Cell Metabolism (2016), http://dx.doi.org/10.1016/j.cmet.2015.10.016
Please cite this article in press as: Szabat et al., Reduced Insulin Production Relieves Endoplasmic Reticulum Stress and Induces b Cell Proliferation,Cell Metabolism (2016), http://dx.doi.org/10.1016/j.cmet.2015.10.016
used complementary experiments with controlled glucose to
demonstrate the cell-autonomous nature of this effect. We also
observed an increased number of insulin gene knockout b cells
that mis-expressed glucagon protein, but only after robust hy-
perglycemia. Our results provide the first evidence that normal
insulin production directly constrains b cell proliferation.
RESULTS AND DISCUSSION
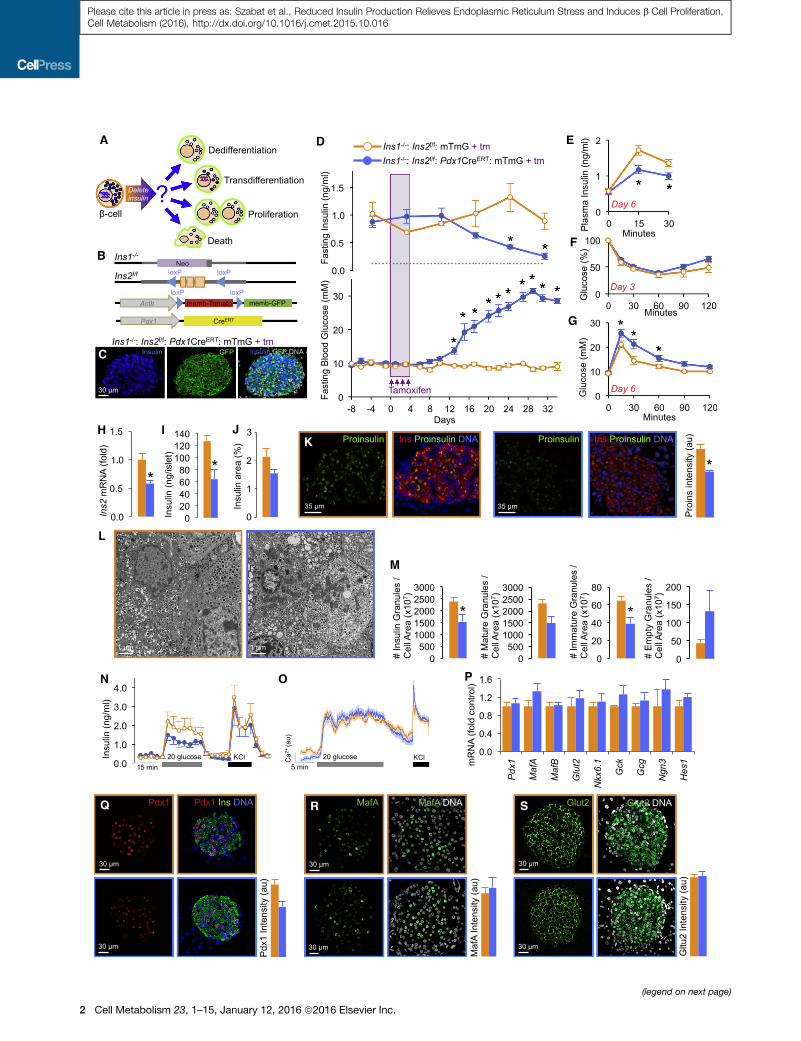
Physiological Characterization of Mice with Acute IsletInsulin Gene KnockoutThe effects of reducing insulin production in adult b cells are
unknown (Figure 1A). To distinguish between possible b cell
fates, we generated a mouse model with conditional deletion
of Ins2 (Fan et al., 2009) on an Ins1-null background (Duvillie
et al., 2002), where b cell selective tamoxifen-inducible Cre is
driven by a Pdx1 promoter fragment (Pdx1CreERT) (Figure 1B).
This Cre ‘‘deleter’’ allele resulted in virtually complete recombi-
nation, as measured by the antibody staining against mem-
brane targeted GFP from the mTmG reporter allele (Muzumdar
et al., 2007) (�99%; Figure 1C). Acute Ins2 gene knockout re-
sulted in the expected loss of circulating insulin and sustained
diabetes in all experimental Ins1�/�:Ins2f/f:Pdx1CreERT:mTmG
but not in control Ins1�/�:Ins2f/f:mTmG mice (Figure 1D).
Remarkably, the onset of hyperglycemia and insulinopenia
was delayed by 14 ± 4 days after the initiation of Ins2 deletion
by tamoxifen. This delay is consistent with the abundance
and stability of Ins2 mRNA, the large amount of stored insulin,
and the functional excess of b cell mass (Tillmar et al., 2002).
While islets can express hundreds of growth factors, cyto-
kines, and hormones (Yang et al., 2011b, 2015), our data
confirm that insulin is non-redundant for glucose homeostasis
in adult mice.
Six days after tamoxifen initiation, a time when fasting insulin
and glucose were normal (Figure 1D), in vivo glucose-stimu-
lated insulin secretion was reduced by �50%, insulin sensitivity
was normal, and glucose tolerance was only mildly impaired
(Figures 1E–1G). We addressed the state of b cells with
reduced insulin production at the 6-day time point to focus
on potential cell-autonomous effects independent of altered
Figure 1. Adult Insulin Gene Knockout b Cells Produce and Release Le
(A) Schematic of possible fates of insulin gene knockout b cells.
(B) Alleles required for conditional Ins2 deletion on an Ins1-null background and
inducible Pdx1-driven Cre-mediated recombination of membrane-targeted tdTo
(C) Near complete Cre-recombination efficiency (�99% of b cells are GFP-positiv
after tamoxifen. Unless otherwise stated, Ins1�/�:Ins2f/f:Pdx1CreERT:mTmG t
Ins1�/�:Ins2f/f:mTmG control mice throughout this study, with both groups inject
(D) Plasma insulin (n = 3, 14; control replicates listed 1st throughout) and blood glu
detection. No changes in body weight between control and experimental groups
(E–G) Glucose-stimulated insulin secretion (n = 3, 5), insulin tolerance (n = 4, 7),
(H) Ins2 mRNA quantification by qPCR at the 6-day time point (as are all subseq
(I) Insulin content in isolated islets (n = 3).
(J) Pancreatic insulin-positive area (n = 3).
(K) Proinsulin immunofluorescence (n = 3).
(L and M) Electron microscopy and quantification of granule populations. Two re
(N) Dynamic analysis of insulin secretion by perifusion (n = 6).
(O) Average Ca2+ responses to 20 mM glucose and 30 mM KCl (n > 100 cells in
(P) qPCR analysis of islet cell differentiation markers (n = 8, 9).
(Q–S) Imaging and quantification of Pdx1, MafA, and Glut2 Immunofluorescence (
represent Ins1�/�:Ins2f/f:mTmG controls and Ins1�/�:Ins2f/f:Pdx1CreERT:mTmG ex
circulating insulin and sustained, robust hyperglycemia (Fig-
ure 1D), which have profound effects on b cell differentiation
state (Brereton et al., 2014; Wang et al., 2014). Six days
after Ins2 allele recombination, islets had roughly half their re-
serves of Ins2 mRNA and insulin protein content (Figures 1H
and 1I). The relative area of insulin immunoreactivity, a com-
posite of insulin content and b cell mass, was not significantly
different at this time point (Figure 1J). Although stored insulin
was readily apparent by immunofluorescence, pro-insulin was
significantly decreased (Figure 1K), consistent with a robust
reduction in new insulin synthesis. Perhaps expectedly, elec-
tron microscopy illustrated that b cells with reduced insulin
production had fewer mature dense core granules and fewer
immature/new insulin granules, while the overall ultrastructural
morphology was normal (Figures 1L and 1M). Dynamic analysis
of insulin secretion demonstrated that glucose-stimulated insu-
lin secretion was reduced by �50%, while basal and KCl-stim-
ulated insulin secretion were unchanged (Figure 1N). The obser-
vations that fasting/basal insulin were unchanged in vivo and
in vitro, but glucose-stimulated insulin secretion was reduced,
are consistent with the concept that newer insulin is selectively
released by glucose and older stored insulin supports basal
glucose homeostasis. Halban previously reported that newly
synthesized insulin was preferentially released, but they did
not find a further preferential release with increased glucose
(Halban, 1982). Recently, in vitro studies have suggested that
the most recently synthesized insulin is selectively released
upon glucose stimulation (Ivanova et al., 2013), and our data
provide in vivo support for this concept, although additional
studies are clearly warranted on this topic. Notably, b cells
with reduced insulin production were otherwise fully functional,
with identical Ca2+ responses to 20 mM glucose and 30 mM
KCl (Figure 1O). Reduction of insulin production also did not
appear to lead to b cell dedifferentiation, based on mRNA
and protein levels of known differentiation/maturity genes
(Szabat et al., 2010) (Figures 1P–1S). Collectively, our data
demonstrate that 6 days after the acute abrogation of insulin
production, pancreatic b cells remain grossly normal while re-
taining some stored insulin that enables normal fasting glucose
homeostasis.
ss Insulin but Are Otherwise Normally Differentiated
lineage-tracing with membrane-targeted eGFP marks cells after tamoxifen-
mato.
e) and residual insulin stores in Ins1�/�:Ins2f/f:Pdx1CreERT:mTmG islets 6 days
reatment mice with insulin gene knockout were compared with littermate
ed with tamoxifen.
cose (n = 6, 14) were measured after a 4 hr fast. Gray line indicates the limit of
were observed (not shown).
glucose tolerance (n = 6, 12) tests at the indicated time points.
uent data unless otherwise specified) (n = 8, 9).
presentative images from three samples of each group.
each group).
n = 3). *p < 0.05. Orange and blue borders around immunofluorescence images
perimental samples, respectively. All error bars represent SEM of pooled data.
Cell Metabolism 23, 1–15, January 12, 2016 ª2016 Elsevier Inc. 3
A
C
D E F
B
(legend on next page)
4 Cell Metabolism 23, 1–15, January 12, 2016 ª2016 Elsevier Inc.
Please cite this article in press as: Szabat et al., Reduced Insulin Production Relieves Endoplasmic Reticulum Stress and Induces b Cell Proliferation,Cell Metabolism (2016), http://dx.doi.org/10.1016/j.cmet.2015.10.016
Please cite this article in press as: Szabat et al., Reduced Insulin Production Relieves Endoplasmic Reticulum Stress and Induces b Cell Proliferation,Cell Metabolism (2016), http://dx.doi.org/10.1016/j.cmet.2015.10.016
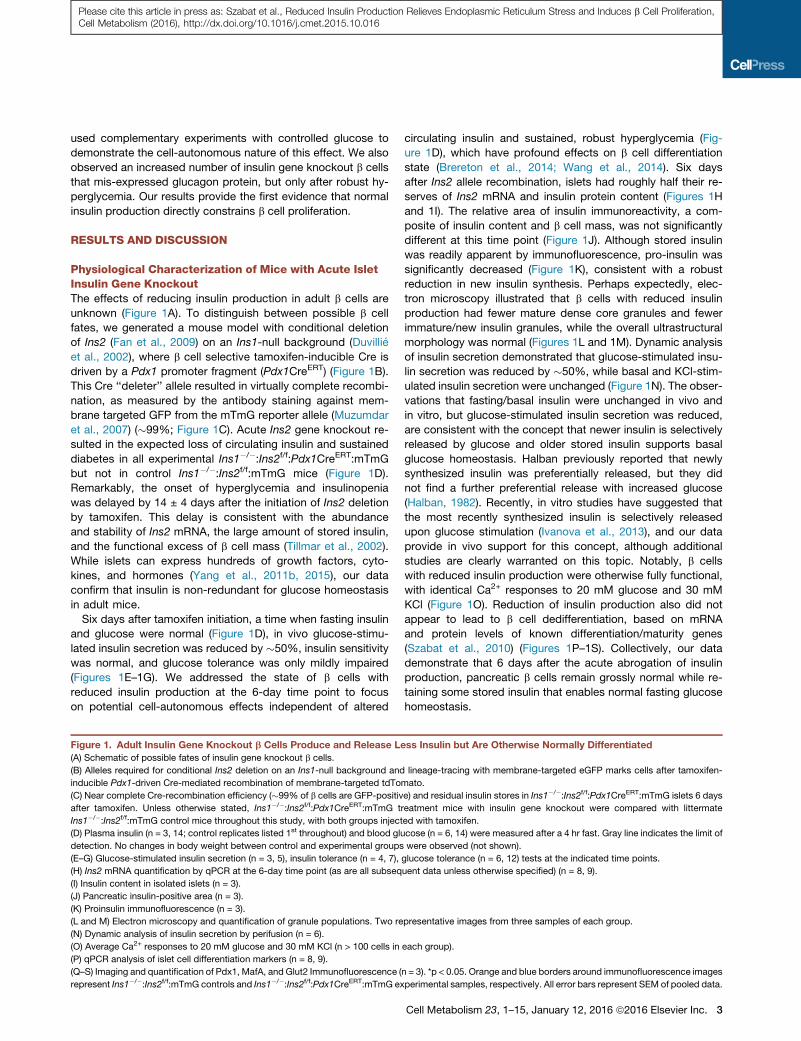
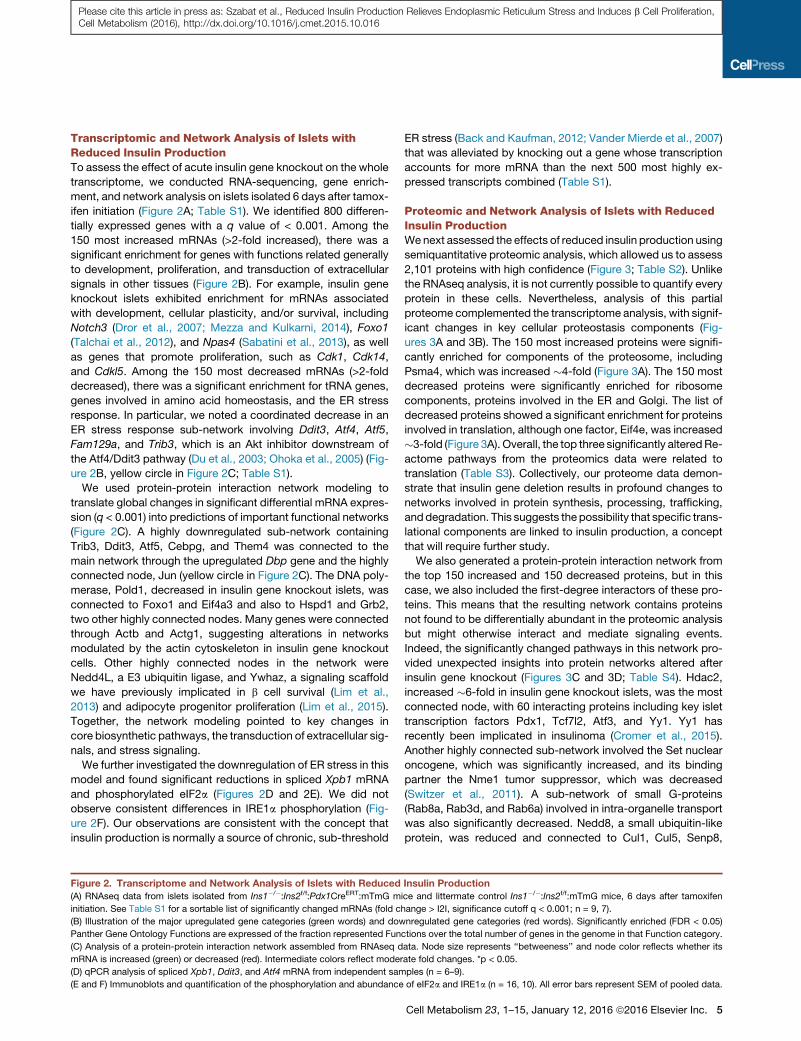
Transcriptomic and Network Analysis of Islets withReduced Insulin ProductionTo assess the effect of acute insulin gene knockout on the whole
transcriptome, we conducted RNA-sequencing, gene enrich-
ment, and network analysis on islets isolated 6 days after tamox-
ifen initiation (Figure 2A; Table S1). We identified 800 differen-
tially expressed genes with a q value of < 0.001. Among the
150 most increased mRNAs (>2-fold increased), there was a
significant enrichment for genes with functions related generally
to development, proliferation, and transduction of extracellular
signals in other tissues (Figure 2B). For example, insulin gene
knockout islets exhibited enrichment for mRNAs associated
with development, cellular plasticity, and/or survival, including
Notch3 (Dror et al., 2007; Mezza and Kulkarni, 2014), Foxo1
(Talchai et al., 2012), and Npas4 (Sabatini et al., 2013), as well
as genes that promote proliferation, such as Cdk1, Cdk14,
and Cdkl5. Among the 150 most decreased mRNAs (>2-fold
decreased), there was a significant enrichment for tRNA genes,
genes involved in amino acid homeostasis, and the ER stress
response. In particular, we noted a coordinated decrease in an
ER stress response sub-network involving Ddit3, Atf4, Atf5,
Fam129a, and Trib3, which is an Akt inhibitor downstream of
the Atf4/Ddit3 pathway (Du et al., 2003; Ohoka et al., 2005) (Fig-
ure 2B, yellow circle in Figure 2C; Table S1).
We used protein-protein interaction network modeling to
translate global changes in significant differential mRNA expres-
sion (q < 0.001) into predictions of important functional networks
(Figure 2C). A highly downregulated sub-network containing
Trib3, Ddit3, Atf5, Cebpg, and Them4 was connected to the
main network through the upregulated Dbp gene and the highly
connected node, Jun (yellow circle in Figure 2C). The DNA poly-
merase, Pold1, decreased in insulin gene knockout islets, was
connected to Foxo1 and Eif4a3 and also to Hspd1 and Grb2,
two other highly connected nodes. Many genes were connected
through Actb and Actg1, suggesting alterations in networks
modulated by the actin cytoskeleton in insulin gene knockout
cells. Other highly connected nodes in the network were
Nedd4L, a E3 ubiquitin ligase, and Ywhaz, a signaling scaffold
we have previously implicated in b cell survival (Lim et al.,
2013) and adipocyte progenitor proliferation (Lim et al., 2015).
Together, the network modeling pointed to key changes in
core biosynthetic pathways, the transduction of extracellular sig-
nals, and stress signaling.
We further investigated the downregulation of ER stress in this
model and found significant reductions in spliced Xpb1 mRNA
and phosphorylated eIF2a (Figures 2D and 2E). We did not
observe consistent differences in IRE1a phosphorylation (Fig-
ure 2F). Our observations are consistent with the concept that
insulin production is normally a source of chronic, sub-threshold
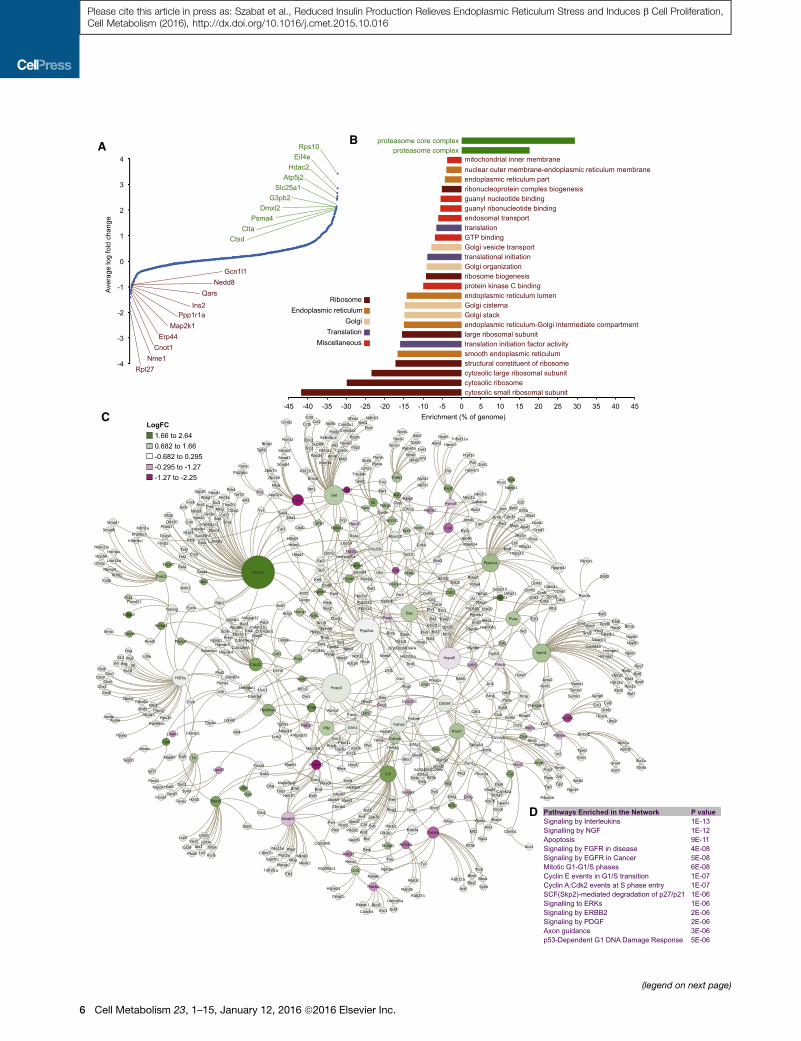
Figure 2. Transcriptome and Network Analysis of Islets with Reduced
(A) RNAseq data from islets isolated from Ins1�/�:Ins2f/f:Pdx1CreERT:mTmG m
initiation. See Table S1 for a sortable list of significantly changed mRNAs (fold c
(B) Illustration of the major upregulated gene categories (green words) and dow
Panther Gene Ontology Functions are expressed of the fraction represented Fun
(C) Analysis of a protein-protein interaction network assembled from RNAseq d
mRNA is increased (green) or decreased (red). Intermediate colors reflect moder
(D) qPCR analysis of spliced Xpb1, Ddit3, and Atf4 mRNA from independent sam
(E and F) Immunoblots and quantification of the phosphorylation and abundance
ER stress (Back and Kaufman, 2012; Vander Mierde et al., 2007)
that was alleviated by knocking out a gene whose transcription
accounts for more mRNA than the next 500 most highly ex-
pressed transcripts combined (Table S1).
Proteomic and Network Analysis of Islets with ReducedInsulin ProductionWenext assessed the effects of reduced insulin production using
semiquantitative proteomic analysis, which allowed us to assess
2,101 proteins with high confidence (Figure 3; Table S2). Unlike
the RNAseq analysis, it is not currently possible to quantify every
protein in these cells. Nevertheless, analysis of this partial
proteome complemented the transcriptome analysis, with signif-
icant changes in key cellular proteostasis components (Fig-
ures 3A and 3B). The 150 most increased proteins were signifi-
cantly enriched for components of the proteosome, including
Psma4, which was increased �4-fold (Figure 3A). The 150 most
decreased proteins were significantly enriched for ribosome
components, proteins involved in the ER and Golgi. The list of
decreased proteins showed a significant enrichment for proteins
involved in translation, although one factor, Eif4e, was increased
�3-fold (Figure 3A). Overall, the top three significantly alteredRe-
actome pathways from the proteomics data were related to
translation (Table S3). Collectively, our proteome data demon-
strate that insulin gene deletion results in profound changes to
networks involved in protein synthesis, processing, trafficking,
anddegradation. This suggests the possibility that specific trans-
lational components are linked to insulin production, a concept
that will require further study.
We also generated a protein-protein interaction network from
the top 150 increased and 150 decreased proteins, but in this
case, we also included the first-degree interactors of these pro-
teins. This means that the resulting network contains proteins
not found to be differentially abundant in the proteomic analysis
but might otherwise interact and mediate signaling events.
Indeed, the significantly changed pathways in this network pro-
vided unexpected insights into protein networks altered after
insulin gene knockout (Figures 3C and 3D; Table S4). Hdac2,
increased �6-fold in insulin gene knockout islets, was the most
connected node, with 60 interacting proteins including key islet
transcription factors Pdx1, Tcf7l2, Atf3, and Yy1. Yy1 has
recently been implicated in insulinoma (Cromer et al., 2015).
Another highly connected sub-network involved the Set nuclear
oncogene, which was significantly increased, and its binding
partner the Nme1 tumor suppressor, which was decreased
(Switzer et al., 2011). A sub-network of small G-proteins
(Rab8a, Rab3d, and Rab6a) involved in intra-organelle transport
was also significantly decreased. Nedd8, a small ubiquitin-like
protein, was reduced and connected to Cul1, Cul5, Senp8,
Insulin Production
ice and littermate control Ins1�/�:Ins2f/f:mTmG mice, 6 days after tamoxifen
hange > I2I, significance cutoff q < 0.001; n = 9, 7).
nregulated gene categories (red words). Significantly enriched (FDR < 0.05)
ctions over the total number of genes in the genome in that Function category.
ata. Node size represents ‘‘betweeness’’ and node color reflects whether its
ate fold changes. *p < 0.05.
ples (n = 6–9).
of eIF2a and IRE1a (n = 16, 10). All error bars represent SEM of pooled data.
Cell Metabolism 23, 1–15, January 12, 2016 ª2016 Elsevier Inc. 5
A B
C
D
(legend on next page)
6 Cell Metabolism 23, 1–15, January 12, 2016 ª2016 Elsevier Inc.
Please cite this article in press as: Szabat et al., Reduced Insulin Production Relieves Endoplasmic Reticulum Stress and Induces b Cell Proliferation,Cell Metabolism (2016), http://dx.doi.org/10.1016/j.cmet.2015.10.016
Please cite this article in press as: Szabat et al., Reduced Insulin Production Relieves Endoplasmic Reticulum Stress and Induces b Cell Proliferation,Cell Metabolism (2016), http://dx.doi.org/10.1016/j.cmet.2015.10.016
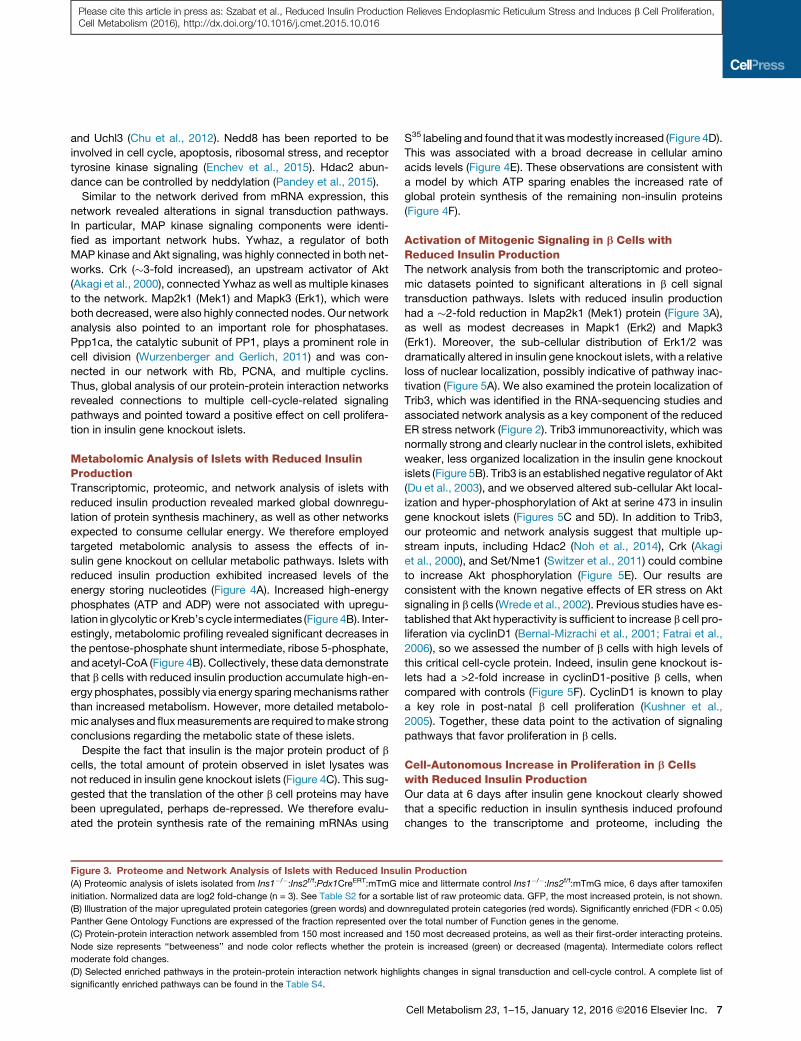
and Uchl3 (Chu et al., 2012). Nedd8 has been reported to be
involved in cell cycle, apoptosis, ribosomal stress, and receptor
tyrosine kinase signaling (Enchev et al., 2015). Hdac2 abun-
dance can be controlled by neddylation (Pandey et al., 2015).
Similar to the network derived from mRNA expression, this
network revealed alterations in signal transduction pathways.
In particular, MAP kinase signaling components were identi-
fied as important network hubs. Ywhaz, a regulator of both
MAP kinase and Akt signaling, was highly connected in both net-
works. Crk (�3-fold increased), an upstream activator of Akt
(Akagi et al., 2000), connected Ywhaz as well as multiple kinases
to the network. Map2k1 (Mek1) and Mapk3 (Erk1), which were
both decreased, were also highly connected nodes. Our network
analysis also pointed to an important role for phosphatases.
Ppp1ca, the catalytic subunit of PP1, plays a prominent role in
cell division (Wurzenberger and Gerlich, 2011) and was con-
nected in our network with Rb, PCNA, and multiple cyclins.
Thus, global analysis of our protein-protein interaction networks
revealed connections to multiple cell-cycle-related signaling
pathways and pointed toward a positive effect on cell prolifera-
tion in insulin gene knockout islets.
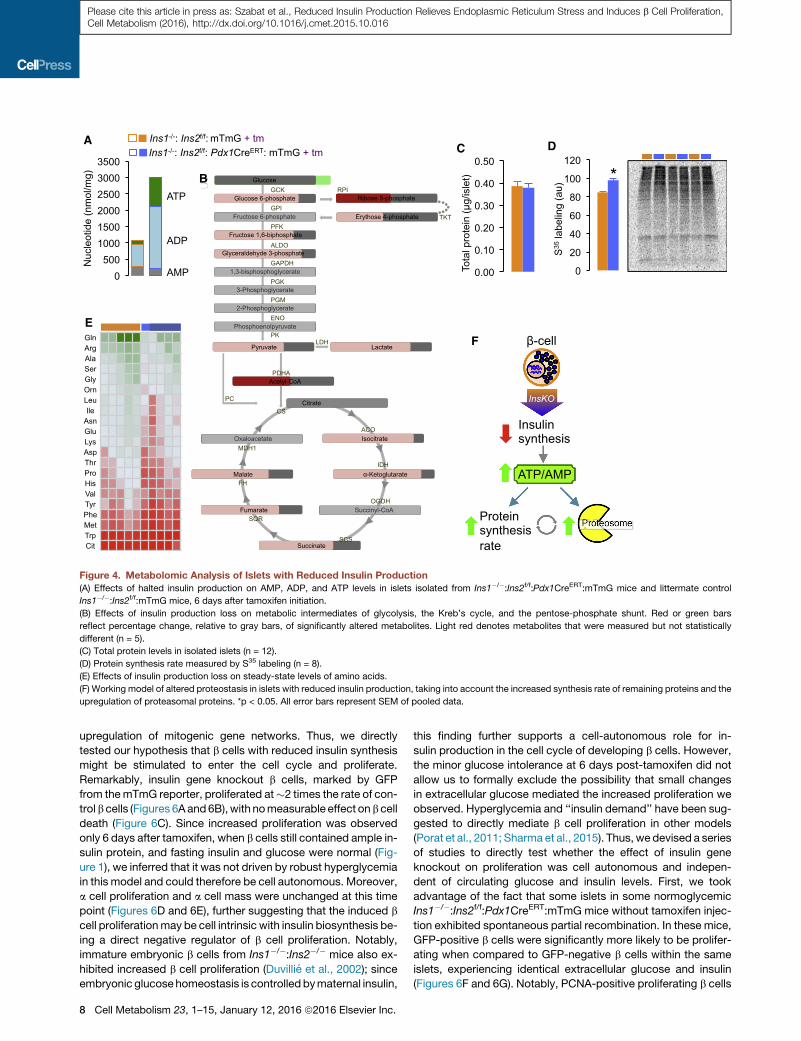
Metabolomic Analysis of Islets with Reduced InsulinProductionTranscriptomic, proteomic, and network analysis of islets with
reduced insulin production revealed marked global downregu-
lation of protein synthesis machinery, as well as other networks
expected to consume cellular energy. We therefore employed
targeted metabolomic analysis to assess the effects of in-
sulin gene knockout on cellular metabolic pathways. Islets with
reduced insulin production exhibited increased levels of the
energy storing nucleotides (Figure 4A). Increased high-energy
phosphates (ATP and ADP) were not associated with upregu-
lation in glycolytic orKreb’s cycle intermediates (Figure 4B). Inter-
estingly, metabolomic profiling revealed significant decreases in
the pentose-phosphate shunt intermediate, ribose 5-phosphate,
and acetyl-CoA (Figure 4B). Collectively, these data demonstrate
that b cells with reduced insulin production accumulate high-en-
ergyphosphates, possibly via energy sparingmechanisms rather
than increased metabolism. However, more detailed metabolo-
mic analyses and fluxmeasurements are required tomake strong
conclusions regarding the metabolic state of these islets.
Despite the fact that insulin is the major protein product of b
cells, the total amount of protein observed in islet lysates was
not reduced in insulin gene knockout islets (Figure 4C). This sug-
gested that the translation of the other b cell proteins may have
been upregulated, perhaps de-repressed. We therefore evalu-
ated the protein synthesis rate of the remaining mRNAs using
Figure 3. Proteome and Network Analysis of Islets with Reduced Insu
(A) Proteomic analysis of islets isolated from Ins1�/�:Ins2f/f:Pdx1CreERT:mTmG m
initiation. Normalized data are log2 fold-change (n = 3). See Table S2 for a sorta
(B) Illustration of the major upregulated protein categories (green words) and dow
Panther Gene Ontology Functions are expressed of the fraction represented ove
(C) Protein-protein interaction network assembled from 150 most increased and
Node size represents ‘‘betweeness’’ and node color reflects whether the prot
moderate fold changes.
(D) Selected enriched pathways in the protein-protein interaction network highli
significantly enriched pathways can be found in the Table S4.
S35 labeling and found that it wasmodestly increased (Figure 4D).
This was associated with a broad decrease in cellular amino
acids levels (Figure 4E). These observations are consistent with
a model by which ATP sparing enables the increased rate of
global protein synthesis of the remaining non-insulin proteins
(Figure 4F).
Activation of Mitogenic Signaling in b Cells withReduced Insulin ProductionThe network analysis from both the transcriptomic and proteo-
mic datasets pointed to significant alterations in b cell signal
transduction pathways. Islets with reduced insulin production
had a �2-fold reduction in Map2k1 (Mek1) protein (Figure 3A),
as well as modest decreases in Mapk1 (Erk2) and Mapk3
(Erk1). Moreover, the sub-cellular distribution of Erk1/2 was
dramatically altered in insulin gene knockout islets, with a relative
loss of nuclear localization, possibly indicative of pathway inac-
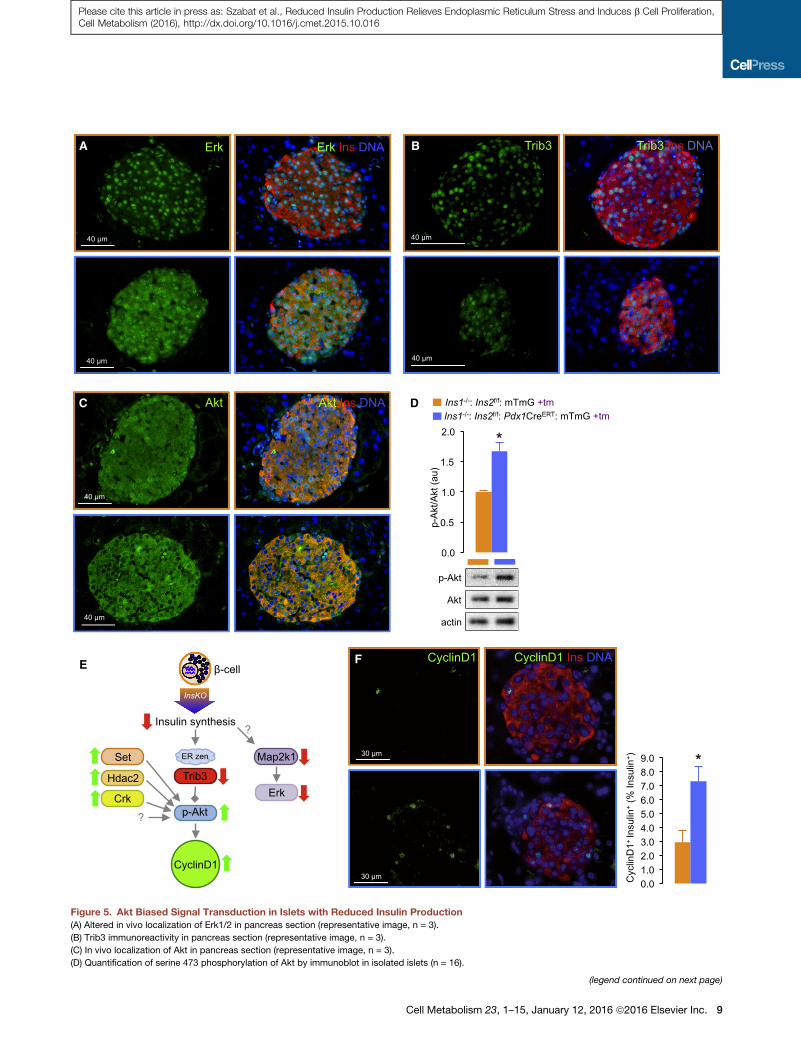
tivation (Figure 5A). We also examined the protein localization of
Trib3, which was identified in the RNA-sequencing studies and
associated network analysis as a key component of the reduced
ER stress network (Figure 2). Trib3 immunoreactivity, which was
normally strong and clearly nuclear in the control islets, exhibited
weaker, less organized localization in the insulin gene knockout
islets (Figure 5B). Trib3 is an established negative regulator of Akt
(Du et al., 2003), and we observed altered sub-cellular Akt local-
ization and hyper-phosphorylation of Akt at serine 473 in insulin
gene knockout islets (Figures 5C and 5D). In addition to Trib3,
our proteomic and network analysis suggest that multiple up-
stream inputs, including Hdac2 (Noh et al., 2014), Crk (Akagi
et al., 2000), and Set/Nme1 (Switzer et al., 2011) could combine
to increase Akt phosphorylation (Figure 5E). Our results are
consistent with the known negative effects of ER stress on Akt
signaling in b cells (Wrede et al., 2002). Previous studies have es-
tablished that Akt hyperactivity is sufficient to increase b cell pro-
liferation via cyclinD1 (Bernal-Mizrachi et al., 2001; Fatrai et al.,
2006), so we assessed the number of b cells with high levels of
this critical cell-cycle protein. Indeed, insulin gene knockout is-
lets had a >2-fold increase in cyclinD1-positive b cells, when
compared with controls (Figure 5F). CyclinD1 is known to play
a key role in post-natal b cell proliferation (Kushner et al.,
2005). Together, these data point to the activation of signaling
pathways that favor proliferation in b cells.
Cell-Autonomous Increase in Proliferation in b Cellswith Reduced Insulin ProductionOur data at 6 days after insulin gene knockout clearly showed
that a specific reduction in insulin synthesis induced profound
changes to the transcriptome and proteome, including the
lin Production
ice and littermate control Ins1�/�:Ins2f/f:mTmG mice, 6 days after tamoxifen
ble list of raw proteomic data. GFP, the most increased protein, is not shown.
nregulated protein categories (red words). Significantly enriched (FDR < 0.05)
r the total number of Function genes in the genome.
150 most decreased proteins, as well as their first-order interacting proteins.
ein is increased (green) or decreased (magenta). Intermediate colors reflect
ghts changes in signal transduction and cell-cycle control. A complete list of
Cell Metabolism 23, 1–15, January 12, 2016 ª2016 Elsevier Inc. 7
A
E
F
B
C D
Figure 4. Metabolomic Analysis of Islets with Reduced Insulin Production
(A) Effects of halted insulin production on AMP, ADP, and ATP levels in islets isolated from Ins1�/�:Ins2f/f:Pdx1CreERT:mTmG mice and littermate control
Ins1�/�:Ins2f/f:mTmG mice, 6 days after tamoxifen initiation.
(B) Effects of insulin production loss on metabolic intermediates of glycolysis, the Kreb’s cycle, and the pentose-phosphate shunt. Red or green bars
reflect percentage change, relative to gray bars, of significantly altered metabolites. Light red denotes metabolites that were measured but not statistically
different (n = 5).
(C) Total protein levels in isolated islets (n = 12).
(D) Protein synthesis rate measured by S35 labeling (n = 8).
(E) Effects of insulin production loss on steady-state levels of amino acids.
(F) Working model of altered proteostasis in islets with reduced insulin production, taking into account the increased synthesis rate of remaining proteins and the
upregulation of proteasomal proteins. *p < 0.05. All error bars represent SEM of pooled data.
Please cite this article in press as: Szabat et al., Reduced Insulin Production Relieves Endoplasmic Reticulum Stress and Induces b Cell Proliferation,Cell Metabolism (2016), http://dx.doi.org/10.1016/j.cmet.2015.10.016
upregulation of mitogenic gene networks. Thus, we directly
tested our hypothesis that b cells with reduced insulin synthesis
might be stimulated to enter the cell cycle and proliferate.
Remarkably, insulin gene knockout b cells, marked by GFP
from themTmG reporter, proliferated at�2 times the rate of con-
trolb cells (Figures 6Aand6B),with nomeasurable effect onb cell
death (Figure 6C). Since increased proliferation was observed
only 6 days after tamoxifen, when b cells still contained ample in-
sulin protein, and fasting insulin and glucose were normal (Fig-
ure 1), we inferred that it was not driven by robust hyperglycemia
in this model and could therefore be cell autonomous. Moreover,
a cell proliferation and a cell mass were unchanged at this time
point (Figures 6D and 6E), further suggesting that the induced b
cell proliferationmay be cell intrinsic with insulin biosynthesis be-
ing a direct negative regulator of b cell proliferation. Notably,
immature embryonic b cells from Ins1�/�:Ins2�/� mice also ex-
hibited increased b cell proliferation (Duvillie et al., 2002); since
embryonic glucosehomeostasis is controlled bymaternal insulin,
8 Cell Metabolism 23, 1–15, January 12, 2016 ª2016 Elsevier Inc.
this finding further supports a cell-autonomous role for in-
sulin production in the cell cycle of developing b cells. However,
the minor glucose intolerance at 6 days post-tamoxifen did not
allow us to formally exclude the possibility that small changes
in extracellular glucose mediated the increased proliferation we
observed. Hyperglycemia and ‘‘insulin demand’’ have been sug-
gested to directly mediate b cell proliferation in other models
(Porat et al., 2011; Sharma et al., 2015). Thus, we devised a series
of studies to directly test whether the effect of insulin gene
knockout on proliferation was cell autonomous and indepen-
dent of circulating glucose and insulin levels. First, we took
advantage of the fact that some islets in some normoglycemic
Ins1�/�:Ins2f/f:Pdx1CreERT:mTmG mice without tamoxifen injec-
tion exhibited spontaneous partial recombination. In these mice,
GFP-positive b cells were significantly more likely to be prolifer-
ating when compared to GFP-negative b cells within the same
islets, experiencing identical extracellular glucose and insulin
(Figures 6F and 6G). Notably, PCNA-positive proliferating b cells
A
C
F
D
E
B
Figure 5. Akt Biased Signal Transduction in Islets with Reduced Insulin Production
(A) Altered in vivo localization of Erk1/2 in pancreas section (representative image, n = 3).
(B) Trib3 immunoreactivity in pancreas section (representative image, n = 3).
(C) In vivo localization of Akt in pancreas section (representative image, n = 3).
(D) Quantification of serine 473 phosphorylation of Akt by immunoblot in isolated islets (n = 16).
(legend continued on next page)
Cell Metabolism 23, 1–15, January 12, 2016 ª2016 Elsevier Inc. 9
Please cite this article in press as: Szabat et al., Reduced Insulin Production Relieves Endoplasmic Reticulum Stress and Induces b Cell Proliferation,Cell Metabolism (2016), http://dx.doi.org/10.1016/j.cmet.2015.10.016
Please cite this article in press as: Szabat et al., Reduced Insulin Production Relieves Endoplasmic Reticulum Stress and Induces b Cell Proliferation,Cell Metabolism (2016), http://dx.doi.org/10.1016/j.cmet.2015.10.016
exhibited significantly reduced insulin staining intensity on
average in these partially recombined islets (Figure 6H). Second,
we co-transplanted 50 Ins1�/�:Ins2f/f:Pdx1CreERT:mTmG islets
and 50 Ins1�/�:Ins2f/f:mTmG control islets into the same anterior
eye chamber of recipient mice that were then injected with
tamoxifen and remained normoglycemic for the duration of
the experiment (fasted blood glucose before graft harvest was
6.3 ± 0.4 mM). Again, we observed significantly increased b cell
proliferation in insulin gene knockout b cells (marked by GFP),
when compared to adjacent co-transplanted GFP-negative
Ins1�/�:Ins2f/f:mTmG control cells within the same eye graft (Fig-
ures 6I and 6J). Third, we compared cells within the same in vitro
cultures of dispersed islets with partial recombination and
observed a significant increase in the proliferation rate (this
time measured with EdU incorporation) of GFP-positive insulin
gene knockout b cells, relative to GFP-negative control b cells
(Figures 6K and 6L). Collectively, these experiments strongly
suggest that reduced insulin production drives b cell prolifera-
tion in a cell-autonomous manner, independently of changes
in extracellular glucose or insulin. In vitro studies of human
b cell lines clearly illustrate the converse cell-autonomous effect
(i.e., that inhibition of proliferation in sub-differentiated cells
dramatically increases insulin production) (Scharfmann et al.,
2014). We propose that multiple parallel pathways contribute
to drive proliferation in b cells with reduced insulin production.
Usually, proliferation is kept at very low levels in fully functional
mature b cells (Beith et al., 2008; Mezza and Kulkarni, 2014;
Teta et al., 2005), and it appears from our results that
sub-threshold chronic ER stress associated with the normal
high rate of insulin production is among the many factors that
can act as a brake on proliferation. In our study, relief from ER
stress was associated with reduced Ddit3, and knockout of
this critical transcription factor is sufficient to increase b cell
proliferation in db/dbmice (Song et al., 2008). Higher ATP levels
in insulin gene knockout islets likely facilitate increased prolifer-
ation. Recently, Alonso and colleagues reported that mild ER
stress is associated with increased b cell proliferation in the
context of sustained hyperglycemia, and that this effect could
be reversed by ATF6 and IRE1 inhibitors, but not an inhibitor
of the PERK pathway (Sharma et al., 2015). It appears that ER
stress has complex context-dependent and pathway-specific
links to the b cell proliferative machinery.
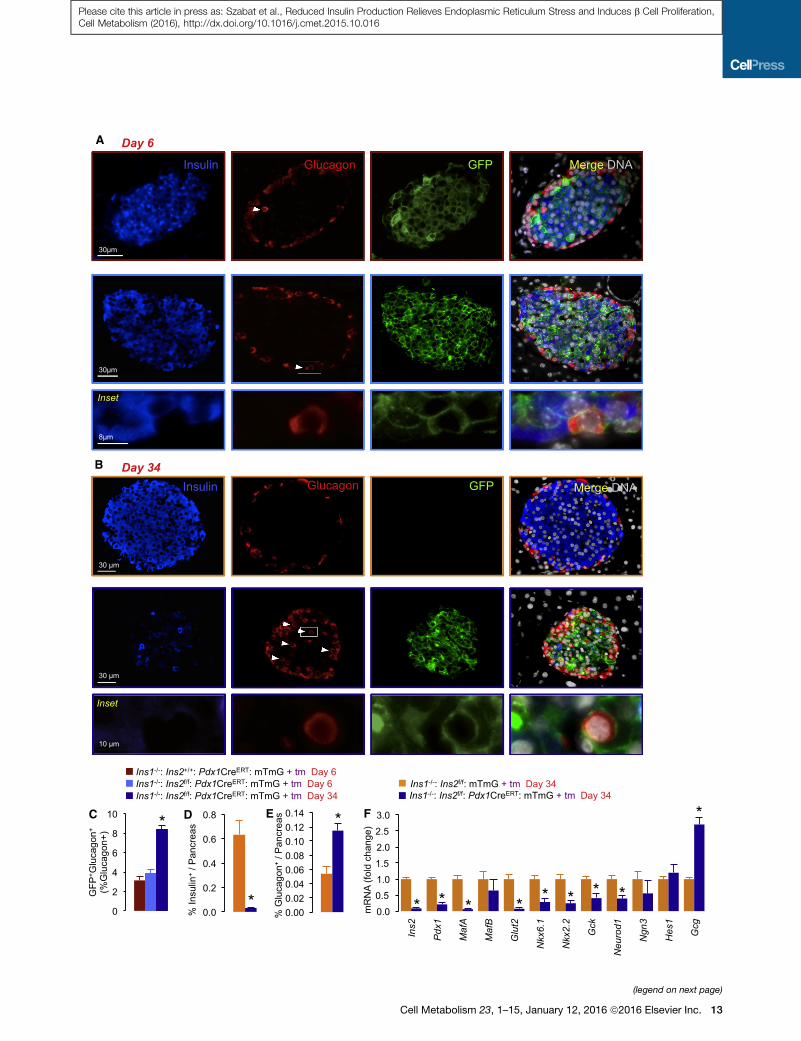
Cell Identity Confusion and Eventual De-Differentiationin Insulin Gene Knockout IsletsFinally, we assessed whether the loss of insulin productionmight
affect b cell identity, directly or indirectly (Szabat et al., 2012)
(Figures 7A–7C). Examination 6 days after tamoxifen initiation
revealed that 3.8% ± 0.4% of glucagon-positive cells co-ex-
pressed GFP but not insulin, but this was not significantly higher
than the background rate of recombination in islets without insu-
lin gene knockout, suggesting it was not caused by a cell-auton-
omous loss of insulin production (Figures 7A and 7C). However,
(E) Working model of shifted signaling in islets with reduced insulin production
activation.
(F) CyclinD1 immunoreactivity in b cells. (Representative image, n = 3.) *p < 0.
Ins1�/�:Ins2f/f:mTmG controls and Ins1�/�:Ins2f/f:Pdx1CreERT:mTmG experiment
10 Cell Metabolism 23, 1–15, January 12, 2016 ª2016 Elsevier Inc.
after 34 days, including �2 weeks of diabetes caused by dra-
matic loss of pancreatic insulin stores (Figures 7B and 7D),
8.3% ± 0.5% of glucagon-positive cells expressed GFP (Fig-
ure 7C). Many of the glucagon-positive cells were found in the
islet core (Figure 7B), suggesting they may have converted
from b cells that normally reside in the center of mouse islets.
After 34 days, glucagon-positive area in histological pancre-
atic sections was more than doubled (Figure 7E), as was islet
glucagon mRNA (Figure 7F). At the 34 day time point, we
observed significant ‘‘islet de-differentiation’’ with reduced
Pdx1, MafA, and other markers of mature b cells (Figure 7F). At
this late hyperglycemic stage, the altered islet architecture and
increased glucagon expression appears remarkably similar to
islets after b-cell-specific Pdx1 knockout, including the dramatic
loss of the same mature b cell markers (Gao et al., 2014). Given
that hyperglycemia has previously been implicated in glucagon
mis-expression (Brereton et al., 2014; Gao et al., 2014; Talchai
et al., 2012), it seems a likely culprit for contributing to the
apparent mis-expression of glucagon in a sub-population of
insulin gene knockout b cells. While the exact mechanisms
of this phenomenon remain to be identified, it is notable that
b cell phenotypic plasticity has been previously observed in
b cells lacking adaptive PERK-mediated phosphorylation of
eIF2a (Kaufman et al., 2010), as well as cells overexpressing
constitutively active Akt (Elghazi et al., 2009).
In summary, we present the first direct evidence that normally
high insulin production directly suppresses b cell proliferation
associated with sub-threshold chronic ER stress and is required
to maintain b cell identity indirectly via glucose homeostasis.
Mechanistically, we define protein networks associated with
the loss of insulin production and identify new candidate factors
that may accelerate efforts to induce b cell proliferation. These
fundamental studies shed light on the molecular sequelae of
reduced insulin production associated with diabetes (Yang
et al., 2011a).
EXPERIMENTAL PROCEDURES
Animals and In Vivo Physiology
Animal protocols were performed in accordance with the University of British
Columbia Animal Care Committee. Ins1�/�:Ins2flf mice have been described
(Fan et al., 2009). Pdx1CreERT mice (Gu et al., 2002) were purchased from
Jax (stock # 024968). Mice carrying the lineage tracing marker membrane-
targeted tomato/membrane-targeted GFP (Muzumdar et al., 2007) were
purchased from Jax (stock # 007675). Mice (6–8 weeks old) were injected in-
traperioneally with tamoxifen (3 mg/40 g body weight), dissolved in corn oil, for
4 consecutive days. Basal blood glucose and insulin were measured after a
4 hr fast. Glucose tolerance, insulin secretion, or insulin tolerance were as-
sessed in mice injected with either 200 mg/ml (20%) glucose or 1.5 U/kg
body weight insulin after a 4 hr fast. Insulin from in vivo samples wasmeasured
using ELISA kits from Alpco.
Islet Transplantation and Tissue Processing
To examine possible effects of blood glucose on the increased proliferation
and glucagon mis-expression in insulin knockout b cells, islets from control
, illustrating the multiple positive influences on Akt activation and CyclinD1
05. Orange and blue borders around immunofluorescence images represent
al samples, respectively. All error bars represent SEM of pooled data.

A
F
I
K
B
D
G
J
L
H
E
C
Figure 6. Cell-Autonomous Increase in b Cell Proliferation after Reduced Insulin Production
(A and B) PCNA, insulin, and GFP immunofluorescent staining in b cells in littermate controls Ins1�/�:Ins2f/f:mTmG (no tamoxifen) and Ins1�/�:Ins2f/f::Pdx1CreERT:mTmG (insulin gene knockout) pancreata, 6 days following the initial tamoxifen dose, and quantification of b cell proliferation (n = 3).
(C) Number of TUNEL-positive b cells (n = 3).
(D) Quantification of a cell proliferation from the same mice (n = 3).
(E) Pancreatic glucagon-positive area at the 6-day time point (n = 3).
(legend continued on next page)
Cell Metabolism 23, 1–15, January 12, 2016 ª2016 Elsevier Inc. 11
Please cite this article in press as: Szabat et al., Reduced Insulin Production Relieves Endoplasmic Reticulum Stress and Induces b Cell Proliferation,Cell Metabolism (2016), http://dx.doi.org/10.1016/j.cmet.2015.10.016
Please cite this article in press as: Szabat et al., Reduced Insulin Production Relieves Endoplasmic Reticulum Stress and Induces b Cell Proliferation,Cell Metabolism (2016), http://dx.doi.org/10.1016/j.cmet.2015.10.016
and experimental animals were co-transplanted into normoglycemic
recipient mice to maintain the same exposure to glucose and insulin. A
mixture of equal numbers of 50 hand-picked islets isolated from donor
control mice (Ins1�/�: Ins2flf: mTmG) and donor insulin knockout mice
(Ins1�/�:Ins2flf: Pdx1CreERT: mTmG) were co-transplanted into age-
matched recipient NOD-SCID mice into the anterior chamber of the eye
(Mojibian et al., 2013).
Ten days after transplantation, animals were injected intraperioneally with
tamoxifen (3 mg/40 g body weight), dissolved in corn oil, for 4 consecutive
days. Graft tissues were harvested 3 weeks post-tamoxifen initiation. Eyes
with engrafted islets were placed in Davidson’s fixative (two parts 37%
formalin, three parts 100% ethanol, one part glacial acetic acid, and three
parts tap water) for 24 hr at 4�C, then transferred to 70% ethanol for storage.
Tissues were processed into 5 mm paraffin sections and mounted by Wax-it
Histology Services (Vancouver, Canada).
Immunohistochemistry
Pancreata from PBS perfused mice were harvested and fixed in 4% parafor-
maldehyde for 24 hr before being washed and stored in 70% ethanol, prior
to paraffin embedding. Pancreatic sections (5 mm) were taken from at least
three different regions of the pancreas 100 mm apart. Sections were deparaf-
finized, hydrated with decreasing concentrations of ethanol, and rinsed with
PBS. Sections were subjected to 15 min of heat-induced epitope retrieval at
95�C using a 10 mM citrate buffer, pH 6.0. Sections were blocked then
incubated with primary antibodies overnight in a humid chamber at 4�C. Alist of primary antibodies can be found in Table S5. Primary antibodies
were visualized following incubation with secondary antibodies conjugated
to AlexaFluor 488, 555, 594, or 647 as required (1:1,000; Invitrogen) or using
anti-guinea pig AMCA (1:250; Jackson Immunologicals). TUNEL reactivity
was detected using the In Situ Cell Death Kit (Roche). Images for b cell
and a cell area were taken on ImageXpressMICRO using a 103 (NA 0.3) objec-
tive and analyzed using the MetaXpress software (Molecular Devices Corpo-
ration). All other images were taken on a Zeiss 200M microscope using 203
air (NA 0.75), 403 oil (NA 1.3), and/or 1003 oil (NA 1.45) objectives and
analyzed using Slidebook software.
Electron Microscopy
Pancreas tissue from control and experimental mice at 6 days post-tamoxifen
initiation were cut into small pieces and stored in 2% glutaraldehyde diluted in
PBS. Samples were processed by the Electron Microscopy Facility at McMas-
ter University, Faculty of Health Sciences (Hamilton). The samples were rinsed
twice in 0.1 M phosphate buffer pH 7.4 and post-fixed in 1% osmium tetroxide
in 0.1 M phosphate buffer for 1 hr. The samples were dehydrated through a
graded ethanol series with final dehydration in propylene oxide, then infiltrated
and embedded with Spurr’s resin. Thin sections were cut on a Leica UCT
Ultramicrotome, picked up onto Cu grids, then post-stained with uranyl ace-
tate and lead citrate and viewed in a JEOL JEM 1200 EX TEMSCAN transmis-
sion electron microscope (JEOL) operating at an accelerating voltage of 80 kV.
The images were acquired with an AMT 4megapixel digital camera (Advanced
Microscopy Techniques).
Islet Isolation and Culture
Pancreatic islets were isolated using collagenase, filtration, and hand-picking
as described (Szabat et al., 2010). Islets were cultured overnight (37�C, 5%CO2) in RPMI1640 medium (Invitrogen) with 11 mM glucose (Sigma), 100
(F and G) Cell-by-cell analysis of b cell proliferation within the same islets with p
GFP-negative cells counted per n from islets with �40%–50% recombination).
(H) Proliferating (PCNA-positive) b cells exhibited lower insulin staining intensity
(I and J) Increased proliferation in Ins1�/�:Ins2f/f:Pdx1CreERT:mTmG (insulin gen
control islets co-transplanted side-by-side into normoglycemic recipient mice in
donors—2 donors per recipient; >2,000 GFP-positive and GFP-negative cells co
(K and L) Increased proliferation (EdU incorporation) in insulin gene knockout b cells
with control non-recombined b cells cultured in the same dish in 5 mMglucose con
0.05. White arrowheads: PCNA-positive b cells (marked by insulin-positive and/or
negative b cells. Orange and blue borders around immunofluorescence images
experimental samples, respectively. All error bars represent SEM of pooled data.
12 Cell Metabolism 23, 1–15, January 12, 2016 ª2016 Elsevier Inc.
units/ml penicillin, 100 mg/ml streptomycin (Invitrogen), and 10% vol/vol FBS
(Invitrogen). Real-time RT-PCR and western blotting were conducted as
described previously (Szabat et al., 2010; Yang et al., 2011b). Lists of anti-
bodies and primers used can be found in Tables S5 and S6.
Multi-Omics Analysis
Detailed methods for the RNA sequencing, mass spectroscopy-based pro-
teomics, and metabolomics are provided in the Supplemental Experimental
Procedures. Briefly, RNA sequencing was conducted with HiSeq2500, col-
lecting >20 million nucleotide 150 bp paired-end reads. TopHat2 was used
to align reads to the GRCm38_68 reference genome. Expression levels
were quantified with RNA-SeQC in strictMode and differential expression
analysis was performed on the gene-level read count data using the limma
empirical Bayes analysis pipeline with voom precision weights for normaliza-
tion. After correcting for multiple testing, a q value < 0.001 was deemed sig-
nificant. Raw and processed RNA sequencing data have been submitted to
GEO (GEO: GSE74113). Briefly, proteomic analysis employed LC/MS/MS
and obtained a partial proteome of �3,000 high-confidence proteins (identi-
fied via at least two independent peptide spectra). The study was repeated
three times with separate biological replicates. We excluded any proteins for
which we only had readings in one biological replicate. We excluded pro-
teins for which there was poor agreement between biological replicate
runs (SD > 50% of the average intensity measurement). Results were plotted
as log2 fold change. Results were analyzed using Genemania, Panther,
Reactome, and DAVID. Network analysis was conducted as described in
the Supplemental Experimental Procedures. Metabolomics analyses were
conducted by ultra-performance liquid chromatography-tandem mass
spectrometry.
Statistical Analysis
Unless otherwise indicated, data are expressed as mean ± SEM. Results were
considered statistically significant when p < 0.05 using two-tailed, unpaired
Student t test, unless otherwise indicated.
SUPPLEMENTAL INFORMATION
Supplemental Information includes six tables and Supplemental Experimental
Procedures and can be found with this article online at http://dx.doi.org/10.
1016/j.cmet.2015.10.016.
AUTHOR CONTRIBUTIONS
M.S. designed experiments, performed experiments, analyzed data, and
co-wrote the manuscript. M.M.P., E.P., S. Skovsø, M.M., J.F.-T., and J.H. de-
signed experiments, performed experiments, analyzed data, and edited the
manuscript. J.E.B. analyzed data, and edited the manuscript. M.J.B.,
J.T.C.L., E.E.X., K.-M.M., and S. Sinha performed experiments, analyzed
data, and edited the manuscript. F.T. and S.O.’D. performed experiments.
M.v.d.B. analyzed data and edited the manuscript. Y.F. and M.T. provided
essential research tools and edited the manuscript. F.C.L. designed studies,
analyzed data, and edited the manuscript. C.H.B., L.J.F., C.N., and T.J.K. de-
signed experiments; oversaw experiments; and edited the manuscript. J.D.J.
conceptualized and designed studies, performed analysis, co-wrote the
manuscript, and takes full responsibility for its contents.
artial spontaneous recombination (n = 3 pancreata; >2,000 GFP-positive and
than non-proliferating b cells (n = 3).
e knockout) b cells (green) compared with b cells from Ins1�/�:Ins2f/f:mTmG
jected with tamoxifen (n = 4 recipients, 8 paired control and experimental islet
unted per replicate).
(green) from dispersed islets with spontaneous partial recombination compared
taining media (n = 3 independent islet isolations; similar islets as [F] and [G]). *p <
GFP-positive staining); pink arrowheads: PCNA-positive/insulin-positive/GFP-
represent Ins1�/�:Ins2f/f:mTmG controls and Ins1�/�:Ins2f/f:Pdx1CreERT:mTmG
A
B
C D E F
(legend on next page)
Cell Metabolism 23, 1–15, January 12, 2016 ª2016 Elsevier Inc. 13
Please cite this article in press as: Szabat et al., Reduced Insulin Production Relieves Endoplasmic Reticulum Stress and Induces b Cell Proliferation,Cell Metabolism (2016), http://dx.doi.org/10.1016/j.cmet.2015.10.016
Please cite this article in press as: Szabat et al., Reduced Insulin Production Relieves Endoplasmic Reticulum Stress and Induces b Cell Proliferation,Cell Metabolism (2016), http://dx.doi.org/10.1016/j.cmet.2015.10.016
CONFLICTS OF INTEREST
None of the authors have any conflicts of interest to disclose.
ACKNOWLEDGMENTS
We thank Dr. Alireza Rezania (BetaLogics) for the generous gift of MafA anti-
body. We thank Micah Piske and Betty Hu for their expert technical help and
Dr. Tobias Boothe for assistance with RNAseq analysis and a careful reading
of the manuscript. We thank Marcia Reid of the McMaster University Electron
Microscopy Facility for expert imaging work. We thank Dr. Eric Jan for assis-
tance with S35 labeling, and for reading the manuscript. We thank Dr. Eliza-
beth Rideout for reading of the manuscript. We appreciate the constructive
comments from the peer reviewers and many colleagues that improved the
study.
This study was funded by grants from the JDRF and the Canadian Diabetes
Association (CDA). M.S., J.E.B., and M.M.P. were supported by CDA Post-
doctoral Fellowships. M.S. and E.P. were supported by CIHR Transplant
Training Post-doctoral Fellowships. This research was enabled in part by sup-
port provided by WestGrid (https://www.westgrid.ca) and Compute Canada/
Calcul Canada (https://www.computecanada.ca).
Received: April 15, 2015
Revised: September 13, 2015
Accepted: October 25, 2015
Published: November 25, 2015
REFERENCES
Akagi, T., Shishido, T., Murata, K., and Hanafusa, H. (2000). v-Crk activates the
phosphoinositide 3-kinase/AKT pathway in transformation. Proc. Natl. Acad.
Sci. USA 97, 7290–7295.
Akirav, E., Kushner, J.A., and Herold, K.C. (2008). Beta-cell mass and type 1
diabetes: going, going, gone? Diabetes 57, 2883–2888.
Back, S.H., and Kaufman, R.J. (2012). Endoplasmic reticulum stress and type
2 diabetes. Annu. Rev. Biochem. 81, 767–793.
Beith, J.L., Alejandro, E.U., and Johnson, J.D. (2008). Insulin stimulates pri-
mary beta-cell proliferation via Raf-1 kinase. Endocrinology 149, 2251–2260.
Bernal-Mizrachi, E., Wen, W., Stahlhut, S., Welling, C.M., and Permutt, M.A.
(2001). Islet beta cell expression of constitutively active Akt1/PKB alpha
induces striking hypertrophy, hyperplasia, and hyperinsulinemia. J. Clin.
Invest. 108, 1631–1638.
Brereton, M.F., Iberl, M., Shimomura, K., Zhang, Q., Adriaenssens, A.E.,
Proks, P., Spiliotis, I.I., Dace, W., Mattis, K.K., Ramracheya, R., et al. (2014).
Reversible changes in pancreatic islet structure and function produced by
elevated blood glucose. Nat. Commun. 5, 4639.
Chera, S., Baronnier, D., Ghila, L., Cigliola, V., Jensen, J.N., Gu, G., Furuyama,
K., Thorel, F., Gribble, F.M., Reimann, F., and Herrera, P.L. (2014). Diabetes
recovery by age-dependent conversion of pancreatic d-cells into insulin pro-
ducers. Nature 514, 503–507.
Chu, K.Y., Li, H., Wada, K., and Johnson, J.D. (2012). Ubiquitin C-terminal hy-
drolase L1 is required for pancreatic beta cell survival and function in lipotoxic
conditions. Diabetologia 55, 128–140.
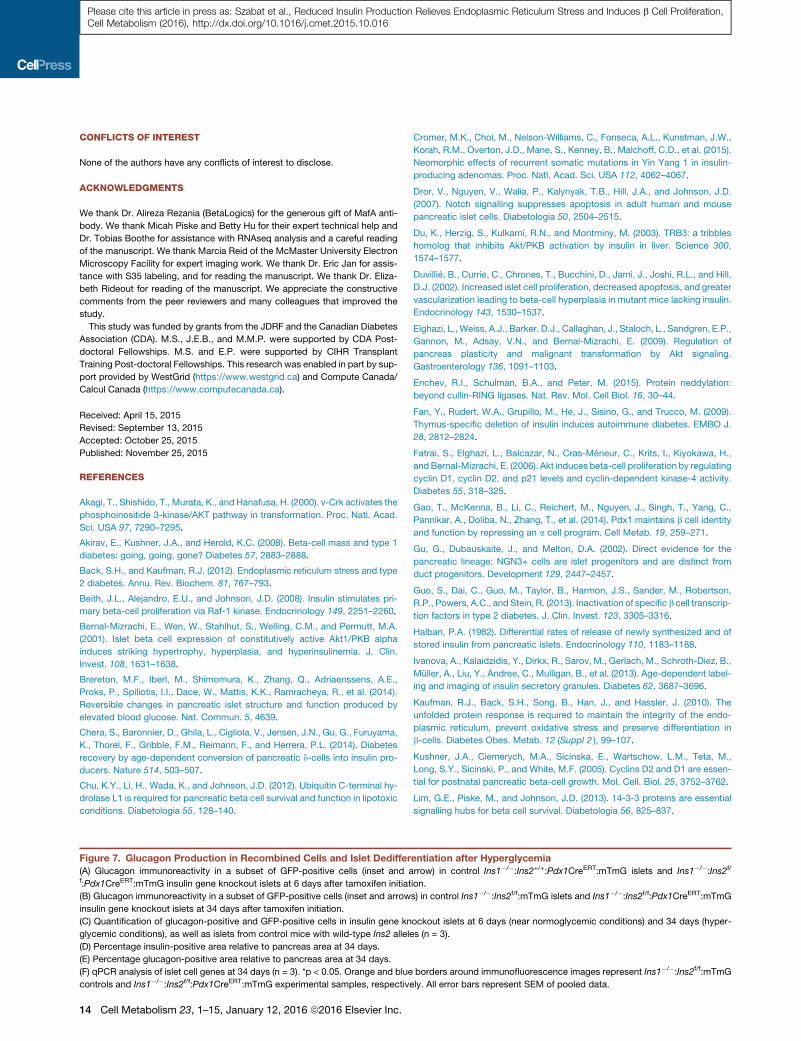
Figure 7. Glucagon Production in Recombined Cells and Islet Dediffer
(A) Glucagon immunoreactivity in a subset of GFP-positive cells (inset and af:Pdx1CreERT:mTmG insulin gene knockout islets at 6 days after tamoxifen initiat
(B) Glucagon immunoreactivity in a subset of GFP-positive cells (inset and arrow
insulin gene knockout islets at 34 days after tamoxifen initiation.
(C) Quantification of glucagon-positive and GFP-positive cells in insulin gene kn
glycemic conditions), as well as islets from control mice with wild-type Ins2 allele
(D) Percentage insulin-positive area relative to pancreas area at 34 days.
(E) Percentage glucagon-positive area relative to pancreas area at 34 days.
(F) qPCR analysis of islet cell genes at 34 days (n = 3). *p < 0.05. Orange and blue
controls and Ins1�/�:Ins2f/f:Pdx1CreERT:mTmG experimental samples, respective
14 Cell Metabolism 23, 1–15, January 12, 2016 ª2016 Elsevier Inc.
Cromer, M.K., Choi, M., Nelson-Williams, C., Fonseca, A.L., Kunstman, J.W.,
Korah, R.M., Overton, J.D., Mane, S., Kenney, B., Malchoff, C.D., et al. (2015).
Neomorphic effects of recurrent somatic mutations in Yin Yang 1 in insulin-
producing adenomas. Proc. Natl. Acad. Sci. USA 112, 4062–4067.
Dror, V., Nguyen, V., Walia, P., Kalynyak, T.B., Hill, J.A., and Johnson, J.D.
(2007). Notch signalling suppresses apoptosis in adult human and mouse
pancreatic islet cells. Diabetologia 50, 2504–2515.
Du, K., Herzig, S., Kulkarni, R.N., and Montminy, M. (2003). TRB3: a tribbles
homolog that inhibits Akt/PKB activation by insulin in liver. Science 300,
1574–1577.
Duvillie, B., Currie, C., Chrones, T., Bucchini, D., Jami, J., Joshi, R.L., and Hill,
D.J. (2002). Increased islet cell proliferation, decreased apoptosis, and greater
vascularization leading to beta-cell hyperplasia in mutant mice lacking insulin.
Endocrinology 143, 1530–1537.
Elghazi, L.,Weiss, A.J., Barker, D.J., Callaghan, J., Staloch, L., Sandgren, E.P.,
Gannon, M., Adsay, V.N., and Bernal-Mizrachi, E. (2009). Regulation of
pancreas plasticity and malignant transformation by Akt signaling.
Gastroenterology 136, 1091–1103.
Enchev, R.I., Schulman, B.A., and Peter, M. (2015). Protein neddylation:
beyond cullin-RING ligases. Nat. Rev. Mol. Cell Biol. 16, 30–44.
Fan, Y., Rudert, W.A., Grupillo, M., He, J., Sisino, G., and Trucco, M. (2009).
Thymus-specific deletion of insulin induces autoimmune diabetes. EMBO J.
28, 2812–2824.
Fatrai, S., Elghazi, L., Balcazar, N., Cras-Meneur, C., Krits, I., Kiyokawa, H.,
andBernal-Mizrachi, E. (2006). Akt induces beta-cell proliferation by regulating
cyclin D1, cyclin D2, and p21 levels and cyclin-dependent kinase-4 activity.
Diabetes 55, 318–325.
Gao, T., McKenna, B., Li, C., Reichert, M., Nguyen, J., Singh, T., Yang, C.,
Pannikar, A., Doliba, N., Zhang, T., et al. (2014). Pdx1 maintains b cell identity
and function by repressing an a cell program. Cell Metab. 19, 259–271.
Gu, G., Dubauskaite, J., and Melton, D.A. (2002). Direct evidence for the
pancreatic lineage: NGN3+ cells are islet progenitors and are distinct from
duct progenitors. Development 129, 2447–2457.
Guo, S., Dai, C., Guo, M., Taylor, B., Harmon, J.S., Sander, M., Robertson,
R.P., Powers, A.C., and Stein, R. (2013). Inactivation of specific b cell transcrip-
tion factors in type 2 diabetes. J. Clin. Invest. 123, 3305–3316.
Halban, P.A. (1982). Differential rates of release of newly synthesized and of
stored insulin from pancreatic islets. Endocrinology 110, 1183–1188.
Ivanova, A., Kalaidzidis, Y., Dirkx, R., Sarov, M., Gerlach, M., Schroth-Diez, B.,
Muller, A., Liu, Y., Andree, C., Mulligan, B., et al. (2013). Age-dependent label-
ing and imaging of insulin secretory granules. Diabetes 62, 3687–3696.
Kaufman, R.J., Back, S.H., Song, B., Han, J., and Hassler, J. (2010). The
unfolded protein response is required to maintain the integrity of the endo-
plasmic reticulum, prevent oxidative stress and preserve differentiation in
b-cells. Diabetes Obes. Metab. 12 (Suppl 2 ), 99–107.
Kushner, J.A., Ciemerych, M.A., Sicinska, E., Wartschow, L.M., Teta, M.,
Long, S.Y., Sicinski, P., and White, M.F. (2005). Cyclins D2 and D1 are essen-
tial for postnatal pancreatic beta-cell growth. Mol. Cell. Biol. 25, 3752–3762.
Lim, G.E., Piske, M., and Johnson, J.D. (2013). 14-3-3 proteins are essential
signalling hubs for beta cell survival. Diabetologia 56, 825–837.
entiation after Hyperglycemia
rrow) in control Ins1�/�:Ins2+/+:Pdx1CreERT:mTmG islets and Ins1�/�:Ins2f/
ion.
s) in control Ins1�/�:Ins2f/f:mTmG islets and Ins1�/�:Ins2f/f:Pdx1CreERT:mTmG
ockout islets at 6 days (near normoglycemic conditions) and 34 days (hyper-
s (n = 3).
borders around immunofluorescence images represent Ins1�/�:Ins2f/f:mTmG
ly. All error bars represent SEM of pooled data.

Please cite this article in press as: Szabat et al., Reduced Insulin Production Relieves Endoplasmic Reticulum Stress and Induces b Cell Proliferation,Cell Metabolism (2016), http://dx.doi.org/10.1016/j.cmet.2015.10.016
Lim, G.E., Albrecht, T., Piske, M., Sarai, K., Lee, J.T., Ramshaw, H.S., Sinha,
S., Guthridge, M.A., Acker-Palmer, A., Lopez, A.F., et al. (2015). 14-3-3z coor-
dinates adipogenesis of visceral fat. Nat. Commun. 6, 7671.
Mezza, T., and Kulkarni, R.N. (2014). The regulation of pre- and post-matura-
tional plasticity of mammalian islet cell mass. Diabetologia 57, 1291–1303.
Mojibian, M., Harder, B., Hurlburt, A., Bruin, J.E., Asadi, A., and Kieffer, T.J.
(2013). Implanted islets in the anterior chamber of the eye are prone to autoim-
mune attack in a mouse model of diabetes. Diabetologia 56, 2213–2221.
Muzumdar, M.D., Tasic, B., Miyamichi, K., Li, L., and Luo, L. (2007). A global
double-fluorescent Cre reporter mouse. Genesis 45, 593–605.
Nir, T., Melton, D.A., and Dor, Y. (2007). Recovery from diabetes in mice by
beta cell regeneration. J. Clin. Invest. 117, 2553–2561.
Noh, J.H., Bae, H.J., Eun, J.W., Shen, Q., Park, S.J., Kim, H.S., Nam, B., Shin,
W.C., Lee, E.K., Lee, K., et al. (2014). HDAC2 provides a critical support to
malignant progression of hepatocellular carcinoma through feedback control
of mTORC1 and AKT. Cancer Res. 74, 1728–1738.
Ohoka, N., Yoshii, S., Hattori, T., Onozaki, K., and Hayashi, H. (2005). TRB3, a
novel ER stress-inducible gene, is induced via ATF4-CHOP pathway and is
involved in cell death. EMBO J. 24, 1243–1255.
Pandey, D., Hori, D., Kim, J.H., Bergman, Y., Berkowitz, D.E., and Romer, L.H.
(2015). NEDDylation promotes endothelial dysfunction: a role for HDAC2.
J. Mol. Cell. Cardiol. 81, 18–22.
Porat, S., Weinberg-Corem, N., Tornovsky-Babaey, S., Schyr-Ben-Haroush,
R., Hija, A., Stolovich-Rain, M., Dadon, D., Granot, Z., Ben-Hur, V., White,
P., et al. (2011). Control of pancreatic b cell regeneration by glucose meta-
bolism. Cell Metab. 13, 440–449.
Sabatini, P.V., Krentz, N.A., Zarrouki, B., Westwell-Roper, C.Y., Nian, C., Uy,
R.A., Shapiro, A.M., Poitout, V., and Lynn, F.C. (2013). Npas4 is a novel activ-
ity-regulated cytoprotective factor in pancreatic b-cells. Diabetes 62, 2808–
2820.
Scharfmann, R., Pechberty, S., Hazhouz, Y., vonBulow,M., Bricout-Neveu, E.,
Grenier-Godard, M., Guez, F., Rachdi, L., Lohmann, M., Czernichow, P., and
Ravassard, P. (2014). Development of a conditionally immortalized human
pancreatic b cell line. J. Clin. Invest. 124, 2087–2098.
Sharma, R.B., O’Donnell, A.C., Stamateris, R.E., Ha, B., McCloskey, K.M.,
Reynolds, P.R., Arvan, P., and Alonso, L.C. (2015). Insulin demand regulates
b cell number via the unfolded protein response. J. Clin. Invest. 125, 3831–
3846.
Song, B., Scheuner, D., Ron, D., Pennathur, S., and Kaufman, R.J. (2008).
Chop deletion reduces oxidative stress, improves beta cell function, and pro-
motes cell survival in multiple mouse models of diabetes. J. Clin. Invest. 118,
3378–3389.
Switzer, C.H., Cheng, R.Y., Vitek, T.M., Christensen, D.J., Wink, D.A., and
Vitek, M.P. (2011). Targeting SET/I(2)PP2A oncoprotein functions as a multi-
pathway strategy for cancer therapy. Oncogene 30, 2504–2513.
C
Szabat, M., Johnson, J.D., and Piret, J.M. (2010). Reciprocal modulation of
adult beta cell maturity by activin A and follistatin. Diabetologia 53, 1680–1689.
Szabat, M., Lynn, F.C., Hoffman, B.G., Kieffer, T.J., Allan, D.W., and Johnson,
J.D. (2012). Maintenance of b-cell maturity and plasticity in the adult pancreas:
developmental biology concepts in adult physiology. Diabetes 61, 1365–1371.
Talchai, C., Xuan, S., Lin, H.V., Sussel, L., and Accili, D. (2012). Pancreatic
b cell dedifferentiation as a mechanism of diabetic b cell failure. Cell 150,
1223–1234.
Teta, M., Long, S.Y., Wartschow, L.M., Rankin, M.M., and Kushner, J.A.
(2005). Very slow turnover of beta-cells in aged adult mice. Diabetes 54,
2557–2567.
Thorel, F., Nepote, V., Avril, I., Kohno, K., Desgraz, R., Chera, S., and Herrera,
P.L. (2010). Conversion of adult pancreatic alpha-cells to beta-cells after
extreme beta-cell loss. Nature 464, 1149–1154.
Tillmar, L., Carlsson, C., andWelsh, N. (2002). Control of insulin mRNA stability
in rat pancreatic islets. Regulatory role of a 30-untranslated region pyrimidine-
rich sequence. J. Biol. Chem. 277, 1099–1106.
Vander Mierde, D., Scheuner, D., Quintens, R., Patel, R., Song, B., Tsukamoto,
K., Beullens, M., Kaufman, R.J., Bollen, M., and Schuit, F.C. (2007). Glucose
activates a protein phosphatase-1-mediated signaling pathway to enhance
overall translation in pancreatic beta-cells. Endocrinology 148, 609–617.
Wang, Z., York, N.W., Nichols, C.G., and Remedi, M.S. (2014). Pancreatic b
cell dedifferentiation in diabetes and redifferentiation following insulin therapy.
Cell Metab. 19, 872–882.
Weir, G.C., Aguayo-Mazzucato, C., and Bonner-Weir, S. (2013). b-cell dedif-
ferentiation in diabetes is important, but what is it? Islets 5, 233–237.
Wrede, C.E., Dickson, L.M., Lingohr, M.K., Briaud, I., and Rhodes, C.J. (2002).
Protein kinase B/Akt prevents fatty acid-induced apoptosis in pancreatic beta-
cells (INS-1). J. Biol. Chem. 277, 49676–49684.
Wurzenberger, C., and Gerlich, D.W. (2011). Phosphatases: providing safe
passage through mitotic exit. Nat. Rev. Mol. Cell Biol. 12, 469–482.
Yang, B.T., Dayeh, T.A., Kirkpatrick, C.L., Taneera, J., Kumar, R., Groop, L.,
Wollheim, C.B., Nitert, M.D., and Ling, C. (2011a). Insulin promoter DNA
methylation correlates negatively with insulin gene expression and positively
with HbA(1c) levels in human pancreatic islets. Diabetologia 54, 360–367.
Yang, Y.H., Szabat, M., Bragagnini, C., Kott, K., Helgason, C.D., Hoffman,
B.G., and Johnson, J.D. (2011b). Paracrine signalling loops in adult human
and mouse pancreatic islets: netrins modulate beta cell apoptosis signalling
via dependence receptors. Diabetologia 54, 828–842.
Yang, Y.H., Wills, Q.F., and Johnson, J.D. (2015). A live-cell, high-content im-
aging survey of 206 endogenous factors across five stress conditions reveals
context-dependent survival effects in mouse primary beta cells. Diabetologia
58, 1239–1249.
ell Metabolism 23, 1–15, January 12, 2016 ª2016 Elsevier Inc. 15