t-2 and ht-2 toxins in oats and oat products · t-2 and ht-2 toxins in oats and oat products update...
TRANSCRIPT
T-2 and HT-2 toxinsin Oats and
Oat Products
Update from CEEREAL on the status of the research activities of the
European Oat Milling industry
1/36
• CEEREAL is the trade association for the EU breakfast cereal and oat milling industries
• CEEREAL’s members are the national breakfast cereal and oat milling associations in 13 EU member states
• Through its Oat Millers Committee it represents the oat milling industry in Finland, Sweden, Denmark, Germany, Ireland and UK
2/36
Oat Consumption
3/36
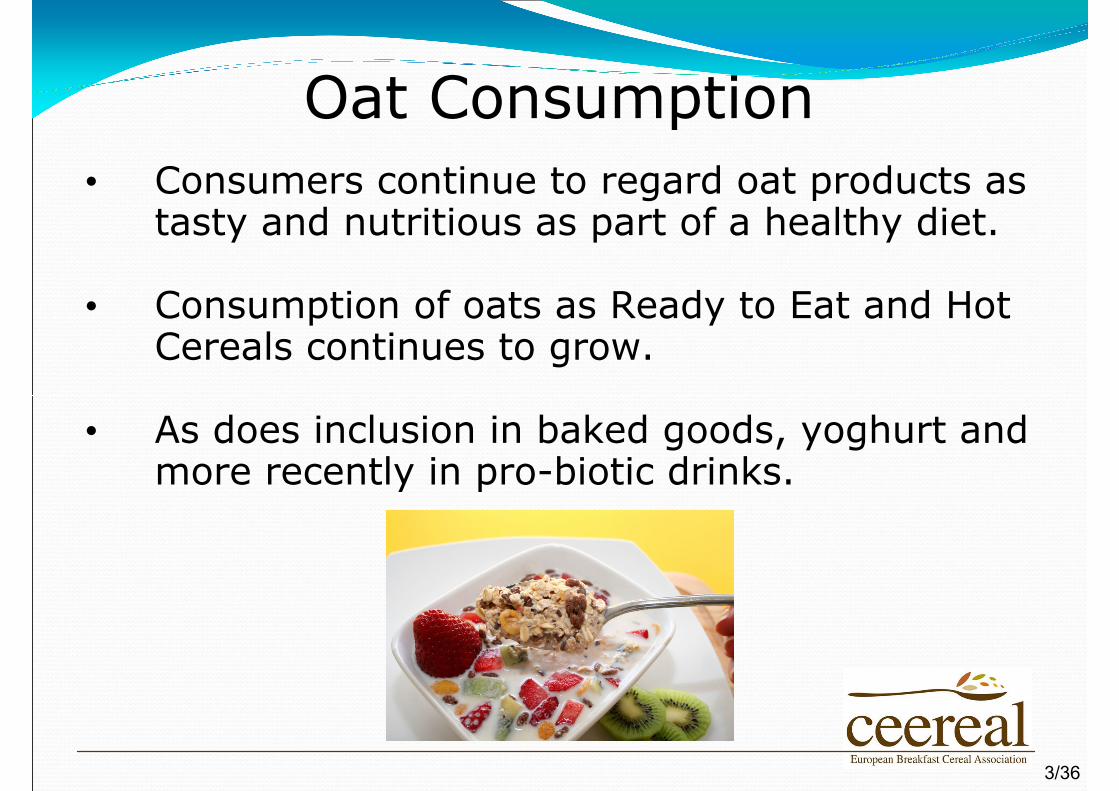
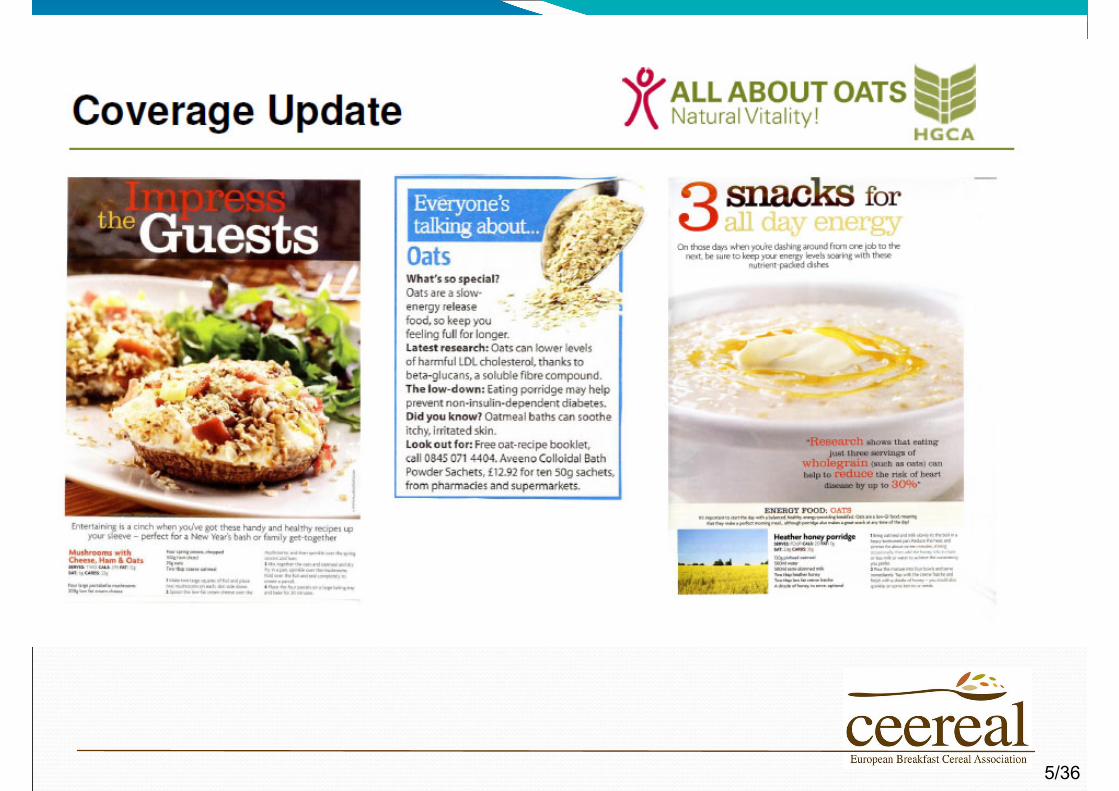
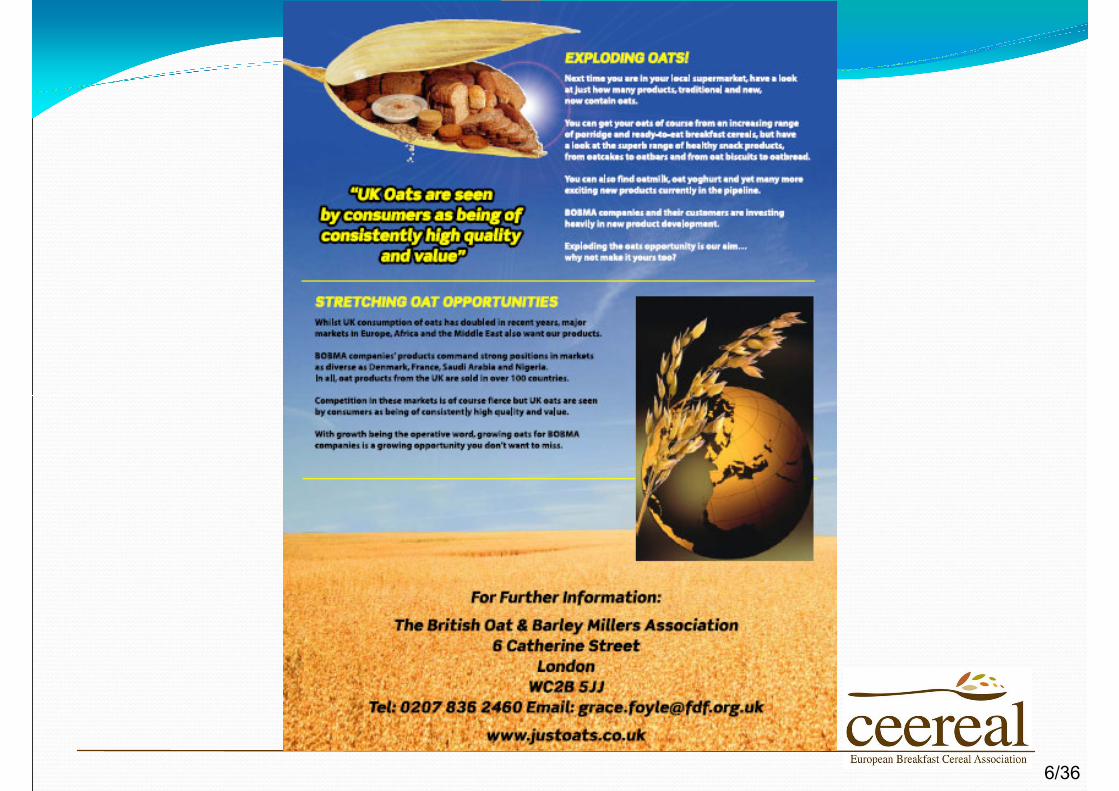
• Consumers continue to regard oat products as tasty and nutritious as part of a healthy diet.
• Consumption of oats as Ready to Eat and Hot Cereals continues to grow.
• As does inclusion in baked goods, yoghurt and more recently in pro-biotic drinks.
4/36
5/36
6/36
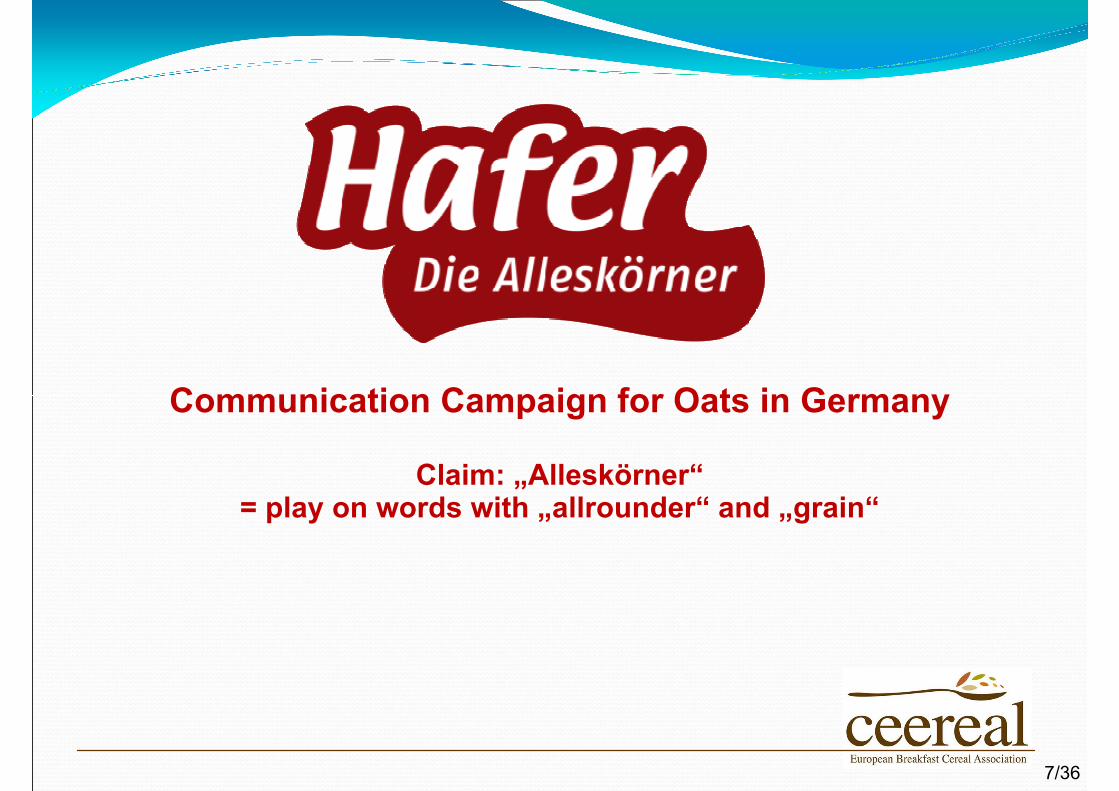
Communication Campaign for Oats in Germany
Claim: „Alleskörner“= play on words with „allrounder“ and „grain“
7/36
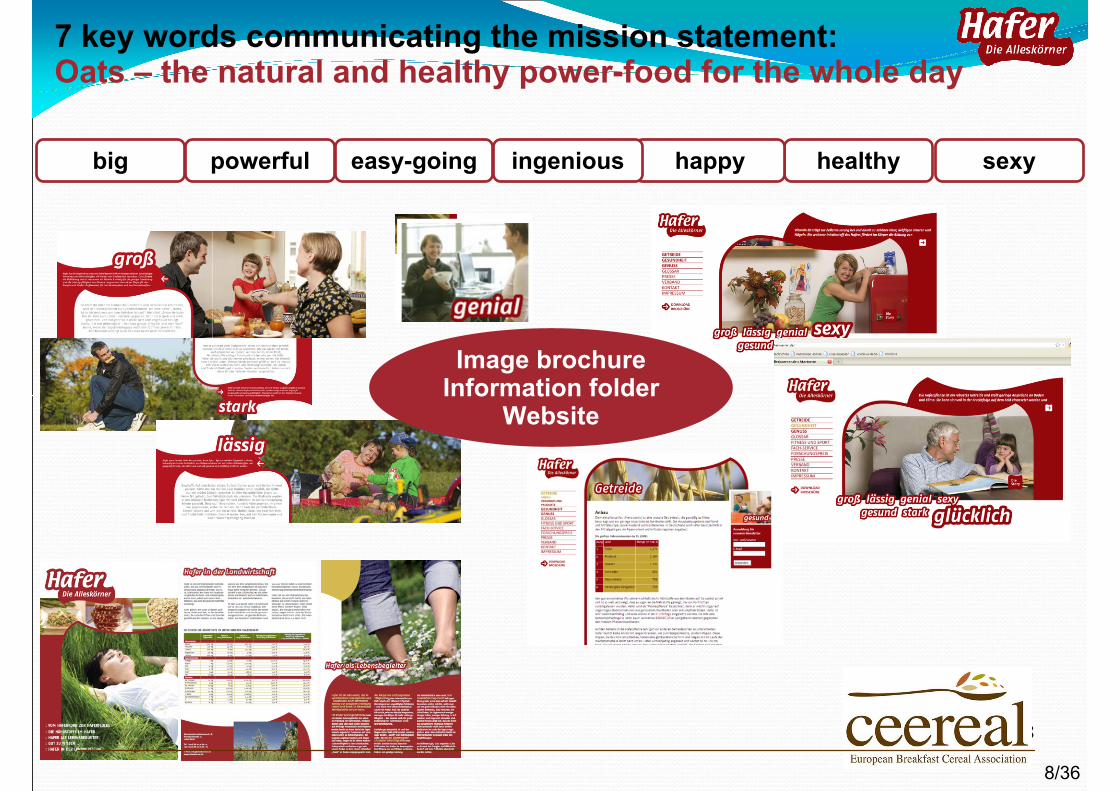
7 key words communicating the mission statement:Oats – the natural and healthy power-food for the whole day
8
big easy-goingpowerful healthyhappy sexyingenious
Image brochureInformation folder
Website
8/36
9
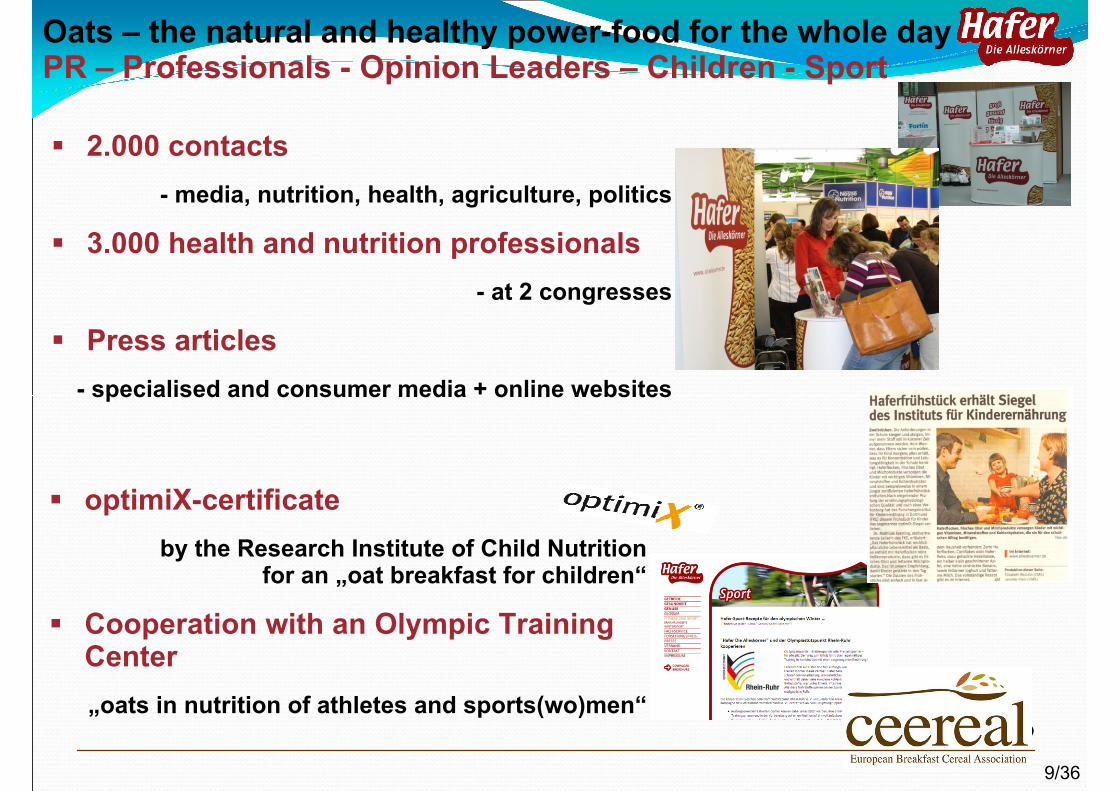
2.000 contacts- media, nutrition, health, agriculture, politics
3.000 health and nutrition professionals - at 2 congresses
Press articles - specialised and consumer media + online websites
Oats – the natural and healthy power-food for the whole dayPR – Professionals - Opinion Leaders – Children - Sport
optimiX-certificate by the Research Institute of Child Nutrition
for an „oat breakfast for children“
Cooperation with an Olympic Training Center „oats in nutrition of athletes and sports(wo)men“
9/36
• Oat consumers regard oats as “pure” and only lightly processed.
• It is therefore important that any perceived risk is fully understood, which is why the oat millers are committed to improving the science on T-2 and HT-2.
• This commitment led to the decision to launch a major study in 2007.
10/36
Oat Consumption

CEEREAL T-2/HT-2 Project
• The scope of the study is:
• Supported by more than 25 mills and associations
• Set up to collect samples of raw oats, oat flakes and by-products in key producing or processing countries
• Started from harvest 2007 through to include harvest 2009
11/36
CEEREAL T-2/HT-2 Project
• Evaluation of the level of T-2/HT-2 in oats, oat flakes and oat by-products
• Distribution in oats, oat flakes and by-products
• Substantiate the reduction rate during processing
• Level of T2/HT2 in flakes from different origin
12/36
T-2 and HT-2 toxins in Oats and Oat Products
Presented by
Hans PetterssonDept. Animal Nutrition and ManagementSwedish University of Agricultural SciencesP. Box 7024, SE-750 07 Uppsala, SwedenE-mail: [email protected]
Update from CEEREAL at
Fusarium toxin Forum, Brussels 1-2nd February 2010
13/36
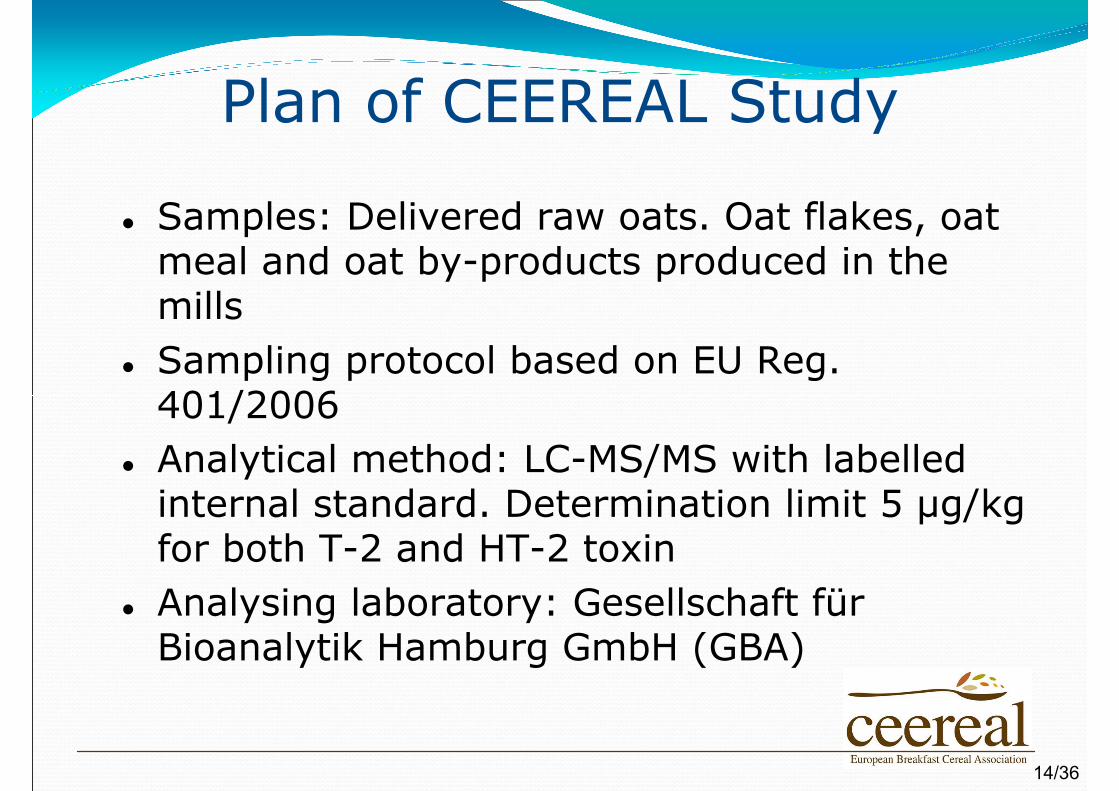
Plan of CEEREAL Study
Samples: Delivered raw oats. Oat flakes, oat meal and oat by-products produced in the millsSampling protocol based on EU Reg. 401/2006Analytical method: LC-MS/MS with labelled internal standard. Determination limit 5 µg/kg for both T-2 and HT-2 toxinAnalysing laboratory: Gesellschaft für Bioanalytik Hamburg GmbH (GBA)
14/36
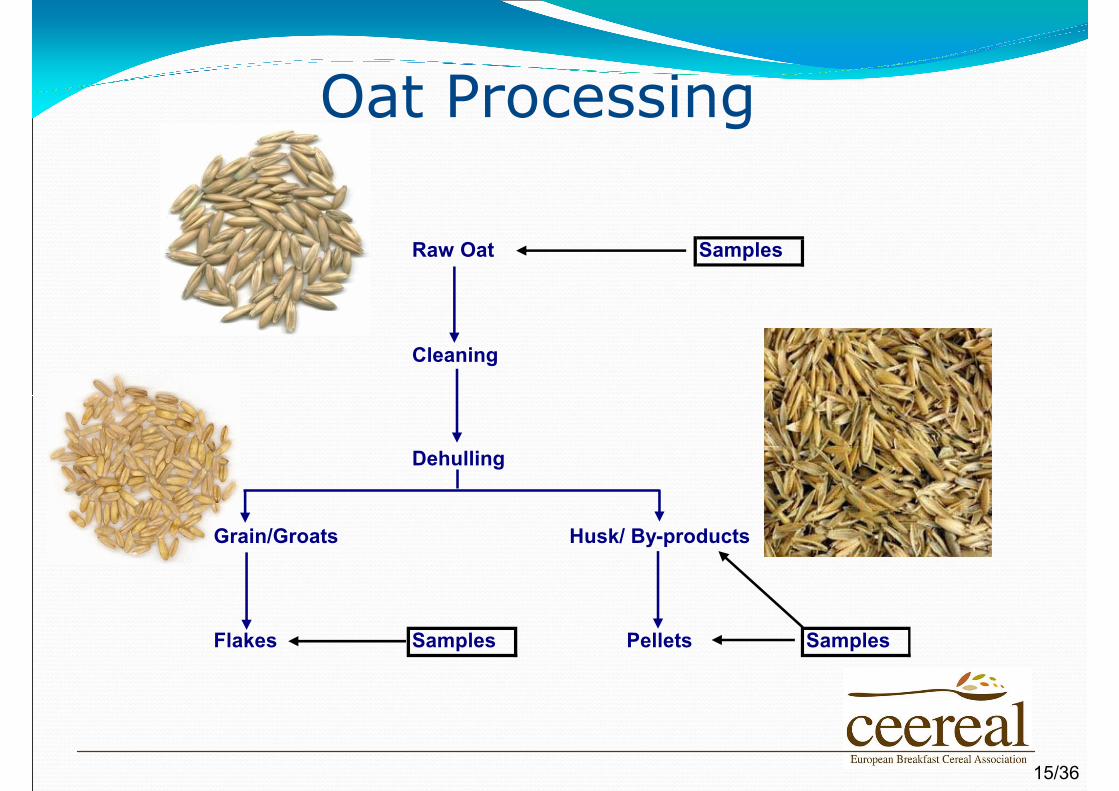
Oat Processing
Raw Oat Samples
Cleaning
Dehulling
Grain/Groats Husk/ By-products
Flakes Samples Pellets Samples
15/36
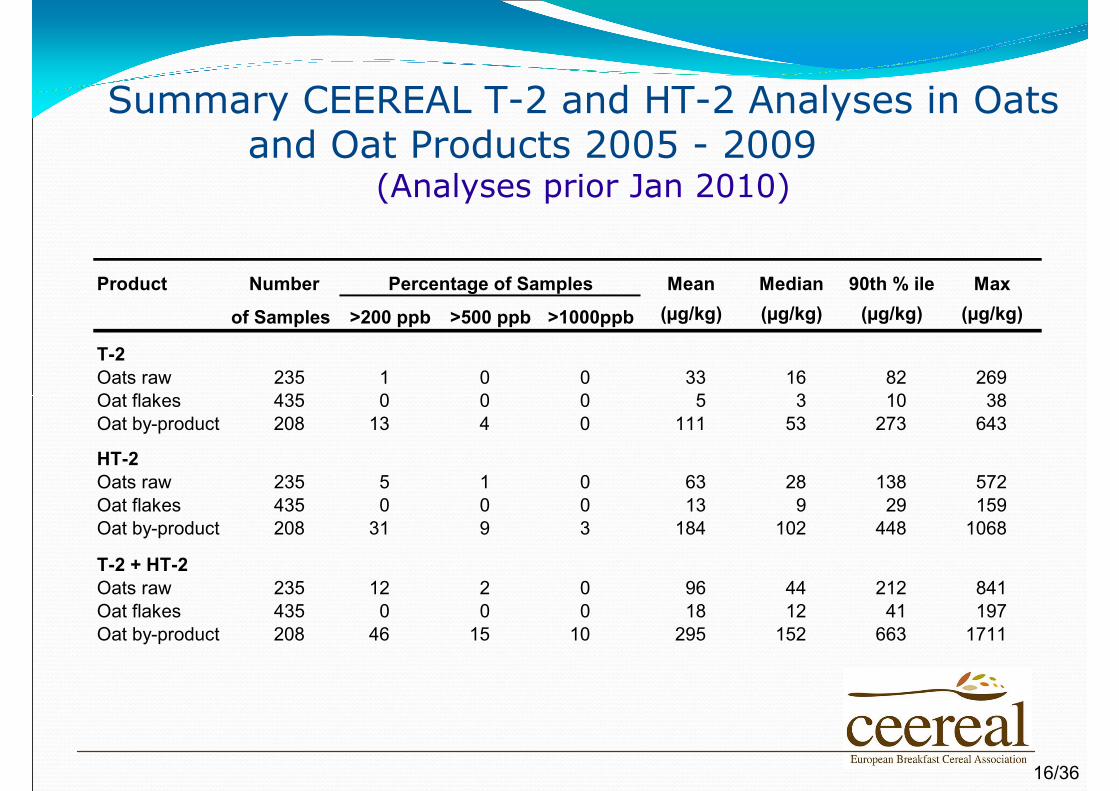
Summary CEEREAL T-2 and HT-2 Analyses in Oats and Oat Products 2005 - 2009
(Analyses prior Jan 2010)
Product Number Mean Median 90th % ile Max
of Samples >200 ppb >500 ppb >1000ppb (µg/kg) (µg/kg) (µg/kg) (µg/kg)
T-2Oats raw 235 1 0 0 33 16 82 269Oat flakes 435 0 0 0 5 3 10 38Oat by-product 208 13 4 0 111 53 273 643
HT-2Oats raw 235 5 1 0 63 28 138 572Oat flakes 435 0 0 0 13 9 29 159Oat by-product 208 31 9 3 184 102 448 1068
T-2 + HT-2Oats raw 235 12 2 0 96 44 212 841Oat flakes 435 0 0 0 18 12 41 197Oat by-product 208 46 15 10 295 152 663 1711
Percentage of Samples
16/36
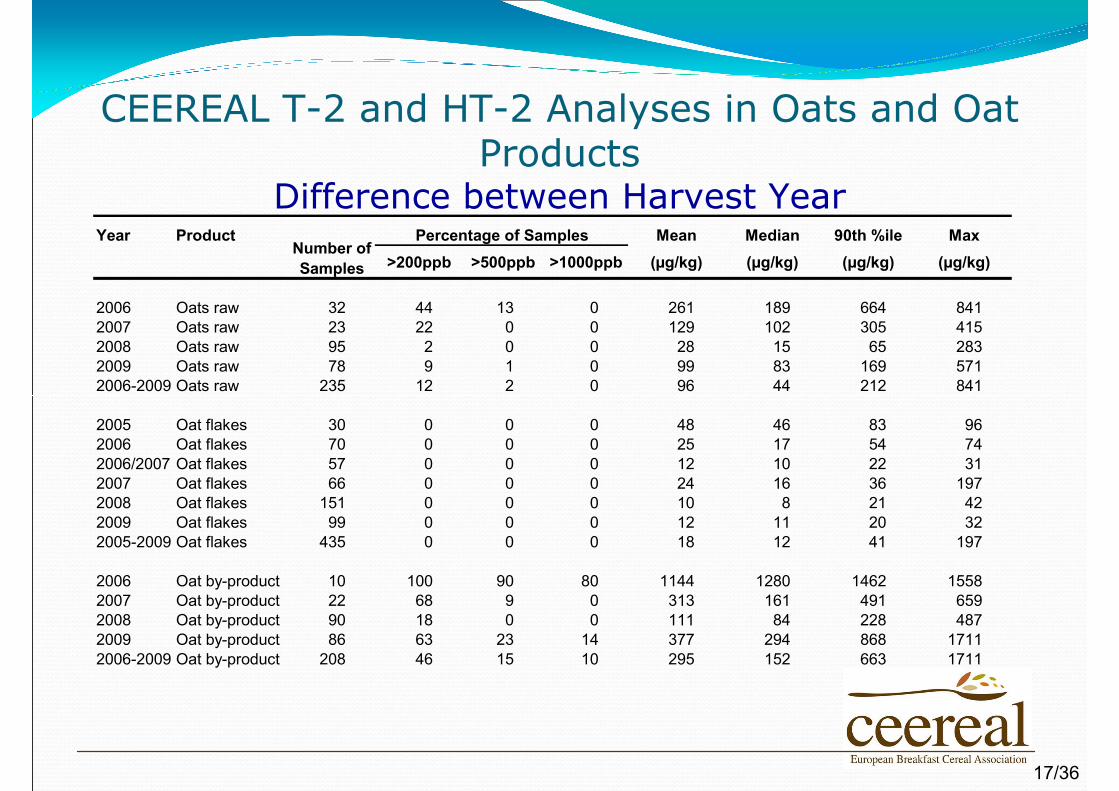
CEEREAL T-2 and HT-2 Analyses in Oats and Oat Products
Difference between Harvest Year
17/36
Year Product Mean Median 90th %ile Max>200ppb >500ppb >1000ppb (µg/kg) (µg/kg) (µg/kg) (µg/kg)
2006 Oats raw 32 44 13 0 261 189 664 8412007 Oats raw 23 22 0 0 129 102 305 4152008 Oats raw 95 2 0 0 28 15 65 2832009 Oats raw 78 9 1 0 99 83 169 5712006-2009 Oats raw 235 12 2 0 96 44 212 841
2005 Oat flakes 30 0 0 0 48 46 83 962006 Oat flakes 70 0 0 0 25 17 54 742006/2007 Oat flakes 57 0 0 0 12 10 22 312007 Oat flakes 66 0 0 0 24 16 36 1972008 Oat flakes 151 0 0 0 10 8 21 422009 Oat flakes 99 0 0 0 12 11 20 322005-2009 Oat flakes 435 0 0 0 18 12 41 197
2006 Oat by-product 10 100 90 80 1144 1280 1462 15582007 Oat by-product 22 68 9 0 313 161 491 6592008 Oat by-product 90 18 0 0 111 84 228 4872009 Oat by-product 86 63 23 14 377 294 868 17112006-2009 Oat by-product 208 46 15 10 295 152 663 1711
Number of Samples
Percentage of Samples
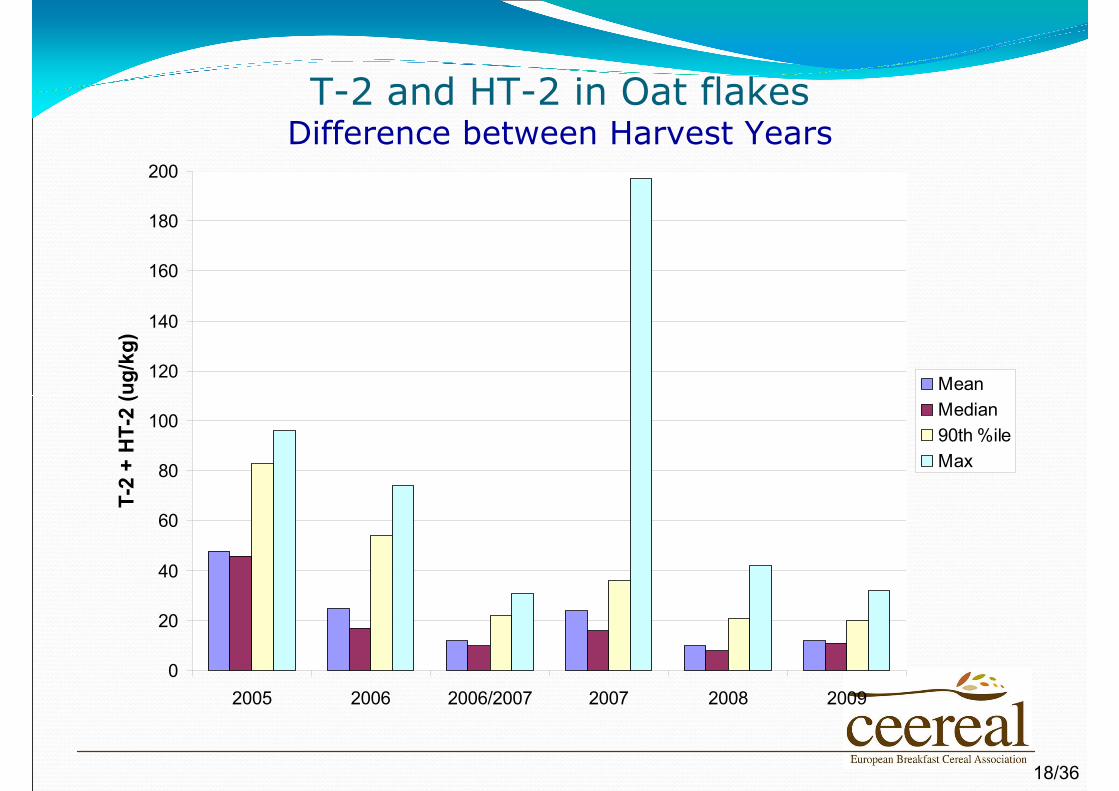
T-2 and HT-2 in Oat flakes Difference between Harvest Years
0
20
40
60
80
100
120
140
160
180
200
2005 2006 2006/2007 2007 2008 2009
T-2
+ H
T-2
(ug/
kg)
MeanMedian90th %ileMax
18/36
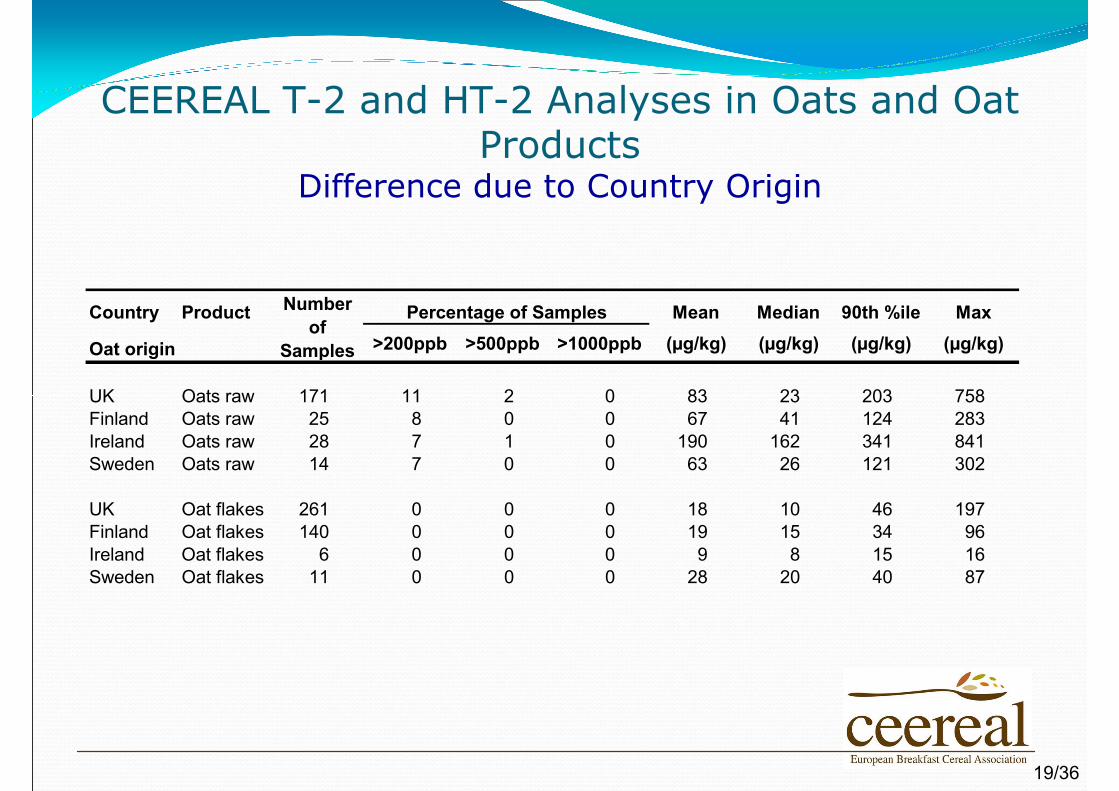
CEEREAL T-2 and HT-2 Analyses in Oats and Oat Products
Difference due to Country Origin
Country Product Mean Median 90th %ile Max
Oat origin >200ppb >500ppb >1000ppb (µg/kg) (µg/kg) (µg/kg) (µg/kg)
UK Oats raw 171 11 2 0 83 23 203 758Finland Oats raw 25 8 0 0 67 41 124 283Ireland Oats raw 28 7 1 0 190 162 341 841Sweden Oats raw 14 7 0 0 63 26 121 302
UK Oat flakes 261 0 0 0 18 10 46 197Finland Oat flakes 140 0 0 0 19 15 34 96Ireland Oat flakes 6 0 0 0 9 8 15 16Sweden Oat flakes 11 0 0 0 28 20 40 87
Number of
Samples
Percentage of Samples
19/36
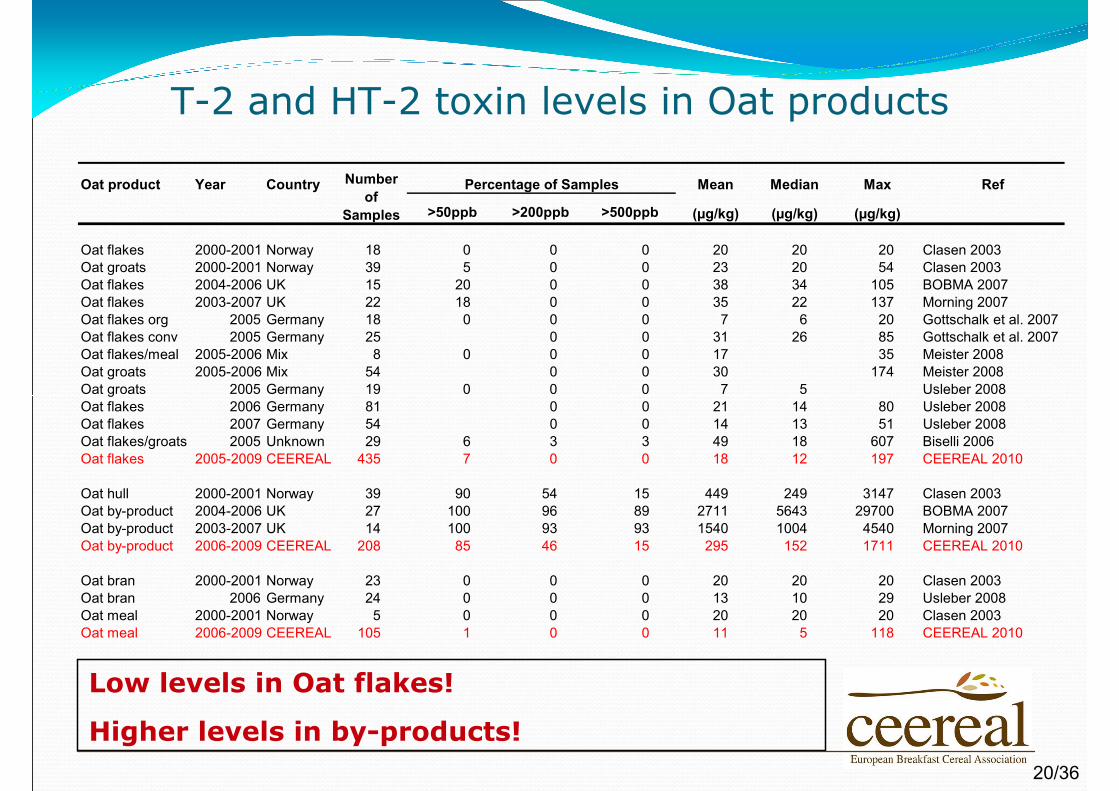
T-2 and HT-2 toxin levels in Oat products
Low levels in Oat flakes!
Higher levels in by-products!
Oat product Year Country Mean Median Max Ref
>50ppb >200ppb >500ppb (µg/kg) (µg/kg) (µg/kg)
Oat flakes 2000-2001 Norway 18 0 0 0 20 20 20 Clasen 2003Oat groats 2000-2001 Norway 39 5 0 0 23 20 54 Clasen 2003Oat flakes 2004-2006 UK 15 20 0 0 38 34 105 BOBMA 2007Oat flakes 2003-2007 UK 22 18 0 0 35 22 137 Morning 2007Oat flakes org 2005 Germany 18 0 0 0 7 6 20 Gottschalk et al. 2007Oat flakes conv 2005 Germany 25 0 0 31 26 85 Gottschalk et al. 2007Oat flakes/meal 2005-2006 Mix 8 0 0 0 17 35 Meister 2008Oat groats 2005-2006 Mix 54 0 0 30 174 Meister 2008Oat groats 2005 Germany 19 0 0 0 7 5 Usleber 2008Oat flakes 2006 Germany 81 0 0 21 14 80 Usleber 2008Oat flakes 2007 Germany 54 0 0 14 13 51 Usleber 2008Oat flakes/groats 2005 Unknown 29 6 3 3 49 18 607 Biselli 2006Oat flakes 2005-2009 CEEREAL 435 7 0 0 18 12 197 CEEREAL 2010
Oat hull 2000-2001 Norway 39 90 54 15 449 249 3147 Clasen 2003Oat by-product 2004-2006 UK 27 100 96 89 2711 5643 29700 BOBMA 2007Oat by-product 2003-2007 UK 14 100 93 93 1540 1004 4540 Morning 2007Oat by-product 2006-2009 CEEREAL 208 85 46 15 295 152 1711 CEEREAL 2010
Oat bran 2000-2001 Norway 23 0 0 0 20 20 20 Clasen 2003Oat bran 2006 Germany 24 0 0 0 13 10 29 Usleber 2008Oat meal 2000-2001 Norway 5 0 0 0 20 20 20 Clasen 2003Oat meal 2006-2009 CEEREAL 105 1 0 0 11 5 118 CEEREAL 2010
Number of
Samples
Percentage of Samples
20/36
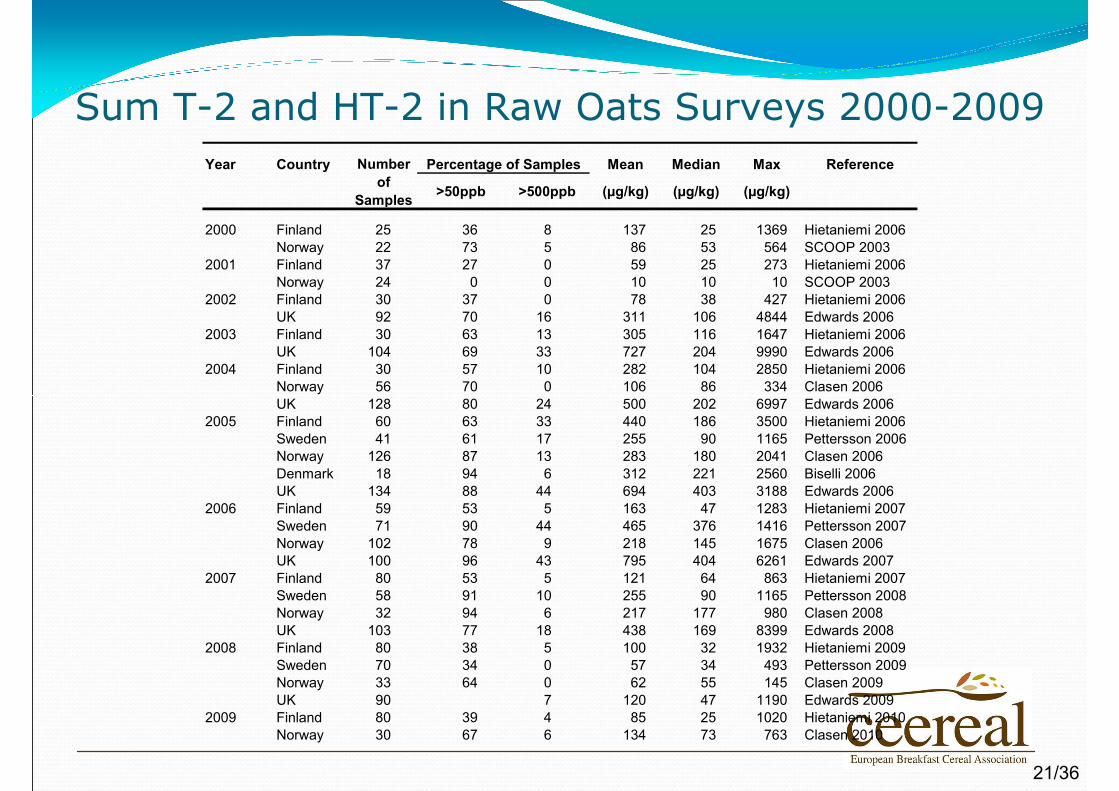
Sum T-2 and HT-2 in Raw Oats Surveys 2000-2009Year Country Mean Median Max Reference
>50ppb >500ppb (µg/kg) (µg/kg) (µg/kg)
2000 Finland 25 36 8 137 25 1369 Hietaniemi 2006Norway 22 73 5 86 53 564 SCOOP 2003
2001 Finland 37 27 0 59 25 273 Hietaniemi 2006Norway 24 0 0 10 10 10 SCOOP 2003
2002 Finland 30 37 0 78 38 427 Hietaniemi 2006UK 92 70 16 311 106 4844 Edwards 2006
2003 Finland 30 63 13 305 116 1647 Hietaniemi 2006UK 104 69 33 727 204 9990 Edwards 2006
2004 Finland 30 57 10 282 104 2850 Hietaniemi 2006Norway 56 70 0 106 86 334 Clasen 2006UK 128 80 24 500 202 6997 Edwards 2006
2005 Finland 60 63 33 440 186 3500 Hietaniemi 2006Sweden 41 61 17 255 90 1165 Pettersson 2006Norway 126 87 13 283 180 2041 Clasen 2006Denmark 18 94 6 312 221 2560 Biselli 2006UK 134 88 44 694 403 3188 Edwards 2006
2006 Finland 59 53 5 163 47 1283 Hietaniemi 2007Sweden 71 90 44 465 376 1416 Pettersson 2007Norway 102 78 9 218 145 1675 Clasen 2006UK 100 96 43 795 404 6261 Edwards 2007
2007 Finland 80 53 5 121 64 863 Hietaniemi 2007Sweden 58 91 10 255 90 1165 Pettersson 2008Norway 32 94 6 217 177 980 Clasen 2008UK 103 77 18 438 169 8399 Edwards 2008
2008 Finland 80 38 5 100 32 1932 Hietaniemi 2009Sweden 70 34 0 57 34 493 Pettersson 2009Norway 33 64 0 62 55 145 Clasen 2009UK 90 7 120 47 1190 Edwards 2009
2009 Finland 80 39 4 85 25 1020 Hietaniemi 2010Norway 30 67 6 134 73 763 Clasen 2010
Number of
Samples
Percentage of Samples
21/36
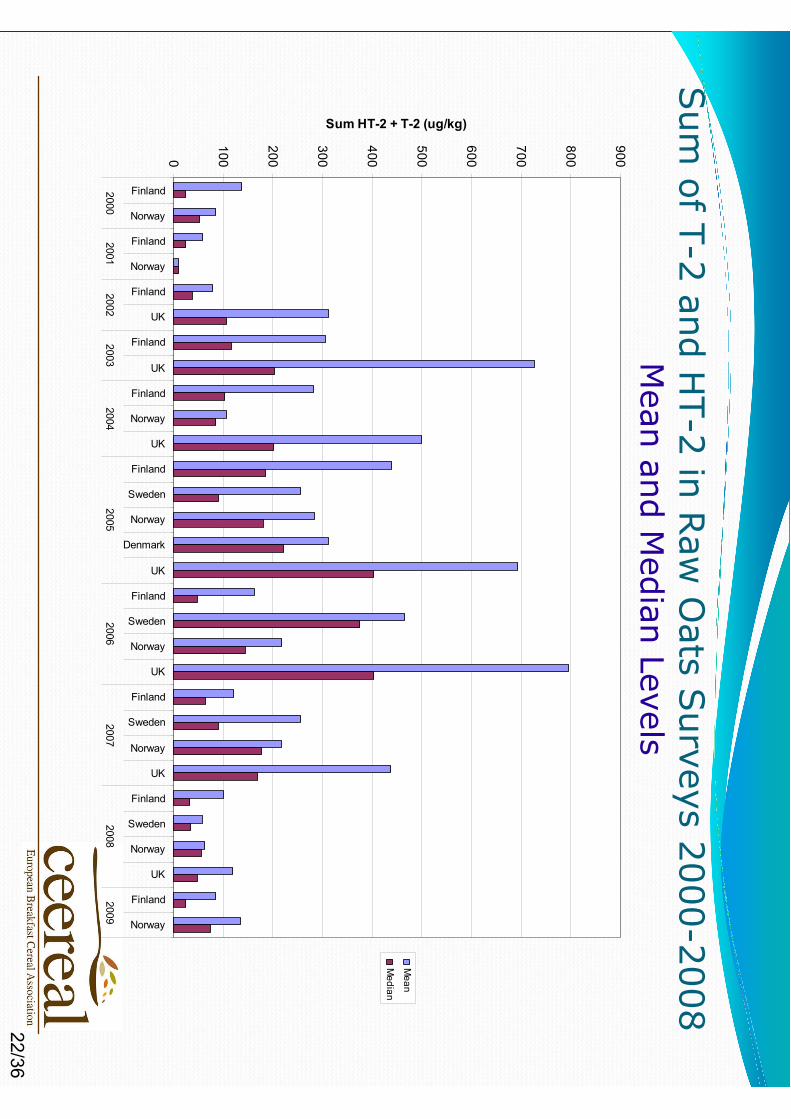
Sum
of T-2 and HT-2 in R
aw O
ats Surveys 2000-2008
Mean and M
edian Levels
0
100
200
300
400
500
600
700
800
900Finland
Norway
Finland
Norway
Finland
UK
Finland
UK
Finland
Norway
UK
Finland
Sweden
Norway
Denmark
UK
Finland
Sweden
Norway
UK
Finland
Sweden
Norway
UK
Finland
Sweden
Norway
UK
Finland
Norway
20002001
20022003
20042005
20062007
20082009
Sum HT-2 + T-2 (ug/kg)
Mean
Median
22/36
Conclusions from Survey Results
Yearly variation within countriesIncrease from 2002 to 2006Decrease from 2007 and low levels 2008 and 2009
Frequent and similar occurrence in all survey countriesLevels not comparable between countries
Different sampling and analytical methods
23/36
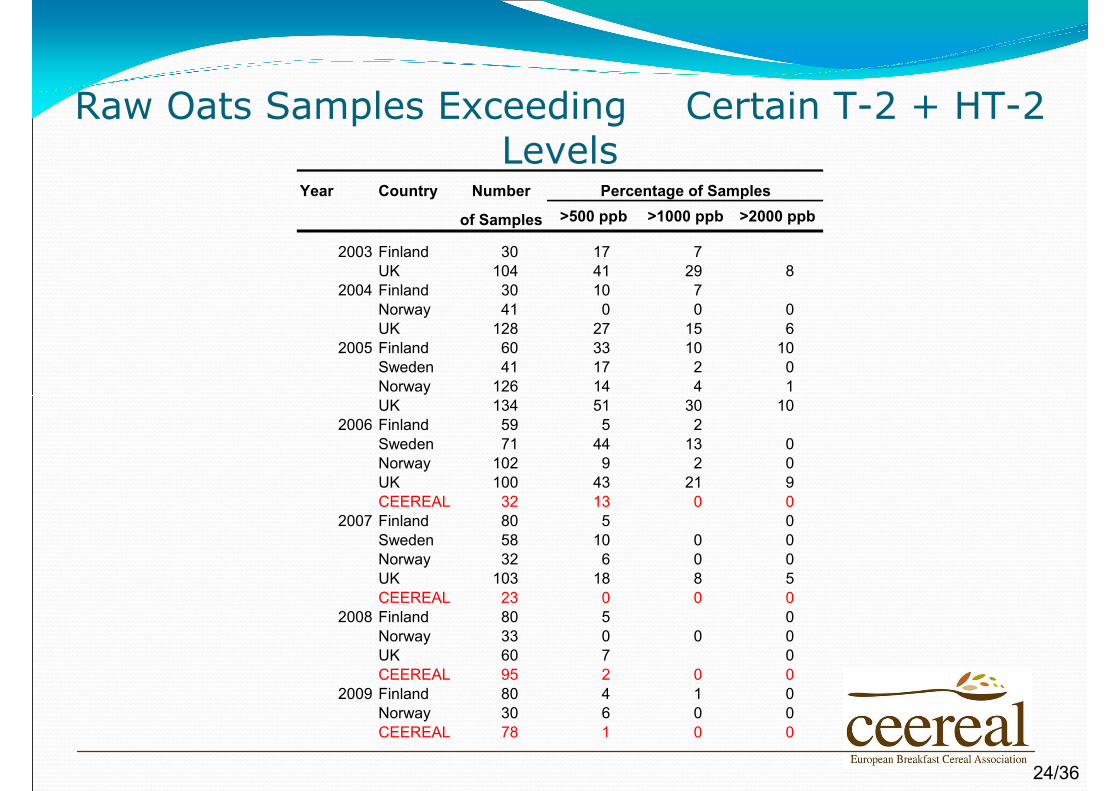
Raw Oats Samples Exceeding Certain T-2 + HT-2 Levels
Year Country Number
of Samples >500 ppb >1000 ppb >2000 ppb
2003 Finland 30 17 7UK 104 41 29 8
2004 Finland 30 10 7Norway 41 0 0 0UK 128 27 15 6
2005 Finland 60 33 10 10Sweden 41 17 2 0Norway 126 14 4 1UK 134 51 30 10
2006 Finland 59 5 2Sweden 71 44 13 0Norway 102 9 2 0UK 100 43 21 9CEEREAL 32 13 0 0
2007 Finland 80 5 0Sweden 58 10 0 0Norway 32 6 0 0UK 103 18 8 5CEEREAL 23 0 0 0
2008 Finland 80 5 0Norway 33 0 0 0UK 60 7 0CEEREAL 95 2 0 0
2009 Finland 80 4 1 0Norway 30 6 0 0CEEREAL 78 1 0 0
Percentage of Samples
24/36
T-2 and HT-2 in raw OatsRegional Differences?
Survey Results may indicate higher levels in Scandinavian and UK oatsLack of analytical results from other producing countries (Poland, Germany, France, Spain, Austria)Survey country levels not comparable (sampling and method differences)No or slight indication of regional differences within survey countries
Climate and Agronomic may cause regional differencesDry and warm weather Variety choice
25/36
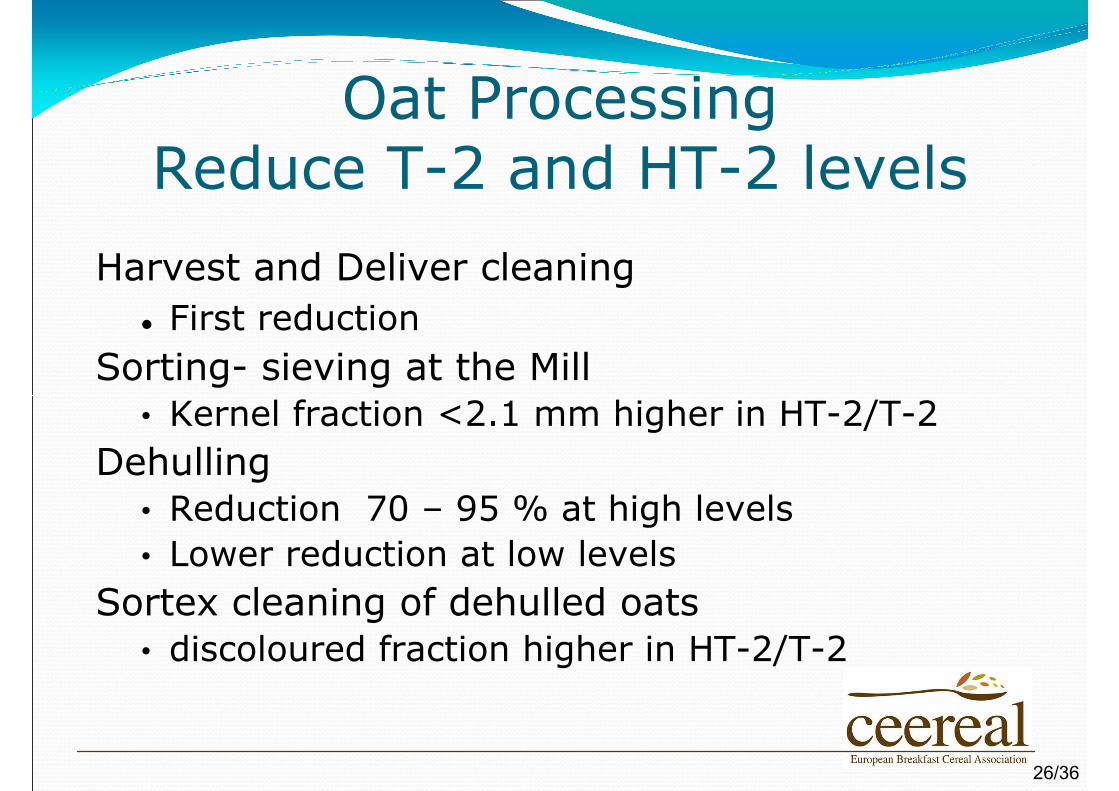
Oat Processing Reduce T-2 and HT-2 levels
Harvest and Deliver cleaningFirst reduction
Sorting- sieving at the Mill• Kernel fraction <2.1 mm higher in HT-2/T-2
Dehulling • Reduction 70 – 95 % at high levels• Lower reduction at low levels
Sortex cleaning of dehulled oats • discoloured fraction higher in HT-2/T-2
26/36
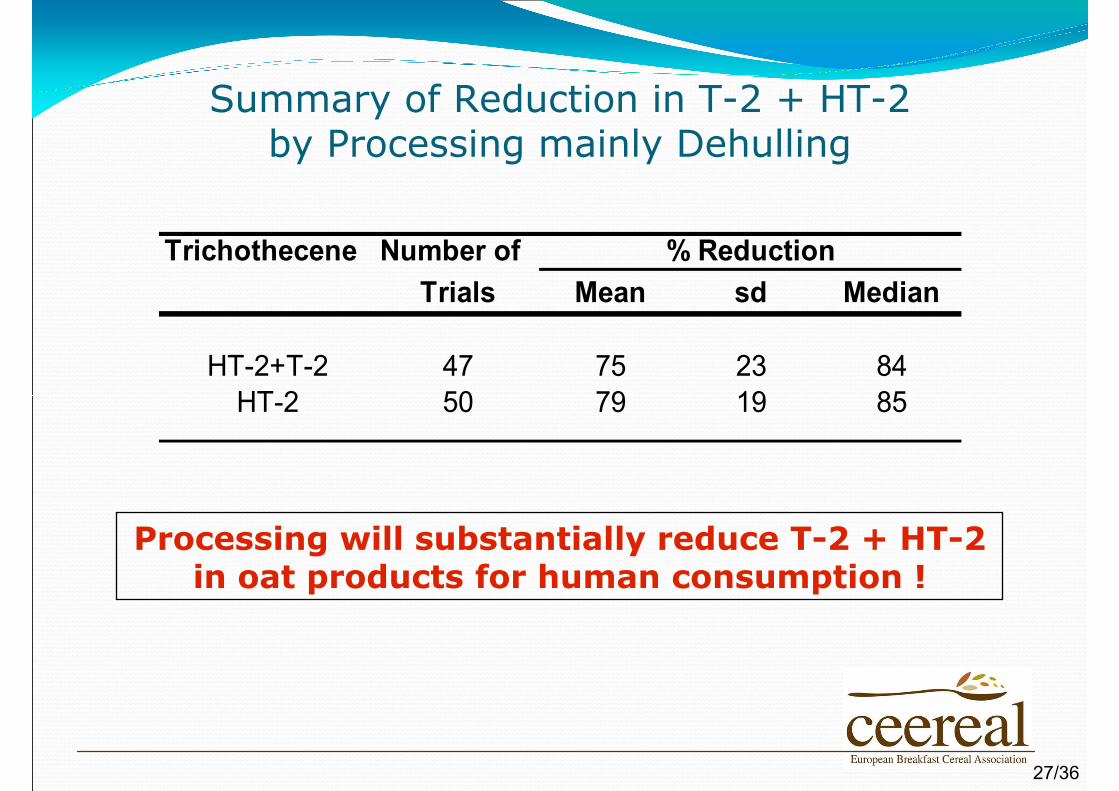
Summary of Reduction in T-2 + HT-2 by Processing mainly Dehulling
Processing will substantially reduce T-2 + HT-2 in oat products for human consumption !
Trichothecene Number ofTrials Mean sd Median
HT-2+T-2 47 75 23 84HT-2 50 79 19 85
% Reduction
27/36
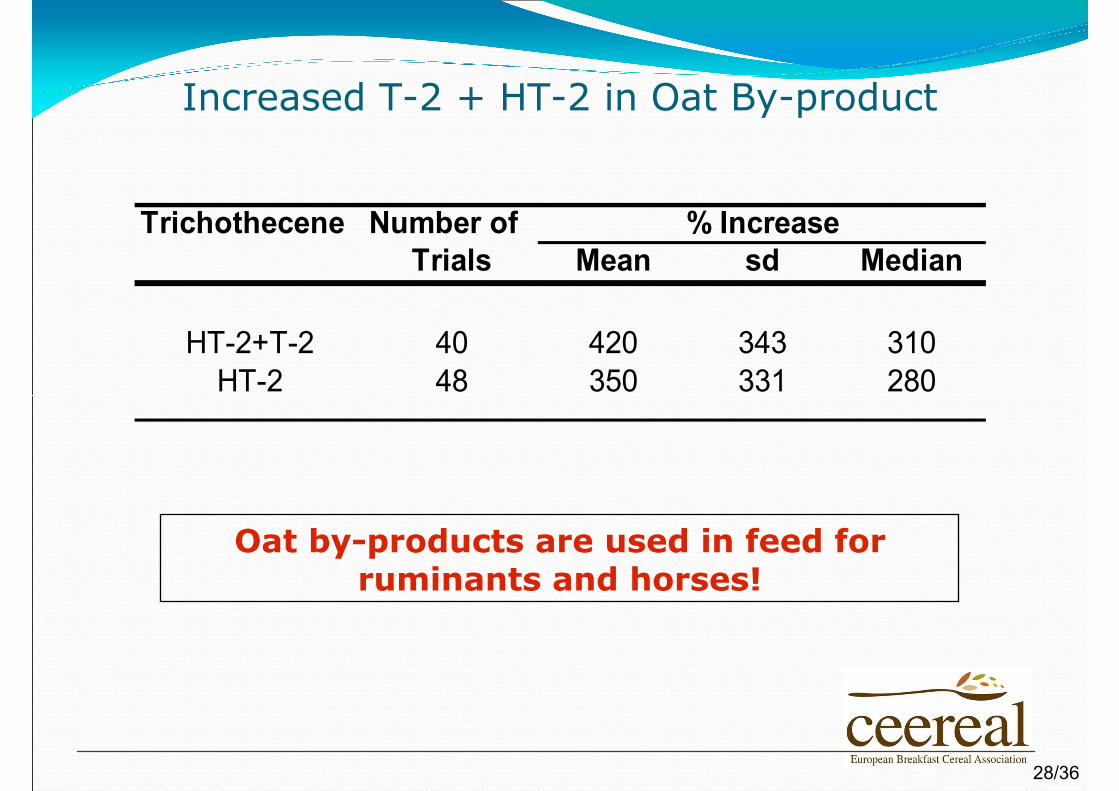
Increased T-2 + HT-2 in Oat By-product
Oat by-products are used in feed for ruminants and horses!
Trichothecene Number ofTrials Mean sd Median
HT-2+T-2 40 420 343 310HT-2 48 350 331 280
% Increase
28/36
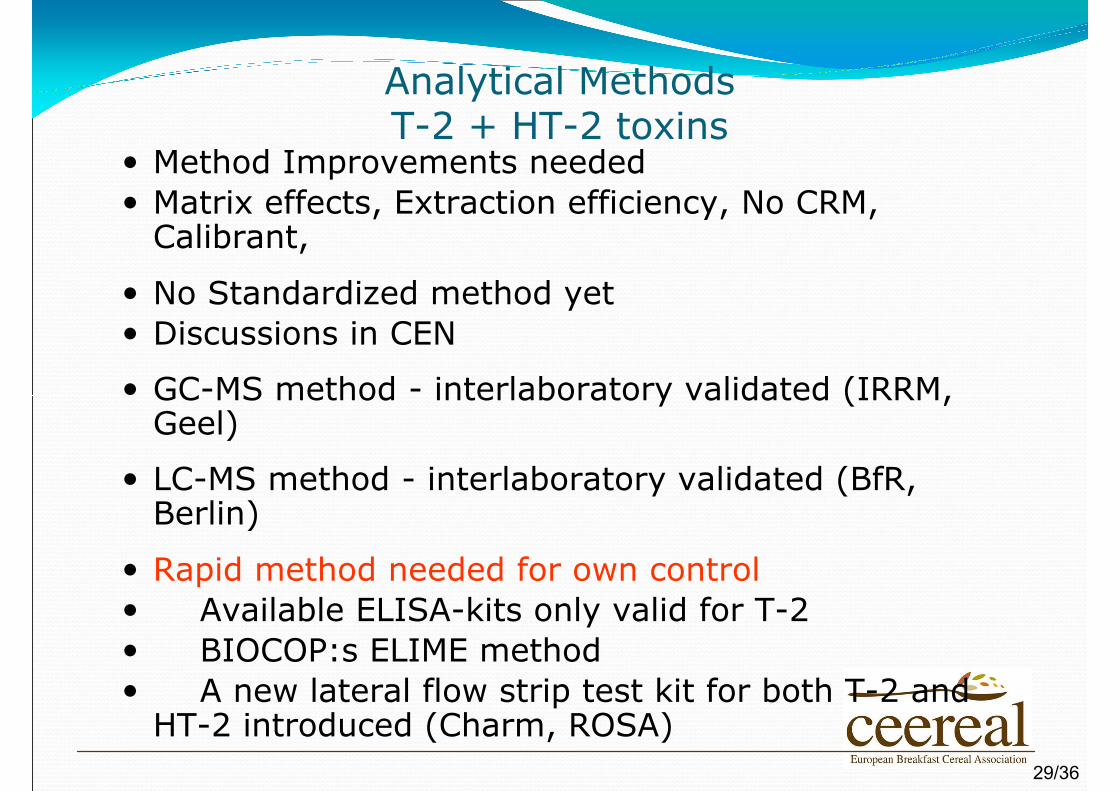
Analytical MethodsT-2 + HT-2 toxins
Method Improvements neededMatrix effects, Extraction efficiency, No CRM, Calibrant,
No Standardized method yetDiscussions in CEN
GC-MS method - interlaboratory validated (IRRM, Geel)
LC-MS method - interlaboratory validated (BfR, Berlin)
Rapid method needed for own controlAvailable ELISA-kits only valid for T-2BIOCOP:s ELIME method A new lateral flow strip test kit for both T-2 and
HT-2 introduced (Charm, ROSA)29/36
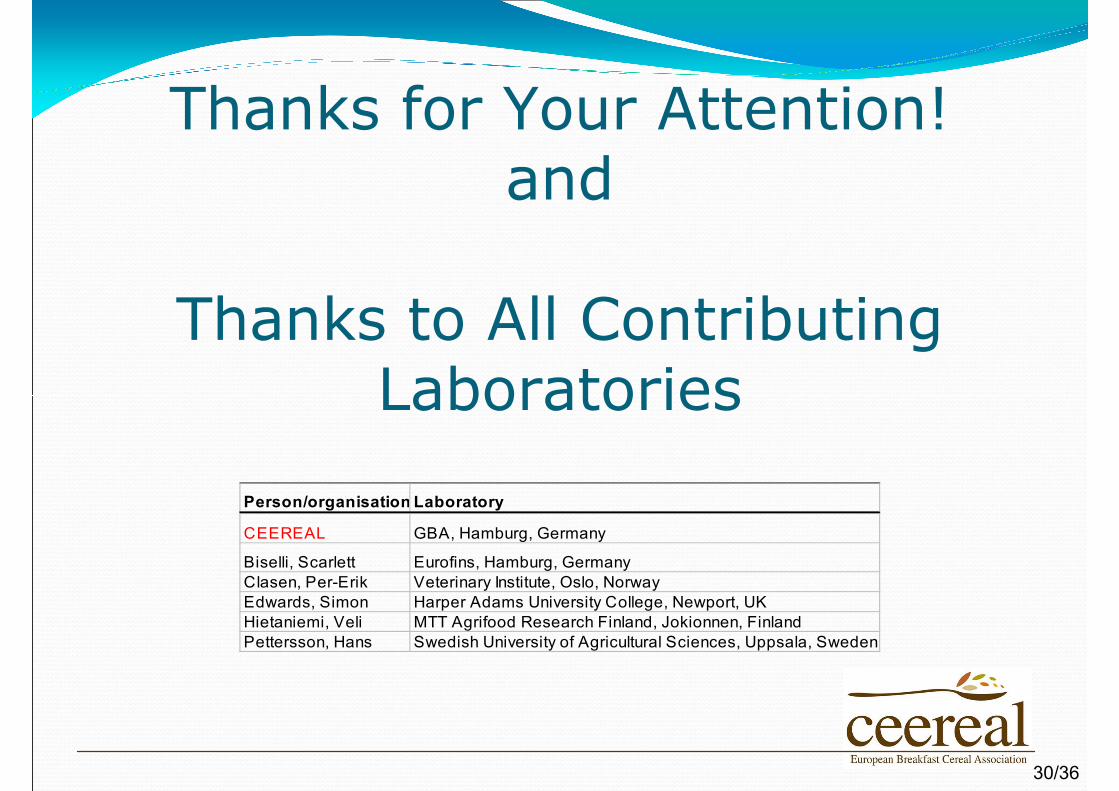
Thanks for Your Attention!and
Thanks to All Contributing Laboratories
Person/organisation Laboratory
CEEREAL GBA, Hamburg, Germany
Biselli, Scarlett Eurofins, Hamburg, GermanyClasen, Per-Erik Veterinary Institute, Oslo, NorwayEdwards, Simon Harper Adams University College, Newport, UKHietaniemi, Veli MTT Agrifood Research Finland, Jokionnen, FinlandPettersson, Hans Swedish University of Agricultural Sciences, Uppsala, Sweden
30/36
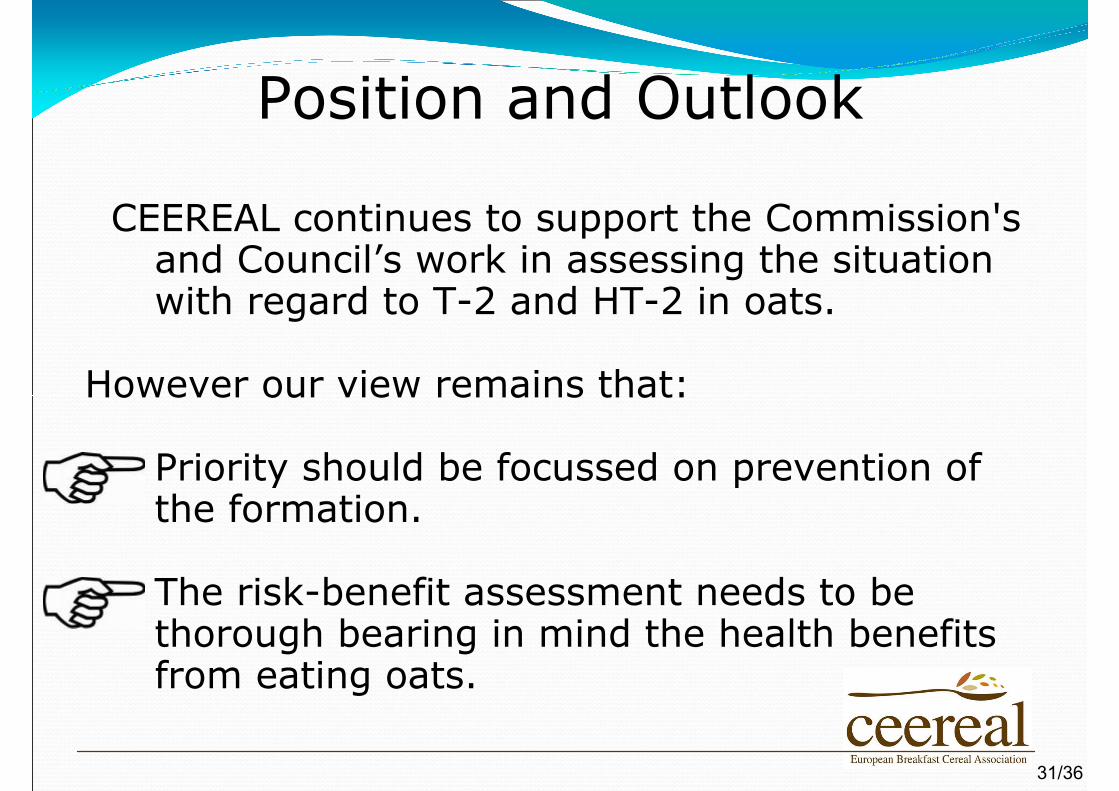
Position and Outlook
CEEREAL continues to support the Commission's and Council’s work in assessing the situation with regard to T-2 and HT-2 in oats.
However our view remains that:
• Priority should be focussed on prevention of the formation.
• The risk-benefit assessment needs to be thorough bearing in mind the health benefits from eating oats.
31/36
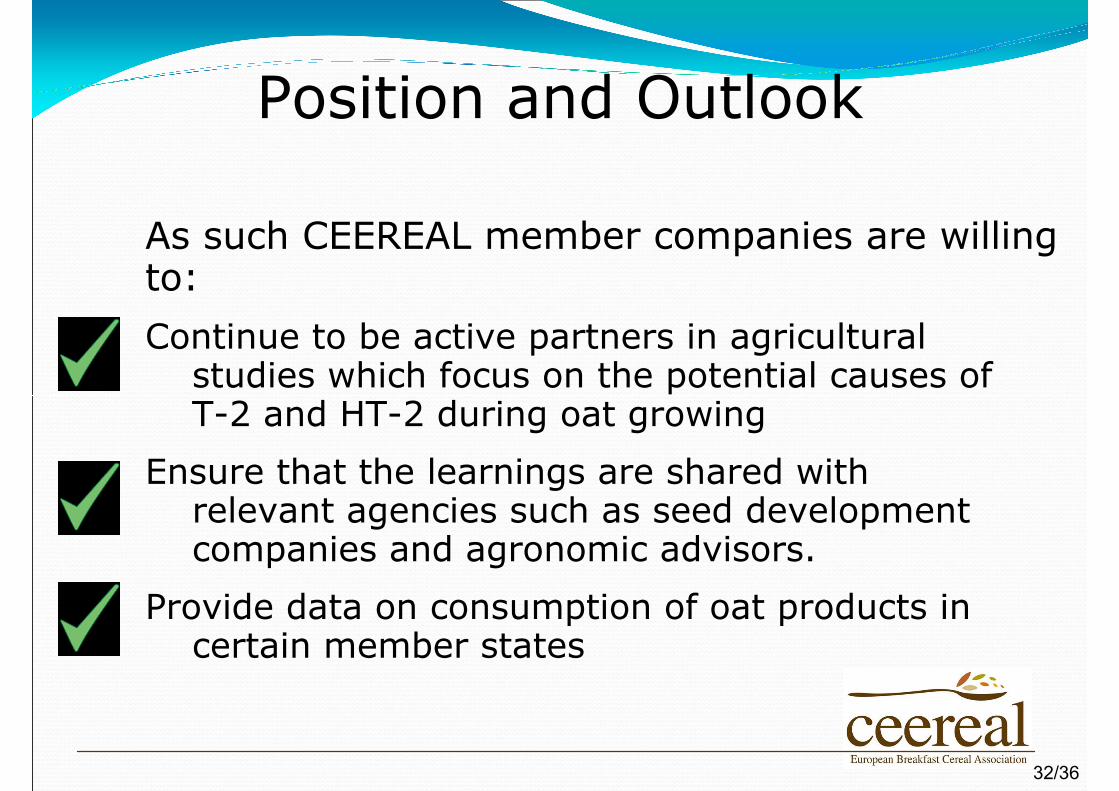
Position and Outlook
As such CEEREAL member companies are willing to:Continue to be active partners in agricultural
studies which focus on the potential causes of T-2 and HT-2 during oat growing
Ensure that the learnings are shared with relevant agencies such as seed development companies and agronomic advisors.
Provide data on consumption of oat products in certain member states
32/36
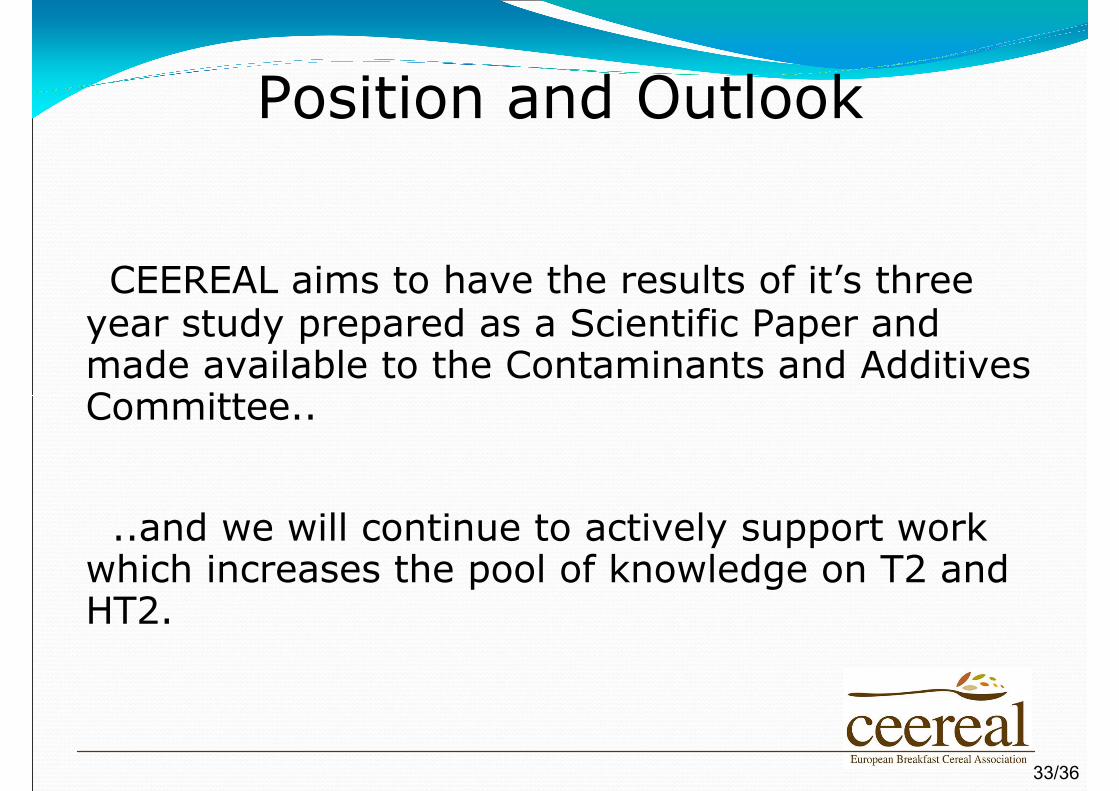
Position and Outlook
CEEREAL aims to have the results of it’s three year study prepared as a Scientific Paper and made available to the Contaminants and Additives Committee..
..and we will continue to actively support work which increases the pool of knowledge on T2 and HT2.
33/36
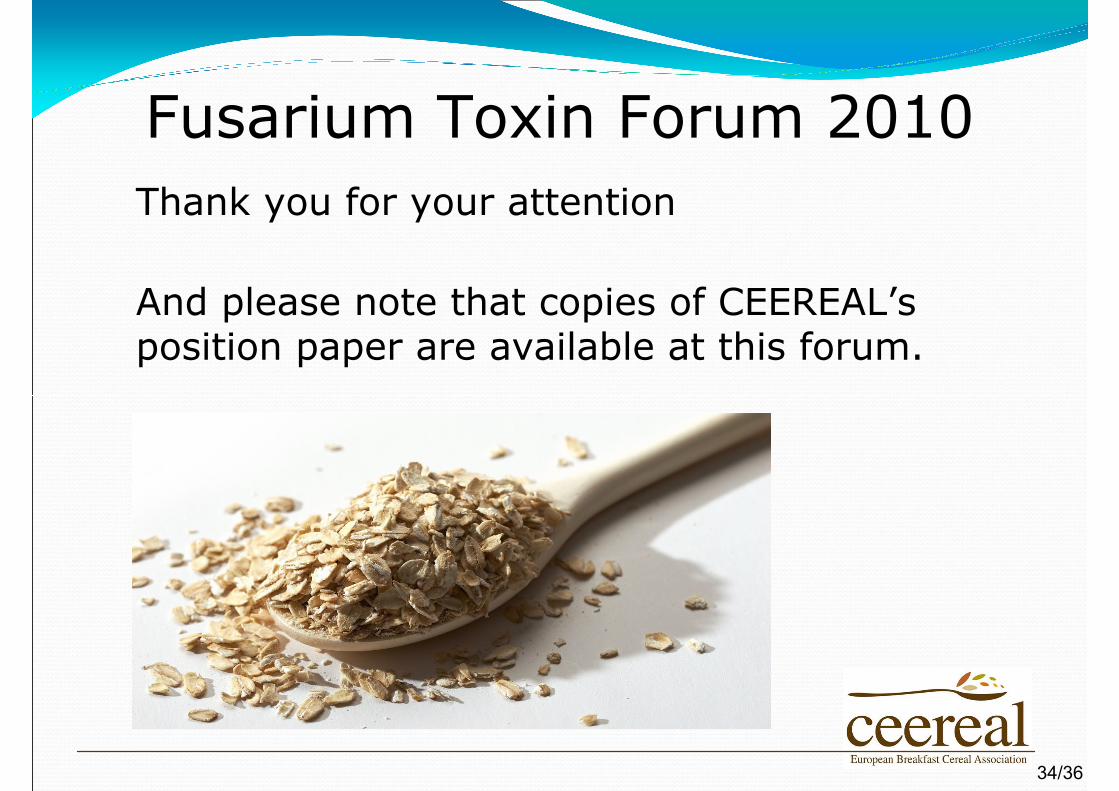
Fusarium Toxin Forum 2010Thank you for your attention
And please note that copies of CEEREAL’s position paper are available at this forum.
34/36
ReferencesBiselli, S 2006, Eurofins, Hamburg, Germany. Personal communication.
BOBMA, British Oat and Barley Millers Association 2007, Personal communication.
Brueggen H & J 2006, in T-2 and HT-2 toxins in Oats. Communication by CEEREAL at Fusarium toxin Forum, Brussels 2007
CEEREAL, European Breakfast Cereal Association 2009, Personal communication
Clasen P-E 2003, F-usariumtoksiner i bearbeidede kornprodukter - fordelning mellom skall og kjerne (Fusarium toxins in processed cereal products- distribution between hull and kernel). Report Veterinaerinstituttet, Oslo Februar 2003. pp 1-27.
Clasen, P-E 2006 + 2008, Veterinary Institute, Oslo. Personal communication.
DGE: Ernährungsbericht 2008, Kapitel Trendanalysen zum Lebensmittelverbrauch auf der Basis der Agrarstatistik. p.26-29.
Edwards S 2006 + 2008, Harper Adams University College, Newport, UK. Personal communication.
Edwards S 2007, Investigation of Fusarium mycotoxins in UK barley and oat production. HGCA Home-Grown Cereals Authority, Project Report No 415 pp 1-72.
Gottschalk C, Barthel J, Engelhardt G, Bauer J, Meyer K 2007, Occurrence of type A trichothecenes in conventionally and organically produced oats and oat products. Mol Nutr Food Res 51:1547-1553
Gregory et al., 1990, Dietary and Nutritional Survey of British Adults,
London: Her Majesty's Stationery Office
35/36
Gregory et al. 1992, National Diet and Nutrition Survey: Children aged 11/2 to 41/2 years. Volume 1: Report of the Diet and Nutrition Survey, London: Her Majesty's Stationery Office
Hietaniemi, V 2006 + 2007, MTT Agrifood Research Finland, Jokionen, Finland. Personal communication.
Langseth, W 2000, A survey on the occurrence of mycotoxins in cereals on the Norwegian market. Report from the Veterinary Institute, Norway.
Meister U 2008, Analysis of T-2 and HT-2 toxins in oats and other cereals by means of HPLC with fluorescence detection. Mycotoxin Research 24:31-39
MorningFood 2007, Personal Communication.
Pettersson H 2008, Dept. Animal Nutrition and Management, Swedish University of Agricultural Sciences, Uppsala. Personal communication.
Schöneberger et al. 2000. Hafer, Lehrbuch des Pflanzenbaus. Band 2, Verlag Th. Mann, Gelsenkirchen, 387-397.
Scoop 2003, European Commission, Scientific Cooperation:SCOOP Task 3.2.10: Collection of occurrence data of Fusarium toxins in food and assessment of dietary intake by population of EU Member States, T-2 and HT-2 toxins. DG Health and Consumers Protection 2003.
Scudamore KA, Baillie H, Patel S, Edwards SG 2007, Occurrence and fate of Fusarium mycotoxins during commercial processing of oats in the UK. Food Addit Contam 24:1374-1385
Usleber E 2008, Improvement and Occurrence of HT-2 and T-2 in Foods in Germany. 5th Fusarium toxin Forum, Brussels
Zechner, E 2001, Züchtung von Qualitätshafer für die Nahrungs-
mittelproduktion. Arbeitsgem.landwirtschaftlicher Versuchanstalten. 36/36