t: +61 08 9228 3060 soilwater consultants
TRANSCRIPT
SOILWATER CONSULTANTS t: +61 08 9228 3060 f: +61 08 9228 3210
a: 45 Gladstone St, East Perth, WA 6004
e: [email protected] w: www.soilwatergroup.com
A Member of the SOILWATER GROUP
SOILWATER CONSULTANTS | SOILWATER ANALYSIS | SOILWATER TECHNOLOGIES
www.soilwatergroup.com
Page 1 of 12
MEMO
TO: Justin Robins COMPANY: ABM Resources
FROM: Joe Powers PROJECT TITLE: Twin Bonanza Soil Assessment
DATE: 12 December 2013 PROJECT & DOCUMENT NO: ABM-002-01-01 001
SUBJECT: Twin Bonanza Soil Assessment and Erosion Study
Justin,
Soilwater Consultants (SWC) were engaged to undertake a pre-mine soils assessment for the proposed Twin Bonanza
Gold Project (TBGP). This study was intended to identify the surficial soil materials present with the Project Area, and to
characterise their physical, chemical, and hydraulic properties so that their behaviour during mining, waste dump
construction, and rehabilitation is known and predictable.
1 STUDY OVERVIEW
This study focused primarily on the properties of the in situ soils, and was confined to the main project disturbance areas
(Figure 1). In order to further refine the distribution and properties of the orebody, ABM undertook a surficial (< 2 m
depth) trenching program across the proposed deposit/s; this trenching exposed the in situ surficial soil profile and
provided an ideal scenario in which to examine and sample the surface soils from the proposed pit areas to determine
their nature and distribution. Sampling of the exposed in situ soils was conducted by ABM personnel, with11 samples
being collected from four locations within the proposed pit disturbance areas (Table 1; Figure 1). A depth profile was
sampled at 10 cm depth increments at one of the locations to examine any pedogenic organisation and development,
while surface spot samples were collected at the other 3 locations.
Table 1: Samples collected for the soil assessment study
Coordinates (GDA94 Zone 52) Sampling Depth (m)
Easting Northing
516690 7767839 0.1 - 1.35
516751 7767879 0.0 - 0.1
516654 7767728 0.0 - 0.1
516824 7766875 0.0 - 0.1
TWIN BONANZA SOIL ASSESSMENT
STUDY OVERVIEW
2
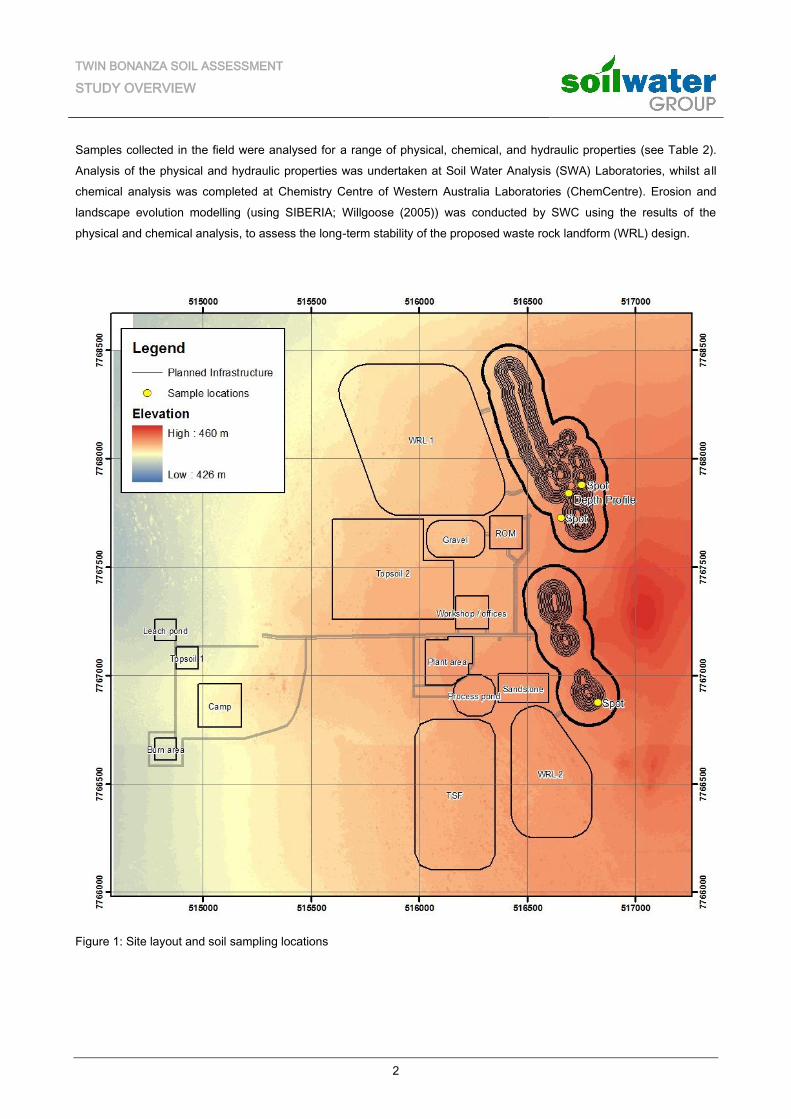
Samples collected in the field were analysed for a range of physical, chemical, and hydraulic properties (see Table 2).
Analysis of the physical and hydraulic properties was undertaken at Soil Water Analysis (SWA) Laboratories, whilst all
chemical analysis was completed at Chemistry Centre of Western Australia Laboratories (ChemCentre). Erosion and
landscape evolution modelling (using SIBERIA; Willgoose (2005)) was conducted by SWC using the results of the
physical and chemical analysis, to assess the long-term stability of the proposed waste rock landform (WRL) design.
Figure 1: Site layout and soil sampling locations
TWIN BONANZA SOIL ASSESSMENT
MORPHOLOGICAL AND PHYSICAL PROPERTIES
3
Table 2: Laboratory analysis conducted on the soil samples
Physical properties Chemical properties
Particle size distribution (PSD) pH
Gravel content Electrical conductivity (EC)
Erosion characteristics Nitrate and Ammonium
Organic Carbon (OC)
‘Mehlich 3’ nutrient suite
(B, Ca, Co, Cu, Fe, K, Mg, Mn, Mo, P, Na, S, Zn)
Exchangeable cations
2 MORPHOLOGICAL AND PHYSICAL PROPERTIES
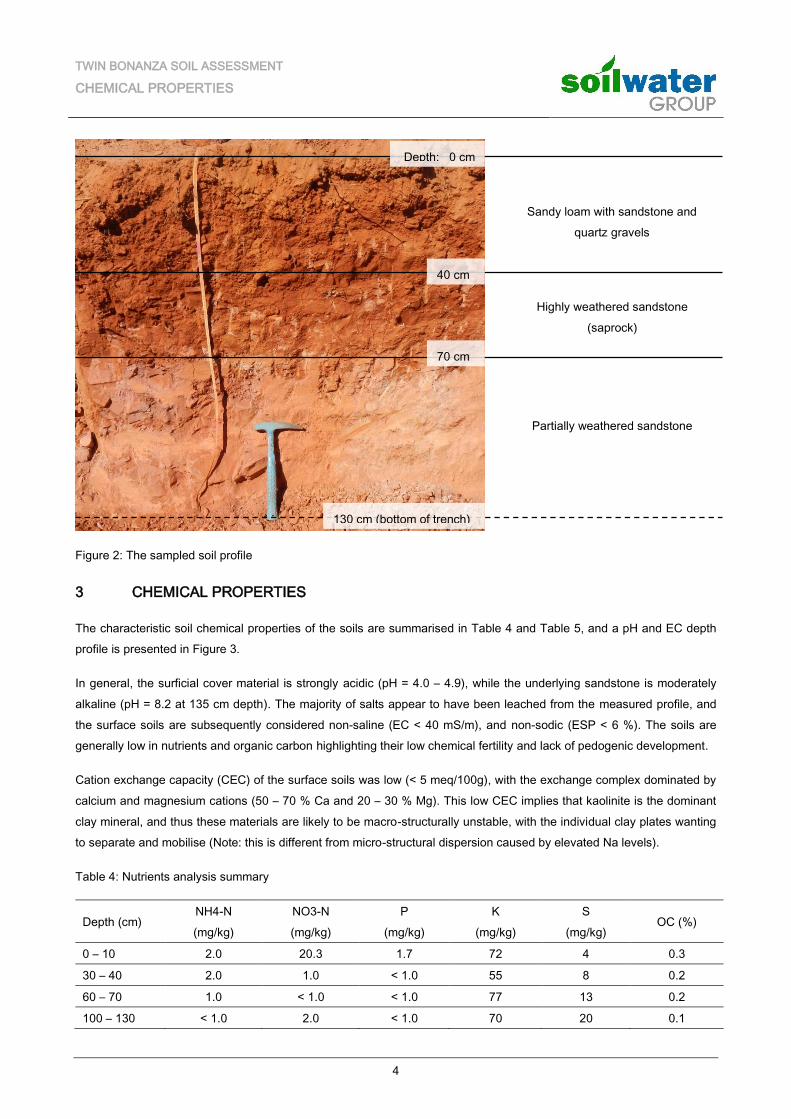
A characteristic soil profile from the site is shown in Figure 2, and typical physical properties exhibited by the soils are
summarised in Table 3. The soil profile is characterised as a shallow sandy loam, consisting of surficial red sandy loam
cover (i.e. upper 30 – 50 cm), overlying a partially to completely weathered sandstone (i.e. reflects a saprock or transition
material). Plant roots were present throughout the sampled profile.
The surficial cover material contains a significant residual gravel fraction (15 – 40 % gravel), with generally fewer gravels
present in the underlying weathered transition zone (5 – 25 %). The underlying in situ sandstone is considered to be well
cemented, but a high proportion of gravel (55 – 65 %) was measured in the laboratory sample, which is thought to be
representative of the properties of this material once broken up during excavation.
Table 3: Particle size distribution profile
Depth
(cm) Texture % Sand % Silt % Clay %Gravel
0 – 10 Loamy sand 87.2 5.0 7.9 17.5
10 – 20 Sandy loam 81.8 6.7 11.5 43.9
20 – 30 Sandy loam 76.4 11.7 11.9 16.9
30 – 40 Loam 73.9 13.9 12.1 5.7
40 – 50 Loamy Sand 69.2 20.6 10.1 2.3
50 – 60 Loam 62.2 21.4 16.4 25.4
60 – 70 Loam 58.4 19.5 22.1 56.9
70 – 80 Loam 60.3 18.7 21.0 54.4
100 – 130 Loam 75.2 12.9 11.9 66.8
TWIN BONANZA SOIL ASSESSMENT
CHEMICAL PROPERTIES
4
Figure 2: The sampled soil profile
3 CHEMICAL PROPERTIES
The characteristic soil chemical properties of the soils are summarised in Table 4 and Table 5, and a pH and EC depth
profile is presented in Figure 3.
In general, the surficial cover material is strongly acidic (pH = 4.0 – 4.9), while the underlying sandstone is moderately
alkaline (pH = 8.2 at 135 cm depth). The majority of salts appear to have been leached from the measured profile, and
the surface soils are subsequently considered non‐saline (EC < 40 mS/m), and non-sodic (ESP < 6 %). The soils are
generally low in nutrients and organic carbon highlighting their low chemical fertility and lack of pedogenic development.
Cation exchange capacity (CEC) of the surface soils was low (< 5 meq/100g), with the exchange complex dominated by
calcium and magnesium cations (50 – 70 % Ca and 20 – 30 % Mg). This low CEC implies that kaolinite is the dominant
clay mineral, and thus these materials are likely to be macro-structurally unstable, with the individual clay plates wanting
to separate and mobilise (Note: this is different from micro-structural dispersion caused by elevated Na levels).
Table 4: Nutrients analysis summary
Depth (cm) NH4-N
(mg/kg)
NO3-N
(mg/kg)
P
(mg/kg)
K
(mg/kg)
S
(mg/kg) OC (%)
0 – 10 2.0 20.3 1.7 72 4 0.3
30 – 40 2.0 1.0 < 1.0 55 8 0.2
60 – 70 1.0 < 1.0 < 1.0 77 13 0.2
100 – 130 < 1.0 2.0 < 1.0 70 20 0.1
Depth: 0 cm
40 cm
70 cm
130 cm (bottom of trench)
Sandy loam with sandstone and
quartz gravels
Highly weathered sandstone
(saprock)
Partially weathered sandstone

TWIN BONANZA SOIL ASSESSMENT
CHEMICAL PROPERTIES
5
Table 5: Exchangeable cations
Depth (cm) Ca
(meq/100g)
K
(meq/100g)
Mg
(meq/100g)
Na
(meq/100g)
CEC
(meq/100g)
ESP
(%)
0 – 10 1.21 0.18 0.50 0.05 1.90 0.0 %
30 – 40 0.63 0.12 0.30 < 0.02 1.05 0.0 %
60 – 70 1.60 0.17 0.91 0.03 2.71 1.1 %
100 – 130 2.60 0.19 1.20 0.17 4.16 4.1 %
Figure 3: pH and EC depth profile
2 3 4 5 6 7 8 9 10 11 12
0
10
20
30
40
50
60
70
80
90
100
110
120
130
140
0 20 40 60 80 100 120 140 160 180 200
EC (mS/m)
Dep
th [
cm
]
pH
EC
pH

TWIN BONANZA SOIL ASSESSMENT
SOIL EROSION POTENTIAL
6
4 SOIL EROSION POTENTIAL
An analysis of dispersion potential was made using a method based on the work of Rengasamy and Greene et al. (1984)
(Figure 4). This analysis showed that all of the sampled soils were considered to fall within Dispersion Class 2a. This
means that most of the topsoils are potentially dispersive after mechanical disturbance of the soil structure (i.e. after
excavation and stockpiling). This classification is mainly attributed to the lack of salts within the soil solution to facilitate
aggregation and flocculation of clays. Thus, soils containing the largest fractions of clay (i.e. the weathered “transition”
layer) are at the greatest risk of dispersion. Conversely, soils containing larger fractions of gravel will be at the least risk
of the effects of dispersion. The topsoils (0 – 30 cm depth) and sandstone (> 100 cm depth) are therefore expected to be
the least affected by dispersion because of the moderate clay content and significant gravel content in these soil
horizons.
A visual assessment of slaking and dispersion was also conducted by SWA. This assessment indicated that the soils
were prone to slaking, but did not readily disperse; supporting the CEC results that the clay mineral fraction is dominated
by kaolinite. This indicates a level of susceptibility to structural degradation in the presence of water, although very little
true dispersion of the clay fraction was observed.
Figure 4: Clay dispersion potential
Table 6: Slaking and dispersion test results
Depth (cm) Slaking
(15 min)
Slaking
(24 hr)
Dispersion
(15 min)
Dispersion
(24 hr)
0 – 10 Complete Complete Slight Slight
30 – 40 Moderate Complete None None
60 – 70 Moderate Complete None None
0
50
100
150
200
250
0 5 10 15 20
EC1
:5 [
mS/
m]
ESP [%]
2a
Class 3a
Flocculated Soils
Potentially Dispersive Soils
3c
Class 3b
Class 2b
Dispersive Soils Class 1

TWIN BONANZA SOIL ASSESSMENT
SOIL EROSION POTENTIAL
7
Laboratory-scale erosion testing was conducted on a sandstone material, as this was considered the most suitable and
widely available material for reconstructing the outer surfaces of the post-mine landforms. A laboratory-scale rainfall
simulator was used to measure the interrill (raindrop impact) erodibility (Ki) and effective hydraulic conductivity (Keff) of
each material, and a rill erosion test was conducted to measure the rill erodibility (Kr) and critical shear stress (τC) of the
materials under overland flow conditions (Table 7). These parameters were then used within the Watershed Erosion
Prediction Project (WEPP) model to determine expected average sediment yields on a range of land surface
configurations.
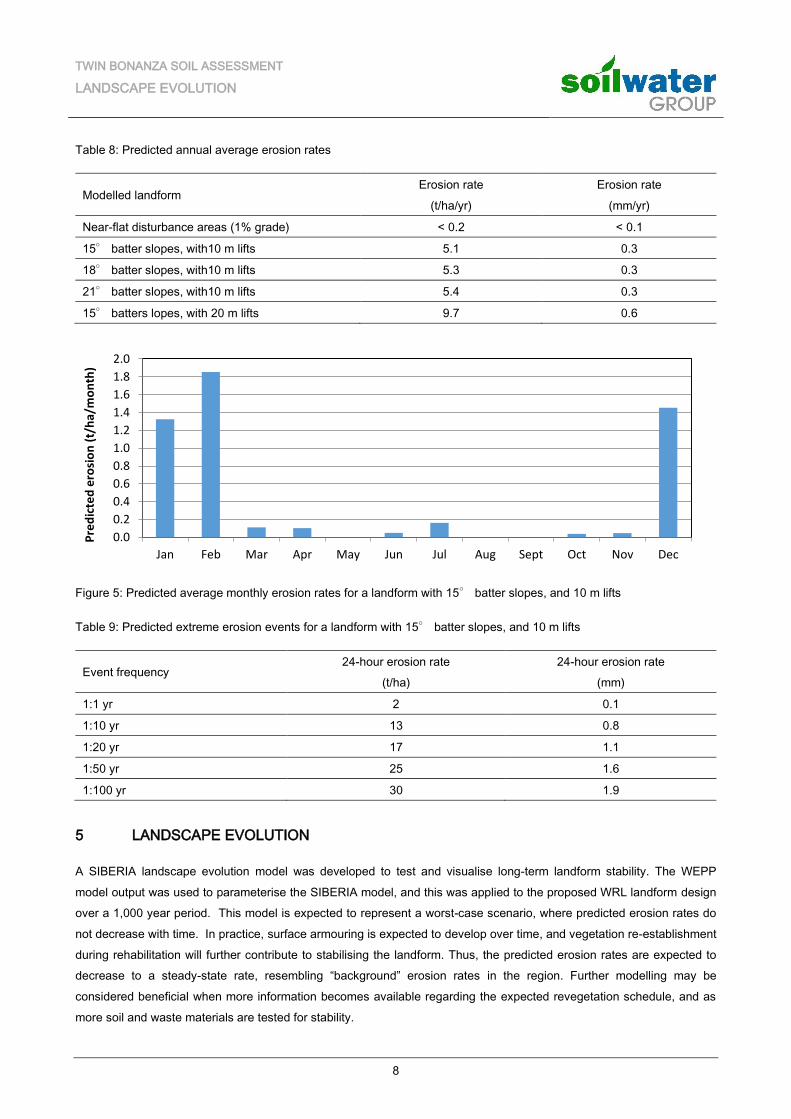
The results of the erosion modelling are summarised in Table 8. In general predicted erosion rates were low, primarily
due to the armouring effects of the large gravel fraction (Plate 1) and high infiltration rate of the sandstone material.
Predicted erosion rates on WRL batter slopes increased with increasing slope angle and with increasing lift height. The
predicted average erosion rate for near-flat surfaces (i.e. pads, roads, etc.) was negligible, at < 0.2 t/ha/yr, with
approximately 90 % of the predicted erosion expected in the months of December, January, and February (Figure 5).
Expected extreme erosion event frequencies are presented in Table 8 for a WRL design consisting of 15° batter slope
angles, and a 10 m lift height.
Table 7: WEPP model input parameters determined through laboratory testing
Material ID Sand
(%)
Clay
(%)
OM
(%)
CEC
(meq/100g)
Keff
(mm/hr)
Ki x 105
(Kg s / m4)
Kr
(s / m)
τC
(Pa)
Sandstone 75 12 0.11 4.1 31.2 1.0 0.0007 8.9
Plate 1: Surface armouring after 4 hours of simulated rainfall
TWIN BONANZA SOIL ASSESSMENT
LANDSCAPE EVOLUTION
8
Table 8: Predicted annual average erosion rates
Modelled landform Erosion rate
(t/ha/yr)
Erosion rate
(mm/yr)
Near-flat disturbance areas (1% grade) < 0.2 < 0.1
15° batter slopes, with10 m lifts 5.1 0.3
18° batter slopes, with10 m lifts 5.3 0.3
21° batter slopes, with10 m lifts 5.4 0.3
15° batters lopes, with 20 m lifts 9.7 0.6
Figure 5: Predicted average monthly erosion rates for a landform with 15° batter slopes, and 10 m lifts
Table 9: Predicted extreme erosion events for a landform with 15° batter slopes, and 10 m lifts
Event frequency 24-hour erosion rate
(t/ha)
24-hour erosion rate
(mm)
1:1 yr 2 0.1
1:10 yr 13 0.8
1:20 yr 17 1.1
1:50 yr 25 1.6
1:100 yr 30 1.9
5 LANDSCAPE EVOLUTION
A SIBERIA landscape evolution model was developed to test and visualise long-term landform stability. The WEPP
model output was used to parameterise the SIBERIA model, and this was applied to the proposed WRL landform design
over a 1,000 year period. This model is expected to represent a worst-case scenario, where predicted erosion rates do
not decrease with time. In practice, surface armouring is expected to develop over time, and vegetation re-establishment
during rehabilitation will further contribute to stabilising the landform. Thus, the predicted erosion rates are expected to
decrease to a steady-state rate, resembling “background” erosion rates in the region. Further modelling may be
considered beneficial when more information becomes available regarding the expected revegetation schedule, and as
more soil and waste materials are tested for stability.
0.0
0.2
0.4
0.6
0.8
1.0
1.2
1.4
1.6
1.8
2.0
Jan Feb Mar Apr May Jun Jul Aug Sept Oct Nov Dec
Pre
dic
ted
ero
sio
n (
t/h
a/m
on
th)
TWIN BONANZA SOIL ASSESSMENT
RECOMMENDATIONS
9
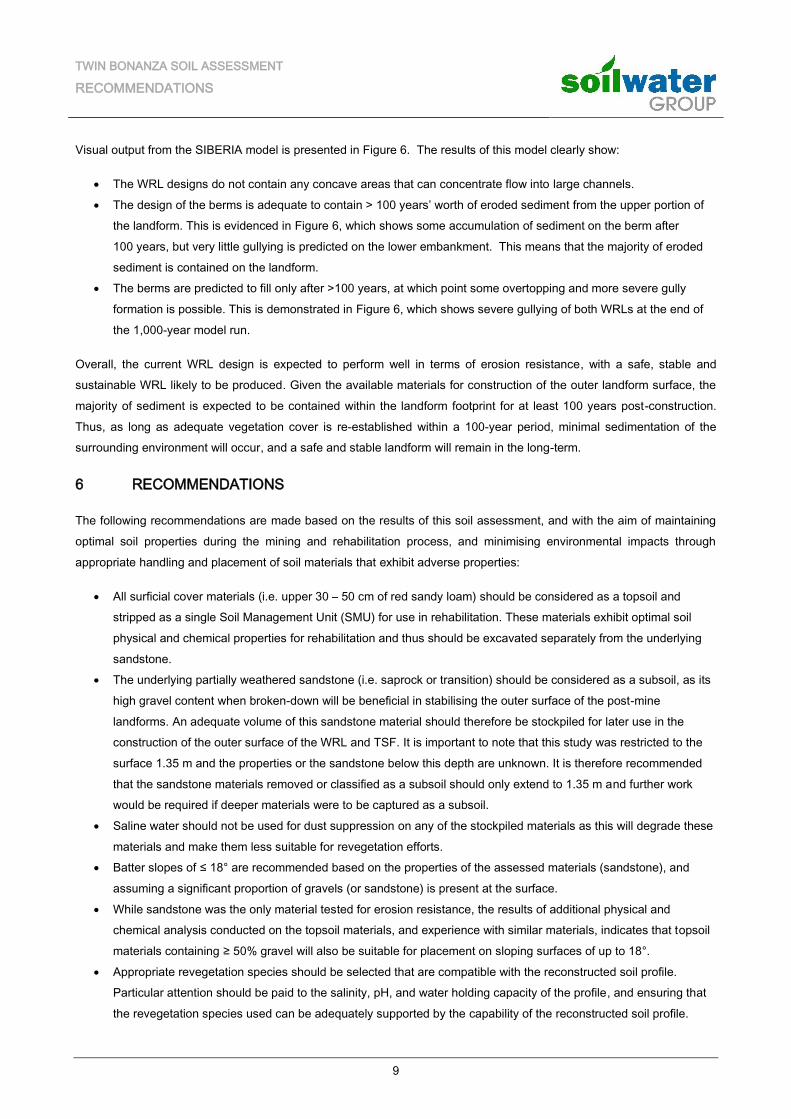
Visual output from the SIBERIA model is presented in Figure 6. The results of this model clearly show:
The WRL designs do not contain any concave areas that can concentrate flow into large channels.
The design of the berms is adequate to contain > 100 years’ worth of eroded sediment from the upper portion of
the landform. This is evidenced in Figure 6, which shows some accumulation of sediment on the berm after
100 years, but very little gullying is predicted on the lower embankment. This means that the majority of eroded
sediment is contained on the landform.
The berms are predicted to fill only after >100 years, at which point some overtopping and more severe gully
formation is possible. This is demonstrated in Figure 6, which shows severe gullying of both WRLs at the end of
the 1,000-year model run.
Overall, the current WRL design is expected to perform well in terms of erosion resistance, with a safe, stable and
sustainable WRL likely to be produced. Given the available materials for construction of the outer landform surface, the
majority of sediment is expected to be contained within the landform footprint for at least 100 years post-construction.
Thus, as long as adequate vegetation cover is re-established within a 100-year period, minimal sedimentation of the
surrounding environment will occur, and a safe and stable landform will remain in the long-term.
6 RECOMMENDATIONS
The following recommendations are made based on the results of this soil assessment, and with the aim of maintaining
optimal soil properties during the mining and rehabilitation process, and minimising environmental impacts through
appropriate handling and placement of soil materials that exhibit adverse properties:
All surficial cover materials (i.e. upper 30 – 50 cm of red sandy loam) should be considered as a topsoil and
stripped as a single Soil Management Unit (SMU) for use in rehabilitation. These materials exhibit optimal soil
physical and chemical properties for rehabilitation and thus should be excavated separately from the underlying
sandstone.
The underlying partially weathered sandstone (i.e. saprock or transition) should be considered as a subsoil, as its
high gravel content when broken-down will be beneficial in stabilising the outer surface of the post-mine
landforms. An adequate volume of this sandstone material should therefore be stockpiled for later use in the
construction of the outer surface of the WRL and TSF. It is important to note that this study was restricted to the
surface 1.35 m and the properties or the sandstone below this depth are unknown. It is therefore recommended
that the sandstone materials removed or classified as a subsoil should only extend to 1.35 m and further work
would be required if deeper materials were to be captured as a subsoil.
Saline water should not be used for dust suppression on any of the stockpiled materials as this will degrade these
materials and make them less suitable for revegetation efforts.
Batter slopes of ≤ 18° are recommended based on the properties of the assessed materials (sandstone), and
assuming a significant proportion of gravels (or sandstone) is present at the surface.
While sandstone was the only material tested for erosion resistance, the results of additional physical and
chemical analysis conducted on the topsoil materials, and experience with similar materials, indicates that topsoil
materials containing ≥ 50% gravel will also be suitable for placement on sloping surfaces of up to 18°.
Appropriate revegetation species should be selected that are compatible with the reconstructed soil profile.
Particular attention should be paid to the salinity, pH, and water holding capacity of the profile, and ensuring that
the revegetation species used can be adequately supported by the capability of the reconstructed soil profile.
TWIN BONANZA SOIL ASSESSMENT
RECOMMENDATIONS
10
Should you have any queries regarding this report, please do not hesitate to contact us.
Yours sincerely,
Joe Powers
Water Resource Engineer
t: +61 8 9228 3060

PN: ABM-002-01-01 Prepared by: JP Date: 22/10/13 Reviewed by: ASP Date: 28/10/13 Revision: 1
Design DEM 100 years 1,000 years
ABM Resources
Figure 6: SIBERIA model output, showing predicted worst-case erosion of the proposed wast rock landforms.
Twin Bonanza Soil Assessment
WR
L N
ort
h
WR
L S
ou
th
TWIN BONANZA SOIL ASSESSMENT
12
7 REFERENCES
Rengasamy, P., Greene, R., Ford, G. and Mehanni, A. (1984) Identification of dispersive behaviour and the
management of red-brown earths. Soil Research, 22, 413-431.
Willgoose, G. (2005) User Manual for SIBERIA, Version 8.3. Telluric Research. Scone, NSW.