t enefits of diversification - schultz collins 27.53% crsp deciles 1-2 crsp deciles 3-5 crsp deciles...
TRANSCRIPT
T H E B E N E F I T S O F D I V E R S I F I C AT I O N
S c h u l t z C o l l i n s , I n c . 4 5 5 M a r ke t S t re e t , S u i t e 1 2 5 0 S a n F ra n c i s c o , C A 9 4 1 0 5 p h o n e : 4 1 5 . 2 9 1 . 3 0 0 0 8 7 7 . 2 9 1 . 2 2 0 5
T H E B E N E F I T S O F D I V E R S I F I C A T I O N
1
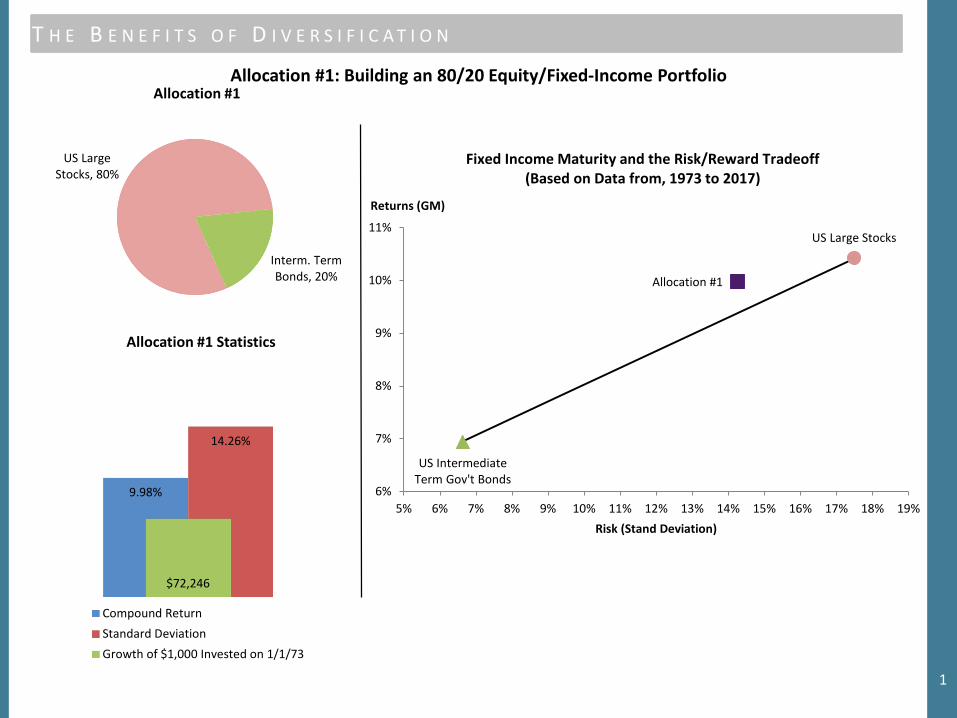
US Large Stocks, 80%
Interm. Term Bonds, 20%
Allocation #1: Building an 80/20 Equity/Fixed-Income Portfolio
9.98%
14.26%
$72,246 0.E+00
5.E+04
1.E+05
2.E+05
2.E+05
0%
2%
4%
6%
8%
10%
12%
14%
16%
18%
20%Allocation #1 Statistics
Compound ReturnStandard DeviationGrowth of $1,000 Invested on 1/1/73
Allocation #1
US Large Stocks
US Intermediate Term Gov't Bonds
6%
7%
8%
9%
10%
11%
5% 6% 7% 8% 9% 10% 11% 12% 13% 14% 15% 16% 17% 18% 19%
Returns (GM)
Risk (Stand Deviation)
Fixed Income Maturity and the Risk/Reward Tradeoff(Based on Data from, 1973 to 2017)
Allocation #1
T H E B E N E F I T S O F D I V E R S I F I C A T I O N
2
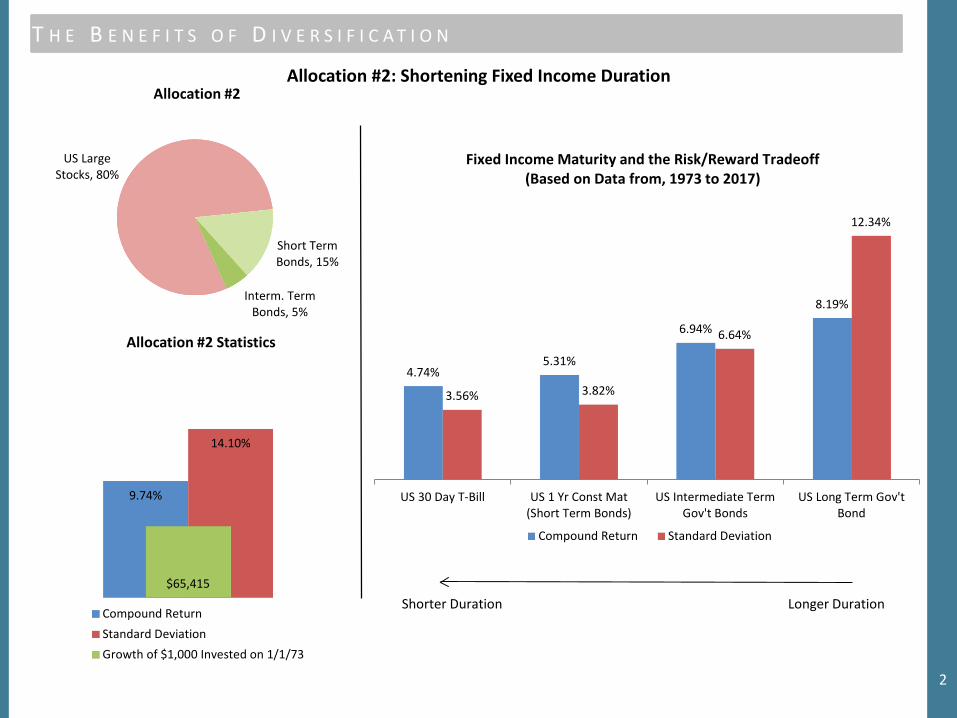
US Large Stocks, 80%
Short Term Bonds, 15%
Interm. Term Bonds, 5%
Allocation #2: Shortening Fixed Income Duration
9.74%
14.10%
$65,415 0.E+00
5.E+04
1.E+05
2.E+05
2.E+05
0%
2%
4%
6%
8%
10%
12%
14%
16%
18%
20%Allocation #2 Statistics
Compound ReturnStandard DeviationGrowth of $1,000 Invested on 1/1/73
4.74%5.31%
6.94%
8.19%
3.56% 3.82%
6.64%
12.34%
US 30 Day T-Bill US 1 Yr Const Mat(Short Term Bonds)
US Intermediate TermGov't Bonds
US Long Term Gov'tBond
Compound Return Standard Deviation
Fixed Income Maturity and the Risk/Reward Tradeoff(Based on Data from, 1973 to 2017)
Allocation #2
Shorter Duration Longer Duration
T H E B E N E F I T S O F D I V E R S I F I C A T I O N
3
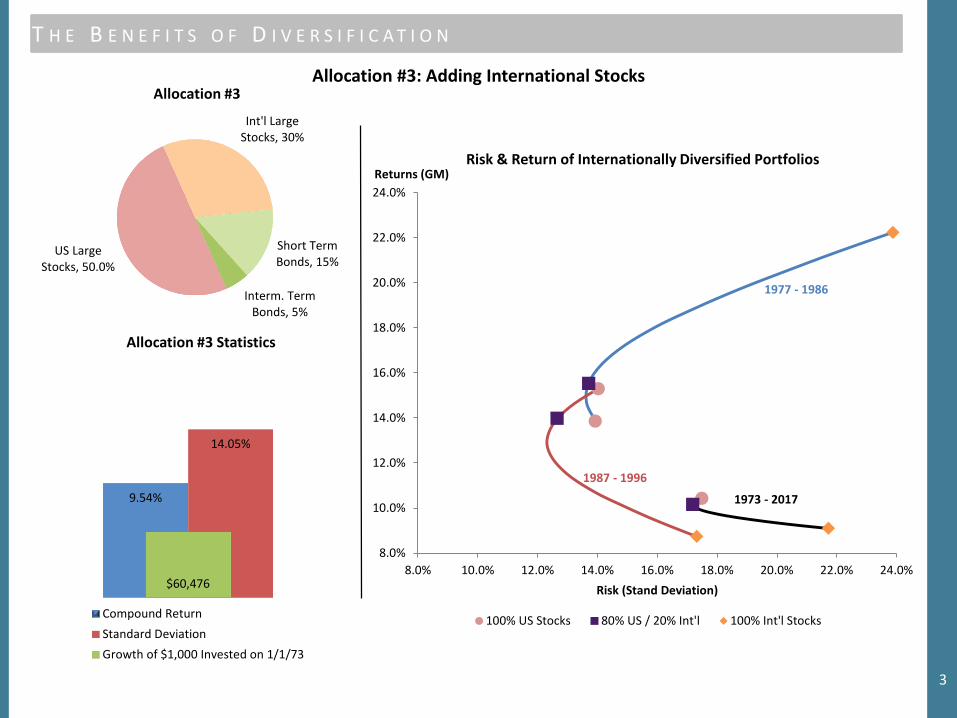
US Large Stocks, 50.0%
Int'l Large Stocks, 30%
Short Term Bonds, 15%
Interm. Term Bonds, 5%
Allocation #3: Adding International Stocks
9.54%
14.05%
$60,476 0.E+00
5.E+04
1.E+05
2.E+05
2.E+05
0%
2%
4%
6%
8%
10%
12%
14%
16%
18%
20%Allocation #3 Statistics
Compound ReturnStandard DeviationGrowth of $1,000 Invested on 1/1/73
1973 - 2017
1977 - 1986
1987 - 1996
8.0%
10.0%
12.0%
14.0%
16.0%
18.0%
20.0%
22.0%
24.0%
8.0% 10.0% 12.0% 14.0% 16.0% 18.0% 20.0% 22.0% 24.0%
Returns (GM)
Risk (Stand Deviation)
100% US Stocks 80% US / 20% Int'l 100% Int'l Stocks
Risk & Return of Internationally Diversified Portfolios
Allocation #3
T H E B E N E F I T S O F D I V E R S I F I C A T I O N
4
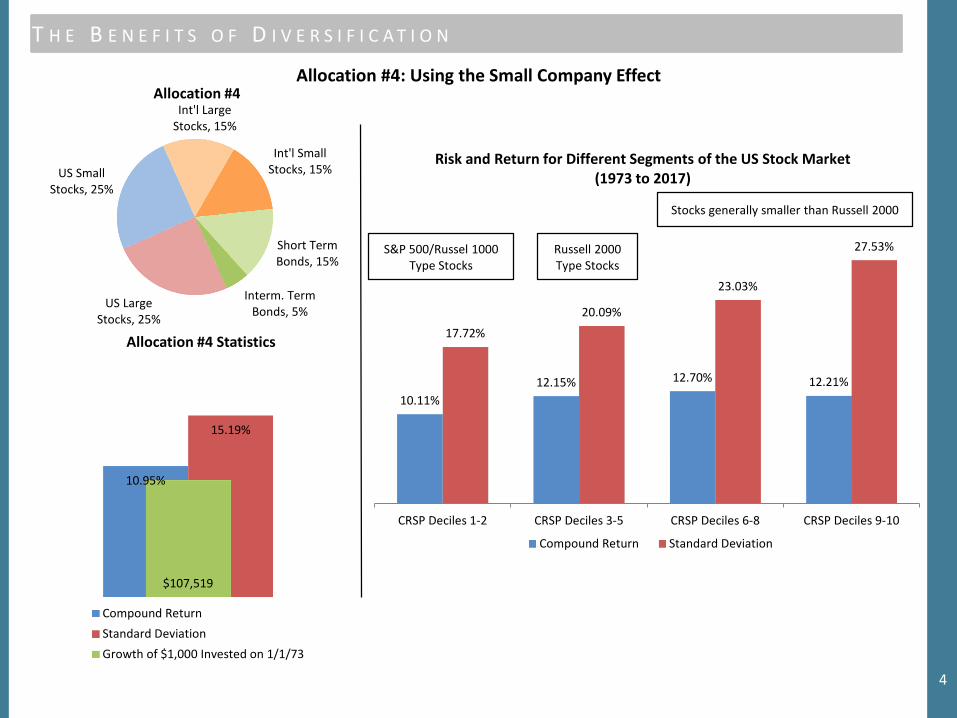
US Large Stocks, 25%
US Small Stocks, 25%
Int'l Large Stocks, 15%
Int'l Small Stocks, 15%
Short Term Bonds, 15%
Interm. Term Bonds, 5%
Allocation #4: Using the Small Company Effect
10.95%
15.19%
$107,519 0.E+00
5.E+04
1.E+05
2.E+05
2.E+05
0%
2%
4%
6%
8%
10%
12%
14%
16%
18%
20%Allocation #4 Statistics
Compound ReturnStandard DeviationGrowth of $1,000 Invested on 1/1/73
10.11%12.15% 12.70% 12.21%
17.72%
20.09%
23.03%
27.53%
CRSP Deciles 1-2 CRSP Deciles 3-5 CRSP Deciles 6-8 CRSP Deciles 9-10
Compound Return Standard Deviation
Stocks generally smaller than Russell 2000
Russell 2000Type Stocks
S&P 500/Russel 1000Type Stocks
Risk and Return for Different Segments of the US Stock Market (1973 to 2017)
Allocation #4
T H E B E N E F I T S O F D I V E R S I F I C A T I O N
5
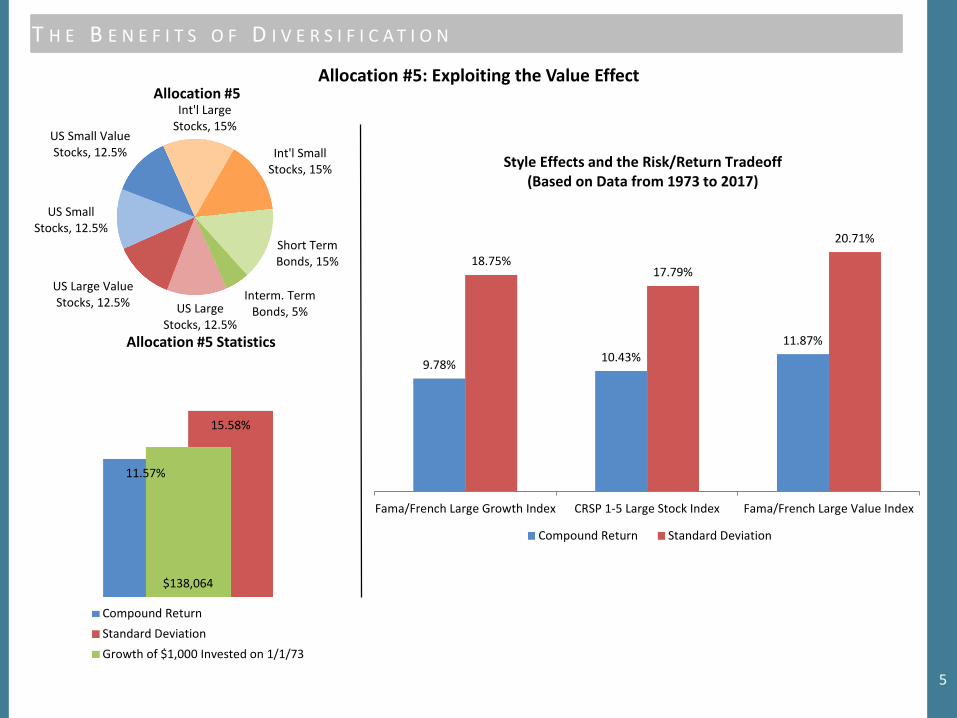
US Large Stocks, 12.5%
US Large Value Stocks, 12.5%
US Small Stocks, 12.5%
US Small Value Stocks, 12.5%
Int'l Large Stocks, 15%
Int'l Small Stocks, 15%
Short Term Bonds, 15%
Interm. Term Bonds, 5%
Allocation #5: Exploiting the Value Effect
11.57%
15.58%
$138,064 0.E+00
5.E+04
1.E+05
2.E+05
2.E+05
0%
2%
4%
6%
8%
10%
12%
14%
16%
18%
20%Allocation #5 Statistics
Compound ReturnStandard DeviationGrowth of $1,000 Invested on 1/1/73
9.78% 10.43%11.87%
18.75%17.79%
20.71%
Fama/French Large Growth Index CRSP 1-5 Large Stock Index Fama/French Large Value Index
Compound Return Standard Deviation
Style Effects and the Risk/Return Tradeoff(Based on Data from 1973 to 2017)
Allocation #5
T H E B E N E F I T S O F D I V E R S I F I C A T I O N
6
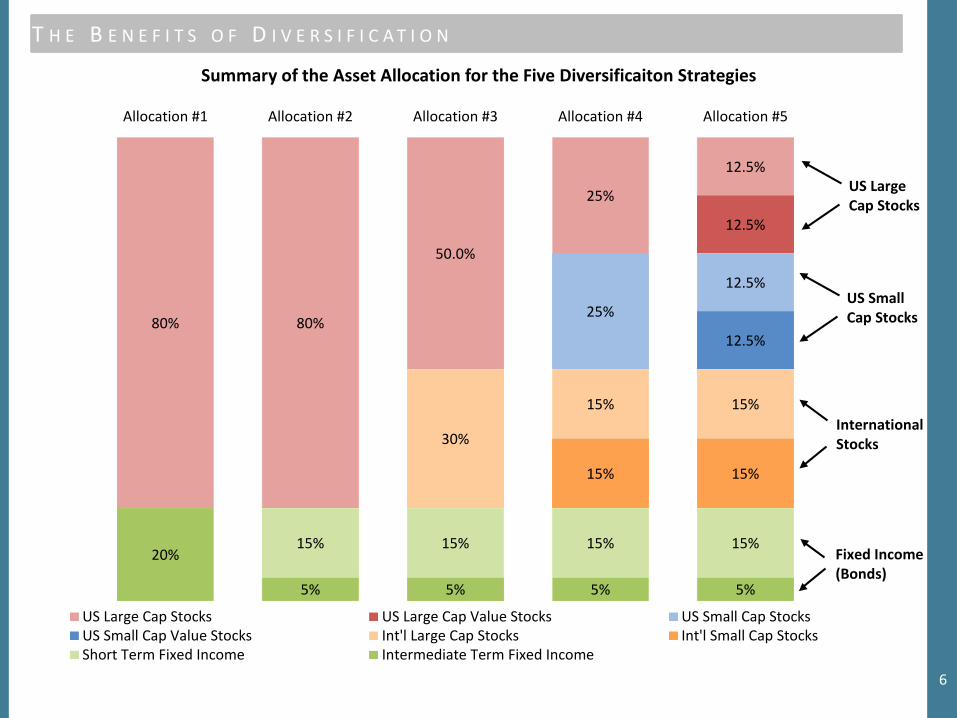
80% 80%
50.0%
25%
12.5%
12.5%
25%
12.5%
12.5%
30%
15% 15%
15% 15%
15% 15% 15% 15%20%
5% 5% 5% 5%
Allocation #1 Allocation #2 Allocation #3 Allocation #4 Allocation #5
Summary of the Asset Allocation for the Five Diversificaiton Strategies
US Large Cap Stocks US Large Cap Value Stocks US Small Cap StocksUS Small Cap Value Stocks Int'l Large Cap Stocks Int'l Small Cap StocksShort Term Fixed Income Intermediate Term Fixed Income
US Large Cap Stocks
US Small Cap Stocks
International Stocks
Fixed Income (Bonds)
T H E B E N E F I T S O F D I V E R S I F I C A T I O N
7
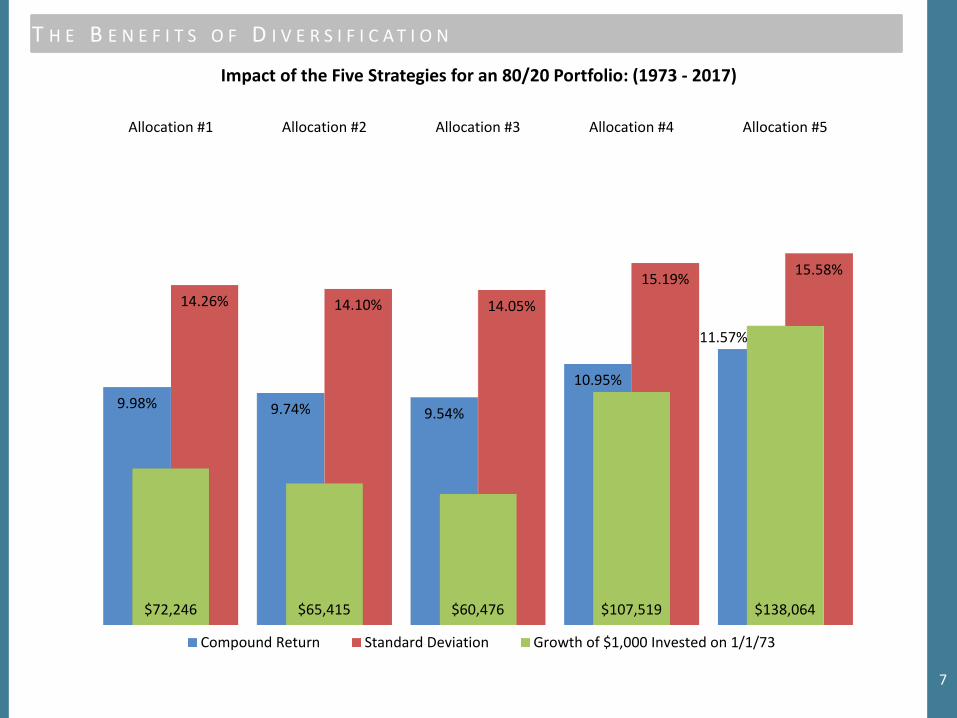
9.98% 9.74% 9.54%
10.95%
11.57%
14.26% 14.10% 14.05%
15.19% 15.58%
$72,246 $65,415 $60,476 $107,519 $138,064 0.E+00
5.E+04
1.E+05
2.E+05
2.E+05
0.00%
2.00%
4.00%
6.00%
8.00%
10.00%
12.00%
14.00%
16.00%
18.00%
20.00%Allocation #1 Allocation #2 Allocation #3 Allocation #4 Allocation #5
Impact of the Five Strategies for an 80/20 Portfolio: (1973 - 2017)
Compound Return Standard Deviation Growth of $1,000 Invested on 1/1/73
T H E B E N E F I T S O F D I V E R S I F I C A T I O N
8
$103,570
$292,715
$107,947
$1,804,150
$100
$1,000
$10,000
$100,000
$1,000,000
$10,000,000
1963
1965
1967
1969
1971
1973
1975
1977
1979
1981
1983
1985
1987
1989
1991
1993
1995
1997
1999
2001
2003
2005
2007
2009
2011
2013
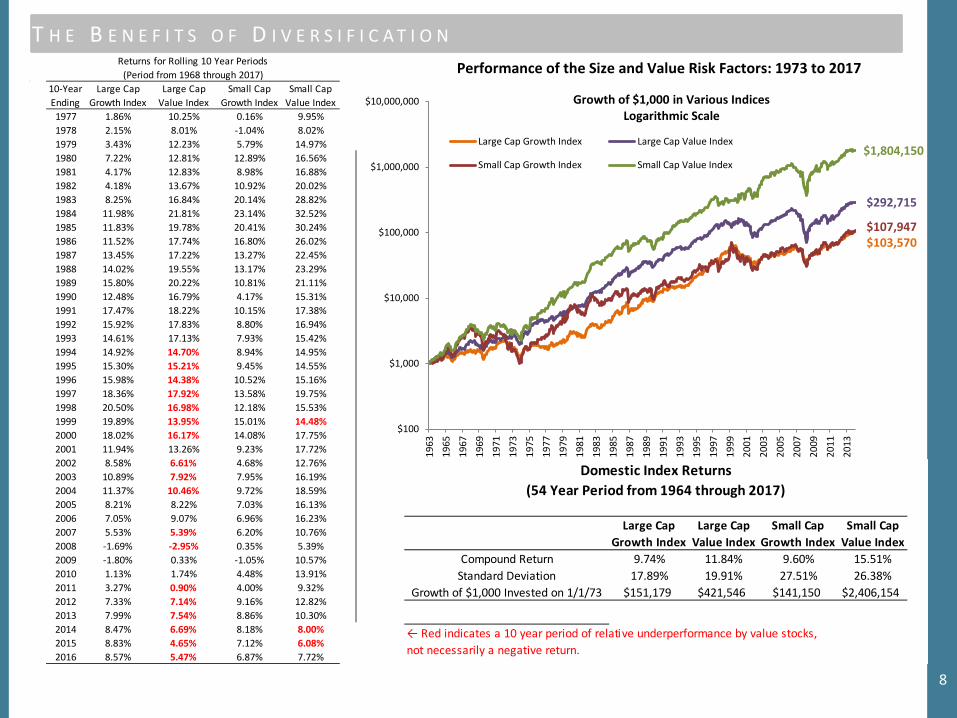
Growth of $1,000 in Various IndicesLogarithmic Scale
Large Cap Growth Index Large Cap Value Index
Small Cap Growth Index Small Cap Value Index
Performance of the Size and Value Risk Factors: 1973 to 201710-Year Ending
Large Cap Growth Index
Large Cap Value Index
Small Cap Growth Index
Small Cap Value Index
1977 1.86% 10.25% 0.16% 9.95%1978 2.15% 8.01% -1.04% 8.02%1979 3.43% 12.23% 5.79% 14.97%1980 7.22% 12.81% 12.89% 16.56%1981 4.17% 12.83% 8.98% 16.88%1982 4.18% 13.67% 10.92% 20.02%1983 8.25% 16.84% 20.14% 28.82%1984 11.98% 21.81% 23.14% 32.52%1985 11.83% 19.78% 20.41% 30.24%1986 11.52% 17.74% 16.80% 26.02%1987 13.45% 17.22% 13.27% 22.45%1988 14.02% 19.55% 13.17% 23.29%1989 15.80% 20.22% 10.81% 21.11%1990 12.48% 16.79% 4.17% 15.31%1991 17.47% 18.22% 10.15% 17.38%1992 15.92% 17.83% 8.80% 16.94%1993 14.61% 17.13% 7.93% 15.42%1994 14.92% 14.70% 8.94% 14.95%1995 15.30% 15.21% 9.45% 14.55%1996 15.98% 14.38% 10.52% 15.16%1997 18.36% 17.92% 13.58% 19.75%1998 20.50% 16.98% 12.18% 15.53%1999 19.89% 13.95% 15.01% 14.48%2000 18.02% 16.17% 14.08% 17.75%2001 11.94% 13.26% 9.23% 17.72%2002 8.58% 6.61% 4.68% 12.76%2003 10.89% 7.92% 7.95% 16.19%2004 11.37% 10.46% 9.72% 18.59%2005 8.21% 8.22% 7.03% 16.13%2006 7.05% 9.07% 6.96% 16.23%2007 5.53% 5.39% 6.20% 10.76%2008 -1.69% -2.95% 0.35% 5.39%2009 -1.80% 0.33% -1.05% 10.57%2010 1.13% 1.74% 4.48% 13.91%2011 3.27% 0.90% 4.00% 9.32%2012 7.33% 7.14% 9.16% 12.82%2013 7.99% 7.54% 8.86% 10.30%2014 8.47% 6.69% 8.18% 8.00%2015 8.83% 4.65% 7.12% 6.08%2016 8.57% 5.47% 6.87% 7.72%
Returns for Rolling 10 Year Periods(Period from 1968 through 2017)
Large Cap Growth Index
Large Cap Value Index
Small Cap Growth Index
Small Cap Value Index
Compound Return 9.74% 11.84% 9.60% 15.51%Standard Deviation 17.89% 19.91% 27.51% 26.38%
Growth of $1,000 Invested on 1/1/73 $151,179 $421,546 $141,150 $2,406,154
(54 Year Period from 1964 through 2017)Domestic Index Returns
← Red indicates a 10 year period of relative underperformance by value stocks, not necessarily a negative return.

T H E B E N E F I T S O F D I V E R S I F I C A T I O N
9
-50%
-40%
-30%
-20%
-10%
0%
10%
20%
30%
40%
The Market PremiumThe S&P 500 outperformed a risk-free investment (30-Day US T-Bill) by 5.12% per year from 1964 through 2017. In 38 of 54 of those years, an investment in the US stock market generated a higher rate of return than an invsetment in 30-Day US T-Bills.
T H E B E N E F I T S O F D I V E R S I F I C A T I O N
10
-40%
-30%
-20%
-10%
0%
10%
20%
30%
40%
50%
60%
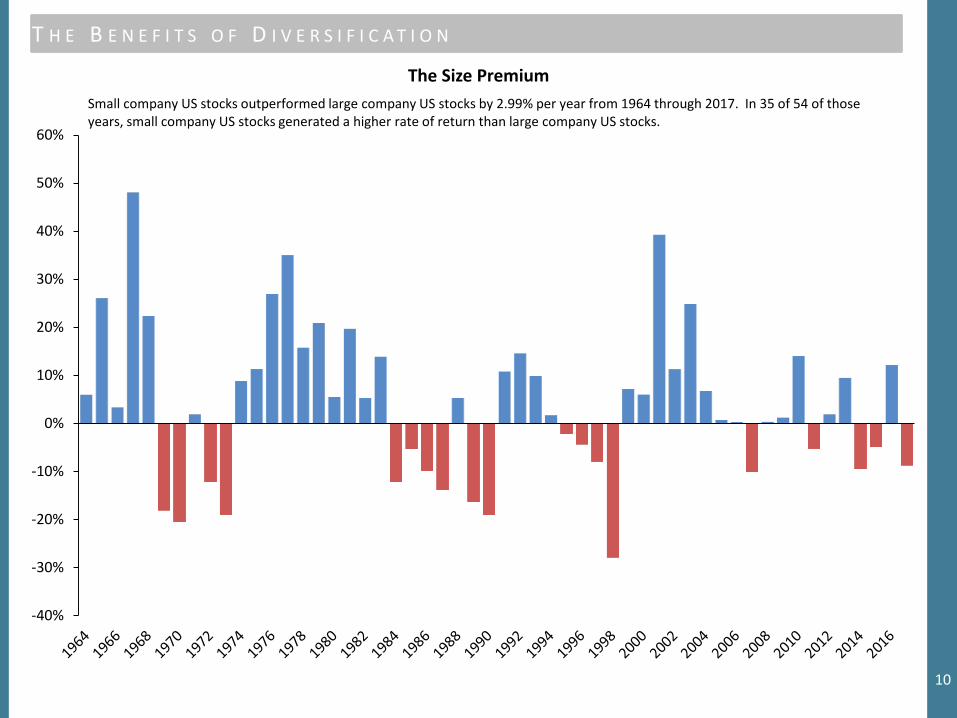
The Size PremiumSmall company US stocks outperformed large company US stocks by 2.99% per year from 1964 through 2017. In 35 of 54 of those years, small company US stocks generated a higher rate of return than large company US stocks.
T H E B E N E F I T S O F D I V E R S I F I C A T I O N
11
-30%
-20%
-10%
0%
10%
20%
30%
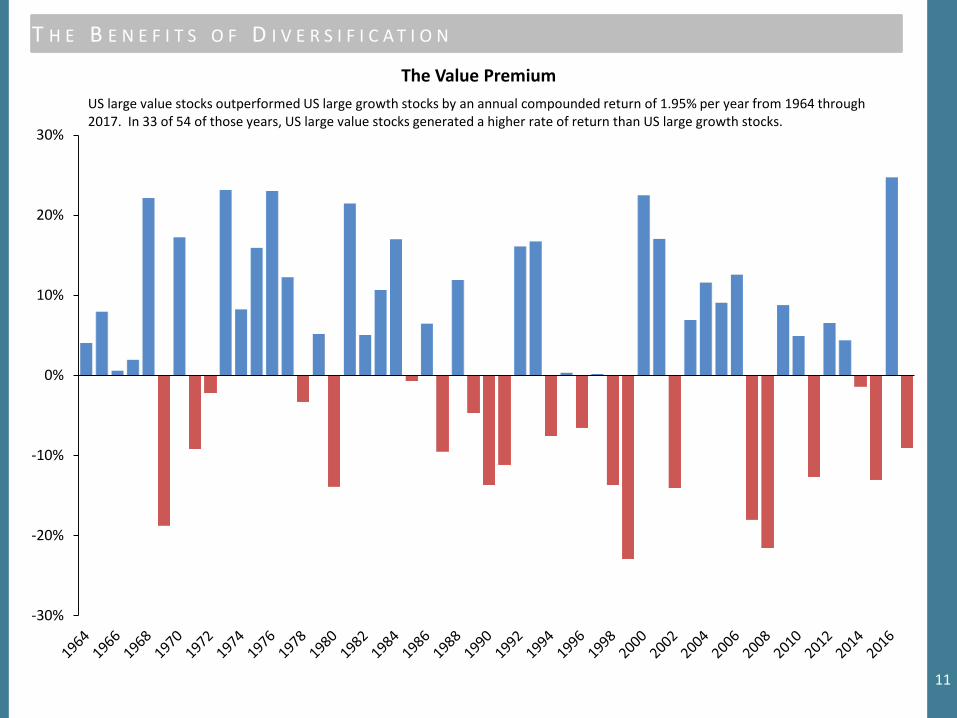
The Value PremiumUS large value stocks outperformed US large growth stocks by an annual compounded return of 1.95% per year from 1964 through 2017. In 33 of 54 of those years, US large value stocks generated a higher rate of return than US large growth stocks.
T H E B E N E F I T S O F D I V E R S I F I C A T I O N
12
-30%
-20%
-10%
0%
10%
20%
30%
40%
50%
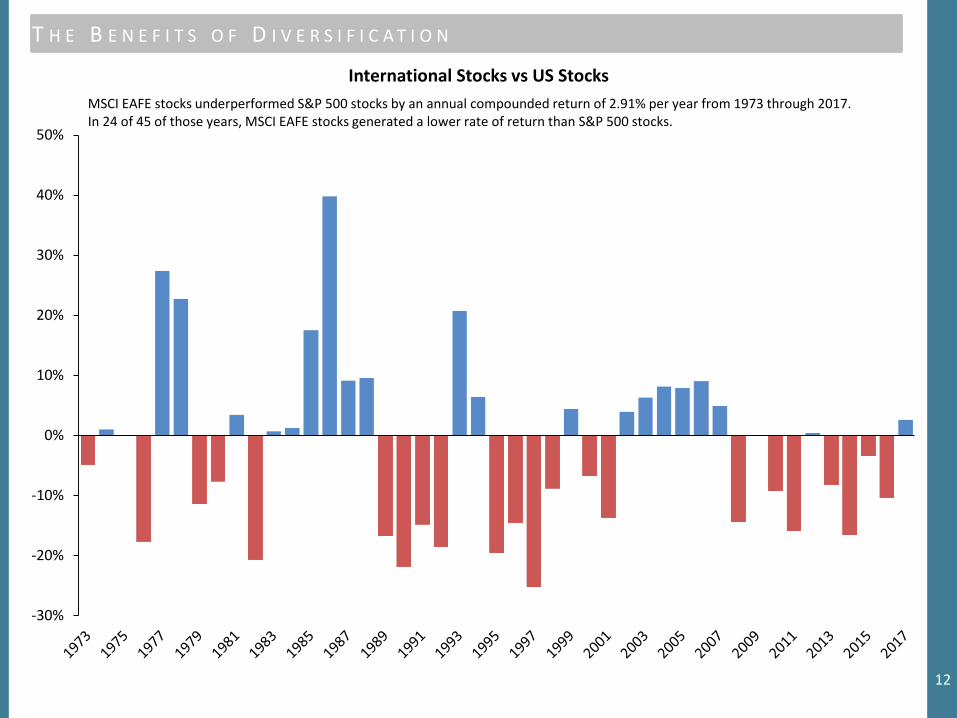
International Stocks vs US StocksMSCI EAFE stocks underperformed S&P 500 stocks by an annual compounded return of 2.91% per year from 1973 through 2017. In 24 of 45 of those years, MSCI EAFE stocks generated a lower rate of return than S&P 500 stocks.
T H E B E N E F I T S O F D I V E R S I F I C A T I O N
13
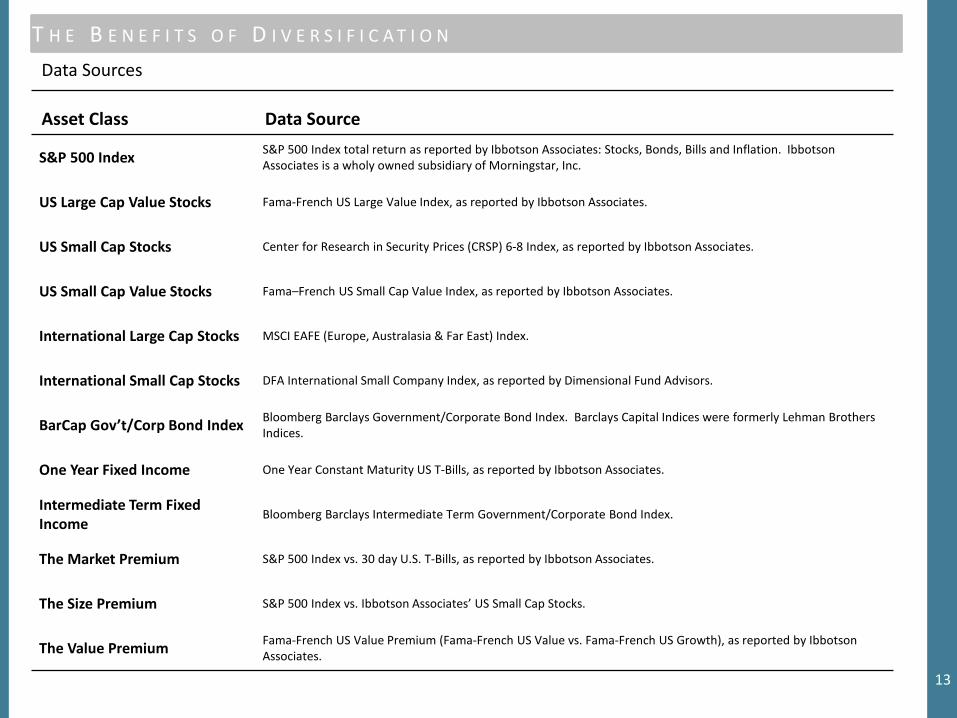
Data Sources
Asset Class Data Source
S&P 500 Index S&P 500 Index total return as reported by Ibbotson Associates: Stocks, Bonds, Bills and Inflation. Ibbotson Associates is a wholy owned subsidiary of Morningstar, Inc.
US Large Cap Value Stocks Fama-French US Large Value Index, as reported by Ibbotson Associates.
US Small Cap Stocks Center for Research in Security Prices (CRSP) 6-8 Index, as reported by Ibbotson Associates.
US Small Cap Value Stocks Fama–French US Small Cap Value Index, as reported by Ibbotson Associates.
International Large Cap Stocks MSCI EAFE (Europe, Australasia & Far East) Index.
International Small Cap Stocks DFA International Small Company Index, as reported by Dimensional Fund Advisors.
BarCap Gov’t/Corp Bond Index Bloomberg Barclays Government/Corporate Bond Index. Barclays Capital Indices were formerly Lehman Brothers Indices.
One Year Fixed Income One Year Constant Maturity US T-Bills, as reported by Ibbotson Associates.
Intermediate Term Fixed Income
Bloomberg Barclays Intermediate Term Government/Corporate Bond Index.
The Market Premium S&P 500 Index vs. 30 day U.S. T-Bills, as reported by Ibbotson Associates.
The Size Premium S&P 500 Index vs. Ibbotson Associates’ US Small Cap Stocks.
The Value Premium Fama-French US Value Premium (Fama-French US Value vs. Fama-French US Growth), as reported by Ibbotson Associates.