t-exploiting ace to create build-up estimates - castaneda.ppt
TRANSCRIPT

Exploiting ACE to Exploiting ACE to Exploiting ACE to Exploiting ACE to Exploiting ACE to Exploiting ACE to
Create BuildCreate Build--Up EstimatesUp Estimates
Exploiting ACE to Exploiting ACE to
Create BuildCreate Build--Up EstimatesUp Estimates
Joel CastanedaACEIT Users Conference, Santa Barbara, CAACEIT Users Conference, Santa Barbara, CA
January 2009
Tecolote Research, Inc.
Copyright © Tecolote Research, Inc. January 2009

AbstractAbstractAbstractAbstract
Bottom-up estimating is an extremely helpful technique in
cost estimating as it allows for highly detailed systemcost estimating as it allows for highly detailed system
estimates. While the process of getting raw data to support
the estimate can be like pulling teeth, using ACEIT to
determine your estimate doesn’t have to be. This
presentation describes the basic steps in constructing an
ACE model to support a build up estimate.
22/23/2009 Copyright © Tecolote Research, Inc. January 2009

ALL DATA EXHIBITED IN ALL DATA EXHIBITED IN THIS BRIEF ARE ENTIRELY THIS BRIEF ARE ENTIRELY
NOTIONAL AND DO NOT REPRESENT OR PORTRAY
REAL NASA MISSION REAL NASA MISSION OPERATIONS FACTS OR OPERATIONS FACTS OR
FIGURES.FIGURES.32/23/2009 Copyright © Tecolote Research, Inc. January 2009

OutlineOutlineOutlineOutline
What is bottom-up cost estimatingp gBenefits to using ACEITCost model structure layoutyCreating reportsApplying risk analysisRunning simplified what-if scenariosSummary
42/23/2009 Copyright © Tecolote Research, Inc. January 2009

What is bottomWhat is bottom--up cost estimating?up cost estimating?What is bottomWhat is bottom--up cost estimating?up cost estimating?
Sometime referred to as “grass roots” estimating, this methodology identifies and estimates each activity/part of a mission/product and then rolls up the individual results to produce a total project estimate (2004rolls up the individual results to produce a total project estimate (2004 NASA Cost Estimating handbook) Usually involves three steps:
Estimate the cost of each activity/part that composes the work package or productEstimate the cost of each activity/part that composes the work package or product (e.g. labor and material costs) Total the estimates at each activity or part levelCalculate an overall project estimate (this estimate is the cost rolled up to the top levelCalculate an overall project estimate (this estimate is the cost rolled up to the top level or the sum of all the items at the level below it)
Data is usually provided by those who are directly involved or very familiar with each particular work activity or part (i.e. technical personnel)familiar with each particular work activity or part (i.e. technical personnel)Drawback: costly (significant time and money required to create estimate), may not be readily responsive to “what-if” requirements, progress can be delayed waiting for accurate datadelayed waiting for accurate dataBenefit: intuitive, defensible, provides insight into major cost contributors, and leads to a fairly accurate estimate (caveat: if the work content is well understood)
52/23/2009 Copyright © Tecolote Research, Inc. January 2009
)

Benefits to using ACEITBenefits to using ACEITBenefits to using ACEITBenefits to using ACEITACEIT is a standard framework with built in functionality structureACEIT is flexible
Cost estimating inputs (e.g. manhours, labor rates, quantity) can be entered as constant data or phased over timeentered as constant data or phased over timeInputs can also be adjusted using industry approved algorithms and databases to model inflation, learning, and phasing
ACEIT integrates statistical and risk analysis to quantify uncertainty in estimatesC b d t t h t if i l i ft thCan be used to support what-if scenario analysis after the model has already been constructed
62/23/2009 Copyright © Tecolote Research, Inc. January 2009
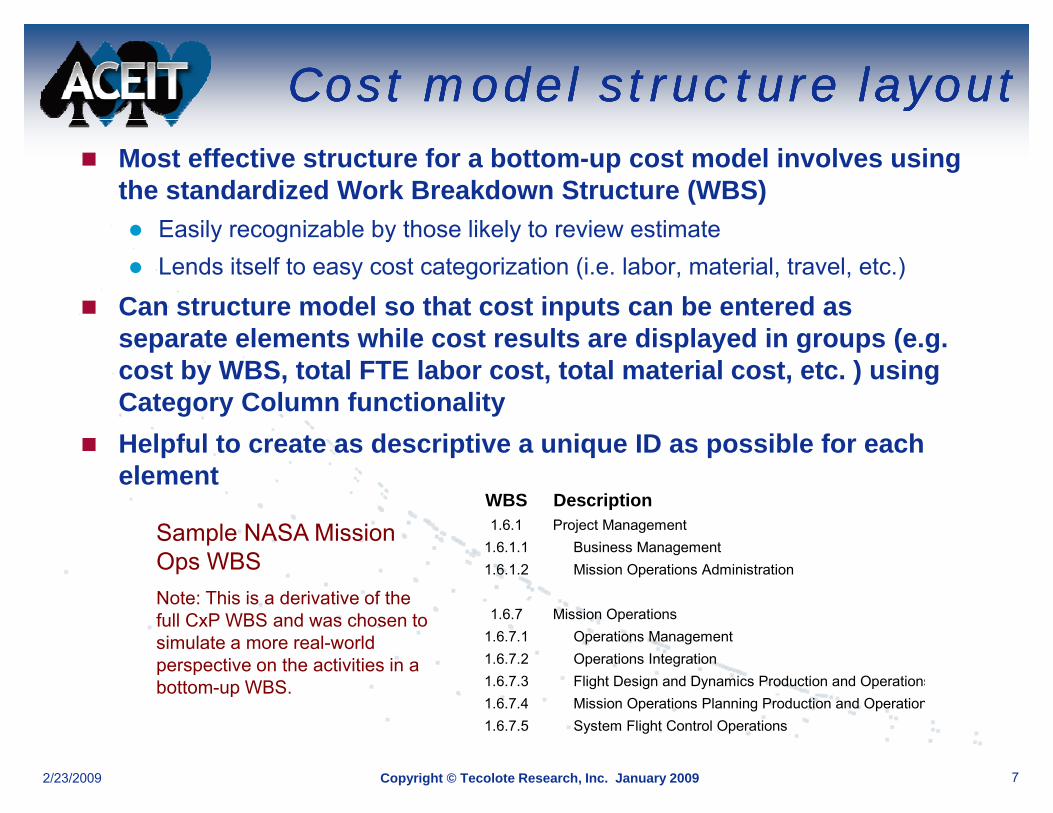
Cost model structure layoutCost model structure layoutCost model structure layoutCost model structure layoutMost effective structure for a bottom-up cost model involves using the standardized Work Breakdown Structure (WBS)
Easily recognizable by those likely to review estimateLends itself to easy cost categorization (i.e. labor, material, travel, etc.)
Can structure model so that cost inputs can be entered asCan structure model so that cost inputs can be entered as separate elements while cost results are displayed in groups (e.g. cost by WBS, total FTE labor cost, total material cost, etc. ) using Category Column functionalityCategory Column functionalityHelpful to create as descriptive a unique ID as possible for each element
WBS Description
Sample NASA Mission Ops WBS Note: This is a derivative of the
WBS Description1.6.1 Project Management
1.6.1.1 Business Management1.6.1.2 Mission Operations Administration
Note: This is a derivative of the full CxP WBS and was chosen to simulate a more real-world perspective on the activities in a bottom-up WBS.
1.6.7 Mission Operations1.6.7.1 Operations Management1.6.7.2 Operations Integration1.6.7.3 Flight Design and Dynamics Production and Operations
72/23/2009 Copyright © Tecolote Research, Inc. January 2009
p1.6.7.4 Mission Operations Planning Production and Operation1.6.7.5 System Flight Control Operations
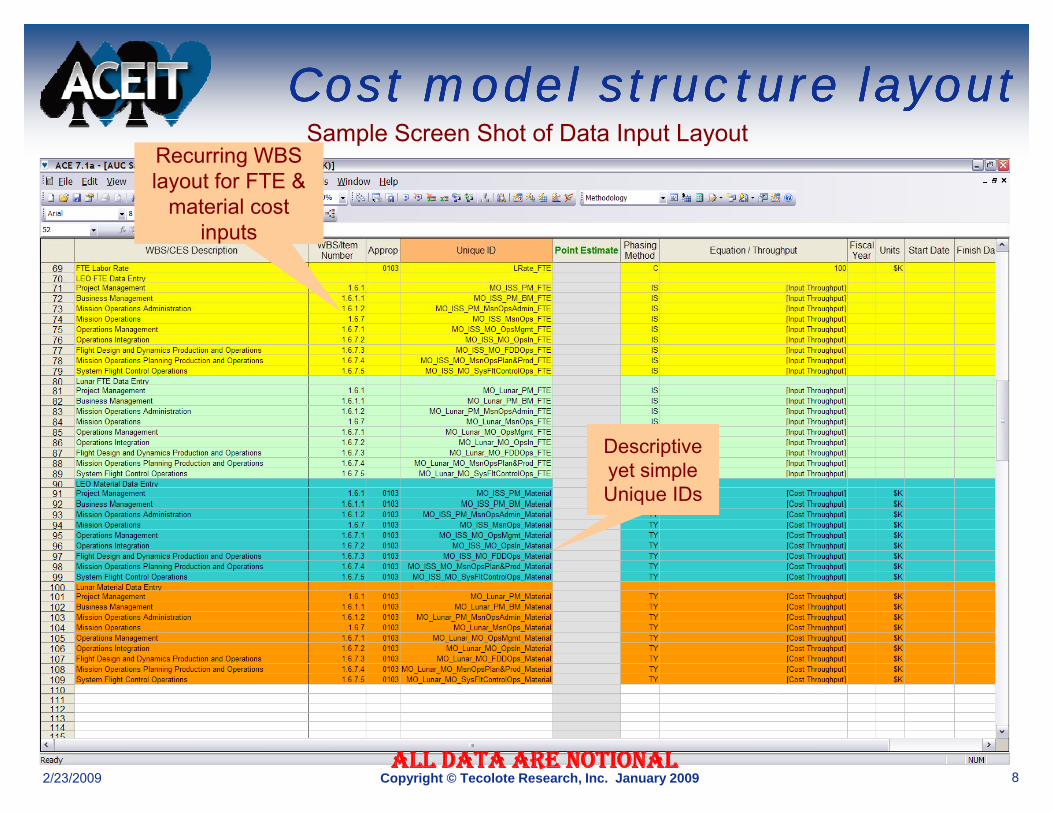
Cost model structure layoutCost model structure layoutCost model structure layoutCost model structure layoutSample Screen Shot of Data Input Layout
Recurring WBS layout for FTE &
material cost inputs
Descriptive yet simple Unique IDs
Descriptive yet simple Unique IDsqq
82/23/2009 Copyright © Tecolote Research, Inc. January 2009ALL DATA ARE NOTIONAL
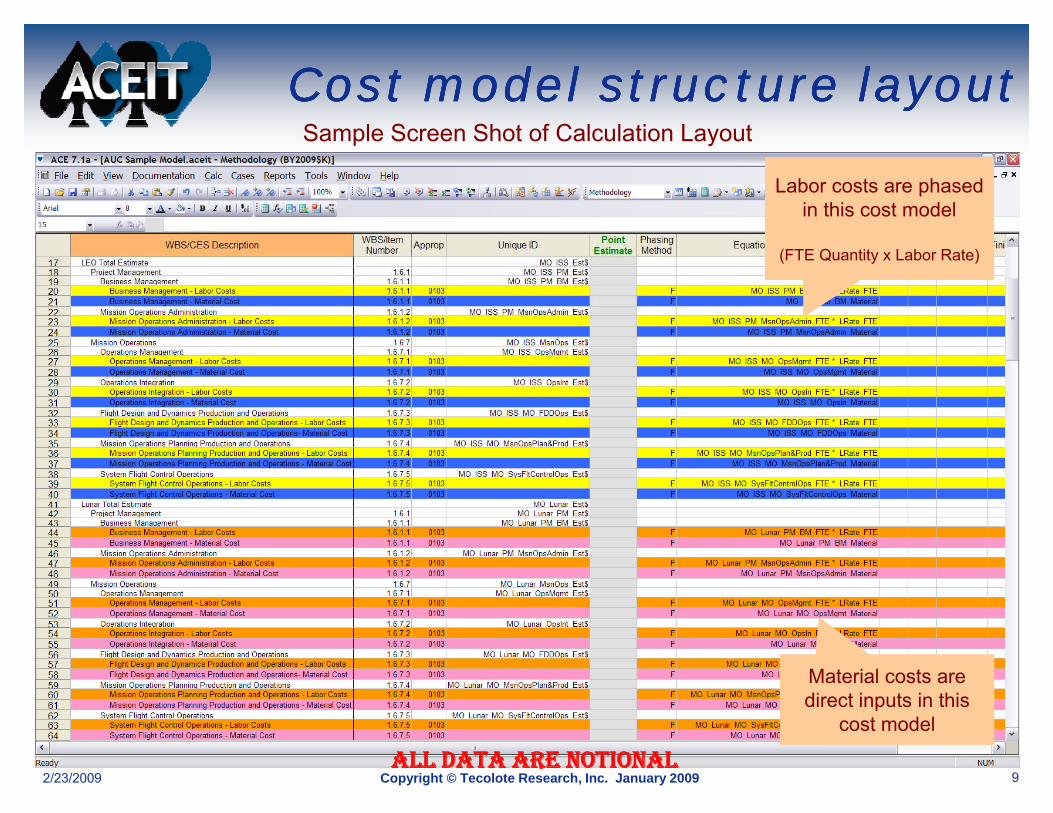
Cost model structure layoutCost model structure layoutCost model structure layoutCost model structure layoutSample Screen Shot of Calculation Layout
Labor costs are phased in this cost modelin this cost model
(FTE Quantity x Labor Rate)
Material costs are di t i t i thi
92/23/2009 Copyright © Tecolote Research, Inc. January 2009
direct inputs in this cost model
ALL DATA ARE NOTIONAL

S l S Sh t f C t C l L tCost model structure layoutCost model structure layoutCost model structure layoutCost model structure layout
Sample Screen Shot of Category Columns Layout
102/23/2009 Copyright © Tecolote Research, Inc. January 2009ALL DATA ARE NOTIONAL

Creating reportsCreating reportsCreating reportsCreating reportsAvailable PO$T reports that show results:
Time Phased ReportDisplays the totals and yearly base year or then year values for a single caseCommonly used for creating budget reports, viewing the estimate in a constant year, creating summary-level reports, and viewing risk-adjusted budget reports
Sand ChartA chart with multiple stacked areas or columns listed by fiscal yearUsed to view costs graphically by appropriation or any other category
Delta ReportLets you quickly find changes or differences between two or more casesOften used in highlighting the difference between different versions of the same
ti t i th lt f diff t ti t d d t i i thestimate, comparing the results from different estimates, and determining the high risk elements in the estimate
RI$K ChartCumulative distribution chart that is typically called S curve chartCumulative distribution chart that is typically called S-curve chartUsed to view the probabilities of a possible cost value
When setting up the report results view, data can be filtered or summarized via category columns
112/23/2009 Copyright © Tecolote Research, Inc. January 2009
summarized via category columns
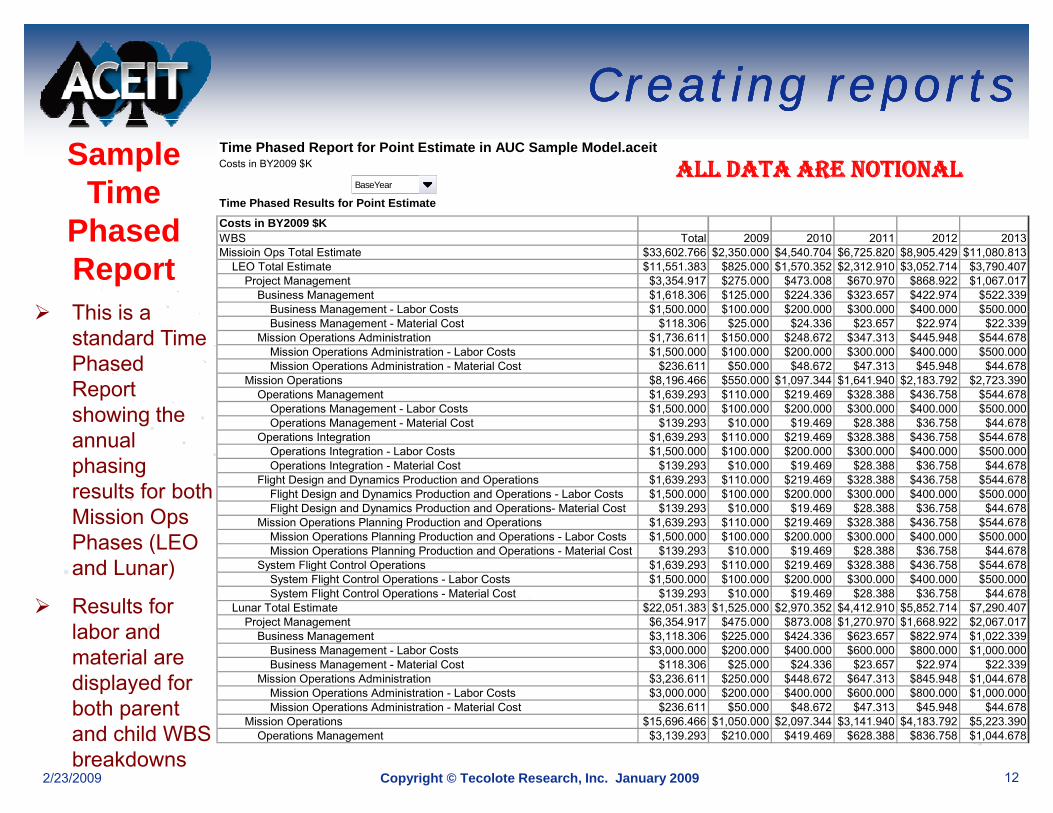
Creating reportsCreating reportsCreating reportsCreating reportsSample
Time Time Phased Report for Point Estimate in AUC Sample Model.aceitCosts in BY2009 $K
Time Phased Results for Point EstimateBaseYear
ALL DATA ARE NOTIONAL
This is a
Phased Report
Costs in BY2009 $KWBS Total 2009 2010 2011 2012 2013Missioin Ops Total Estimate $33,602.766 $2,350.000 $4,540.704 $6,725.820 $8,905.429 $11,080.813 LEO Total Estimate $11,551.383 $825.000 $1,570.352 $2,312.910 $3,052.714 $3,790.407 Project Management $3,354.917 $275.000 $473.008 $670.970 $868.922 $1,067.017 Business Management $1,618.306 $125.000 $224.336 $323.657 $422.974 $522.339
Business Management - Labor Costs $1 500 000 $100 000 $200 000 $300 000 $400 000 $500 000This is a standard Time Phased Report h i th
Business Management Labor Costs $1,500.000 $100.000 $200.000 $300.000 $400.000 $500.000 Business Management - Material Cost $118.306 $25.000 $24.336 $23.657 $22.974 $22.339 Mission Operations Administration $1,736.611 $150.000 $248.672 $347.313 $445.948 $544.678 Mission Operations Administration - Labor Costs $1,500.000 $100.000 $200.000 $300.000 $400.000 $500.000 Mission Operations Administration - Material Cost $236.611 $50.000 $48.672 $47.313 $45.948 $44.678 Mission Operations $8,196.466 $550.000 $1,097.344 $1,641.940 $2,183.792 $2,723.390 Operations Management $1,639.293 $110.000 $219.469 $328.388 $436.758 $544.678
Operations Management Labor Costs $1 500 000 $100 000 $200 000 $300 000 $400 000 $500 000showing the annual phasing results for both
Operations Management - Labor Costs $1,500.000 $100.000 $200.000 $300.000 $400.000 $500.000 Operations Management - Material Cost $139.293 $10.000 $19.469 $28.388 $36.758 $44.678 Operations Integration $1,639.293 $110.000 $219.469 $328.388 $436.758 $544.678 Operations Integration - Labor Costs $1,500.000 $100.000 $200.000 $300.000 $400.000 $500.000 Operations Integration - Material Cost $139.293 $10.000 $19.469 $28.388 $36.758 $44.678 Flight Design and Dynamics Production and Operations $1,639.293 $110.000 $219.469 $328.388 $436.758 $544.678 Flight Design and Dynamics Production and Operations - Labor Costs $1,500.000 $100.000 $200.000 $300.000 $400.000 $500.000
Mission Ops Phases (LEO and Lunar)
R lt f
Flight Design and Dynamics Production and Operations- Material Cost $139.293 $10.000 $19.469 $28.388 $36.758 $44.678 Mission Operations Planning Production and Operations $1,639.293 $110.000 $219.469 $328.388 $436.758 $544.678 Mission Operations Planning Production and Operations - Labor Costs $1,500.000 $100.000 $200.000 $300.000 $400.000 $500.000 Mission Operations Planning Production and Operations - Material Cost $139.293 $10.000 $19.469 $28.388 $36.758 $44.678 System Flight Control Operations $1,639.293 $110.000 $219.469 $328.388 $436.758 $544.678 System Flight Control Operations - Labor Costs $1,500.000 $100.000 $200.000 $300.000 $400.000 $500.000 System Flight Control Operations - Material Cost $139.293 $10.000 $19.469 $28.388 $36.758 $44.678
Results for labor and material are displayed for
y g p $ $ $ $ $ $ Lunar Total Estimate $22,051.383 $1,525.000 $2,970.352 $4,412.910 $5,852.714 $7,290.407 Project Management $6,354.917 $475.000 $873.008 $1,270.970 $1,668.922 $2,067.017 Business Management $3,118.306 $225.000 $424.336 $623.657 $822.974 $1,022.339 Business Management - Labor Costs $3,000.000 $200.000 $400.000 $600.000 $800.000 $1,000.000 Business Management - Material Cost $118.306 $25.000 $24.336 $23.657 $22.974 $22.339 Mission Operations Administration $3,236.611 $250.000 $448.672 $647.313 $845.948 $1,044.678
Mission Operations Administration - Labor Costs $3 000 000 $200 000 $400 000 $600 000 $800 000 $1 000 000
122/23/2009 Copyright © Tecolote Research, Inc. January 2009
yboth parent and child WBS breakdowns
Mission Operations Administration - Labor Costs $3,000.000 $200.000 $400.000 $600.000 $800.000 $1,000.000 Mission Operations Administration - Material Cost $236.611 $50.000 $48.672 $47.313 $45.948 $44.678 Mission Operations $15,696.466 $1,050.000 $2,097.344 $3,141.940 $4,183.792 $5,223.390 Operations Management $3,139.293 $210.000 $419.469 $628.388 $836.758 $1,044.678

Creating reportsCreating reportsCreating reportsCreating reportsTime Phased Report for Point Estimate in AUC Sample Model.aceitCosts in BY2009 $K
Time Phased Results for Point EstimateCosts in BY2009 $K
BaseYearSample Time Phased
ALL DATA ARE NOTIONAL
Costs in BY2009 $KWBS, Filtered by Cost Category Cost Category Total 2009 2010 2011 2012 2013Missioin Ops Total Estimate Material $2,102.766 $250.000 $340.704 $425.820 $505.429 $580.813 LEO Total Estimate Material $1,051.383 $125.000 $170.352 $212.910 $252.714 $290.407 Project Management Material $354.917 $75.000 $73.008 $70.970 $68.922 $67.017 Business Management Material $118.306 $25.000 $24.336 $23.657 $22.974 $22.339 Business Management - Material Cost Material $118.306 $25.000 $24.336 $23.657 $22.974 $22.339
Phased Report
us ess a age e t ate a Cost ate a $ 8 306 $ 5 000 $ 336 $ 3 65 $ 9 $ 339 Mission Operations Administration Material $236.611 $50.000 $48.672 $47.313 $45.948 $44.678 Mission Operations Administration - Material Cost Material $236.611 $50.000 $48.672 $47.313 $45.948 $44.678 Mission Operations Material $696.466 $50.000 $97.344 $141.940 $183.792 $223.390 Operations Management Material $139.293 $10.000 $19.469 $28.388 $36.758 $44.678 Operations Management - Material Cost Material $139.293 $10.000 $19.469 $28.388 $36.758 $44.678 Operations Integration Material $139.293 $10.000 $19.469 $28.388 $36.758 $44.678
This is a filtered Time Phased Report showing the annual Operations Integration - Material Cost Material $139.293 $10.000 $19.469 $28.388 $36.758 $44.678
Flight Design and Dynamics Production and Operations Material $139.293 $10.000 $19.469 $28.388 $36.758 $44.678 Flight Design and Dynamics Production and Operatio Material $139.293 $10.000 $19.469 $28.388 $36.758 $44.678 Mission Operations Planning Production and OperationsMaterial $139.293 $10.000 $19.469 $28.388 $36.758 $44.678 Mission Operations Planning Production and OperatioMaterial $139.293 $10.000 $19.469 $28.388 $36.758 $44.678 System Flight Control Operations Material $139.293 $10.000 $19.469 $28.388 $36.758 $44.678
System Flight Control Operations Material Cost Material $139 293 $10 000 $19 469 $28 388 $36 758 $44 678
the annual phasing results for both Mission Ops Phases (LEO d System Flight Control Operations - Material Cost Material $139.293 $10.000 $19.469 $28.388 $36.758 $44.678
Lunar Total Estimate Material $1,051.383 $125.000 $170.352 $212.910 $252.714 $290.407 Project Management Material $354.917 $75.000 $73.008 $70.970 $68.922 $67.017 Business Management Material $118.306 $25.000 $24.336 $23.657 $22.974 $22.339 Business Management - Material Cost Material $118.306 $25.000 $24.336 $23.657 $22.974 $22.339 Mission Operations Administration Material $236.611 $50.000 $48.672 $47.313 $45.948 $44.678 Mission Operations Administration - Material Cost Material $236.611 $50.000 $48.672 $47.313 $45.948 $44.678
(LEO and Lunar)
Using category columns only p $ $ $ $ $ $
Mission Operations Material $696.466 $50.000 $97.344 $141.940 $183.792 $223.390 Operations Management Material $139.293 $10.000 $19.469 $28.388 $36.758 $44.678 Operations Management - Material Cost Material $139.293 $10.000 $19.469 $28.388 $36.758 $44.678 Operations Integration Material $139.293 $10.000 $19.469 $28.388 $36.758 $44.678 Operations Integration - Material Cost Material $139.293 $10.000 $19.469 $28.388 $36.758 $44.678 Flight Design and Dynamics Production and Operations Material $139.293 $10.000 $19.469 $28.388 $36.758 $44.678
columns, only results for material costs are displayed f b th t Flight Design and Dynamics Production and Operatio Material $139.293 $10.000 $19.469 $28.388 $36.758 $44.678
Mission Operations Planning Production and OperationsMaterial $139.293 $10.000 $19.469 $28.388 $36.758 $44.678 Mission Operations Planning Production and OperatioMaterial $139.293 $10.000 $19.469 $28.388 $36.758 $44.678 System Flight Control Operations Material $139.293 $10.000 $19.469 $28.388 $36.758 $44.678 System Flight Control Operations - Material Cost Material $139.293 $10.000 $19.469 $28.388 $36.758 $44.678
132/23/2009 Copyright © Tecolote Research, Inc. January 2009
for both parent and child WBS breakdowns

Creating reportsCreating reportsCreating reportsCreating reportsSand Chart for Point Estimate in AUC Sample Model.aceitCosts in BY2009 $K
Sand Chart
SampleALL DATA ARE NOTIONAL
Point EstimateSecond Level of Visibility for Missioin Ops Total Estimate
WBS, Filtered by CxP Phase
$12,000.000This is a filtered
Sample Sand Chart
$8,000.000
$10,000.000
,This is a filtered Sand Chart Report showing the annual h i lt f
$4,000.000
$6,000.000
BY2
009
$K
Lunar Total EstimateLEO Total Estimate
phasing results for both Mission Ops Phases (LEO and Lunar)
$0.000
$2,000.000
2009 2010 2011 2012 2013
Using category columns, results are summarized b C P Ph
Time Phased Results for Point Estimate
Costs in BY2009 $K
Missioin Ops Total Estimate
BaseYear
by CxP Phases
142/23/2009 Copyright © Tecolote Research, Inc. January 2009
Costs in BY2009 $KWBS, Filtered by CxP Phase CxP Phase 2009 2010 2011 2012 2013Missioin Ops Total Estimate $2,350.000 $4,540.704 $6,725.820 $8,905.429 $11,080.813 LEO Total Estimate LEO $825.000 $1,570.352 $2,312.910 $3,052.714 $3,790.407 Lunar Total Estimate Lunar $1,525.000 $2,970.352 $4,412.910 $5,852.714 $7,290.407

Applying risk analysisApplying risk analysisApplying risk analysisApplying risk analysisTo conduct risk analysis, you need uncertainty inputs for your cost elements
Probability distribution (e.g. normal, lognormal, triangle, etc.) Bounds
Possible low / high values for element (e.g. 85% / 120% of point estimate with distribution percentile at the 10th or 85th percentileGeneral distribution characteristics (e.g. mean, standard deviation)
Uncertainty inputs should represent defendable values for the cost input
Based on historical values Based on subject matter expert (SME) opinionsBased on subject matter expert (SME) opinions
Uncertainty entered on input drivers of the estimateLabor ratesHeadcountsMaterial and labor costs
152/23/2009 Copyright © Tecolote Research, Inc. January 2009

Applying risk analysisApplying risk analysisApplying risk analysisApplying risk analysisS S SSample Screen Shot Risk Analysis Layout
Risk is notRisk is not applied at the
calculation level
Risk is applied to all cost inputs
162/23/2009 Copyright © Tecolote Research, Inc. January 2009ALL DATA ARE NOTIONAL

Applying risk analysisApplying risk analysisApplying risk analysisApplying risk analysisCorrelations between values should be addressed if they are not functionally related
When the values of two variables depend on each other, you should correlate them to increase the accuracy of your risk analysis resultsTwo behaviors of correlation:
Positive – Indicates that two assumptions increase or decrease togetherNegative – Indicates that an increase in one assumption results in a decrease in the other assumption
Cost elements that are often correlated:Labor rates among similar job positionsMaterial costs among similar parts in a product
In bottom-up cost estimating, it is always a best practice to apply correlation for a better risk distribution at the very top level
172/23/2009 Copyright © Tecolote Research, Inc. January 2009

Applying risk analysisApplying risk analysisApplying risk analysisApplying risk analysisSample Screen Shot of Risk Analysis Correlation Layout
Risk correlation matrix for allRisk correlation matrix for all material inputs in the lunar
mission ops WBS level (1.6.7)
182/23/2009 Copyright © Tecolote Research, Inc. January 2009ALL DATA ARE NOTIONAL
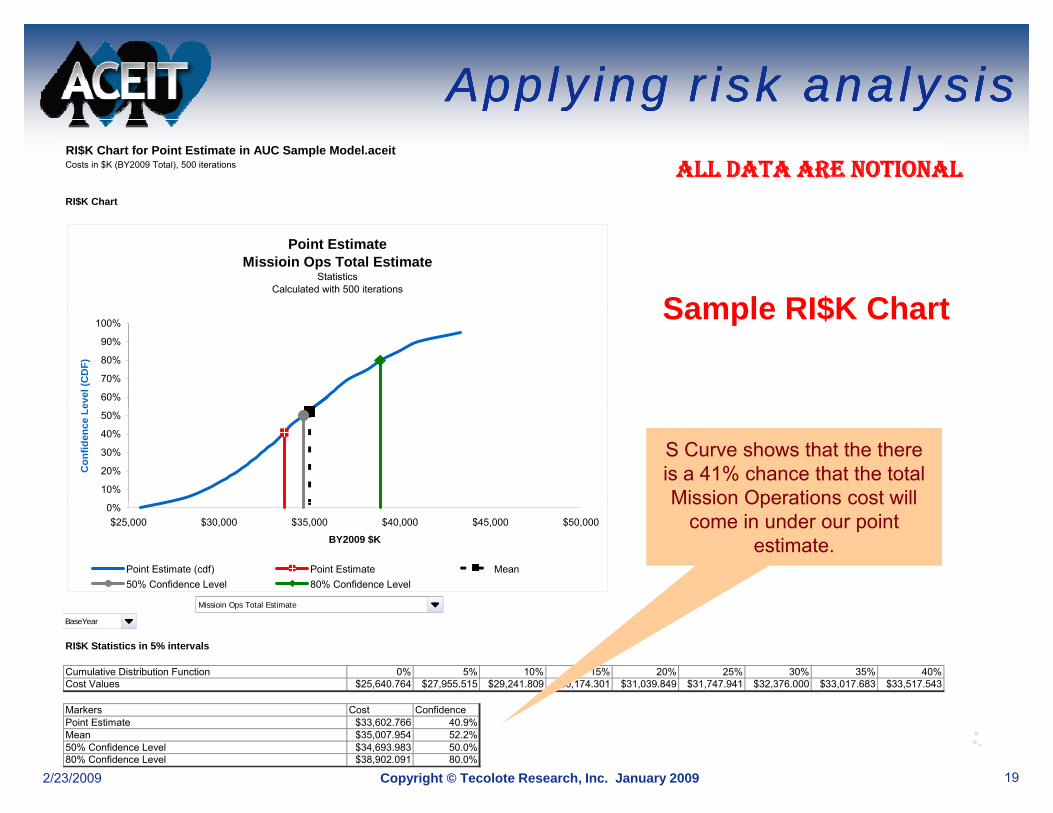
Applying risk analysisApplying risk analysisApplying risk analysisApplying risk analysisRI$K Chart for Point Estimate in AUC Sample Model.aceitCosts in $K (BY2009 Total), 500 iterations
RI$K Chart
ALL DATA ARE NOTIONAL
Point EstimateMissioin Ops Total Estimate
StatisticsCalculated with 500 iterations
Sample RI$K Chart
60%
70%
80%
90%
100%
evel
(CD
F)
Sample RI$K Chart
10%
20%
30%
40%
50%
Con
fiden
ce L
e
S Curve shows that the there is a 41% chance that the total Mission Operations cost will
0%$25,000 $30,000 $35,000 $40,000 $45,000 $50,000
BY2009 $K
Point Estimate (cdf) Point Estimate Mean50% Confidence Level 80% Confidence Level
Mission Operations cost will come in under our point
estimate.
RI$K Statistics in 5% intervals
Cumulative Distribution Function 0% 5% 10% 15% 20% 25% 30% 35% 40%Cost Values $25,640.764 $27,955.515 $29,241.809 $30,174.301 $31,039.849 $31,747.941 $32,376.000 $33,017.683 $33,517.543
Missioin Ops Total Estimate
BaseYear
192/23/2009 Copyright © Tecolote Research, Inc. January 2009
Markers Cost ConfidencePoint Estimate $33,602.766 40.9%Mean $35,007.954 52.2%50% Confidence Level $34,693.983 50.0%80% Confidence Level $38,902.091 80.0%

Running simplified whatRunning simplified what--if scenariosif scenariosRunning simplified whatRunning simplified what--if scenariosif scenarios
ACEIT can help non-cost modelers run what-if scenarios using your existing cost model
Create a what-if input worksheet where variable cost elements (e.g. labor rate, FTE headcount, material cost etc.) can be organized and modifiedCreate a PO$T case in a new worksheet that is linked to existing bottom-up ACE cost model
PO$T will add a “Calculate” macro button on top of worksheetPO$T will add a Calculate macro button on top of worksheetThis worksheet will look like a simplified copy of your ACE model
Link input cells in PO$T case worksheet to corresponding cells in what –if input worksheetCreate required PO$T reports using this caseAdjust variable cost elements per what if scenario guidanceAdjust variable cost elements per what-if scenario guidanceHit “Calculate” buttonUse PO$T to update reportsp p
202/23/2009 Copyright © Tecolote Research, Inc. January 2009

Running simplified whatRunning simplified what--if scenariosif scenariosRunning simplified whatRunning simplified what--if scenariosif scenariosSample Screen Shot of Input WorksheetSample Screen Shot of Input Worksheet
Enter values for what-if scenario here
212/23/2009 Copyright © Tecolote Research, Inc. January 2009ALL DATA ARE NOTIONAL
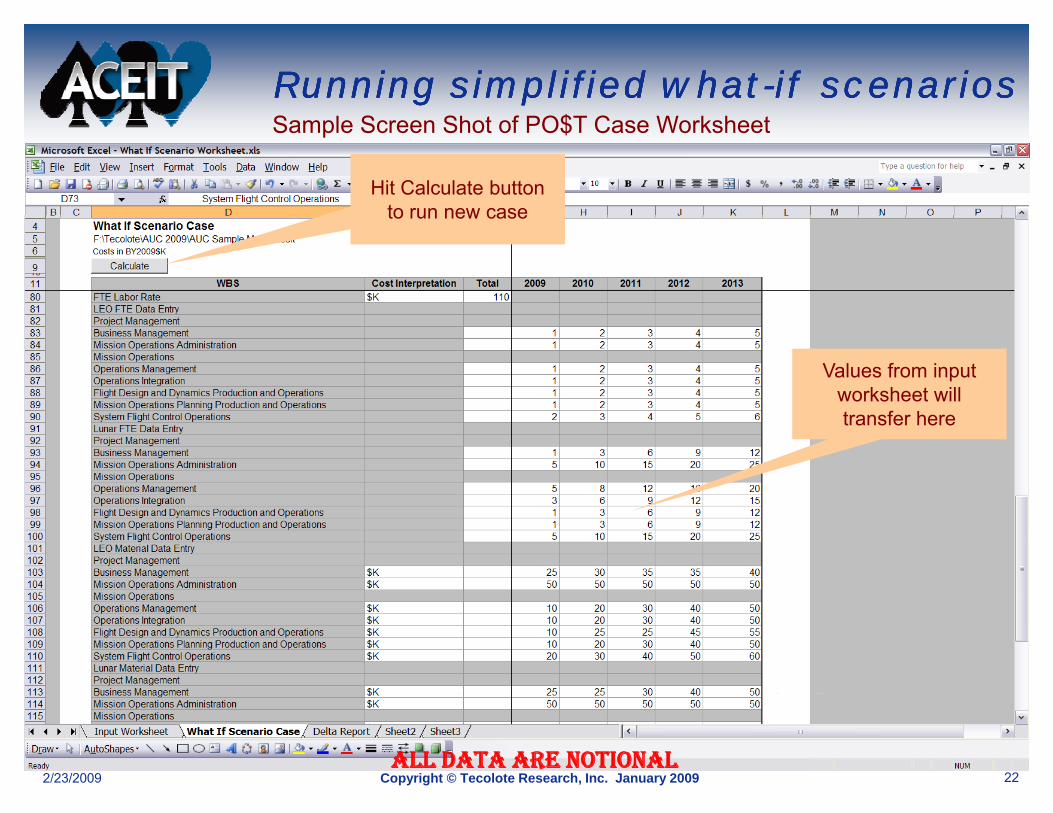
Running simplified whatRunning simplified what--if scenariosif scenariosRunning simplified whatRunning simplified what--if scenariosif scenariosS l S Sh t f PO$T C W k h tSample Screen Shot of PO$T Case Worksheet
Hit Calculate button to run new caseto run new case
Values from input worksheet will transfer here
222/23/2009 Copyright © Tecolote Research, Inc. January 2009ALL DATA ARE NOTIONAL

Running simplified whatRunning simplified what--if scenariosif scenariosRunning simplified whatRunning simplified what--if scenariosif scenarios
Sample Delta Report
Delta Report for AUC Sample Model.aceitCosts in BY2009 $K
Delta Comparison
Costs in BY2009 $K
BaseYearALL DATA ARE NOTIONAL
This is a Delta Report showing the difference between the Point Estimate
Costs in BY2009 $KWBS Point Estimate What If Scenario Case Delta (Δ) Percent Δ ThresholdMissioin Ops Total Estimate $33,602.766 $80,380.000 $46,777.234 139.21% High LEO Total Estimate $11,551.383 $40,495.000 $28,943.617 250.56% High Project Management $3,354.917 $12,475.000 $9,120.083 271.84% High Business Management $1,618.306 $3,745.000 $2,126.694 131.41% High Business Management - Labor Costs $1,500.000 $3,520.000 $2,020.000 134.67% High Business Management - Material Cost $118.306 $225.000 $106.694 90.19% High
Mi i O ti Ad i i t ti $1 736 611 $8 730 000 $6 993 389 402 70% Hi hthe Point Estimate (baseline) results and the new What If Scenario at the total
Mission Operations Administration $1,736.611 $8,730.000 $6,993.389 402.70% High Mission Operations Administration - Labor Costs $1,500.000 $8,470.000 $6,970.000 464.67% High Mission Operations Administration - Material Cost $236.611 $260.000 $23.389 9.88% Medium Mission Operations $8,196.466 $28,020.000 $19,823.534 241.85% High Operations Management $1,639.293 $6,935.000 $5,295.707 323.05% High Operations Management - Labor Costs $1,500.000 $6,820.000 $5,320.000 354.67% High Operations Management - Material Cost $139.293 $115.000 ($24.293) (17.44%) High Operations Integration $1,639.293 $5,210.000 $3,570.707 217.82% High
levels
Report will categorize the deltas into high
Operations Integration - Labor Costs $1,500.000 $5,060.000 $3,560.000 237.33% High Operations Integration - Material Cost $139.293 $150.000 $10.707 7.69% Medium Flight Design and Dynamics Production and Operations $1,639.293 $3,670.000 $2,030.707 123.88% High Flight Design and Dynamics Production and Operations - Labor Costs $1,500.000 $3,520.000 $2,020.000 134.67% High Flight Design and Dynamics Production and Operations- Material Cost $139.293 $150.000 $10.707 7.69% Medium Mission Operations Planning Production and Operations $1,639.293 $3,695.000 $2,055.707 125.40% High Mission Operations Planning Production and Operations - Labor Costs $1,500.000 $3,520.000 $2,020.000 134.67% High Mission Operations Planning Production and Operations - Material Cost $139.293 $175.000 $35.707 25.63% Highdeltas into high,
medium, or low percentage differences
g g System Flight Control Operations $1,639.293 $8,510.000 $6,870.707 419.13% High System Flight Control Operations - Labor Costs $1,500.000 $8,360.000 $6,860.000 457.33% High System Flight Control Operations - Material Cost $139.293 $150.000 $10.707 7.69% Medium Lunar Total Estimate $22,051.383 $39,885.000 $17,833.617 80.87% High Project Management $6,354.917 $12,080.000 $5,725.083 90.09% High Business Management $3,118.306 $3,580.000 $461.694 14.81% High Business Management - Labor Costs $3,000.000 $3,410.000 $410.000 13.67% High Business Management - Material Cost $118.306 $170.000 $51.694 43.70% High
Percentage differences will be highlighted in red, orange or tan for
Business Management Material Cost $118.306 $170.000 $51.694 43.70% High Mission Operations Administration $3,236.611 $8,500.000 $5,263.389 162.62% High Mission Operations Administration - Labor Costs $3,000.000 $8,250.000 $5,250.000 175.00% High Mission Operations Administration - Material Cost $236.611 $250.000 $13.389 5.66% Medium Mission Operations $15,696.466 $27,805.000 $12,108.534 77.14% High Operations Management $3,139.293 $6,925.000 $3,785.707 120.59% High Operations Management - Labor Costs $3,000.000 $6,710.000 $3,710.000 123.67% High Operations Management - Material Cost $139.293 $215.000 $75.707 54.35% High
Operations Integration $3 139 293 $5 165 000 $2 025 707 64 53% High
232/23/2009 Copyright © Tecolote Research, Inc. January 2009
orange, or tan for high, medium, or low, respectively
Operations Integration $3,139.293 $5,165.000 $2,025.707 64.53% High Operations Integration - Labor Costs $3,000.000 $4,950.000 $1,950.000 65.00% High Operations Integration - Material Cost $139.293 $215.000 $75.707 54.35% High Flight Design and Dynamics Production and Operations $3,139.293 $3,625.000 $485.707 15.47% High Flight Design and Dynamics Production and Operations - Labor Costs $3,000.000 $3,410.000 $410.000 13.67% High
SummarySummarySummarySummary
ACEIT is a very flexible cost estimating tool that can handle ll ki d f b tt t ti ti it tiall kinds of bottom-up cost estimating situations
ACEIT suite integrates statistical and risk analysis tools to quantify uncertainty in estimatesquantify uncertainty in estimatesCan be used by non cost modelers to support what-if scenario analysis after the model has already been constructed
242/23/2009 Copyright © Tecolote Research, Inc. January 2009