t h e e c o n o m i c s o f p o v e r t y h e e c o n o m i c s o f p o v e r t y t h e e c o n o m...
TRANSCRIPT
T h e E c o n o m i c s o f P o v e r t y :H o w I n v e s t m e n t s t o E l i m i n a t e P o v e r t y B e n e f i t A l l A m e r i c a n s
D e v e l o p e d f o r E n t e r g y b y
J e r r o l d O p p e n h e i m
T h e o M a c G r e g o r
Jerrold Oppenheim and Theo MacGregor are the co-authors
of a comprehensive examination of the benefits of early childhood
education. That document has been used extensively to inform policy
makers about the needs and values of investments made in Pre-K and
other early childhood programs.
For 2006, Entergy again turned to Oppenheim and MacGregor for
the answer to another critical question—that of “What is the business
case for investing in low-income programs?”
A graduate of Harvard College and Boston College Law School
(Juris Doctor), Jerrold Oppenheim directed energy and utility
litigation for the Attorneys General of New York and Massachusetts.
In his 35+ year career, he has played a key role in the development
of regulatory policy in US states as legal counsel and advisor for state
governments, consumer organizations, low-income advocates, labor
unions, environmental interests, industrial customers, and utilities.
Theo MacGregor founded MacGregor Energy Consultancy in
1998, specializing in electric industry restructuring issues in general,
consumer, low-income, and energy efficiency issues in particular. Prior
to founding her own firm, Ms. MacGregor spent more than ten years
with the Electric Power Division of the Massachusetts Department of
Telecommunications and Energy (DTE) (the state’s utility regulator),
most recently as acting director. Ms. MacGregor holds an MBA from
Simmons School of Management in Boston, Massachusetts.
Together, they are co-authors, with Greg Palast, of Democracy
And Regulation, winner of the American Civil Liberties Union Upton
Sinclair Freedom of Expression Award. Much of their recent work is
posted on www.D e m o c r a c y A n d R e g u l a t i o n . c o m .
© M M V I E n t e r g y C o r p o r a t i o n , A l l R i g h t s R e s e r v e d .
T h e E c o n o m i c s o f P o v e r t y : H o w I n v e s t m e n t s t o E l i m i n a t e P o v e r t y B e n e f i t A l l A m e r i c a n s l J e r r o l d O p p e n h e i m a n d T h e o M a c G r e g o r
A b o u t t h e A u t h o r s
T h e E c o n o m i c s o f P o v e r t y :H o w I n v e s t m e n t s t o E l i m i n a t e P o v e r t y B e n e f i t A l l A m e r i c a n s
C o n t e n t s
I N T R O D U C T I O N
P O V E R T Y I S E X P E N S I V E 2
Cr i m e
He a l t h c a re
U n e m p l oy m e nt a n d U n d e re m p l oy m e nt
Cu r re nt Ant i - Pove r t y I nve s t m e nt s
Ho u s i n g a n d Ho m e l e s s n e s s
H u n g e r
Ed u c at i o n
Ut i l i t i e s
O t h e r Ant i - Pove r t y I nve s t m e nt s
C O N C LU S I O N 1 9
A P P E N D I X A : I N V E S T M E N T R E Q U I R E D 2 2
A P P E N D I X B : AV O I D A B L E C O S T S O F P O V E R T Y 2 5
1
2
2
4
8
11
11
13
14
16
17
17
20
23
Th
e
Ec
on
om
ic
s
of
P
ov
er
ty
T h e E c o n o m i c s o f P o v e r t y : H o w I n v e s t m e n t s t o E l i m i n a t e P o v e r t y B e n e f i t A l l A m e r i c a n s l J e r r o l d O p p e n h e i m a n d T h e o M a c G r e g o r T h e E c o n o m i c s o f P o v e r t y : H o w I n v e s t m e n t s t o E l i m i n a t e P o v e r t y B e n e f i t A l l A m e r i c a n s l J e r r o l d O p p e n h e i m a n d T h e o M a c G r e g o r T h e E c o n o m i c s o f P o v e r t y : H o w I n v e s t m e n t s t o E l i m i n a t e P o v e r t y B e n e f i t A l l A m e r i c a n s l J e r r o l d O p p e n h e i m a n d T h e o M a c G r e g o r
I N T R O D U C T I O N Investing in the eradication of poverty in America would increase the resources of each American
household by an average of more than $18,000 a year, equivalent to a wage increase of more than 30 percent.
Investments in the eradication of poverty would:
n substantially reduce losses due to crime, a large fraction of which is caused by poverty;
n increase incomes to people now unemployed or underemployed, which would result in
new expenditures (including income and sales taxes) circulating through the economy
and becoming income to others;
n reduce the cost of health care, including the cost we all share of taking care of people
who cannot afford health insurance or medicines;
n virtually eliminate the need for societal supports to ameliorate the most extreme
manifestations of poverty.1
The savings from eradication of poverty are so substantial that it would actually be cost-effective to close
the poverty gap with cash grants. Making cash grants to every low-income household to bring all incomes to
a minimum middle-income level would take a lot of money—$397 billion a year—but such grants would save
almost four times what they would cost (a benefit:cost ratio of 3.75). This study does not advocate a dramatic
increase in cash grants, however; in reality, careful investments in the eradication of poverty are considerably
more cost-effective than that.
This study finds that in the wealthiest country on Earth, more than 30 million households live on less
than $26,640 (60 percent of the median American household income of $44,400), and many on much less
than that. By contrast, the median income for the other three-quarters of American households is more than
$60,000. The discrepancy in incomes, as well as poverty itself, leads to real and growing costs. Eliminating
poverty, or greatly reducing the number of families living in poverty, would increase the amount all American
families have to spend on necessities such as food and housing, and would raise education levels, reduce
crime, and greatly increase the health of the nation.
Earlier studies have shown, for example, that increased investments in pre-school education for low-
1
1Societal supports such as welfare assistance, public housing, and shelters for the homeless, are the smallest of the costs of poverty that we examined, costing only six percent of the income of the median non-low-income household. By contrast, middle-income supports—social security benefits, Medicare, middle class tax breaks such as home mortgage tax deductions—amount to 24 percent of median income.
T h e E c o n o m i c s o f P o v e r t y : H o w I n v e s t m e n t s t o E l i m i n a t e P o v e r t y B e n e f i t A l l A m e r i c a n s l J e r r o l d O p p e n h e i m a n d T h e o M a c G r e g o r T h e E c o n o m i c s o f P o v e r t y : H o w I n v e s t m e n t s t o E l i m i n a t e P o v e r t y B e n e f i t A l l A m e r i c a n s l J e r r o l d O p p e n h e i m a n d T h e o M a c G r e g o rT
he
E
co
no
mi
cs
o
f
Po
ve
rt
yT
he
E
co
no
mi
cs
o
f
Po
ve
rt
y T h e E c o n o m i c s o f P o v e r t y : H o w I n v e s t m e n t s t o E l i m i n a t e P o v e r t y B e n e f i t A l l A m e r i c a n s l J e r r o l d O p p e n h e i m a n d T h e o M a c G r e g o r
2
income families have a benefit:cost ratio of about 92 and that increased investments in energy efficiency
for low-income families have a benefit:cost ratio of about 7.3 It would be worthwhile to study the cost-
effectiveness of similar anti-poverty measures, such as education at higher levels, including job training;
preventive health care; budget and financial counseling; increasing the minimum wage; and providing health
and retirement benefits to workers, whether full- or part-time. Grants of cash, food, and medicine may be
needed to fill the gap, especially in a transition period.4 Nevertheless, the evidence shows that adding cost-
effective measures to cash grants will only increase the cost-effectiveness of a campaign to eradicate poverty.
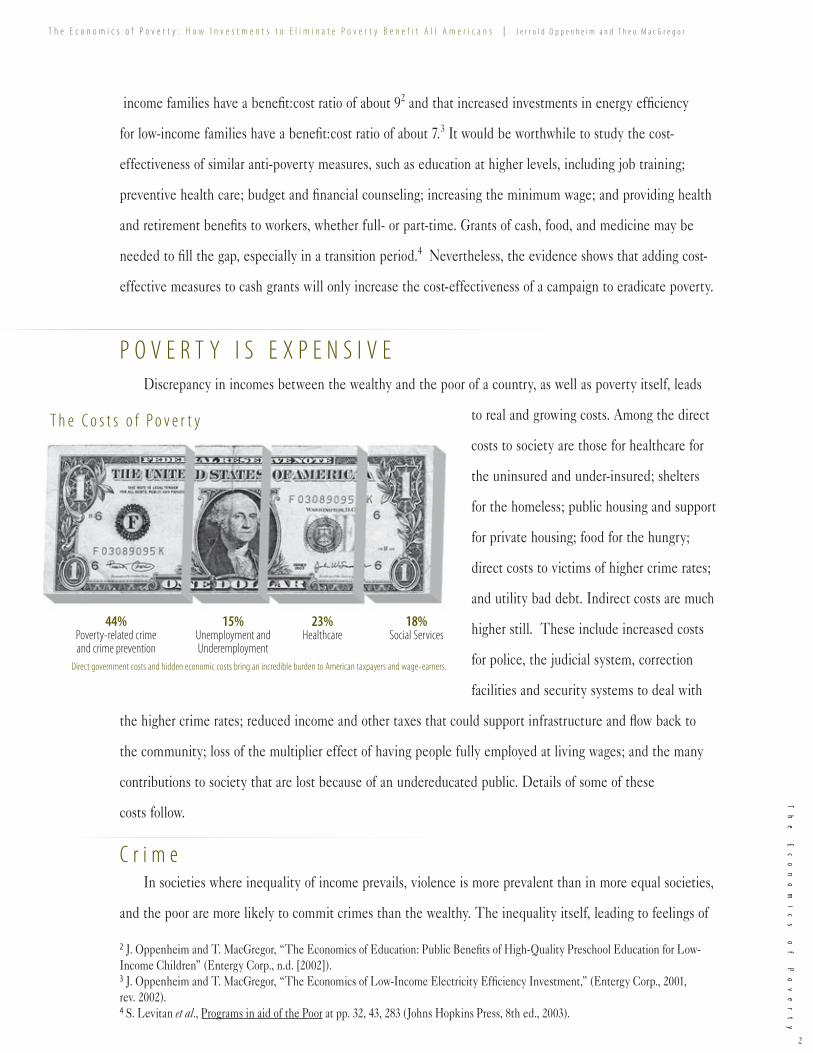
P O V E R T Y I S E X P E N S I V E Discrepancy in incomes between the wealthy and the poor of a country, as well as poverty itself, leads
to real and growing costs. Among the direct
costs to society are those for healthcare for
the uninsured and under-insured; shelters
for the homeless; public housing and support
for private housing; food for the hungry;
direct costs to victims of higher crime rates;
and utility bad debt. Indirect costs are much
higher still. These include increased costs
for police, the judicial system, correction
facilities and security systems to deal with
the higher crime rates; reduced income and other taxes that could support infrastructure and flow back to
the community; loss of the multiplier effect of having people fully employed at living wages; and the many
contributions to society that are lost because of an undereducated public. Details of some of these
costs follow.
C r i m e In societies where inequality of income prevails, violence is more prevalent than in more equal societies,
and the poor are more likely to commit crimes than the wealthy. The inequality itself, leading to feelings of
2J. Oppenheim and T. MacGregor, “The Economics of Education: Public Benefits of High-Quality Preschool Education for Low-Income Children” (Entergy Corp., n.d. [2002]).3J. Oppenheim and T. MacGregor, “The Economics of Low-Income Electricity Efficiency Investment,” (Entergy Corp., 2001, rev. 2002).4S. Levitan et al., Programs in aid of the Poor at pp. 32, 43, 283 (Johns Hopkins Press, 8th ed., 2003).
Th
e
Ec
on
om
ic
s
of
P
ov
er
ty
T h e E c o n o m i c s o f P o v e r t y : H o w I n v e s t m e n t s t o E l i m i n a t e P o v e r t y B e n e f i t A l l A m e r i c a n s l J e r r o l d O p p e n h e i m a n d T h e o M a c G r e g o r T h e E c o n o m i c s o f P o v e r t y : H o w I n v e s t m e n t s t o E l i m i n a t e P o v e r t y B e n e f i t A l l A m e r i c a n s l J e r r o l d O p p e n h e i m a n d T h e o M a c G r e g o r T h e E c o n o m i c s o f P o v e r t y : H o w I n v e s t m e n t s t o E l i m i n a t e P o v e r t y B e n e f i t A l l A m e r i c a n s l J e r r o l d O p p e n h e i m a n d T h e o M a c G r e g o r
being disrespected and offering few options for moving up in status, contributes to the level of violence seen
in poor neighborhoods of even wealthy countries like the United States.5 With more money from full
employment at decent wages, people are less likely to commit crimes, saving society costs of the judicial
system, police, corrections facilities, and security systems. Added to these costs are the enormous costs to
victims, both persons and businesses.
During the past 25 years, the population of people convicted of criminal activity in the U.S. rose from
1.8 million to 6.3 million—with over two million in prison and another four million on probation, the highest
per capita incarceration rate in the world.6
The total net burden of crime in the United States is estimated to be $1 trillion annually, or $4,118 for
every U.S. resident.7 According to The National Center for Victims of Crime, in 2002, crime was estimated
to create $105 billion in medical expenses, lost earnings, and costs for victim services. Including intangible
costs, such as pain and suffering and a reduced quality of life, brought the estimated cost of crime to victims
to $450 billion annually.8 In 2003, reported burglaries and larceny resulted in an estimated total loss of
$4.9 billion. The value of stolen motor vehicles was another $8.6 billion.9 According to the National Center
for Policy Analysis, the typical arson costs an average of $54,000 per victim and an assault costs $31,000.10
The costs to society of incarcerating criminals are almost as staggering. Recent estimates put the cost at
$38 billion annually.11 The costs of police and the judicial system at the federal, state and local levels add
another $110 billion.12
Poverty contributes a substantial portion of the criminal population, and an increase in income inequality
has been shown to increase the crime rate by nearly 60 percent.13 In states where income inequality is
5Richard Wilkinson, The Impact of Inequality: How to Make Sick Societies Healthier, pp. 146-148, (The New Press, New York, NY, 2005).6David Mericle, “Profiting from Poverty: The U.S. Prison-Industrial Complex,” http://www.impactpress.com/aticles/febmar01/prisonind020301/html.7http://www.ncpa.org/pi/crime/pd041100e.html, citing David A. Anderson, “The Aggregate Burden of Crime,” Journal of Law and Economics (October 1999).8http://www.ncvc.org/ncvc/main.aspx?dbName=DocumentViewer&DocumentID=38710, citing Miller et al. (1996). Victim Costs and Consequences: A New Look. Washington, DC: National Institute of Justice, U.S. Department of Justice. Online: http://www.ncjrs.org/pdffiles/victcost.pdf.9http://www.ncvc.org/ncvc/main.aspx?dbName=DocumentViewer&DocumentID=38710, citing the Federal Bureau of Investigation. (2004). Crime in the United States, 2003. Washington, DC: FBI, U.S. Department of Justice. Online: http://www.fbi.gov/ucr/cius_03/pdf/03sec2.pdf.10http://www.ncpa.org/pi/crime/pdcrm/pdcrm11.html.11http://www.ncvc.org/ncvc/main.aspx?dbName=DocumentViewer&DocumentID=38710.12www.ojp.usdoj.gov/bjs/glance/tables/exptyptab.htm.13Antonio Merlo, “The Research Agenda: Dynamic Models of Crime and Punishment”, Economic Dynamics Newsletter, vol. 2, Issue 2 (April 2001) http://www.economicdynamics.org/N41p.htm.
3
T h e E c o n o m i c s o f P o v e r t y : H o w I n v e s t m e n t s t o E l i m i n a t e P o v e r t y B e n e f i t A l l A m e r i c a n s l J e r r o l d O p p e n h e i m a n d T h e o M a c G r e g o r T h e E c o n o m i c s o f P o v e r t y : H o w I n v e s t m e n t s t o E l i m i n a t e P o v e r t y B e n e f i t A l l A m e r i c a n s l J e r r o l d O p p e n h e i m a n d T h e o M a c G r e g o rT
he
E
co
no
mi
cs
o
f
Po
ve
rt
yT
he
E
co
no
mi
cs
o
f
Po
ve
rt
y T h e E c o n o m i c s o f P o v e r t y : H o w I n v e s t m e n t s t o E l i m i n a t e P o v e r t y B e n e f i t A l l A m e r i c a n s l J e r r o l d O p p e n h e i m a n d T h e o M a c G r e g o r
4
greater, homicide and other violent crime rates are higher. Studies have shown that differences in income
equality may account for as much as half of the very large differences in homicide rates from one state
to another.14
Men comprise roughly 93 percent of prisoners in the U.S., and research shows that roughly half of male
prisoners are unemployed when they’re arrested, and up to 70 percent are functionally illiterate.15 One-fourth
of male inmates were convicted of property offenses, one-fourth of drug offenses, and the rest for violent
crimes.16 While women make up just a small fraction of inmates, more than 60 percent have not graduated
from high school; about half were unemployed when arrested; and more than three-quarters are mothers.
Two-thirds of women inmates were imprisoned for drug offenses or violent crimes, and the rest for
property crimes.17
After being released from prison, ex-offenders are often stigmatized and unable to find well-paying jobs;
they face lower wages than they would had they never been incarcerated. While the decrease in earnings can
vary by the type of crime (e.g., “street” crime versus white collar crime), studies show that the effect can be
as large as a 12 percent reduction in wages lasting longer than eight years following conviction.18 Thus, the
cycle continues—low wages, low self-esteem, more crime.
The vast majority of prisoners are poor, but even attributing only 50 percent of crime to poverty and
its effects results in a cost to society from crime committed by poor people of nearly $661 billion a year. As
shown in the education study referenced above, saving one child from a life of crime can save society around
$2 million. Providing full employment at a living wage, with health and other benefits, can reduce crime and
save society an estimated $661 billion annually.
H e a l t h c a r e Poor people are less healthy than are others in America. People lower down the income scale in rich,
developed countries have death rates two to four times higher than those nearer the top of the scale; and the
greater the extremes between wealth and poverty, the greater the health differences.19 Thus it follows, and
14 Richard G. Wilkinson, Unhealthy Societies: The Afflictions of Inequality, p. 156, (Routledge, London and New York, 1996).15David Mericle, “Profiting from Poverty: The U.S. Prison-Industrial Complex,” http://www.impactpress.com/aticles/febmar01/prisonind020301/html.16“The Prison Population,” http://encarta.msn.com/encyclopedia_761573083_2/Prison.html.17“The Prison Population,” http://encarta.msn.com/encyclopedia_761573083_2/Prison.html.18Antonio Merlo, “The Research Agenda: Dynamic Models of Crime and Punishment”, Economic Dynamics Newsletter, vol. 2, Issue 2 (April 2001) http://wwweconomicdynamics.org/N41p.htm.19Richard G. Wilkinson, Unhealthy Societies: The Afflictions of Inequality, p. 54-56, Routledge, London and New York (1996).
Th
e
Ec
on
om
ic
s
of
P
ov
er
ty
T h e E c o n o m i c s o f P o v e r t y : H o w I n v e s t m e n t s t o E l i m i n a t e P o v e r t y B e n e f i t A l l A m e r i c a n s l J e r r o l d O p p e n h e i m a n d T h e o M a c G r e g o r T h e E c o n o m i c s o f P o v e r t y : H o w I n v e s t m e n t s t o E l i m i n a t e P o v e r t y B e n e f i t A l l A m e r i c a n s l J e r r o l d O p p e n h e i m a n d T h e o M a c G r e g o r T h e E c o n o m i c s o f P o v e r t y : H o w I n v e s t m e n t s t o E l i m i n a t e P o v e r t y B e n e f i t A l l A m e r i c a n s l J e r r o l d O p p e n h e i m a n d T h e o M a c G r e g o r
research shows, that overall health declines as economic inequality among populations increases. For
example, Swedes and Norwegians, in whose countries incomes are more evenly distributed, enjoy longer
average life spans than Americans.20 Japan, which has the longest life expectancy in the world, also has
among the narrowest of income distributions.21 Economic equality is thus more important to health than
wealth is.
Poverty carries with it a much higher risk of illness. According to a report by The Robert Woods Johnson
Foundation, based on the U.S. Census Bureau’s 2002 Current Population Survey and Survey of Income and
Program Participation, an estimated 74.7 million people under age 65 in America, or almost one in every
three (30.1 percent), had no health insurance for at least part of the year 2001-2002. Two-thirds had no
insurance for longer than six months of that year.22 More than half (56.1 percent) of people living below 100
percent of the federal poverty level (FPL) were uninsured, as were just under half (48.9 percent) of those
between 100 percent and 200 percent FPL. Yet most (70.7 percent) were employed during that time, while
20.8 million were children under 18 (27.9 percent of all children in the U.S.).23 The total uninsured had risen
to 85 million by 2003-2004, according to the same source.24
Poor uninsured individuals often defer seeking out care when they are ill. As a result, their illness
progresses and can become needlessly severe. They then require more expensive care, often through
the emergency room or hospitalization, for conditions such as diabetes, hypertension, pneumonia and
ulcers. Uninsured adults are often diagnosed with cancer in later stages and suffer lower survival rates as
a consequence. Uninsured children are less likely to be treated in a timely manner—or at all—for typical
childhood illnesses such as sore throats, asthma, and earaches, or even for more serious illnesses or injuries
like broken bones.25 An estimate from the National Academy of Sciences puts the number who die each year
because they lack health insurance at 18,000.26
Uninsured people also experience much higher mortality and morbidity rates once they are hospitalized
(that is case adjusted; in other words, among patients with identical medical conditions, the uninsured have
20 Richard G. Wilkinson, Unhealthy Societies: The Afflictions of Inequality, p. 76, Routledge, London and New York (1996).21 Blane, Brunner and Wilkinson, Health and Social Organization, pp. 60-61, Routledge, London and New York (1996).2 2 “Going without Health Insurance: Nearly One in Three Non-Elderly Americans,” Families USA Publication No. 03-103 (2003), www.familiesusa.org.2 3 “Going without Health Insurance: Nearly One in Three Non-Elderly Americans,” Families USA Publication No. 03-103 (2003), www.familiesusa.org.24 “PHC4 FYI – Uninsured Stats Continue to Climb,” Pennsylvania Healthcare Cost Containment Council (April 2005), http:/www.phc4.org/reports/fyi29.htm.2 5Whitney W. Addington, “No Health Insurance? It’s Enough to Make You Sick - Scientific Research Linking the Lack of Health Coverage to Poor Health,” ACP Online, http://www.acponline.org/uninsured/lack-fore.htm.26 Joan Gralla, “U.S. Uninsured Health Care Cost Put at $125 Billion,” Common Dreams News Center, (Reuters, May 11, 2004).
5
T h e E c o n o m i c s o f P o v e r t y : H o w I n v e s t m e n t s t o E l i m i n a t e P o v e r t y B e n e f i t A l l A m e r i c a n s l J e r r o l d O p p e n h e i m a n d T h e o M a c G r e g o r T h e E c o n o m i c s o f P o v e r t y : H o w I n v e s t m e n t s t o E l i m i n a t e P o v e r t y B e n e f i t A l l A m e r i c a n s l J e r r o l d O p p e n h e i m a n d T h e o M a c G r e g o rT
he
E
co
no
mi
cs
o
f
Po
ve
rt
yT
he
E
co
no
mi
cs
o
f
Po
ve
rt
y T h e E c o n o m i c s o f P o v e r t y : H o w I n v e s t m e n t s t o E l i m i n a t e P o v e r t y B e n e f i t A l l A m e r i c a n s l J e r r o l d O p p e n h e i m a n d T h e o M a c G r e g o r
6
much higher rates of complications and die at a much higher rate than the insured). And once the poor
and uninsured leave the hospital, they are often financially ruined (because the uninsured do not have an
insurance company representing them, they can pay the highest hospital rates in their community).27 Thus,
poverty not only contributes to poor health, but poor health also contributes to poverty. More than half of the
bankruptcies in the U.S. are now due to medical expenses, even though a large majority (75.7 percent) had
insurance at the onset of the illness that contributed to the bankruptcy.28
“In the past six years, the national percentage of individuals insured through
employer-sponsored health insurance has dropped from 69 percent of the country to
60 percent. Those employees that remain uninsured are less likely to seek needed
medical care and more likely to be absent from work and less effective when they
are there. Their family members are more likely to experience untreated medical
conditions and create an enormous distraction for the worker. So one aspect of poverty
is reduced productivity among the working poor.”29
Medicaid is the most comprehensive public health program in the U.S., serving 38 million people in
2005, and jointly funded by the federal and state governments, with most states requiring co-payments from
recipients of Medicaid services.30 And while the assumption may be that most poor Americans are covered by
Medicaid, in fact, “more than eight in ten low-income, uninsured adults do not qualify for Medicaid or other
public health coverage because their incomes are too high. In 42 states, unless they are severely disabled,
they are ineligible for Medicaid regardless of their income.”31 In addition, most of the care provided through
the Medicaid program goes to low-income elderly or seriously disabled people who are also covered under
Medicare. Only 30 percent of Medicaid costs go to cover low-income children and pregnant women.32
In addition to all of the uninsured Americans, many more are “underinsured.” Nearly two million
people under 65 spent more than 10 percent of their pre-tax income on health care, including premiums,
deductibles, co-payments, coinsurance and uncovered services. Of these, 1.69 million had some
health insurance.33
27 Personal correspondence from Bruce Spitz, president, Spitz Consulting Group, formerly Management Professor at Brandeis University’s Institute for Health Policy (Feb. 2006).28 Himmelstein, et al., “MarketWatch: Illness and Injury As Contributors to Bankruptcy,” Health Affairs (Feb. 2, 2005).29 Personal correspondence from Bruce Spitz, president, Spitz Consulting Group, formerly Management Professor at Brandeis University’s Institute for Health Policy (Feb. 2006).30 Michelle Chen, “Poor ‘Share’ More Costs Under Medicaid ‘Cost Sharing’ Initiatives,” The New Standard, (June 3, 2005).31 “Working without a Net: The Health Care Safety Net Still Leaves Millions of Low-Income Workers Uninsured,” (Families USA, April 2004). Other public health services include the State Children’s Health Assistance Program and local health clinics.32 “Future Medicaid Growth is not Due to Flaws in the Program’s Design, but to Demographic Trends and General Increases in Health Care Costs,” (Center on Budget and Policy Priorities, Feb. 4, 2005).33 “PHC4 FYI – Uninsured Stats Continue to Climb,” citing Kathleen Stoll, Director of Health Policy Analysis for Families USA, (Pennsylvania Healthcare Cost Containment Council, April 2005), http:/www.phc4.org/reports/fyi29.htm
Th
e
Ec
on
om
ic
s
of
P
ov
er
ty
T h e E c o n o m i c s o f P o v e r t y : H o w I n v e s t m e n t s t o E l i m i n a t e P o v e r t y B e n e f i t A l l A m e r i c a n s l J e r r o l d O p p e n h e i m a n d T h e o M a c G r e g o r T h e E c o n o m i c s o f P o v e r t y : H o w I n v e s t m e n t s t o E l i m i n a t e P o v e r t y B e n e f i t A l l A m e r i c a n s l J e r r o l d O p p e n h e i m a n d T h e o M a c G r e g o r T h e E c o n o m i c s o f P o v e r t y : H o w I n v e s t m e n t s t o E l i m i n a t e P o v e r t y B e n e f i t A l l A m e r i c a n s l J e r r o l d O p p e n h e i m a n d T h e o M a c G r e g o r
What do all these uninsured and underinsured Americans cost the rest of us? The American Hospital
Association estimates that, in registered community hospitals in 2004, uncompensated care (the total of bad
debt and charity care) cost $26.9 billion. Other estimates are even higher. A Kaiser Commission study from
May 2004 found that uninsured hospital services alone would cost $41 billion in 2005.34 The same study
estimated total costs to be spent on healthcare for the uninsured came to $125 billion.35 That translates to an
extra $922 for family health insurance premiums to those insured by private employers, $341 for individual
coverage.36 This study used $125 billion times the fraction of the population that is low-income (28.67
percent) for a total cost of uninsured care of $35.8 billion, then added the amount paid for Medicaid by the
federal government ($180 billion) and that paid by the states ($120 billion).
Despite all of the evidence presented here, reducing poverty will not necessarily change some rather
startling and disturbing features of our health care system. Thirty percent of the medical services provided in
the U.S. are unnecessary, and unnecessary services add costs and can lead to complications that undermine
the health of patients. For example, half of all patients diagnosed with a common cold are incorrectly
prescribed antibiotics, which has been shown to lead to resistance to antibiotics and to as much as $7.5 billion
a year in excess costs. One study found that 16 percent of hysterectomies performed in the United States
were unnecessary.37 Quality of care also varies greatly by state, locale, size and experience of hospitals,
and resource availability. It is possible that reducing poverty will increase preventive care and thereby
reduce total medical costs in the country. But without further study, it is difficult to determine whether the
increased access to medical care will also increase waste sufficiently to erase the financial benefit. For this
reason, this study simply counted the actual cost of medical care for low-income people that was not paid for
by others.
Despite these shortcomings, progress toward remedying the abysmal healthcare situation in the U.S.
is possible. “Larger and sustained investment in the infrastructure for a healthy society is key to the health
and well-being of the entire population, not just one segment. These investments should be in education,
transport, communication, job creation and training, improved conditions of work, environmental cleanliness,
and health care.”38
3 4 “PHC4 FYI – Uninsured Stats Continue to Climb,” (Pennsylvania Healthcare Cost Containment Council, April 2005), http:/www.phc4.org/reports/fyi29.htm.35 Joan Gralla, “U.S. Uninsured Health Care Cost Put at $125 Billion,” Common Dreams News Center, (Reuters, May 11, 2004).36 “Paying a Premium: The Increased Care for the Uninsured,” (Families USA, rev. July 13, 2005), http://www.familiesusa.org/resources/publications/reports/paying-a-premium.html.37“The Challenge and Potential for Assuring Quality Health Care for the 21st Century,” U.S. Dept. of Health and Human Services citing numerous studies (1998), http://www.ahrq.gov/QUAL/21stcena.htm38 Blane, Brunner and Wilkinson, Health and Social Organization, p. 88, (Routledge, London and New York, 1996).
7
T h e E c o n o m i c s o f P o v e r t y : H o w I n v e s t m e n t s t o E l i m i n a t e P o v e r t y B e n e f i t A l l A m e r i c a n s l J e r r o l d O p p e n h e i m a n d T h e o M a c G r e g o r T h e E c o n o m i c s o f P o v e r t y : H o w I n v e s t m e n t s t o E l i m i n a t e P o v e r t y B e n e f i t A l l A m e r i c a n s l J e r r o l d O p p e n h e i m a n d T h e o M a c G r e g o rT
he
E
co
no
mi
cs
o
f
Po
ve
rt
yT
he
E
co
no
mi
cs
o
f
Po
ve
rt
y T h e E c o n o m i c s o f P o v e r t y : H o w I n v e s t m e n t s t o E l i m i n a t e P o v e r t y B e n e f i t A l l A m e r i c a n s l J e r r o l d O p p e n h e i m a n d T h e o M a c G r e g o r
U n e m p l o y m e n t a n d U n d e r e m p l o y m e n t Unemployment is devastating for the family depending on a breadwinner to pay the rent and put food
on the table. Underemployment is also difficult for families in today’s economy, where two full-time salaries
at one-and-a-half times the minimum wage39 just make it to the poverty cut-off of 60 percent of median
income.40 The average service worker in the US is paid about two times the minimum wage,41 so there is
a substantial population of service workers paid less. When they are unable to find a full week’s work, they
quickly fall into poverty and are thus unable to afford the basics of food, shelter, and medicine. The personal
costs of underemployment are severe for those already living on the edge.
“What is particularly distinctive about joblessness as an economic problem, however, is
the focused harm it visits on particular individuals. Joblessness is a primary cause of both
absolute and relative poverty in otherwise wealthy societies. Low average earnings can
cause mass poverty in poor societies, but joblessness can cause concentrated poverty even
in rich societies. This poverty hurts because it involves real material deprivation, but it
hurts even more because it is experienced in the midst of plenty. For this reason, poverty
caused by joblessness may be especially damaging to the persons who suffer it. This effect
is even more pronounced in a society, such as ours, in which both social status and self-
esteem depend heavily on the kind of work one does and how it is rewarded. In fact, being
involuntarily unemployed is a deeply corrosive experience, even when it is not associated
with significant material deprivation. Among other problems, unemployment appears to
cause increased rates of suicide and attempted suicide, substantial adverse mental and
physical health effects, adverse social psychological effects, adverse effects on family life
and personal relationships, and increased criminal activity and rates of incarceration. In
recognition of the importance of employment in securing individual welfare, access to work
(and not just income) has been recognized as a fundamental right in international human
rights proclamations and agreements.”42
39 Minimum wage is $5.15 per hour. The average number of hours worked for a service worker is 32.4 hours a week or 1684.8 hours per year. Bureau of Labor Statistics. The total income would be $26,030.4 0 $26,640 in 2004. US Census.41 $10.65 in 2004 according to the Bureau of Labor Statistics. The median hourly wage for the primary worker in low-income families is even less, about $9. The Urban Institute, “Low-Income Working Families: Facts and Figures” (Aug. 25, 2005), www.urban.org/url.cfm?ID=900832.42 Philip Harvey (Associate Professor of Law, Rutgers School of Law–Camden), “Designing Policies to Combat Joblessness,” University of Missouri —Kansas City Department of Economics, Center for Full Employment and Price Stability, Seminar Paper No. 3 (2000).
8
Th
e
Ec
on
om
ic
s
of
P
ov
er
ty
T h e E c o n o m i c s o f P o v e r t y : H o w I n v e s t m e n t s t o E l i m i n a t e P o v e r t y B e n e f i t A l l A m e r i c a n s l J e r r o l d O p p e n h e i m a n d T h e o M a c G r e g o r T h e E c o n o m i c s o f P o v e r t y : H o w I n v e s t m e n t s t o E l i m i n a t e P o v e r t y B e n e f i t A l l A m e r i c a n s l J e r r o l d O p p e n h e i m a n d T h e o M a c G r e g o r T h e E c o n o m i c s o f P o v e r t y : H o w I n v e s t m e n t s t o E l i m i n a t e P o v e r t y B e n e f i t A l l A m e r i c a n s l J e r r o l d O p p e n h e i m a n d T h e o M a c G r e g o r
Underemployment is usually defined for statistics-gathering purposes as not being able to find work
for as many hours as a worker is willing to work.43 Other forms of underemployment are prevalent but
more difficult to quantify. For example, global economic factors have turned a large fraction of a generation
of highly-trained and well-paid industrial workers into much-less-well-paid workers in jobs requiring
considerably less training, such as retailing.
Thus unemployment and underemployment push families into poverty. “After a period of
unemployment, however it is caused, the risk of downward social mobility from high to lower status
occupations appears to be increased.”44 As explained elsewhere in this report, families falling into poverty
are costly to the nation because of the increased costs they cause of crime, healthcare, and social services.
Nobel laureate William S. Vickrey put it this way:
“It is totally unacceptable when it means 10 percent, 20 percent and 40 percent
unemployment among disadvantaged groups, with serious consequences for poverty,
homelessness, family breakups, drug addiction and crime. The malaise that pervades our
cities may be attributable in no small measure to the fact that for the first time in our
history, an entire generation and more has grown up without experiencing reasonably full
employment, even briefly.”45
As another scholar summarizes:46
“Unemployment has tremendous social and economic costs. Unemployment causes
permanent losses of output of goods and services. The unemployed are faced with financial
insecurity, resulting in poverty and indebtedness. Certain kinds of criminal activity are
directly related to health (physical and mental), drug addiction, homelessness, malnutrition,
poor prenatal care, school dropouts, racial and ethnic antagonism, and other social
problems. Unemployment also differentially affects certain sectors of the population, so that
disadvantaged minorities, those with little education, and youth, e.g., can suffer from rates of
unemployment two to ten times the overall rate.
43Bureau of Labor Statistics; C. Cobb et al., “Why Bigger Isn’t Better: The Genuine Progress Indicator – 1999 Update” (Redefining Progress, 1999), www.rprogress.org/newpubs/1999/gpi1999.html.4 4“M. Bartley et al.,”Health and work insecurity in young men,” in D. Blane et al., Health and Social Organization, at p. 255 (Routledge, 1996), citations omitted.45 William S. Vickrey, “Fifteen Fallacies of Financial Fundamentalism: A Disquisition on Demand Side Economics” in Aaron Warner, Mathew Forstater and Sumner Rosen (eds.), Commitment to Full Employment: the Macroeconomics of Public Policy of William S. Vickrey, (Armonk, NY: M. E. Sharpe Publishing, 2000), http://www.cfeps.org/pubs/wp/wp1.html. 4 6 Mathew Forstater (Associate Professor of Economics and Black Studies and Director, Center for Full Employment and Price Stability, Department of Economics, University of Missouri — Kansas City), “Unemployment” in John King (ed.), Elgar Companion to Post Keynesian Economics (Edward Elgar Publishing, 2002), http://www.cfeps.org/pubs/wp/wp20.html. Citations omitted.
9
T h e E c o n o m i c s o f P o v e r t y : H o w I n v e s t m e n t s t o E l i m i n a t e P o v e r t y B e n e f i t A l l A m e r i c a n s l J e r r o l d O p p e n h e i m a n d T h e o M a c G r e g o r T h e E c o n o m i c s o f P o v e r t y : H o w I n v e s t m e n t s t o E l i m i n a t e P o v e r t y B e n e f i t A l l A m e r i c a n s l J e r r o l d O p p e n h e i m a n d T h e o M a c G r e g o rT
he
E
co
no
mi
cs
o
f
Po
ve
rt
yT
he
E
co
no
mi
cs
o
f
Po
ve
rt
y T h e E c o n o m i c s o f P o v e r t y : H o w I n v e s t m e n t s t o E l i m i n a t e P o v e r t y B e n e f i t A l l A m e r i c a n s l J e r r o l d O p p e n h e i m a n d T h e o M a c G r e g o r
10
“Unemployment also can destabilize business expectations, as fears of low demand cool
private investment. Related to this, unemployment can also lead to technological stagnation.
“Unemployment is the direct and indirect cause of many social and economic
problems. It can also lead to political instability.”
Thus, as difficult as unemployment and underemployment are for the families that experience them,
unemployment and underemployment are costly drags on the economy that affect everyone. This study
quantified some, but by no means all, of the costs that could be avoided by reducing unemployment and
underemployment.
Most obviously, there are taxpayer-financed social supports such as unemployment compensation, job
training, and retraining. In addition, unemployed and underemployed persons pay less in taxes than if
they were fully employed. They also spend less on job-producing goods and services—the so-called
multiplier effect.
The total costs of unemployment and underemployment are calculated in a conservative manner. The
starting point is the number of unemployed workers reported by the US Department of Labor Bureau of
Labor Statistics, including discouraged workers “wanting and available for work,” conservatively adjusted by
subtracting a “full employment rate” of four percent.47 As a further conservatism, lost wages were assumed
to be at the minimum wage per hour (for 2000 hours per year). As noted above, this is about half the average
service worker wage. A spending multiplier of 2.0 assumes that at this low level of income, all income would
be spent.48
A published estimate of the costs of underemployment, including multiplier effects,49 was inflated to
$2005. However, the estimate was reduced here to restate lost wages as at the minimum wage instead of the
$11.20 per hour used. Also, underemployment is defined to reflect only lost hours of work and not lost wages
due to inability to find a job at an appropriate skill level—another conservatism.
Finally, transfer payments to or on behalf of the unemployed and underemployed were estimated,
47 There is considerable disagreement over a “natural” or ”full employment” unemployment rate. E.g., William S. Vickrey, “Fifteen Fallacies of Financial Fundamentalism: A Disquisition on Demand Side Economics” in Aaron Warner, Mathew Forstater and Sumner Rosen (eds.), Commitment to Full Employment: the Macroeconomics of Public Policy of William S. Vickrey, (Armonk, NY: M. E. Sharpe Publishing, 2000), http://www.cfeps.org/pubs/wp/wp1.html. Our subtraction is thus a considerable conservatism.4 8 P. R. Tcherneva, Missouri’s Cost of Unemployment (University of Missouri —Kansas City Department of Economics, Center for Full Employment and Price Stability, Special Report 05-02 2002.49 C. Cobb et al., “Why Bigger Isn’t Better: The Genuine Progress Indicator – 1999 Update” (Redefining Progress, 1999), www.rprogress.org/newpubs/1999/gpi1999.html.
Th
e
Ec
on
om
ic
s
of
P
ov
er
ty
T h e E c o n o m i c s o f P o v e r t y : H o w I n v e s t m e n t s t o E l i m i n a t e P o v e r t y B e n e f i t A l l A m e r i c a n s l J e r r o l d O p p e n h e i m a n d T h e o M a c G r e g o r T h e E c o n o m i c s o f P o v e r t y : H o w I n v e s t m e n t s t o E l i m i n a t e P o v e r t y B e n e f i t A l l A m e r i c a n s l J e r r o l d O p p e n h e i m a n d T h e o M a c G r e g o r T h e E c o n o m i c s o f P o v e r t y : H o w I n v e s t m e n t s t o E l i m i n a t e P o v e r t y B e n e f i t A l l A m e r i c a n s l J e r r o l d O p p e n h e i m a n d T h e o M a c G r e g o r
including unemployment insurance50 and job training.51 As with lost economic benefits, the cost of
unemployment insurance was limited to those in excess of a “natural” unemployment rate of four percent.
The average weekly benefit of $263.25 was capped at 26 weeks, conservatively ignoring extended
payment periods.
Some of the indirect societal costs of unemployment and underemployment, such as costs of crime and
for healthcare52 are subsumed under the aggregate estimates for those categories described elsewhere in this
report. Other indirect costs are not counted.
In this way, the avoidable costs of low-income unemployment and underemployment have been
conservatively estimated.
C u r r e n t A n t i - P o v e r t y I n v e s t m e n t s There are many other areas that contribute to the high cost of poverty in the U.S. For some of these,
current anti-poverty investments – that is, investments made by the rest of us, through taxes or other
social service supports, to mitigate or alleviate the high costs – make but a small dent in the overall cost to
society. Following are descriptions and conservative cost estimates for such conditions as homelessness and
inadequate housing, lack of appropriate high-quality education, hunger, and inability to pay utility bills.
The amount society has allocated to mitigating these conditions does not come close to meeting the
true needs.
H o u s i n g a n d H o m e l e s s n e s s Homelessness exploded in the 1980s, as federal funds for low-income housing and social assistance
programs for low-income families fell dramatically. Current federal spending on housing assistance programs
50Bureau of Labor Statistics.51 US Department of Labor FY 2006 Budget Overview; Tax Policy Center (Joint Venture of the Urban Institute and Brookings Institution), “Estimates of Total Income Tax Expenditures,” www.taxpolicycenter.org/TaxFacts/TFDB/TFTemplate.cfm?Docid=375; National Community Action Foundation, “CAA Core Appropriations,” www.ncaf.org, see e.g., www.ncaf.org/fy07bud2.pdf. 52 “All studies show higher rates of ill health, however measured, both psychological and physical in women and men who are unemployed.” M. Bartley et al., “Health and work insecurity in young men,” in D. Blane et al., Health and Social Organization, at p. 255 (Routledge, 1996), citations omitted. Health declines “as a consequence of unemployment. A large part of the link between health and unemployment is related to job insecurity and the anticipation of unemployment.” R. G. Wilkinson, Unhealthy Societies: The Afflictions of Inequality at p. 178 (Routledge, 1996).
11
T h e E c o n o m i c s o f P o v e r t y : H o w I n v e s t m e n t s t o E l i m i n a t e P o v e r t y B e n e f i t A l l A m e r i c a n s l J e r r o l d O p p e n h e i m a n d T h e o M a c G r e g o r T h e E c o n o m i c s o f P o v e r t y : H o w I n v e s t m e n t s t o E l i m i n a t e P o v e r t y B e n e f i t A l l A m e r i c a n s l J e r r o l d O p p e n h e i m a n d T h e o M a c G r e g o rT
he
E
co
no
mi
cs
o
f
Po
ve
rt
yT
he
E
co
no
mi
cs
o
f
Po
ve
rt
y T h e E c o n o m i c s o f P o v e r t y : H o w I n v e s t m e n t s t o E l i m i n a t e P o v e r t y B e n e f i t A l l A m e r i c a n s l J e r r o l d O p p e n h e i m a n d T h e o M a c G r e g o r
12
53 “Overview of Homelessness In America” National Student Campaign Against Hunger and Homelessness, http://www.studentsagainsthunger.org/hunger.5 4 Jay Shaft, “US Homelessness and Poverty Rates Skyrocket,” (Information Clearing House, July 7, 2003), http://www.informationclearinghouse.info/article4305.htm.55”The State of the Nation’s Housing” (Harvard University Joint Center for Housing, June 13, 2005), http://www.jchs.harvard.edu/media/son2005_fact_sheet.pdf.56 ”A Plan, Not a Dream: How to End Homelessness in Ten Years,” citing research by Dr. Yvonne Rafferty of Pace University (National Alliance to End Homelessness, 2000), http://www.endhomelessness.org/pub/tenyear/cost.htm.57 J. Oppenheim and T. MacGregor, “The Economics of Education: Public Benefits of High-Quality Preschool Education for Low-Income Children,” p. 27 (Entergy Corp., n.d. [2002]).58 While those with a high school diploma earn $27,915, those without a high school diploma average $18,734. (U.S. Census Bureau, March 28, 2005).59 “A Plan, Not a Dream: How to End Homelessness in Ten Years,” citing Salit S.A., Kuhn E.M., Hartz A.J., Vu J.M., Mosso A.L. “Hospitalization costs associated with homelessness in New York City,” New England Journal of Medicine 1998; 338: 1734-1740.
targeted at low-income populations is less than 50 percent of 1976 spending levels.53 On any given day,
at least 840,000 people in the United States are homeless — nearly 40 percent of them children. “The
homeless population is estimated to be 50 percent African American, 35 percent white, 12 percent Hispanic,
2 percent Native American, and 1 percent Asian. An average of 23 percent suffer from mental illness, 38
percent suffer from substance abuse, 10 percent are veterans, and 22 percent are employed. Over 40 percent
of homeless persons are eligible for disability benefits, but only 11 percent actually receive them. Most are
eligible for food stamps, but only 37 percent receive them. Most homeless families are eligible for welfare
benefits, but only 52 percent receive them.”54
More than 3.5 million Americans are affected by homelessness for at least part of the year each year.
More than one in eight households pay more than 50 percent of their income for housing, and another
2.5 million live in over-crowded or severely inadequate housing.55 These factors contribute to interrupted
educations, lack of adequate health care, persistent hunger, and higher crime rates.
Children living with families that are homeless attend school less frequently, score lower on standardized
tests, are less likely to graduate from high school and become productive members of society.56 As described
in MacGregor and Oppenheim’s education study, full-time, year-round workers without a high school diploma
earned more than 30 percent less than those with a diploma in 1999.57 The gap has only widened since.58
Homelessness can both cause and result from serious health care issues. The New England Journal
of Medicine reported that homeless people spent an average of four days longer per hospital visit than did
comparable non-homeless people.59 Homelessness can exacerbate drug and alcohol addictions, and treating
homeless people for drug and alcohol related illnesses when people are not in stable living conditions is
expensive. Physician and health care expert Michael Siegel found that the average cost to cure an alcohol-
Th
e
Ec
on
om
ic
s
of
P
ov
er
ty
T h e E c o n o m i c s o f P o v e r t y : H o w I n v e s t m e n t s t o E l i m i n a t e P o v e r t y B e n e f i t A l l A m e r i c a n s l J e r r o l d O p p e n h e i m a n d T h e o M a c G r e g o r T h e E c o n o m i c s o f P o v e r t y : H o w I n v e s t m e n t s t o E l i m i n a t e P o v e r t y B e n e f i t A l l A m e r i c a n s l J e r r o l d O p p e n h e i m a n d T h e o M a c G r e g o r T h e E c o n o m i c s o f P o v e r t y : H o w I n v e s t m e n t s t o E l i m i n a t e P o v e r t y B e n e f i t A l l A m e r i c a n s l J e r r o l d O p p e n h e i m a n d T h e o M a c G r e g o r
related illness is approximately $10,660. Another study found that the average cost to California Hospitals of
treating a substance abuser is about $8,360 for those in treatment for the abuse, and $14,740 for those who are
not.60 It is difficult to keep people in treatment when they are homeless.
Other major causes of homelessness are unemployment or underemployment; high housing costs,
including rising utility bills; domestic abuse; mental illness and substance abuse, with lack of treatment
services; cuts in public assistance; and the general state of the economy.
The costs of providing healthcare to the homeless are included in the overall costs of healthcare
discussed above. This study calculates the costs of homeless shelters, public housing, and public subsidies to
private housing (including tax expenditures) at $69.1 billion.
H u n g e r An estimated 14 million American children live in homes where there is not enough food.61 Bread for
the World reported that 35 percent of Americans had to choose between food and rent, while 28 percent had
to choose between medical care and food, in the first half of 2004.62 Other studies show that money devoted
to food by families is typically the first to be sacrificed. Families will often pay their fixed payments first,
such as rent and utilities, rather than pay for food.63
The number of people requesting emergency food aid is rising. In a survey conducted in early 2005 of
900 emergency food and shelter providers across the country, volunteers found an increase of 74 percent in
the number of requests for food assistance over the year before, although many had to be denied because of
budget cuts and lack of agency funding.64 Thus, the amount included in this study for food grants from non-
governmental food pantries ($2.3 billion) is a gross understatement of the need.
Including the cost of the federal Women, Infants and Children (WIC) program ($5.2 billion), Food
Stamps ($27.2 billion in 2004), school and other child nutrition programs ($11.9 billion), and other food
assistance ($300 million) yields a conservative $46.9 billion for direct food subsidies to poor people.
6 0 “A Plan, Not a Dream: How to End Homelessness in Ten Years” (National Alliance to End Homelessness, 2000), citing the National Law Center on Homelessness and Poverty, May 8, 2000 http://www.endhomelessness.org/pub/tenyear/cost.htm.61 “Hunger, Poverty and Nutrition Policy: Childhood Hunger, Childhood Obesity” (Tufts University 1995-2005), http://nutrition.tufts.edu/consumer/hunger/hunger_and_obesity.html.62 “Overview of Hunger In America” National Student Campaign Against Hunger and Homelessness, http://www.studentsagainsthunger.org/hunger.63 “Overview of Hunger In America” National Student Campaign Against Hunger and Homelessness, http://www.studentsagainsthunger.org/hunger.6 4“Communities in Crisis: Survey of Hunger and Homelessness in America” (National Student Campaign Against Hunger and Homelessness, Feb. 2005).
13
T h e E c o n o m i c s o f P o v e r t y : H o w I n v e s t m e n t s t o E l i m i n a t e P o v e r t y B e n e f i t A l l A m e r i c a n s l J e r r o l d O p p e n h e i m a n d T h e o M a c G r e g o r T h e E c o n o m i c s o f P o v e r t y : H o w I n v e s t m e n t s t o E l i m i n a t e P o v e r t y B e n e f i t A l l A m e r i c a n s l J e r r o l d O p p e n h e i m a n d T h e o M a c G r e g o rT
he
E
co
no
mi
cs
o
f
Po
ve
rt
yT
he
E
co
no
mi
cs
o
f
Po
ve
rt
y T h e E c o n o m i c s o f P o v e r t y : H o w I n v e s t m e n t s t o E l i m i n a t e P o v e r t y B e n e f i t A l l A m e r i c a n s l J e r r o l d O p p e n h e i m a n d T h e o M a c G r e g o r
E d u c a t i o n “Poverty prevention is more dependent on education than on any other factor, as is escape from
poverty.”65 Education is the primary means by which people can lift themselves out of poverty, yet the
amount spent on education targeting low-income children falls far short of the need. “The achievement
gap between poor and non-poor children is well-documented. Low-income children consistently fall behind
their peers in test scores, graduation rates, college enrollment, and other measures of academic success.”66
In research cited in a report by the Center on Budget and Policy Priorities, the following findings
were summarized:
n “Student achievement is linked to school funding levels. While some researchers in
the 1980s and 1990s suggested that school funding levels and student achievement are
largely unrelated, more recent studies have contradicted this claim. A comprehensive
review of over 60 statistical analyses that examine the link between school inputs,
such as funding levels and student poverty rates, and school outcomes, such as test
scores and graduation rates, indicates that school funding and student performance are
strongly related.
n “Claims that large increases in school funding already have been made are overstated.
... However, measures of inflation that account for the service-oriented nature of public
education show smaller increases in school funding levels because services have risen
in cost faster than most common measures of inflation. Moreover, most of the real
increases in education spending have been in areas such as special education, where
one would not expect the additional expenditures to result in improved performance on
standardized tests or similar measures of student performance. ...
n “Claims of stagnant achievement growth are overstated. ... Since 1970, the national
child poverty rate has increased, while the dropout rate has declined, meaning that
more students are poor and fewer academically-marginal students are dropping
out of school.
65 S. Levitan et al., Programs in aid of the Poor, p. 274 (Johns Hopkins Press, 8th ed., 2003).6 6 Kevin Carey, “Education Funding and Low-Income Children: A Review of Current Research,” Center on Budget and Policy Priorities (Nov. 5, 2002).
14
Th
e
Ec
on
om
ic
s
of
P
ov
er
ty
T h e E c o n o m i c s o f P o v e r t y : H o w I n v e s t m e n t s t o E l i m i n a t e P o v e r t y B e n e f i t A l l A m e r i c a n s l J e r r o l d O p p e n h e i m a n d T h e o M a c G r e g o r T h e E c o n o m i c s o f P o v e r t y : H o w I n v e s t m e n t s t o E l i m i n a t e P o v e r t y B e n e f i t A l l A m e r i c a n s l J e r r o l d O p p e n h e i m a n d T h e o M a c G r e g o r T h e E c o n o m i c s o f P o v e r t y : H o w I n v e s t m e n t s t o E l i m i n a t e P o v e r t y B e n e f i t A l l A m e r i c a n s l J e r r o l d O p p e n h e i m a n d T h e o M a c G r e g o r
n “Recent research indicates that schools need significant additional funds to educate
low-income students. Both the federal government and most states have adopted
funding policies that provide additional money to school districts based on poverty
rates. ... [I]n order to reduce significantly the academic achievement gap, school
districts need funding for poor students equal to two to two-and-a-half times the
cost of educating non-poor students. These amounts are much greater than the
supplemental amount provided by any state prior to 2002.
n “Schools can use additional funds for low-income students to implement specific
resource-intensive education improvement strategies that have been shown to
improve student achievement. ... For example, class-size reduction programs, when
properly funded and implemented, have resulted in substantial, lasting improvements
in student achievement. Poor and minority students showed greater benefits than
non-poor students in prominent class-size reduction programs implemented in
Tennessee and Wisconsin and minority students showed greater benefits than
non-poor students in prominent class-size reduction programs implemented in
Tennessee and Wisconsin. ...”67
Title 1 is a federal program designed to raise academic achievement among children who attend either
public or private schools with a high percentage of poor children. It reaches about 12.5 million children
enrolled in preschool through high school. Total appropriations for Title 1 in 2005 equaled $12.7 billion, for
an average of approximately $1,000 per student.68
In addition to Title 1 funds, at least 38 states provide some education funding on the basis of levels of
poverty. These states contributed $8.7 billion for 75 separate programs specifically targeting categories of
learning such as preschool or kindergarten, smaller class sizes, reading in the early grades, and students who
are falling behind their peers.69
15
67 Kevin Carey, “Education Funding and Low-Income Children: A Review of Current Research,” Center on Budget and Policy Priorities (Nov. 5, 2002).6 8 Title 1, Part A Program, http://www.ed.gov/print/programs/title1parta/index.html.69 Kevin Carey, “State Poverty-Based Education Funding: A Survey of Current Programs and Options for Improvement” (Center on Budget and Policy Priorities, Nov. 7, 2002).
T h e E c o n o m i c s o f P o v e r t y : H o w I n v e s t m e n t s t o E l i m i n a t e P o v e r t y B e n e f i t A l l A m e r i c a n s l J e r r o l d O p p e n h e i m a n d T h e o M a c G r e g o r T h e E c o n o m i c s o f P o v e r t y : H o w I n v e s t m e n t s t o E l i m i n a t e P o v e r t y B e n e f i t A l l A m e r i c a n s l J e r r o l d O p p e n h e i m a n d T h e o M a c G r e g o rT
he
E
co
no
mi
cs
o
f
Po
ve
rt
yT
he
E
co
no
mi
cs
o
f
Po
ve
rt
y T h e E c o n o m i c s o f P o v e r t y : H o w I n v e s t m e n t s t o E l i m i n a t e P o v e r t y B e n e f i t A l l A m e r i c a n s l J e r r o l d O p p e n h e i m a n d T h e o M a c G r e g o r
Head Start has enrolled over 20,000,000 low-income children since its inception as a summer program in
1965.70 Long-term follow-up studies on a number of these children have shown that Head Start participants
achieve greater school success and avoid crime as they grow.71 The total spent on Head Start and related
programs in the states and territories in 2005 was at least $9.502 billion. Tax expenditures add $628 million.72
In an earlier study performed for Entergy, Oppenheim and MacGregor found that educating low-
income children when they are very young returns about $9 for every dollar spent. Benefits include children
staying in school through high school, developing a work ethic, and getting and keeping better jobs, with
the commensurate rise in pay and associated income taxes, along with the multiplier effect of putting more
money in the economy.73
U t i l i t i e s
Poor people cannot pay the full cost of heating and lighting their homes. Utilities, governments, and
social service agencies have long assisted low-income ratepayers in paying their bills through such programs
as the Low-Income Home Energy Assistance Program (LIHEAP), charitable fuel funds, levelized billing,
discounts, home weatherization, energy efficiency, energy usage education, and arrearage forgiveness/debt
management.
Utility bad debt costs around $1 billion annually.74 American utilities, through their ratepayers, paid
an average of $3 per customer to collect bad debt, and in some cases, the cost was as high as $10.75 If all
Americans lived in weatherized and energy efficient homes, and had the income to pay their full share
of utility bills, all other ratepayers would save nearly $6 billion in poverty costs, including fuel assistance,
lifeline and other rate assistance; weatherization and efficiency costs; and the costs of late and unmade
payments, such as service disconnections.76
70 Joan E. Ohl, “Head Start: Building on the Pillars of our Success” presented at the National Head Start Association Conference, May 28, 2003.71 Oden, et al., “Into Adulthood: A Study of the Effects of Head Start” (High/Scope Educational Research Foundation, 2005).72 Tax Policy Center (Joint Venture of the Urban Institute and Brookings Institution), “Estimates of Total Income Tax Expenditures,” www.taxpolicycenter.org/TaxFacts/TFDB/TFTemplate.cfm?Docid=37573 J. Oppenheim and T. MacGregor, ”The Economics of Education: Public Benefits of High-Quality Preschool Education for Low-Income Children” (Entergy Corp., n.d. [2002]).74 Industry Solutions, The CBE Group, http://www.cbegroup.com/industry/utilities.aspx.75 ”Utility Collections Best Practice: Theory Into Practice” (Peace Software White Paper, May 2005), http://www.peace.com/industry-watch/whitepapers/Peace-Collections-Best-Practice.pdf. This paper also states that total utility bad debt written off in the U.S. each year is as high as $1.7 billion. This study used the more conservative $1 billion.76 LIHEAP Clearinghouse, National Energy Assistance Directors’ Association (NEADA), National Center for Appropriate Technology (NCAT), National Community Action Foundation (NCAF).
16
Th
e
Ec
on
om
ic
s
of
P
ov
er
ty
T h e E c o n o m i c s o f P o v e r t y : H o w I n v e s t m e n t s t o E l i m i n a t e P o v e r t y B e n e f i t A l l A m e r i c a n s l J e r r o l d O p p e n h e i m a n d T h e o M a c G r e g o r T h e E c o n o m i c s o f P o v e r t y : H o w I n v e s t m e n t s t o E l i m i n a t e P o v e r t y B e n e f i t A l l A m e r i c a n s l J e r r o l d O p p e n h e i m a n d T h e o M a c G r e g o r T h e E c o n o m i c s o f P o v e r t y : H o w I n v e s t m e n t s t o E l i m i n a t e P o v e r t y B e n e f i t A l l A m e r i c a n s l J e r r o l d O p p e n h e i m a n d T h e o M a c G r e g o r
O t h e r A n t i - P o v e r t y I n v e s t m e n t s Some additional anti-poverty programs and initiatives for which the average non-low-income household
contributes, and which are not detailed above but are included in the total estimate of the cost of poverty,
include the following:
n Legal Services and other civil legal aid -- $573 million;
n Transitional Aid to Needy Families (TANF) -- $27.5 billion, federal and
states combined;
n Supplemental Security Income (SSI) -- $42.6 billion;
n Earned Income Tax Credit (EITC) -- $36.7 billion;
n Services to low-income seniors -- $1.830 billion;
n Other social services -- $2.673 billion;
n Community Services Block Grants -- $636.8 million; and
n Community Development Block Grants -- $4.116 billion.7 7
C O N C L U S I O N Investments in low-income Americans are among the most cost-effective investments we can make.
Simple cash payments to low-income families may be among the least cost-effective investments against
poverty in the long-run. Yet, as we show above, even simple cash payments sufficient to lift all Americans
out of poverty would immediately be returned nearly fourfold. We have shown elsewhere that there are
investment strategies on behalf of low-income families with even greater potential payoffs. For example,
investing in weatherization and installing efficient appliances in low-income homes returns seven times the
investment.78 Investing in the education of three-and-four-year-olds returns nine times the investment.79
17
7 7 Legal Services Corp. fiscal year 2005 appropriation; “Documenting the Justice Gap in America” Legal Services. Corp, Sept. 2005; Tax Policy Center (joint venture of Urban Institute and Brookings Institution), from OMB; http://www.whitehouse.gov/omb/budget/fy2006/treasury.html; U.S. Dept. of Health and Human Services – Office of Family Assistance; Center on Budget and Policy Priorities; http://www.ssa.gov/policy/docs/statcomps/ssi_monthly/2005-11/table01.html; National Center for Appropriate Technology (NCAT).78 J. Oppenheim and T. MacGregor, “The Economics Of Low-Income Electricity Efficiency Investment” (Entergy, 2001, rev. 2002).79 J. Oppenheim and T. MacGregor, “The Economics of Education: Public benefits of High-Quality Preschool Education for Low-Income Children” (Entergy, n.d. [2002]).
T h e E c o n o m i c s o f P o v e r t y : H o w I n v e s t m e n t s t o E l i m i n a t e P o v e r t y B e n e f i t A l l A m e r i c a n s l J e r r o l d O p p e n h e i m a n d T h e o M a c G r e g o r T h e E c o n o m i c s o f P o v e r t y : H o w I n v e s t m e n t s t o E l i m i n a t e P o v e r t y B e n e f i t A l l A m e r i c a n s l J e r r o l d O p p e n h e i m a n d T h e o M a c G r e g o rT
he
E
co
no
mi
cs
o
f
Po
ve
rt
yT
he
E
co
no
mi
cs
o
f
Po
ve
rt
y T h e E c o n o m i c s o f P o v e r t y : H o w I n v e s t m e n t s t o E l i m i n a t e P o v e r t y B e n e f i t A l l A m e r i c a n s l J e r r o l d O p p e n h e i m a n d T h e o M a c G r e g o r
Others have shown that investments in preventive healthcare earn a positive return.80
Additional study should confirm the economic wisdom of other investments in low-income families.
Indeed, in many cases, the science is established and the political decision has been made to create a
program. All that remains to do in those cases is to adequately fund the existing programs.81
Weatherization, Head Start, and preventive healthcare are examples of underfunded cost-effective
investment opportunities that have already been mentioned. Another example is childhood nutrition. It is
well established that a nutritious breakfast and lunch determine a child’s ability to learn, with significant
implications for later success in life,82 just as it is well established that nutrition during the first two years of
life, as well as of pregnant mothers, has an enormous impact on later health and intellect.83 That is why there
is a successful program to provide adequate nutrition to infants and pregnant mothers.84 Similarly, this is the
basis for the free and reduced price school meal program.85
Later in life, effective vocational training and re-training can turn a marginal worker into an economic
success.86 Investing in decent housing provides the first prerequisite for a homeless family to even participate
in the economy.87 All are cost-effective investments in low-income families that could pay huge dividends
if expanded.
8 0 E.g., J. Abramson, M.D., Overdosed America at pp. 49, 166 (Harper Perrennial 2005).81 E.g., “Millions of eligible children do not receive free or reduced price lunches.” S. Levitan et al., Programs in aid of the Poor at p. 122 (Johns Hopkins Press, 8th ed., 2003). “Whereas [the job training program phased out in 2000] ended with sufficient funds to enroll approximately 1 percent of those who were eligible for its services, [its replacement program] adult ratio approaches the infinitesimal.” Id. at p. 234. Housing programs are inadequately funded and do not pay enough in many markets to keep housing costs below 40 percent of income. “They simply need more resources to meet the needs of those eligible by cutting interminable waiting lists.” Id. at p. 272.82 E.g., J. Fraser Mustard, “Health and social capital” in D. Blane et al., Health and Social Organization, at p. 306 (Routledge, 1996).83 E.g., M. Wadsworth, “Family and education as determinants of health,” in D. Blane et al., Health and Social Organization, at pp. 154-156 (Routledge, 1996); J. Fraser Mustard, “Health and social capital” in id. at pp. 304-306; V. Lazariu-Bauer et al., “A Comparative Analysis of Effects of Early Versus Late Prenatal WIC Participation on Birth Weight: NYS, 1995,” 8 Maternal and Child Health Journal 77 (2004), www.springerlink.com/(baf1qf55lma12mnqiwgv13qi)/app/home/contribution.asp?referrer=parent&backto=issue,5,8;journal,9,38;linkingpublicationresults,1:105600,1; USDA, Economic Research Service, Effects of Food Assistance and Nutrition Programs on Nutrition and Health, Volumes 1-4, and Nutrition and Health Characteristics of Low-Income Populations, volumes 1-4, www.ers.usda.gov/Publications/fanrr19-1/. 8 4 www.fns.usda.gov/wic/ 85 E.g., The “School Breakfast Program [p]rovides nutritious breakfasts to promote learning readiness and healthy eating behaviors.” www.fns.usda.gov/cnd/Default.htm. 8 6”Some form of postsecondary career preparation has become essential to earning a family-sustaining income. Skill training can be accomplished through apprenticeship or employment with an employer committed to substantial incumbent training ; few will escape poverty or near-poverty in the future without setting foot on a substantial career ladder and following it upward.” S. Levitan et al., Programs in aid of the Poor at pp. 208-209 (Johns Hopkins Press, 8th ed., 2003). See generally chapters 5-6. “Poverty prevention is more dependent on education than on any other factor, as is escape from poverty.” Id. at p. 274.87 “Marriage is unlikely to occur or last without [affordable housing].” S. Levitan et al., Programs in aid of the Poor at p. 271 (Johns Hopkins Press, 8th ed., 2003).
18
Th
e
Ec
on
om
ic
s
of
P
ov
er
ty
T h e E c o n o m i c s o f P o v e r t y : H o w I n v e s t m e n t s t o E l i m i n a t e P o v e r t y B e n e f i t A l l A m e r i c a n s l J e r r o l d O p p e n h e i m a n d T h e o M a c G r e g o r T h e E c o n o m i c s o f P o v e r t y : H o w I n v e s t m e n t s t o E l i m i n a t e P o v e r t y B e n e f i t A l l A m e r i c a n s l J e r r o l d O p p e n h e i m a n d T h e o M a c G r e g o r T h e E c o n o m i c s o f P o v e r t y : H o w I n v e s t m e n t s t o E l i m i n a t e P o v e r t y B e n e f i t A l l A m e r i c a n s l J e r r o l d O p p e n h e i m a n d T h e o M a c G r e g o r
As anti-poverty expert Sar Levitan, late director of the George Washington University Center for Social
Policy Studies, summarized:
n “The evidence indicates that social programs that provide cash support, goods, and
services substantially reduce the number of poor individuals and significantly raise the
incomes of those remaining in poverty.”
n “These calculations leave out entirely the impact on the poverty rate of education and
training programs, child care programs, and other programs designed to enhance the
employability and earned income of the poor. The impact of such programs is more
indirect and more difficult to ascertain.”88
Levitan concludes with a call for “a renewed commitment to the goal of expanding earning capacity and
work opportunities for all Americans – a pursuit of assisted self-reliance.”89
As long ago as 1916, economists recognized that “a universal living wage is the only sound social
policy. It will not be denied by any intelligent person who considers seriously the influence of low wages in
diminishing the efficiency, physical, mental, and moral, of the workers; in increasing the volume of crime,
and the social cost of meeting it; in the immense social outlay for the relief of unnecessary poverty, sickness,
and other forms of distress; and in the formation of a large and discontented proletariat.”90
It is time for America to invest in eradicating poverty for the benefit of all Americans.
19
8 8 S. Levitan et al., Programs in aid of the Poor at p. 37, 38 (Johns Hopkins Press, 8th ed., 2003).8 9 Id. at p 291.9 0 John A. Ryan, Distributive Justice, pp. 376-377, The MacMillan Co., New York, 1916.
T h e E c o n o m i c s o f P o v e r t y : H o w I n v e s t m e n t s t o E l i m i n a t e P o v e r t y B e n e f i t A l l A m e r i c a n s l J e r r o l d O p p e n h e i m a n d T h e o M a c G r e g o r T h e E c o n o m i c s o f P o v e r t y : H o w I n v e s t m e n t s t o E l i m i n a t e P o v e r t y B e n e f i t A l l A m e r i c a n s l J e r r o l d O p p e n h e i m a n d T h e o M a c G r e g o rT
he
E
co
no
mi
cs
o
f
Po
ve
rt
yT
he
E
co
no
mi
cs
o
f
Po
ve
rt
y T h e E c o n o m i c s o f P o v e r t y : H o w I n v e s t m e n t s t o E l i m i n a t e P o v e r t y B e n e f i t A l l A m e r i c a n s l J e r r o l d O p p e n h e i m a n d T h e o M a c G r e g o r
The maximum investment needed to eradicate poverty in the United States is an amount that would
raise the income of every low-income household to the minimum income required to be a non-low-income
household. As explained in the text, there are investments that are more effective, as well as more cost-
effective, than cash transfers to eradicate poverty – such as education, job training, nutrition, housing, and
health care.91
Thus this calculation sets out the maximum annual investment needed to eradicate poverty. Notably,
costly as the investment is, it is considerably less than the annual benefit that it would achieve by reducing
the costs of crime, healthcare, unemployment and underemployment, and transfers and other current
investments in low-income families. These avoided costs are described in the text and summarized in
Appendix B.
This report accepted the US Department of Health and Human Services (HHS) definition of low-
income used by HHS to set the maximum income for eligibility to receive fuel assistance (Low Income
Home Energy Assistance Program, or LIHEAP) payments. This income is 60 percent of the median
household income (in each state).92 Other programs use higher incomes to define poverty – for example, the
US Department of Housing and Urban Development (HUD) uses 80 percent of local median income as a
standard for its housing programs.93 On the other hand, there are programs that use lower incomes to define
poverty – for example, the standard used by the US Department of Agriculture (USDA) for food stamp
eligibility is 130 percent of the Federal Poverty Line (FPL).94
At the bottom of the low-income standards is the discredited so-called Federal Poverty Line.95 This is
so broadly recognized as inadequate that it is usually used in the context of a multiple, such as 150 percent
or 200 percent of the FPL. For a family of three under 2005 FPL guidelines, 60 percent of median income
is roughly equivalent to 150 percent FPL.96 When first developed, the poverty line was calculated as three
times a minimally adequate food budget since food then represented a third of the average family budget.
Food now represents about a sixth of the average family budget, but the poverty line is still calculated as
three times a minimally adequate food budget. Thus the poverty line sank from 59 percent
91 S. Levitan et al., Programs in aid of the Poor at pp. 43, 262 et seq. (Johns Hopkins Press, 8th ed., 2003).92 “Section 2605(b)(2)(B) of Public Law 97-35 establishes 60 percent of a state’s median income as the maximum income allowed in determining income eligibility for LIHEAP, except in states where 150 percent of the poverty guidelines is higher.” HHS Division of Energy Assistance Office of Community Services memorandum, LIHEAP Information Memorandum Transmittal No. LIHEAP-IM-2005-7, dated 2/28/05, http://www.acf.dhhs.gov/programs/liheap/guidance/information_memoranda/im05-07.html. 93 E.g., housing rehabilitation loans. See http://brgov.com/dept/ocd/housing/loan.htm. 9 4 See http://www.fns.usda.gov/fsp/applicant_recipients/fs_Res_Ben_Elig.htm. 95 The 2005 HHS Poverty Guidelines (FPL) can be found at Federal Register, Vol. 70, No. 33, February 18, 2005, pp. 8373-8375.9 6 One reason the two standards are not strictly comparable is that the FPL is calculated to vary by family size while a percentage of median household income simply averages all households.
A p p e n d i x A : I n v e s t m e n t R e q u i r e d — t o B r i d g e T h e I n c o m e G a p
20
Th
e
Ec
on
om
ic
s
of
P
ov
er
ty
T h e E c o n o m i c s o f P o v e r t y : H o w I n v e s t m e n t s t o E l i m i n a t e P o v e r t y B e n e f i t A l l A m e r i c a n s l J e r r o l d O p p e n h e i m a n d T h e o M a c G r e g o r T h e E c o n o m i c s o f P o v e r t y : H o w I n v e s t m e n t s t o E l i m i n a t e P o v e r t y B e n e f i t A l l A m e r i c a n s l J e r r o l d O p p e n h e i m a n d T h e o M a c G r e g o r T h e E c o n o m i c s o f P o v e r t y : H o w I n v e s t m e n t s t o E l i m i n a t e P o v e r t y B e n e f i t A l l A m e r i c a n s l J e r r o l d O p p e n h e i m a n d T h e o M a c G r e g o r
of median income of married-couple families to 33 percent. Adjusting the poverty line for this one item
(fraction of budget devoted to food) would raise the family-of-four poverty line (in 1994) from $15,100 to
$26,000.97 The actual fraction of Americans in poverty, as would have originally been computed, has risen
50% from 1970, from 17% to 25%.98
At the other end of the spectrum is the self-sufficiency income standard.99 These are very detailed
calculations, usually done on a county-by-county, state-by-state basis that take into account actual
expenditures necessary to live a basic life in various family configurations. Bare bones budgets for a working
family are calculated to include housing, child care, food, transportation, health care, clothing, household
items, and taxes – no recreation, entertainment, or savings.100 In particularly costly locales, such as along
the two ocean coasts, self-sufficiency incomes can be as high as a state’s median income, as, for example, in
Boston.101 However, even in Atlanta, the self-sufficiency requirement for such a family is 90 percent of the
state’s median income.103 Before Katrina, in Harrison County (outside Biloxi) and Hinds County, Mississippi,
84 percent of state median income was required for basic self-sufficiency;104 in Jefferson Parish, Louisiana,
91 percent.105
The 2000 Census includes detailed reports of 1999 household income. Median income in the United
States was $41,994,106 60 percent of which is $25,196. (By 2004, median income had risen to $44,000,
60 percent of which is $26,640.) By analyzing and interpolating from the published data, the median income
97 J. Schwarz, “The Hidden Side of the Clinton Economy,” The Atlantic Monthly at 18, 20 (October 1998). See also K. Porter, “Proposed Changes in The Official Measure of Poverty” (Center on Budget and Policy Priorities 1999).98 J. Schwarz, id.9 9 See generally http://www.sixstrategies.org/includes/productlistinclude.cfm?strProductType=resource&searchType=type&strType=self-sufficiency%20standard. 10 0 E.g., D. Pearce and J. Brooks, “The Self-Sufficiency Standard for Georgia” (Women’s Policy Group, 2002).101 Self-sufficiency income required for a single parent with two children in Boston is $51,284. D. Pearce and J. Brooks, “The Self-Sufficiency Standard for Massachusetts” (Women’s Educational and Industrial Union, 2003). Massachusetts state median income in 1999 was $50,502. http://quickfacts.census.gov/qfd/states/25000.html. 102 Self-sufficiency income required for a single parent with two children in Atlanta is $37,982. D. Pearce and J. Brooks, “The Self-Sufficiency Standard for Massachusetts” (Women’s Educational and Industrial Union, 2003). Georgia median income in 1999 was $42,433. http://quickfacts.census.gov/qfd/states/13000.html.103 Self-sufficiency income required for a single parent with two children in metropolitan counties of Iowa is $28,600. J. L.Flora et al., “Iowa Self-Sufficiency Wages” (The Iowa Policy Project, 2004). Iowa median income in 1999 was $39,469. http://quickfacts.census.gov/qfd/states/19000.html. 10 4 Self-sufficiency income required for a single parent with two children in Harrison or Hinds County was $26,472 or $26,222, respectively. D. Pearce and J. Brooks, “The Self-Sufficiency Standard for Mississippi” (Enterprise Corp. of the Delta, 2003). Mississippi median income in 1999 was $31,300. http://quickfacts.census.gov/qfd/states/28000.html105 Self-sufficiency income required for a single parent with two children in Jefferson Parish was $29,797. D. Pearce and J. Brooks, “The Self-Sufficiency Standard for Louisiana” (Agenda for Children, 2003). Louisiana median income in 1999 was $32,566. http://quickfacts.census.gov/qfd/states/22000.html.10 6 http://quickfacts.census.gov/qfd/states/00000.html.
21
T h e E c o n o m i c s o f P o v e r t y : H o w I n v e s t m e n t s t o E l i m i n a t e P o v e r t y B e n e f i t A l l A m e r i c a n s l J e r r o l d O p p e n h e i m a n d T h e o M a c G r e g o r T h e E c o n o m i c s o f P o v e r t y : H o w I n v e s t m e n t s t o E l i m i n a t e P o v e r t y B e n e f i t A l l A m e r i c a n s l J e r r o l d O p p e n h e i m a n d T h e o M a c G r e g o rT
he
E
co
no
mi
cs
o
f
Po
ve
rt
yT
he
E
co
no
mi
cs
o
f
Po
ve
rt
y T h e E c o n o m i c s o f P o v e r t y : H o w I n v e s t m e n t s t o E l i m i n a t e P o v e r t y B e n e f i t A l l A m e r i c a n s l J e r r o l d O p p e n h e i m a n d T h e o M a c G r e g o r
of the 30,262,220 low-income households so defined (28.7 percent of all households) was determined to be
$13,802. Updating yields estimates of 32,974,198 low-income households with a median income of $14,593.
(Similarly, the median income of the 75,235,804 non-low-income households was $56,997. Updating yields an
estimated 82,026,714 non-low-income households with a median income of $60,262.)
A cash payment to every low-income household to bring all to the brink of escaping poverty would
require, on average, a payment to each of the 33 million households an amount equal to the difference
between the current low-income median income and the minimum income to escape poverty as here
defined, i.e., 60 percent of median household income ($26,640). This difference is $12,047 per low-income
household, or $397.2 billion per year.
As shown in Appendix B, this cost, while significant, would avoid costs that are almost four times larger.
In other words, an investment of enough to bring every low-income household out of poverty would have a
benefit:cost ratio of 3.75.
22
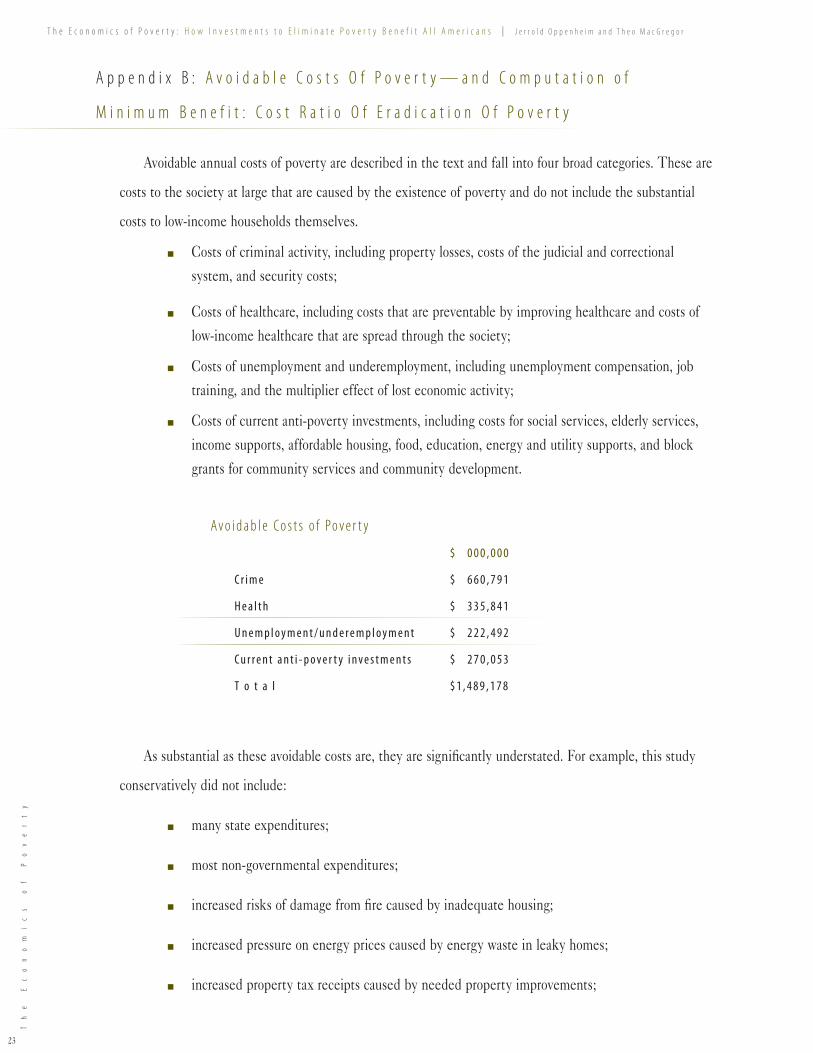
Th
e
Ec
on
om
ic
s
of
P
ov
er
ty
T h e E c o n o m i c s o f P o v e r t y : H o w I n v e s t m e n t s t o E l i m i n a t e P o v e r t y B e n e f i t A l l A m e r i c a n s l J e r r o l d O p p e n h e i m a n d T h e o M a c G r e g o r T h e E c o n o m i c s o f P o v e r t y : H o w I n v e s t m e n t s t o E l i m i n a t e P o v e r t y B e n e f i t A l l A m e r i c a n s l J e r r o l d O p p e n h e i m a n d T h e o M a c G r e g o r T h e E c o n o m i c s o f P o v e r t y : H o w I n v e s t m e n t s t o E l i m i n a t e P o v e r t y B e n e f i t A l l A m e r i c a n s l J e r r o l d O p p e n h e i m a n d T h e o M a c G r e g o r
Avoidable annual costs of poverty are described in the text and fall into four broad categories. These are
costs to the society at large that are caused by the existence of poverty and do not include the substantial
costs to low-income households themselves.
n Costs of criminal activity, including property losses, costs of the judicial and correctional
system, and security costs;
n Costs of healthcare, including costs that are preventable by improving healthcare and costs of
low-income healthcare that are spread through the society;
n Costs of unemployment and underemployment, including unemployment compensation, job
training, and the multiplier effect of lost economic activity;
n Costs of current anti-poverty investments, including costs for social services, elderly services,
income supports, affordable housing, food, education, energy and utility supports, and block
grants for community services and community development.
As substantial as these avoidable costs are, they are significantly understated. For example, this study
conservatively did not include:
n many state expenditures;
n most non-governmental expenditures;
n increased risks of damage from fire caused by inadequate housing;
n increased pressure on energy prices caused by energy waste in leaky homes;
n increased property tax receipts caused by needed property improvements;
23
A p p e n d i x B : A v o i d a b l e C o s t s O f P o v e r t y — a n d C o m p u t a t i o n o f
M i n i m u m B e n e f i t : C o s t R a t i o O f E r a d i c a t i o n O f P o v e r t y
Av o i d a b l e Co s t s o f Po v e r t y
$ 0 0 0 , 0 0 0
C r i m e $ 6 6 0 , 7 9 1
H e a l t h $ 3 3 5 , 8 4 1
U n e m p l o y m e n t / u n d e r e m p l o y m e n t $ 2 2 2 , 4 9 2
C u r r e n t a n t i - p o v e r t y i n v e s t m e n t s $ 2 7 0 , 0 5 3
T o t a l $ 1 , 4 8 9 , 1 7 8
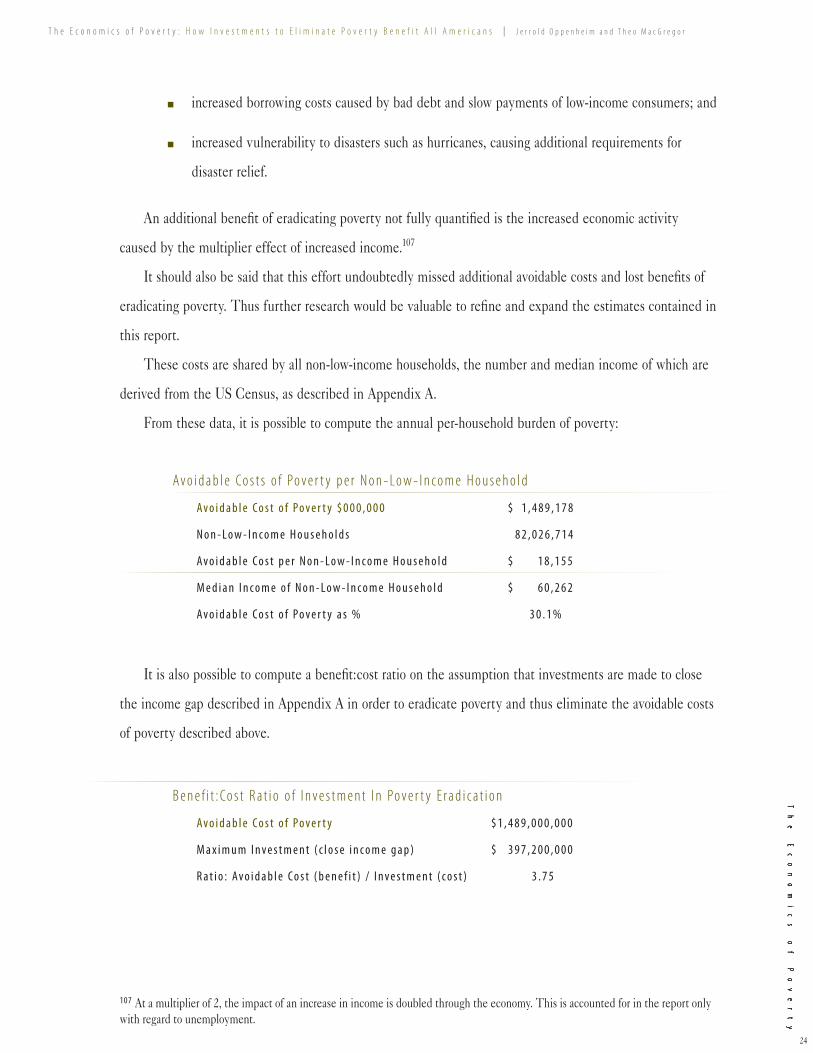
T h e E c o n o m i c s o f P o v e r t y : H o w I n v e s t m e n t s t o E l i m i n a t e P o v e r t y B e n e f i t A l l A m e r i c a n s l J e r r o l d O p p e n h e i m a n d T h e o M a c G r e g o r T h e E c o n o m i c s o f P o v e r t y : H o w I n v e s t m e n t s t o E l i m i n a t e P o v e r t y B e n e f i t A l l A m e r i c a n s l J e r r o l d O p p e n h e i m a n d T h e o M a c G r e g o rT
he
E
co
no
mi
cs
o
f
Po
ve
rt
yT
he
E
co
no
mi
cs
o
f
Po
ve
rt
y T h e E c o n o m i c s o f P o v e r t y : H o w I n v e s t m e n t s t o E l i m i n a t e P o v e r t y B e n e f i t A l l A m e r i c a n s l J e r r o l d O p p e n h e i m a n d T h e o M a c G r e g o r
n increased borrowing costs caused by bad debt and slow payments of low-income consumers; and
n increased vulnerability to disasters such as hurricanes, causing additional requirements for
disaster relief.
An additional benefit of eradicating poverty not fully quantified is the increased economic activity
caused by the multiplier effect of increased income.107
It should also be said that this effort undoubtedly missed additional avoidable costs and lost benefits of
eradicating poverty. Thus further research would be valuable to refine and expand the estimates contained in
this report.
These costs are shared by all non-low-income households, the number and median income of which are
derived from the US Census, as described in Appendix A.
From these data, it is possible to compute the annual per-household burden of poverty:
It is also possible to compute a benefit:cost ratio on the assumption that investments are made to close
the income gap described in Appendix A in order to eradicate poverty and thus eliminate the avoidable costs
of poverty described above.
24
107 At a multiplier of 2, the impact of an increase in income is doubled through the economy. This is accounted for in the report only with regard to unemployment.
Th
e
Ec
on
om
ic
s
of
P
ov
er
ty
Th
e
Ec
on
om
ic
s
of
P
ov
er
ty
Av o i d a b l e Co s t s o f Po v e r t y p e r N o n - Lo w - I n c o m e H o u s e h o l d
Av o i d a b l e C o s t o f Po v e r t y $ 0 0 0 , 0 0 0 $ 1 , 4 8 9 , 1 7 8
N o n - L o w - I n c o m e H o u s e h o l d s 8 2 , 0 2 6 , 7 1 4
Av o i d a b l e C o s t p e r N o n - L o w - I n c o m e H o u s e h o l d $ 1 8 , 1 5 5
M e d i a n I n c o m e o f N o n - L o w - I n c o m e H o u s e h o l d $ 6 0 , 2 6 2
Av o i d a b l e C o s t o f Po v e r t y a s % 3 0 . 1 %
B e n e f i t : Co s t R a t i o o f I n v e s t m e n t I n Po v e r t y E r a d i c a t i o n
Av o i d a b l e C o s t o f Po v e r t y $ 1 , 4 8 9 , 0 0 0 , 0 0 0
M a x i m u m I n v e s t m e n t ( c l o s e i n c o m e g a p ) $ 3 9 7 , 2 0 0 , 0 0 0
R a t i o : Av o i d a b l e C o s t ( b e n e f i t ) / I n v e s t m e n t ( c o s t ) 3 . 7 5

w w w . e n t e r g y . c o m
1 - 8 0 0 - e n t e r g y