t. h. r. j. - repository home
TRANSCRIPT

EVALUATION OF SAPROLITE FOR ON-SITE WASTEWATER DISPOSAL
Aziz Amoozegar, Michael T. Hoover, H. Joseph Kleiss Will iam R. Guertal and J. Edward Surbrugg
Soi 1 Science Department Agricultural Research Service
College of Agriculture and Life Sciences North Carolina State University
Raleigh, North Carol ina 27695-7619
The contents of this report were developed under a grant from the Department of the Interior, U.S. Geological Survey. However, those contents do not necessarily represent the policy of that agency, and should not assume endorsement by the Federal Government.
Supported by the U.S. Geological Survey, Department of the Interior, under award number 14-08-0001-61633.
Also, the use of trade names does not imply endorsement by the College of Agriculture and Life Sciences, North Carolina State University, of the products named nor criticism of similar ones not mentioned.
Agreement No. 14-08-0001-61633
WRRI Project Number 20154

ACKNOWLEDGMENT
T h i s p r o j e c t b e n e f i t t e d f rom t h e ass is ' tance and c o o p e r a t i o n o f many i n d i v i d u a l s and o rgan i za t i ons . We would l i k e t o ex tend o u r s i n c e r e a p p r e c i a t i o n t o a l l o f them, e s p e c i a l l y t o those w i t h t h e l o c a l H e a l t h Departments, County Centers o f t h e 'Nor th Caro l i n a Coopera t i ve Ex tens ion Serv ice , and p r i v a t e c i t i z e n s o r o r g a n i z a t i o n s who he lped us l o c a t e s i t e s and/or a l lowed t h e use o f t h e i r p r o p e r t i e s f o r research. To name a few, w e t hank t h e s t a f f o f t h e N o r t h C a r o l i n a D i v i s i o n o f Env i ronmenta l H e a l t h and t h e D i v i s i o n o f Soi 1 and Water Conservat ion, espec i a1 l y Steve S t e i nbeck, Steven Berkowi tz , A1 S lag le , K a r l Shafer, and Dav id Kn igh t . We a p p r e c i a t e t h e coope ra t i on o f t h e USDA, S o i l Conservat ion Se rv i ce s t a f f , and would l i k e t o e s p e c i a l l y thank M r . Horace Smith f o r a l l o w i n g h i s s t a f f t o h e l p us w i t h ou r tasks . Many i n d i v i d u a l s f rom va r i ous coun ty o f f i c e s were i n s t r u m e n t a l i n t h i s p r o j e c t and we apo log ize f o r n o t ment ion ing a l l o f them. To ex tend o u r g r e a t e s t a p p r e c i a t i o n s t o a l l these i n d i v i d u a l s , we ment ion C a r l C a r r o l and L a r r y Whi tt f rom Caswell County, Jimmy C o l l i n s f rom Chatham County, Mike Thompson f rom Cherokee County, Sammy Buchanan f rom Jackson County, Cindy K i n s l and and Speed Davis f r om Macon County, B i l l Mar l i n f r om Mecklenburg County, Jimmy Clayton, Randy B a r n e t t and Derek Day f r om Person County, and E v e r e t t Lynn f rom Wake County. P r i v a t e i n d i v i d u a l s who cooperated w i t h us were S tan ley Hofme is te r and Dennis Osborne f rom N o r t h S t a t e U t i l i t i e s , Kev in M a r t i n f r om S o i l s and Environmental Consul tants , t h e owners and managers o f t h e rest-home i n Chatham County and t h e commercial c e n t e r i n Macon County, t h e homeowners i n Kn igh tda le and Macon Count ies, and a l l o t h e r p r o p e r t y owners who a l lowed us t h e use o f t h e i r l a n d and t o l e r a t e d ou r f r e q u e n t s i t e v i s i t s .
As f a c u l t y and graduate s tuden ts conduc t ing t h i s research, we a re indeb ted t o t h e e f f o r t and d e d i c a t i o n o f t h e s t a f f and s t u d e n t a s s i s t a n t s th roughout t h e p r o j e c t . F l oyd Wh i t l ey was w i t h t h i s p r o j e c t f o r about t h r e e years and was i ns t rumen ta l i n t h e success fu l comple t ion o f f i e l d e v a l u a t i o n s and sampl ing t asks r e p o r t e d i n t h i s document. We g r e a t l y a p p r e c i a t e h i s d e d i c a t i o n t o t h e p r o j e c t b o t h i n t h e f i e l d and l a b o r a t o r y . Ma rc i a McKenna j o i n e d us i n t h e m idd le o f t h e p r o j e c t and we thank h e r f o r h e r ha rd work i n comple t ing t h e chemical analyses. Chester Cobb a s s i s t e d us w i t h t h e f i e l d s t u d i e s th roughout t h e p r o j e c t and we app rec ia te h i s c o n t r i b u t i o n s . We a l s o thank Barbara Pitman, who was i n i t i a l l y w i t h t h e p r o j e c t and i n i t i a t e d t h e chemical analyses o f t h e samples and he lped w i t h f i e l d sampl ing e f f o r t s . Our a p p r e c i a t i o n s a re extended t o Dr. Mike Vepraskas and John W i l l iams f rom t h e Soi 1 Science Department f o r t h e i r coope ra t i on i n c h a r a c t e r i z i n g s o i 1 and s a p r o l i t e a t one s i t e i n Randolph County. Others i n t h e S o i l Science Department t h a t a l lowed us t h e use o f t h e i r l a b o r a t o r y f a c i l i t i e s and p rov ided t e c h n i c a l suppor t were f a c u l t y members Drs. Stan Buol, K e i t h Cassel, Ray Dan ie l s, Wendel 1 G i 11 i am, Wayne Robarge, and S t e r l i n g Weed; and s t a f f members Fred Avere t te , B e t t y Ayers, Ber tha Crabt ree, E l 1 i s Edwards, Be th Haines, Roberta M i 11 er-Haraway, B a r r e t t Richards, Tim Shack1 e fo rd , and Beve r l y Tay l o r . The s e c r e t a r i a l and suppor t s t a f f , G a i l Regan, Denise Sur les , Dianne Poole, Caro lyn Bal i c k i e , She1 i a F isher , and V i c k i e Wal t o n made t h e non techn i ca l aspects o f ou r p r o j e c t easy f o r us and we thank them g r e a t l y . We would a l s o
iii

l i k e t o thank Dr . Eugene Kamprath, t h e Head o f the S o i l Science Department, who provided admin is t ra t ive and f i n a n c i a l support throughout t h e p r o j e c t . We c e r t a i n l y thank t h e s t a f f o f the water Resources ~ e s e a r c h I n s t i t u t e f o r t h e i r assistance and understanding dur ing t h e p r o j e c t .

ABSTRACT
Approximately 55% of the land in North Carolina is located in the Piedmont and Mountain regions, and over 50% of the people 1 iving in the state rely on on-site wastewater disposal systems for management of their household wastewater. A common characteristic of the soils in these two regions is the presence of saprolite at or near the surface. At present, certain saprolites are permitted for installation of septic systems. The rules and regulations for the use of saprol ite for septic systems, however, are based less on scientific knowledge and more on the personal experience of those involved with the use of septic systems for on-site management of wastewater.
A comprehensive study was undertaken to assess various physical, chemical, and morphological properties of twelve different soi 1 s and saprol ites; and to study the performance of five septic systems in the Piedmont and Mountain regions of the state. To evaluate soil and saprolite properties, a large observation pit was dug at each site and soil and saprol i te morphological properties were evaluated on the pit wall s. Bul k samples were then coll ected from individual horizons for 1 aboratory analyses. In the laboratory, these samples were analyzed for pH, electrical conductivity (EC), cation exchange capacity (CEC), attenuation capacity for a number of chemicals, and particle size distribution. Intact core samples were also obtained from various depths (or horizons) from around the observation pit for determination of saturated hydraul ic conductivity (K,,,) , water retention, and bulk density measurements. In addition, in situ K,,, was measured at various depths/locations at each site. At two of the sites, the mineralogy of clay and sand-sized particles, distribution of various types of pores, root distribution in the profile, and the possi bil ity of preferential movement of water and solutes were also determined by x-ray diffraction analysis, thin section evaluation, direct root count, and a field solute/dye displacement experiment, respectively. To study the septic systems, soil water content and potential inside and outside the drainfield areas of the systems were monitored by neutron thermal ization and tensiometry for more than one year. Soil and saprolite samples were also collected fro: various depths and locations inside and outside the drainfield area of each system and analyzed for pH, EC, NH,-N, Ca, K, Na, Mg, NO,-N and C1 content.
For the majority of the sites studied, K,,, decreased from top of the Bt to a minimum value in the lower part of the Bt or within the transitional (BC or B/C) horizon. Hydraulic conductivity then increased with depth within the saprolite. For some sites, the minimum K,,, occurred in the upper part of the Bt horizon. Only at one site the average K,,, values for the cores indicated a continuous decrease from the Bt into saprolite. Saprolite also showed appreciable capacity for holding water at saturation. However, the majority of the pores in saprolite are greater than 0.003 mm in diameter. Lower bulk density of saprol ite contributes to higher porosity and a greater capacity for holding water at saturation than expected for soil materials with the same texture as saprol ite. Most of the soils and saprol ites at our study sites had relatively low CEC. This indicates that the clay minerals in the Bt at the

sites are of the 1:l clay type with low cation exchange capacity. Although for most sites the CEC of saprol ite was lower than the CEC of the Bt, the apparent CEC, i .e., CEC calculated based on the clay content, was substantially higher than the apparent CEC for the soil materials. We believe the sand- and silt-sized particles in saprolite have substantial capacity for adsorbing cations. Generally, the boundaries between various soil and saprol ite horizons were not uniform. This non uniformity makes it difficult to identify the boundaries between soil and saprolite by evaluating the materials obtained from a hand-dug auger hole. Examination of the materials removed by hand boring a hole using an auger may not reveal the true identity of the materials due to crushing and mixing. Destruction of the natural structure of the transitional horizon(s) between the Bt and saprol i te may cause both incorrect interpretation of the material and horizon class designation. To identify the morphological properties of soil and saprol i te, a large observation pit must be used.
Lower concentrations of some chemicals in soil and saprolite under the drainfield areas of the septic systems are related to leaching of the solutes by the applied wastewater. In one of the septic systems studied, higher concentrations of solutes were observed under the drainfield. Higher concentrations of chemicals in wastewater, low hydraul ic conductivity, 1 ack of uniform distribution of wastewater over the entire drainfield area, and lack I
of management were the reasons for the presence of perched water in the drainfield area of this system. Overall, the septic systems installed in soils above saprolite, or in saprolite, appeared to be working properly for disposing wastewater. We did not directly evaluate the treatment capacity of the soils and saprol ite at any of the sites. Pretreatment of wastewater could be used for areas where soil solum and saprolite are not capable o f providing treatment, but have adequate hydraul ic properties for the disposal of treated effluent .

TABLE OF CONTENTS
. . . . . . . . . . . . . . . . . . . . . . . . . . . . . ACKNOWLEDGEMENT iii
ABSTRACT . . . . . . . . . . . . . . . . . . . . . . . . . . . . . O . . . v
. . . . . . . . . . . . . . . . . . . . . . . . . . . . . . LIST OF FIGURES i x
. . . . . . . . . . . . . . . . . . . . . . . . . . . . . . LIST OF TABLES xv
. . . . . . . . . . . . . . . . . . . . . . . . SUMMARYANDCONCLUSIONS x x i i i
. . . . . . . . . . . . . . . . . . . . . . . . . . . . RECOMMENDATIONS x x v i i
INTRODUCTION 1 . . . . . . . . . . . . . . . . . . . . . . . . . . . . . . SepticSystemsinNorthCarolina . . . . . . . . . . . . . . . . . 1
. . . . . . . . . . . . . S a p r o l i t e Development and C h a r a c t e r i s t i c 3 Ob jec t i ves 5 . . . . . . . . . . . . . . . . . . . . . . . . . . . .
. . . . . . . . . . . . . . . . . . . . . . . . . MATERIALS AND METHODS . . . . . . . . . . . . Charac te r i za t i on o f S o i l and S a p r o l i t e . . . . . . . . . . . . Sample C o l l e c t i o n and Prepara t ion . . . . . . . . . . . . Satura ted Hydraul i c Conduc t i v i t y . . . . . . . . . . . . . . . . . . S o i l Water Retent ion
B u l k D e n s i t y . . . . . . . . . . . . . . . . . . . . . . . P a r t i c l e S ize D i s t r i b u t i o n and Chemical Analyses
. . . . . . . . In S i t u Satura ted Hydraul i c Conduc t i v i t y . . . . . . . . . . . . . . . . . . . . . Other Analyses . . . . . . . . . . . . . . . . . . . . . . . B a t c h s t u d y
. . . . . . . . . . . . . . . . . Eva lua t ion o f Sep t i c Systems
. . . . . . . . . . . . . . . . . Nor th Wake County S i t e Mon i to r i ng S o i l Water and Charac te r i z i ng S o i l and . . . . . . . . . . . . . . . . . . S a p r o l i t e Assessment o f Solute Distribution Under the System . . . . . . . . . . . . . . . . . . . . . Kn igh tda le S i t e
. . . . . . . . . . . . . . . . . . . Chatham County S i t e . . . . . . . . . . . . . . . . . . . Macon County S i t e s . . . . . . . . . . . . . . . . . Cornrnerci a1 Center Res iden t i a l Dwe l l i ng . . . . . . . . . . . . . . .
. . . . . . . . . . . . . . . . . . . . . . . . . RESULTS AND DISCUSSION 35 . . . . . . . . . . . . . . Charac te r i za t i on o f S o i l and S a p r o l i t e 35
PiedmontRegion . . . . . . . . . . . . . . . . . . . . . . . . . . 35 . . . . . . . . . . . . . . . . . . . . . . . . S i t e Number 1 35 . . . . . . . . . . . . . . . . . . . . . . . . S i t e Number 2 43 . . . . . . . . . . . . . . . . . . . . . . . . S i t e Number 3 49 . . . . . . . . . . . . . . . . . . . . . . . . S i t e Number 4 56 . . . . . . . . . . . . . . . . . . . . . . . . S i t e Number 5 62 . . . . . . . . . . . . . . . . . . . . . . . . S i t e Number 6 69

. . . . . . . . . . . . . . . . . . . . . . . . S i t e Number 7 77 S i t e N u m b e r 8 . . . . . . . . . . . . . . . . . . . . . . . . 89
Mounta in Region . . . . . . . . . . . . . . . . . . . . . . . . . . 100 S i t e Number 9 . . . . . . . . . . . . . . . . . . . . . . . . 100 S i t e Number 10 . . . . . . . . . . . . . . . . . . . . . . . 106 S i t e Number 11 . . . . . . . . . . . . . . . . . . . . . . . 112 S i t e Number 12 . . . . . . . . . . . . . . . . . . . . . . . 116
B a t c h s t u d y . . . . . . . . . . . . . . . . . . . . . . . . . . . . 122 E v a l u a t i o n o f S e p t i c Systems . . . . . . . . . . . . . . . . . . . 124
Piedmont Region . . . . . . . . . . . . . . . . . . . . . . . 124 General S o i l C h a r a c t e r i s t i c s . . . . . . . . . . . . . 124
. . . . . S o i l and S a p r o l i t e H y d r a u l i c C h a r a c t e r i s t i c s 127 . . . . . . . . . . . . E v a l u a t i o n o f S o i l Water Regime 134 D i s t r i b u t i o n o f So lu tes i n S o i l and S a p r o l i t e Under t h e
D r a i n f i e l ds . . . . . . . . . . . . . . . . . . . 147 . . . . . . . . D i s t r i b u t i o n o f C h e m i c a l s a t N W a k e S i t e 152 . . . . . D i s t r i b u t i o n o f Chemicals a t Kn igh tda le S i t e 156 . . . D i s t r i b u t i o n o f Chemicals a t Chatham County S i t e 160
Mounta in Region . . . . . . . . . . . . . . . . . . . . . . . 162 S o i l Water Content . . . . . . . . . . . . . . . . . . 162
. . . . . D i s t r i b u t i o n o f So lu tes Under t h e D r a i n f i e l d s 165
GUIDELINES FOR USE AND EVALUATION OF SAPROLITE FOR WASTEWATER DISPOSAL . . . . . . . . . . . . . . . . . . . . . . 173
REFERENCES . . . . . . . . . . . . . . . . . . . . . . . . . . . . . . . 177
Figure
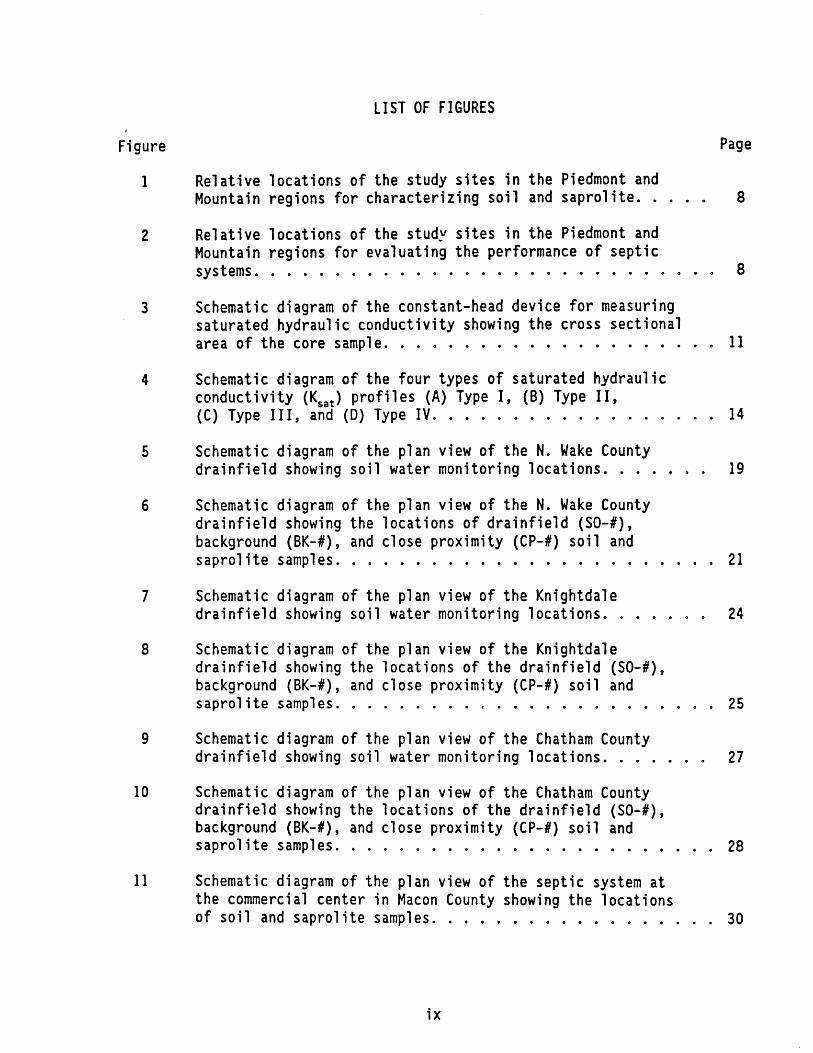
LIST OF FIGURES
Page
Relative locations of the study sites in the Piedmont and . . . . Mountain regions for characterizing soil and saprolite. 8
Relative locations of the study sites in the Piedmont and Mountain reg1 ons for eval uating the performance of septic
. . . . . . . . . . . . . . . . . . . . . . . . . . . . . systems 8
Schematic diagram of the constant-head device for measuring saturated hydraul ic conductivity showing the cross sectional . . . . . . . . . . . . . . . . . . . . area of the core sample. 11
Schematic diagram of the four types of saturated hydraulic conductivity (K,,,) profiles (A) Type I, (B) Type 11,
. . . . . . . . . . . . . . . . . (C) Type 111, and (D)Type IV. 14
Schematic diagram of the plan view of the N. Wake County drainfield showing soil water monitoring locations. . . . . . . 19 Schematic diagram of the plan view of the N. Wake County drainfield showing the 1 ocations of drainfield (SO-#), background (BK-#), and close proximity (CP-#) soil and
. . . . . . . . . . . . . . . . . . . . . . . saprolite samples. 21
Schematic diagram of the plan view of the Knightdale . . . . . . drainfield showing soil water monitoring locations. 24
Schematic diagram of the plan view of the Knightdale drainfield showing the locations of the drainfield (SO-#), background (BK-#), and close proximity (CP-#) soil and saprolite samples. . . . . . . . . . . . . . . . . . . . . . . . 25 Schematic diagram of the plan view of the Chatham County
. . . . . . drainfield showing soil water monitoring locations. 27
Schematic diagram of the plan view of the Chatham County drainfield showing the locations of the drainf ield (SO-#), background (BK-#), and close proximity (CP-#) soil and saprolite samples. . . . . . . . . . . . . . . . . . . . . . . . 28 Schematic diagram of the plan view of the septic system at the commercial center in Macon County showing the locations of soil and saprol ite samples. . . . . . . . . . . . . . . . . . 30

Schematic diagram of the plan view of the septic system at the comercial center in Macon County showing soil water monitoring locations. . . . . . . . . . . . . . . . . . . . . . 31 Schematic diagram of the septic system at the residenti a1 dwelling in Macon County showing the locations of soil and saprol ite samples. . . . . . . . . . . . . . . . . . . . . . . . . 32 Schematic diagram of the plan view of the septic system at the residenti a1 dwell ing in Macon County showing soi 1 water monitoring locations. . . . . . . . . . . . . . . . . . . . . . 33 In si tu and 1 aboratory determined saturated hydraul ic conductivity (K,,,) of the Enon soil at Site Number 1 in the Piedmont region. . . . . . . . . . . . . . . . . . . . . . . 39 In situ and laboratory determined saturated hydraulic conductivity (K,,) of the Vance soil at Site Number 2 in the Piedmontreglon. . . . . . . . . . . . . . . . . . . . . . . 47 In situ and laboratory determined saturated hydraulic conductivity (K,,,) of the Wil kes soil at Site Number 3 in the Piedmont region. . . . . . . . . . . . . . . . . . . . . . . 54 In si tu and 1 aboratory determined saturated hydraul ic conductivity (K,,,) of the Appl ing soil at Site Number 4 in the Piedmont region. . . . . . . . . . . . . . . . . . . . . . . 62 In si tu and 1 aboratory determined saturated hydraul i c conductivity (K,,,) of the Mecklenburg soil at Site Number 5 in the Piedmont region. . . . . . . . . . . . . . . . . . . . . 67 In situ and laboratory determined saturated hydraulic conductivity (K,,,) of the Pacolet soil at Site Number 6 in the Piedmont region. . . . . . . . . . . . . . . . . . . . . . . 74 In situ and laboratory determined saturated hydraulic conductivity (K,,,) of the Enon taxadjunct soil at Site Number 7 in the Piedmont region. . . . . . . . . . . . . . . . . 82 Computer generated unsaturated hydraul ic conductivity (K,,,) for various soil water pressure heads (negative val ues) for SiteNumber7 . . . . . . . . . . . . . . . . . . . . . . . . . . 86 In situ and laboratory determined saturated hydraulic conductivity (K,,,) of the Mecklenburg taxadjunct soil at Site Number 8 in the Piedmont region. . . . . . . . . . . . . . . . . 96

Computer generated unsa tu ra ted hydrau l i c c o n d u c t i v i t y (La,) f o r v a r i o u s s o i l wa te r p ressure heads (nega t i ve va lues) f o r . . . . . . . . . . . . . . . . . . . . . . . . . S i t e Number 8. 98
I n s i t u and l a b o r a t o r y determined s a t u r a t e d h y d r a u l i c c o n d u c t i v i t y (K,,,) o f t h e H a y e s v i l l e s o i l a t S i t e Number 9 . . . . . . . . . . . . . . . . . . . . i n t h e Mounta in reg ion . 103
I n s i t u and 1 abo ra to r y determined s a t u r a t e d hyd rau l i c c o n d u c t i v i t y (K,,:) o f t h e Watauga s o i l a t S i t e Number 10 i n . . . . . . . . . . . . . . . . . . . . . t h e M o u n t a i n r e g l o n . . l o 9
I n s i t u s a t u r a t e d h y d r a u l i c c o n d u c t i v i t y (K,,,) o f t h e . . . . Chandler s o i l a t S i t e Number 11 i n t h e Mounta in r e g i o n . 115
I n s i t u and 1 abora to ry determined s a t u r a t e d hyd rau l i c c o n d u c t i v i t y (K,,,) o f t h e Junaluska s o i l a t S i t e Number 12
. . . . . . . . . . . . . . . . . . . . i n t h e Mountain reg ion . 119
Labo ra to r y determined s a t u r a t e d hydrau l i c c o n d u c t i v i t y (K,,,) . . . . . . . . . o f t h e s o i l and s a p r o l i t e a t t h e N. Wake s i t e . 129
Labo ra to r y determined s a t u r a t e d h y d r a u l i c c o n d u c t i v i t y (K,,,) o f t h e s o i l and s a p r o l i t e a t t h e Kn igh tda le s i t e . . . . . . . . 130
S o i l wa te r r e t e n t i o n curves, averaged by ho r i zon , f o r (A) N. Wake s i t e and (B) Kn igh tda le s i t e . . . . . . . . . . . . 132
A r i t h m e t i c average s a t u r a t e d hydrau l i c c o n d u c t i v i t y (K,,,) i n cm/d f o r Bt , BC, and C ho r i zons p l o t t e d by t e x t u r a l c l ass . Labo ra to r y determined va lues a r e used f o r t h e N. Wake and K n i g h t d a l e s i t e s , and i n s i t u va lues a re used f o r t h e Chatham County s i t e . . . . . . . . . . . . . . . . . . . . . . . I 3 3
Month ly p r e c i p i t a t i o n measured a t t h e N. Wake County s i t e , f r om N o r t h Caro l i n a S t a t e U n i v e r s i t y (NCSU) , and 30-year average f o r Ra le igh , NC, f rom t h e Na t i ona l Weather S e r v i c e (NUS). . . . 134
S o i l wa te r con ten ts a t t h r e e l o c a t i o n s i n s i d e (NP-1, NP-2 and NP-3) and one l o c a t i o n o u t s i d e (NP-7) t h e d r a i n f i e l d f o r f o u r depths ove r a 22-month p e r i o d a t t h e N. Wake s i t e . . . . I 3 6
S o i l wa te r con ten ts a t t h r e e l o c a t i o n s i n s i d e (NP-11, NP-12 and NP-15) and one l o c a t i o n o u t s i d e (NP-16) t h e d r a i n f i e l d f o r f o u r depths over a 12-month p e r i o d a t t h e K n i g h t d a l e s i t e . . 137
S o i l wa te r con ten ts a t t h r e e l o c a t i o n s i n s i d e (NP-22, NP-25 and NP-26) and one l o c a t i o n o u t s i d e (NP-27) t h e d r a i n f i e l d f o r f o u r depths over a 12-month p e r i o d a t t h e Chatham County s i t e . . 138

Comparison o f v o l ume t r i c s o i 1 wa te r con ten t measurements u s i n g TDR and neu t ron thermal i z a t i o n techn iques f o r two dep ths ove r a Cmon th p e r i o d a t t h e N. Wake s i t e . . . . . . . . 141
S o i l wa te r p o t e n t i a l o u t s i d e t h e d r a i n f i e l d a rea a t t ens iome te r bank #7 (TB-7) f o r t h r e e depths ove r a 22-month p e r i o d a t t h e N. Wake s i t e . The l o w e r graph r e p r e s e n t s
. . . . . . . . . . . . . . . weekly r a i n f a l l measured on s i t e . 142
S o i l wa te r p o t e n t i a l i n s i d e t h e d r a i n f i e l d a rea a t t ens iome te r banks #1 (TB-1) and 14 (TB-4) f o r t h r e e dep ths
. . . . . . . . . . ove r a 22-month p e r i o d a t t h e N. Wake s i t e . 143
S o i l wa te r p o t e n t i a l i n s i d e t h e d r a i n f i e l d a rea a t t ens iome te r banks 111 (TB-11) and Y15 (TB-15) f o r t h r e e depths ove r a 12-month p e r i o d a t t h e Kn igh tda le s i t e . The 1 ower graph rep resen ts month ly r a i n f a l l a t N o r t h Caro l i n a . . . . . . . . . . . . . . . . . . . . . . . S t a t e U n i v e r s i t y . 145
S o i l wa te r p o t e n t i a l o u t s i d e t h e d r a i n f i e l d a rea a t t ens iome te r bank #21 (TB-21) and i n s i d e t h e d r a i n f i e l d a rea a t t ens iome te r bank #22 (TB-22) f o r t h r e e depths o v e r a 12-month p e r i o d a t t h e Chatham County s i t e . The l o w e r g raph rep resen ts month ly r a i n f a l l a t N o r t h Caro l i n a S t a t e
. . . . . . . . . . . . . . . . . . . . . . . . . . U n i v e r s i t y . 146
Average s o i l NH,-N, NO3-N, and C 1 concen t ra t i ons (ba rs rep resen t f one s tandard d e v i a t i o n ) f o r background (BK), c l o s e p r o x i m i t y (CP), and d r a i n f i e l d (SO) samples f o r f o u r
. . . . . . . . . . . . . . . . . . depths a t t h e N. Wake s i t e . 154
Average s o i l Na, K, Ca, and Mg concen t ra t i ons (bars rep resen t f one s tandard d e v i a t i o n ) f o r background (BK), c l o s e p r o x i m i t y (CP), and d r a i n f i e l d (SO) samples f o r f o u r . . . . . . . . . . . . . . . . . . depths a t t h e N. Wake s i t e . 155
Average s o i l NH,-N, NO,-N, and C 1 concen t ra t i ons (ba rs rep resen t f one s tandard d e v i a t i o n ) f o r background (BK) , c l o s e p r o x i m i t y (CP), and d r a i n f i e l d (SO) samples f o r f o u r . . . . . . . . . . . . . . . . . depths a t t h e Kn igh tda le s i t e . 158
Average s o i l Na, K, Ca, and Mg concen t ra t i ons (bars rep resen t f one s tandard d e v i a t i o n ) f o r background (BK) , c l ose p r o x i m i t y (CP) , and d r a i n f i e l d (SO) samples f o r f o u r depths a t t h e Kn igh tda le s i t e . . . . . . . . . . . . . . . . . . 159

46 Average soil NH,-N, N4-N, and C1 concentrations (bars represent f one standard deviation) for background (BK) , close proximity (CP), and drainfield (SO) samples for four . . . . . . . . . . . . . . . depths at the Chatham County site. 163
47 Average soil Na, K, Ca, and Mg concentrations (bars represent f one standard devi at f on) for background (BK) , close proximity (CP), and drainfield (SO) samples for four depths at the Chatham County site. . . . . . . . . . . . . . . . 165
48 Soil water content distributions at three locations inside and one location outside the drainfield area at the
. . . . . . . . . . . . . . commercial center in Macon County. .166
49 Soi 1 water content distributions at two locations inside and one location outside the drainfield area at the residential dwelling in Macon County. . . . . . . . . . . . . . . . . . . . 167
50 Mean of the electrical conductivity (EC) for background (BK), drainfield (SO), and close proximity (CP) soil and saprol ite samples collected from four depths at the commercial center in Macon County. Bars represent f one standard deviation. . . . . 168
5 1 Mean soil NH,-N, NO& and C1 concentrations (bars represent f one standard deviation) for background (BK) drainfi eld (SO), and close proximity samples collected from four depths at the residential dwelling in Macon County. . . . . . . . . . . . . . 171


LIST OF TABLES
Page
Depth to saprolite and type location for the official soil series of the key soils in the Piedmont and Mountain regions . . . . . . . . . . . of North Carolina (Daniels, et a1 . , 1984). 3
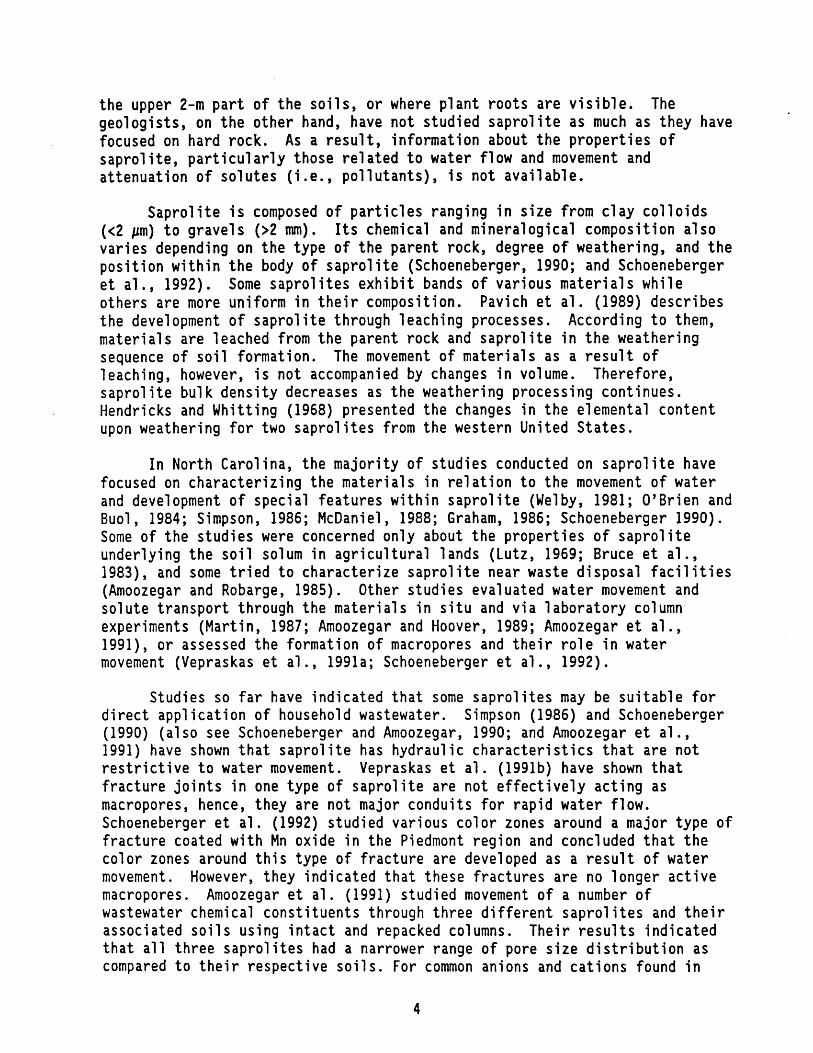
Locations, soil series, and soil classifications for the . . . . . . . . . 12 sites in the Piedmont and Mountain regions. 9
Soil classification and profile description for Site Number 1. . 36 Particle size distribution, free iron oxide (Fe203 reported as % Fe), and organic matter content of various horizons for the Enon soil at Site Number 1 in the Piedmont region. . . . . . 37 Cation exchange capacity (CEC), electrical conductivity (EC), and pH of various horizons for the Enon soil at Site Number 1
. . . . . . . . . . . . . . . . . . . . in the Piedmont region.
Mean, coefficient of vari abil i ty (CV) , number of sampl es (N) , and depth interval for saturated hydraul ic conductivity determined in the laboratory and in situ for the Enon soil at SiteNumber 1 in the Piedmont region. . . . . . . . . . . . . . Mean, standard deviation (SD), and number of measurements (N) for bulk density and volumetric water content at various soil water pressure heads for the major horizons of the Enon soil at Site Number 1 in the Piedmont region. . . . . . . . . . . . . 42 Soil classification and profile description for Site Number 2. . 44 Particle size distribution, free iron oxide (Fe203 reported as % Fe), and organic matter content of various horizons for the Vance soil at Site Number 2 in the Piedmont region. . . . . Cation exchange capacity (CEC) , electrical conductivity (EC) , and pH of various horizons for the Vance soil at Site Number 2
. . . . . . . . . . . . . . . . . . . . in the Piedmont region.
Mean, coefficient of variability (CV), number of samples (N), and depth interval for saturated hydraul ic conductivity determined in the laboratory and in situ for the Vance soil at Site Number 2 in the Piedmont region. . . . . . . . . . . . . .

Mean, standard deviation (SD), and number of measurements (N) for bulk density and volumetric water content at various soil water pressure heads for the major horizons of the Vance soil at Site Number 2 in the Piedmont region. . . . . . . . . . . . . 50 Soil classification and profile description for Site Number 3. . 51 Particle size distribution, free iron oxide (Fe,03 reported as % Fe), and organic matter content of various horizons for
. . . . the Wilkes soil at Site Number 3 in the Piedmont region. 53
Cation exchange capacity (CEC) , electrical conductivity (EC) , and pH of various horizons for the Wil kes soil at Site Number 3 in the Piedmont region. . . . . . . . . . . . . . . . . 53 Mean, coefficient of variability (CV), number of samples (N), and depth interval for saturated hydraul ic conductivity determined in the laboratory and in situ for the Wilkes soil at Site Number 3 in the Piedmont region. . . . . . . . . . . . . 55 Mean, standard deviation (SD), and number of measurements (N) for bulk density and volumetric water content at various soil water pressure heads for the major horizons of the Wilkes soil at Site Number 3 in the Piedmont region. . . . . . . . . . . . . 57 Soil classification and profile description for Site Number 4. . 58
Particle size distribution, free iron oxide (Fe,O, reported as % Fe), and organic matter content of various horizons for the Appl ing soil at Site Number 4 in the Piedmont region. . . . 59 Cation exchange capacity (CEC) , electrical conductivity (EC) , and pH of various horizons for the Appling soil at Site Number 4 in Piedmont region. . . . . . . . . . . . . . . . . . . 60 Mean, coefficient of variability (CV), number of samples (N), and depth interval for saturated hydraul ic conductivity determined in the laboratory and in situ for the Appling soil at Site Number 4 in the Piedmont region. . . . . . . . . . . . . 61 Soil classification and profile description for Site Number 5. . 63 Particle size distribution, free iron oxide (Fe,03 reported as X Fe), and organic matter content of various horizons for the Meckler.!wrg soil at Site Number 5 in the Piedmont region. . 64
Cat ion exchange capacity (CEC) , electrical conductivity (EC) , and pH of various horizons for the Mecklenburg soil at Site Number 5 in the Piedmont region. . . . . . . . . . . . . . . . . 65
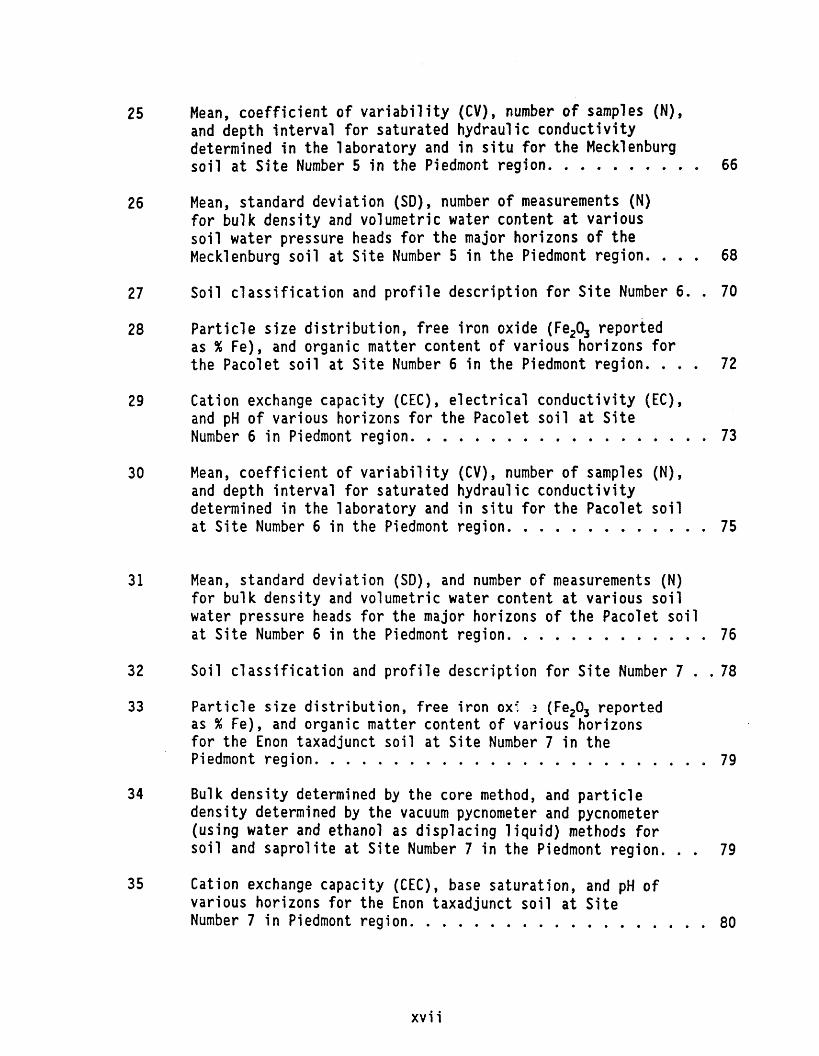
Mean, coefficient of variability (CV), number o f samples (N), and depth interval for saturated hydraul ic conductivity determined in the 1 aboratory and in situ for the Mecklenburg soil at Site Number 5 in the Piedmont region. . . . . . . . . . 66 Mean, standard deviation (SD) , number of measurements (N) for bulk density and volumetric water content at various soil water pressure heads for the major horizons o f the Mecklenburg soil at Site Number 5 in the Piedmont region. . . . 68 Soil classification and profile description for Site Number 6. . 70 Particle size distribution, free iron oxide (Fe,03 reported as % Fe), and organic matter content of various horizons for the Pacolet soil at Site Number 6 in the Piedmont region. . . . Cation exchange capacity (CEC) , electrical conductivity (EC) , and pH of various horizons for the Pacolet soil at Site Number6 in Piedmont region. . . . . . . . . . . . . . . . . . Mean, coefficient of vari abil i ty (CV) , number of samples (N) , and depth interval for saturated hydraul ic conductivity determined in the laboratory and in situ for the Pacolet soil at S i t e N u m b e r 6 in the Piedmont region. . . . . . . . . . . .
Mean, standard deviation (SD), and number of measurements (N) for bulk density and volumetric water content at various soil water pressure heads for the major horizons of the Pacolet soil at Site Number 6 in the Piedmont region. . . . . . . . . . . . . 76 Soil classification and profile description for Site Number 7 . . 78 Particle s i z e distribution, free iron ox; .? (Fe,O, reported as % Fe), and organic matter content of various horizons for the Enon taxadjunct soil at Site Number 7 in the
. . . . . . . . . . . . . . . . . . . . . . . . Piedmont region. 79
Bulk density determined by the core method, and particle density determined by the vacuum pycnometer and pycnometer (using water and ethanol as displacing liquid) methods for soil and saprolite at Site Number 7 in the Piedmont region. . . 79 Cation exchange capacity (CEC), base saturation, and pH of various horizons for the Enon taxadjunct soil at Site Number 7 in Piedmont region. . . . . . . . . . . . . . . . . . . 80
xvi i

Dominant and secondary mineralogy of clay fraction and mineral composition of very fine sand fraction (0.0-0.05 m) ,
of soil and saprolite at Site Number 7 in the Piedmont region. . 81 Mean, coefficient of variability (CV), number of samples (N), and depth interval for saturated hydraulic conductivity determined in the laboratory and in situ for the Enon . . . . taxadjunct soil at Site Number 7 in the Piedmont region. 83
Mean, standard deviation (SD), and number of observations (N) for volumetric water content at various soil water pressure heads for the major horizons of the Enon taxadjunct soil at Site Number 7 in the Piedmont region. . . . . . . . . . . . . 85 Features that were identified and counted in each thin section. 87
Volume percentage, coefficient of variation (in parentheses), and number of thin sections (N) for the Enon taxadjunct soil at Site Number 7 in the Piedmont region. . . . . . . . . . . . . 88 Soil classification and profile description for Site Number 8. . 9 0 Particle size distribution, free iron oxide (Fe,03 reported as % Fe), and organic matter content of various horizons for the Mecklenburg taxadjunct soil at Site Number 8 in the Piedmont region. . . . . . . . . . . . . . . . . . . . . . . . . 91 Bulk density determined by the core method, and particle density determined by the vacuum pycnometer and pycnometer (using water and ethanol as displacing liquid) methods for soil and saprol ite at Site Number 8 in the Piedmont region. . . 92
Cation exchange capacity (CEC), base saturation, and pH of various horizons for the Mecklenburg taxadjunct soil at Site Number 8 in the Piedmont region. . . . . . . . . . . . . . 93 Dominant and secondary mineralogy of clay fraction and mineral composition of very fine sand fraction (0.1-0.05 mm) of soil and saprolite at Site Number 8 in the Piedmont region. . . . . . 94 Mean, coefficient of variability (CV), number of samples (N), and depth interval for saturated hydraul ic conductivity determined in the laboratory and in situ for the t~lscklenburg taxadjunct soil at Site Number 8 in the Piedmont region. . . . . 95 Mean, standard deviation (SD), and number of observations (N) for volumetric water content at various soil water pressure heads for the major horizons of the Mecklenburg taxadjunct soil at Site Number 8 in the Piedmont region. . . . . . . . . . 97
xvi i i

Volume percentage of the components identified for the . . . . . . . . . Mecklenburg taxadjunct soil at Site Number 8. 99
Soil classification and profile description for Site Number 9. . 101 Particle size distribution, free iron oxide (Fe203 reported as % Fe) , and organic matter content of various horizons for the Hayesville soil at Site Number 9 in the Mountain region. . 102
Cation exchange capacity (CEC) , electrical conductivity (EC) , and pH of various horizons for the Hayesville soil at Site . . . . . . . . . . . . . . . Number 9 in the Mountain region. .I02
Mean, coefficient of variability (CV), number of samples (N), and depth interval for saturated hydraul ic conductivity determined in the laboratory and in situ for the Hayesville soil at Site Number 9 in the Mountain region. . . . . . . . . . 104 Mean, standard deviation (SD), and number of measurements (N) for bulk density and volumetric water content at various soil water pressure heads for the major horizons of the Hayesville soil at Site Number 9 in the Mountain region. . . . . . . . . . 105 Soil classification and profile description for Site Number 10. 107
Particle size distribution, free iron oxide (Fe20, reported as % Fe), and organic matter content of various horizons for the Watauga soil at Site Number 10 in the Mountain region. . . 108
Cation exchange capacity (CEC) , electrical conductivity (EC) , and pH of various horizons for the Watauga soil at Site Number 10 in the Mountain region. . . . . . . . . . . . . . . . 108 Mean, coefficient o f variability (CV), number o f samples (N), and depth interval for saturated hydraulic conductivity determined in the laboratory and in situ for the Watauga soil at Site Number 10 in the Mountain region. . . . . . . . . . . . 110 Mean, standard deviation (SD), and number of measurements (N) for bulk density and volumetric water content at various soil water pressure heads for the major horizons of the Watauga soil at Site Number 10 in the Mountain region. . . . . . 111 Soil classification and profile description for Site Number 11. 113
Particle size distribution, free iron oxide (Fez% reported as X Fe), and organic matter content of various horizons for the Chandler soil at Site Number 1 1 in the Mountain region. . . 114
xix

0
Cation exchange capacity (CEC), electrical conductivity (EC), and pH of various horizons for the Chandler soil at, Site Number 11 in the Mountain region. . . . . . . . . . . . . . . . 114 Mean, coefficient of variability (CV), number of samples (N), and depth interval for saturated hydraul ic conductivity determined in situ for the Chandler soil at Site Number 11 in the Mountain region. . . . . . . . . . . . . . . . . . . . . 115 Soil classification and profile description for Site Number 12. 117
Particle size distribution, free iron oxide (Fe203 reported as % Fe), and organic matter content of various horizons for the Junaluska soil at Site Number 12 in the Mountain region. . . 118 Cation exchange capacity (CEC) , electrical conductivity (EC) , and pH of various horizons for the Junaluska soil at Site Number 12 in the Mountain region. . . . . . . . . . . . . . . . 118
Mean, coefficient of variability (CV), number of samples (N), and depth interval for saturated hydraul ic conductivity determined in the laboratory and in situ for the Junaluska soil at Site Number 12 in the Mountain region. . . . . . . . . . 120
67 Mean, standard deviation (SD), and number of measurements (N) for bulk density and volumetric water content at various soil water pressure heads for the major horizons of the Junaluska soil at Site Number 12. . . . . . . . . . . . . . . . . . . . . 121
68 Attenuation of Ca by soil and saprolite from 10 sites as determined by the batch study. . . . . . . . . . . . . . . . . . 123
69 Attenuation of K by soil and saprolite from 10 sites as determined by a batch study. . . . . . . . . . . . . . . . . . .I23
70 Attenuation of NH, by soil and saprolite from 10 sites as determined b y a batch study. . . . . . . . . . . . . . . . - 1 2 4
7 1 Arithmetic average, standard deviation (in parentheses), and number of observations (N) for selected soil physical and chemical properties for the Bt, BC, and C (saprolite) horizons at the N. Wake site. . . . . . . . . . . . . . . . . . 125
72 Arithmetic average, standard deviation (in parentheses), and number of observations (N) for selected soil physical and chemical properties for the Bt, BC, and C (saprol ite) horizons at the Knightdale site. . . . . . . . . . . . . - 1 2 6

A r i t h m e t i c average, s tandard d e v i a t i o n ( i n parentheses) , and number o f observatdons (N) f o r s e l e c t e d s o i l p h y s i c a l and chemica l p r o p e r t i e s f o r t h e Bt, BC, and C ( sap ro l i t e ) h o r i z o n s a t t h e Chatham County s i t e . . . . . . . . . . . . . . . 127
Geometr ic average, range, and number o f obse rva t i ons (N) o f K,,, f o r t h e B t , BC, and C ( s a p r o l i t e ) h o r i z o n s f r om t h r e e s i t e s measured i n t h e l a b o r a t o r v (Lab) and i n s i t u . . . . . . . 128
Average v o l u m e t r i c wa te r con ten t , s tandard d e v i a t i o n ( i n parentheses) , and number o f observa t ions (N) a t v a r i o u s s o i l wa te r p ressure heads f o r t h e ma jo r ho r i zons a t t h e N. Wake and Kn igh tda le s i t e s . . . . . . . . . . . . . . . . . . 131
Chemical c h a r a c t e r i s t i c s o f t h e wastewater a t 3 s i t e s . . . . . . . 148
A r i t h m e t i c average, s tandard d e v i a t i o n ( i n parentheses), and number o f samples (N) f o r s o i l pH and EC f rom t h r e e sample t ypes and f o u r s o i l depths (0.5, 1.0, 1.5, and 2.0 m) f rom t h e N. Wake s i t e . . . . . . . . . . . . . . . . . . . . . . . . 149
A r i t h m e t i c average, s tandard d e v i a t i o n ( i n parentheses) , and number o f samples (N) f o r s o i l pH and EC f rom t h r e e sample t y p e s and f o u r s o i l depths (0.5, 1.0, 1.5, and 2.0 m) f rom t h e K n i g h t d a l e s i t e . . . . . . . . . . . . . . . . . . . . . . . 150
A r i t h m e t i c average, s tandard d e v i a t i o n ( i n parentheses), and number o f samples (N) f o r s o i l pH and EC f rom t h r e e sample t ypes and f o u r s o i l depths (0.5, 1.0, 1.5, and 2.0 m) f rom t h e Chatham County s i t e . . . . . . . . . . . . . . . . ,. . . I 5 1
S t a t i s t i c a l summary m a t r i x o f comparisons between mean c o n c e n t r a t i o n s (mg/kg) o f background (BK) and d r a i n f i e l d s o i l (SO) samples f o r f o u r depths aad seven chemica ls a t t h e N. Wake s i t e . . . . . . . . . . . . . . . . . . . . . . . . . . 153
S t a t i s t i c a l summary m a t r i x o f comparisons between mean c o n c e n t r a t i o n s (mg/kg) o f background (BK) and d r a i n f i e l d s o i l (SO) samples f o r f o u r depths and seven chemica ls a t t h e K n i g h t d a l e s i t e . . . . . . . . . . . . . . . . . . . . . . . . . 1 5 7
S t a t i s t i c a l summary m a t r i x o f comparisons between mean c o n c e n t r a t i o n s (rng/kg) o f background (BK) and d r a i n f i e l d s o i l (SO) samples f o r f o u r depths and seven chemica ls a t t h e Chatham County s i t e . . . . . . . . . . . . . . . . . . . . . . . 1 6 1

83 Mean and standard deviation (in parentheses) for NH,, NO3, and C1 concentrations in s o i l . and saprol i t e samples collected from four depths inside and outside the drainfield area of the commercial center inMaconCounty. . . . . . . . . . . . . . . .I69
x x i i

SUMMARY AND CONCLUSIONS
Popu la t ion growth and economic development w i t h i n Nor th Caro l i na has increased demand f o r t h e use o f s e p t i c systems f o r housing development. Most r e s i d e n t i a l dwe l l i ngs i n t h e s t a t e r e l y on on -s i t e wastewater d i sposa l systems f o r t h e management o f t h e i r household wastewater. I t appears t h a t t h e demand f o r us ing i n d i v i d u a l s e p t i c systems w i l l increase due t o t h e l a c k o f f und ing f o r community o r p u b l i c sewer system. Th i s i s p a r t i c u l a r l y t r u e f o r r u r a l areas and suburbs around 1 arge munic ipal i t i e s .
The m a j o r i t y o f t h e s o i l s i n t h e Piedmont and Mountain reg ions o f No r th Caro l i na are cha rac te r i zed by t h e presence o f s a p r o l i t e a t o r near t h e surface. Due t o t h e l a c k o f knowledge, sapro l i t e i s g e n e r a l l y considered unsu i tab le f o r s e p t i c systems. Th is s tudy was undertaken t o eva lua te p e r t i n e n t p r o p e r t i e s o f a number o f sapro l i t e s i n these two reg ions and assess t h e possi b i l i t y o f i d e n t i f y i n g s u i t a b l e saprol i t e s f o r on-si t e wastewater d isposa l systems. The s p e c i f i c ob jec t i ves o f t h e s tudy were (1) t o determine t h e phys i ca l , chemical, and morphological. p r o p e r t i e s o f a number o f s o i l and s a p r o l i t e sequences i n t h e Piedmont and Mountain reg ions f o r wastewater d isposa l purposes, (2) t o eva lua te t h e performance o f s e p t i c systems i n shal low s o i l s u n d e r l a i n by saprol i t e , and (3) t o at tempt development o f guide1 ines f o r eva lua t i on o f s o i l and saprol i t e continuum f o r s e p t i c systems.
E igh t s i t e s i n t h e Piedmont and f o u r s i t e s i n t h e Mountain r e g i o n were se lec ted f o r comprehensive eva lua t i on o f s o i l and s a p r o l i t e . A t each s i t e , a 1 arge observa t ion p i t was dug t o we1 1 be1 ow sapro l i te , and s o i l morphological p r o p e r t i e s were assessed on t h e p i t w a l l s. Bul k samples were then c o l l ec ted from i n d i v i d u a l hor izons f o r l abo ra to ry analyses. These samples were analyzed f o r pHy e l e c t r i c a l c o n d u c t i v i t y (EC), c a t i o n exchange c a p a c i t y (CEC), o rgan ic mat te r content , and p a r t i c l e s i z e d i s t r i b u t i o n . A t tenua t i on c a p a c i t i e s o f each s o i l o r s a p r o l i t e sample f o r t h ree ca t i ons and two anions were determined through a batch study. I n add i t i on , i n t a c t core samples were ob ta ined f rom t h e t o p o f t h e B t t o a few meters below t h e s o i l sur face a t a number o f l o c a t i o n s around t h e observa t ion p i t , and i n s i t u sa tu ra ted h y d r a u l i c c o n d u c t i v i t y (K,,,) was measured a t 50 cm depth i n t e r v a l s , f rom 50 cm t o 200 cm ( o r bedrock, whichever was shal lower) . The i n t a c t co re samples were analyzed f o r K,,,, water r e t e n t i o n a t var ious s o i l water p ressure heads, and b u l k dens i ty . A t two s i t e s a d d i t i o n a l s tud ies were conducted t o assess t h e p o r o s i t y o f t h e s o i l and s a p r o l i t e , r o o t d i s t r i b u t i o n i n t h e p r o f i l e , mineralogy o f t h e c lay - and sand-sized p a r t i c l e s , and p r e f e r e n t i a l movement o f water and so lu tes .
Three s e p t i c systems i n the Piedmont and two systems i n t h e Mountain r e g i o n were se lec ted f o r eva lua t ion . A s e r i e s o f samples was c o l l e c t e d f rom a number o f t r ansec ts perpend icu la r and p a r a l l e l t o t h e d r a i n 1 i n e s o f t h e s e p t i c systems. The samples were c o l l e c t e d from 25 o r 50 cm depth i n t e r v a l s , f rom t h e sur face t o 200 cm depth. Background samples, and samples f rom near t h e d r a i n l i n e s were a l s o c o l l e c t e d f o r comparison purposes. These samples were analyzed i n t h e l a b o r a t o r y f o r pHy EC, and seven c a t i o n s and anions. S o i l
x x i i i

water contents and p o t e n t i a l s i n s i d e and .outside t h e d r a i n f i e l d areas o f t h r e e s e p t i c systems i n t h e Piedmont reg ions were determined weekly f o r over one year. I n t h e Mountain region, o n l y s o i l water content was mon i to red on a b iweekly b a s i s a t bo th s i t e s .
Overa l l , sapro l i t e e x h i b i t e d favorab le h y d r a u l i c c h a r a c t e r i s t i c s f o r t h e d isposa l o f wastewater. For t h e m a j o r i t y o f t h e s i t e s , s a p r o l i t e had a h ighe r K,,, than t h e B t and/or t h e t r a n s i t i o n a l (BC) hor izon above it. Low sa tu ra ted hydraul i c c o n d u c t i v i t y o f t h e t r a n s i t i o n a l hor izon@) between we1 1 s t r u c t u r e d B t and sapro l i t e i s most 1 i k e l y due t o t h e i n f i l l i n g and c o a t i n g o f t h e pores by va r ious c l ay-sized ma te r ia l s . The CEC o f s o i l and sapro l i t e was g e n e r a l l y low, b u t t h e apparent CEC f o r sapro l i t e was q u i t e h igh f o r most s i t e s . We b e l i e v e r e l a t i v e l y h i g h CEC values f o r s a p r o l i t e w i t h low c l a y content i s due t o t h e negat ive charges on t h e sand- and s i l t - s i z e d p a r t i c l e s . U n l i k e most s o i l s , t h e sand-sized p a r t i c l e s o f s a p r o l i t e are composed o f m ine ra l s o t h e r than quar tz . A t 11 s i t e s , bo th s o i l and s a p r o l i t e were a c i d i c (i .e . , pH <7). Both s o i l and s a p r o l i t e a l so had low so lub le sa l t s , as i n d i c a t e d by low EC values. Overa l l , sapro l i t e had h igher sand content and lower b u l k d e n s i t y than t h e B t ho r i zon@) above it. I n general, sandy s o i l s have h i g h e r b u l k d e n s i t y due t o lower t o t a l p o r o s i t y than s o i l s w i t h more c layey t e x t u r e . I n saprol i te , however, t h e presence o f more sand-sized p a r t i c l e s does n o t necessa r i l y correspond w i t h h igher bu l k dens i ty . Lower b u l k d e n s i t y o f sapro l i t e i s associated w i t h t h e s o l u t i o n weathering processes t h a t are t a k i n g p lace w i t h o u t be ing accompanied by a volume reduct ion.
Water content i n t h e d r a i n f i e l d areas o f t h e s e p t i c systems was g e n e r a l l y re1 a ted t o seasonal v a r i a t i o n . A1 though t h e amount o f wastewater app l i ed t o a d r a i n f i e l d area i s subs tan t i a l , no appreciable d i f f e r e n c e s can be observed i n s o i l water content i f t h e s o i l and s a p r o l i t e have adequate hydraul i c c o n d u c t i v i t y . Exceptions are du r ing per iods o f h i g h p r e c i p i t a t i o n and low evapot ransp i ra t ion . For one o f t h e s e p t i c systems s e r v i n g a r e s t - home, excessive wetness was observed below t h e s o i l sur face a t a number o f l o c a t i o n s i n s i d e t h e d r a i n f i e l d area. We be l i eve t h e excessive wetness i n t h e s o i l and s a p r o l i t e a t t h i s s i t e i s t h e r e s u l t o f low h y d r a u l i c c o n d u c t i v i t y o f t h e B t and/or t r a n s i t i o n a l BC horizons, excessive water use by t h e f a c i l i t y , l a c k o f un i fo rm d i s t r i b u t i o n o f wastewater over t h e e n t i r e d r a i n f i e l d area, and l a c k o f management f o r t h i s system. Another s e p t i c system se rv ing a subd iv i s ion was a l a r g e low-pressure p ipe system composed o f 11 i n d i v i d u a l d r a i n f i e l d s . We moni tored one o f t h e d r a i n f i e l d s w i t h sha l lowest s o i l and found t h a t t h e system was f u n c t i o n i n g p rope r l y throughout t h e year . Th i s system i s managed by a p u b l i c u t i l i t y and receives r e g u l a r checkup and maintenance as needed. The systems a t t h e i n d i v i d u a l r e s i d e n t i a l dwe l l i ngs i n t h e Piedmont and Mountain regions a1 so func t ioned w i t h o u t problems d u r i n g our study per iod . High c o n d u c t i v i t y o f t h e subso i l and placement o f t h e t renches o f t h e s e p t i c system below t h e hor izons w i t h low c o n d u c t i v i t y a r e t h e reasons f o r our observat ions.
We b e l i e v e s e p t i c systems can be i n s t a l l e d i n s a p r o l i t e i f s a p r o l i t e p r o p e r t i e s a re c a r e f u l l y evaluated and t h e p o t e n t i a l f o r r a p i d movement o f
x x i v

water and oxygen diffusion through the soil are considered. For septic systems, properties of the Bt and its underlying horizons must be studied. For areas where the Bt horizon is relatively thin, and a transitional horizon occurs between soil and saprolite, hydraulic characteristics of the transitional horizon must be evaluated. For sites where a suitable soil (e.g., well structured Bt with a loamy texture) is underlain by a horizon with the lowest conductivity in the profile, application of wastewater to the trenches of the system may result in accumulation of water above the layer with the least permeability. Eventually, such a system will exhibit signs of failure due to the lack of vertical infiltration of wastewater. For shallow soils underlain by saprolite, it may be advantageous to install the drainlines of the septic system in saprolite rather than using a modified septic system with shallow trenches within the upper part of the profile. We should note that pretreatment may be required to prevent ground water (or surface water) pollution when wastewater is applied to saprolite instead of soil above it. Finally, for some sites, saprolite may be the best suitable material for the disposal of household wastewater, and for its evaluation one must consider the soil and saprol ite as a continuum and evaluate their properties collectively. We should keep in mind that although saprol ites may not provide adequate treatment, they could effectively be used for the disposal of treated household wastewater.
xxv


RECOMMENDATIONS
1. Some sapro l i t e s may be s u i t a b l e f o r t h e d isposa l o f household wastewater, b u t t h e i r phys ica l c h a r a c t e r i s t i c s must be c a r e f u l l y evaluated. That i s , n o t every s a p r o l i t e should be used f o r t h e d i sposa l o f household wastewater. For sha l low s o i l s under1 a i n by saprol i te , t h e hydrau l i c p r o p e r t i e s o f t h e s o i l , t r a n s i t i o n a l hor izons and sapro l i t e must be s t u d i e d c o l l e c t i v e l y . I n another words, s o i l and s a p r o l i t e must be considered as a continuum r a t h e r t han i n d i v i d u a l hor izons.
2. S a p r o l i t e morphological p r o p e r t i e s cou ld n o t be e f f e c t i v e l y evaluated through auger bor ings . To eva lua te saprol i t e f o r a s e p t i c system, an observa t ion p i t must be used. Morphological c h a r a c t e r i s t i c s o f t h e s o i l s o l urn and s a p r o l i t e must then be evaluated c o l l e c t i v e l y on t h e p i t w a l l s . Depending on t h e v a r i a b i l i t y o f t he s o i l and saprol i t e across t h e landscape, more than one p i t may be r e q u i r e d f o r proper eva lua t i on o f s a p r o l i t e . For s i n g l e f a m i l y u n i t s , one observa t ion p i t may be adequate i f t h e i n d i v i d u a l per fo rming t h e s o i l l s i t e e v a l u a t i o n can determine t h a t t h e proposed d r a i n f i e l d area i s n o t u n d e r l a i n by a hard s a p r o l i t e t o w i t h i n 2 m and/or t h e c o n d u c t i v i t y o f t h e e n t i r e p r o f i l e does n o t decrease w i t h depth.
3 . For l a r g e s e p t i c systems i n areas w i t h shal low s o i l s , t h e s o i l - s a p r o l i t e sequences a t va r i ous 1 andscape p o s i t i o n s must be eval uated us ing 1 arge observa t ion p i t s . Trenches o f a l a r g e s e p t i c system may be p laced i n sapro l i t e i f t h e r e i s no r e s t r i c t i v e l a y e r w i t h i n a reasonable d i s tance below t h e t renches o f t h e proposed system. To determine t h e l e a s t permeable l a y e r , sa tu ra ted h y d r a u l i c c o n d u c t i v i t y o f var ious hor izons cou ld be measured i n s i t u o r by c o l l e c t i n g i n t a c t cores and analyz ing them i n a l a b o r a t o r y .
4 . For coarse- textured saprol i tes, sa tura ted hydraul i c c o n d u c t i v i t y can be evaluated by e i t h e r i n s i t u o r l a b o r a t o r y techniques us ing l a r g e r than 5 cm i n d iameter i n t a c t cores. For t h e Bt, t h e r e s u l t s o f t h e i n s i t u and t h e l a b o r a t o r y techniques may n o t correspond w i t h one another due t o t h e presence o f p lana r vo ids i n t h e i n t a c t cores, o r d is turbances and c l o s i n g o f t h e pores d u r i n g p repa ra t i on o f t h e s o i l f o r i n s i t u measurements.
5. Sep t i c systems i n general, and p a r t i c u l a r l y those i n s t a l l e d i n sapro l i t e o r sha l low s o i l s under la in by s a p r o l i t e , must be managed p r o p e r l y . I g n o r i n g a s e p t i c system, o r misusing i t beyond i t s capac i t y r e s u l t s i n h y d r a u l i c f a i l u r e . The d r a i n f i e l d area o f a s e p t i c system i n s t a l l e d i n s a p r o l i t e o r sha l low s o i l u n d e r l a i n by s a p r o l i t e must be examined on a r e g u l a r bas is t o determine i f perched water t a b l e s are formed under t h e system.
6. A low-pressure p ipe (LPP) system should be used t o d i s t r i b u t e t h e e f f l u e n t u n i f o r m l y over t h e e n t i r e area o f a d r a i n f i e l d i n s t a l l e d i n s a p r o l i t e . We should note t h a t o the r i nnova t i ve techniques f o r t h e d isposa l o f household wastewater (e.g., t r i c k l e i r r i g a t i o n systems) may a l s o be used a f t e r adequate t e s t i n g o f t h e technology. The LPP system w i l l p rov ide a
x x v i i

b e t t e r wastewater d i s t r i b u t i o n , and prevent over loading a s e c t i o n o f the d r a i n f i e l d a r e a .
7. For a r e a s where s ap ro l i t e i s recommended f o r d i s p o s a l , t h e s o i l and t h e t r a n s i t i o n a l ho r i zon ( s ) must a1 s o be eva lua ted f o r t h e i r a b i l i t y t o t r a n s m i t a i r . Oxygen must move by d i f f u s i o n from t h e g rave l s u r f a c e t o underneath t h e bottom o f t h e d r a i n f i e l d t r enches . Lack o f adequate oxygen may r e s u l t i n anaerobic c o n d i t i o n s under t h e d r a i n f i e l d even though s a p r o l i t e may remain unsa tu ra t ed .
8. For a r e a s where s a p r o l i t e i s suspec ted o f n o t being a b l e t o provide adequate t r e a t m e n t f o r wastewater , o r when t h e s o i l above s a p r o l i t e does n o t permit a i r t r a n s p o r t t o t h e bottom o f the t r enches , a p r e t r ea tmen t system and/or pressure-dosed sand l i n e d t r enches should be used t o reduce t h e n i t rogen , o r g a n i c m a t t e r con ten t , and microbial popu la t i on o f wastewater .
9. The load ing r a t e f o r sapro l i t e must be determined based on t h e h y d r a u l i c c o n d u c t i v i t y o f t h e l e a s t permeable m a t e r i a l s below i t . The same i s t r u e f o r s o i l s c u r r e n t l y cons idered s u i t a b l e o r p r o v i s i o n a l l y s u i t a b l e f o r s e p t i c systems. We do n o t recommend inc reas ing t h e l oad ing r a t e f o r p r e t r e a t e d e f f l u e n t a t this t ime.
xxvi i i
INTRODUCTION
Treatment and disposal of domestic wastewater can be generally accompl ished through central or community wastewater treatment facil i ties or sewage systems (EPA, 1977; Metcalf and Eddy, Inc., 1979), or via direct application of wastewater to soils on-site using septic systems (EPA, 1980; Perkins, 1989). According to the Bureau of Census (1983), in 1980, 47% of the year-round dwelling units in North Carolina were served by pub1 ic or communi ty wastewater disposal systems, 49% had an approved on-si te wastewater disposal system, and the remaining 4% used other means for the management of their domestic wastewater. In North Carolina, the use of septic systems for management of household wastewater is regulated by the state rules and regulations governing the treatment and disposal of wastewater (NCDEH, 1990). Nationally, it is estimated that over 113 of the households use an on-site wastewater treatment facil ity for the disposal of their wastewater (Canter and Knox, 1984). These systems are generally permitted and operated under various state and local regulations, which vary across the nation.
In general, sewage systems are available to residents living in municipalities. For those living in small communities, or in suburbs around municipal i ties, individual or communi ty septic systems are the only economical option avail able for management of their household wastewater. With the economic development over the last two decades, the use of septic systems in North Carolina has increased substantially. According to Grayson et al. (1982), the number of households using on-site wastewater disposal systems in North Carolina was 1.2 mill ion in 1981. Hoover and Amoozegar (1989) reported that during a 6-year period between January 1982 and January 1988 over 260,000 new septic systems were installed in the state. With a projected 50,000 new septic systems annually, the number of septic systems will exceed 2 million by the year 2000. Assuming an average daily water use of 180 L per individual (EPA, l98O), and the average number of individuals (2.9) per housing unit (Bureau of Census, 1983), the amount of wastewater that will be applied to North Carolina Soils by septic systems will exceed 1 billion L (275 x lo6 gallons) per day (or 380 billion L annually).
Septic Systems in North Carolina
In a typical septic system (call ed conventional septic system), wastewater from a dwelling enters a septic tank where the majority of solid particles are settled. Partially treated wastewater from the septic tank containing dissolved and suspended materials then flows by gravity into a series of trenches dug into the soil for infiltration. The area where the trenches are located is referred to as the drainfield or ni trification-field. It is assumed that solils with their complex physical, chemical, and microbiological characteristics can destroy the microbial population and attenuate the chemical constituents of wastewater (Fuller and Warrick, 1985), thus providing the final treatment before wastewater enters ground or surface waters.

The rules and regulations for septic systems in North Carolina require that, for a single family residential dwelling, at least 30 cm (12 inches) of naturally occurring soil be present between the bottom of the trenches and any restrictive layer in the soil. The restrictive layers may vary from a seasonally high water table in the east to the presence of hard rock in the western part the state. These rules and regulations also specify that for a conventional septic system the trenches should be 90 cm (3 ft) wide and 90 cm deep, with 180 cm spacing between the trenches (i .e., 270 cm or 9 ft spacing between the centers of two adjacent trenches). As a result, for a conventional septic system to be permitted by local health officials the thickness of the suitable soil at the site must be at least 120 cm (4 ft).
Not all of the soils in North Carolina meet the thickness requirement for conventional septic systems. Modifications to the conventional septic systems for using shallower trenches, and alternative systems for the disposal of wastewater have been developed to use septic systems in areas where the thickness of suitable soils is less than 120 cm (Hoover and Amoozegar,1988). These modifications include shallow trench system, ultra shallow trench system with backfill cover, fill system (Hoover and Amoozegar, 1988; Hoover et al., 1988), and mound system (Cogger et a1 . , 1982b). A1 ternative septic systems , have also been developed to use shallower soils and/or improve the performance of conventional (gravity fed) septic systems. The most common a1 ternative system used in North Carolina is the low-pressure pipe septic system (NCDEH, 1990; Hoover and Amoozegar, 1988; Carl ile, 1979, 1980; Cogger et a1 , 1982a; EPA, 1980). In the low-pressure pipe (LPP) system, wastewater from a septic tank flows by gravity into a holding tank (called pump tank). From the pump tank wastewater is intermittently pumped into a series of perforated pipes installed in shallow and narrow trenches. These trenches are generally 20 to 30 cm (8 to 12 inches) wide and can be placed as shallow as 30 cm (12 inches) below the soil surface.
Many soils in the state of North Carolina do not meet the depth requirement even though alternative systems allow shallow placement of the trenches. The majority of soils in the Piedmont a:.. . Mountain regions of North Carol ina (and the Southeastern United States) are under1 ain by saprol i te. These two regions comprise about 55% of the land in the state. The depth to saprolite varies considerably among various soil series in these two regions (Table 1). Saprolite has been defined as thoroughly decomposed igneous or metamorphic rock formed in pl ace by chemical weathering (American Geological Institute, 1976). Pavich (1986) defines saprol i te as "soft, friable, i sovol umetrical ly weathered bedrock that retains the fabric and structure of the parent rock". Saprol i te represents transit i onal materi a1 s between rock and soil, and edends from the bottom section of a soil sol um to the underlying bedrock (Pavich et a1 . , 1989). The soi 1-saprol i te-rock sequence represents a continuum of weathering processes (H. J . Klei ss, unpubl i shed data).
In the past, the North Carolina rules and regulations governing on-site collection, treatment and disposal of household wastewater (NCDEH, 1990)
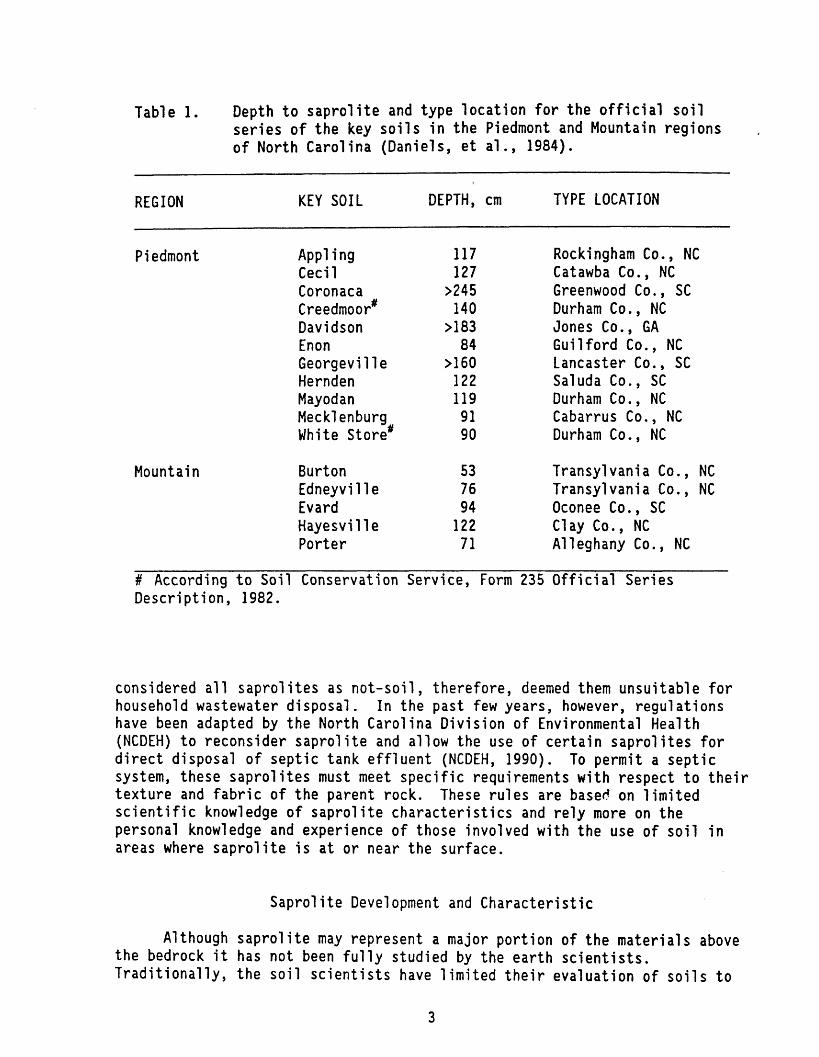
Table 1. Depth to saprolite and type location for the official soil series of the key soils in the Piedmont and Mountain regions ,
of North Carol ina (Daniel s, et a1 . , 1984).
REGION KEY SOIL DEPTH, cm TYPE LOCATION
Pi edmont
Mountain
Appl i ng Ceci 1 Coronaca creedmoor' Davi dson Enon Georgevi 1 1 e Hernden Mayodan Mec kl enburg White store'
Rockingham Co., NC Catawba Co., NC Greenwood Co., SC Durham Co., NC Jones Co., GA Guilford Co., NC Lancaster Co., SC Saluda to . , SC Durham Co., NC Cabarrus Co., NC Durham Co., NC
Burton 53 Transylvania Co. , NC Edneyvi 1 1 e 76 Transyl vani a Co . , NC Evard 94 Oconee Co., SC Hayesvi 11 e 122 Cl ay Co., NC Porter 7 1 A1 1 eghany Co., NC
# According to Soil Conservation Service, Form 235 Official Series Description, 1982.
considered all saprol ites as not-soil , therefore, deemed them unsuitable for household wastewater disposal. In the past few years, however, regulations have been adapted by the North Carolina Division of Environmental Health (NCDEH) to reconsider saprol ite and allow the use of certain saprol ites for direct disposal of septic tank effluent (NCDEH, 1990). To permit a septic system, these saprol ites must meet specific requirements with respect to their texture and fabric of the parent rock. These rules are based on limited scientific knowledge of saprolite characteristics and rely more on the personal knowledge and experience of those involved with the use of soil in areas where saprol ite is at or near the surface.
Saprol i te Devel oprnent and Characteristic
Although saprol ite may represent a major portion of the materials above the bedrock it has not been fully studied by the earth scientists. Traditionally, the soil scientists have limited their evaluation of soils to
t h e upper 2-m p a r t o f t h e s o i l s , o r where p l a n t r o o t s a r e v i s i b l e . The g e o l o g i s t s , on t h e o t h e r hand, have n o t s t u d i e d s a p r o l i t e as much as t h e y have focused on ha rd rock . As a r e s u l t , i n f o r m a t i o n about t h e p r o p e r t i e s o f sap ro l i t e , p a r t i c u l a r l y those r e l a t e d t o wa te r f l o w and movement and a t t e n u a t i o n o f s o l u t e s (i .e., p o l l u t a n t s ) , i s n o t a v a i l a b l e .
S a p r o l i t e i s composed o f p a r t i c l e s r a n g i n g i n s i z e f r o m c l a y c o l l o i d s (<2 pm) t o g r a v e l s (>2 nun). I t s chemical and m i n e r a l o g i c a l compos i t i on a l s o v a r i e s depending on t h e t y p e o f t h e p a r e n t rock , degree o f weather ing, and t h e p o s i t i o n w i t h i n t h e body o f sap ro l i t e (Schoeneberger, 1990; and Schoeneberger e t a1 . , 1992). Some sap ro l i t e s e x h i b i t bands o f v a r i o u s m a t e r i a1 s w h i l e o the rs a re more u n i f o r m i n t h e i r composi t ion. Pav ich e t a1 . (1989) desc r i bes t h e development o f s a p r o l i t e th rough l e a c h i n g processes. Accord ing t o them, m a t e r i a l s a re leached f rom t h e p a r e n t r o c k and sap ro l i t e i n t h e weather ing sequence o f s o i l fo rmat ion . The movement o f m a t e r i a l s as a r e s u l t o f leach ing , however, i s n o t accompanied by changes i n volume. There fo re , sapro l i t e b u l k d e n s i t y decreases as t h e weather ing p rocess ing con t inues . Hendr icks and W h i t t i n g (1968) p resen ted t h e changes i n t h e e lementa l c o n t e n t upon weather ing f o r two s a p r o l i t e s f rom t h e western U n i t e d S ta tes .
I n N o r t h Ca ro l i na , t h e m a j o r i t y o f s t u d i e s conducted on s a p r o l i t e have focused on c h a r a c t e r i z i n g t h e m a t e r i a l s i n r e l a t i o n t o t h e movement o f wa te r and development o f spec i a1 f e a t u r e s w i t h i n sap ro l i t e (We1 by, 1981; 0' B r i e n and Buol , 1984; Simpson, 1986; McDaniel , 1988; Graham, 1986; Schoeneberger 1990). Some o f t h e s t u d i e s were concerned o n l y about t h e p r o p e r t i e s o f sap ro l i t e u n d e r l y i n g t h e s o i l solum i n a g r i c u l t u r a l l ands (Lutz , 1969; Bruce e t a l . , l983) , and some t r i e d t o c h a r a c t e r i z e sap ro l i t e near waste d i s p o s a l f a c i l i t i e s (Amoozegar and Robarge, 1985). Other s t u d i e s eva lua ted wa te r movement and s o l u t e t r a n s p o r t th rough t h e m a t e r i a l s i n s i t u and v i a l a b o r a t o r y column, exper iments (Mar t in , 1987; Amoozegar and Hoover, 1989; Amoozegar e t a1 . , 1991), o r assessed t h e f o r m a t i o n o f macropores and t h e i r r o l e i n wa te r movement (Vepraskas e t a l . , 1991a; Schoeneberger e t a l . , 1992).
S tud ies so f a r have i n d i c a t e d t h a t some s a p r o l i t e s may be s u i t a b l e f o r d i r e c t a p p l i c a t i o n o f household wastewater. Simpson (1986) and Schoeneberger (1990) ( a l s o see Schoeneberger and Amoozegar, 1990; and Amoozegar e t a l . , 1991) have shown t h a t s a p r o l i t e has h y d r a u l i c c h a r a c t e r i s t i c s t h a t a r e n o t r e s t r i c t i v e t o wate r movement. Vepraskas e t a l . (1991b) have shown t h a t f r a c t u r e j o i n t s i n one t y p e o f s a p r o l i t e a re n o t e f f e c t i v e l y a c t i n g as macropores, hence, t hey a re n o t ma jo r condu i t s f o r r a p i d wa te r f l o w . Schoeneberger e t a l . (1992) s t u d i e d va r i ous c o l o r zones around a ma jo r t y p e o f f r a c t u r e coated w i t h Mn ox ide i n t h e Piedmont r e g i o n and conc luded t h a t t h e c o l o r zones around t h i s t y p e o f f r a c t u r e a re developed as a r e s u l t o f wa te r movement. However, t hey i n d i c a t e d t h a t these f r a c t u r e s a r e no l o n g e r a c t i v e macropores. Amoozegar e t a l . (1991) s t u d i e d movement o f a number o f wastewater chemical c o n s t i t u e n t s th rough t h r e e d i f f e r e n t s a p r o l i t e s and t h e i r assoc ia ted s o i l s u s i n g i n t a c t and repacked columns. T h e i r r e s u l t s i n d i c a t e d t h a t a l l t h r e e s a p r o l i t e s had a narrower range o f pore s i z e d i s t r i b u t i o n as compared t o t h e i r r e s p e c t i v e s o i l s . For common anions and c a t i o n s found i n

wastewater, these saprol i tes exhibited attenuation capacities that were not significantly different from the attenuation capacity of their associated soils.
Most of the studies conducted to evaluate movement o f water through saprol i te determined the vertical saturated hydraul ic conductivity (K,,) of a variety of saprol i tes using intact columns collected in the vertical d~rection (We1 by, 1981; O'Brien and Buol, 1984; Amoozegar and Robarge, 1985; Simpson, 1986; and Vepraskas et a1 . , 1991a). Schoeneberger and Amoozegar (1990) reported K,,, o f a soil and saprolite continuum in five different directions (vertical, two horizontal, and two diagonal) at three different 1 andscape positions (ridge top, shoulder, and ridge nose). They indicated that the mean K,,, val ues for various directions were not significantly different from one another. Schoeneberger (1990) collected a large number of samples from the Bt, BC and C (saprolite) horizons at the above three landscape positions and determined that the BC horizon had the lowest K,,, compared to the Bt and saprol ite at all three landscape positions. He a1 so measured K,,, of the same horizons in si tu by the constant-head permeameter method (Amoozegar and Warrick, 1986) and found similar results.
Although a 1 imited number of studies (Martin, 1987; Amoozegar and Hoover, 1989; Amoozegar et al., 1991) have evaluated saprolite in relation to on-si te wastewater disposal systems, a comprehensive assessment of water movement and characterization of saprol i te properties specifically for o n 4 te wastewater di sposal purposes has not been compl eted.
Objectives
This study was conducted to evaluate a number of saprolites for their potential use as the direct receptacle of wastewater, i.e., for direct application of wastewater in septic systems. Another aim of the study was to determine the possi bil ity of assessing suitability of saprol i te for septic systems from auger borings (a practice that i s commonly used to evaluate soils for septic systems). The specific objectives of the study were:
1. to determine the physical, chemical, and morphological properties of a number of soil and saprolite sequences in the Piedmont and Mountain regions of North Carolina for wastewater disposal purposes,
2. to evaluate the effectiveness of saprol ite in removing the constituents of wastewater from septic systems placed in shallow soils underlain by saprol i te, and
3 . to attempt development of guidelines (or procedures) for field evaluation of saprol ite for use in septic systems.


MATERIALS AND METHODS
The study was divided into two parts. In one part, soil and the underlying saprolite were evaluated at 12 sites in the Piedmont and Mountain regions (Fig. 1, Table 2). These sites were selected based on their soils, geographic 1 ocation, and accessi bil i ty for an extended period o f time, usual ly in excess of three months. In the other part of the study, five septic systems in these two regions were selected for determining the distribution of a number of inorganic chemical s and monitoring soil water content and/or potential in soil and saprolite under their drainfield areas. Three of these systems were located in the Piedmont region (Wake and Chatham Counties), and two were in the Mountain region (Macon County) (Fig. 2). Soil and saprol ite samples were collected from these five sites only once, but the soil water content and potential monitoring was carried out for over one year.
Characterization of Soil and Saprol i te
Table 2 presents the location and general soil information for each of the twelve sites. In Jackson County, the soil and saprolite were evaluated at two locations (sites 10 and 11) less than 50 m apart because our field evaluation revealed that the materials at the two locations were substantially different. Some of the soils at the twelve sites were mapped prior to our study. However, each soil was reevaluated and placed in an appropriate soil series for this study.
Sample Collection and Preparation
A large pit was excavated at each site for describing the soil profile, classifying the soil, and collecting soil and saprolite samples for characterization. Major soil horizons were identified on one wall of the pit. Disturbed samples were then collected from each horizon in plastic bags and transported to the 1 aboratory for analysis. In the 1 aboratory, the disturbed samples were air dried, crushed, and passed through a 2-mm (No. 10) sieve. The sieved materials for each horizon were thoroughly mixed and stored for future analyses. In addition to these samples, an adequate (>1 kg) sample from each horizon was collected for a soil/saprolite bank to be used for future evaluation and training of sanitarians and soil scientists involved with design and operation of septic systems.
With one exception (site ll), intact (undisturbed) cores were collected from the soil surface down to a depth well within the saprolite from various locations in close proximity to the observation pit. These samples were collected with Giddir?s soil sampling equipment (Giddings Equipment Co., Fort Collins, CO) using a 3-inch soil sampling tube equipped with a 6.5 or 6.6 cm diameter, quick re1 ief cutting head. These samples were wrapped in plastic and transported to the laboratory in long semi-circular trays. In the

Figure 1. R e l a t i v e l o c a t i o n s o f t h e study s i t e s i n t h e Piedmont and Mountain reg ions f o r c h a r a c t e r i z i n g s o i l and saprol i t e .
F igure 2 . R e l a t i v e l o c a t i o n s o f t h e study s i t e s i n t h e Piedmont and Mountain reg ions f o r e v a l u a t i n g t h e performance o f s e p t i c systems.
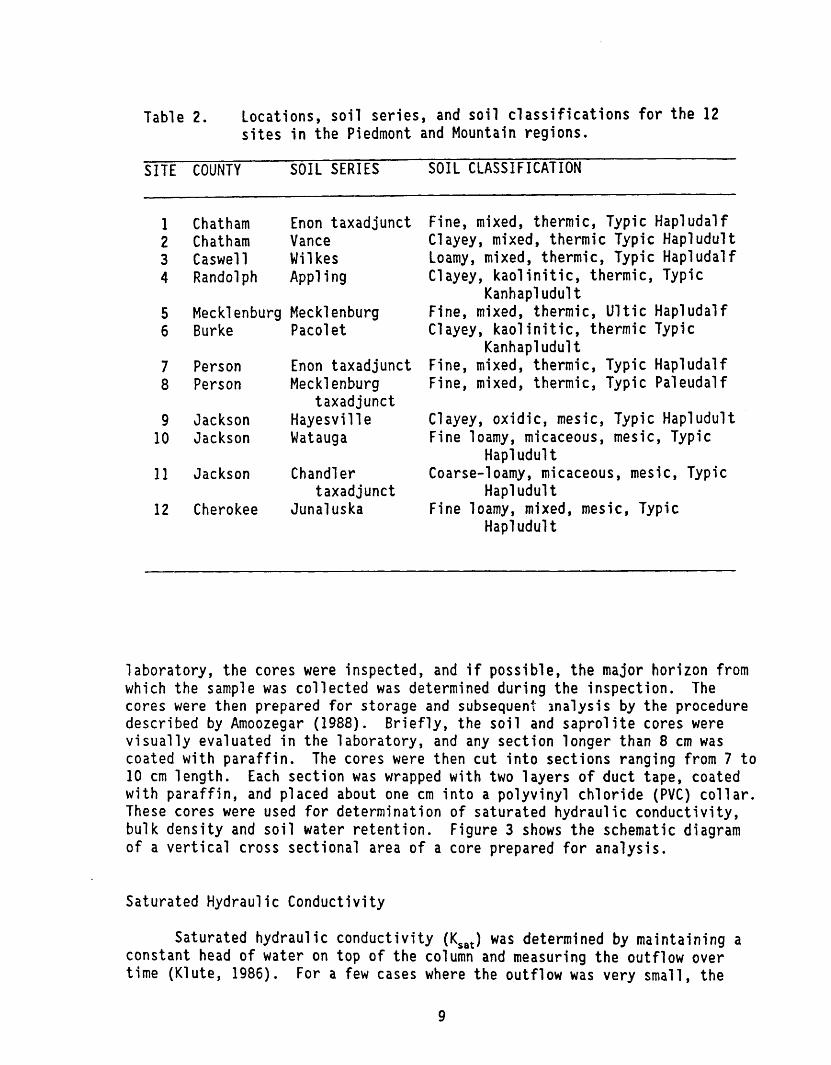
Table 2. Locations, soi l ser ies , and soil c lassif icat ions for the 12 s i t e s in the Piedmont and Mountain regions.
SITE COUNTY SOIL SERIES SOIL CLASSIFICATION
Chatharn Enon taxadjunct Chatham Vance Caswell Mi1 kes Rand01 ph Appl i ng
Meckl enburg Meckl enburg Burke Pacol e t
Person Enon t axad junct Person Mec kl enburg
taxadjunct Jackson Hayesvi 11 e Jackson Watauga
Jackson Chandler taxadjunct
Cherokee Junaluska
Fine, mixed, thermic, Typic Hapl udal f Cl ayey, mixed, thermic Typic Hapl udul t Loamy, mixed, thermic, Typic Hapl udal f Cl ayey, kaol ini t i c , thermic, Typic
Kanhapl udul t Fine, mixed, thermic, Ultic Hapludalf Clayey, kaol i n i t i c , thermic Typic
Kanhapl udul t Fine, mixed, thermi c, Typic Hapl udal f Fine, mixed, thermic, Typic Paleudal f
Clayey, oxidic, mesic, Typic Hapl u d u l t Fine loamy, micaceous, mesic, Typic
Hapl udul t Coarse-1 oamy, micaceous, mesic, Typic
Hapl udul t Fine loamy, mixed, mesic, Typic
Hapl udul t
laboratory, the cores were inspected, and i f possible, the major horizon from which the sample was collected was determined during the inspection. The cores were then prepared for storage and subsequent analysis by the procedure described by Amoozegar (1988). Briefly, the soil and saprol i te cores were visually evaluated in the laboratory, and any section longer than 8 cm was coated with paraffin. The cores were then cut into sections ranging from 7 t o 10 cm length. Each section was wrapped with two layers of duct tape, coated with paraffin, and placed about one cm into a polyvinyl chloride (PVC) col lar . These cores were used for determination of saturated hydraulic conductivity, bulk density and soi l water retention. Figure 3 shows the schematic diagram of a vertical cross sectional area of a core prepared for analysis.
Saturated Hydraul ic Conductivity
Saturated hydraul i c conductivity (K,,,) was determined by maintaining a constant head of water on top of the column and measuring the outflow over time (Klute, 1986). For a few cases where the outflow was very small, the

falling head procedure was employed for K,,, measurement. To measure conductivity, the cores were placed in large trays .and saturated from the bottom slowly. This was done to allow displacement o f air with water in the column, decreasing the possi bil i ty of air entrapment during conductivity analysis. After saturation was achieved, the cores were placed in funnels and the top part of each column was connected to a constant head device (Fig. 3). The amount of head on the columns varied slightly, but in general, adequate head was provided to obtain a gradient between 1.5 and 2. The outflow from each core was collected with time. In most cases, measurements were continued for more than 48 hours but hydraulic conductivity was calculated after 24 hours of measurement. For soil and saprol ite with high conductivity, measurements were carried out for a few hours to one day. Darcy's law
was used to calculate saturated hydraulic conductivity. In this equation, Q is the volume of outflow through the core during time t, A is the cross sectional area of the core, and i is the gradient (total hydraulic head difference, AH, across the column length, L, see Fig. 3).
Soil Water Retention
At the termination of the KSat measurement for each sample, the core was removed from the PVC collar and trimmed to about 7.5 cm length if necessary. The core was then placed in a buchner funnel fitted with a porous plate and resaturated again from the bottom. This was done to allow displacement of air through the top of the column and eliminate entrapped air that may have entered the column as a result of free drainage during hand1 ing of the core. After saturation, excess water from around the core in the buchner funnel was removed and a positive air pressure equal to 5 kPa (equivalent to -50 cm of soil water pressure head) was applied to the top of the column (Klute and Dirksen, 1986). The pressure was maintained on top of the column for at least 24 hours before the total outflow was measured. The air pressure on top of the column was then increased to 10 kPa (equivalent to -100 cm of soil water pressure head) and the outflow was measured at least 24 hours later. This step was repeated consecutively after increasing the air pressure on top o f the column to 20 and 30 kPa (-200 and -300 cm of soil water pressure heads, respectively). At the end of the measurement, the core was removed from the funnel and its total mass determined immediately. Selected number of cores were then cut in half for soil water retention at -100 kPa soil water pressure. The half-cores not used for further analysis and the remainder of cores not cut in half were weighed for water content determination. To determine the water content of each whole or half core, the paraffin and duct tape cover of the sample were removed and cleaned from soil materials. The weight of the cover was subsequently subtracted from the mass of the total core to obtain the mass of the wet soil at the end of soil moisture retention measurement. All the soil materials for each column were then placed in an oven at 105 to llo°C for 24 hours. After determining the mass of dry soil,

collection f lask
Figure 3 . Schematic diagram of the constant-head device for measuring saturated hydraul ic conductivity showing the cross sectional area of the core sample.

the soil water content at each level of soil water pressure (i .e . , pressure level applied to the soil core) was calculated using the volume of water drained from the soil core after each pressure increment and the amount of water retained by the soil core at the end of the measurement. The soil water content at -100 kPa soil water pressure (-1,000 cm soil water pressure head1) was determined using the undisturbed soil cores. Water contents at -500 and -1,500 kPa soil water pressures (equivalent to -5,000 and -15,000 cm soil water pressure heads, respectively), however, were determined using disturbed samples. This was done because soil water at high pressures is maintained on the surface of soil particles, whereas at low soil water pressure, water is held within the pores (Hillel, 1982).
Bul k Density
Bulk density of the soil and saprolite was determined by the core method using the oven-dried mass of each core and its volume (Blake and Hartge, 1986a).
Particle Size Distribution and Chemical Analyses
The disturbed soil samples collected from the horizons in the pits were used for particle size distribution and chemical analyses. Initially, the samples were air-dried in a vented room. Then, the samples were crushed using a wooden roller and passed through a 2-mm sieve. The t2-mm fraction was stored in plastic bags for future analyses.
Particle size distribution was determined by the pipet method (Gee and Bauder, 1986) using a 10 to 20 g air-dried sample. Each sample was first treated with 30% H,O, and heated in a constant temperature bath to remove its organic matter. The mineral particles were then sieved through a 300 mesh (0.05 mm) screen into a 1,000 mL cylinder. The sand portion that was retained by t h e 300 mesh sieve was oven-dried at 105 to llO°C and fractionated by dry sieving through a nest of sieves. The silt and clay fractions were determined by sampling the suspension in the 1,000 mL cylinder using a 25 rnL pipet (see Gee and Bauder, 1986).
Electrical conductivity (EC) and pH of the material collected from each horizon at each study site (except sites 7 and 8 in the Piedmont region) were determined using a 1:2 soil :water ratio. The soil water mixture was shaken for 1 hour and extracted through a filter paper. Electrical conductivity of the extract was determined using a conductivity bridge, and the pH was measured using a pH electrode.
The cation exchange capacity (CEC) of each one of the soil and saprolite samples collected from each pit (except sites 7 and 8 in the Piedmont region) was determined at pH 7 using the procedure for acid soils (Rhoades, 1982). A 2-9 air-dried sample from each horizon was used for this measurement. A

subsample from each horizon was also used for free iron oxide analysis. The CBD (ci trate-bicarbonate-dithioni te) procedure (01 son and Ell i s , 1982) was used for this analysis.
In Si tu Saturated Hydraul ic Conductivity
In situ saturated 'hydraulic conductivity (K,,) of soil and saprolite around the observation pit at each site was determ~ned by the constant-head we1 1 permeameter technique (Amoozegar and Warrick, 1986). The Compact Constant Head Permeameter introduced by Amoozegar (1989a) was used to measure the steady state flow rate of water (Q) under about 15 cm of water head (H) in a 6 cm diameter (r = 3 cm) auger hole dug to the desired depth. Measurements were carried out at different depths (t2 rn) and various locations within each site. The Glover equation (Amoozegar, 1989b)
was used for calculating K,,,. We attempted to measure the in situ K,,, of individual horizons. However, due to the i rregul ar boundaries between various horizons it was not always possible to accurately determine the soil horizon during the construction of the auger hole. As an alternative, we often measured the in situ K,,, at predetermined depths (e .g . , 50, 100, 150, and 200 crn), and tried to relate the depth of measurement to a given horizon within the soil profile. The locations for measuring K,,, with respect to the observation pit and the number of measurements at each horizon (or depth) were varied from site to site due to the differences between the physical characteristics of each site. In most cases, we tried to divide the site into a number of 10- by 10-m square areas and select a minimum of five areas randomly for measuring K,,, in situ. Within each square area, measurements were made at four different depths on a transect in the middle of the area. The distance between the locations on the transect was 1 m. Due to the presence of rocks, tree roots, and other constraints we were unable to measure K,,, at every location and depth (or horizon) we had planned.
We divided the possible saturated hydraulic conductivity profiles into four groups or types (Fig. 4). In all these groups the soil profile consists of Bt, BC and/or CB (transitional horizon), and C (saprol ite) horizons. We should note that for this purpose we are concerned only with the upper 2 to 3 m (or depth to the bedrock) of the soil-saprolite continuum. In Type I (Fig. 4 A ) , the K,,, decreases with depth from the top o f the Bt horizon into saprolite. In Type I 1 (Fig. 4B), K,,, increases with depth continuously to within the saprolite below the soil. In Type I 1 1 (Fig. 4 C ) , the conductivity decreases from the top of the Bt to the lower part of the Bt or the transitional horizon (BC or CB) before starting to increase with depth. In Type I V (Fig. 4D), maximum K,,, occurs in the lower part o f the Bt, in the transitional horizon, or top of saprolite. Both in situ and laboratory determined sets of K,,, values for each site were placed in one of these groups for assessing the hydraul ic conductivity.

RELATIVE Ksat
Figure 4. Schematic diagram of the four types of saturated hydraulic conductivity (K,,,) profiles (A) Type I, (B) Type 11, ( C ) Type 111, and (D) Type IV.

Other Analyses
For two s i t e s around Lake Hyco i n t h e no r the rn p a r t o f t h e Piedmont r e g i o n a more comprehensive eval u a t i o n o f s o i 1 and saprol i t e were performed. [NOTE: These s i t e s were se lec ted as t h e pr imary research s i t e s f o r a Ph.D. d i s s e r t a t i o n and were i n v e s t i g a t e d i n more d e t a i l . For i n f o r m a t i o n t h e reader i s r e f e r r e d t o Guer ta l (1992).] A d d i t i o n a l analyses were performed f o r these s i t e s t o b e t t e r understand the phys ica l , chemical, and m i n e r a l o g i c a l p r o p e r t i e s o f s o i l - s a p r o l i t e sequences, re1 a te t h e geomorphic p o s i t i o n i n t h e landscape t o t h e s o i l - s a p r o l i t e sequences i n t h e area, and assess t h e p r e f e r e n t i a1 movement o f so lu tes through s o i l and sapro l i t e .
A s e r i e s o f i n t a c t s o i l cores was c o l l e c t e d i n t h e h o r i z o n t a l d i r e c t i o n from t h e p i t w a l l a t each s i t e and analyzed f o r K,,,, unsaturated h y d r a u l i c c o n d u c t i v i t y ( ) bu l k densi ty , p a r t i c l e dens i ty , and s o i 1 water r e t e n t i o n . P a r t i c l e d e n s i t y was measured by t h e pycnometer method (B l ake and Hartge, 1986b) us ing bo th water and ethanol as d i s p l a c i n g l i q u i d . P a r t i c l e d e n s i t y was a1 so determined by t h e vacuum pycnometer method descr ibed by Amoozegar e t a1 . (1992). To measure La,, each i n t a c t co re was a1 1 owed t o sa tu ra te f rom t h e bottom i n a buchner funnel . Then, a pressure equ iva len t t o -90 cm s o i l water pressure head was app l ied t o t h e t o p o f t h e core and t h e ou t f l ow f rom t h e core was measured a t 1, 2, 5, 10, and 30 minutes and 1, 2, 4, 8, 22, and 28 hours. Unsaturated h y d r a u l i c c o n d u c t i v i t y was then c a l c u l a t e d us ing t h e procedure presented by Kool e t a l . (1985). S o i l water r e t e n t i o n was determined f o r s o i l water pressure heads o f 0 (saturated) , -25, -50, -75, -100, -150, -200, -300, and -400 cm by t h e procedure descr ibed e a r l i e r .
Undisturbed blocks, 8- by 6-cm and 5-cm t h i c k , were carved on t h e p i t w a l l s and covered w i t h Kubiena t i n s . Each b lock was then removed f rom t h e p i t w a l l and t ranspor ted t o t h e l a b o r a t o r y f o r t h i n s e c t i o n ana lys i s . F i r s t , water i n each b l o c k sample was removed by acetone exchange. Then t h e sample was impregnated w i t h p l a s t i c and mounted on a g lass s l i d e . A f t e r p o l i s h i n g t h e m a t e r i a l , a minimum o f 300 p o i n t s were i d e n t i f i e d and counted f o r each t h i n sec t ion . The general procedure f o r p repar ing t h i n sec t i ons through acetone exchange i s descr ibed by Vepraskas e t a l . (1991b). For more i n f o r m a t i o n on t h e procedure f o r t h i n sec t i on p repa ra t i on and t h e subsequent p o i n t count f o r t h i s study see Guerta l (1992).
The d i s t u r b e d samples c o l l e c t e d from t h e p i t w a l l s a t t h e two s i t e s were analyzed f o r p a r t i c l e s i z e d i s t r i b u t i o n , s o i l pH, CEC and e x t r a c t a b l e c a t i o n s . P a r t i c l e s i z e d i s t r i b u t i o n was determined by t h e p i p e t method. S o i l pH was measured us ing a 1:l so i l -water suspension and a 1:2 soil-O.01M CaC1, suspension. Ca t i on Exchange capac i t y a t pH 7 was determined w i t h a K j e l t e c System 1003 d i s t i l l i n g u n i t us ing 1N NaOH a l k a l i s o l u t i o n . To determine t h e e x t r a c t a b l e ca t i ons , 2.5 g sample o f each hor izon was e x t r a c t e d w i t h 50 mL o f 1M NH,OAc. Samples f rom a l l hor izons were a l so analyzed f o r Fe and Mn contents us ing t h e Na c i t r a t e - d i t h i o n i t e e x t r a c t i o n (Holmgren, 1967; S o i l Survey S t a f f , 1984), organic carbon content us ing t h e Val k l ey-Bl ack method

(Jackson, 1958), and clay mineralogy using x-ray diffraction analysis (Theisen . and Harward, 1962; Soil Survey Staff, 1984).
The root frequency distributions in soil and saprol ite horizons were determined in the pits at both locations. Four 1.2- by 1.2-m areas, each divided into 144 10- by 10-cm grid system, were laid out on the pit wall at each site. The number of roots appearing in each sampling cell was then recorded for root count analysis. Guertal (1992) describes the procedures for the above analyses in more detail.
To determine the clay mineralogy of the samples collected from these two sites by x-ray diffraction (XRD), the clay fraction from each sample was separated by the sedimentation procedure (Jackson, 1979). The fine sand and selected silt fractions were prepared for XRD by grinding them as a mineral- acetone slurry and then drying the suspension on glass slides. For a more comprehensive explanation for the procedures used for identifying various fractions see Guertal (1992).
Batch Study
A batch study was employed to obtain the attenuation capacity of the soil and saprolite samples collected from the pit walls at all the sites (except sites 7 and 8) for selected chemicals common in domestic wastewater. Three different stock solutions of 0.2M NH,N03, CaCl,, and KC1 were prepared and pl aced in a refrigerator. Sol utions of two different concentrations equivalent to 2 and 5 millimoles (mM) of each of NH,, NO,, C1 and K, and 4 and 10 mM of Ca were prepared from the respective stock solutions.
For each solution, two 10-g air-dried samples (duplicate) were placed in 100 mL centrifuge bottles. Fifty mL of the solution under consideration were added to each bottle. After sealing the bottles, they were placed on a mechanical shaker and shaken on low speed for 24 hours. The mixture was then centrifuged at 2,000 rpm for 10 minutes, followed :y filtration through a #42 filter paper. If the extractant was cloudy, it was centrifuged at 17,000 rpm for 20 minutes and filtered through a 142 paper again. A blank sample (i.e., no soil) was also prepared for each solution using the same procedure. The final extracts for each soil-solution combination and the blank samples were stored in a refrigerator before being analyzed for the ion(s) in the solution. Nitrate-N (NO3-N) and ammonium-N (NH,-N) were determined by the colorimetric method using the procedures described by Cataldo et a1 . (1975) and Cataldo et a1 . (1974), respectively. Potassium and Ca were analyzed using an atomic absorption spectrophotometer, and C1 was determined using a chl oridometer. This batch experiment procedure was used for both soil and saprolite samples and each of the two solutions at two different concentrations.
The amount of each ion attenuated by each soil or saprolite sample was calculated using the oven-dried mass of the material. To obtain the oven- dried mass of soil or saprolite sample used in this experiment, a sample from

each s o i l o r sap ro l i t e m a t e r i a l was used f o r d e t e r m i n a t i o n o f t h e wa te r con ten t . The wa te r c o n t e n t v a l u e was used t o c o n v e r t t h e mass o f t h e a i r - d r i e d sample (10 g) t o oven-dr ied b a s i s f o r t h e f i n a l c a l c u l a t i o n s .
Eva1 u a t i o n o f S e p t i c Systems
Three s i t e s i n t h e Piedmont and two s i t e s i n t h e Mounta in r e g i o n were s e l e c t e d f o r e v a l u a t i o n o f t h e performance o f t h e s e p t i c systems i n s t a l l e d i n s a p r o l i t e s o r sha l l ow s o i l s u n d e r l a i n by s a p r o l i t e . O f t h e t h r e e systems i n t h e Piedmont r e g i o n two were i n Wake County. One was a l a r g e community s e p t i c system s e r v i n g 26 homes i n a s u b d i v i s i o n i n n o r t h e r n p a r t o f Wake County, and t h e o t h e r was an i n d i v i d u a l s e p t i c system s e r v i n g a s i n g l e f a m i l y home i n t h e c i t y o f K n i g h t d a l e i n t h e e a s t e r n p a r t o f t h e county . The t h i r d system was f o r a rest-home f a c i l i t y i n Chatham County. [NOTE: E v a l u a t i n g these systems i n t h e Piedmont r e g i o n was t h e s u b j e c t o f ano ther Ph.D. d i s s e r t a t i o n (see Surbrugg, l 9 9 Z ) I . The two s e p t i c systems i n t h e Mounta in r e g i o n were i n t h e c i t y o f High1 and, Macon County, s e r v i n g a smal l commercial c e n t e r and a s i n g l e f a m i l y r e s i d e n t i a l d w e l l i ng , r e s p e c t i v e l y . The r e 1 a t i v e 1 oca t i ons o f t hese s i t e s w i t h i n t h e N o r t h C a r o l i n a a r e shown i n F i g . 2.
No r th Wake County S i t e
A l a r g e community s e p t i c system s e r v i n g 26 homes i n a s u b d i v i s i o n i n t h e F a l l s o f t h e Neuse watershed was s e l e c t e d f o r t h e s tudy. T h i s system was designed t o hand le 36,000 L (9,600 g a l l o n s ) o f wastewater p e r day u s i n g a LPP d i s t r i b u t i o n system composed o f mu1 t i p l e d r a i n f i e l d s . I n t h i s system, a c e n t r a l l y l o c a t e d pump t a n k a t t h e s i t e o f t h e d r a i n f i e l d s r e c e i v e s wastewater f rom t h e homes. Wastewater i s t hen pumped i n t o t h e 11 d r a i n f i e l d s once a day us ing an e l e c t r i c a l c o n t r o l system connected t o a s o l e n o i d v a l v e a t each o f t h e 11 d r a i n f i e l d s . A f t e r an i n i t i a l assessment o f t h e e n t i r e area f o r t h e d r a i n f i e l d s and e v a l u a t i o n o f t h e s o i l t h i ckness u s i n g auger bor ings , d r a i n f i e l d #11 was s e l e c t e d f o r m o n i t o r i n g and sam; ,ng. T h i s d r a i n f i e l d a rea was then surveyed t o l o c a t e i n d i v i d u a l d r a i n l i n e s u s i n g t h e i n i t i a l des ign p l a n f o r t h e system. We shou ld n o t e t h a t a l l t h e d r a i n f i e l d s f o r t h i s system were i n s t a l l e d i n a wooded area, t h e r e f o r e , t h e spac ing between t h e i n d i v i d u a l d r a i n l i n e s i s n o t u n i f o r m l y 150 cm (5 f t ) as recommended by Cogger e t a l . ( l98Za).
The s o i l a t t h e s i t e o f t h e s e p t i c system has been mapped as a C e c i l sandy 1 oam (c layey , kao l i n i t i c , t he rm ic Typ ic Kanhapl udu l t) ( S o i l Survey S t a f f , 1990) w i t h 2 t o 6% s lope (Cawthorn, 1970). The i n i t i a l assessment o f t h e s i t e i n d i c a t e d t h a t t h e s o i l s a t d r a i n f i e l d #11 a re sha l l owe r t o s a p r o l i t e than t h e r e s t o f t h e o t h e r d r a i n f i e l d areas. We de te rmined t h a t t h e s o i l a t t h i s d r a i n f i e l d i s an i n c l u s i o n o f t h e Paco le t s e r i e s ( a l s o a c layey, kao l i n i t i c , the rmic , Typ i c Kanhapl udul t ) w i t h i n t h e C e c i l mapping u n i t . The es t imated s o i l h o r i z o n dep th i n t e r v a l s , averaged f r om ove r 40 hand auger

bor ings , were: Ap, 0 t o 5 cm; B t l , 5 t o 30 cm; Bt2, 30 t o 70 cm; BC, 70 t o 95 cm; and C ( sap ro l i t e ) hor i zon , >95 cm. The sapro l i t e , t o a d e p t h o f 250 cm, c o n s i s t s o f l i g h t , m u l t i c o l o r e d m a t e r i a l s weathered f r om f e l s i c c r y s t a l l i n e rocks.
Moni t o r i n q S o i l Water and C h a r a c t e r i z i n q S o i l and Saprol i t e : S o i l wa te r con ten t and p o t e n t i a l were mon i to red a t t h i s s i t e u s i n g n e u t r o n therma l i z a t i o n t echn ique (Gardner, l986) , t ens iome t r y (Cassel and K lu te , l986) , and TDR ( t i m e domain r e f l e c t o m e t r y ) techno1 ogy (Topp e t a1 . , 1982).
Neutron access tubes cons t ruc ted f rom 2- inch (5 cm d iame te r ) a1 uminum i r r i g a t i o n p i p e were i n s t a l l e d t o 2.5 m depth about 75 cm f r o m t h e c e n t e r o f t h e t r enches a t f i v e l o c a t i o n s w i t h i n t h e d r a i n f i e l d area (F ig . 5). Two access tubes were a l s o i n s t a l l e d o u t s i d e t h e d r a i n f i e l d area t o p r o v i d e background da ta . The bot tom o f each access tube was permanent ly sea led w i t h a rubbe r s topper t o p reven t wa te r e n t r y f rom t h e bottom, and a r u b b e r s toppe r was p laced on t o p o f t h e t ube between measurement pe r i ods . A l l access tubes were i n s t a l l e d u s i n g a 5-cm d iameter hand auger. A t o t a l o f 27 u n d i s t u r b e d samples (3.6 cm i n d iameter and 7.6 cm l ong ) were c o l l e c t e d f r o m t h e h o l e s f o r t h e access tubes a t about every 50 cm i n t e r v a l s f o r g r a v i m e t r i c wa te r c o n t e n t and b u l k d e n s i t y analyses. S o i l samples taken f rom 50 cm ( f 1 0 cm) dep th were c o n s i s t e n t l y f r om t h e B t ho r i zons and t h e samples c o l l e c t e d f r o m 100 cm (f 15 cm) were f r om t h e BC hor izon . A l l t h e samples f rom 150 and 200 cm depths were f r om t h e C ( s a p r o l i t e ) hor i zon . One d i s t u r b e d sample was a l s o c o l l e c t e d immediate ly a f t e r e x t r a c t i o n o f each und is tu rbed core f o r p a r t i c l e s i z e d i s t r i b u t i o n ( a t 24 depth11 oca t i ons ) , p a r t i c l e dens i t y , c a t i o n exchange c a p a c i t y (CEC), and s p e c i f i c su r f ace area analyses. P a r t i c l e s i z e d i s t r i b u t i o n , b u l k d e n s i t y and p a r t i c l e d e n s i t y were determined by t h e procedures desc r i bed e a r l i e r . S p e c i f i c su r f ace area was de te rmined u s i n g d u p l i c a t e samples f rom each o f 50, 100, 150, and 200 cm dep ths by t h e e t h y l e n e g l y c o l monoethyl e t h e r (EGME) method (Ca r te r e t a l . , 1986).
Immediate ly a f t e r i n s t a l l a t i o n o f each access t ube a 30-second n e u t r o n probe coun t was ob ta ined a t each o f t h e 50 cm depth i n t e r v a l s u s i n g a T r o x l e r model 3300 neu t ron probe (T rox l e r E l e c t r o n i c Labo ra to r i es Inc. , Research T r i a n g l e Park, NC). These were used f o r deve lop ing s p e c i f i c c a l i b r a t i o n curves f o r s o i l solum (B t and BC) and sap ro l i t e (C) ho r i zons . Fo r 22 months, count numbers were ob ta i ned weekly a t 25 cm depth i n t e r v a l s f r o m 25 t o 225 cm depth. These coun t numbers were conver ted t o v o l u m e t r i c s o i l wa te r c o n t e n t u s i n g t h e a p p r o p r i a t e c a l i b r a t i o n curve.
Tensiometer banks; each c o n t a i n i n g t h r e e tens iometers a t 50, 100, and 150 cm depths; were i n s t a l l e d p a r a l l e l t o t h e d r a i n l i n e and about 1 m away f rom each neu t ron access tube i n s i d e t h e d r a i n f i e l d area and a t one l o c a t i o n o u t s i d e t h e d r a i n f i e l d area (see F ig . 5 ) . Tensiometers were c o n s t r u c t e d u s i n g 2.2 cm d iameter by 5 cm l o n g porous cups w i t h 1 b a r bubb l i ng p ressure . S o i l wa te r p o t e n t i a l was determined weekly f o r 22 months u s i n g a commerc ia l l y

X NP-6 Control , Solenoid (Gate Valve)
m Neutron Probe Access Locations NP-7 m Control
Tensiometer Bank (0.5. 1 .O. and 1.5 m depths)
Not to Scale (drainlines approximately 40 m long on 1.5 m centers)
F i g u r e 5. Schematic d iagram o f t h e p l a n v iew o f N. Wake County d r a i n f i e l d showing s o i l wa te r m o n i t o r i n g l o c a t i o n s .
a v a i l a b l e hand-held p ressu re t ransducer ( c a l l ed Tensimeter, S o i l Measurement Systems, Tucson, AZ) desc r i bed by M a r t h a l e r e t a1 . (1983). A 1 aser l e v e l was used t o survey t h e e l e v a t i o n o f t h e tens iometers f o r c a l c u l a t i o n o f t h e t o t a l h y d r a u l i c head a t each dep th and l o c a t i o n r e l a t i v e t o a common r e f e r e n c e l e v e l w i t h i n t h e f i e l d .
To measure s o i l wa te r con ten t i n t h e upper p a r t o f t h e p r o f i l e d i r e c t l y by TDR, a s e t o f s t a i n l e s s s t e e l wave-guides; 15, 30, 45, and 60 cm long; were i n s t a l l e d between t h e access tube and t h e t ens iome te r bank a t each o f t h e f i v e l o c a t i o n s w i t h i n and one l o c a t i o n o u t s i d e t h e d r a i n f i e l d f o r m o n i t o r i n g

soi l water content in the t o p 60 cm. The wave-guide pairs were equally spaced between the access tube and the tensiometer bank a t each location. A Trase System I , model 6050x1 (Soilmoi s ture Equipment Corp., Santa Barbara, CA) was used t o measure soi l water content. A to ta l of 10 measurements for each pair of wave-guides were made for a s ix months period.
Undisturbed ( intact) soi l samples were collected from the surface t o over 250 cm depth (well within saprol i t e ) a t 5 locations around the drainfield area. In the laboratory, a total of 41 cores were prepared fo r measuring vertical K,,, and soi l water retention analysis as described previously. Soil water contents were determined a t soi l water pressure heads of 0, -25, -50, -75, -150, -200, -300 and -400 cm using intact cores. Soil water contents a t -1,000; 5,000; and 1,500 cm soil water pressure heads were determined using di sturbed sampl es .
In s i t u K,,, was measured by the constant-head well permeameter technique using 15 cm head as described previously. Measurements were made for the B t , BC, and C horizons.
Precipitation a t th i s s i t e was measured using a recording rain-gauge.
Assessment of Solute ~ i s t r i bution Under the System: Soil and saprol i t e samples (1 to 2 kg) were collected a t 50 cm depth intervals from 50 cm t o 200 cm depth or bedrock, whichever was shallower, over three transects parallel to and three transects perpendicular t o the drainlines. Figure 6 presents the schematic diagram of the plan view of the sample locations in the drainfield area. Each of the transects parallel t o the drainlines was located halfway between two adjacent drainlines. The transects perpendicular to the drainlines were located approximately 2 m from the end of the drainlines and a t the middle of the drainfield close t o the manifold. These samples were designated as "SO" and will be called drainfield samples. A t four locations, samples were collected from the same depth intervals a t distances of 20 and 40 cm from the trench sidewalls (see Fig. 6) . These samples are referred t o as close proximity (CP) samples. Soi 1 and saprol i t e samples were a1 so coll ected from 8 locations outside the drainfield as background samples ( B K ) . A to ta l of 200 soil and saprolite samples were collected in five days a t t h i s s i t e . These samples were placed in plast ic bags and placed on ice in the f i e ld for transportation. In the laboratory, the samples were stored in a refr igerator until they were removed for analyses.
Samples were removed from the refrigerator and a i r dried in a well vented room. The air-dried samples were then crushed using a wooden rol l ing pin and passed through a 2-mm sieve. Minimal force was used for grinding the samples to avoid crushing of minerals and rocks. Any material n o t passing the 2-mm sieve was discarded. The t 2 - m m materials -were then stored in a i r - t ight polyethylene bags until analyzed.

0 '
Drainline + 40 cm'
0 - \
Perpendicular transects
A BK- 1
Figure 6. Schematic diagram o f t h e plan view o f t h e N. Wake County d r a i n f i e l d showing t h e 1 oca t ions o f d r a i n f i e l d (SO-#), background (BK-#), and c l o s e proximity (CP-#) s o i l and s a p r o l i t e samples.
S o i l and sap ro l i t e samples were i n i t i a l l y analyzed f o r wa te r s o l u b l e NH,-N and NO3-N us ing a 1:5 s o i 1 : d i s t i l l e d water r a t i o . The e x t r a c t s were analyzed f o r t h e s e two forms o f n i t rogen by t h e c o l o r i m e t r i c procedures u s ing a spectrophotorneter a s descr ibed by Cataldo e t a l . (1974, 1975). S ince t h e concen t r a t i on o f water s o l u b l e NH4-N and NO3-N were g e n e r a l l y be1 ow t h e d e t e c t a b l e 1 i m i t o f 0 .1 mg/L, t h e s o i l and s a p r o l i t e samples were e x t r a c t e d with a 1N K,S04 e x t r a c t a n t s o l u t i o n (Keeney and Nelson, 1982) .

Each of the air-dried soil or saprolite materials was thoroughly mixed in i t s respective bag. A subsample from each bag was obtained fo r gravimetric water content measurement. Another 5-9 subsample was then removed from each bag and mixed with 25 mL of the extractant solution (1:5 ra t io) in a 250 mL flask. The mixture was shaken for one hour before being f i l t e r e d through a #42 f i l t e r paper. The extract was refrigerated while a l l the samples from t h i s s i t e were extracted for analyses. The extracts were then analyzed fo r NH4-N and NO3-N in duplicate by the colorimetric procedure mentioned above. The concentration of each chemical in soil or saprol i te was calculated using the oven-dried mass of the sample.
The concentrations of exchangeable Ca, Mg, Na, and K in the soi l and saprol i te samples were determined using the procedure described by Robarge and Fernandez (1992). Exchangeable cations are defined as those bases tha t can be exchanged with other positively charged ions in a soi l solution. An unbuffered s a l t extractant (1N NH4C1) was used to minimize the ef fec t of pH on the exchangeable cations during extraction. A 5-9 subsampl e from air-dried material was mixed with 100 mL of the 1N NH,C1 solution (1:20 soi1:solution ra t io ) in a 250 mL glass flask. The mixture was shaken for one hour a t low speed and then passed through a 142 f i l t e r paper. Several drops of 12M HC1 was then added t o each extract t o preserve the sample and prevent microbial ac t iv i ty . The extracts were then refrigerated and analyzed within two weeks as recommended by Robarge and Fernandez (1992). All the chemical concentrations were converted to oven-dried basis using the water content of the ai r-dri ed materi a1 s determined earl i er .
The concentration of C1 in each sample was determined using a 1:5 soi1:dist i l led water extraction. The extracts were obtained using the procedure described above. Extracts were analyzed in duplicate using the procedure for automatic C1 t i t r a t ion (Cotlove e t a l . , 1958; Adriano e t a1 . , 1973).
Three different extractants (water, NaHCO, solution, and 0.5N HC1) were used for extracting PO4-P for analysis. In each procedure, a 5-9 subsample of air-dried material was removed from each bag, mixed with 25 mL of the extractant (a 1:5 soil :extractant r a t io ) , shaken for one hour , and f i l t e r e d through a #42 f i l t e r paper. The extracts were analyzed for PO4-P by the molybdate-ascorbic acid colorimetric method (01 sen and Sommers, 1982). In i t i a l ly , the samples were extracted using d i s t i l l ed water. When no water soluble P was detected in the samples, a NaHC03 solution was used t o extract the fraction of PO,-P adsorbed on the surface of part icles . Very low (below the detection l imi t ) PO4-P was detected by th i s procedure. Finally, 0.5N HC1 was used to extract the fraction of PO4-P that i s not t ight ly bound by soi l part icles . This procedure also did n o t show an appreciable amount of P in the soil or saprol i t e , indicating that the majority of the PO4-P fraction of soil P must be t ight ly held.
In addition t o the samples coll ected from the transects, background, and close proximity locations, other soil and saprolite samples tha t were

collected from the drainfield area were analyzed for pH and electrical conductivity (EC). Both pH and EC were determined using a 1:2 soil :water ratio (MacLean, 1982; Rhoades, 1982).
Knightdale Site
The septic system at this site serves a residential dwelling with a design loading of 360 gallons per day. The original septic system (a LPP system) installed at this site had failed when septic tank effluent did not infiltrate the soil from the trenches. An attempt to expand the drainfield using additional shallow LPP drainlines also had failed due to soil conditions. As a last resort, a pumped gravitational system, consisting of four 90 cm wide, 90 cm deep, and 30 m long trenches on 2.7 m spacing had been installed in saprolite prior to the initiation of this study. At the time this study was initiated the septic system appeared to be working properly.
The soil at this site had been mapped as an eroded Appl ing gravelly sandy loam (clayey, kaolinitic, thermic, Typic Kanhapludult) with 6 to 10% slope (Cawthorn, 1970). Evaluation of soil throughout the site using numerous hand auger borings confirmed the soil series as mapped. Briefly, the soil at this site has a very thin Ap, perhaps due to soil erosion before housing development or removal of the top soil during construction activities. In addition, it appeared that the top 40 cm of the soil in the open area of the property was more compacted than similar soils in the nearby wooded areas. The average estimated soil horizon depth intervals for the site were: Ap, 0 to 5 cm; Btl, 5 to 30 cm, Bt2, 30 to 80 cm, BC, 80 to 115 cm, and C (saprolite), >I15 cm.
Neutron access tubes and tensiometers were installed about 75 cm from the trenches at five locations within the drainfield area (Fig. 7). An additional access tube was installed outside the drainfield area as a control . Intact and disturbed samples were collected during the installation of neutron probe access tubes for obtaining a specific calibration curve and characterization of soil and saprolite under the drainfield area, respectively. Soil water content and potential were measured weekly for 12 months. Undisturbed soil cores were obtained for laboratory determination of K,,, and soil water characteristics. In situ K,,, of the Bt, BC and C horizons were also determined. The procedures for installation of the access tubes and tensiometers, collection of soil and saprolite samples, and the type of analyses performed were similar to those described for the N. Wake County site. No rain-gauge was installed at this site. Precipitation records from the National Weather Station (NWS) at North Carolina State University were used for this site.
To determine the distribution of a number of inorganic chemicals at this site a total of 142 soil and saprolite samples were collected from 30 locations on six transects (3 parallel and 3 perpendicular to the drain1 ines) at the initiation of the study (Fig. 8). The transects parallel to the

d r a i n l i n e s were l o c a t e d approximately 90 cm f rom t h e t r e n c h w a l l s . S i m i l a r t o t h e N. Wake County s i t e , samples were a l so c o l l e c t e d f rom c lose p r o x i m i t y t o t h e d r a i n l i nes a t f o u r 1 ocat ions. Twenty-three background samples were a1 so c o l l e c t e d f rom f i v e l o c a t i o n s as shown on Fig. 8. The samples were c o l l e c t e d from 50, 100, 150, and 200 cm depths i f poss ib le .
Wi th t h e except ion o f PO,-P and water e x t r a c t a b l e NH,-N and NO3-N, these samples were c o l l ected, prepared, and analyzed us ing s im i 1 a r procedures descr ibed f o r t h e Nor th Wake County s i t e .
m NP-16 Control
Distribution Box
m Neutron Probe Access Locations
Tensiometer Bank (0.5. 1 .O. and 1.5 m depths)
Not to Scale (drainlines approximately 30 m long on 3 m centers)
J
Single Family Detached House
Figure 7. Schematic diagram o f t he p lan view o f t h e Kn igh tda le d r a i n f i e l d showing s o i l water mon i to r ing l o c a t i o n s .
24

BK- 1 05' A
Perpendicular transects
F igu re 8. Schematic diagram o f t h e p l a n v iew o f t h e K n i g h t d a l e d r a i n f i e l d showing t h e l o c a t i o n s o f t h e d r a i n f i e l d (SO-#), background (BK-#), and c l o s e p r o x i m i t y (CP-#) s o i l and sap ro l i t e samples.
Chatham County S i t e
The s e p t i c system a t t h i s s i t e had been des igned t o hand le 3,000 g a l l o n s o f wastewater p e r day f rom a 24-bed rest-home. T h i s system i s composed o f two separate d r a i n f i e l d s . T h i s s e p t i c system uses a p ressure m a n i f o l d (Berkowi t z , 1985) t o d e l i v e r equal amounts o f wastewater t o i n d i v i d u a l t r enches w i t h i n each d r a i n f i e l d . The t o p o g r a p h i c a l l y 1 ower d r a i n f i e l d was s e l e c t e d f o r m o n i t o r i n g because t h e s o i l i s sha l l owe r t o sap ro l i t e w i t h i n t h i s d r a i n f i e l d area. The t r enches a t t h i s s i t e a re 90 cm wide and t h e spac ing between t h e t renches i s 2.7 m.

The soi l a t t h i s s i t e had been originally mapped as an Iredell loam (Jurney e t a1 . , 1937). Our prel iminary assessment of the so i l under the drainfield placed the soi l in Coronaca series . The so i l s in Coronaca ser ies are c lass i f ied as f ine, kaol ini t ic , thermic, Rhodic Paleudalf (National Cooperative Soil Survey, 1983). Soil horizon depths and boundaries were quite variable throughout the s i t e . Soil profi le characterization from auger borings was more d i f f i c u l t a t t h i s s i t e due t o disturbances tha t had resulted from the ins ta l la t ion of the trenches and the presence of a perched saturation zone near the 1 m depth beneath most of the drainfield area. The estimated soil horizon depth intervals a t t h i s s i t e were: Ap, 0 t o 5 cm; Btl, 5 t o 25 cm; B t 2 , 25 t o 60 cm; Bt3, 60 t o 90 cm; BC, 90 to 130 cm; and C ( saprol i te ) , >I30 cm.
Neutron access tubes and banks of tensiometers were instal led a t f ive locations within the drainfield area (Fig. 9). An additional access tube was instal 1 ed outside the drainfield area for obtaining background soi l water content data. Access tubes were installed to 2.5 m depth unless a saturation zone was detected during the instal lat ion of the access tube. For the locations with a saturated zone, the access tubes were instal led t o above the saturated zone. The procedures for instal lat ion of access tubes and tensiometers, and collection of intact and disturbed soi l and saprol i t e samples were simil a r t o those described previously. A specif ic cal i brat ion curve was developed for converting neutron probe count r a t ios t o volumetric water content. Soil water content and potential were monitored weekly for 12 months.
No intact cores were collected for laboratory measurement of K,,, and soil water characteristics due to problems associated with access t o the s i t e by heavy equipment and conditions of soil and saprolites a t the s i t e . In s i t u K,,, of B t , BC and C horizons were measured a t two locations in the drainfield area. Rainfall was not measured a t the s i t e . Instead, precipitation records from NWS were used for t h i s s i t e .
A total of 107 samples were collected from 28 iocations along s ix transects (3 parallel and 3 perpendicular t o the drainlines) within the drainfield area, and 28 samples were collected from 6 locations outside the drainfield as background samples. Similar t o the Knightdale s i t e , the transects parallel t o the drainlines were located about 90 cm from the trench walls. Samples were a1 so collected from close proximity a t two sides of one trench a t two locations (Fig. 10). A t t h i s s i t e , zones of saturation were observed a t certain locations within the drainfield area. The saturation zones were the resul ts of a natural perched water table and/or la tera l movement of wastewater from the trenches.. To avoid contamination of samples and creation of preferential flow path from the saturated zones t o the underlying s t r a t a , sampling was ceased as soon as a saturated zone was detected. All the samples collected from inside and outside of the drainfield were treated and analyzed using the same procedures used for the Knightdale s i t e .

TB-25. X NP-25 I Control
N
\ TB-26. X NP-26
m Neutron Probe Access Locations I Tensiometer Bank (0.5. 1 .O, and 1.5 m depths;
Not to Scale (drainlines approximately 45 m long on 3 m centers)
Figure 9. Schematic diagram o f t h e p l a n view o f t h e Chatham County d r a i n f i e l d showing s o i l water mon i to r i ng l o c a t i o n s .

Diversion Ditch Pressure Manifold
SO207 SO21 4 S0220' . . . P
sampl es.
Perpendicular transects
10. Schematic diagram o f the plan view o f the Chatham County d r a i n f i e l d showing the locat ions o f the d r a i n f i e l d ( S O - # ) , background (BK-#), and close proximity (CP-#) s o i l and s a p r o l i t e

Macon County S i t e s
Commercial Center: The sep t ic system a t t h i s center was designed with seven, 33 m (100 f t ) long gravi ty fed trenches. However, during inspection of the s i t e we could locate only 6 trenches. The sampling scheme and monitoring so i l water content and potential were designed fo r s i x dra in l ines .
Due t o the seasonal var ia t ions in the use of the s e p t i c system a t t h i s center , i t was d i f f i c u l t t o project the extent of i t s use. To evaluate the d i s t r ibu t ion of various chemicals, 256 so i l and saprol i t e samples were col lected a t 25 cm depth intervals from 25 t o 200 cm depth (or bedrock) from 35 locat ions inside and outside the drainf ie ld area (Fig. 11). The dra inf ie ld samples (SO-#) were col l ected on t ransects ha1 fway between the drain1 ines. The close proximity samples (CP-#) were collected a t dis tances of 20, 50, and 100 cm from the s ide o f the trench. Background samples (BK-#) were from locations a few meters outside the drainf ie ld . These samples were placed on ice and transported t o Raleigh fo r laboratory analyses. In the laboratory, these samples were prepared and analyzed for NH4-N, NO,-N, C1, PO4-P, Ca, Mg, Na, K , pHy and EC.
Seven neutron access tubes were also ins ta l led within the dra inf ie ld area of t h i s system (Fig. 12). Similar t o the s i t e s in the Piedmont region, the access tubes were constructed from 2-inch (5 cm diameter) aluminum i r r iga t ion pipe. The bottom of each tube was sealed with a rubber stopper. Soil samples were collected from 25 cm depth in te rva ls from 25 t o 200 cm depth for gravimetric so i l water content determination during in s t a l l a t i on of the access tubes. To construct a spec i f ic cal ibrat ion curve, a 30 s count measurement was obtained a t each depth where a sample was collected immediately a f t e r the ins ta l la t ion of the access tube. A t a l a t e r date , a s e r i e s of undisturbed so i l cores were obtained from the same depths a t a 30-cm distance from the access tubes fo r gravimetric determination of so i l water content and bulk density measurement along with a 30 s neutrsn probe count a t each depth. From these and previously collected data , ca l ib ra t ion equations were developed fo r t h i s s i t e .
Residential Dwellinq: A t the res ident ia l dwelling, s o i l and sapro l i te samples were col lected from 22 locations for determination of the d i s t r ibu t ion of various chemicals under the drainf ie ld area (Fig. 13). With a few exceptions, these samples were collected from 50, 100, 150, and 200 cm depths. Included in these samples are close proximity samples a t distances of 20, 50 and 100 cm from the drainl ines . Similar t o the samples from the Commercial Center, these samples were placed on ice and transported t o the laboratory. In the laboratory, EC and pH were determined using a 1:2 s o i l :water r a t i o . Other analyses performed were NH,-N and NO3-N extracted with 1N K,SO,, C 1 extracted with water, PO,-P extracted with 0.5N HCI, and Ca, Mg, K, and Na extracted with 1N NH,Cl as described for the samples from the Piedmont region.

Seven access tubes were also installed inside and outside the drainfield (Fig. 14). Similar to the shopping center site, samples were collected for soil water content determination during the instal 1 ation of access tubes a1 ong with a 30 s count number for each depth. The samples were collected at 25 cm intervals from 25 cm to 200 cm (or bedrock). Undisturbed samples at 25 cm depth intervals from a distance of 30 cm from the access tubes were collected at a later date for bulk density and gravimetric soil water content determination. A 30 s count reading for the neutron probe was obtained at each depth immediately after sampl ing for development of specific cal i bration equations for the site.
m SEPTIC TANK
o SO - Drainfield
A BK - Background
0 CP - Close Proximity
A I BK-5
A B K J
Figure 11. Schematic diagram of the plan view of the septic system at the commercial center in Macon County showing the locations of soil and saprol i te samples.

F m SEPTIC TANK
Neutron Probe Access Locatims
F igure 12. Schematic diagram o f t h e p l a n view o f t h e s e p t i c system a t t h e commerci a1 c e n t e r i n Macon County showing s o i l w a t e r moni tor ing l o c a t i o n s .
HOUSE
B K - 1A
o SO - Drainfield
A BK - Background
U CP - Close Proximity
Figure 13. Schematic diagram of the septic system at the residential dwelling in Macon County showing the locations of soil and saprol ite sampl es.

HOUSE
% NP-3 NP-6 ;IIC F m d
NP-4 - SEPTIC TANK
DOWNHIU i qC Neutron Probe Access Locations
Figure 14. Schematic diagram o f the plan view o f the septic system at the residential dwelling in Macon County showing soil water monitoring locations.


RESULTS AND DISCUSSION
C h a r a c t e r i z a t i o n o f S o i l and Sapro l i t e
The t w e l v e s i t e s f o r c h a r a c t e r i z i n g sap ro l i t e were s e l e c t e d t o r e p r e s e n t a range of s o i l and s a p r o l i t e p r o p e r t i e s . Due t o t h e s o i l and s i t e c o n d i t i o n s t h e c h a r a c t e r i z a t i o n procedure f o r s o i l and s a p r o l i t e v a r i e d f r om s i t e t o s i t e . We a t tempted t o measure a number o f p r o p e r t i e s , b u t t h e number o f measurements f o r each p r o p e r t y was n o t t h e same f o r a l l s i t e s . As ment ioned e a r l i e r , a t two s i t e s i n t h e Piedmont r e g i o n more comprehensive e v a l u a t i o n s o f s o i l and s a p r o l i t e were conducted because these s i t e s were s e l e c t e d as t h e p r i m a r y s u b j e c t o f a Ph.D. D i s s e r t a t i o n (see Gue r ta l , 1992). I n t h i s s e c t i o n , t h e r e s u l t s f o r each s i t e i n t h e Piedmont and Mounta in r e g i o n s w i l l be d iscussed independent l y . The o v e r a l l r e s u l t s o f a l l s i t e s w i l l be assessed c o l l e c t i v e l y i n a subsequent s e c t i o n o f t h e r e p o r t .
P i edmont Regi on
S i t e Number 1
T h i s s i t e was l o c a t e d near t h e smal l town o f Goldston G u l f on t h e sou th s i d e o f S t a t e Road 2306 i n t h e southern p a r t o f Chatham County. The genera l landscape o f t h e a rea i s g e n t l y r o l l i n g and t h e l a n d i s used p r i m a r i l y f o r a g r i c u l t u r e . The s o i l a t t h e s i t e was o r i g i n a l l y mapped as Goldston (Jurney e t a1 . , 1937). To eva lua te t h e s o i l p r o f i l e ( s o i 1 s o l urn and sap ro l i t e ) and c h a r a c t e r i z e t h e s o i l , an obse rva t i on p i t (5 m long , 2 m wide, and >2.5 deep) was dug w i t h a backhoe and s o i l morpholog ica l p r o p e r t i e s were eva lua ted on t h e w a l l s o f t h e p i t . The s o i l was c l a s s i f i e d as an Enon sandy loam t a x a d j u n c t . The p r o f i l e d e s c r i p t i o n f o r t h i s s i t e i s p rov ided i n Tab le 3.
Some v a r i a b i l i t y was observed on oppos i t e w a l l s o f t h e o b s e r v a t i o n p i t a t t h i s s i t e . S o i l and s a p r o l i t e samples were c o l l e c t e d f rom each p r o f i l e face t o about 2.5 m depth. Table 4 shows t h e depth, p a r t i c l e s i z e d i s t r i b u t i o n , f r e e i r o n ox ide ( represented as X Fe) and o r g a n i c m a t t e r c o n t e n t of v a r i o u s h o r i z o n s f o r samples c o l l e c t e d f rom b o t h w a l l s . Note t h a t t h e h o r i z o n boundar ies f o r t h e two oppos i te w a l l s were n o t t h e same, i n d i c a t i n g t h e s p a t i a l v a r i a b i l i t y t h a t must be cons idered i n s o i l e v a l u a t i o n . The p a r t i c l e s i z e d i s t r i b u t i o n s f o r each h o r i z o n on t h e two p r o f i l e s were f a i r l y s i m i l a r . The c l a y con ten t s o f t h e B t2 and B t3 h o r i z o n s on one s i d e were about 8% l e s s t h a n t h e corresponding va lues f o r t h e o t h e r s i d e o f t h e p i t . A t deeper depths, t h e c l a y con ten t o f t h e s a p r o l i t e was g e n e r a l l y l e s s t han 1%, w i t h sand-sized p a r t i c l e con ten t exceeding 85%. The i r o n o x i d e con ten t (% Fe on mass b a s i s ) was h i g h e s t i n t h e B t l and was about 1.3% f o r t h e C 1 ho r i zon . On one s i d e o f t h e p i t , however, t h e f r e e i r o n o x i d e con ten t o f deep sap ro l i t e was l e s s t h a n 0.5%, w h i l e on t h e o t h e r s i d e o f t h e p i t , t h e l e v e l o f i r o n ox ide was ove r 4.3%. Th i s d ramat ic inc rease i n t h e i r o n o x i d e corresponds w i t h h i g h CEC va lues determined f o r t h e C2 m a t e r i a l s c o l l e c t e d f rom t h i s p r o f i 1 e.

Tab le 3. S o i l c l a s s i f i c a t i o n and p r o f i l e d e s c r i p t i o n f o r S i t e Number 1.
S o i l S e r i e s : Enon sandy 1 oam ( t a x a d j u n c t ) C l a s s i f i c a t i o n : Fine, mixed, thermic Typic Hap1 udal f
AP
Btl
Bt2
Bt3
BC
C1
C2
0 t o 15 cm; d a r k brown (10YR 313) sandy c l a y loam; weak medium g r a n u l a r and subangula r blocky s t r u c t u r e ; f r i a b l e , sl i g h t l y s t i c k y and s l i g h t l y p l a s t i c ; ab rup t smooth boundary.
1 5 t o 28 cm; ye l l owi sh r ed (5YR 416) c l a y ; weak c o a r s e subangul a r blocky s t r u c t u r e ; very f i r m , s t i c k y and very p l a s t i c ; g radua l d i s con t inuous boundary.
28 t o 45 cm; s t r o n g brown (7.5YR 416) c l a y ; moderate c o a r s e subangul a r blocky s t r u c t u r e ; very f i r m , s t i c k y and p l a s t i c ; g radua l d i s con t inuous boundary.
45 t o 80 cm; s t r o n g brown (7.5YR 416) c l a y ; many c o a r s e prominent browni sh ye1 1 ow (10YR 618) mott l e s ; moderate medi urn and c o a r s e subangul a r blocky s t r u c t u r e ; f i rm , sl i g h t l y s t i c k y and p l a s t i c ; common d i s t i n c t b lack c o a t i n g s on peds; d i f f u s e wavy boundary.
80 t o 130 cm; s t r o n g brown (7.5YR 416) loam; many c o a r s e f a i n t s t r o n g brown (7.5YR 516) m o t t l e s ; weak medium and c o a r s e subangul a r blocky s t r u c t u r e ; f r i a b l e t o f i r m , s l i g h t l y s t i c k y and s l i g h t l y p l a s t i c ; few f i n e b l ack c o a t i n g s on peds; d i f f u s e wavy boundary.
130 t o 205 cm; 1 i g h t 01 i v e brown (2.5Y 516) loam; common medium d i s t i n c t da rk brown (7.5YR 4/4) m o t t l e s ; massive rock c o n t r o l l e d s t r u c t u r e ; f i r m , b r i t t l e , s l i g h t l y s t i c k y ; many t h i c k c l a y f lows i n h o r i z o n t a l pores ; f r a c t u r e pl anes seem f i l l ed w i th g r a y p a r e n t mate r i a1 . 205 t o 245 cm; va r i ega t ed 1 i g h t 01 i v e brown (2.5Y 5 / 6 ) , g r a y i s h brown (2.5Y 512) and b lack ( N 210); coa r se sandy loam; massive rock c o n t r o l l e d s t r u c t u r e ; f r i a b l e t o f i rm .

Tab le4 . P a r t i c l e s i z e d i s t r i b u t i o n , freeironoxide(Fe,O,reported as % Fe), and organic matter content pf various horizons f o r the Enon so i l a t S i t e Number 1 in the Piedmont region.
HORIZON DEPTH SAND SILT CLAY Fe ORGAN I C MATTER
AP Btl Bt2 Bt3 BC C1 C2
AP Btl Bt2 Bt3 BC C1 C2 C2 C2 C2 C2
For t he samples collected from the p i t , the pH of t he so i l and sap ro l i t e varied between 5.2 and 6.6, and the e l ec t r i ca l conductivity ( E C ) was l e s s than 1.53 x lo-* S/m (see Table 5) . We also analyzed the pH, EC and CEC o f some of the core samples collected throughout the study area (data not shown here). Surprisingly, the pH values fo r some of the cores from B t and BC horizons were over 8. This r e f l e c t s the mafic (basic) nature of the parent material a t t h i s s i t e . Overall, the pH of the core samples varied from 6.5 t o 8.3. Higher EC values were also observed fo r the core samples compared t o the p i t samples shown in Table 5. With one exception, no C E C l a rge r than 10 cmol,/kg was measured f o r a l l the cores from B t , B C , and C (saprol i t e ) horizons. The very large apparent CEC value fo r the C2 horizon, which contains very 1 i t t l e c lay, i s perhaps due t o the charges on s i l t - or f ine sand-sized pa r t i c l e s . In general, the sand-sized par t ic les in the upper par t of the p ro f i l e are

Table 5. Cation exchange capacity (CEC), e l ec t r i ca l ' conductivity (EC) , and pH of various horizons fo r the Enon s o i l a t S i t e Number 1 in the Piedmont region.
HORIZON pHa EC' c EC# APPARENT CEC'
AP 6.1 120 7.1 26.8 B t l 5.5 145 5.3 6.8 B t 2 5.2 153 5.9 9.0 Bt3 5.6 123 6.6 16.5 BC 6.1 103 6.4 27.0 C 1 6.5 74 6.3 71.6 C2 6.6 32 14.9 2980.0
--
@ Determined using 1:2 soi1:water r a t i o # Determined with a BaC1, procedure a t pH 7 and calculated on to t a l so i l
mass $ Calculated based on the mass of clay f ract ion * 1 pmho/cm = S/m -- 1 mmho/cm = 1 dS/m
composed of quartz and other minerals with re1 at ively small surface area and negative charges. In sapro l i te , the sand-sized par t ic les may be made of materials with re1 a t ive ly high cation exchange capacity.
The saturated hydraulic conductivity (K,,,) of the cores collected in ver t ica l di rect ion from around the p i t by the Giddi rq sampling probe a re shown in Fig. 15. For comparison purposes, the individual in s i t u K,,, values are a lso shown in t h i s f igure. We mentioned in the previous section t h a t the in s i t u K,,, measurements reported here were made under 15 cm of head a t the bottom section of an auger hole dug to the depth given in Fig. 15. Note t h a t , overal l , there i s a good agreement between the in s i t u and individual laboratory determined K,,, values. Ve should a lso mention t h a t i t i s often d i f f i c u l t t o determine the exact horizon from the inspection of a core t h a t i s collected from the top of the ground. Therefore, we do not subdivide the B t and C horizons in to t h e i r sub-horizons for reporting K,,,. This i s a l so t rue fo r the in s i t u K,,,. Because of the variations in the depth t o horizon boundaries over a landscape area, i t i s often d i f f i c u l t t o determine the exact horizonation of the prof i le from the small auger boring f o r measuring K,,, in s i t u . For s o i l s with thick horizons, however, i t will be r e l a t i ve ly easy t o determine the major horizon fo r the bottom section of the auger hole where K,,, i s measured.

Ksat, cm/d
Figure 15. In situ and laborat
Lab In Situ
ory determined saturated hydraulic conductivity (K,,,) of the Enon soil at Site Number 1 in the Piedmont region.
At the boundary of the Ap and Bt, K,,, was about 1 .X cm/d. Below the Ap horizon, K,,, shows an increase with depth from the top of Bt to saprolite at about 180 cm depth. In the upper 30 cm depth, the conductivity of the Bt horizon was less than 0.4 cm/d. From 30 to 50 cm depth, K,,, values for the cores had a maximum value of 1.46 cm/d. The conductivity was higher in the lower part of the Bt (50 to 80 cm depth interval) and ranged from 0.02 to 7.9 cm/d. In the BC horizon, K,,, ranged between 0.4 and 3.7 cm/d. In saprolite, the conductivity increased significantly with depth. The lowest measured value for saprol ite was 1.2 cm/d at 100 cm depth and the highest value was 74 cm/d at 150 cm depth. Overall, the saturated hydraulic condllctivity at this site increases with depth from the Bt into saprolite, and rt, lects Type I 1 shown in Fig. 4.
The arithmetic and geometric mean values and the coefficient of variations (CV = standard deviation x 100Jmean) for 1 aboratory determined and in situ K,,, for Bt, BC, and C (saprolite) horizons are shownin Table 6. The

Table 6. Mean, coefficient of variabi l i ty (CV), number of samples ( N ) , and depth interval for saturated hydraul i c conductivity determined in the laboratory and in s i t u f o r the Enon soi l a t S i te Number 1 in the Piedmont region.
DEPTH A R I T H M E T I C GEOMETRIC HORIZON INTERVAL N MEAN CV MEAN
cm Laboratory Method
In Situ
@ Depth intervals are for a l l the cores collected from various depths/locations that were placed in a major horizon for the s i t e .
# Depth intervals are for the bottom section of the holes under the constant head of water ( i .e. , from the top of the water level in the shallowest hole t o the bottom of the deepest hole within each horizon).
highest level of variation was within the B t horizon where the CV for the arithmetic mean was about 180%. For the BC and C horizons CV values for the arithmetic mean were 63 and 80%, respectively. I t has been shown that K,,, i s a highly variable soi l property with CV exceeding 100% (Warrick and Nielsen, 1980). Our CV resul t for the B t agrees with the values reported in the 1 i terature. For saprol i t e , however, the CV i s l e s s than 50% of the CV for the B t , indicating tha t saprolite a t t h i s s i t e i s n o t as variable as the so i l above i t .
In general, i t i s expected tha t the in s i t u determined K,,, values will be less than laboratory determined K,., using cores collected from the same depth interval where in s i tu measurements are made. According t o Bouma (1982), high conductivity values may resul t from the presence of macropores

extending t h r o u g h the length of soil columns. When a macropore extends the length of a column, water that i s applied t o the top of the core t ravels rapidly t o the bottom of the core through the macropore. Once water reaches the bottom face of the core, i t moves freely and rapidly out of the core resulting in relat ively high K,,, values. In the f i e ld , on the other hand, the macropores generally terminate in the soi l matrix; therefore, a f t e r i n i t i a l saturation, water does n o t move through the macropores freely. This resul t s in more uniform and somewhat lower in s i t u K,,, values. In addition, higher laboratory determined K,,, values relat ive t o the in s i t u K,,, of the B t horizons with relat ively high clay content may be due t o the smearlng of the auger hole sidewall during i t s construction. Brushing the hole sidewall before measurement i s recommended for removing the smearing i f soi l water content i s n o t excessively high t o cause resealing of the hole side wall.
Note t h a t a t t h i s s i t e there i s a good agreement between the individual and mean K,,, values of the BC and C horizons determined in the laboratory and in s i t u . This i s perhaps due t o the lack of planar voids and the absence of smearing of the auger hole side wall due t o higher sand content in these horizons. Schoeneberger and Amoozegar (1990) expl ain the re1 ationship between the laboratory and in s i tu determined K,,, values for another type of so i l - saprol i t e sequence. For the B t horizon, we could only obtain one in s i t u K,,, value due t o problems associated with boring an auger hole in sticky clayey materi a1 s .
The mean, standard deviation, and number of observations (measurements) for b u l k density and water retention of the B t , BC, and C horizons a t various soil water pressure heads are given in Table 7. Note tha t the var iabi l i ty of the bulk density for a l l three horizons i s f a i r l y small with CV ( n o t given in the table) of 13.3, 3.1, and 10.5% for the B t , BC, and C horizons, respectively.
Water retention a t each of the pressure heads between 0 and -300 cm (using undisturbed cores) also had a low variabi l i ty . The CV values for a l l horizons and pressure heads between 0 and -300 crn were less than 35.5%. The BC horizon had the lowest CV for each of the pressure heads compared t o the other two horizons. These results agree with the resul t s reported in the l i t e ra tu re (Warrick, and Nielsen, 1980). For soi l water pressure heads of -1,000, -5,000, and -15,000 cm the CV values for the B t horizon were l e s s t h a n 17.3%. The greatest amount of water loss between zero (saturation) and -400 cm soi l water pressure heads (14%) was for saprolite. The B t horizon, on the other hand , l o s t only 5.5% water between the same pressures. More water was held a t -15,000 cm soi l water pressure head by the B t material than was held by saprol i t e a t -100 cm pressure head. Overall, about 1/3 o f the pores in th i s saprol i te are larger t h a n 0.01 mm in diameter. In contrast, 62% of the pores in the B t horizon of th i s soil are small pores l e s s than 1.9 x 10" mm in diameter. In the BC horizon, the pores larger than 0.01 mm in diameter comprise about 22% of a l l the pores.

NLn . . o m - *
mLn Loo . . - o m
S L - A W =>Z m w
n

S i t e Number 2
T h i s s i t e was l o c a t e d i n t h e n o r t h e r n p a r t o f Chatham County nea r highway 15-501. The l a n d a t t h e s tudy area had a g e n t l e s l o p e o f 0 t o 2%, and t h e v e g e t a t i o n was g rass . [NOTE: The owner o f t h i s s i t e had p l a n s t o deve lop t h e a rea f o r housing.] No new s o i l survey i n f o r m a t i o n i s a v a i l a b l e f o r t h i s s i t e . To e v a l u a t e s o i l morpho log ica l p r o p e r t i e s and o b t a i n samples f r o m v a r i o u s ho r i zons f o r analyses, an obse rva t i on p i t , app rox ima te l y 3 m deep, was dug w i t h t h e backhoe i n t h e m idd le o f an open f i e l d . Va r i ous ho r i zons were i d e n t i f i e d and desc r i bed on t h e w a l l s o f t h e p i t and t h e s o i l s e r i e s was i d e n t i f i e d as Vance sandy loam (Table 8). A d d i t i o n a l samples f r om below 3-m dep th were c o l l e c t e d f rom t h e bo t tom o f t h e p i t u s i n g a hand auger.
The Ap h o r i z o n was about 15 cm t h i c k , and t h e B t h o r i z o n was d i v i d e d i n t o t h r e e subhor izons. Sapro l i t e s t a r t e d a t app rox ima te l y 178 cm depth. Maximum c l a y c o n t e n t (61%) occu r red i n t h e Bt2, and decreased c o n t i n u o u s l y w i t h dep th t o l e s s t h a n 2% below 380 cm dep th (Table 9). The s i l t c o n t e n t a l s o decreased f r om t h e t o p o f C 1 t o about 470 cm depth. The sand c o n t e n t o f C 1 was about 30% and inc reased con t i nuous l y w i t h dep th t o 470 cm depth. S l i g h t i nc rease i n c l a y and s i l t con ten t was measured i n t h e sample c o l l e c t e d b y t h e hand auger f r om 470 t o 500 cm dep th i n t e r v a l . The f r e e i r o n o x i d e (as Fe) o f t h e C1 and C2 comprised more t h a n 1% o f t h e mass o f sap ro l i t e . I n sap ro l i t e , below 300 cm depth, t h e Fe-Fe,03 con ten t was about 0.5%.
The pH va lues f o r t h e B t ho r i zons were s l i g h t l y h i g h e r t h a n t h e pH o f sap ro l i t e ho r i zons (Tab1 e 10). Throughout t h e p r o f i 1 e, t h e s o i 1 and s a p r o l i t e remain a c i d i c w i t h pH rang ing between 4.9 and 5.8. The Ap h o r i z o n had t h e h i g h e s t EC, b u t t h e EC va lues f o r t h e B t and C ho r i zons were between 2.0 x t o 4.0 x 1 0 ' ~ S/m (20 and 40 pmohs/cm) . The CEC va lues measured f o r t h e B t ho r i zons were i n genera l h i g h e r t h a n t h e CEC f o r s a p r o l i t e hor i zons . Howeversthe apparent CEC f o r t h e sap ro l i t e was much g r e a t e r t h a n t h e apparent CEC f o r t h e B t hor i zons . T h i s i s perhaps due t o t h e types o f t h e c l a y m ine ra l o f t h e B t and s a p r o l i t e ho r i zons and/or t h a t t h e s i l t - and sand- s i z e d f r a c t i o n s o f sap ro l i t e c o n t r i b u t e s i g n i f i c a n t l y t o t h e CEC.
F i g u r e 16 shows t h e K,,, o f t h e i n t a c t co res c o l l e c t e d f r om v a r i o u s depths and l o c a t i o n s around t h e obse rva t i on p i t . The i n s i t u K,,, va lues a r e a1 so shown f o r comparison purposes. The a r i t h m e t i c mean, c o e f f i c i e n t o f v a r i a t i o n , geomet r i c mean, and t h e number o f obse rva t i ons (i .e., number o f i n t a c t cores o r i n s i t u measurements) f o r l abo ra to r y -de te rm ined and i n s i t u - measured K,,, a re p resen ted i n Tab le 11. O v e r a l l , t h e r e was good agreement between t h e i n s i t u and t h e i n d i v i d u a l l a b o r a t o r y de te rmined K,,, va lues f o r a l l ho r i zons . We shou ld n o t e t h a t t h e h o r i z o n d e s i g n a t i o n s f o r t h e i n s i t u va lues determined a t t h r e e d i f f e r e n t depth i n t e r v a l s shown i n Tab le 11 were se lec ted-based on t h e genera l h o r i z o n boundar ies observed i n t h e f i e l d . Therefore, t h e i n s i t u mean va lues should n o t be d i r e c t l y compared w i t h t h e l abora to ry determined v a l ues u s i n g cores f rom d i f f e r e n t depths.

Table 8. S o i l c l a s s i f i c a t i o n and p r o f i l e d e s c r i p t i o n f o r S i t e Number 2.
S o i l Ser ies: Vance sandy loam C l a s s i f i c a t i o n : Clayey, mixed, thermic Typ ic Hap1 udul t
Ap 0 t o 15 cm; da rk brown (10YR 3/3) sandy loam; moderate medium g r a n u l a r (0-3 cm) then moderate medium subangul a r b l ocky; f r i a b l e .
B t l 15 t o 35 cm; y e l l o w i s h .red (5YR 5/6) c lay ; moderate medium p r i s m a t i c s t r u c t u r e p a r t i n g t o moderate coarse and medi um subangul a r b l ocky; very f i r m , s t i c k y and p l a s t i c ; many coarse prominent brown (7.5YR 5/6) c l a y f i l m s .
Bt2 35 t o 60 cm; y e l l o w i s h r e d (5YR 5/6) c lay ; weak coarse p r i s m a t i c s t r u c t u r e p a r t i n g t o moderate medium t o coarse subangular b locky and weak ve ry coarse p l a t y ; f r i a b l e , s t i c k y and p l a s t i c ; moderate coarse prominent redd ish brown (5YR 5/4) c l a y f i l m s .
Bt3 60 t o 100 cm; mo t t l ed y e l l o w i s h red (5YR 5/6), redd ish y e l l o w (7.5YR 6/8 and 7.5YR 8/6) c l a y loam; weak medium and coarse subangular b locky s t r u c t u r e ; f r i a b l e , s l i g h t l y b r i t t l e , s l i g h t l y s t i c k y , s l i g h t l y p l a s t i c .
BC 100 t o 142 cm; mo t t l ed y e l l o w i s h r e d (%YR 5/6), redd ish y e l l o w (7.5YR 6/8 and 7.5 YR 8/6) sandy c l a y loam; massive; f r i a b l e , s l i g h t l y
s t i c k y .
CB 142 t o 178 cm; mo t t l ed y e l l o w i s h r e d (5YR 5/8), redd ish y e l l o w (7.5YR 6/8 and 7.5YR 8/6) loam; f r i a b l e , s l i g h t l y b r i t t l e , s l i g h t l y s t i c k y .
C 1 178 t o 250 cm; mo t t l ed redd ish ye l l ow (7.5YR 8/6 and 7.5YR 6/8) and y e l l o w i s h r e d (5YR 5/6) sandy loam; massive; f r i a b l e t o ve ry f r i a b l e , s l i g h t l y s t i c k y ; b lack manganese coat ings i n f r a c t u r e planes.
C2 250 t o 350 cm; mo t t l ed redd ish ye l l ow (7.5YR 8/6 and 7.5YR 6/8) s t r o n g brown (7.5YR 5 /8 , -ye l low (10YR 8/8) and wh i te (IOYR 8/2) sandy loam; massive; very f r i a b l e ; b lack manganese coat ings i n f r a c t u r e planes.

'ab l e 9. P a r t i c l e s i z e d i s t r i b u t i o n , f r e e i r o n oxide (Fe,O, reported as % Fe), and organic rnatt2r content o f var ious horizons f o r t h e Vance s o i l a t S i t e Number 2 i n the Piedmont region.
HORIZON DEPTH SAND SILT CLAY Fe ORGAN I C MATTE Fa
A P B t l Bt2 Bt3 BC CB C 1 C 2 c3#
# Samples below 295 cm depth were co l l ec tea w i t h an auger from t h e bottom o f the p i t .

Table 10. Cat ion exchange capac i t y (CEC), e l e c t r i c a l c o n d u c t i v i t y (EC), and pH o f va r i ous hor izons f o r t h e Vance s o i l a t S i t e Number 2 i n t h e Piedmont region.
HORIZON PH' EC' c EC' APPARENT CEC'
AP B t l
Bt2 Bt3 BC CB C 1 C2 c3*
@ Determined us ing 1:2 s o i l :water r a t i o # Determined w i t h a BaC1, procedure a t pH 7 and c a l c u l a t e d on t o t a l s o i l
mass $ Ca lcu la ted based on t h e mass o f c l a y f r a c t i o n * Samples below t h i s ho r i zon were c o l l e c t e d by a hand auger f rom t h e
bottom o f t h e p i t

Ksat, cmld
.01 .I 1 10 1 0 0 1 0 0 0
Lab In Situ
Figure 16. I n s i t u and l a b o r a t o r y determined sa tura ted h y d r a u l i c c o n d u c t i v i t y (K,,,) o f t h e Vance s o i l a t S i t e Number 2 i n t h e Piedmont reg ion .
For t h i s s i t e , we d i d n o t have i n s i t u measurements i n t h e upper p a r t o f t h e B t hor izon, b u t t h e core da ta i nc lude c o n d u c t i v i t y va lues f rom t h e Ap t o approximate ly 3 m below t h e sur face. I n t h e Ap p a r t o f t h e s o i l p r o f i l e , K,,, o f t h e cores were between 179 and 535 cm/d w i t h an a r i t h m e t i c average va lue o f 358 cm/d. The c o e f f i c i e n t o f v a r i a t i o n (36%) was r e l a t i v e l y smal l compared t o t h e repo r ted values (Warr ick and Nielsen, 1980) and, as expected f rom t h e C V value, t h e geometr ic mean was f a i r l y s i m i l a r t o t h e a r i t h m e t i c mean. The c o n d u c t i v i t y o f t h e i n t a c t cores determined i n t h e 1 abora tory decreased f rom t h e t o p o f t h e B t hor izon t o values l e s s than 0.1 cm/d. The h ighes t degree o f v a r i a b i l i t y f o r t h e p r o f i l e a t t h i s s i t e was observed i n t h e B t ho r i zon i n d i c a t i n g a very skewed d i s t r i b u t i o n . Th is CV va lue f o r t h e B t ho r i zon i s much h ighe r than what i s observed i n o the r s tud ies (Warr ick and Nie lsen, 1980; Schoeneberger and Amoozegar, 1990). The geometr ic mean va lue f o r t h e 12 samples was 1.5 cm/d which i s about 2% o f t h e a r i t h m e t i c mean. The

conductivity of the cores coll ected from the transitional horizon (BC) varied from <0.1 to 49 cm/d. Variability in the BC horizon was also high, and both the arithmetic and geometric means were the smallest in their respective groups of means. In saprol ite, K,,, was not uniform with depth, and it had an arithmetic average of 99 cm/d and a CV of 121%. Although we did not measure K,,, below 3 m depths, it appears that K,,, is decreasing below 2.5 m depths. Overall, the minimum K,,, occurs in the lower Bt and perhaps upper BC horizon. Based on the conductivity of the cores, the K,,, profile at this site fits Type I11 (see Fig. 4).
Table 11. Mean, coefficient of variability (CV), number of samples (N), and depth interval for saturated hydraul i c conductivity determined in the laboratory and in situ for the Vance soil at Site Number 2 in the Piedmont region.
DEPTH ARITHMETIC GEOMETRIC HORIZON INTERVAL N MEAN CV MEAN
cm laboratory Method
In Situ
@ Depth intervals are for a1 1 the cores collected from various depths/locations that were placed in a major horizon for the site.
# Depth intervals are for the bottom section of the holes under the constant head of water (i .e., from the top of the water level in the shallowest hole to the bottom of the deepest hole within each horizon).

The mean, standard deviation, and number of samples analyzed for bulk density and soi l water retention between zero and -15,000 cm water heads are given in Table 12. The bulk density of the cores collected from the B t horizon varied between 1.15 and 1.44, and for saprol i te bulk density varied between 1.11 and 1.58 g/cm3. Considering the high sand content of the C horizons (see Table 9) , saprol i t e has re1 atively high to ta l porosity compared t o the other horizons. The volumetric water content of saprol i t e a t zero
3 3 pressure head (saturation) i s approximately 0.47 m /m (47%). The amount o f water l o s t between zero and -300 cm pressure head (approximately 16%) was highest for saprol i t e . For the same change in so i l water pressure, the water contents of the Ap, B t , and BC(and CB) decreased by 14%, 7.3% and 9.2%, respectively. A t -15,000 cm pressure head the B t horizon holds more t h a n 25% water while saprol i te can only hold 13.2%. On the average, about 32% of the pores in saprol i t e are larger than 0.01 mm in diameter and about 72% are larger than 2 x 10.' mm in diameter. These resul t s are in agreement with the clay and sand contents as well as the saturated hydraulic conductivity of both horizons.
S i te Number 3
This s i t e was located near Lake Hyco in Caswell County. The man-made lake was original ly bui l t as cooling water supply for a power plant. In recent years, however, the lake i s used more as a recreational lake and interest has increased substanti a1 ly to develop the properties around the 1 ake for permanent or summer vacation homes. As a resul t , the demand for using septic systems around the lake has increased dras t ica l ly . However, due t o the shallowness of some of the so i l s , local and s t a t e health of f ic ia l are concerned with the possibili ty of fa i lure of sept ic systems which may resul t in contamination of the lake.
The general, terrain around the lake i s ro l l ing, and the so i l s are highly variable. The limitations of the so i l s around the lake are similar t o the ones encountered in many parts of the Piedmont and Mountain regions. Therefore, we selected three s i t e s with different s o i l s in two counties around the lake. As we mentioned ear l ie r , two of the s i t e s ( t 7 and f8) were used as the research s i t e s for a Ph.D. degree dissertat ion (Guertal, 1992).
The study area was on a t r ac t of land facing the lake. Soil conditions a t t h i s s i t e are quite variable and the slope i s more than 10% near the lake shore. The vegetation a t the study area was permanent t a l l fescue grass. An observation p i t was dug in the upper part of the property where slope was between 1 and 5%. The soil profile was described in the p i t (Table 13), and bulk samples were obtained from various horizons (from Ap t o the Cr) for 1 aboratory analyses and for our soi 1 /saprol i t e sample bank for training purposes. The horizon boundaries and thickness identif ied in the p i t varied considerably. The depth values reported in Table 13 are for one section of the observation p i t and are quite different from the perceived horizon designations placed on the undisturbed cores taken around the p i t . The soi l a t the s i t e was classif ied and placed in the Wil kes ser ies . We should note t h a t due to the hardness of materials, i t was impossible t o d r i l l an auger


Table 13. S o i l c l a s s i f i c a t i o n and p r o f i l e d e s c r i p t i o n f o r S i t e N u m b e r 3 .
S o i l S e r i e s : Wilkes c l a y loam C l a s s i f i c a t i o n : Loamy, mixed, thermic , sha l low Typic Hapludalf
Ap 0 t o 8 cm; d a r k brown (IOYR 3 1 3 ) c l a y loam; moderate medium subangular blocky structure; f i rm, s t i c k y and p l a s t i c ; many fine-medium r o o t s ; c l e a r smooth boundary.
B t l 8 t o 14 cm; s t r o n g brown (7.5YR 516) c l a y loam; moderate medium angu la r and subangular blocky s t r u c t u r e ; f i r m , s t i c k y and p l a s t i c ; v a r i e g a t e d green and red c o l o r s ; da rk brown c o a t i n g s on both t h e horizon and v e r t i c a l ped f a c e s ; many medium-fine r o o t s ; c l e a r smooth boundary.
Bt2 14 t o 35 cm; s t r o n g brown (7.5YR 5/6 and 7.5YR 416) and very d a r k brown (IOYR 212) c l a y loam; weak medium subangul a r blocky s t r u c t u r e ; f i rm , s t i c k y and p l a s t i c ; many dark brown (IOYR 312) c l a y f i l m s , common f i n e bl ack Mn and Fe ( N 210) c o a t i n g s i n 1 ower v e r t i c a l ped f a c e s ; many f i n e r o o t s i n v e r t i c a l channels ; g radua l d i s con t inuous boundary.
35 t o 60 cm; s t r o n g va r i ega t ed crushed-rubbed c o l o r d a r k ye l lowi sh brown (IOYR 4 / 4 ) , i nd iv idua l c o l o r s o f da rk g r e e n i s h brown, brown, ye l lowi sh brown, and b lack c l a y loam; massive rock c o n t r o l l e d s t r u c t u r e ; f r i a b l e ; s l i g h t l y s t i c k y and sl i g h t l y p l a s t i c ; b lack Mn c o a t i n g s on v e r t i c a l f a c e s ; few f i n e r o o t s a long f r a c t u r e s g e n e r a l l y a s s o c i a t e d wi th Mn coa t ings ; wavy i r r e g u l a r boundary.
60 t o 98 cm; va r i ega t ed crushed-rubbed c o l o r da rk ye l lowi sh brown (10YR 4 /4 ) , i nd iv idua l c o l o r s of da rk g reen i sh brown, brown, ye l lowish brown, and b lack sandy loam; s t r u c t u r e l e s s massive rock c o n t r o l l e d s t r u c t u r e ; firm ( b r i t t l e ) ; sl i g h t l y s t i c k y and s l i g h t l y p l a s t i c ; 1 a r g e cont inuous b lack Mn c o a t i n g s l o c a t e d along f r a c t u r e p lanes ; few f i n e r o o t s a1 ong f r a c t u r e ; wavy i r r e g u l a r boundary.
90 cm'; banded da rke r ma te r i a l sandy loam; s t r u c t u r e l e s s massive rock c o n t r o l l e d s t r u c t u r e ; very f i rm ( b r i t t l e ) ; s l i g h t l y s t i c k y and sl i g h t l y p l a s t i c ; f ragments o f s c h i s t and g n e i s s ; wavy i r r e g u l a r boundary.
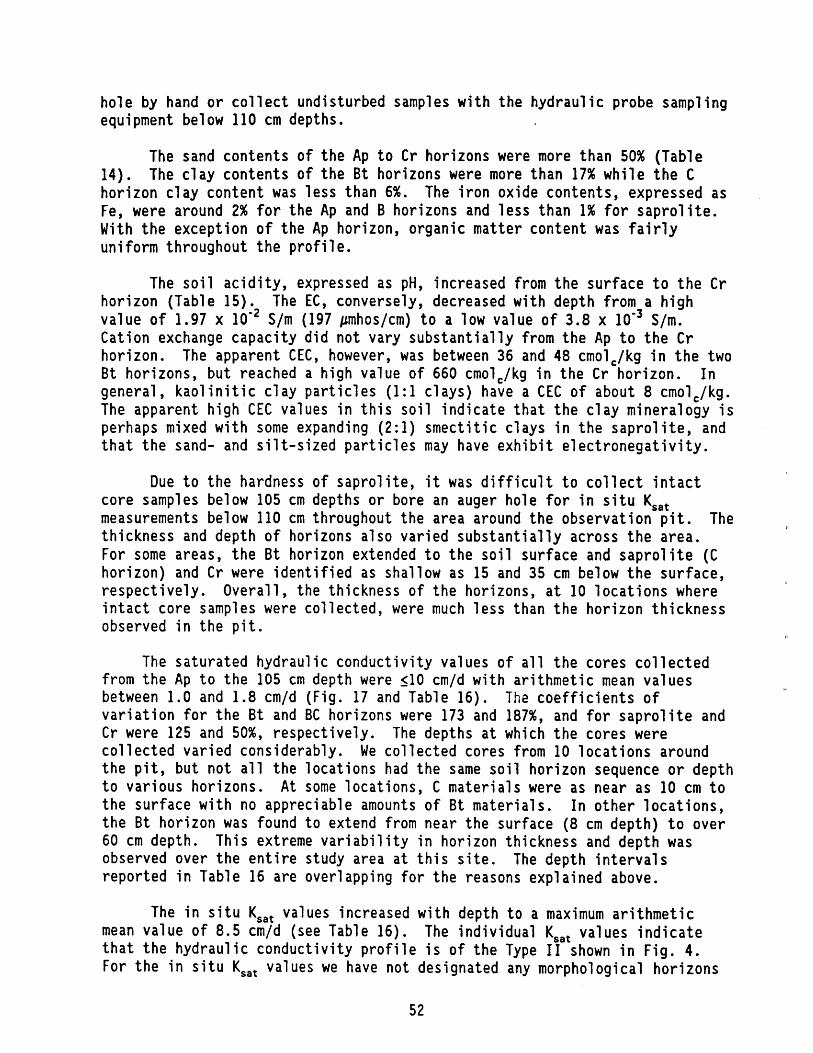
h o l e by hand o r c o l l e c t undisturbed samples w i t h t h e h y d r a u l i c probe sampling equipment below 110 cm depths.
The sand contents o f t h e Ap t o C r hor izons were more than 50% (Table 14). The c l a y contents o f t h e B t hor izons were more than 17% w h i l e t h e C ho r i zon c l a y content was l e s s than 6%. The i r o n ox ide contents, expressed as Fe, were around 2% f o r t h e Ap and B hor izons and l e s s than 1% f o r sap ro l i t e . Wi th t h e except ion o f t h e Ap horizon, o rgan ic ma t te r content was f a i r l y un i fo rm throughout t h e p r o f i l e .
The s o i l a c i d i t y , expressed as pH, increased from t h e su r face t o t h e C r ho r i zon (Table 15). The EC, conversely, decreased w i t h depth f rom a h i g h va lue o f 1.97 x S/m (197 pmhos/cm) t o a low value o f 3.8 x lo-' S/m. Ca t ion exchange capac i t y d i d n o t vary s u b s t a n t i a l l y from t h e Ap t o t h e C r hor izon. The apparent CEC, however, was between 36 and 48 cmolc/kg i n t h e two B t hor izons, b u t reached a h igh value o f 660 cmolc/kg i n t h e C r hor izon. I n general , k a o l i n i t i c c l a y p a r t i c l e s (1:l c lays ) have a CEC o f about 8 cmol,/kg. The apparent h ighCEC values i n t h i s s o i l i n d i c a t e t h a t t h e c l a y minera logy i s perhaps mixed w i t h some expanding ( 2 : l ) s m e c t i t i c c lays i n t h e s a p r o l i t e , and t h a t t h e sand- and s i l t - s i zed p a r t i c l e s may have e x h i b i t e l e c t r o n e g a t i v i ty.
Due t o t h e hardness o f s a p r o l i t e , i t was d i f f i c u l t t o c o l l e c t i n t a c t core samples below 105 cm depths o r bore an auger ho le f o r i n s i t u K,,, measurements below 110 cm throughout t h e area around t h e observa t ion p i t . The th ickness and depth o f horizons a l so v a r i e d s u b s t a n t i a l l y across t h e area. For some areas, t h e B t hor izon extended t o t h e s o i l sur face and s a p r o l i t e (C hor izon) and C r were i d e n t i f i e d as shal low as 15 and 35 cm below t h e sur face, r e s p e c t i v e l y . Ove ra l l , the th ickness o f t h e horizons, a t 10 l o c a t i o n s where i n t a c t core samples were co l l ec ted , were much l e s s than t h e ho r i zon th i ckness observed i n t h e p i t .
The sa tu ra ted h y d r a u l i c c o n d u c t i v i t y values o f a l l t h e cores c o l l e c t e d f rom t h e Ap t o t h e 105 cm depth were 510 cm/d w i t h a r i t h m e t i c mean va lues between 1.0 and 1.8 cm/d (F ig. 17 and Table 16). T h e c o e f f i c i e n t s o f v a r i a t i o n f o r t h e B t and BC hor izons were 173 and 187%, and f o r sapro l i t e and C r were 125 and 50%, respec t i ve l y . The depths a t which t h e cores were c o l l e c t e d v a r i e d considerably. We c o l l e c t e d cores from 10 l o c a t i o n s around t h e p i t , b u t n o t a l l t h e l o c a t i o n s had t h e same s o i l ho r i zon sequence o r depth t o var ious hor izons. A t some loca t i ons , C m a t e r i a l s were as near as 10 cm t o t h e sur face w i t h no appreciable amounts o f B t ma te r i a l s . I n o t h e r l o c a t i o n s , t h e B t ho r i zon was found t o extend from near t h e sur face (8 cm depth) t o over 60 cm depth. Th i s extreme v a r i a b i l i t y i n hor izon th ickness and depth was observed over t h e e n t i r e study area a t t h i s s i t e . The depth i n t e r v a l s repo r ted i n Table 16 are over lapping f o r t h e reasons exp la ined above.
The i n s i t u K,,, values increased w i t h depth t o a maximum a r i t h m e t i c mean value o f 8.5 cm/d (see Table 16). The i n d i v i d u a l K,,, values i n d i c a t e t h a t t h e h y d r a u l i c c o n d u c t i v i t y p r o f i l e i s o f t h e Type 11 shown i n F ig . 4. For t h e i n s i t u K,,, values we have no t designated any morphological ho r i zons

Table 14. P a r t i c l e s i z e d i s t r i b u t i o n , f r e e i r o n ox ide (Fez$ r e p o r t e d as X Fe), and organ ic m a t t e r content o f va r i ous hor izons f o r t h e Wi lkes s o i l a t S i t e Number 3 i n t h e Piedmont reg jon .
HORIZON DEPTH SAND SILT CLAY Fe ORGAN I C MATTER
AP 0-8 52.4 28.4 19.2 1.80 2.05 B t l 8-14 57.9 25.0 17.1 1.97 0.21 B t2 14-25 53.7 24.9 21.4 2.12 0.73 BC 35-60 69.6 19.0 11.4 1.58 0.15 C 60-98 79.0 15.8 5.2 0.98 0.26 C r 98' 80.7 17.9 1.4 0.62 0.0
Table 15. Cat ion exchange capac i t y (CEC) , e l e c t r i c a l c o n d u c t i v i t y (EC), and pH o f var ious hor izons f o r t h e W i l kes s o i l a t S i t e Number 3 i n t h e Piedmont reg ion .
HORIZON PH= EC' CEC' APPARENT CEC,
AP 5.5 197 10.1 52.5 B t l 5.4 128 8.2 47.9 Bt2 5 . 7 107 7.7 36.0 BC 5.9 73 8.6 75.6 C 6.1 51 8.4 162.8 C 6.5 38 9.1 659.4
P Determined us ing 1:2 s o i l :water r a t i o # Determined w i t h a BaC1, procedure a t pH 7 and c a l c u l a t e d on t o t a l s o i l
mass $ Ca lcu la ted based on t h e mass o f c l a y f r a c t i o n

Ksat, cmld
Figure 17 . In s i tu and laboratory determined saturated hydraulic conductivity (K,,,) of the Wil kes soil at Site Number 3 in the Pi edmont regi on.

ab le 16. Mean, c o e f f i c i e n t o f v a r i a b i l i t y (CV), number o f samples (N) , and depth i n t e r v a l f o r sa tu ra ted hydrau l i c c o n d u c t i v i t y determined i n t h e l a b o r a t o r y and i n s i t u f o r W i l kes s o i l a t S i t e Number 3 i n t h e Piedmont reg ion .
DEPTH ARITHMETIC GEOMETRIC HORIZON INTERVAL N MEAN CV MEAN
Labora tory Method
I n S i t u
@ Depth i n t e r v a l s a re f o r a l l t h e cores c o l l e c t e d f rom va r ious dep ths / l oca t i ons t h a t were p laced i n a major h o r i z o n f o r t h e s i t e .
# Depth i n t e r v a l s a re f o r t h e bottom s e c t i o n o f t h e ho les under t h e cons tant head o f water.
* Not determined.
t o t h e depths r e p o r t e d i n Table 16. The depth i n t e r v a l s r e f e r t o t h e s e c t i o n o f t h e s o i l o r s a p r o l i t e where K,,, measurements were conducted (i.e., f rom t h e t o p o f t h e water l e v e l i n t h e ho le i n t h e sha l lowest h o l e t o t h e bottom o f t h e deepest h o l e f o r each depth group). Due t o h i g h degree o f v a r i a b i l i t y i n t h e th ickness o f each hor izon, each depth group may c o n t a i n c o n d u c t i v i t y values f rom more than one morphologic hor izon. Overa l l , however, we can s t a t e t h a t t h e minimum K,,, occurs i n t he upper p a r t o f t h e s o i l p r o f i l e and t h a t t h e h y d r a u l i c c o n d u c t i v i t y increases w i t h depth w i t h mean values more than 5 cm/d below t h e 70 cm depths.

The mean s o i l water r e t e n t i o n da ta and b u l k d e n s i t y va lues f o r Bt, BC, C, and C r hor izons a r e presented i n Table 17. I n add i t i on , s tandard d e v i a t i o n and number o f samples are a l s o g i ven f o r each mean value. The h i g h e s t amount o f water a t s a t u r a t i o n (zero pressure head) i s found i n t h e cores c o l l e c t e d f rom t h e B t hor izons. Most o f t h e pores i n t h e Bt, however, a re smal l and t h e amount o f pores l a r g e r than 0.01 mm i n diameter comprise o n l y 15% o f t h e t o t a l pore volume. A t deeper depths, t h e b u l k d e n s i t y o f t h e C r i s much h i g h e r than t h e s o i l and t h e t o t a l amount o f pore space, as expressed by water con ten t a t zero pressure head, i s 33%. The h i g h b u l k d e n s i t y o f t h e C r r e f l e c t s i t s r o c k t ype c h a r a c t e r i s t i c s . Approximately 1/3 o f t h e pores i n C r a re l a r g e r t han 0.01 mm i n diameter. A t -15,000 cm s o i l water pressure head, t h e C r h o r i z o n s t i l l ho lds n e a r l y 1/2 o f i t s sa tura ted water content . For t h e C hor izon, approximate ly 114th o f t h e pores are l a r g e r than 0.01 mm and about 1 /2 o f t h e water a t s a t u r a t i o n i s r e t a i n e d a t -15,000 cm s o i l water pressure head.
S i t e Number 4
Th i s s i t e was l oca ted i n Randolph County i n t h e middle o f t h e Piedmont reg ion . The s i t e was on p r i v a t e p rope r t y near t h e town o f Frank1 i n v i l l e , on t h e eas t s i d e o f Highway 22. An observat ion p i t was dug and t h e s o i l p r o f i l e was described. Bulk samples were a l so obta ined f rom t h e p i t w a l l s f o r l a b o r a t o r y analyses. The s o i l a t t h i s s i t e was i d e n t i f i e d as an Appl i n g s e r i e s (Table 18).
The B t hor izon a t t h i s s i t e extended t o about 95 cm and t h e maximum c l a y content occurred i n t h e Bt3 ho r i zon (Table 19). The minimum sand con ten t i n t h e p r o f i l e , however, was i n t h e B t l hor izon. The t r a n s i t i o n a l ho r i zons between t h e B t and C (sapro l i t e ) were f a i r l y t h i c k w i t h a c l a y con ten t o f about 11% and sand content o f 68%. I n t h e saprol i t e , c l a y content decreased w i t h depth t o a minimum value o f 0.2%. The f r e e i r o n ox ide content ( repo r ted as % Fe) was h ighes t i n t h e Bt3 and decreased t o l e s s than 1% i n sapro l i t e . I n c o n t r a s t t o t h e c l a y content , t he CEC o f t h e B t ho r i zon was l e s s than t h e CEC measured i n s a p r o l i t e (Table 20). Al though we cannot e x p l a i n w i t h c e r t a i n t y t h e h igher CEC o f t h e saprol i t e based on t h e c l a y content (i . e . , t h e apparent CEC repor ted i n Table 20), we f e e l t h e d i f f e r e n c e i s due t o l ow a c t i v i t y c l a y i n t he B t and h ighe r negat ive charges on t h e s i l t - and sand- s i zed p a r t i c l e s i n t h e C hor izon. S o i l pH increased w i t h depth and was t h e h ighes t i n sapro l i t e a t deeper depths. The EC was f a i r l y low throughout t h e p r o f i l e i n d i c a t i n g a l a c k o f so lub le s a l t s and d i sso l ved s o l i d s i n t h i s so i 1 / sapro l i t e continuum.
The mean i n s i t u sa tura ted hyd rau l i c c o n d u c t i v i t y (Table 21) was h i g h a t t he 50 crn depth, decreased t o a minimum value o f 2.3 cm/d a t 100 cm depth and then increased cont inuous ly down i n t o t h e saprol i t e . I n t h e B t hor izon, K,,, was f a i r l y v a r i a b l e and t h e values f o r 10 measurements v a r i e d between 0.5 and 325 cm/d. The range f o r t h e 100 cm depth measurements, on t h e o t h e r hand, was 0 . 2 t o 5 . 0 c m / d . Insaprol i teK,, ,was h i g h l y v a r i a b l e w i t h a C V v a l u e o f


Table 18. S o i l c l a s s i f i c a t i o n and p r o f i l e d e s c r i p t i o n f o r S i t e N u m b e r 4 .
S o i l S e r i e s : Appl ing sandy loam C l a s s i f i c a t i o n : Clayey, kaol i n i t i c , thermic Typic Kanhapl udul t
A
E
BIE
B t l
Bt2
Bt3
BC
CB
C 1
C2
0 t o 15 cm; brown (IOYR 513) sandy loam; weak c o a r s e subangular blocky s t r u c t u r e ( f i n e g r a n u l a r s t r u c t u r e a t t o p o f ho r i zon ) ; f r i a b l e ; c l e a r smooth boundary.
15 t o 23 cm; brownish yel low (10YR 616) sandy loam; weak c o a r s e subangul a r bl ocky s t r u c t u r e ; f r i a b l e ; c l e a r smooth boundary.
23 t o 30 cm; r edd i sh yel low (7.5YR 618) sandy c l a y loam; weak medium and c o a r s e subangul a r bl ocky s t r u c t u r e ; f r i a b l e ; c l e a r smooth boundary.
30 t o 43 cm; ye l lowish red (5YR 518) sandy c l a y loam; moderate medium subangul a r blocky s t r u c t u r e ( s t r u c t u r e no t a s we1 1 expressed a s below) ; f i rm , s t i c k y ; gradual smooth boundary.
43 t o 73 cm; reddish brown (5YR 414) c l a y ; moderate medium subangul a r bl ocky and angul a r bl ocky s t r u c t u r e ( s t r u c t u r e i s b e t t e r expressed than below) ; f i rm , s t i c k y ; gradual smooth boundary.
73 t o 95 cm; ye l lowish red (5YR 416) sandy c l a y wi th b l ack (10YR 211) mangans; sandy c l ay; moderate medium c o a r s e subangul a r bl ocky s t r u c t u r e ; f i rm; c l e a r boundary, horizon i s d i scon t inuous .
95 t o 100 cm; ye l lowish red (5YR 5/8) sandy c l a y loam wi th b l ack (10YR 211) mangans; sandy c l a y loam; weak coa r se subangular blocky; f r i a b l e ; c l e a r wavy boundary.
100 t o 170 cm; s t rong brown (7.5YR 5/8) sandy c l a y loam and b l ack (10YR 211) mangans; sandy c l a y loam; massive t o very weak subangular blocky s t r u c t u r e (zones of p l a t i n e s s ) ; f r i a b l e and sl i g h t l y b r i t t l e ; c l e a r smooth boundary.
170 t o 215 cm; reddish yel low (7.5YR 618) sandy loam; massive f r i a b l e almost f i rm; s l i g h t l y b r i t t l e ; t h i n r edde r l a m e l l a ; c l e a r smooth boundary.
215 t o 253 cm; reddish yellow (7.5YR 618) ma t r ix and ye l low (10YR 816) h igh ly weathered s a p r o l i t e ; loamy sand; massive; moderately t h i c k p l a t y s t r u c t u r e ; f r i a b l e almost f i rm; sl i g h t l y b r i t t l e ; gradual wavy boundary.

Table 18. Continued
C3 253 t o 300 cm; strong brown (7.5YR 518) matrix with very pale brown l O Y R 813) highly weathered saprol i t e ; loamy sand; massive; firm; b r i t t l e .
C4 300 t o 335 cm; reddish yellow (7.5YR 618) matrix with white (IOYR 812) highly weathered saprol i t e ; loamy sand; massive; f i n ; b r i t t l e .
Table 19. Particle size distribution, free iron oxide (Fe,03 reported as % Fe), and organic matter content of various horizons fo r the Appling soil a t Si te Number 4 in the Piedmont region.
HORIZON DEPTH SAND S I L T CLAY Fe ORGAN I C MATTER
AP E BIE Btl Bt2 Bt3 B/C C / B C1 C 2 C3 C4

Table 20. Cat ion exchange capac i t y (CEC), e l e c t r i c a l c o n d u c t i v i t y (EC) , and pH o f va r i ous hor izons f o r t h e Appl i n g s o i l a t S i t e Number 4 i n Piedmont reg ion .
HORIZON P H ~ E C ~ CEC# APPARENT CEC'
AP E B / E B t l B t 2 B t 3 B /C C/B C 1 C2 C3 C4
-- --
@ Determined us ing 1:2 s o i l :water r a t i o # Determined w i t h a BaC1, procedure a t pH 7 and c a l c u l a t e d on t o t a l s o i l
mass $ Ca lcu la ted based on t h e mass o f c l a y f r a c t i o n

over 100% and a range o f values between 0.7 and 62.4 cm/d. For the 1 aboratory determined K,,,, the highest value was measured in a core obtained from the top of the A horizon (Fig. 18). Between 25 and 90 cm depth (Bt horizon), the maximum K,,, was 15.7 and the minimum values was 0.2 cm/d. Consistent with the in situ values, KL, decreased with depth from the Bt to the transitional horizon before increasing again in saprolite (Type 111, see Fig. 4). The highest value measured in saprol ite was 48.3 cm/d at 285 cm depth.
Table 21. Mean, coefficient of variability (CV), number of samples (N), and depth interval for saturated hydraul ic conductivity determined in the laboratory and in situ for the Appling soil at Site Number 4 in the Piedmont region.
DEPTH ARITHMETIC GEOMETRIC HORIZON INTERVAL N MEAN CV MEAN
Laboratory Method
In Situ

Ksat, cmld
Lab
In Situ
Figure 18. I n s i t u and 1 aboratory determined sa tura ted hydraul i c c o n d u c t i v i t y (K,,,) o f t h e Appl i n g s o i l a t S i t e Number 4 i n t h e Piedmont region.
S i t e Number 5
Th i s s i t e was l o c a t e d i n Meckl enburg County near C h a r l o t t e I n t e r n a t i o n a l A i r p o r t . The l a n d i n t h e area had been c leared p r i o r t o our study, b u t wooded area surrounded it. The s lope o f t h e area i s 1 t o 3 X , and t h e cover a t t h e t ime o f t h e study was grass and scat te red small shrubs. A l a r g e obse rva t i on p i t was dug i n t h e middle o f t h e area t h a t we se lec ted f o r eva lua t i on . I n t a c t core samples were obta ined from 12 l o c a t i o n s around the p i t f o r de te rm ina t i on o f c o n d u c t i v i t y , water r e t e n t i o n and b u l k d e n s i t y i n t h e l abo ra to ry . The s o i l and sapro l i t e continuum was evaluated i n t h e p i t and t h e ho r i zon boundaries were marked on one s i d e o f t h e p i t . The p r o f i l e d e s c r i p t i o n f o r t h e p i t i s presented i n Table 22. The ho r i zon boundaries a t t h i s s i t e were a l s o v e r y v a r i a b l e w i t h some hor izons merging w i t h others. I n general, t h e p r o f i l e a t

Table 22. S o i l c l a s s i f i c a t i o n and p r o f i l e d e s c r i p t i o n f o r S i t e Number 5.
S o i l S e r i e s : Meckl enburg 1 oam C l a s s i f i c a t i o n : Fine, mixed, t he rmic Ultic Hapluda l f
A P
Btl
Bt2
Bt3
BC
C1
C2
C3
C4
0 t o 8 cm; s t r o n g brown (7.5YR 416) 1 oam; moderate medium subangul a r blocky s t r u c t u r e ; f r i a b l e , s l i g h t l y s t i c k y and s l i g h t l y p l a s t i c ; many c o a r s e and medium r o o t s ; c l e a r smooth boundary.
8 t o 33 cm; r e d (2.5YR 416) c l a y ; weak c o a r s e p r i s m a t i c s t r u c t u r e p a r t i n g t o moderate medi um angul a r and subangul a r bl ocky; f i r m , s t i c k y , and p l a s t i c ; t h i c k cont inuous c l a y films (IOYR 414) on h o r i z o n t a l and v e r t i c a l f a c e s ; common f i n e and medium r o o t s ; g radua l wavy boundary.
33 t o 45 cm; s t r o n g brown (7.5YR 5 /8) and y e l l o w i s h brown (10YR 5/6) c l a y loam; moderate medium and c o a r s e subangul a r blocky s t r u c t u r e ; f i r m t o f r i a b l e s l i g h t l y s t i c k y and s l i g h t l y p l a s t i c ; common (10YR 4 /4 ) c l a y f i l m s on ped s u r f a c e s ; few b lack Mn c o a t i n g s on v e r t i c a l ped f a c e s ; common f i n e r o o t s ; d i f f u s e wavy boundary.
45 t o 60 cm; brownish ye l low (10YR 618) and r e d d i s h ye l l ow (7 .5 6 /8 ) c l a y ; common g r a y i s h brown (10YR 5 /2) m o t t l e s ; weak c o a r s e subangul a r blocky s t r u c t u r e ; firm, s t i c k y and p l a s t i c ; c l a y films (10YR 414) on v e r t i c a l f a c e s ; common ,black Mn c o a t i n g s ; common f i n e f o o t s ; g r a d u a l d i s con t inuous boundary.
60 t o 80 cm; v a r i e g a t e d g r a y i s h brown (IOYR 512) d a r k g r a y i s h brown (IOYR 4/2) and s t r o n g brown (IOYR 518) sandy c l a y loam; very weak c o a r s e subangul a r blocky s t r u c t u r e ; firm, sl i g h t l y s t i c k y and sl i g h t l y p l a s t i c ; few c l a y f i l m s (5YR 4/4) a s s o c i a t e d w i th f r a c t u r e p l anes and v e r t i c a l ped f a c e s ; common f i n e r o o t s ; c l e a r wavy boundary.
80 t o 142 cm; p a l e brown (IOYR 5/4 c rushed mixed) loamy sand; massive rock c o n t r o l l e d s t r u c t u r e ; very f i r m and b r i t t l e ; b l a c k c o a t i n g s i n f r a c t u r e f a c e s ; very few r o o t s ; d i f f u s e d i s c o n t i n u o u s boundary.
142 t o 173 cm; ye l l owi sh brown (IOYR 5/6 c rushed) loamy sand; massive rock c o n t r o l l e d s t r u c t u r e ; very f i r m , b r i t t l e ; b l a c k c o a t i n g s on f r a c t u r e f a c e s ; common f i n e r o o t s ; g radua l wavy boundary.
173 t o 200 cm; da rk brown (IOYR 3 / 3 c rushed) sand; mass ive ; f i r m , b r i t t l e ; b l ack coa t i ng on f r a c t u r e f a c e s ; few f i n e r o o t s ; g radua l wavy boundary.
200 t o 245 cm; da rk ye l l owi sh brown (IOYR 414 c rushed ) sand; massive; very f i r m , b r i t t l e ; t h i n (0 .5 cm) c l a y r i c h zone a t t o p o f hor izon; few r o o t s a r e on ly i n c l a y zone.

t h i s s i t e cons i s ted o f a t h i n Ap and a r e l a t i v e l y t h i c k a r g i l l i c ho r i zon composed o f t h r e e d i f f e r e n t 1 ayers. The BC hor izon was q u i t e v a r i a b l e and i n t e r m i n g l e d w i t h t h e B t horizons. Various saprol i t e hor izons were a1 so observed over lapp ing each other . A C r ho r i zon was i d e n t i f i e d a t t h e bot tom o f t h e p i t .
The sand content decreased from t h e Ap t o t h e B t l ho r i zon where maximum c l a y was present (Table 23). The sand c w t e n t then increased f rom t h e Bt , i n t o BC, and reached i t s maximum value o f 92% i n t h e C3 (saprol i t e ) hor izon. The c l a y - and s i l t - s i z e d p a r t i c l e s , on t h e o the r hand, decreased w i t h depth t o a minimum c l a y content o f approximately 1.2% i n s a p r o l i t e . The f r e e i r o n ox ide content , as expressed by t h e percentage o f Fe i n t h e ma te r ia l s , was a l s o h ighes t i n t h e B t l hor izon (4.3%) and decreased w i t h depth t o an average va lue o f 0.63% i n sapro l i t e . Only t h e Ap hor izon had an appreciable amount o f o rgan ic m a t e r i a l s . Below t h e B t horizon, organic m a t e r i a l content was g e n e r a l l y l e s s than 0.5%.
Tab1 e 23. P a r t i c l e s i z e d i s t r i b u t i o n , f r e e i r o n ox ide (Fe,03 r e p o r t e d as %Fe), and organ ic mat te r content o f var ious hor izons f o r t h e Mecklenburg s o i l a t S i t e Number 5 i n t h e Piedmont reg ion .
HORIZON DEPTH SAND SILT CLAY Fe ORGAN I C MATTER
A B t l B t2 Bt3 Bc C 1 C 2 C3 C 4

The soil above the transitional BC horizon was acidic with pH values ranging from 5.4 in the Ap.to 6.9 in the Bt3 horizon (Table 24). Below the soil solum (i .e . , in saprolite), pH was between 7.0 and 7.3. The soluble salt content of the Ap horizon, as expressed by the EC, was the highest, and the Btl horizon had the lowest EC. The CEC of the Ap horizon was the lowest. Surprisingly, saprol i te with 1 i ttle clay content had measurable cation exchange capacity similar to its overlying Bt horizons. This results in substanti a1 ly higher apparent CEC, for saprol i te materi a1 s. The re1 atively high CEC values for saprolite may be due to the presence of 2 to 1 clay particles and/or high cation exchange capacity of sand- and sil t-sized particles. As we mentioned earl ier, in the upper part of the profile (Ap and Bt horizons) the sand-sized particles are generally associated with quartz sand, whereas in saprol i te the sand-sized particles may be composed of minerals other than quartz. This could give rise to high apparent CEC values for deeper materi a1 s.
Table 24. Cation exchange capacity (CEC), electrical conductivity (EC), and pH of various horizons for the Mecklenburg soil at Site Number 5 in the Piedmont region.
HORIZON PH" EC' CEC' APPARENT CEC'
A P Btl Bt2 Bt3 BC C1 C2 c3 \
Cr
@ Determined using 1:2 soil :water ratio # Determined with BaCl, method at pH 7 and calculated on total soil mass 5 Calculated based on the mass of clay fraction

The mean and CV values for 1 aboratory and in situ K,,, are given in Table 25, and the individual values are shown in Fig. 19. Because of the variations in the horizon boundaries it was difficult to assign an exact horizon designation to the bottom of edch auger hole used for measuring K,,, values. This was also true for intact cores collected from this site. We were only able to assign a horizon to a limited number of the core sample. As a result, the intact core and in situ K,,, values are grouped by depth and placed in a horizon class using the average horizon boundary depths given in Table 22.
The hydraulic conductivity profile at this site was of Type I11 shown in Fig. 4. The highest K,,, (148 crn/d) was measured in a core collected from 20 cm depth, and the minimum value (<0.1 cm/d) was for five samples collected from below 100 crn depth. The conductivity increased with depth in saprolite. For the in situ measurements, the range of K,,, for 50 crn depth (35 to 50 cm depth interval) was between 0.2 and 12.4 crn/d with an average value of 3.2 cm/d. For the 85 to 100 crn depth interval, the average value was 1.2 and the
Table 25. Mean, coefficient of variability (CV), number of samples (N), and depth interval for saturated hydraul ic conductivity determined in the laboratory and in situ for the Mecklenburg soil at Site Number 5 in the Piedmont region.
DEPTH ARITHMETIC GEOMETRIC HORIZON INTERVAL N MEAN CV MEAN
Laboratory Method
In Situ

Ksat, cm/d
Figure 19. I n s i t u and 1 aboratory determined saturated hydraul i c conduc t i v i t y (K,,) o f the Mecklenburg s o i l a t S i t e Number 5 i n the Piedmont region.
v a r i a b i l i t y was l e s s than the 50 cm depth. The h ighest v a r i a b i l i t y was observed a t 200 cm depth w i t h a h igh K,,, value o f 61.8 cm/d. Excluding t h i s value, the ranges o f i n s i t u K,,, values a t 150 and 200 cm depths were f a i r l y s i m i l a r (1.3 t o 11.0 cm/d f o r 150 cm and 1.0 t o 14.0 cm/d f o r 200 cm depth).
The mean bu l k dens i ty o f the upper 50 cm was j u s t be1 ow 1.4 g/cm3 (Tab1 e 26). From 50 t o 250 cm depth, the mean bu lk dens i t y decreased from 1.48 t o 1.37 g/cm3. Overa l l , bul k dens i ty v a r i abi 1 i t y was 1 ow and was i n agreement w i t h the repor ted v a r i a b i l i t y f o r 1 ocations outs ide North Carol i n a (see Warrick and Nielsen, 1980). The mean values f o r water content a t sa tu ra t i on f o r the cores co l l ec ted from the surface t o 200 cm depth d i d no t d i f f e r f rom one another s i g n i f i c a n t l y . The amount o f water l o s t between zero and -300 cm s o i l water pressure head, however, was the l a rges t f o r the samples c o l l e c t e d between 150 and 200 cm depth (11.9%) and was the smal lest f o r the 50 t o 100 cm depth i n t e r v a l (7.1%).

Table 26. Mean, standard dev ia t ion (SD), number o f measurements (N) f o r b u l k dens i t y and volumetr ic water content a t var ious s o i l water pressure heads f o r the major horizons o f the Mecklenburg s o i l a t S i t e Number 5 i n t he Piedmont region.
SOIL WATER PRESSURE HEAD, cm
BULK DEPTH DENSITY 0 -50 -100 -200 -300 -1,000 -5,000 -15,000
Mean SD N
Mean 50- 100 SD
N 13
Mean 100-150 SD
N
Mean 150-200 SD
N
Mean 200-250 SD
N
@ Not determined.

S i t e Number 6
T h i s s i t e was l o c a t e d i n Burke County nea r t h e c i t y o f H i l d e b r a n i n t h e wes te rn p a r t o f t h e Piedmont r eg ion . The s l ope o f t h e a rea was between 1 and 5% and t h e v e g e t a t i v e cover was grass. The landscape con ta ined d i f f e r e n t geomorphic p o s i t i o n s . For ou r s t u d y a r i d g e t o p and a head s l o p e p o s i t i o n (see D a n i e l s e t a1 . , 1984) were s e l e c t e d f o r e v a l u a t i o n . A l a r g e o b s e r v a t i o n p i t (over 2 m wide, 5 m l o n g and 3 m deep) was dug on t h e shou lder 1 andscape p o s i t i o n . The morpho log ica l c h a r a c t e r i s t i c s o f t h e s o i l and sap ro l i t e were eva lua ted on t h e p i t w a l l s and v a r i o u s ho r i zons were i d e n t i f i e d f o r sampl i n g (Table 27). Based on t h e e v a l u a t i o n o f t h e p r o f i l e , t h e s o i l was p l a c e d i n t h e Paco le t s e r i e s . I n genera l , t h e p r o f i l e c o n s i s t e d o f an Ap hor izon , f o u r d i f f e r e n t B t subhorizons, an i r r e g u l a r B/C h o r i z o n t h a t extended below an i r r e g u l a r C ho r i zon . Below t h e B/C, s a p r o l i t e was subd i v i ded i n t o - a number of C ho r i zons based p r i m a r i l y on c o l o r .
Maximum c l a y con ten t occu r red i n t h e m idd le o f t h e B t h o r i z o n (B t2 ) and decreased c o n t i n u o u s l y t o 2.7 % i n t h e C 1 h o r i z o n (Table 28). I n t h e BC l a y e r immed ia te ly below t h e C 1 h o r i z o n c l a y con ten t was 8.7% and sand con ten t was over 71%. I n t h e s a p r o l i t e , c l a y con ten t was g e n e r a l l y below 7% and sand con ten t was between 68 and 80%. The f r e e i r o n o x i d e con ten t , expressed as % Fe on a mass bas is , v a r i e d between 4.4 and 6.2% i n t h e B t and between 1.5 and 3.4% i n BC and s a p r o l i t e hor i zons . Below t h e B t l , t h e o r g a n i c m a t t e r c o n t e n t was l e s s t h a n 1%.
I n t h e Ap and t h e upper p a r t o f t h e a r g i l l i c h o r i z o n ( B t l ) pH was more t han 6.1 whereas below t h e B t l pH d i d n o t exceed 5.5 (Table 29) . The B t 3 and B t4 had t h e l o w e s t EC w h i l e t h e EC o f t h e upper p a r t o f t h e p r o f i l e was t h e h i ghes t . The CEC con t i nuous l y decreased w i t h dep th f r om t h e Ap t o t h e C 1 hor i zon . The BC and i t s u n d e r l y i n g s a p r o l i t e had a CEC comparable t o t h e B t hor i zons . However, t h e apparent CEC was l owes t i n t h e B t and h i g h e s t i n s a p r o l i t e . The l ow CEC and apparent CEC i n d i c a t e t h a t t h e c l a y i n t h e Ap and B t ho r i zons a t t h e s i t e i s kao l i n i t i c . I n sap ro l i t e , on t h e o t h e r hand, t h e r e may be some 2 t o 1 c l a y i n coa rse r p a r t i c l e s o r t h e sand- and s i l t - s i z e d p a r t i c l e s w i t h r e 1 a t i v e l y h i g h n e g a t i v e charges, g i v i n g r i s e t o h i g h e r apparent CEC va lues than t h e B t ho r i zon .
For t h e l a b o r a t o r y d e t e r m i n a t i o n o f K,,,, s o i l wa te r r e t e n t i o n and b u l k d e n s i t y i n t a c t co re samples were ob ta i ned f rom 10 l o c a t i o n s around t h e obse rva t i on p i t . For measuring i n s i t u K,,,, 11 10- by 10-m square areas were s e l e c t e d on 3 s i des o f t h e obse rva t i on p i t and 4 6-cm d iame te r auger h o l e s were dug t o 50, 100, 150, and 200 cm depths on a t r a n s e c t i n t h e m idd le o f each square. There was o n l y one l o c a t i o n where we c o u l d n o t bore a h o l e t o 200 cm depth.
F i g u r e 20 p resen ts t h e l a b o r a t o r y and i n s i t u determined K,,, va lues f o r va r i ous depths. Based on t h e h o r i z o n boundar ies observed i n t h e p i t and t h e i n s p e c t i o n o f t h e cores ob ta i ned f rom v a r i o u s l o c a t i o n s we have des igna ted t h e 50 cm dep th as t h e B t , t h e 100 cm dep th as B t o r BC, and t h e 150 and 200 cm

Table 27. S o i l c l a s s i f i c a t i o n and p r o f i l e d e s c r i p t i o n f o r S i t e Number 6.
S o i l S e r i e s : Pacol e t c l ay 1 oam C l a s s i f i c a t i o n : Cl ayey, kaol i n i t i c , thermic Typic Kanhapl udul t
A P
Btl
Bt2
Bt3
Bt4
C1
B l C
0 t o 10 cm; s t r o n g brown (7.5YR 416) c l a y loam; weak medium and c o a r s e subangul a r bl ocky s t r u c t u r e ; common patchy c l ay films on f a c e s o f peds; common very f i n e and medium r o o t s ; d i f f u s e wavy boundary.
10 t o 28 cm; ye l lowish red (5YR 4/6) heavy c l a y loam; moderate medium subangular blocky s t r u c t u r e ; f r i a b l e ; common pa tchy c l a y f i l m s on f a c e s o f peds; common very f i n e and medium r o o t s ; d i f f u s e wavy boundary.
28 t o 50 cm; red (2.5YR 4/8) c l a y ; moderate f i n e subangul a r blocky s t r u c t u r e , and weak, t h i n p l a t y i n p l aces ; f r i a b l e ; many moderate t h i c k c l a y f i l m s on f a c e s of peds; very f i n e r o o t s ; common b l ack (10YR 2/1) C fragments; d i f f u s e wavy boundary.
50 t o 86 cm; red (2.5YR 418) c l a y loam; moderate medium subangul a r blocky s t r u c t u r e ; f r i a b l e ; common, d i scont inuous moderately t h i c k c l a y f i l m s on f a c e s of l a r g e peds; very f i n e r o o t s ; C f ragments change i n c o l o r from black (IOYR 2/1) t o ye l lowish brown (10YR 516) nea r boundary of Bt3; d i f f u s e wavy boundary.
86 t o 104 cm; red (2.5YR 4/8) heavy loam; moderate c o a r s e subangular blocky s t r u c t u r e ; f r i a b l e ; few patchy c l a y f i l m s on f a c e s o f peds; ye l lowish brown C f ragments (10YR 5/6) occur i n g r e a t e r f requency; very f i n e r o o t s ; abrupt wavy boundary.
104 t o 127 cm; whi te matr ix (2.5Y 8/) wi th l i g h t o l i v e brown (2.5Y 5 / 4 ) , ye l lowish brown (10YR 5 / 8 ) , b lack (IOYR 2/1) , g r ay (IOYR 6 , r ed (2.5YR 4/8) va r i ega t ed sandy loam; s t r u c t u r e l e s s massive; very f r i a b l e and b r i t t l e ; many medium and c o a r s e c l a y f i l m c o a t s i n C1, few t h i n patchy c l a y f i l m s on f r a c t u r e f a c e s , f r a c t u r e f a c e s coated with Mn; very f i n e r o o t s ; ab rup t d i f f u s e boundary.
127 t o 137 cm; red (2.5YR 418) B and va r i ega t ed (same a s v a r i e g a t e d C1) C mixed heavy loam and sandy loam; v a r i a b l e weak t o very weak medium subangul a r blocky s t r u c t u r e ; v a r i a b l e f r i a b l e t o firm; few t h i n patchy c l a y f i l m s on f a c e s o f peds and i n pores ; very f i n e r o o t s : a radua l d i f f u s e boundary.

Tab le 27. Cont i nued.
C2 137 t o 163 cm; r e d m a t r i x (2.5YR 4/8) w i t h brownish y e l l o w (IOYR 6/6), y e l l o w (2.5Y 7/8), r e d d i s h y e l l o w (7.5YR 6/8), w h i t e (2.5Y 8/ ) , r e d d i s h brown (5YR 4/3) v a r i e g a t e d 1 oam; s t r u c t u r e 1 ess massive; f i r m and s l i g h t l y b r i t t l e ; few t h i n c l a y f i l m s i n ores; v e r y f i n e roo t s ; d i scon t i nuous d i f f u s e boundary.
C3 163 t o 203 cm; l i g h t o l i v e brown m a t r i x (2.5Y 5/4), y e l l o w i s h brown (IOYR 5/6), s t r o n g brown (7.5YR 5/8), p i n k i s h w h i t e (7.5YR 8/2) , y e l l o w (2.5Y 7/8) va r i ega ted loam; s t r u c t u r e l e s s , massive; v e r y f r i a b l e t o f i r m ; few t h i n c l a y f i l m s i n pores; ve ry f i n e r o o t s ; c l e a r smooth boundary.
C4 203 t o 244 cm; same c o l o r as C3 except w i t h more p i n k i s h w h i t e (7.5YR 8/2) and b l a c k (IOYR 2/1) v a r i e g a t e d sandy loam; s t r u c t u r e l e s s , massive; ve ry f i r m t o ex t reme ly f i r m and v e r y b r i t t l e ; no c l a y f i l m s , seems p a r t i a l l y cemented "secondary depos i ts?" , r e s i s t s d i g g i n g by hand; v e r y f i n e r o o t s ; d i f f u s e smooth boundary.
C5 244 t o 292 cm; l i g h t y e l l o w i s h brown m a t r i x (2.5Y 6/4) w i t h w h i t e (2.5Y 8 4 , brownish y e l l o w (IOYR 6/8), p a l e y e l l o w (2.5Y 7/4), ye1 l o w (2.5Y 7/8), b l a c k (IOYR 2/1) v a r i e g a t e d loam; s t r u c t u r e l e s s , massive; f i r m t o f r i a b l e ; no c l a y f i l m s ; l e s s b l a c k (IOYR 2/1) t h a n above, more p i n k i s h w h i t e (2.5Y 8/2); no r o o t s seen.
Remarks: F o l i a t i o n o f C 1 and C4 ho r i zons n e a r l y h o r i z o n t a l .

Tab1 e 28. Particle size distribution, free iron oxide (Fe,O, reported as %Fe), and organic matter content of various horizons for the Pacolet soil at Site Number 6 in the Piedmont region.
HORIZON DEPTH SAND SILT CLAY Fe ORGAN I C MATTER
AP Btl Bt2 Bt3 Bt4 C1 B/C C2 C3 C4 C5 C6

Tab1 e 29. Cat ion exchange capac i t y (CEC) , e l e c t r i c a l c o n d u c t i v i t y (EC) , and pH o f va r i ous hor izons f o r t h e Pacolet s o i l a t S i t e Number 6 i n Piedmont region.
HORIZON APPARENT CEC'
A P B t l B t2 Bt3 Bt4 C 1 B/C C2 C3 C4 C5
@ Determined us ing 1:2 s o i l :water r a t i o # Determined w i t h a BaC1, procedure a t pH 7 and c a l c u l a t e d on t o t a l s o i l
mass $ Ca lcu la ted based on the mass o f c l a y f r a c t i o n
depths as t h e C hor izons f o r t h e i n s i t u measurements (Table 30). For t h e l a b o r a t o r y determined K,,, values, each core was inspected and p laced i n a d i a g n o s t i c hor izon. I n general, t h e B t samples were f rom 15 t o 128 cm depth, t h e BC samples were from 120 t o 160 cm depth, and t h e C samples were ob ta ined f rom below 100 cm. The over lap o f t h e depth i n t e r v a l s f o r these hor izons i n d i c a t e s t h e v a r i a b i l i t y o f t h e hor izon boundaries a t t h e s i t e .
The B t ho r i zon a t t h i s s i t e was genera l l y t h i c k and extended beyond 125 cm depth. O f t h e t o t a l o f 61 i n t a c t cores 44 were f rom t h e B t hor izon. As can be detec ted from t h e i n d i v i d u a l values presented i n F ig . 20, K,,, was h ighes t i n t h e upper p a r t o f t h e B t and decreased t o a minimum va lue o f 0.2 cm/d i n t h e lower p a r t o f t h e B t hor izon. Conduc t i v i t y o f t h i s ho r i zon was extremely v a r i a b l e w i t h a C V o f 450%. Th is h i g h C V va lue i s t h e r e s u l t o f i n c l u s i o n o f two samples w i t h K,,, value o f 90 and 293 cm/d. Exc lus ion o f these values r e s u l t s i n a subs tan t i a l drop i n t h e v a r i a b i l i t y . The lowest a r i t h m e t i c mean value was f o r t he BC hor izon. Hydraul i c c o n d u c t i v i t y o f t h e

cores from this horizon varied between 1.1 and 16.3 cm/d, and the CV (71%) was in moderate range (see Warrick and Nielsen, 1980). The conductivity then increased with depth in saprol i te, but the variation among the individual values was moderate. The maximum and minimum K,,, values measured for the 10 intact cores from saprolite were 2.1 and 31.0 cm/d, respectively. Overall, the hydraulic conductivity profile for this site is similar to Type I11 K,,, profile shown in Fig. 4.
In general, higher values o f conductivity were obtained by the in situ procedure for various depth groups as compared to the individual core values. At 50 and 100 cm depths (i .e., 35 to 50 and 85 to 100 cm depth intervals) the in situ K,,, values were 1.0 to 26.6 and 1.4 to 49.7 cm/d, respectively. A t 150 and 200 cm depths, the minimum K,,, values were 10.3 and 29 cm/d, respectively.
Ksat, cmld .1 1 1 0 100 1,000
Lab In Situ
Figure 20. In si tu and 1 aboratory determined saturated hydraul ic conductivity (K,,,) of the Pacolet soil at Site Number 6 in the Piedmont region.

Table 30. Mean, coefficient of variabi l i ty (CV), number of samples (N), and depth interval for saturated hydraul i c conductivity determined in the laboratory and in s i t u for Pacolet soi l a t S i t e Number 6 in the Piedmont region.
DEPTH ARITHMETIC GEOMETRIC HORIZON INTERVAL N MEAN CV MEAN
Laboratory Met hod
In Si tu
Bulk densi t ies of the B t , BC and C horizons were n o t s ignif icant ly different from one another (Table 31). However, considering the average sand content of saprol i te (74.4% for C1-C6 horizons reported in Table Z8), the bulk density i s lower than bulk density expected for a soi l with comparable texture. The standard deviations of bulk density values for a l l three horizons were relat ively low, resulting in CV values of l e s s than 10%. This i s in agreement with the reported values in l i t e ra tu re (Warrick and Nielsen, 1980). The water content a t saturation (zero soi l water pressure) was also similar for a l l three horizons. However, the amount of water moved out of saprol i t e when soi l water pressure head was decreased t o -300 cm was much larger (approximately 17%) compared t o 8.3% for the B t horizon. Based on the capillary r i s e equation, over 1/3 of a l l the pores in saprol i t e are larger than 0.01 mm in diameter. A t -1,000 cm pressure head, the average water contents of a l l three horizons were f a i r l y similar indicating tha t about 213 of a l l the pores were smaller t h a n 0.003 mm in diameter. Volumetric water contents of the B t , BC and C horizons a t soil water pressure head of -15,000 cm were around 21%.

Table 31. Mean, standard dev ia t ion (SD), and number o f measurements (N) f o r bu lk dens i ty and volumetr ic water content a t var ious s o i l water pressure heads f o r t h e major hor izons o f the
' P a c o l e t s o i l a t S i t e N u m b e r 6 i n t h e P i e d m o n t r e g i o n . - -
S O I L WATER PRESSURE HEAD, cm
BULK HORI ZON DENSITY 0 - 50 -100 -200 -300 -1,000 -5,000 -15,000
Bt Mean SD N
BC Mean SD N
Mean SD N

S i t e Number 7
Th i s s i t e was a pa rce l o f l a n d l o c a t e d i n a s u b d i v i s i o n near Lake Hyco i n Person County. The general topography o f t h e area, l i k e o the r areas around t h e lake , i s most ly r o l l i n g , b u t t h e s lope o f t h e study s i t e was 0-2% and t h e s o i l was considered w e l l dra ined. The s i t e was f o r e s t e d and t h e s o i l pa ren t m a t e r i a l was i d e n t i f i e d as hornblende gneiss and s c h i s t . To eva lua te t h e s o i l and sapro l i t e continuum, and c o l l e c t b u l k and und is tu rbed samples f o r v a r i o u s analyses, a l a r g e observa t ion p i t (approximate ly 6 m long, 3 m wide, and 4 m deep) was dug i n t h e middle o f t h e s i t e . Based on t h e eva lua t i on o f t h e s o i l and s a p r o l i t e i n t h e p i t , t h e s o i l a t t h i s s i t e was considered an Enon taxad junc t . Table 32 conta ins t h e morphological d e s c r i p t i o n f o r t h i s s i t e . For t h i s r e p o r t o n l y se lec ted p r o p e r t i e s o f s o i l and sapro l i t e determined a t t h i s s i t e (and S i t e Number 8) w i l l be presented. For a d d i t i o n a l i n f o r m a t i o n t h e reader i s r e f e r r e d t o Guerta l (1992).
Table 33 presents t h e p a r t i c l e s i z e d i s t r i b u t i o n , i r o n , and organ ic m a t t e r content o f t h e hor izons i d e n t i f i e d i n t h e p i t . The c l a y content was about 46% i n t h e B t hor izon and dec l i ned t o l e s s than 1% i n t h e C3 ho r i zon a t about 3 m depth. The saprol i t e t e x t u r e was sand and t h e s i l t content v a r i e d between 7 and 9%. L i t t l e o rgan ic m a t e r i a l was detec ted i n samples below t h e B t hor izon.
The p a r t i c l e d e n s i t y o f t h e s o i l and sapro l i t e f rom t h e s o i l su r face (Ap) t o 350 cm depth (C3), as determined by t h e pycnometer method us ing water as d i s p l a c i n g l i q u i d , was between 2.7 and 2.81 g/cm3 (Table 34). Except f o r t h e B t hor izon, t h e p a r t i c l e d e n s i t y values f o r t h e vacuum pycnometer were s l i g h t l y h ighe r than t h e corresponding values determined by t h e pycnometer method us ing e i t h e r water o r ethanol . For t h e B t horizon, t h e p a r t i c l e d e n s i t y was s u b s t a n t i a l l y h ighe r f o r t h e vacuum pycnometer method than t h e o t h e r two measurements. High c l a y content o f t h e B t and t h e presence o f ve ry f i n e pores between c l a y p a r t i c l e s perhaps p r o h i b i t t he displacement o f a i r by water o r ethanol d u r i n g measurement by t h e pycnometer method. A i r , on t h e o t h e r hand, can move i n and ou t o f t h e pores e a s i e r than l i q u i d s , r e s u l t i n g i n h ighe r p a r t i c l e d e n s i t y values f o r t h e vacuum pycnometer. Amoozegar e t a]. (1992) observed t h e same type o f d i f f e r e n c e s f o r o the r s o i l s w i t h r e l a t i v e l y h i g h c l a y content . They d i d n o t observe t h e same type o f d i f f e r e n c e s between t h e vacuum pycnometer and pycnometer procedure us ing water f o r sand, rocks, and g lass beads w i t h r e l a t i v e l y few t o no pores on t h e p a r t i c l e s . The b u l k d e n s i t y was t h e lowest i n t h e B t and increased w i t h depth t o about 1.95 g/cm3 f o r t h e C3 hor izon. Th is i s cons i s ten t w i t h t h e development o f s o i l f rom t h e under l y ing saprol i t e . Higher b u l k d e n s i t y i n sapro l i t e a l so agrees w i t h h i g h sand-sized p a r t i c l e content o f t he ma te r ia l s .
The CEC o f t h e B t ho r i zon was about 24 cmolc/kg s o i l (Table 35). S a p r o l i t e CEC decreased f rom 10.3 i n t h e CB ho r i zon t o about 6 cmolc/kg i n t h e C3 hor izon. Th i s t r e n d was s i m i l a r t o t h e t r e n d observed f o r c l a y content , bu t was oppos i te t h e one f o r sand content and b u l k dens i t y as expected. The

Table 32. S o i l c l a s s i f i c a t i o n and p r o f i l e d e s c r i p t i o n f o r S i t e Number 7.
S o i l Ser ies: Enon sandy loam ( taxad junc t ) C l a s s i f i c a t i o n : Fine, mixed, thermic Typ ic Hap luda l f
0 t o 8 cm; da rk brown (10YR 3/3) sandy loam; moderate, medium, subangul a r b locky s t ruc tu re ; f i r m , s t i c k y and p l a s t i c ; many f i n e - coarse roo ts ; c l ea r , smooth boundary.
8 t o 33 cm; s t rong brown (7.5YR 5/6) c l a y loam; moderate, medium, subangul a r s t ruc tu re ; f i r m , s t i c k y and p l a s t i c ; common, fine-medium mangans on v e r t i c a l and h o r i z o n t a l ped faces; dark y e l l o w i s h brown (10YR 4/4) c l a y f i l m s on v e r t i c a l and h o r i z o n t a l ped faces; many f i n e - medi urn roo ts ; c l ea r , smooth boundary.
33 t o 84 cm; var iegated c o l o r s y e l l o w i s h brown (10YR 5/6) s t rong brown (7.5YR 5/6) b l a c k (N 2/0) and redd ish y e l l o w (7.5YR 6/8) greasy c l a y loam (loam?); m a j o r i t y o f hor izon has massive rock c o n t r o l l e d s t r u c t u r e , i s o l a t e d areas o f very weak, medium-fine subangular b l o c k y s t r u c t u r e ; f i r m ; s t i c k y and p l a s t i c ; common, f i n e b lack mangans and Fe coat ings on v e r t i c a l peds faces, mangans are genera l l y assoc ia ted w i t h r o c k s t r u c t u r e and f o l i a t i o n planes; few, f i n e roo ts ; d i f f u s e , wavy boundary.
84 t o 137 cm; var iegated gneiss b lack (n 2/0 y e l l o w i s h brown), s t r o n g brown (7.5YR 5/6) and o thers) sandy loam; massive rock c o n t r o l l e d s t r u c t u r e ; f r i a b l e , s l i g h t l y s t i c k y and s l i g h t l y p l a s t i c ; few c l a y f i l m s associated w i t h r o o t channels; many, f i n e b lack mangans; l a r g e (10 cm o r g rea te r ) Mn coat ings along f o l i a t i o n plans; few, f i n e roo ts ; gradual, wavy boundary.
137 t o 254 cm; banded m a t e r i a l w i t h var iegated co lo rs , crushed rubbed c o l o r y e l l o w i s h r e d (5YR 4/6) sandy loam; massive s t ruc tu re , s t r o n g r o c k c o n t r o l l e d s t ruc tu re ; f i r m ( b r i t t l e ) , s l i g h t l y s t i c k y and s l i g h t l y p l a s t i c ; b lack mangans along f r a c t u r e faces and associated w i t h f o l i a t i o n planes; common y e l l o w i s h r e d (5YR 5/8) c o a t i n g i n f r a c t u r e ; regu l a r banded ma te r ia l , some zones o f more r e s i s t a n t rock , n o t 1 arge enough area t o separate; gradual, wavy boundary. I nc luded i n t h i s ho r i zon i s a 15 cm band o f greenish gabbro-schist . A l l p h y s i c a l f e a t u r e s i m i l a r t o r e s t o f hor izon. Rock d i p i s approximate ly 80 . 254 t o 345 cm; var iegated co lo rs , crushed rubbed c o l o r brown (7.5YR 5/2) sandy loam; massive rock c o n t r o l l e d s t ruc tu re ; f r i a b l e ( few s l i g h t l y b r i t t l e zones) ; s l i g h t l y s t i c k y and s l i g h t l y p l a s t i c ; few y e l l o w i s h r e d Fe (5YR 5/8 and b lack Mn N/O) coat ings i n f r a c t u r e plane; s i m i l a r ma te r i a l extends t o t h e bottom o f t h e p i t .

Table 33. P a r t i c l e s i ze d i s t r i b u t i o n , f r e e i r o n ox ide (Fe,03reported 3s %Fe), and organic matter content o f var ious horizons f o r the Enon taxadjunct s o i l a t S i t e Number 7 i n t he Piedmont region.
HORIZON DEPTH SAND S I L T CLAY Fe ORGAN I C MATTER
Table 34. Bulk dens i ty determined by the core method, and p a r t i c l e dens i ty determined by the vacuum pycnometer and pycnometer (using water and ethanol as d isp lac ing l i q u i d ) methods f o r s o i l and s a p r o l i t e a t S i t e Number 7 i n the Piedmont region.
PARTICLE DENSITY
BULK WATER ETHANOL VACUUM HORIZON DEPTH DENSITY PYCNOMETER PYCNOMETER PYCNOMETER

Table 35. Cation exchange capacity (CEC), base saturation, and pH of various horizons for the Enon taxadjunct soi l a t S i t e Number 7 in Piedmont region.
DH' BASE CEC' APPARENT HORIZON WATER CaC1, SATURAT ION CEC'
@ Determined using 1:l soi l :water ra t io and a 1:2 soil : O . O l M CaC1, solution
# Determined a t pH 7 with NH,OAc and calculated on total soi l mass 5 Calculated based on the mass of clay fraction
relat ively high apparent CEC of the C horizon, particularly C 2 and C3, with respect t o the high sand-sized particles and low clay content i s perhaps due t o negative charges on sand- and sil t-sized part icles as wel: as the fac t tha t the secondary clay minerals in the C horizon are mainly composed of smectite with higher CEC than the other clay minerals. The pH of the soi l and saprol i t e determined by water and CaC1, increased with depth. The Ap horizon a t t h i s s i t e had the lowest pH and the highest organic matter content. The small difference between the pH determined by water and CaC1, indicates tha t there i s l i t t l e exchangeable acidity on the surface of the clay part icles . The B t had the highest base saturation and Ca content (data fo r Ca n o t shown). The concentration of Mg, K , Na, Fe, and Mn was l e s s than 1 cmol/kg for a l l horizons below B t (data not shown, see Guertal , 1992).
The x-ray diffraction analysis (data not shown, see G ~ e r t a l , 1992) showed tha t the dominant clay mineral in a l l horizons was kaol i n i t e with the secondary amounts of hydroxy-inter1 ayer vermicul i t e and smecti t e (Tab1 e 36). The mineral composition in the very fine sand fraction was mostly quartz followed by hornblende. The presence of easily weathered minerals in the sand fraction suggests t h a t some of the C E C may come from charges on par t ic les 1 arger than cl ay-size.

Table 36. Dominant and secondary mineralogy o f c l a y f r a c t i o n and mineral composit ion o f very f i n e sand f r a c t i o n (0.0-0.05 mrn) o f s o i l and s a p r o l i t e a t S i t e Number 7 i n the Piedmont region.
CLAY FRACTION SAND FRACTION Dominant Secondary
HORIZON M i nera l ogy M i ne ra l ogy Quar tz Hornbl ende Feldspar Mica Opaques
A P Kaol i n i t e Hydroxy-i n t e r l ayered 65 21 3 1 10 Vermi cu l i t e
B t Kaol i n i t e Hydroxy-i n t e r l ayered 83 7 2 4 4 Vermi cu l i t e
CB Kaol i n i t e none detected 58 27 5 3 7
C 1 Kaol i n i t e Hydroxy-i n t e r l ayered 50 27 14 4 6 Vermi cu l i t e
C 2 Kaol i n i t e Smecti t e 59 17 14 5 4
C3 Kaol i n i t e Smecti t e 66 19 11 3 2 .

F igu re 21 presents t h e K,,, o f t h e Ap through C 1 ho r i zon as determined i n t h e l a b o r a t o r y us ing i n t a c t core samples c o l l e c t e d w i t h a Giddings probe from va r ious l o c a t i o n s around t h e observa t ion p i t . A lso shown a r e t h e i n s i t u K,,, values o f t h e B t through C3 hor izons determined a t va r i ous l o c a t i o n s i n t h e s tudy area. We should no te t h a t i t was impossib le t o c o l l e c t i n t a c t co re samples from t h e C2 and C3 hor izons from t h e s o i l sur face u s i n g a Giddings sampling tube. Th i s was due t o t h e h igh sand content and h i g h b u l k d e n s i t y o f t h e m a t e r i a l which showed a subs tan t i a l res i s tance t o t h e p e n e t r a t i o n f o r c e p rov ided by our hydraul i c sampl i n g equipment. For t h e 1 abora tory a n a l y s i s (Table 37), t h e h ighes t K,,, occurred i n t h e B t ho r i zon w i t h t h e second h i g h e s t va lue be ing i n t h e CB hor izon. The c o e f f i c i e n t s o f v a r i a t i o n f o r t h e K,,, o f t h e B t and CB hor izons were about 220 and 160%, r e s p e c t i v e l y . Saprol i t e ( C 1 hor izon) had t h e lowest CV (72%). The i n s i t u K,,, values showed a d i f f e r e n t t r e n d w i t h depth. The i n s i t u c o n d u c t i v i t y o f t h e B t was
Ksat, cm/d
.01 .1 1 1 0 100
1 0 Lab I
F igu re 21. I n s i t u and 1 aboratory determined sa tura ted hydrau l i c c o n d u c t i v i t y (K,,,) o f t he Enon taxad junc t s o i l a t S i t e Number 7 i n t h e Piedmont reg ion .

Table 37. Mean, coefficient of variability (CV), number of samples (N), and depth interval for saturated hydraul ic conductivity determined in the laboratory and i n situ for the Enon taxadjunct soil at Site Number 7 in the Piedmont region.
HORIZON DEPTH ARITHMETIC INTERVAL N MEAN
GEOMETRIC CV MEAN
Laboratory Method
A P
Bt
CB
C1
In S i t u
Bt 12-33 6
CB 45-100 7
C1 50-150 10
C2 135-275 8
C3 260-425 4

the lowest, and K,,, increased with depth from an average of 2.2 cm/d in the Bt to 68.2 cm/d in the C3 (well within saprol ite) horizon. The increase in in situ K,,, can be explained by the decrease in the clay content, but does not agree with the increase in the measured bulk density values. The in situ K,,, profile resembled Type 11. The individual core values, however, did not follow a consistent pattern. While the arithmetic mean values resembled Type I, The geometric mean values were similar to a Type I11 K,,, profile. Considering the individual K,,, values, the minimum K,,, occurred in cores coll ected from 20 to 100 cm depth interval. Higher values were measured for samples collected at deeper depth. This places the overall K,,, in a Type H I category.
To measure unsaturated hydraul ic conductivity (La,) and water retention, a Uhland sampler was used to collect intact cores from the pit wall in a horizontal direction. The Uhland sampler was forced into the pit wall using a hydraulic jack. Water retention data revealed that the Bt horizon had the smallest change in the soil water content between 0 and -400 cm of soil water pressure head indicating a narrow range of pore size distribution between these two pressure heads (Table 38). The amount of water released from the cores from 0 to -400 cm soil water pressure head was highest for saprolite, which agrees with higher K,,, values for these materials. The CV (not shown in the table) for all horizons was less than 50% indicating a moderately low variability for this property. The computer generated K,,, values for the saprolite materials are given in Fig. 22. The data indicate that while the Kmsat at -400 cm soil water pressure head (about field capacity, Cassel and Nielsen, 1986) is similar for all three horizons in saprolite, the C3 conductivity increases much more rapidly as water content increases to saturation.
Table 39 presents the features that were identified and counted in the microscopic examination of the thin sections of various horizons. The number of point counts for each of the features for the horizons are given in Table 40. Except for the Bt and CB, the greatest degree of point count variation occurred in the channels and planes categories. The Bt and CB horizons had the lowest percentage of interparticle pores with highest degree of variabil i ty compared to other horizons. Both interparticle pores and total macropores increased with depth while the channels and planes showed a decrease with depth. Below 200 cm depth (in saprol ite) only a few channels or planes were observed in our samples.
As was mentioned earlier, only selected properties measured for the soil and saprol i te at this site (and site X8) are presented in this report. Other analyses included root count measurements and evaluation of the potential for preferential flow through a dyelsolute transport experiment in situ. For information about these analyses and a more comprehensive assessment of other properties, including thin section photographs for Bt, BC and C horizons and individual measurement values, see Guertal (1992).
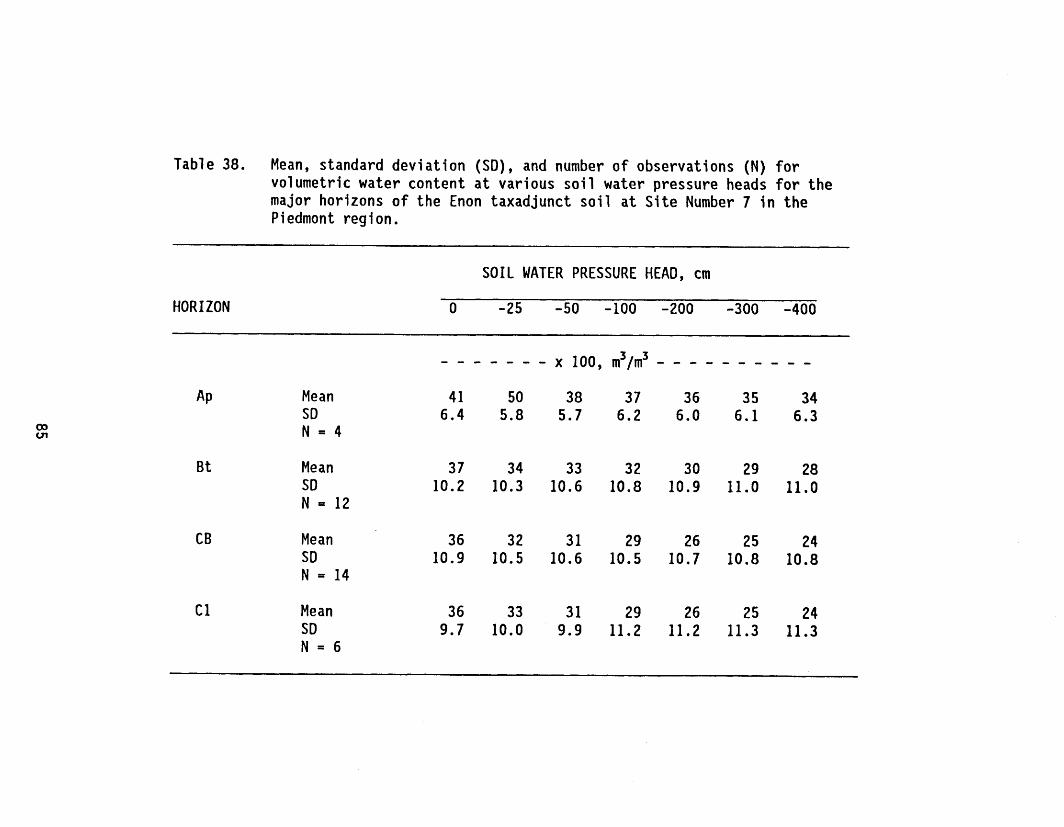
Table 38. Mean, standard dev ia t ion (SD), and number o f observations (N) f o r volumetric water content a t various s o i l water pressure heads f o r t h e major horizons o f the Enon taxadjunct s o i l a t S i t e Number 7 i n t h e Piedmont region.
HORIZON
-
S O I L WATER PRESSURE HEAD, cm
0 -25 -50 -100 -200 -300 -400
AP Mean SD N = 4
Mean SD N = 12
Mean SD N = 14
C1 Mean SD N = 6

0 100 . 200 300 400
SOIL WATER PRESSURE HEAD, -cm
Figure 22. Computer generated unsaturated hydraulic conductivity (Kw,,) for various soil water pressure heads (negative values) for site Number 7.

Table 39. Features t ha t were ident i f ied and counted in each thin section.
FEATURES KEY TO FEATURE IDENTIFICATION
Pore Space
Channel s (CH)
Planes ( P )
In t rapar t ic l es (IP)
In te rpar t i cl es (IG)
Sol ids
Coatings (C)
In f i l l i ngs ( I F )
Elongated, cyl indrical voids t ha t usual l y have smooth walls. Generally the r e su l t of root ac t iv i ty .
Elongated voids t h a t are the r e su l t of so i l s t ructural uni ts o r remnants of rock s t ructure .
Voids t ha t occur as openings within individual mineral grains.
Voids tha t occur as openings between mineral grains.
Material on a void surface t h a t does not f i l l the void.
Material tha t f i l l s in a void e i t he r completely or nearly completely and may include weathered mineral grains.
Groundmass ( G ) The base material (matrix) of the so i l o r saprol i t e which does not include d i s t i n c t features t ha t have been formed i n the so i l o r saprol i t e .

Table 40. Volume percentage, c o e f f i c i e n t o f v a r i a t i o n ( i n parentheses), and number o f t h i n sect ions (N) f o r the Enon taxadjunct s o i l a t S i t e Number 7 i n the Piedmont region.
HORIZON CHANNELS PLANES INTER/INTERAPARTICLE COATINGS INFILLINGS GROUNDMASS

S i t e Number 8
Th is s i t e was a l s o l o c a t e d near Lake Hyco i n Person County. The area o f t h e study was n e a r l y l e v e l (0-5% slope), and t h e s o i l was considered w e l l dra ined. Vegetat ion a t t h e s i t e was f o r e s t and t h e parent m a t e r i a l was i d e n t i f i e d as ma f i c c r y s t a l 1 i n e r o c k (gne iss /sch is t ) . A l a r g e obse rva t i on p i t was dug i n t h e midd le o f t h e study area by a backhoe. S o i l and sapro l i t e morphol og i c a l p r o p e r t i es were assessed a-d bu l k and undi s tu rbed sampl es were c o l l e c t e d f rom va r ious hor izons f o r analyses. Based on t h e e v a l u a t i o n o f s o i l morphological p rope r t i es , t h e s o i l was c l a s s i f i e d as a Mecklenburg taxad junc t . Table 41 presents t h e p r o f i l e d e s c r i p t i o n f o r t h i s s i t e .
P a r t i c l e s i z e d i s t r i b u t i o n , f r e e i r o n ox ide content (as %Fe), and organ ic ma t te r content o f Ap, through C ho r i zon a r e presented i n Table 42. A t t h i s s i t e , t h e B t ho r i zon was found a t about 20 cm below t h e sur face and extended t o about 140 cm w i t h f o u r d i f f e r e n t ho r i zon designat ions. The t r a n s i t i o n a l hor izons were f a i r l y t h i c k and ranged from Bt/C t o CB. Saprol i t e ( C hor izon) was i d e n t i f i e d a t below 270 cm. The c l a y content was h ighes t i n t h e B t4 ho r i zon between t h e depths 110 t o 140 cm.- The sand content o f s a p r o l i t e was about 66% and i t s s i l t content was comparable t o t h e s i l t con tent o f t h e B t and t h e t r a n s i t i o n a l horizons. There was a sharp decrease i n t h e c l a y content f rom t h e CB t o the C hor izon. Only t h e Ap ho r i zon had a no t i ceab le amount o f o rgan ic mater i a1 s.
Bu lk d e n s i t y o f t h e sapro l i t e (C hor izon) was cons iderab ly l e s s than t h e bu l k d e n s i t i e s o f t h e B t hor izons (Tabl e 43). The p a r t i c l e d e n s i t y as determined w i t h water was about 2.76 g/cm3. However, t h e p a r t i c l e d e n s i t i e s determined by t h e vacuum pycnorneter f o r a1 1 t h e hor izons below Ap were s i g n i f i c a n t l y g r e a t e r than t h e d e n s i t i e s determined by water o r ethanol . Considering t h e b u l k and p a r t i c l e dens i t i es , i t appears t h a t s a p r o l i t e a t t h i s s i t e i s much more porous than the B t m a t e r i a l s above it. The p a r t i c l e d e n s i t i e s o f a l l hor izons determined by water pycnometer was n o t app rec iab l y g r e a t e r than t h e d e n s i t y o f quar tz (2.65 g/cm3). The h igh d e n s i t i e s determined by the vacuum pycnometer i s perhap; due t o t h e presence o f i n t e r l a y e r pores between p a r t i c l e s o r presence o f dead end pores on t h e p a r t i c l e s i n t h e B t and s a p r o l i t e ma te r i a l s .
S u r p r i s i n g l y , s a p r o l i t e a t t h i s s i t e had a h ighe r CEC than t h e B t o r t r a n s i t i o n a l m a t e r i a l s (Tabl e 44). Considering t h e re1 a t i v e l y low c l a y content (5.7%) and f r e e i r o n ox ide (3.8% as Fe), i t appears t h a t t h e sand- and s i l t - s i z e d p a r t i c l e s c o n t r i b u t e t o the c a t i o n exchange capac i t y cons iderab ly . The pH o f t h e C ho r i zon determined w i t h water was a l so lower than t h e pH o f t h e B t and t h e t r a n s i t i o n a l horizons. The pH values obta ined by us ing CaC1, s o l u t i o n were n o t d i f f e r e n t from t h e ones obta ined us ing water, except f o r t h e C hor izon. Overa l l , t h e Ca and Mg contents o f t h e C ho r i zon (11.3 and 9.0 cmol /kg, r e s p e c t i v e l y ) were h igher than t h e o t h e r hor izons (data n o t shown). The amounts o f K and Na throughout the p r o f i l e were low. The base s a t u r a t i o n o f t h e CB and C hor izons were s i g n i f i c a n t l y l a r g e r than t h e values f o r B t t o BC hor izons. The Ap had t h e lowest base s a t u r a t i o n .

Table 41. S o i l c l a s s i f i c a t i o n and p r o f i l e d e s c r i p t i o n f o r S i t e Number 8.
S o i l S e r i e s : Meckl enburg loam ( taxad j u n c t ) C l a s s i f i c a t i o n : Fine, mixed, thermic Typic Pal eudal f
AP
B t l
Bt2
Bt3
Bt4
B t C
BC
C B
0 t o 20; ye l lowish brown (1Oyr 516) c l a y loam; weak, medium, subangul a r blocky s t r u c t u r e ; f r i a b l e , s t i c k y and p l a s t i c ; many f i n e , medi um-coarse r o o t s ; ab rup t , smooth boundary.
20 t o 45 cm; red (2.5YR 416) c l a y loam; moderate, f i n e and medium, subangular blocky s t r u c t u r e ; f i rm, s t i c k y and p l a s t i c ; t h i n c l a y films on a l l ped f a c e s ; few , f i n e black mangans o n ped f a c e s ; common f i n e r o o t s ; few, f i n e , b lack mangans o f ped f a c e s ; common, f i n e r o o t s , c l e a r , smooth boundary.
45 t o 80 cm; red (2.5YR 416) c l a y loam; s t rong , f i n e and medium, subangular and angular blocky s t r u c t u r e ; f i rm , s t i c k y and p l a s t i c ; cont inuous c l a y f i l m coa t ings on a l l ped f a c e s ; common f i n e b l ack mangans on both t h e v e r t i c a l and ho r i zon ta l ped f a c e s ; common, f i n e r o o t s ; c l e a r , wavy boundary.
780 t o 112 cm; red (2.5Y 4/6) and reddish yel low (7.5YR 618) c l a y ; s t rong , . medium t o f i n e , subangular and angular blocky s t r u c t u r e ; firm, s t i c k y and p l a s t i c ; s t rong cont inuous c l a y f i l m c o a t i n g s on a l l ped f a c e s ; no mangans p re sen t ; common, f i n e r o o t s ; g r adua l , wavy boundary.
112 t o 140 cm; reddish yel low (7.5YR 6/8-6/6) s i l t y c l a y ; moderate , medium t o coa r se , subangular blocky s t r u c t u r e ; f i rm , s t i c k y and p l a s t i c ; d i scont inuous red (2.5YR 416) c l a y f i l m s on a l l ped f a c e s ; few, f i n e b lack mangans i n f r a c t u r e f aces ; common medium t o f i n e r o o t s ; g r adua l , wavy boundary.
140 t o 185 cm; r edd i sh yel low (7.5YR 6/6-6/8) loam; weak, coarse ' , subangul a r blocky s t r u c t u r e ; f r i a b l e , s t i c k y and p l a s t i c ; few d i scon t inuous red (2.5YR 4/6) c l a y f i l m s on v e r t i c a l ped f a c e s ; few, f i n e b lack mangans i n f r a c t u r e f aces ; few, f i n d r o o t s ; g r a d u a l , i r r egu l a r boundary.
185 t o 225 cm; r edd i sh yel low (7.5YR 6/6-618) s i l t y c l a y loam; ve ry weak, coa r se , subangul a r blocky s t r u c t u r e ; f r i a b l e , s t i c k y and p l a s t i c ; r a r e d i scont inuous red (2.5YR 4/6) c l a y f i l m s ; approximate ly 5% black mangans i n f r a c t u r e and bedding p lanes ; few, f i n e r o o t s ; gradual , i r r egu l a r boundary.
225 t o 270 cm; reddish yel low (5YR 6/8) s i l t loam; massive rock c o n t r o l l e d s t r u c t u r e ; f r i a b l e , s t i c k y and p l a s t i c ; r a r e r e d (2.5YR 4/6) c l a y f i l m ; approximately 5% black mangans i n f r a c t u r e s and bedding pl anes; few, f i n e r o o t s ; g r adua l , i r r e g u l a r boundary.

Tab1 e 41. Continued.
C 270 to 328 cm; brownish yellow (IOYR 618) loam; massive rock controlled structure; very friable, slightly sticky and slightly plastic; few black mangan coatings associated with rock structure; rare roots.
Table 42. Particle size distribution, free iron oxide (Fe,03 reported as %Fe), and organic matter content of various horizons for the Mecklenburg taxadjunct soil at Site Number 8 in the Piedmont region.
HORIZON DEPTH SAND SILT CLAY ORGANIC MATTER
A P Btl Bt2 Bt3 Bt4 B t C BC CB C

Table 43. Bulk densi ty determined by the core method, and p a r t i c l e densi ty determined by the vacuum pycnometer and pycnometer (using water and ethanol as d isp lac ing l i q u i d ) methods f o r s o i l and s a p r o l i t e a t S i t e Number 8 i n the Piedmont reg ion.
PARTICLE DENSITY
BULK WATER ETHANOL VACUUM HORIZON DEPTH DENSITY PYCNOMETER PYCNOMETER PYCNOMETER
A P B t l B t 2 B t 3 B t 4 BtC BC CB C

Table 44. Cation exchange capacity (CEC), base saturation, and pH o f various horizons for the Mecklenburg taxadjunct so i l a t S i t e Number 8 in the Piedmont region.
PH' BASE HORIZON WATER CaC1, SATURATION
CEC' APPARENT CEC'
AP B t l Bt2 Bt3 Bt4 B t C BC C B C
@ Determined using 1:l soi1:water r a t io and a 1:2 soil:O.OlM CaC1, solution
# Determined a t pH 7 with NH,OAc and calculated on to ta l soi l mass $ Calculated based on the mass of clay fraction
The dominant clay mineral of a l l horizons was kaolinite (Table 45). The secondary mineral s of the upper B t horizons and lower t ransi t ional horizons were hydroxy-i nterl ayer verrni cul i t e and smect i t e , respectively. Perhaps higher effect ive CEC values ( i .e . , CEC calculated based on the clay content) of the deeper horizons can be explained by higher levels of smectite. The very f ine sand fractions in the B t horizons were mainly quartz. In the saprol i te layer, quartz comprised only 51% of the f ine sand fraction followed by mica (23%) and hornblende (18%). other minerals identified were feldspar and opaques.
The minimum K,,, value obtained from the in tac t cores in the laboratory was for the transitional horizon (Table 46 and Fig. 23). The highest K,,, values occurred in the upper part of the B t near the Ap horizon. This i s perhaps due t o the presence of macropores created by worm holes and decomposing roots. Saturated hydraul i c conductivity showed an increase with depth from the B t C t h r o u g h the C horizon. Similar t o the other s i t e s , C V for the K,,, was highest in the B t horizon and was lowest in saprol i t e . The in s i tu K,,, of the upper part of the B t horizon was also higher t h a n the K,,, of

Tab le 45. Dominant and secondary minera logy o f c l a y f r a c t i o n and m ine ra l compos i t ion o f ve ry f i n e sand f r a c t i o n (0.1-0.05 mm) o f s o i l and s a p r o l i t e a t S i t e Number 8 i n t h e Piedmont reg ion .
CLAY FRACTION SAND FRACTION Dominant Secondary
HORIZON Mi n e r a l ogy Minera logy Q u a r t z Hornbl ende Fe ldspar M i ca Opaques
B t l w P
B t 2
BtC
Kaol i n i t e
Kaol i n i t e
Kaol i n i t e
Kaol i n i t e
Kaol i n i t e
Kaol i n i t e
Kaol i n i t e
Kaol i n i t e
Kaol i n i t e
Hydroxy- in te r layered Vermi c u l i t e
Hydroxy- i n t e r l ayered Vermi c u l i t e
Hydroxy-1 n t e r l ayered Vermi c u l i t e
Hydroxy- i n t e r l ayered Vermi c u l i t e
none de tec ted
none de tec ted
Smecti t e
Smecti t e
none de tec ted

Table 46. Mean, coefficient of variability (CV), number of samples (N), and depth interval for saturated hydraul ic conductivity determined in the laboratory and in situ for the Mecklenburg taxadjunct soil at Site Number 8 in the Piedmont region.
DEPTH ARITHMETIC GEOMETRIC HORIZON INTERVAL N MEAN CV MEAN
Laboratory Method
In Situ
other horizons. The in situ conductivity showed a sharp decrease within the B t 2 horizon followed by an increase into the Bt3 and B t 4 . Similar to the laboratory determined K,,, values, the transitional horizon BC had the lowest conductivity, and the C horizon's mean conductivity was 42 cm/d. The K,,, profile at this site was Type 111.
The soil water retention data (Table 47) agree with both laboratory and in situ K,,, values. The lowest K,,, values in the Bt2 and BC horizons corresponded well with the low soil water release between saturation and -400 cm soil water pressure head. The coefficient of variation for all horizons for water retention was fairly low indicating the uniformity of pore size distribution among the samples at this site. The computer generated KUn,,, values of soil and saprolite materials were similar at -400 cm soil water pressure head (Fig. 24). As the water content increases, the K-,, of the B t 4 and saprol ite increase substantially.

Ksat, cmld .I 1 10 100 1,000
I D1llll
o *
El 8 , 0 Do@ 5%
i o n fl 0 ~ 0 9 .O In Situ
n
Figure 23. In s i t u and 1 aboratory determined saturated hydraul i c conductivity (K,,,) o f the Mecklenburg taxadjunct soil at Site Number 8 in t h e Piedmont region.

Table 47. Mean, s t anda rd d e v i a t i o n (SD), and number o f o b s e r v a t i o n s ( N ) f o r vo lumet r ic water con ten t a t v a r i o u s s o i l wa te r p r e s s u r e heads f o r t h e major hor izons o f the Mecklenburg t a x a d j u n c t s o i l a t S i t e Number 8 i n t h e Piedmont reg ion .
S O I L WATER PRESSURE HEAD, cm
HORIZON 0 -25 -50 -100 -200 -300 -400
Mean SD
Btl N = 3
Mean SD
Mean SD
Mean SD
Mean SD
BtC N = 4
Mean SD
Mean SD
Mean SD
Mean SD

0 100 200 300 400
SOIL WATER PRESSURE HEAD, -cm
Figure 24. Computer generated unsaturated hydraul ic conductivity (K,?,,) for various soil water pressure heads (negative values) for S ~ t e Number 8.
Table 48 presents the volume percentage of various categories of the components of soil and saprolite determined through point counts for the site. The data indicate that in the argillic horizons ( i . e . , Bt horizons), macropores were mostly in the form of channels and planes. Most of channels were well defined root channels with diameters ranging from 0.05 to 0.2 rnm. The planes were part o f the angular and subangular blocky structure of the Bt materi a1 s. In saprol i te, the majority of pores were interparticle pores. The point count indicated the highest macropores in the saprolite, which agrees well with the lowest bulk density and highest porosity of the materi a1 s compared to other horizons at the site.


Mountain Region
Soil and saprol i t e a t four s i t e s in the Mountain region were evaluated. One s i t e was in Cherokee County and three s i t e s were located in Jackson County. The s o i l s a t these s i t e s are different and represent major s o i l s and saprol i tes in t h i s region. These s i t e s will be referred t o as s i t e s 9 t o 12.
S i te Number 9
This s i t e was located in Jackson County adjacent t o Highway 441 near Sylva. Some of the soil and saprol i te had been removed from part of the s i t e for sa le as f i l l materials before the in i t ia t ion of t h i s study. In an undisturbed part of the s i t e , a 40- by 100-m area was selected for the study. A large p i t was dug with a backhoe t o over 3 m depth and intact soi l cores were collected from a number of locations around the p i t . The morphological properties of the soi l and saprol i t e were then evaluated and bulk samples were collected from various horizons for analyses. Based on the evaluation of the profi le in the p i t the soil was classif ied as a Hayesville clay (Table 49).
The highest clay content was measured in the Btl (Table 50). The clay then dropped sharply from approximately 60% in the Btl t o l e s s than 38% in the Bt2 . In saprol i te , the clay content remained relat ively high. The s i l t content of the Btl was the lowest in the profile. For the Bt2 through saprol i te the s i l t content varied between 19.6 and 25.1%. Iron content was high in both soil and saprol i te with values ranging from 9.9% in B t t o the minimum value of 4.3% in the C materials below 275 cm depth. We should note t h a t the soi l and saprol i te a t t h i s s i t e were very red, indicating high levels of free iron oxide., Only the Ap horizon had a significant amount of organic materi a1 s.
The soi l and saprol i te were bo th acidic, with pH ranging from a high of 6.6 in the BC1 t o the lowest value of 5 in C 2 (Table 51). The soluble s a l t content, as expressed by E C , was fa i r ly low. The L-i was highest in the Ap, perhaps due to higher organic matter content. In the B t and upper transitional horizons the CEC was approximately 3 to 3.5 cmol,/kg. In saprol i te , the C E C was less t h a n 1 cmolJkg. Because of high clay content, the apparent CEC remained re1 a t i vely 1 ow throughout the profi 1 e.
A limited number of in s i t u measurements were obtained a t t h i s s i t e because of the presence of 1 arge rocks in the profile. We were unable t o bore holes without digging the upper part of the profile t o remove the rocks. This resulted in appreciable amounts of time being spent to prepare a few auger holes for in s i tu measurement of K,,,. Obtaining intact cores was also d i f f i cu l t because of the slope of the land. For places where we could col lec t intact cores, we extended the depth of our measurements t o almost 6 m below the surface. The soil a t t h i s s i t e had a relatively high saturated conductivity. Hydraul i c conductivity decreased with depth for b o t h cores and in s i t u measurements (Fig. 25, Table 52). Hydraulic conductivity was higher

Table 49. S o i l c l a s s i f i c a t i o n and p r o f i l e d e s c r i p t i o n f o r S i t e Number 9.
S o i l S e r i e s : Hayesvil l e c l a y C l a s s i f i c a t i o n : Clayey, o x i d i c , mesic Typic Hap1 udul t
Ap 0 t o 18 cm; d a r k r edd i sh brown (5YR 314) cl ay; moderate medium subangular blocky s t r u c t u r e ; f r i a b l e ; few 2-8 cm rounded rocks ; ab rup t m o o t h boundary.
Btl 18 t o 45 cm; r edd i sh brown (2.5YR 414) c l a y ; moderate medium subangul a r bl ocky s t r u c t u r e ; f r i a b l e , s t i c k y and p l a s t i c ; t h i n d i s con t inuous c l a y films; common r o o t s ; g radua l smooth boundary.
Bt2 45 t o 70 cm; r e d (2.5YR 4 /6 ) c l a y loam; moderate medium subangular bl ocky s t r u c t u r e ; f r i a b l e , s t i c k y and pl a s t i c ; t h e n d i scon t inuous c l ay f i l m s ; common f i n e mica f l a k e s ; common r o o t s ; g radua l smooth boundary.
Bt3 70 t o 9 5 cm; r ed ( 2 . 5 YR 4 /8 ) sandy c l a y loam; common ye l lowi sh "sapro l i t e " bodies; weak coa r se subangul a r and angul a r bl ocky s t r u c t u r e ; f r i a b l e , s t i c k y and p l a s t i c ; t h i n d i s con t inuous c l a y f i l m s ; common mica f l akes; common r o o t s ; gradual smooth boundary.
BC1 95 t o 147 cm; r ed (2.5YR 4 / 8 ) sandy c l a y loam; common ye l low bod ie s ; weak c o a r s e angul a r and subangul a r bl ocky s t r u c t u r e ; f r i a b l e , sl i g h t l y s t i c k y and s l i g h t l y p l a s t i c ; few d i scon t inuous c l a y f i l m s ; few r o o t s ; g radua l wavy boundary.
BC2 147 t o 185 cm; red (2.5YR 4/8) sandy c l a y loam common j e l l o w bodies ; weak c o a r s e angular blocky s t r u c t u r e ; f r i a b l e , sl i g h t l y s t i c k y and s l i g h t l y p l a s t i c ; few r o o t s ; c l e a r wavy boundary.
C1 185 t o 235 cm; dark ye l lowish brown (IOYR 3 / 6 ) sandy c l a y loam; many p ink i sh g ray (5YR 7 / 2 ) bands; massive; f r i a b l e ; c l e a r wavy boundary.
C2 235 t o 255 cm; da rk ye l lowish brown (10YR 3 / 6 ) sandy h a m ; p i n k i s h g ray (5YR 7 / 2 ) and ye l lowish brown (IOYR 5 / 8 ) bands; massive; f r i a b l e .

Table 50. Particle size distribution, free iron oxide (Fe203 reported as % Fe), and organic matter content of various horizons for the Hayesville soil at Site Number 9 in the Mountain region.
HORIZON DEPTH SAND SILT CLAY ORGAN I C MATTER
AP Btl Bt2 Bt3 BC1 BC2 C1 C2 c3+
Table 51. Cation exchange capacity (CEC) , electrical conductivity (EC) , and pH o f various horizons for the Hayesville soil at Site Number 9 in the Mountain region.
HORIZON pHa EC' CEC* APPARENT CEC'
AP Btl Bt2 Bt3 BC 1
' BC2 C1 C2 C3t
@ Determined using 1:2 soil :water ratio # Determined with a BaC1, procedure at pH 7 and calculated on total soil
mass $ Calculated based on the mass o f clay fraction

in saprol ite than in the transitional horizon. Overall, the variation among K,,, measurements for the cores obtained from various horizons was high. For the limited number o f in situ measurements CV was in the medium range for hydraulic conductivity.
Ksat, cmld
Figure 25. In si tu and 1 aboratory determined saturated hydraul ic conductivity (K,,) of the Hayesville soil at Site Number 9 in the Mountain region.

Table 52. Mean, coefficient of variability (CV), number of samples (N), and depth interval for saturated hydraul ic conductivity determined i n the laboratory and in situ for the Hayesville soil at Site Number 9 i n the Mountain region.
DEPTH ARITHMETIC GEOMETRIC HORIZON INTERVAL N MEAN CV MEAN
Laboratorv Method
In Situ
N D ~
@ Not determined.
The bulk density of saprolite was less than the bulk density of the soil above it (Table 53). Considering the lower clay content and higher sand content in saprol ite, one may expect to have a higher bulk density in saprol i te. However, our resul ts are consi stent with the devel opment of saprol ite through leaching of materials. At saturation, saprol ite had the highest amount of water (55.2% by volume), which is in agreement with its lower mean bulk density. The amount of water lost from saprol ite between zero and -300 cm soil water pressure head was significantly larger (17.1%) than the amount lost from the Bt materials (6.6%). At -15,000 cm soil water pressure head, the B t had the highest water content while the BC had the lowest water content. The total amount o f water drained from the samples, however, was higher for saprolite than for the transitional horizon.

OCON d (U

S i t e Number 10
T h i s s i t e was nea r t h e sma l l town o f Tuckasegee (near Cul lowhee) i n Jackson County. The s i t e was l o c a t e d on a s teep s l ope i n t h e Mounta in r e g i o n where a few smal l mob i l e homes were l o c a t e d a t t h e t i m e o f o u r s tudy. The o n l y access t o t h e s i t e was t h rough a narrow b u t r e l a t i v e l y s h o r t ( t 0 . 1 m i ) d i r t r o a d t h a t served t h e mob i l e homes on t h e s i d e o f t h e mountain. The owner of t h i s s i t e had p lanned t o i n s t a l l o r subd i v i de h i s p r o p e r t y f o r m o b i l e homes. A r e l a t i v e l y sma l l i r r e g u l a r area (about 20- by 25-m) above t h e r o a d c u t was a v a i l a b l e f o r eva lua t i on . The s i t e s e l e c t e d f o r t h e s t u d y had l i t t l e v e g e t a t i v e cover o f sma l l shrubs and grass.
An obse rva t i on p i t was dug f o r e v a l u a t i o n o f s o i l p r o f i l e and c l a s s i f i c a t i o n o f t h e s o i l . The s o i l ho r i zons were i d e n t i f i e d i n t h e p i t and t h e morphology was eva lua ted (Table 54). The s o i l was t hen p l a c e d i n t h e Watauga s e r i e s . Adequate amounts o f m a t e r i a l s were c o l l e c t e d f r om each
li
h o r i z o n f o r l a b o r a t o r y analyses and development o f a s o i l / s a p r o l i t e bank f o r t r a i n i n g purposes. A s e r i e s o f und i s tu rbed s o i l samples were a l s o c o l l e c t e d f r om around t h e obse rva t i on p i t . Because t h e t e x t u r e o f t h e m a t e r i a l s f r o m
I.
t h e BC t o t h e C ( sap ro l i t e ) ho r i zons was coarse, a p l a s t i c s l eeve was p l a c e d i n s i d e t h e sampl i n g t ube t o c o l l e c t und i s tu rbed cores f o r p h y s i c a l analyses. The sampl ing tube was pushed i n t o t h e s o i l u s i n g t h e Gidd ings h y d r a u l i c sampl ing equipment. A f t e r removing a l o n g column o f s o i l i n t h e p l a s t i c s leeve f r om v a r i o u s depths, t h e samples were t r a n s p o r t e d t o t h e l a b o r a t o r y and c u t i n t o 8 t o 10 cm l o n g s e c t i o n s f o r analyses. *
The B t l h o r i z o n had t h e l owes t sand con ten t and t h e c l a y c o n t e n t o f t h e B t2 was o n l y 20% (Table 55). S a p r o l i t e s t a r t e d a t about 1 m below t h e s u r f a c e i
and i t s sand con ten t was over 90%. The f r e e i r o n ox ide c o n t e n t o f a l l ho r i zons , r e p o r t e d as Fe, was l e s s than I%, which corresponds w e l l w i t h t h e h i g h sand con ten t th roughout t h e p r o f i l e . The o rgan i c m a t t e r c o n t e n t was a l s o l e s s t h a n 0.5% below t h e E hor i zon .
The CEC o f each o f t h e hor i zons , except Bt2, was a l s o q u i t e l o w wh ich corresponds w i t h t h e h i g h sand con ten t (Table 56). The apparent CEC was h i g h e s t i n t h e BC i n d i c a t i n g t h a t some o f t h e sand-sized p a r t i c l e s perhaps have app rec iab le c a p a c i t y f o r c a t i o n exchange. The pH o f t h e e n t i r e p r o f i l e was between 5.1 and 5.5, and t h e EC was l e s s t han 2.4 x S/m. O v e r a l l , t h e l o w s a l t con ten t , a c i d i c cond i t i ons , and sandy t e x t u r e o f t h e h o r i z o n s i n d i c a t e t h a t wa te r can move th rough t h i s s o i l and s a p r o l i t e r e a d i l y .
I n s i t u K,,, was measured a t f o u r depths a t f i v e l o c a t i o n s around t h e p i t (F i g . 26). Due t o v e r y h i g h c o n d u c t i v i t y we were unable t o m a i n t a i n 15 cm head f o r measurements a t 100 cm depth a t one l o c a t i o n and a t 150 cm a t ano ther l o c a t i o n . For t h e l a b o r a t o r y ana l ys i s , because o f h i g h f l o w r a t e , K,,, was determined i n a few hours i n s t e a d o f few days f o r most cores. The i n d i v i d u a l K,,, va lues f o r t h e i n t a c t cores c o l l e c t e d f rom t h e sur face t o 230 cm depth, and t h e i n s i t u va lues determined a t va r i ous dep th i n t e r v a l s , a re shown i n F i g . 26. The minimum K,,, f o r t h e cores was 63 cm/d a t 200 cm dep th i n

Table 54. S o i l c l a s s i f i c a t i o n and p r o f i l e d e s c r i p t i o n f o r S i t e Number 10.
S o i l S e r i e s : Watauga sandy loam C l a s s i f i c a t i o n : Fine-loamy, micaceous, mesic Typic Hap1 udul t
A
Btl
Bt2
BC
C1
C2
0 t o 1 5 cm; d a r k brown (IOYR 3/3) sandy loam; weak f ine g r a n u l a r s t r u c t u r e ; very f r i a b l e ; many f i n e and medium r o o t s ; ab rup t smooth boundary.
15 t o 35 cm; ye l lowi sh brown (10YR 5/4) sandy c l a y loam; weak f i n e granul a r s t r u c t u r e ; f r i abl e; c l e a r smooth boundary.
35 t o 60 cm; ye l lowi sh brown (IOYR 516) sandy c l a y loam; weak f i n e subangul a r bl ocky s t r u c t u r e ; f r i a b l e ; ab rup t wavy boundary.
60 t o 95 cm; brownish ye l low (IOYR 616) loamy c o a r s e sand; weak f i n e subangular blocky s t r u c t u r e ; f r i a b l e ; ye l l owi sh brown (10YR 5/4) bands 2 cm wide t h a t a r e s l i g h t l y cemented a t t h e t op ; abrupt wavy boundary.
95 t o 130 cm; mot t led whi te (IOYR 8 / 2 ) , very p a l e brown (10YR 8 / 3 ) and l i g h t ye l l owi sh brown (IOYR 8 /3 ) and l i g h t ye l lowish brown (IOYR 6/4) and 1 i g h t ye l lowish brown (IOYR 614) c o a r s e sand; massive; f r i a b l e ; ye1 1 owi sh brown (IOYR 514) bands, abrupt wavy boundary.
130 t o 145 cm; whi te (IOYR 812) and very p a l e brown (IOYR 813) c o a r s e sand; massive; f r i a b l e ; ye l lowish brown (IOYR 514) bands.
Note: few r o o t s found i n da rk bands i n BC and C hor izons

Table 55. P a r t i c l e s i z e d i s t r i b u t i o n , f r e e i r o n ox ide (Fe,03 r e p o r t e d as X Fe), and organ ic mat te r content o f va r i ous ho r i zons f o r t h e Watauga s o i l a t S i t e Number 10 i n t h e Mountain reg ion .
HORI ZON DEPTH SAND SILT C LAY Fe ORGAN I C MATTER
A P 0-15 72.0 19.0 9.0 0.11 1.22 B t l 15-30 64.3 18.4 17.3 0.25 0.68 B t2 30-60 71.2 8.8 20.0 0.66 0.27 BC 60-95 88.1 7.3 4.6 0.16 0.32 C 1 95-125 90.1 4.6 5 . 3 0.07 0.11 C2 125 91.6 3.5 4.9 0.02 0.02
Tab1 e 56. Cat ion exchange capac i ty (CEC) , e l e c t r i c a l c o n d u c t i v i t y (EC) , and pH o f var ious hor izons f o r t h e Watauga s o i l a t S i t e Number 10 i n t h e Mountain region.
HORIZON APPARENT CEC'
A P 5.1 24 1.3 14.3 B t l 5.2 19 1.8 10.4 B t2 5.1 2 1 3.3 16.5 BC 5.3 20 1.3 28.0 C 1 5.5 17 0.7 13.3 C2 5.3 16 0.5 10.2
@ Determined us ing 1:2 s o i l :water r a t i o # Determined w i t h a BaC1, procedure a t pH 7 and c a l c u l a t e d on t o t a l s o i l
mass $ Ca lcu la ted based on t h e mass o f c l a y f r a c t i o n

saprol ite. The maximum value (1,507 cm/d) was also in saprol ite (at 135 cm depth). Overall the BC had the lowest mean K,,, value (Table 57), and the general hydraulic conductivity profile for the intact cores was of Type 111 (see Fig. 4). For the in situ values, K,,, was lowest in the upper part of the profile (between 25 and 70 cm depth interval) and increased with depth continuously. Saturated hydraul ic conductivities of the A and Btl horizons were not determined in situ. The in situ K,,, profile increased with depth (Type 11) perhaps due to higher clay content in the Bt horizon and increased sand content at deeper depths. Overall, this site had by far the highest conductivity values measured at any of our study sites.
Ksat, crnld
Figure 26. In si tu and 1 aboratory determined saturated hydraul ic conductivity (K,,) of the Watauga soil at Site Number 10 in the Mountain region.

Table 57. Mean, c o e f f i c i e n t of v a r i a b i l i t y (CV), number o f samples ( N ) , and depth i n t e r v a l f o r sa tu ra t ed hydraul i c conduc t iv i ty determined i n t h e l abora to ry and i n situ f o r t h e Watauga s o i l a t S i t e Number 10 i n t h e Mountain region.
DEPTH ARITHMETIC GEOMETRIC HORIZON INTERVAL N MEAN C V MEAN
Laboratory Method
In S i t u
Bulk dens i ty increased with depth from a low mean value of 1.22 g/cm3 f o r t h e A and B t horizons t o a mean value of 1.5 c ~ / c m ~ f o r saprol i t e (Table 58). Water content a t s a t u r a t i o n was around 40% f o r B t , BC and C hor izons . The major i ty of t h e pores in a l l horizons were l a r g e r than 0.01 mm i n d iameter as indica ted by t h e drainage of more than 60% o r more of t h e water when s o i l water pressure head was decreased from zero t o -300 cm. Water con ten t s a t -5,000 and -15,000 cm s o i l water pressure heads were e s s e n t i a l l y t h e same f o r each horizon with 1 i t t l e d i f f e r e n c e among t h e var ious horizons.

Table 58. Mean, standard d e v i a t i o n (SO), and number o f measurements (N) f o r b u l k d e n s i t y and vo lumet r ic water con ten t a t va r i ous s o i l water pressure heads f o r t h e major hor izons o f t h e Watauga s o i l a t S i t e Number 10 i n t h e Mountain reg ion .
SOIL WATER PRESSURE HEAD, cm
BULK HORIZON DENSITY 0 -50 -100 -200 -300 -1,000 -5,000 -15,000
AE Mean SO N
B t Mean SD N
BC Mean SD N
C Mean SD N

S i t e Number 11
T h i s s i t e was downslope f rom S i t e Number 10 on t h e s i d e o f t h e mountain near Tuckasegee i n Jackson County. As we mentioned i n t h e M a t e r i a l s and Methods sec t ion , we se lec ted t h i s s i t e f o r our s tudy a f t e r our i n i t i a l i n v e s t i g a t i o n o f t h e s i d e o f t h e mountain i n d i c a t e d t h a t t h e s o i l s i n t h e wooded area downslope f rom S i t e Number 10 were d i f f e r e n t from what was observed upslope. T h i s s i t e , however, was l oca ted on a steep s lope and was h e a v i l y wooded w i t h hardwood t rees . Therefore, t h e r e was no access by machinery and no i n t a c t cores were obtained from t h i s s i t e .
An observa t ion p i t was hand dug t o about 150 cm depth. The s o i l and sapro l i t e morphology was 'eva lua ted and t h e s o i l was p laced i n t h e Chandler so i 1 se r i es . Bul k s o i l samples were then c o l l e c t e d from each h o r i z o n f o r l a b o r a t o r y analyses. I n add i t i on , t he s i t e was d i v i d e d i n t o 10- by 10-m square areas and i n s i t u K,,, was measured a t f o u r depths i n s i d e seven o f t h e 10 squares. Four 6-cm diameter auger holes (50, 100, 150, and 200 cm deep) were bored on a t r a n s e c t i n t h e middle o f each square and K,,, was measured by ma in ta in ing approximate ly 15 cm o f water a t t h e bottom o f each ho le . A t two l o c a t i o n s we cou ld n o t bore a ho le t o 200 cm depth, and a t one l o c a t i o n two measurements were made a t 50 cm depth w h i l e no measurement was made a t 100 cm depth.
Table 59 presents t h e p r o f i l e d e s c r i p t i o n f o r t h e Chandler s o i l s e r i e s a t t h e s i t e . As i nd i ca ted , t h e r e was no t r a n s i t i o n a l ho r i zon below t h e B hor izon, and a C r ho r i zon was immediately below t h e Bt3 hor izon. It should be noted t h a t i t was d i f f i c u l t t o d i g an auger ho le by hand below 150 cm depth. The c l a y contents o f t h e Bt2 and Bt3 were over 15% w i t h l i t t l e i n d i c a t i o n o f i l l u v i a t e d c l a y f rom t h e upper horizons (Table 60). Minimal c l a y i nc rease i n t h e B ho r i zon qua1 i f i e d f o r an a r g i l l i c horizon. The C r had a c l a y con ten t o f about 8% and a sand content o f 84%. The organic content o f t h e s o i l was g e n e r a l l y low and t h e f r e e i r o n oxide contents o f a l l hor izons v a r i e d between 0.04 and 0.27%.
The s o i l and t h e C r ho r i zon were a c i d i c w i t h pH o f l e s s than 5.6 (Table 61). The CEC o f a l l hor izons was l ess than 2.2 cmol,/kg and t h e t o t a l s o l u b l e s a l t content , as expressed by EC, was a l so low. The maximum apparent CEC (14.6 cmol,/kg c l a y ) was f o r t h e Bt3 horizon. The r e l a t i v e l y low apparent CEC i n d i c a t e s t h a t t h e c l a y minera ls a t t h i s s i t e are n o t very a c t i v e and a r e g e n e r a l l y o f t h e 1 : 1 type.
The i n d i v i d u a l i n s i t u K,,, and the means and c o e f f i c i e n t s o f v a r i a t i o n s f o r va r i ous depth i n t e r v a l s are shown i n F ig . 27 and Table 62, r e s p e c t i v e l y . For t h e 50 and 100 cm depths t h e CV values f o r K,,, (75 and 76%, r e s p e c t i v e l y ) were moderately h igh . I n t h e upper p a r t o f t h e p r o f i l e t h e range o f K,,, f o r 8 measurements was between 4.6 and 17.5 cm/d. A t deeper depths, however, l ow K,,, values were obta ined a t some loca t ions . Th is i s perhaps due t o t h e v a r i a t i o n i n depth t o t h e C r o r hard ma te r ia l s observed throughout t h e s i t e . A t 150 cm depth, f o r example, t h e lowest measured K,,, was 0.4 and
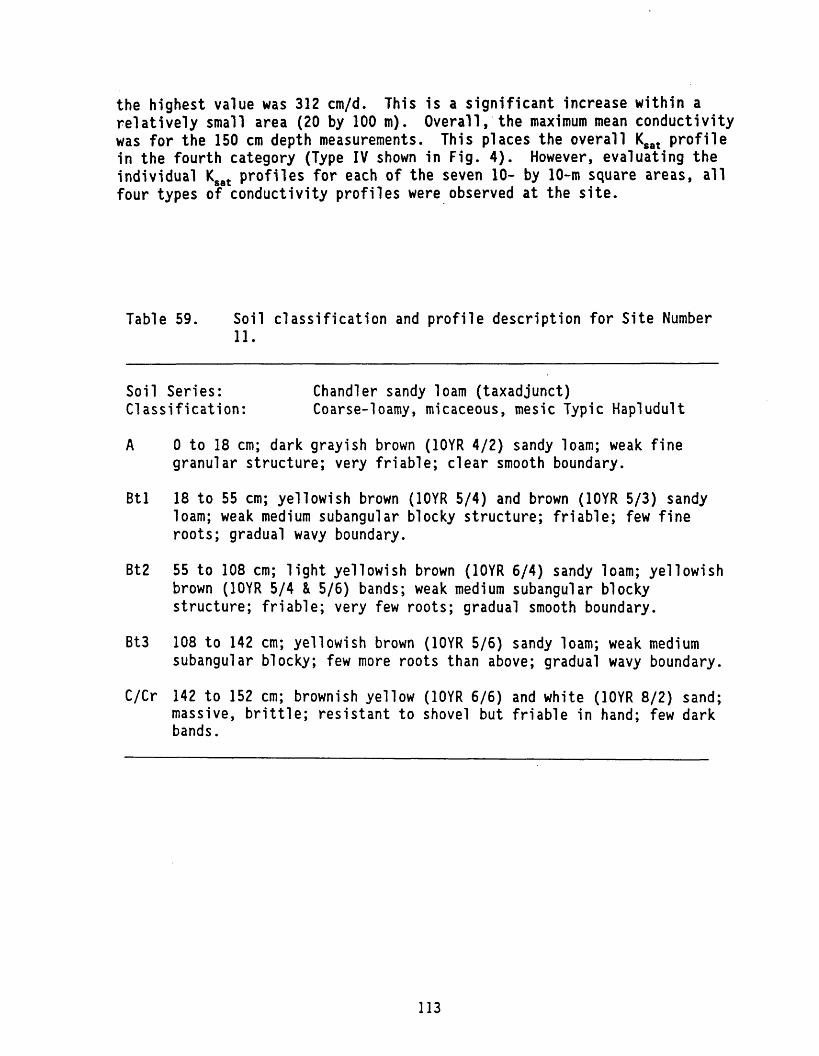
t he highest value was 312 cm/d. This i s a s i g n i f i c a n t increase w i t h i n a re1 a t i ve l y small area (20 by 100 m) . Overa l l , ' t he maximum mean conduc t i v i t y was fo r the 150 cm depth measurements. This places the ove ra l l K,,, p r o f i l e i n t he f o u r t h category (Type I V shown i n Fig. 4). However, eva luat ing t h e i n d i v i d u a l K,,, p r o f i l e s f o r each o f the seven 10- by 10-m square areas, a l l four types o f conduc t i v i t y p r o f i l e s were observed a t the s i t e .
Tab le59 . S o i l c l a s s i f i c a t i o n a n d p r o f i l e d e s c r i p t i o n f o r S i t e N u m b e r 11.
S o i l Series: Chandler sandy 1 oam ( taxadjunct) C lass i f i ca t i on : Coarse-1 oamy, micaceous, mesic Typic Hap1 udul t
A
B t l
Bt2
B t 3
C / C r
0 t o 18 cm; dark gray ish brown (10YR 4/2) sandy loam; weak f i n e granular s t ruc ture ; very f r i a b l e ; c l e a r smooth boundary.
18 t o 55 cm; ye l low ish brown (IOYR 514) and brown (10YR 5/3) sandy loam; weak medium subangular blocky s t ruc ture ; f r i a b l e ; few f i n e roots; gradual wavy boundary.
55 t o 108 cm; l i g h t ye l low ish brown (IOYR 614) sandy loam; ye l l ow i sh brown (10YR 5/4 & 5/6) bands; weak medium subangul a r b locky s t ruc ture ; f r i a b l e ; very few roots; gradual smooth boundary.
108 t o 142 crn; ye l lowish brown (1OYR 5/6) sandy loam; weak medium subangular blocky; few more roo ts than above; gradual wavy boundary.
142 t o 152 em; brownish ye l low (IOYR 6/6) and whi te (IOYR 8/2) sand; massive, b r i t t l e ; r e s i s t a n t t o shovel but f r i a b l e i n hand; few dark bands.

'ab le 60. P a r t i c l e s i z e d i s t r i b u t i o n , f r e e i r o n ox ide (Fe,03 r e p o r t e d as % Fe), and organic mat te r content o f var ious ho r i zons f o r t h e Chandler s o i l a t S i t e Number 11 i n t h e Mountain reg ion .
HORIZON DEPTH SAND SILT CLAY Fe ORGAN I C MATTER
cm - - - - - - - - - - - % - - - - - - - - - - - -
A 0-18 71.2 20.5 8.3 0.25 1.23
B t l 18-55 71 .3 17.6 11.1 0.27 0.85
B t2 55-108 74.3 10.6 15.1 0.04 0.15
Bt3 108-142 68.9 16.0 15.1 0.04 0.20
C r 142t 84.9 8.6 7.7 0.12 0.0
Tab1 e 61. Cat ion exchange capac i ty (CEC), e l e c t r i c a l c o n d u c t i v i t y (EC) , and pH o f var ious horizons f o r t h e Chandler s o i l a t S i t e Number 11 i n t h e Mountain region.
HORIZON PH' EC' CEC' APPARENT CEC'
x S/m - - - - cmol,/kg - - - -
A 5.0 28 1.1 13.2
B t l 4.9 21 1.0 9.0
B t2 5.4 16 1.6 10.6
Bt3 5.3 18 2.2 14.6
C r 5.6 9 0.9 11.7
@ Determined us ing 1:2 s o i l :water r a t i o # Determined w i t h a BaC1, procedure a t pH 7 and ca l cu la ted on t o t a l s o i l mass
$ Ca lcu la ted based on t h e mass o f c l a y f r a c t i o n

Table 62. Mean, c o e f f i c i e n t o f v a r i a b i l i t y (CV), number o f samples (N), and depth i n t e r v a l f o r sa tu ra ted hydrau l i c c o n d u c t i v i t y determined i n s i t u f o r t h e Chandler s o i l a t S i t e Number 11 i n t h e Mountain reg ion .
DEPTH ARITHMETIC GEOMETRIC HORIZON l NTERVAL N MEAN CV MEAN
cm Laboratory Method
' Laboratory Method NOT DETERMINED
I n S i t u
F igure 27.
Ksat, cmld 1 1 0 1 0 0 1 , 0 0 0
I n s i t u sa tura ted h y d r a u l i c c o n d u c t i v i t y (Ks,,) o f t h e Chandler s o i l a t S i t e Number 11 i n t h e Mountain reg ion .
115
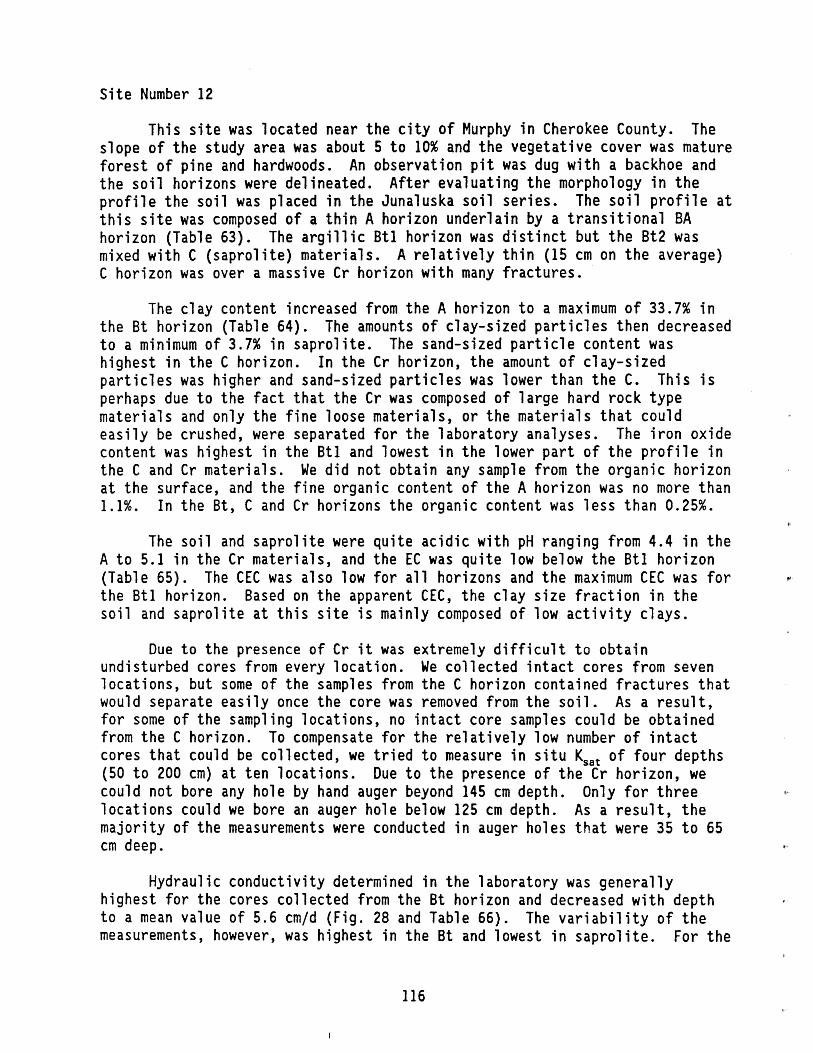
S i t e Number 12
This s i t e was located near the c i t y of Murphy in Cherokee County. The slope of the study area was about 5 t o 10% and the vegetative cover was mature fo re s t of pine and hardwoods. An observation p i t was dug with a backhoe and the s o i l horizons were delineated. After evaluating the morphology i n the p ro f i l e the so i l was placed in the Junaluska so i l se r ies . The s o i l p r o f i l e a t t h i s s i t e was composed of a thin A horizon underlain by a t r ans i t i ona l BA horizon (Table 63). The a r g i l l i c B t l horizon was d i s t i n c t but the Bt2 was mixed with C (saprol i t e ) materials. A r e l a t i ve ly th in (15 cm on the average) C horizon was over a massive Cr horizon with many fractures .
The clay content increased from the A horizon t o a maximum of 33.7% in the B t horizon (Table 64). The amounts of clay-sized pa r t i c l e s then decreased t o a minimum of 3.7% in sapro l i te . The sand-sized pa r t i c l e content was highest in the C horizon. In the Cr horizon, the amount of clay-sized pa r t i c l e s was higher and sand-sized par t ic les was lower than the C. This i s perhaps due t o the f a c t t ha t the Cr was composed of la rge hard rock type materials and only the f ine loose materials, or the materials t h a t could eas i ly be crushed, were separated fo r the laboratory analyses. The iron oxide content was highest in the Btl and lowest in the lower par t of the p r o f i l e in the C and Cr materials. We did not obtain any sample from the organic horizon a t the surface, and the f ine organic content of the A horizon was no more than 1.1%. In the B t , C and Cr horizons the organic content was l e s s than 0.25%.
The so i l and sapro l i te were quite acidic with pH ranging from 4.4 in the A t o 5.1 in the Cr materials, and the EC was qui te low below the Btl horizon (Table 65). The CEC was also low fo r a l l horizons and the maximum CEC was f o r the Btl horizon. Based on the apparent C E C , the clay s i z e f rac t ion in t he so i l and saprol i te a t t h i s s i t e i s mainly composed of low a c t i v i t y c lays .
Due t o the presence of Cr i t was extremely d i f f i c u l t t o obtain undisturbed cores from every location. We collected in t ac t cores from seven locations, b u t some of the samples from the C horizon contained f r ac tu re s t h a t would separate easi ly once the core was removed from the s o i l . As a r e s u l t , fo r some of the sampling locations, no in t ac t core samples could be obtained from the C horizon. To compensate for the re la t ive ly low number of i n t a c t cores t ha t could be collected, we t r i ed t o measure i n s i t u K,,, of four depths (50 t o 200 cm) a t ten locations. Due t o the presence of the Cr horizon, we could not bore any hole by hand auger beyond 145 cm depth. Only f o r th ree locations could we bore an auger hole below 125 cm depth. As a r e s u l t , t h e majority of the measurements were conducted in auger holes t h a t were 35 t o 65 cm deep.
Hydraul i c conductivity determined in the 1 aboratory was general l y highest for the cores collected from the B t horizon and decreased with depth t o a mean value of 5.6 cm/d (Fig. 28 and Table 66). The var iabi l i t y of t he measurements, however, was highest in the B t and lowest in s ap ro l i t e . For the

Table 63. S o i l c l a s s i f i c a t i o n and p r o f i l e d e s c r i p t i o n f o r S i t e Number 12.
S o i l S e r i e s : Juna l uska 1 oam C l a s s i f i c a t i o n : Fine-loamy, mixed, mesic Typic Hapludul t
A 0 t o 10 cm; s t r o n g brown (7.5YR 5/6) loam; weak medium subangul a r blocky structure; very f r i a b l e ; many f i n e t o c o a r s e r o o t s ; g r adua l smooth boundary.
BA 10 t o 25 cm; ye1 lowish r e d (5YR 5/6) loam; weak medium subangul a r blocky s t r u c t u r e ; f r i a b l e ; common f i n e t o very c o a r s e r o o t s ; g r adua l wavy boundary.
Btl 25 t o 53 cm; red (2.5YR 4/8) c l a y loam; moderate medium subangu la r blocky s t r u c t u r e ; f r i a b l e ; d i s con t inuous c l a y f i l m s on f a c e s o f peds; few f i n e t o medium r o o t s ; d i f f u s e wavy boundary.
Bt2 53 t o 85 cm; r ed (2.5YR 4/8) c l a y loam; 30 pe rcen t brownish y e l l o w (IOYR 6/8) rock fragments; moderate medium subangular blocky s t r u c t u r e ; f r i a b l e ; d i s con t inuous c lay f i l m s on ped f a c e s ; few f i n e t o medium r o o t s r e s t r i c t e d t o red p a r t s o f hor izon; gradual wavy boundary.
Cr 85 t o 152 cm; moderately hard f r a c t u r e d phyl i t e ; b lack manganese on f a c e s o f f r a c t u r e s ; few seams o f red (2.5YR 4/8) loam 2-10 cm i n width.

Table 64. Par t ic le s i ze d i s t r ibu t ion , f r ee iron oxide (Fe,?, reported a s X Fe), and organic matter content of various ho r~zons f o r the Junaluska soil a t S i t e Number 12 i n the Mountain region.
HORIZON DEPTH SAND SILT CLAY Fe ORGAN I C MATTER
A 3-10 35.0 40.8 24.2 4.52 1.13 B A 10-25 33.1 40.1 26.8 5.31 0.97 B t l 25-53 37.7 29.1 33.2 7.44 0.25 ~ t 2 - C ' 53-85 37.4 28.9 33.7 3.04 0.15 C - ~ t 2 ' 53-85 45.3 37.3 17.4 2.49 0.25 C 76-90 73 . 5 22.8 3.7 2.16 0.25 Cr 85t 64.7 23.6 11.7 2.03 0.15
# B t 2 and C horizon mixed with wavy boundary.
Tab1 e 65. Cation exchange capacity (CEC) , el ec t r i ca l conductivity ( E C ) , and pH of various horizons fo r the Junaluska so i l a t S i t e Number 12 in the Mountain region.
HORIZON APPARENT CEC'
A B A
Btl B t 2 - C C - B t 2 C Cr
@ Determined using 1:2 so ikwa te r r a t i o # Determined with a BaC1, procedure a t pH 7 and calculated on t o t a l s o i l
mass 5 Calculated based on the mass of clay f ract ion

i n s i t u measurement, r e l a t i v e l y h igh conduc t i v i t y values were obtained i n the upper p a r t o f t he p r o f i l e , w i t h a maximum value o f 375 cm/d f o r t he 30 t o 45 cm depth i n t e r v a l . The minimum i n s i t u K,,, above 65 cm depth was more than 5 cm/d. The conduc t i v i t y decreased between the 65 and 90 cm depth i n t e r v a l , and the re was no t a major increase i n the i nd i v i dua l values down t o t he 145 cm depth. The maximum K,,, value obtained i n s i t u f o r the 105 t o 120 cm depth i n t e r v a l was 33.6 cm/d and t he minimum value was about 4.5 cm/d. Overa l l t he conduc t i v i t y a t t h i s s i t e decreased w i t h depth and i s considered t o be o f the Type I shown i n Fig. 4.
Ksat, cmld
Figure 28. I n s i t u and 1 aboratory determined saturated hydraul i c conduc t i v i t y (K,,) o f the Junaluska s o i l a t S i t e Number 12 i n the Mountain region.
1 1 0 100 1,000 0
0
l o 1 1 1 1 1 1 1 I I I 1 1 1 1 , 1 1 1 1 1 1 1
El 0 $ Ela
48 5 08 * a - 4.s ** 0 9 In Situ
n W - Eta
$ * O
B &

Table 66. Mean, c o e f f i c i e n t o f v a r i a b i l i t y (CV), number o f samples ( N ) , and depth i n t e r v a l f o r s a t u r a t e d hyd rau l i c c o n d u c t i v i t y determined i n t h e l a b o r a t o r y and i n situ f o r Juna luska s o i l a t S i t e Number 12 i n t h e Mountain reg ion .
DEPTH ARITHMETIC GEOMETRIC HORIZON INTERVAL N MEAN CV MEAN
cm Laboratory Method
In S i t u 35-65 23 55.7 164 28.5 65-90 8 13.2 67 10 .8
105-145 5 18.8 70 13.0
Bulk d e n s i t i e s (Table 67) o f t h e B t and BC hor izons were s i m i l a r and had CV va lues o f l e s s t han 10% ( d a t a no t shown). Saprol i t e bulk d e n s i t y , however, was h ighe r wi th a CV of approximately 10% (100 x O.l4/1.44). A t s a t u r a t i o n ( ze ro s o i l water p r e s su re head) , water c o n t e n t s o f a l l t h r e e ho r i zons were s i m i l a r . A t -300 cm s o i l water p r e s su re head, about 22% o f t h e wa te r was removed from s a p r o l i t e compared t o 30% f o r t h e B t hor izon. Under -15,000 cm s o i l water p r e s s u r e head, s a p r o l i t e could hold about 20% of i t s wa te r c o n t e n t a t s a t u r a t i o n whereas t h e B t hor izon r e t a i n e d almost 1/2 o f i t s wa te r a t s a t u r a t i o n . We should no t e t h a t t h e average water con ten t under -1,000 cm s o i l water p r e s s u r e head i s h igher than t h e average va lue under -300 cm o f s o i l water p r e s s u r e head f o r t h e B t and BC horizons-. Th i s i s due t o t h e f a c t t h a t t h e samples a r e analyzed by a d i f f e r e n t procedure and such a d i s c r epancy could r e s u l t from t h e l a c k o f complete s a t u r a t i o n o r changes t h a t may result du r ing t h e handl ing o f t h e samples.

aro W 0 L n M -
MQO . a'= M
aw N h h *
a- Q) O r c E > o
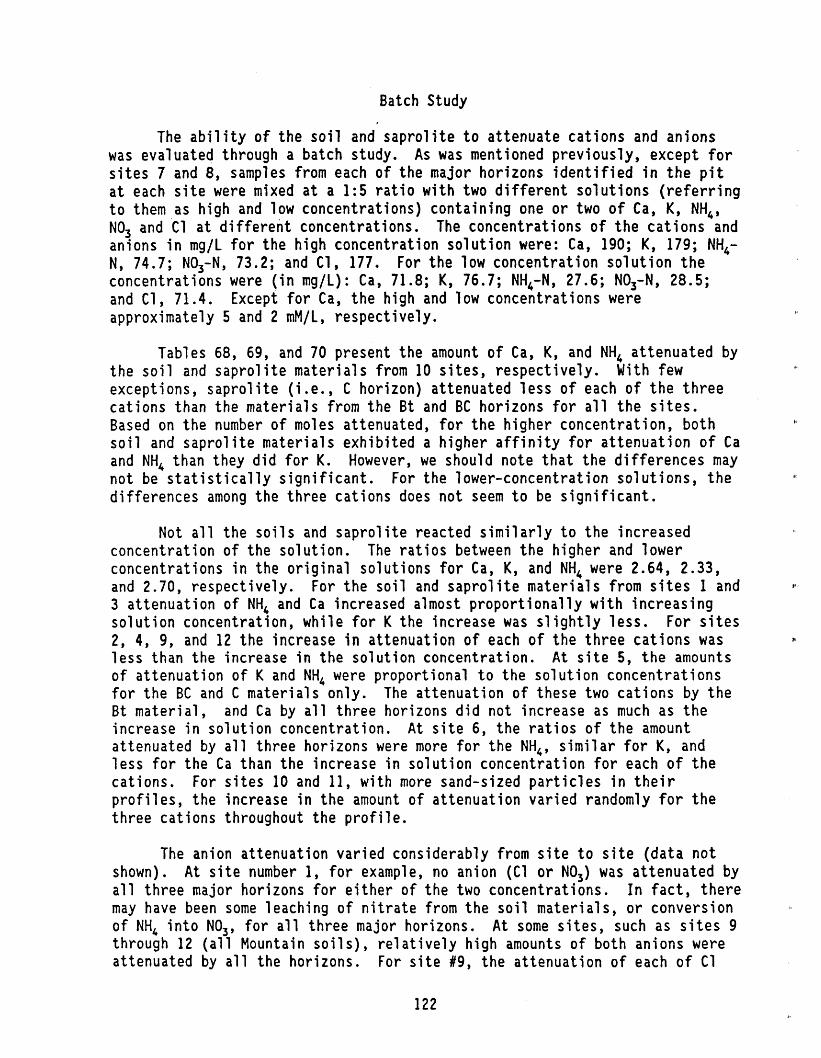
Batch Study
The ability of the soil and saprolite to attenuate cations and anions was evaluated through a batch study. As was mentioned previously, except for sites 7 and 8, samples from each of the major horizons identified in the pit at each site were mixed at a 1:5 ratio with two different solutions (referring to them as high and low concentrations) containing one or two of Ca, K, NH,, NO3 and ' ~ l at different concentrations. The concentrations of the cations and anions in mg/L for the high concentration solution were: Ca, 190; K, 179; NH,- N, 74.7; NO3-N, 73.2; and C1, 177. For the low concentration solution the concentrations were (in mg/L): Ca, 71.8; K, 76.7; NH,-N, 27.6; NO3-N, 28.5; and C1, 71.4. Except for Ca, the high and low concentrations were approximately 5 and 2 mM/L, respectively.
Tables 68, 69, and 70 present the amount of Ca, K, and NH, attenuated by the soil and saprolite materials from 10 sites, respectively. With few exceptions, saprolite (i.e., C horizon) attenuated less of each of the three cations than the materials from the Bt and BC horizons for all the sites. Based on the number of moles attenuated, for the higher concentration, both soil and saprolite materials exhibited a higher affinity for attenuation of Ca and NH, than they did for K. However, we should note that the differences may not be statistically significant. For the lower-concentration solutions, the differences among the three cations does not seem to be significant.
Not all the soils and saprolite reacted similarly to the increased concentration of the solution. The ratios between the higher and lower concentrations in the original solutions for Ca, K, and NH, were 2.64, 2.33, and 2.70, respectively. For the soil and saprolite materials from sites 1 and 3 attenuation of NH, and Ca increased almost proportionally with increasing solution concentration, while for K the increase was slightly less. For sites 2, 4, 9, and 12 the increase in attenuation of each of the three cations was less than the increase i n the solution concentration. A t site 5, the amounts of attenuation of K and NH, were proportional to the solution concentrations for the BC and C materials only. The attenuation of these two cations by the Bt material, and Ca by all three horizons did not increase as much as the increase in solution concentration. At site 6, the ratios of the amount attenuated by all three horizons were more for the NH,, similar for K, and less for the Ca than the increase in solution concentration for each of the cations. For sites 10 and 11, with more sand-sized particles in their profiles, the increase in the amount of attenuation varied randomly for the three cations throughout the profile.
The anion attenuation varied considerably from site to site (data not shown). A t site number 1, for example, no anion (C1 or NO,) was attenuated by all three major horizons for either of the two concentrations. In fact, there may have been some leaching of nitrate from the soil materials, or conversion of NH, into NO,, for all three major horizons. At some sites, such as sites 9 through 12 (all Mountain soils), relatively high amounts of both anions were attenuated by all the horizons. For site #9, the attenuation of each of C1
A L L

Table 68. Attenuation o f Ca by soil and saprolite from 10 s i t e s as determined by the batch study.
190 mq/L (9.5 mmol / L l 71 .8 ms/L (3.6 mmol /L ) S I T E NUMBER B t BC C B t BC C
Table 69. Attenuation o f K by soil and saprolite from 10 sites as determined by a batch study.
179 ms/L (4.6 mmol /L) S I T E NUMBER Bt BC C
76.7 mq/L 12.0 mmol l L 1
Bt BC C

Table 70. Attenuation of NH, by soil and saprolite from 10 sites as determined by a batch study.
74.7 mq/L (5.3 rnmol/L) 27.6 ms/L (2.0 mmol /L) SITE NUMBER Bt BC C Bt BC C
and NO, was almost as much as the attenuation for NH,. In the Piedmont region, some of the soils and saprolite materials had little or no affinity to attenuate anions. Overall, the capacity of the Bt materials to attenuate anions was higher than the capacity of the saprolite materials to attenuate negatively charged ions. For some soils or saprolites with no anion absorption at low concentration, increasing tht concentration of the anions in solution resulted in some attenuation. This is perhaps related to the small anion absorption capacity of the materials.
Eva1 uation of Septic Systems
Piedmont Regi on
General Soil Characteri stics: The soil at the N. Wake County [hereafter referred to as N. Wake] site had the shallowest average depth to saprolite and the thinnest transitional (BC) horizon of all the three Piedmont sites (Tables 71 to 73). As expected, the clay content decreased with depth at all three sites, but the sand content in saprol ite was not higher than the sand content of the BC horizons for every site. Bulk density of saprol i te was lower than the bulk density of the Bt and BC horizons which corresponds with the

Tab1 e 71. Arithmetic average, standard devi ation (in parentheses), and number of observations (N) for selected. soil physical and chemical properties for the Bt, BC, and C (saprolite) horizons at the N. Wake site.
HORIZON
SOIL PARAMETER, UNITS B t BC C
Depth, cm 5-70 70-95 95t
Clay, Silt, % Sand, % Textural class N
49.4(13.0) 38.1 (11.3) 29.7 (7.6) 15.4 (1.8) 16.7 (4.9) 26.4 (4.1) 35.2 (14.8) 45.2 (15.7) 43.9 (8.0) cl ay sandy clay clay loam 6 6 12
Bulk Density, g/cm3 1.38 (0.13) 1.38 (0.22) 1.14 (0.17) N 7 7 13
Particle Density, g/cm3 2.73 (0.02) 2.72 (0.007) 2.80 (0.009) N 3 3 6
CEC, cmolc/kg N
Specific Surface Area, m21g
development of saprol ite. As explained by Pavich et a1 . (l989), saprol ite is developed as a result of leaching of various chemicals from the parent rock without a change in volume. This results in drastic reduction in bulk density of materials. The higher bulk density of the Bt and BC horizons is the result of the collapse of saprolite due to further leaching and formation of clay particles due to weathering processes. The particle density, as determined by the pycnometer method using water as displacing liquid, for all horizons ranged from 2.63 g/cm3 for saprolite at the Knightdale site to 2.8 g/cm3 in saprolite at the N. Wake site. The particle density values for the Knightdale site are similar to the bulk density of quartz (2.65 g/cm3) which corresponds well with higher sand content throughout the profile. The CEC for all soil horizons was less than 5.52 cmolc/kg. The surface area and CEC of the

saprol i t e a t N. Wake were higher than t h e corresponding va lues f o r t h e B t and BC horizons. The Knightdale s o i l and s a p r o l i t e had t h e lowest CEC and s u r f a c e a rea of a l l t h r e e s i t e s . The highest CEC va lues f o r t h e t h r e e hor izons were found i n samples c o l l e c t e d from t h e Chatham County s i t e . Higher CEC va lues correspond with t h e higher c l ay content a t t h i s s i te . Lower CEC o f t h e B t i n d i c a t e s t h e kaol ini t i c na ture of t h e c l a y minerals , but h igher e f f e c t i v e va lues ( L e . , CEC per c l a y content ) may be due t o t h e presence o f some a c t i v e (2 : l ) c l a y s a t deeper depths. In genera l , t h e CEC of k a o l i n i t e c l a y is pH dependent and i s re1 a t i v e l y 1 ow (approximately 8 cmol,/kg) (Brady, 1990). Acidic s o i l condi t ions can a l s o con t r ibu te t o low CEC values (Bohn e t a l . , 1985). The pH values f o r 1 :2 s o i l water e x t r a c t f o r s o i l s and saprol i t e s a t a l l t h r e e s i t e s were l e s s than 5.
Table 72. Arithmetic average, standard dev ia t ion ( i n parentheses) , and number of observat ions (N) f o r se l ec ted s o i l physical and ?
chemical p rope r t i e s f o r t h e B t , BC, and C ( s a p r o l i t e ) horizons a t t h e Knightdale s i te .
HORIZON
SOIL PARAMETER. UNITS B t BC C v
Depth, cm 5-80 80-115 115t
Clay, % S i l t , % Sand, % Textural c l a s s
27.9 (7.2) 17.8 (4.4) 7.1 (3.4) 12.0 (2.0) 17.2 (1.9) 15.6 (1.9) 60.1 (8.1) 65.0 (2 .9) 77.3 (4.0) sandy c l ay sandy loam loamy sand
1 oam 5 5 10
Bulk Density, g/cm3 1.59 (0.074) 1.57 (0.028) 1.53 (0.041) N 5 5 10
P a r t i c l e Density, g/cm3 2.64 (0.007) 2.64 (0.005) 2.63 (0.009) N 3 3 6
CEC, cmol,/kg N
S p e c i f i c Surface Area, m2/g
N

Tab1 e 73. A r i t h m e t i c average, s tandard d e v i a t i o n ( i n parentheses), and number. o f obse rva t i ons (N) f o r s e l e c t e d s o i l p h y s i c a l and chemica l p r o p e r t i e s f o r t h e B t , BC, and C ( s a p r o l i t e ) h o r i z o n s a t t h e Chatham County s i t e .
HORIZON
SOIL PARAMETER, UNITS B t BC C
Depth, cm
Clay, % S i l t , % Sand, % T e x t u r a l c l a s s N
Bu l k dens i t y , g/cm3 N
P a r t i c l e Dens i ty , g/cm3 N
S p e c i f i c Sur face Area, mZ/g
N
S o i l and S a ~ r o l i t e H y d r a u l i c C h a r a c t e r i s t i c s : Table 74 p resen ts t h e geomet r i c mean, range, and number o f observa t ions f o r t h e l a b o r a t o r y and i n s i t u determined s a t u r a t e d h y d r a u l i c c o n d u c t i v i t y ( K t ) f o r t h e t h r e e s i t e s . The i n d i v i d u a l K,,, va lues f o r t h e N. Wake and Kn igh tda le s i t s s a r e shown i n F igs . 29 and 30. As exp la i ned e a r l i e r , due t o t h e s o i l and s i t e c o n d i t i o n s no co re samples were ob ta i ned f o r hydrau l i c c o n d u c t i v i t y and s o i l wa te r r e t e n t i o n analyses f rom t h e Chatham County s i t e . For b o t h N. Wake and K n i g h t d a l e s i t e s , K,,, o f t h e cores was r e l a t i v e l y h i g h i n t h e B t hor i zon , reached i t s l o w e s t va lue i n t h e BC, and inc reased w i t h depth i n s a p r o l i t e . A t t h e N. Wake s i t e , K,,, was g e n e r a l l y below 5 cm/d except f o r one sample f rom t h e B t and one sample f rom s a p r o l i t e (see F i g . 29). A t t h e Kn igh tda le s i t e , K,,, va lues as

high as 238 cm/d were measured in cores collected from saprol i te. Higher K,,, at deeper depths at this site is most likely due to the loamy sand texture (average sand content >77%) of the saprolite. A high value for K,,, in the saprolite at the N. Wake site could be due the presence of a root channel or some other type of macropores in saprolite. Schoeneberger and Amoozegar (1990) have indicated that tubular pores are present in a saprolite similar to that found at this site. As explained by Bouma (1982), high conductivity values may be obtained from a core if a tubular pore (or any other type of macropore) extends from the top to the bottom of the core. Both measurements of i n situ K,,, at N. Wake site were less than 1 cm/d.
Table 74. Geometric average, range, and number of observations (N) of K,,, for the Bt, BC, and C (saprol ite) horizons from three sites measured in the laboratory (Lab) and in situ.
N. Wake Kniqhtdal ea Chatham CO.' HORIZON Lab In situ Lab In situ Lab In situ
Bt Mean Range N
BC Mean Range N
C Mean. Range N
@ Lab and in situ measurements to 2.5 and 1.8 m, respectively. # ND - Not Determined -- No undisturbed cores for measuring K,,, and water
retention were collected from this site.

Ksat, cmfd
0.01 0.1 1 0
1 0 100 I 1 1 , ,I*, I I 1 1 I,,, I I I,,,, I I I ,,
B
Figure 29. Laboratory determined saturated hydraul ic conductivity (K,,,) of the soil and saprolite at the N. Wake site.

Ksat, cmld
0.01 0.1 1 1 0 100 1,000
Figure 30. Laboratory determined saturated hydraul ic conductivity (K,,,) o f the soil and saprolite at the Knightdale site.

The average soil water retention at various soil water pressure heads for the N. Wake and Knightdale sites are given in Table 75 and Fig. 31. At the N. Wake site, the highest soil water content at saturation (i.e., zero soil water pressure head) was obtained in saprolite. This is in agreement with lower bulk density of the saprolite than the bulk densities of the Bt and BC horizons. At the Knightdale site, conversely, soil water content at saturation was fairly similar for all three horizons, corresponding with the similar bulk density values reported in Table 72. More water was released between 0 and -1,000 cm soil water pressure head from saprolite than the other
Table 75. Average volumetric water content, standard deviation (in parentheses), and number of observations (N) at various soil water pressure heads for the major horizons at the N. Wake and Knightdale sites.
S O I L WATER PRESSURE HEAD, cm
HORIZON N 0 -25 -50 -100 -150 -200 -300 -400 -1,000
Knightdale site


two horizons a t both s i t e s . The higher clay content o f the B t i s the major contributing factor f o r high water retention when so i l water pressure head decreases. The release of approximately 60% of the water held by saprol i t e between zero and -1,000 cm so i l water pressure heads indicates tha t the majority of the pores i n saprol i t e are larger than 0.003 mrn i n diameter. This perhaps could explain the high K,,, values obtained i n the laboratory f o r saprol i t e a t the Knightdale s i t e .
Part ic le s ize dis tr ibut ion may influence the K,,, and water retention character is t ics of so i l and saprol i te . Higher K,., values are often associated with sandy textured materials. However, clayey s o i l s w i t h well structured B t horizons have shown t o have re1 at ively high saturated hydraul i c conductivity val ues (Schoeneberger and Amoozegar, 1990; Simpson, 1986). The arithmetic average values of K,,, for the three s i t e s are plotted on a textural t r iangle chart (Fig. 32). Based on the sca t t e r of the average values, the K,,, values are not direct ly related t o the so i l texture perhaps due t o the pedogenic soi l s t ructure and variation in bulk density.
100
A" R N. Wake County
Knightdale
Chatham County
% SAND
Figure 32. Arithmetic average saturated hydraul i c conductivity (K,,,) in cm/d for B t , BC, and C horizons plotted by textural c lass . Laboratory determined values are used for the N. Wake and Knightdale s i t e s , and in s i t u values are used for the Chatham County s i t e .

Evaluation of Soil Water Resime: Our results indicate that soil water regimes under all three septic systems in the Piedmont region were influenced by seasonal precipitation and evapotranspiration. ~onthly precipitation data from the recording gauge at the N. Make site, at N. Carolina State University (NCSU), and the 30 year normal rainfall for Raleigh from the National Weather Service (NWS) are shown in Fig. 33. The 1990 and 1991 annual precipitation amounts were 65 and 145 mrn below the normal, respectively. Large deviations below the monthly normal rainfall was observed during the late summer o f 1990 and 1991, and the spring of 1991.
N. WAKE I
NWS
6 9 1 2 3 6 9 1 2 3 1990 1991 1992
MONTH
Figure 33. Monthly precipitation measured at the N. Wake site, from North Carol ina State University (NCSU) , and 30-year average for Raleigh, NC, from the National Weather Service (NWS).

Volumetric water content at four depths for four locations inside and outside the drainfield area for each of the three sites, as determined by neutron thermalization, are presented in Figs. 34 to 36. The data are for a 22-month period at the N. Wake site and for a 12-month period at the other two sites. Each graph presents data from one neutron access tube location (labelled NP-#) shown in Figs. 5, 7, and 9 for the N. Wake, Knightdale, and Chatham County sites, respectively. For each site data for three locations inside and one location outside (Control) are presented. The results for soil water content inside the drainfield areas indicate less spatial variation within the drainfield area at the N. Wake and the Knightdale sites than the Chatham County site. This is due to a more uniform wastewater distribution by the LPP system at the N. Wake site. At the Knightdale site, wastewater is pumped to the trenches of the system, but the distribution within the trenches is by gravity.
The uniformity o f water content at each depth at the Knightdale site is perhaps due to low water use and higher conductivity and more uniformity of soil and saprolite properties. A t the Chatham County site, wastewater is uniformly applied to the trenches, but the site seems to be more variable as indicated by the standard deviations of various soil and saprolite properties reported in Table 73.
Water content at 50 cm depth was most responsive to precipitation and had the highest fluctuations at each site. Changes greater than 10% were observed in volumetric soil water content at the 50 cm depth on a weekly basis with even greater changes seasonally. At the N. Wake site seasonal variations in soil water content at all four depths outside the drainfield area were more pronounced than the other two sites. Higher water content during the winter and lower water content during the summer corresponds well with the potential evapotranspiration. The site at N. Wake was covered with trees with deep roots whereas at the Knightdale and Chatham County sites the ground covers were lawn grass and fescue grass, respectively. At the N. Wake site, water contents at 50 and 100 cm depths outside the drainfield area were less than the other t w o depths. This trend corresponds well with higher soil water retention for saprol ite at this site. For the other two sites, however, lowest water content was measured at 200 cm depth. At the Chatham County site, the 200 cm depth outside the drainfield had substantially lower water content than the other depths. This could be due to the presence o f a more restrictive 1 ayer between 150 and 200 cm depths. Because of the presence o f perched water table, neutron access tubes were not extended to 200 cm depth inside the drainfield, therefore, no measurements of soil water content are presented beyond 150 cm depth.
Inside the drainfield areas soil water content fluctuations were more pronounced at the 50 cm depth at all three sites. Again, this is directly re1 ated to seasonal precipitation and evapotranspiration. At the N. Wake site, soil water content at 50 crn depth inside the drainfield was generally higher than the water content at the same depth outside the drainfield area. The low pressure pipe trenches at this site are about 50 cm deep, which

NP-7 Control
MONTHS
Figure 34. Soil water contents at three locations inside ( N P - 1 , NP-2 and NP-3) and one location outside (NP-7) the drainfield for four depths over a 22-month period at t h e N . Wake s i t e .
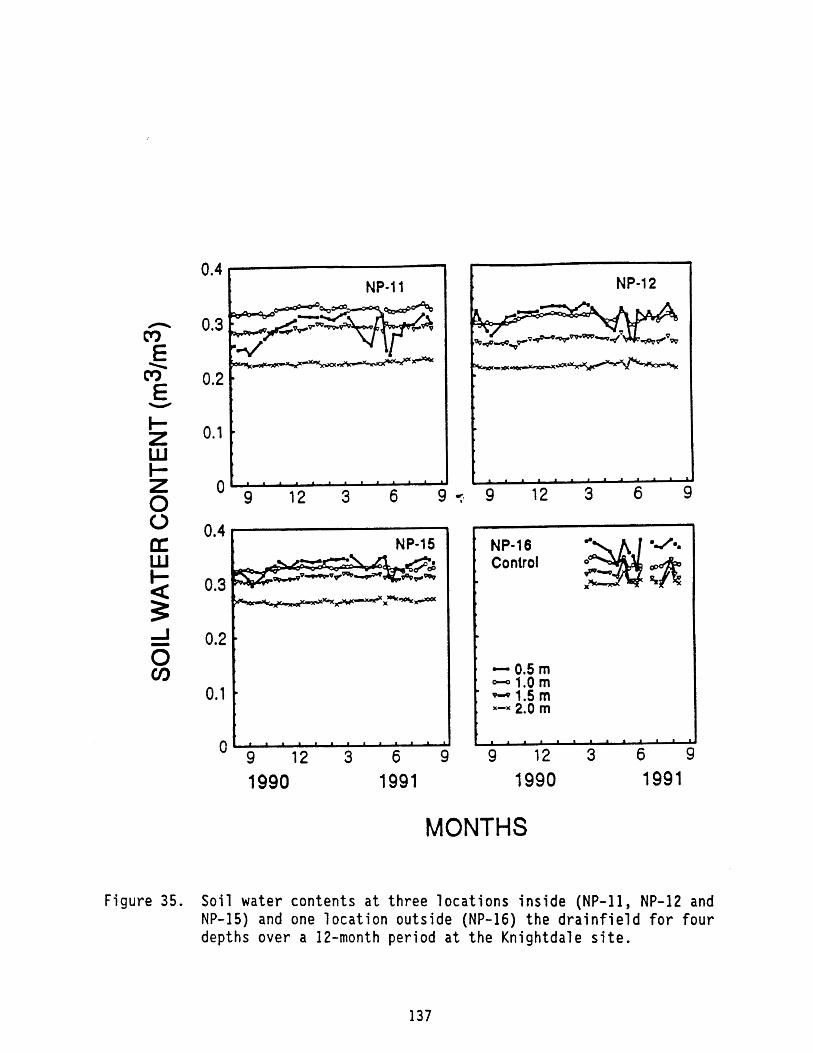
1 NP-I 1
n I.............
NP-16 Control
MONTHS
Figure 35. Soil water contents a t three locations inside (NP-11, NP-12 and NP-15) and one location outside (NP-16) the drainfield for four depths over a 12-month period a t the Knightdale s i t e .

NP-27 Control
MONTHS
Figure 36 . Soil water contents a t three locations inside ( N P - 2 2 , NP-25 and NP-26) and one location outside (NP-27) the drainfield for four depths over a 12-month period a t the Chatham County s i t e .

explains the higher soil water content at this depth. At deeper depths, seasonal variations in soil water content inside the drainfield were less than the variations outside the drainfield area. This i s directly related to the wastewater application to the drainfield area. The drain1 ine next to the NP-4 location received little or no wastewater for an 8- to 10-month period starting in spring 1991. Lower water content was measured during this period. After detecting the problem and repairing. the system, water content throughout the profile was gradually increased and showed high values during early months of 1992 when evapotranspiration was low.
To analyze water movement from the system, total soil hydraulic head was determined for every location and depth within and outside the drainfield area of the N. Wake site for a summer day, representing the trend for summer months, and a winter day, representing the trend for winter months (data not shown). For the summer time, lower hydraulic potential heads at the down slope side of the drainfield than the other locations clearly indicate no build up of excess water at the lower part of the drainfield. Low hydraulic heads at the center of the drainfield (location #3 on Fig. 5) indicate no observable mounding of wastewater in the center of the drainfield area. From the total hydraulic head data it appears that wastewater is moving downward from the 100 cm to lower depths. The uniformity of the hydraulic head at 150 cm throughout the drainfield shows that wastewater is uniformly distributed and moves vertically through the profile. For the winter day, the total hydraulic head data show a slight possibility for lateral movement of water from the upper parts of the drainfield (locations #2 and #5 on Fig. 5) to the lower part of the drainfield. The greater wetness of the upper part of the profile during winter months is primarily due to lower evapotranspiration. At this site, the evapotranspiration inside the drainfield seems to be greater than outside the drainfield area. We have made this conclusion based on a more vigorous plant growth and population inside the drainfield area as compared to the areas outside the drainfield. Some portion of the applied wastewater, even during winter months, is supplying the transpiration needs of the plants and would not move beyond the root zone. Surbrugg (1992) presents a more complete assessment of the movement of wastewater from the site.
At the Knightdale site, soil water contents at depths below 50 cm were nearly uniform over the 12-month period (Fig. 35). The soil and saprolite become increasingly drier with depth with minimum amount of soil water recharge during winter months. This could be due to the household using less than expected water (i.e., wastewater production is less than the design loading rate for the septic system). As was mentioned earlier, the septic system at this site served a 3-bedroom house with the design loading rate of 360 gallons per day. In general, individual households generate less wastewater than the designed loading rate for their septic systems (see Martin, 1987). Consi-tently drier conditions at the 200 cm depth show that ground water mounding will not occur under this system under normal use, and that the unsaturated conditions should enhance treatment of septic tank effluent.

A t t h e Chatham County s i t e , t h e water content between 50 and 100 cm depth i n t e r v a l remained r e 1 a t i v e l y h i g h throughout t h e s tudy p e r i o d (see F ig . 36). V isua l observat ions d u r i n g weekly v i s i t s t o t h e s i t e and t h e sampling a c t i v i t i e s revea led sa tu ra ted cond i t i ons be1 ow 100 cm f o r most o f t h e d r a i n f i e l d area. I n con t ras t , t h e c o n t r o l 1 oca t i on ou ts ide t h e d r a i n f i e l d area (NP-27, F ig. 9) had h i g h neutron probe readings b u t was never observed t o be saturated. The sa tu ra ted cond i t i ons a t var ious l o c a t i o n s w i t h i n t h e d r a i n f i e l d area o f t h i s s e p t i c system cannot be expla ined by t h e u n i f o r m i t y , o r l a c k o f u n i f o r m i t y , o f wastewater a p p l i c a t i o n t o t h e t renches. We suspect t h a t l a t e r a l f l o w o f water f rom t h e trenches through l a r g e channels ( p r e f e r e n t i a1 f l ow) a re respons ib le f o r sa tura ted zones (perched water tab1 es) observed a t var ious l o c a t i o n s w i t h i n t h e d r a i n f i e l d area. The c layey BC ho r i zon ( a t average depth i n t e r v a l o f 90 t o 130 cm) had a ve ry 1 ow K,,, (0.1 cm/d) as determined by i n s i t u measurement. I n add i t i on , severa l l a r g e boulders had been removed f rom t h e s i t e du r ing cons t ruc t i on o f t h e d r a i n f i e l d ( p r i o r t o t h i s s tudy) . Excavat ion a c t i v i t i e s f o r t h e t renches and incomplete b a c k f i l l i n g o f t h e c a v i t i e s r e s u l t i n g from moving boulders and o t h e r ob jec ts , such as t r e e roo ts , perhaps have created p r e f e r e n t i a l pathway f o r water moving down t h e s lop t o t h e lower p a r t o f t h e d r a i n f i e l d area. Poor s i t e maintenance, and h i g h and steady wastewater f l o w volume, may a1 so c o n t r i b u t e t o sa tura ted s o i l c o n d i t i o n a t t h i s s i t e .
A comparison o f s o i l water content de terminat ion by TDR and neut ron probe a t t h e N. Wake s i t e f o r two depths a t s i x l o c a t i o n s i s presented i n F ig . 37. S i m i l a r t rends f o r t h e s o i l water content were observed w i t h t h e two techniques. I n general, t h e 50 cm depth (45 t o 60 cm depth i n t e r v a l f o r t h e TDR) had h igher s o i l water content than t h e 25 cm depth. Temporal v a r i a t i o n s o f t h e s o i l water content measured by t h e two techniques were s i m i l a r even though t h e absolute values d i d n o t match exac t ly . Higher d i f f e r e n c e s were observed f o r t h e 25 cm depth than the 50 cm depth. Th is i s perhaps due t o d i f f e r e n c e s i n t h e volume o f t h e s o i l where water content i s measured and t h e procedure by which t h e two s o i l water contents are ca lcu la ted . Our r e s u l t s i n d i c a t e t h a t bo th techniques cou ld be used f o r eva lua t i ng temporal v a r i a t i o n s o f s o i l water content . The neutron probe technique o f f e r s more f l e x i b i l i t y i n terms o f water content measurement a t var ious depths, bu t r e q u i r e s a s p e c i f i c c a l i b r a t i o n equat ion ( o r curve) . The TDR, on the o the r hand, g i v e s t h e average water content over t h e l e n g t h o f t h e p a i r o f rods i n s t a l l e d i n s o i l d i r e c t l y , bu t i t s depth o f measurement i s r e s t r i c t e d t o t 7 0 cm f o r t h e t ype of t h e device used i n our study.
S o i l water p o t e n t i a l a t var ious depths i n s i d e and ou ts ide t h e d r a i n f i e l d areas o f t h e N. Wake s i t e f l u c t u a t e d w i t h seasonal p r e c i p i t a t i o n and evapot ransp i ra t ion . F igures 38 and 39 present t h e temporal v a r i a t i o n s o f s o i l water p o t e n t i a l a t t h r e e depths f o r one l o c a t i o n ou ts ide and two l o c a t i o n s i n s i d e t h e d r a i n f i e l d area o f t h i s system, respec t i ve l y . [NOTE: -1 j o u l e s l k g s o i l water p o t e n t i a l i s equ iva len t t o -10.2 cm s o i l water pressure head.] A t l o c a t i o n TB-7 ou ts ide t h e d r a i n f i e l d area (see Fig. 5), s o i l water p o t e n t i a l was lowest du r ing t h e summer months o f 1991, and i n d i c a t e d near sa tu ra ted cond i t i ons f o r t h e per iods w i t h minimum p o t e n t i a l evapot ransp i ra t ion . Weekly

I I I I I I I I I I I I m-. WT (2s om)
o-e-., ,.rCm.-~< 5 g e * * w m m ~ 0-Om (lHo cm) 7 (control) k e g d - m - m - I* -. ~O*OTDRy&'or)
MONTHS
F i g u r e 37. Comparison o f vo lumetr ic s o i l water content measurements us ing TDR and neutron thermal i z a t i o n techniques f o r two depths over a 6-month p e r i o d a t N. Wake s i t e .

Figure 38. Soil water potential outside the drainfield area a t tensiometer bank #7 (TB-7) for three depths over a 22-month period at the N. Wake s i t e . The lower graph represents weekly rainfall measured on s i t e .

TB- 1
Figure 39. Soil water potential inside the drainfield area a t tensiometer banks # 1 (TB-1) and #4 (TB-4) for three depths over a 22-month period at the N . Wake s i t e .

f l u c t u a t i o n s o f s o i l wa t e r p o t e n t i a l was g r e a t e s t a t t h e 50 cm d e p t h , and t h e changes were a s s o c i a t e d wi th t h e r a i n f a l l even t s . A t 100 and 150 cm d e p t h s , t h e changes were n o t a s s i g n i f i c a n t a s f o r t h e 50 cm depth . A t t h e TB-1 l o c a t i o n , s o i l wa t e r p o t e n t i a l s a t 100 and 150 cm dep ths remained between z e r o and -20 J /kg (-204 cm s o i l wate r p r e s s u r e head) excep t f o r two s h o r t p e r i o d s w i thou t r a i n f a l l . The 50 cm depth , however, e x h i b i t e d s u b s t a n t i a1 v a r i a t i o n s i n r e sponse t o weekly drought pe r iods . ' A t t h e TB-4 l o c a t i o n t h e s o i l w a t e r p o t e n t i a l s o f a l l dep th s responded t o t h e weekly drought p e r i o d s fn summer o f 1990. Although t h e r e were s i g n i f i c a n t amounts o f r a i n f a l l from l a t e s p r i n g of 1990 t o January 1992, s o i l wate r p o t e n t i a l a t a l l t h r e e d e p t h s dec rea sed s i g n i f i c a n t l y du r ing t h i s per iod . As we d i s cus sed e a r l i e r , t h i s p e r i o d corresponded wi th t h e mal func t ion t h a t r e s u l t e d i n t h e t r e n c h n e a r t h i s l o c a t i o n no t r e c e i v i n g wastewater f o r a long pe r iod . These d a t a show how much t h e s o i l wate r p o t e n t i a l i n s i d e t h e d r a i n f i e l d i s r e l a t e d t o p r e c i p i t a t i o n . Our d a t a f o r o t h e r l o c a t i o n s i n s i d e t h e d r a i n f i e l d show s i m i l a r r e s u l t s t o 1 o c a t i o n TB-1.
The s o i l wa t e r p o t e n t i a l v a r i a t i o n s wi th dep th and t ime f o r two l o c a t i o n s i n s i d e t h e d r a i n f i e l d of t h e Knightdale s i t e a r e p r e s e n t e d i n F ig . 40. A t t h e TB-15 l o c a t i o n ( s e e Fig. 7 ) , s o i l wate r p o t e n t i a l a t 100 and 150 cm dep ths remained nea r z e r o wi th 1 i t t l e f l u c t u a t i o n even a t 50 cm dep th . A t t h e TB-11 l o c a t i o n , s o i l wate r p o t e n t i a l s a t 50 and 100 cm d e p t h s were h igh from w i n t e r o f 1990 t o t h e beginning o f summer o f 1991. A t 50 cm d e p t h , s o i l wa t e r p o t e n t i a l was l e s s t han -80 J /kg (-816 cm p r e s s u r e head) f o l l o w i n g p e r i o d s wi th no r a i n f a l l and/or high e v a p o t r a n s p i r a t i o n . A t t h e 150 cm dep th , l i t t l e f l u c t u a t i o n was observed throughout t h e 12-month p e r i o d . These d a t a correspond well wi th t h e p a t t e r n s observed f o r s o i l wa t e r c o n t e n t de te rmined by t h e neutron thermal i z a t i o n . The h ighe r s o i l wate r p o t e n t i a l and w a t e r c o n t e n t a t p o s i t i o n 15 compared t o p o s i t i o n 11 ( s e e Fig. 7 ) a r e due t o t h e uneven d i s t r i b u t i o n of wastewater w i th in t h e t r e n c h e s . Th i s l o c a t i o n was n e a r t h e t opog raph i ca l l y lowest p o i n t i n t h e d r a i n f i e l d and may p o t e n t i a l l y r e c e i v e wa te r t h a t moves l a t e r a l l y . Although we d i d no t moni tor w a L e w a t e r l e v e l s i n t h e t r e n c h e s of t h e systems, we f e e l t h a t wastewater may a l s o be moving t o t h e end o f t h e t r e n c h e s a s a r e s u l t o f c logging mat fo rmat ion o r a h i g h e r t h a n expec ted s lope o f t h e t r e n c h bottom.
The s o i l wate r p o t e n t i a l a t one l o c a t i o n i n s i d e and one l o c a t i o n o u t s i d e t h e d r a i n f i e l d a r e a a t t h e Chatham County s i t e a r e shown i n F ig . 41 a long w i th t h e monthly r a i n f a l l d a t a f o r t h e same per iod . I n s i d e t h e d r a i n f i e l d , a t l o c a t i o n 122 on Fig. 9 , t h e s o i l water p o t e n t i a l a t 50 and 100 cm d e p t h s remained near z e r o wi th l i t t l e f l u c t u a t i o n . A t 150 cm dep th , s o i l w a t e r p o t e n t i a l d i d n o t f l u c t u a t e apprec iab ly but remained below .era a t a l l times. The d a t a f o r o t h e r p a r t s o f t h e d r a i n f i e l d showed s i m i l a r p d r t e r n s . A t l o c a t i o n 2 2 , t h e s o i l was g e n e r a l l y s a t u r a t e d a t a l l t imes . We de te rmined t h a t t h e exces s ive wetness a t t h i s l o c a t i o n was due t o a perched zone above t h e lower B t and CB hor izons . The BC hor izon a t t h i s s i t e had a very low s a t u r a t e d hyd rau l i c c o n d u c t i v i t y and could p o t e n t i a l l y r e s t r i c t downward movement o f t h e app l i ed wastewater . Outs ide t h e d r a i n f i e l d a r e a , t h e s o i l wa t e r p o t e n t i a l f l u c t u a t e d s i g n i f i c a n t l y a t a l l t h r e e dep ths t h roughou t t h e

V) -r tc,? w m o c, L u a
c, O W m

MONTHS
Figure 41. S o i l water po ten t ia l outside the d r a i n f i e l d area a t tensiometer bank #21 (TB-21) and ins ide the d r a i n f i e l d area a t tensiometer bank #22 (TB-22) f o r th ree depths over a 12-month per iod a t the Chatham County s i t e . The lower graph represents monthly r a i n f a l l a t North Carol i n a S t a t e Un ive rs i ty .

study period. In general, there were inconsistent data for the first part of the study with tensiometers malfunctioning as a result of low soil water potential. For the last few months of the monitoring period, during spring and early summer of 1992, however, soil water potential was near zero at all depths. Soil water potential at 100 and 150 cm depths started to decline after April when evapotranspiration started to increase.
Distribution o f Solutes in Soil and Sa~rolite Under the Drainfields: To characterize the wastewater at the three sites, three different samples were collected from the pump tank at the N. Wake site and one sample was collected from each of the Knightdale and Chatham County sites during the study period. Concentrations of selected inorganic chemicals in the wastewater from the three sites are shown in Table 76. As shown in the table, the concentration of some of the chemicals varied substantially among the three systems. The concentrations of NH,-N and NO,-N in wastewater at all three sites are within the typical ranges of the concentrations of these two chemicals (10-40 and 0-0.1 mg/L, respectively) in residenti a1 wastewater (Canter and Knox, 1985). The concentrations of Ca and Mg were the highest at the N. Wake site and lowest at the Knightdale site. The sodium concentration and EC, however, were much greater at the Chatham County site than the other two sites in Wake County. This could be due to the types of food prepared for the residents of the rest-home at this site. The C1 concentration was highest at the N. wake site. The residents at the Knightdale site use well water from the site without any treatment. The households in the subdivision at the N. Wake site, however, are served by a public drinking water supply which is chlorinated. Wastewater from all sites had a pH greater than 7.
The average pH and EC of the soil and saprolite samples collected from inside and outside the drainfields of the N. Wake, Knightdale, and Chatham County sites are presented in Tables 77 to 79, respectively. Only the data for the samples collected from the main transects are presented for the drainfield samples. As shown, the pH of the soil and saprol ite samples collected from each o f the four depths were t h e same for inside (Drainfield Soils and Close Proximity) and outside (Background Soils) the drainfield areas for the two sites in Wake County (Tables 77 and 78). The differences in the pH between the N. Wake site and Knightdale site is due to the inherent variability among the two soil series. At the Chatham County site (Table 79) , the pH values inside the drainfield at all four depths were higher than their corresponding values outside the drainfield. The difference is more pronounced for 150 and 200 cm samples. At the N. Wake site, the average EC of the samples collected from 50 cm depth inside the drainfield was substantially less than the EC for the samples collected outside the drainfield. The EC values for the other depths, however, were fairly similar. A t the close proximity to the drain1 ines (data shown by Surbrugg, 1992), the EC values at all four depths were similar to their corresponding values outside the drainfield area. At the Knightdale site, the EC for background samples at each of the four depths was numerically less than the corresponding value for inside the drainfield. The difference, however, does not seem to be

signif icant . The EC values for the close proximity were higher than both the b
drainfield and background samples. The differences for the close proximity samples could be significant and i t may ref lec t the effect of applied wastewater on the soi l chemical composition. A t the Chatham County s i t e , the
1.
EC of the samples collected from each of the four depths outside the drainfield area was s ignif icant ly less than the EC for the same depth inside the drainfield. The average EC of the samples collected from 50 cm a t the
)i
close proximity of the drainlines was also higher than the drainfield samples. Higher EC a t t h i s s i t e are assumed t o be related t o overall higher s a l t content (and consequently higher EC) of wastewater.
2
Table 76. Chemical characteristics of the wastewater a t 3 s i t e s .
V
Chemical N. Wake Knightdal e Chatham County
NH,-N
NO,-N
Ca
M g
Na
K
C1
PO,- P"
pH (pH units)
EC (x S/m)
@ ND -- Not Determined, typical range for residential wastewater i s 6 t o 24 mg/L ( E P A , 1980).

Table 77. Ari thmetic average, s tandard d e v i a t i o n ( i n pa ren theses ) , and number o f samples (N) f o r s o i l pH and EC from t h r e e sample types and f o u r s o i l depths (0.5, 1.0, 1 .5, and 2.0 m) from t h e N . Wake s i t e .
SAMPLE TYPE DEPTH. m
0.5 1.0 1 , 5 2.0
Horizon B t
Background S o i l s 10 4.75 (0.16)
D r a i n f i e l d s o i l s 40 4.91 (0.20)
Close Proximity 8 4.84 (0.21)
Background S o i l s 10 46.7 (13.5)
D r a i n f i e l d s o i l s 40 29.7 (8.9)
Close Proximity 8 50.1 (7.0)
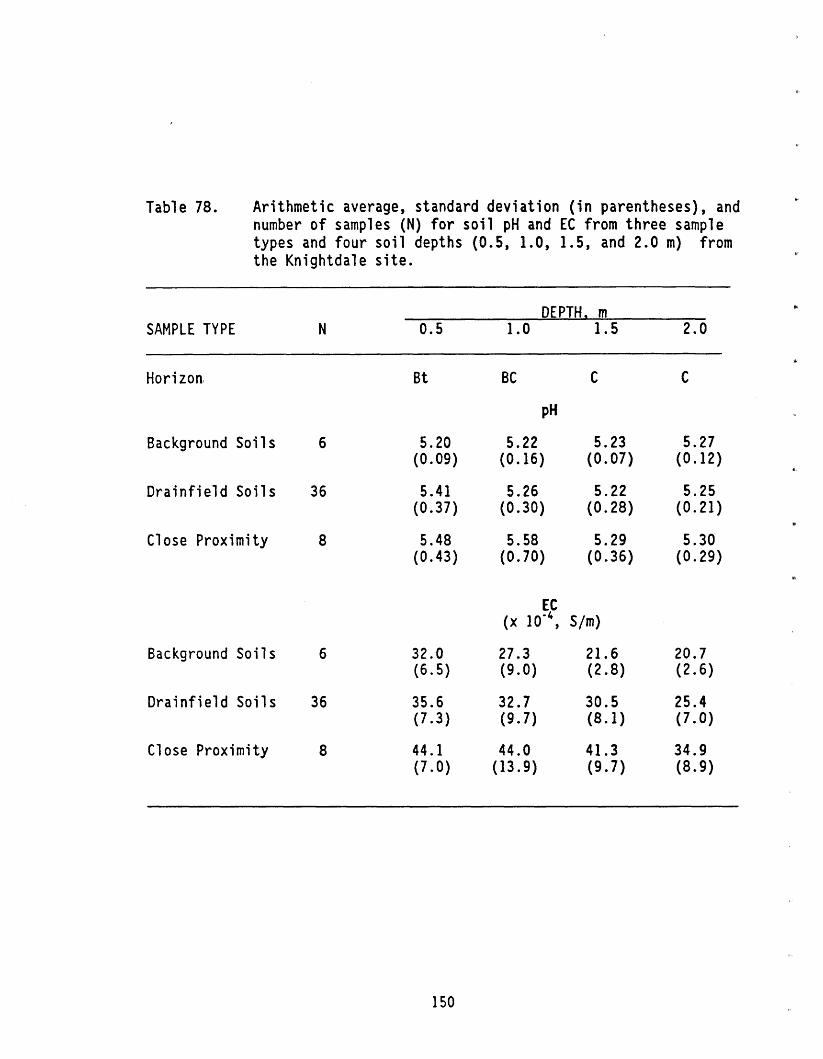
Table 78. Arithmetic average, standard deviation ( i n parentheses), and X"
number of samples (N) for soil pH and EC from three sample types and four soil depths (0.5, 1.0, 1.5, and 2.0 m) from the Knightdale site.
r
DEPTH, rn $p.
SAMPLE TYPE N 0.5 1.0 1.5 2.0
Background Soi 1 s 6 5.20 (0.09)
Drainfield Soils 36 5.41 (0.37)
Close Proximity 8 5.48 (0.43)
Background Soil s 6 32.0 (6.5)
Drainfield Soils 36 35.6 (7.3)
Cl ose Proximity 8 44.1 (7.0)

Table 79. Arithmetic average, standard deviation (in parentheses), and number o f samples (N) for soil pH and EC from three sample types and four soil depths (0.5, 1.0, 1.5, and 2.0 m) from the Chatham County site.
SAMPLE TYPE DEPTH, rn
0.5 1.0 1.5 2.0
Hori zon Bt BC C C
Background Soi 1 s
Drainfield Soils 36
Close Proximity
Background Soils
Drainfield Soils 36
Close Proximity 8

Distribution of Chemicals at N. Wake Site: Significant differences were observed between some of the chemical concentrations of soil and saprolite samples from within the drainfield area as compared to the background samples. A summary matrix showing the statistical analyses for selected chemicals is shown in Table 80. The differences (at 5% level) between the concentrations of chemicals inside and outside the drainfield are expressed by YES and NO. Those differences expressed as YES and NO within parentheses should be viewed with uncertainty since the within treatment variances were found to be non- homogeneous. However, we should point out that the differences in some cases are substantial and should be viewed as real. The two numerical values in each box are the mean values for the N samples, where N is the number of observations (i .e., samples analyzed) for that treatment.
Every significant difference between the drainfield samples and background samples occurred when the chemical concentrat ion inside the drainfield was less than the background samples at the same depth. Actually, the concentration of each of NO3-N, Ca, Mgy and K (in mg/kg) in the soil and saprolite outside the drainfield area at 50 cm depth was higher than the concentration (in mg/L) of wastewater applied to the drainfield. Except for Ca, the same is true for other depths. Leaching of chemicals from soil and saprol ite by downward movement of water or lateral through flow is a common phenomenon in soil formation. Under the drainfield, it seems that the applied wastewater is increasing the removal of some of the chemicals from soil and saprolite. A 100 cm/yr rainfall (40 inlyr) over this drainfield (460 m2 or 5,000 ft2) is equivalent to an average daily rainfall of 1300 L at this site. The amount of wastewater application, however, is 3300 L (equivalent to 260 cm/yr rainfall). The amount of added wastewater, therefore, could have a significant effect in removing chemicals if downward movement of water is significant and the concentration of a chemical in the percolating water is less than the concentration of that chemical in soil solution. The data presented on the soil water regime at this site indicate that downward and lateral water movement is occurring.
The mean concentrations of seven chemicals at four depths for three different sampling groups are shown in Figs. 42 and 43. The bars represent plus and minus one standard deviation around the mean. A1 though the close proximity samples were not included in the statistical analysis, they were helpful in analyzing the distribution of chemicals in soil and saprolite under the drainfield area. The average concentrations of both NH,-N and NO3-N in all soil and saprolite samples were less than 6 mg/kg, with little difference between the background and drainfield samples. In the close proximity samples, a significantly higher NO3-N was detected at 50 cm At deeper depths, NH,-N was lower and NO3-N was slightly higher than tile drainfield and background samples. This could be due to the presence of NH,-N in the applied wastewater (38.4 mg/L, see Table 76) and nitrification that may occur in the trenches and soil near the trench 1 ines. Significant differences were observed for the four base cations shown in Fig. 43. High Ca concentrations at the 50 cm depth is most likely due to lime application to the site when it was under cultivation in the past. Lower concentrations of Ca, Mg, and K in

Tab1 e 80. Statistical summary matrix o f comparisons between mean concentrat ions (mgfkg) of background (BK) and drai n f i eld s o i 1 (SO) samples for four depths and seven chemicals at the N. Wake site.
DEPTH (rn) 0.5 1 ,O 1.5 2.0
Difference NO (YES (PC-0. 0 5 )
( YES
165.3 : 151.7 144.1 : 69.0 108.9 : 7 6 . 6 124.6 : 9 8 . 9 I No
K Difference (YES) ( YES (P<=O.OS)
53 .3 6 9 . 8 : 31.7 62.9 : 33.2 I 5 9 . 8 IES : 37.1
Difference YES (YES (YES) (P<=O.OS)
(YES)
YES vr NO: bdktu significant (P S 0.05) differences between BK and SO. (YES) vs (NO) indicates significant (P S 0.05) differences between BK and.SO are uncertain
due to non homogeneity of sample variances. n= number of observations.

Figure 4 2 . Average soi l NH,-N, NO,-N, and C1 concentrations (bars represent f one standard deviation) for background ( B K ) , close proximity ( C P ) , and drainfield (SO) samples for four depths at the N. Wake s i t e .

SAMPLE TYPE
Figure 43. Average s o i l Na, K, Ca, and Mg concentrations (bars represent f one standard deviat ion) f o r background (BK) , c l ose proximity (CP) , and d r a i n f i e l d (SO) sampl es f o r four depths a t the N. Wake s i t e .

the close proximity samples at below 50 cm depths support our theory that leaching of chemicals from soil and saprolite is enhanced by the application of wastewater to the site. For example, wastewater K concentration was 15.6 mg/L (Table 76) as compared to the K concentration in background samples of 60 to 80 mg/kg soil or saprolite. Therefore, it is very likely that when wastewater is applied to this site it removes K from soil and saprolite either by deep percol ation, 1 ateral movement, or perhaps pl ant uptake.
We also performed a contour plot analysis to determine the uniformity o f distribution of chemical s under this drainfield (data not shown). The contour plots for the seven chemicals discussed here are presented by Surbrugg (1992) and will not be described in detail. Overall, we found that chemicals were fairly uniformly distributed over the drainfield area. Is01 ated areas o f sl ightly higher concentrations were explained by the inherent variabil ity o f soil and saprol ite, presence of old root channels and cavities, and possibly past liming activities at this site. Our analysis of the soil water regime over the drainfield area for a 22-month period also indicated that soil and saprolite stayed fairly uniformly moist at each o f the four depths w e analyzed. The design, operation, and maintenance of this septic system perhaps are the primary reasons for the uniformity of soil water content and solute distribution throughout the drainfield area. The LPP system was originally designed to overcome the lack of uniform distribution o f wastewater over the entire drainfield area. This LPP system seems to function as designed. With the exception of malfunction o f one of the drainlines we had no problem with wastewater delivery at this site.
Distribution of Chemicals at Kniqhtdale Site: Comparison o f the mean values of various chemicals for the background and drainfield samples for this site are presented in a matrix form in Table 81. With the exception o f NH4-N at 150 and 200 cm depths, no significant differences were observed in the mean values between the drainfield and background samples. The significant differences for the ammonium at the deeper depths seem t o be unimportant in light of the low concentration at all depths inside and outside the drainfield. All the drainfield and background samples were in a low range between 1.5 to 8.8 mg/kg.
The means and standard deviations of the chemicals given in Table 81 for the background, drainfield and close proximity samples are shown in Figs. 44 and 45. Only at close proximity to the drainlines did we find significantly higher NH,-N at 100 cm depth. The standard deviation for these samples was more than twice as large as the mean, indicating a very high degree o f vari abi 1 i ty among the samples. Comparing the NH4-N and NO,-N concentrations in the soil samples with the wastewater at this site, it appears that the ammonium in wastewater is converted to nitrate in the soil or the trenches o f this system. The highest concentration of nitrate was found at 150 cm depth among the close proximity samples. Nitrate concentration at the 200 cm depth inside the drainfield had a maximum of 9.9 mg/kg as compared to 2.8 mg/kg for

Tab1 e 81. Statistical summary matrix o f comparisons between mean concentrations (mg/kg) of background (BK) and drainfield soil (SO) samples for four depths and seven chemicals at the Knightdale site.
---------- NH4 -N
Difference (PC-0.05)
Mean ---------- N03-N
Difference (PC-0.05)
Uean ---------- Ca
Difference (PC-0 . 05)
Haan ---------- nq
Difference (PC-0 . 05)
Hman
Ha Difference (P<=0.05)
nean
K Difference (PC-0.05)
Uean
Difference NO NO (PC-0. 05)
YES va NO: indicater, significant (PS 0.05) differences between BK and SO. ( Y B ) vs (NO) indicater significant (PS 0.05) differencea between BK and SO are uncertain
due to non homogeneity of sample variances. n= number of obscnations.
YES
4 . 5 8 : 3 . 2 9
NO
5.26 : 4.08
(YES)
5.07 : 3.42
YES
4.68 : 3.17

- BK CP SO
SAMPLE TYPE
Figure 4 4 . Average soi l NH,-N, NO,-N, and C 1 concentrations (bars represent f one standard deviation) for background ( B K ) , close proximity ( C P ) , and drainfield (SO) samples for four depths at the Knightdale s i t e .

E E E E o o o 0 0 0 0 D Z Z O In CY

background saprol i te. High saturated hydraul ic conductivity and loam to loamy sand texture of saprol ite would favor potential leaching of nitrate to deeper depths. The mean chloride concentrations at all depths was less than 20 mg/kg with no significant differences between the drainfield and background samples. The highest mean concentration was at 100 cm depth near the drainl ines (close proximity samples). The C1 concentration of wastewater at this site was lowest of all three systems and its concentrations in soil and saprol ite were lower than the concentrations found at the N. Wake County site.
Calcium and Mg concentrations at 50 cm depth were higher than other depths for each of the background, drainfield and close proximity samples (Fig. 45). Because these re1 atively high concentrations cannot be expl ained by the low concentrations of these two cations in the wastewater at this site, we be1 ieve the Ca and Mg contents of the soil and saprol ite are more 1 i kely due to 1 iming practices that may have occurred in the past before housi ng development occurred at the site. Numerically higher concentrations of Ca and Mg were found at all depths inside the drainfield compared to the background samples. Overall this could be due to the spatial distribution of these two cations in the area. Higher concentration at deeper depths could be. due to the leaching of Ca and Mg from the upper layers. Potassium and Na appear to be uniformly distributed at all depths inside and outside the drainfield area. The extractable concentrations of both these cations appears t o be primarily due to the inherent mineralogy of the soil and saprolite and not due to the applied wastewater. Concentration of K in wastewater was 12 mg/L compared to mean soil concentration values of more than 50 mg/kg. For the Na, the highest concentration (140.4 mg/kg) was measured in a sample collected from 100 cm depth near a drainl ine (close proximity), which may be attributed to the application of wastewater to the trenches. Overall, the mean soil concentration values for Na were less than 50 mg/kg and the wastewater concentration was 66.3 mg/L (see Table 76).
Distribution of Chemicals at Chatham County Site: The results of the statistical analysis of the Chatham County chemical concentrations are presented in Table 82. Note that, due to the presence of perched water tables, we could not obtain samples below 100 cm in about 50% o f the drainfield area. Therefore, we performed statistical analysis only for the samples collected from 50 and 100 cm depths. All the statistically higher concentrations were found for the samples coll ected from the drainfield area. Concentrations of Ca, Mg, and Na in background soil and saprol ite samples were much higher than the corresponding concentrations for the other two sites. The soil at this site, an Alfisol, is considered to have a higher base saturation and retains more primary minerals than the Ultisols of the other two sites (Buol et al., 1989). The increase in concentrations with depth for these cations is an indication that the parent material at this site has a relatively high concentration of base cations.

Table 82. Statistical summary matrix of comparisons between mean concentrations (mg/kg) of background (BK) and drainf ield soil (SO) samples for four depths and seven chemicals at t h e Chatham County site.
DEPTH (m) 0.5 1.0 1.5 2.0
K Difference NO (P<=0.05)
11.5 : 9 . 7 12.3 : 7 . 6 16.7 : 7 . 3
Difference ( YES (PC-0.05)
19.7 : 4 5 . 1 3 4 . 9 21.3 : 29.7 20.3 : 2 0 . 4
YES vs NO: indicam significant (PS 0.05) differences between BK and SO. w) vs (NO) iruiicatu significant (P S 0.05) differences between BK and SO arc uncertain
due to non homogeneity of sample variances. n= number of observations.

Significantly higher NH,-N concentrations were found in the top part of the soil profile inside the drainfield as compared to backgrou~d samples. The highest concentration (70.4 mgfkg) was found near the drainl ines at 50 cm depth. The NO3-N concentrations inside the drainfield were not significantly different from the concentrations outside the drainfield area. The nitrate concentrations of the 50 cm depth samples were highly variable and ranged from 30.3 to less than 0.1 mg/kg soil. The low concentration of nitrate in saprolite samples shows that nitrate is ~ o t moving downward or there is no adsorption capacity for anions. The saturated or near saturated conditions inside the drainfield area is perhaps preventing the formation of nitrate. It appears that little of the ammonium in wastewater (29.7 mg/L in wastewater, see Table 76) is being converted to nitrate in this system. Soil C1 concentration were much more variable in the drainfield and close proximity samples than the background samples (Fig. 46). Background C1 concentrations were fairly uniform with depth and ranged from 12.1 to 38.4 mg/kg. Significant differences between the C1 concentrations at various depths, relatively high variability among the samples collected from each depth, and the decreasing trend with depth are due to the application of wastewater. Similarity, C1 concentrations in saprol i te inside and outside the drainfield do not indicate downward movement of this anion.
Calcium and Na (Fig. 47) were significantly higher in the 50 and 100 cm depths in the drainfield samples. Concentrations of Ca were high (mean values >500 mg/kg) throughout the area. Higher Ca in the drainfield area is most likely due to natural variability rather than wastewater application. Magnesium concentration appears to be higher in the drainfield samples compared to the background samples. The close proximity sampl es, however, do not indicate movement of this cation through the soil. Higher Mg concentration in the drainfield samples could be due to spatial distribution of this cation in soil and saprolite. Sodium concentration was highest near the drainlines at 50 cm depth and decreased with depth. At close proximity to the drainlines, higher concentration of Na could be due to high concentration of this cation in the applied wastewater (see Table 76). The K concentrations were not significantly different at various lccations within the site. In general, wastewater K concentration is low, and the low concentration of K in the background soil and saprolite samples indicates that the parent material at this site is low in potassium. The K results do not indicate any significant downward movement even though K concentrations at 100 and 150 cm depths are lower than the other depths near the drainl ines (i .e., close proximity samples) .
Mountain Region
Soil Water Content: Soil water contents at the commercial center and the single family dwelling were monitored by neutron thermalization for over one year on a biweekly basis. We were unable to develop a single calibration

SAMPLE TYPE
Figure 46 . Average soi l NH,-N, NO,-N, and C1 concentrations (bars represent f one standard devi a t i on) for background (BK) , cl ose proximity ( C P ) , and drainfield (SO) samples for four depths a t the Chatham County s i t e .

E E E f o o o a 0 0 0 > z z o
CU
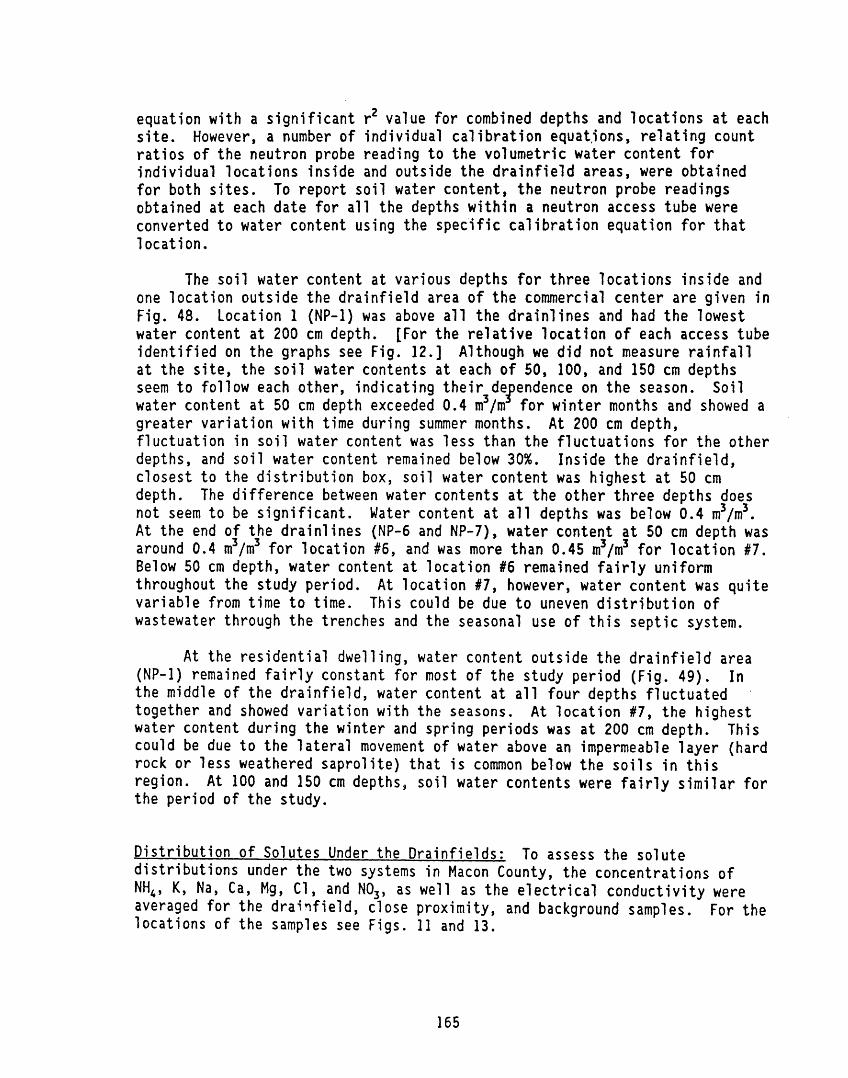
equation with a s ignif icant r2 value for combined depths and locations a t each s i t e . However, a number of individual cal i bration equations, re1 ating count ra t ios of the neutron probe reading t o the volumetric water content fo r individual locations inside and outside the drainfield areas, were obtained for both s i t e s . To report soi l water content, the neutron probe readings obtained a t each date for a l l the depths within a neutron access tube were converted t o water content using the specif ic calibration equation for t h a t location.
The soi l water content a t various depths for three locations inside and one location outside the drainfield area of the commercial center are given in Fig. 48. Location 1 (NP-1) was above a l l the drainlines and had the lowest water content a t 200 cm depth. [For the re la t ive location of each access tube identified on the graphs see Fig. 12.1 Although we did not measure ra infa l l a t the s i t e , the so i l water contents a t each o f 50, 100, and 150 cm depths seem t o follow each other, indicating the i r de endence on the season. Soil P water content a t 50 cm depth exceeded 0.4 m3/m fo r winter months and showed a greater variation with time during summer months. A t 200 cm depth, fluctuation in soi l water content was l e s s than the fluctuations fo r the other depths, and soi l water content remained below 30%. Inside the drainfield, closest to the distribution box, soil water content was highest a t 50 cm depth. The difference between water contents a t the other three depths does
3 3 n o t seem to be significant. Water content a t a l l depths was below 0.4 m /m . A t the end of the drainlines (NP-6 and NP-7), water content a t 50 cm depth was
3 3 3 3 around 0.4 m /m for location #6, and was more than 0.45 m /m for location #7. Below 50 cm depth, water content a t location #6 remained f a i r l y uniform t h r o u g h o u t the study period. A t location X 7 , however, water content was quite variable from time t o time. This could be due to uneven distr ibut ion of wastewater through the trenches and the seasonal use of t h i s sept ic system.
A t the residential dwell ing, water content outside the drainfield area (NP- I ) remained f a i r l y constant for most of the study period (Fig. 49 ) . In the middle of the drainfield, water content a t a l l four depths fluctuated .
together and showed variation with the seasons. A t location X7, t he highest water content during the winter and spring periods was a t 200 cm depth. This could be due t o the la tera l movement of water above an impermeable layer (hard rock o r less weathered saprolite) that i s common below the s o i l s in t h i s region. A t 100 and 150 crn depths, soil water contents were f a i r l y similar for the period of the study.
Distribution of Solutes Under the Drainfields: To assess the solute distributions under the two systems in Macon County, the concentrations of NH,, K, Na, Ca, Mg, C1, and NO3, as well as the e lec t r ica l conductivity were averaged for the d r a h f i e l d , close proximity, and background samples. For the locations of the samples see F i g s . 11 and 13.

MONTH
- 2.0 m 0.2 a a t l l a l l l t l t l ~ l l
g 1 2 3 6 9 1 2 1990 1991
MONTH
Figure 48. Soil water content distributions at three locations inside and one location outside the drainfield area at the commercial center i n Macon County.

MONTH
Figure 49. Soil water content distributions at two locations inside and one location outside the drainfield area at the residential dwelling in Macon County.

h
Figure 50 shows the average and standard deviation of the EC of the samples collected from four depths a t the commercial center. The EC of the background samples decreased with depth, b u t the differences among the four
&a
depths does not seem t o be significant. Overall, the standard deviations for a l l four depths were small. For the drainfield samples, the average EC values for the four depths were very similar and close t o the EC of the 50 cm depth outside the drainfield area. Closer to the drainlines, however, higher EC
e
values with much greater variation was observed for deeper samples. Table 83 presents the mean and standard deviations for NH,, N 4 and C1 concentrations for the three sample types and four depths for t h i s s i t e . For NH,, the
I#
differences between the three sample types does not seem t o be substantial . In fac t , the values for the background samples are numerically larger than the
w' corresponding values for the close proximity samples a t each depth. For NO, and C1, however, higher values were observed closer to the drainlines than the middle of the drainfield or outside the drainfield area. As fo r the other
."
cations, the concentrations of Ca, K, and Na for a l l sample types were relat ively small (data n o t shown). A t t h i s s i t e , i t seems tha t wastewater neither contributes s a l t s to the soil nor removes any from the drainfield area.
Figure 50
BK CP SO SAMPLE TYPE
Mean of the electr ical conductivity ( E C ) for background ( B K ) , drainfield (SO), and close proximity (CP) soi l and saprol i t e samples collected from four depths a t the commercial center i n Macon County. Bars represent f one standard deviation.

Table 83. Mean and standard deviation (in parentheses) for NH,, NO3, and C1 concentrations in soil and saprol ite samples collected from four depths i n s i d e and outside the drainfield area o f the cornmerci a1 center in Macon County.
CHEMICAL TYPE LOCATION 50 100 150 200
NH4 Background 4.3 31 .42 3.15 3.67 (3.57) (3.67) (2.32) (2.35)
Drainfield 3.47 2.93 3.90 9.04 (1.84) (1.86) (3.53) (24.05)
Close Proximity 3.00 2.37 2.39 3.05 (1 .78) (2.35) (3.48) (2.20)
Nos Background 0.68 0.64 0.15 0.13 (0.69) (0.78) (0.17) (0.23)
Drainfield 1.19 (1.23)
Cl ose Proximi ty 1.80 (2.10)
C1 Bac kgroond 2.22 (2.06)
Drai n f i el d 2.39 (2.69)
Close Proximity 2.70 (1.43)

Figure 51 shows the mean concentrations and standard deviations for NO3, , C1, and NH, at the residential dwelling. Note that for both NH, and NO,, the
background samples seem to have a higher concentrations than the soil and saprol ite from the drainfield area. The concentration of NH, outside the drainfield area decreased with depth from 50 to 150 cm depth, while both NO3 and C1 showed an increase with depth. Inside the drainfield, the concentration of NO, at all depths, except at 50 cm, was very small. The Cl concentrations, however, remained similar to the background samples. This could be due to deni trificat ion under the drainfield area, Concentrations of Ca, Mg, K, and Na were also low at this site. The maximum concentration measured for these cations was 0.5 mg/kg Ca measured in a sample at 50 cm depth. The EC of the soil in the upper 100 cm inside and outside the drainfield area did not vary significantly among the three types of samples. For 150 and 200 cm depths, however, the mean EC values were significantly lower than their corresponding values for outside the drainfield as well as halfway between the drainlines. T h i s could only be explained by leaching that may have occurred as a result of wastewater application to the soil and saprol i te.

I,...
SAMPLE M P E
Figure 51 . Mean soil NH,-N, NO,-N, and C 1 concentrations (bars represee f one standard deviation) for background ( B K ) , drai nfield (SO), and close proximity ( C P ) samples collected from four depths a t the residenti a1 dwell ing in Macon County.


GUIDELINES FOR USE AND EVALUATION OF SAPROLITE FOR WASTEWATER DISPOSAL
Saprolite (C horizon) must be recognized as part of the soil that reflects the complete natural weathering continuum. The saprol i te portion extends from the bottom of the soil solum (combi ned A and 0 horizons) to the underlying bedrock. The upper part of saprolite generally has properties that are similar to the overlying B horizon while the lower reaches of saprolite tends to be more 1 i ke rock. Depending on the depth to the bedrock, properties of saprol ite can change rapidly as one looks deeper in the soil-saprol ite continuum. This is especially true in the uppermost part of the saprolite.
Based upon observed changes in the morphology and particle size distribution in the vertical direction for the saprolites studied, we consistently noted the decrease in the clay content and the increase in the hydraulic conductivity of some saprol ites with depth. The upper part of a saprol i te may not have adequate perrneabi 1 i ty to handl e wastewater, but its lower sections may be able to absorb the effluent at a rate that does not result in ponding of wastewater in the trenches or excessive water content around the trenches if a septic system is installed. Therefore, field evaluation of saprol i te sui tabil ity for on-site wastewater management should not be terminated at too shallow a depth. Even if the upper 30 to 60 cm of saprolite does not have adequate permeability for direct application of wastewater, deeper observations may reveal suitable material for wastewater management purposes.
In general, saturated hydraul ic conductivity (K,,,) of saprol i te was relatively low, but exceeded that o f the immediately overlying horizon. While the saturated hydraulic conductivity measurements at our study sites indicated that many saprolites can effectively receive wastewater at an appropriate rate, we also observed K,,, values that were too low for septic systems. With one exception (Site Number l o ) , we did not observe saprolite that would absorb wastewater too rapidly. Even for this exception, we should note that the K,,, of the saprolite was not sufficiently high to make i t unsuitable for wastewater disposal . For saprol i te, conservative loading rates could be recommended to overcome the potent i a1 probl em of l ow hydraul i c conductivity at deeper depths.
Our results show that unsuitable, slowly permeable, Bt horizons may be under1 ain by saprol i te with acceptable permeabil i ty. However, wastewater has a relatively high BOD, and it is difficult to predict if adequate oxygen can diffuse through the slowly permeable soils to meet the oxygen demands of septic tank effluent applied to saprolite at deeper depths. Therefore, it is essential to evaluate the entire soil-saprolite sequence in areas with unsuitable soil even if saprolite is determined to be suitable for wastewater disposal. This is necessary for two reasons. First, we need to assess the potential for diffusion of oxygen through the solum. Second, we need to determine the potential for the accumulation of water above the Bt or BC horizon. If the soil solum is determined to be restrictive to oxygen

diffusion, then pretreatment of household wastewater may be necessary in order to manage household wastewater on-si te. A1 ternatively, ,sand-1 ined trenches may achieve the same effect at many sites. For accumulation of water above the Bt or BC horizons, one may employ a shallow drainage system to intercept 1 ateral water flow and move the perched water away from the drainfield area. If the A and E horizons above the B t have high conductivity, and no interceptor drain is used, the septic system drainlines may act as a drainage system and intercept water that will otbvwise flow above the restrictive Bt or BC horizons.
In this study, we were frequently unable to identify usable saprolite from the auger borings throughout each study area. The crushing o f the materials by the auger, and the mixing that may result during excavation with a hand auger 1 imi ts re1 iable identification' of useable saprol i te for septic systems. Therefore, saprol i te must be directly evaluated in an observation pit at each house lot considered for installation of a septic system. Direct in situ observation is necessary to distinguish unusable Cr horizons from coarse textured saprol i te (with adequate permeabil i ty) that feel s 1 i ke Cr material when excavated by an auger. The coarse-textured saprol ite is firm in place, but it easily crumbles apart and is friable when removed from the pit wall. The Cr, on the other hand, is hard and cannot be broken by hand easily. Also, direct observation is necessary to assess the presence, size, distribution, and likely impact on system performance of various fractures, quartz veins, and other types of macropores that may exist in a saprolite.
Our studies show that both soil solum and saprol ite can change significantly across small distances on the 1 andscape. Therefore, the 1 ateral variability of the soil solum and saprol ite should be assessed. We be1 ieve this can be done in two ways for sites proposed for single family homes. After evaluation of a backhoe-dug pit and initial determination of saprol ite's suitability and potential loading rate, three to four auger borings could be made across the proposed drainfield area to assess lateral variability. The drainfield size could be increased and/or a lower loading rate recommended if some of the areas are identified as likely to have lower permeability. A1 ternatively, a second and third pit could be dug to evaluate the lateral vari abil i ty across the proposed drainf i eld and the associated repair area.
In summary, these guidel ines were developed based on findings at twelve different sites as well as from our observations of other soil-saprolite sequences in the Piedmont and Mountain regions. These guidel ines are based on the following observations and conclusions:
1. Saprol ite is part of the total weathering continuum that encompasses the soil solum down to the bedrock.
2. Saprol ite properties may change significantly with depth as well as in horizontal directions.

3 . Both saprol ite and the overlying soil solum must be evaluated to determine the suitability of a site for installing septic system in saprol i te.
4 . Saprol ite and the overlying soil solum must be observed in at least one pit to accurately determine the saprol i te's properties and spati a1 variabil ity, thereby evaluating its suitability for subsurface wastewater disposal.
5. . Lateral variability of soil solum and saprolite may be assessed using auger bori ngs or backhoe-dug pit (s) .
6. Aerobic conditions in soil and/or saprolite are necessary for treatment of household wastewater applied to land.
7. Many, but not all, saprol ites can accept wastewater at a low, but appropriate rate for wastewater disposal .
8. The loading rate for a saprolite w i t h a given texture must be less than the permissible loading rate for a comparable texture in a soil solum.


REFERENCES
Adr'iano, D.C., P.F. Pratt, and K.M. Holtzclaw. 1973. Comparison of two simple methods of chlorine analysis in plant materials. Agron. J. 65: 130-134.
American Geological Institute. 1976. Dictionary o f geological terms. Anchor Press/Doubl eday . Garden City, New York.
Amoozegar, A. 1988. Preparing soil cores collected by a sampling probe for laboratory analysis of soil hydraulic properties. Soil Sci. Soc. Am. J. 52:1814-1816.
Amoozegar, A. l989a. A compact constant-head permeameter for measuring saturated hydraulic conductivity of the vadose zone. Soil Sci. Soc. Am 3. 53:1356-1361.
Amoozegar, A. 1989b. Comparison of the Glover solution with the simultaneous-equations approach for measuring hydraulic conductivity. Soil Sci. Soc. Am. 3 . 53:1362-1367.
Amoozegar, A * , W. R. Guertal, and P. J. Schoeneberger. 1992. Particle density and porosity of selected North Carolina soils. p. 165-172. In Proc. of the 35th Annual Meeting of the Soil Sci. Soc. of N. Carolina. Raleigh, NC.
Amoozegar, A * , and H. T. Hoover. 1989. Movement o f soil moisture and chemical pol 1 utants from wastewater disposal systems through the soi 1 and saprolite of Piedmont landscapes. Water Resources Res. Inst. of the Univ. of N. Carolina. Raleigh, NC. Report t249.
Amoozegar, A., and W. P. Robarge. 1985. Assessment of soil properties important in movement of pollutants around waste storagefdisposal sites. Report submitted to Water Resources Res. Inst. of the Univ. o f N. Carolina and N. Carolina Board of Science and Technology.
Amoozegar, A * , P. J. Schoeneberger, and M. J. Vepraskas. 1991. Characterization of soils and saprol i tes from the Piedmont region for waste disposal purposes. Water Resources Res. Inst. of the Univ. of N. Carol ina. Raleigh, NC. Report Y255.
Amoozegar, A*, and A. W. Warrick. 1986. Hydraulic conductivity of Saturated Soils: Field Methods. p. 735-770. A. Klute (ed.) Methods of Soil Analysis. Part 1. 2nd ed. Agron. Monogr. 9. ASA and SSSA, Madison, WI.
Berkowi tz, S.J. 1985. Pressure manifold design for 1 arge subsurface ground absorption sewage systems. p. 39-48. Proc. of the 4th National Symposi um on Individual and Small Community Sewage Systems. New Or1 eans, LA. 10-11 Dec. 1985. Am. Soc. of Agric. Eng., St. Joseph, MI.

Blake, 6. R., and K. H. Hartge. 1986a. B u l k d e n s i t y . p. 363-375. A. K l u t e (ed.) Methods o f S o i l Ana lys is . P a r t 1. 2nd ed. Agron. Monogr. 9.
' ASA and SSSA, Madison, W I .
B lake, 6. R., and K. H. Hartge. 1986b. P a r t i c l e d e n s i t y . p. 377-382. I n A. K l u t e (ed.) Methods o f S o i l Ana l ys i s . P a r t 1. 2nd ed. Agron. - Monogr. 9. ASA and SSSA, Madison, W I .
Bohn, H. L., B. L. McNeal, and G. A. O'Connor. 1985. S o i l chem is t r y . 2nd ed. John W i l e y and Sons, Inc., New York, NY.
Bouma, J. 1982. Measuring t h e h y d r a u l i c c o n d u c t i v i t y o f s o i l h o r i z o n s w i t h con t inuous macropores. Soi 1 Sc i . Soc. Am. J. 46: 438-441.
Brady, N. C. 1990. The n a t u r e and p r o p e r t i e s o f s o i l s . 1 0 t h ed. Macmi l lan Publ. Co., New York, NY.
Bruce, R. R., J. H. Dane, V. L. Quisenberry , N. L. Powel l , and A. W. Thomas. 1983. P h y s i c a l c h a r a c t e r i s t i c s o f s o i l s i n t h e sou thern r e g i o n -- C e c i l . Southern Coopera t i ve Se r i es B u l l . 267. Georg ia Ag r i c . Exp. Stn. and Univ. o f Georgia, Athens, GA.
Buol , S. W., F. D. Hole, and R. J. McCracken. 1989. S o i l genes is and c l a s s i f i c a t i o n . 3 r d ed. The Iowa S t a t e U n i v e r s i t y Press, Arnes, IA.
Bureau o f Census. 1983. C h a r a c t e r i s t i c s o f hous ing u n i t s -- Chapter B -- D e t a i l e d hous ing c h a r a c t e r i ~ t i c s . P a r t 35 N o r t h Caro l i n a HC80-1-B35. Volume 1. US dept . o f Commerce.
Canter L., and R. C. Knox. 1984. Eva lua t i on o f s e p t i c t a n k system e f f e c t s on ground wa te r q u a l i t y . Robert S. K e r r Env i ron. Research Lab., EPA-600/S2-84-107.
Canter, L. M., and R. C. Knox. 1985. S e p t i c t a n k system e f f e c t s on ground wate r q u a l i t y . Lewis Publ., Chelsea, M I .
C a r l i l e , B. L. 1979. Use o f shal low, low-pressure i n j e c t i o n systems i n l a r g e and sma l l i n s t a l l a t i o n s . p. 371-386. N. I. McCle l land (ed.) I n d i v i d u a l On-Si t e Wastewater Systems. 6 t h Nat . Conf . Proc., Ann A rbo r Press, Ann Arbor , MI.
C a r l i l e , B. L. 1980. E f f l u e n t d i s t r i b u t i o n and t h e i r s i g n i f i c a n c e t o system performance. p . 129-146. N. I. McCle l l and (ed.) I n d i v i d u a l On-Si t e Wastewater Systems. 7 t h Nat. San. Found. Conf., Ann A rbo r Press, Ann Arbor, MI.
Ca r te r , D. L., M. M. Mor t land, and V. D. Kemper. 1986. S p e c i f i c su r f ace . p. 413-423. & A. K l u t e (ed.) Methods o f S o i l Ana l ys i s . P a r t 1. 2nd ed. Agron. Monogr. 9. ASA and SSSA, Madison, M I .

Cassel, D. K., and A. K l u t e . 1986. Water p o t e n t i a l : Tensiometry . p. 563-596. In A. K l u t e (ed.) Methods o f S o i l Ana l ys i s . P a r t 1. 2nd ed. Agron. Monogr. 9. ASA and SSSA, Madison, W I .
Cassel, D. K., and D. R. N ie lsen . 1986. F i e l d c a p a c i t y and a v a i l a b l e wa te r capac i t y . p . 901-926. A. K l u t e (ed.) Methods o f S o i l Ana l ys i s . P a r t 1. 2nd ed. Agron. Monogr. 9. ASA and SSSA, Madison, W I .
Cataldo, D. A., L. E. Schrader, and V. L. Youngs. 1974. A n a l y s i s by d i g e s t i o n and c o l o r i m e t r i c assay o f t o t a l n i t r o g e n i n p l a n t t i s s u e s h i g h i n n i t r a t e . Crop Sc i . 14:854-856.
Cataldo, D. A., M. Haroon, L. E. Schrader, and V. L. Youngs. 1975. Rapid d e t e r m i n a t i o n o f n i t r a t e i n p l a n t t i s s u e by n i t r a t i o n o f s a l i c y 1 i c ac i d . Commun. S o i l Sc i . P l a n t Anal. 6:71-80.
Cawthorn, J. W., 1970. S o i l survey o f Wake County, N o r t h C a r o l i n a . U.S. Dept. Agr ic . , S o i l Cons. Serv., U.S. Gov. P r i n t . O f f i c e , Washington, DC.
Cogger, C., B. L. C a r l i l e , D. Osborne, and E. Ho l land . 1982a. Design and i n s t a l l a t i o n o f low-pressure p i p e waste t r ea tmen t systems. O f f i c e o f Sea Grant. Un iv . o f N. Caro l i n a See Grant Co l l ege Publ i c a t i o n UNC-SG-82-03.
Cogger, C., B. L. C a r l i l e , D. Osborne, and E. Ho l land . 1982b. Design and i n s t a l l a t i o n o f mound systems f o r waste t r ea tmen t . O f f i c e o f Sea Grant. Univ. o f N. Caro l i n a See Grant C o l l ege Publ i c a t i o n UNC-SG-82-04.
Cot love, E., H. V. Trantham, and R. L. Bowman. 1958. An i ns t rumen t and method f o r automat ic , r a p i d , accurate, and sens i t i v e t i t r a t i o n o f c h l o r i d e i n b i o l o g i c samples. J. Lab. C l i n . Med. 51:461-468.
Dan ie ls , R. B., H. J. K l e i s s , S. W. Buol, H. J. Byrd, and J . A. P h i l l i p s . 1984. S o i l systems i n N o r t h Ca ro l i na . N. C a r o l i n a A g r i c . Res. Ser. B u l l . 467.
EPA. 1977. Process Design Manual. Wastewater t r ea tmen t f a c i l i t i e s f o r sewered sma l l communit ies. U. S. Env i ron. P r o t e c t i o n Agency, Env i ron. Research I n f o r m a t i o n Center, O f f i c e o f Technology T rans fe r . Mun i c i pa l Env i ronmenta l Research Laboratory , C i n c i n n a t i , OH.
EPA. 1980. Design Manual. Onsi t e wastewater t r e a t m e n t and d i s p o s a l systems. U. S. Envi ron . P r o t e c t i o n Agency, O f f i c e o f Research and Development, Mun i c i pa l Env i ronmenta l Research Laboratory , C i n c i n n a t i , OH.
F u l l e r , W. H . , and A. W. Warr ick . 1985. S o i l s i n waste t r e a t m e n t and u t i l i z a t i o n . Vo l . I. CRC Press, Inc . , Boca Raton, FL.

Gardner, W. H. 1986. Water content. p. 493-544. A. Klute (ed.) Methods of Soil Analysis. Part 1. 2nd ed. Agron. Monogr. 9. ASA and SSSA, Madison, WI.
Gee, G . W., and J. W. Bauder. 1986. Particle-size analysis. p. 383-411. In A. Klute (ed.) Methods of Soil Analysis. Part 1. 2nd ed. Agron. Monogr. 9. ASA and SSSA, Madison, WI.
Graham, R. C. 1986. Geomorphology, mineral weathering, and pedology in an area of the Blue Ridge Front, North Carolina. Ph.D. Dissertation, Dept. of Soil Sci., N. Carolina State Univ., Raleigh, NC.
Grayson, S. C., D. F. Olive, and S. Steinbeck. 1982. The North Carolina septage study. NC Division of Health Services, Raleigh, NC.
Guertal , W. R. 1992, Physical, chemical, and mineralogical properties of selected soil-saprolite sequences i n the Lake Hyco region of North Carolina. Ph.D. Dissertation, Dept. of Soil Sci., N. Carolina State Univ., Raleigh, NC.
Hendricks, D. M e , and L. D. Whitting. 1968. Andesite weathering 11. Geochemical changes from andesite to saprol i te. J. Soil Sci . 19: 147- 153.
Hillel, D. 1982. Introduction to soil physics. Academic Press Inc., Or1 ando, FL.
Holmgren, G. S. 1967. A rapid ci trate-di thioni te extractable iron procedure. Soil Sci. Soc. Am. Proc. 31:210-211.
Hoover, M. T., and A. Amoozegar. 1988. Recent trends in on-site sewage systems in North Carolina. p. 259-276. On-Site Wastewater Management and Groundwater Protection, Proc. o f the 3rd Annual Nat. Environ. Health Association Midyear Conference. February 7-9, 1988. Mobile, AL.
Hoover, M. T . , and A. Amoozegar. 1989. Performance of a1 ternative and conventional septic systems. Proc. of the 6th Northwest On-site Wastewater Treatment Short Course. University o f Washington. Sept . 18- 19, 1989. Seattle, WA.
Hoover, M. T., A. Amoozegar, and K. C. Martin. 1988. Distribution and performance of septic tank systems a1 ternatives in North Carol ina. p. 39. In Agronomy Abstracts. Am. Soc. Agronomy, Madison, MI.
Jackson, M. L. 1958. Soil chemical analysis. Prentice Hall, Inc. Englewood Cliffs, NJ.
Jackson, M. L. 1979. Soil chemical analysis -- Advances course. 2nd ed. 11th printing. Published by the author, Madison, WI.

Jurney, R.C., and J.T. Miller, and S. R. Bacon. 1937. Soil survey of Chatham County, North Carolina. U.S. Dept. Agric., Bureau of Chemistry and Soils, Superintendent of Documents, Washington, DC.
Keeney, D. Roy and D. W. Nelson. 1982. Nitrogen - Inorganic forms. p. 643-698. In A. 1. Page et a1 . (ed.) Methods of Soil Analysis, Part 2. 2nd ed. Agron. Monogr. 9. ASA and SSSA, Madison, WI.
Klute, A. 1986. Water retention: Laboratory methods. p. 635-662. A. Klute (ed.) Methods of Soil Analysis. Part 1. 2nd ed. Agron. Monogr. 9. ASA and SSSA, Madi son, W I.
Klute, A., and C. Dirksen. 1986. Hydraulic conductivity and diffusivity: Laboratory methods. p. 687-734. J~J A. Klute (ed.) Methods of Soil Analysis. Part 1. 2nd ed. Agron. Monogr. 9. ASA and SSSA, Madison, MI.
Kool, J. B., J. C. Parker, and M. Th. van Genuchten. 1985. Onestep: A nonl inear parameter estimation program for evaluating soil hydraul ic properties from one-step outflow experiments. Virginia Agric. Exp. Stn. Bull. 85-3.
Lutz, J. F. 1969. The movement and storage of water in North Carolina soils and the role of soil in determining water quality. Water Resources Res. Inst. of the Univ. of N. Carolina. Raleigh, NC. Report X24.
McDaniel, P. A. 1988. Manganese in selected Piedmont soils -- Distribution, geomorphic re7 at ionships, and mineralogical characterization. Ph .D. Dissertation, Dept. of Soil Sci., N. Carolina State Univ., Raleigh, NC.
McLean, E. 0. 1982. Soil pH and lime requirement. p. 199-224. A.L. Page et al. (ed.) Methods of Soil Analysis, Part 2. 2nd ed. Agron. Monogr. 9. ASA and SSSA, Madison, WI.
Marthaler, H. P., W. Vogelsanger, F. Richard, and P. J. Wierenga. 1983. A pressure transducer for tensiometers. Soil Sci. Soc. Am. J. 47:624-627.
Martin, K. C. 1987. Soil water distribution i n and around the drainfields of low-pressure pipe wastewater treatment systems. M.S. Thesis. Dept. of Soil S c i . , N. Carolina State Univ., Raleigh, NC.
Metcalf and Eddy, Inc. 1979. Wastewater engineering: Treatment, disposal, reuse. 2nd Ed. McGraw-Hill Book Co., New York
National Cooperative Soi 1 Survey. 1983. Coronaca series - Prof i 1 e description. U.S. Dept. Agric., Soil Cons. Serv., U.S.A.
NCDEH. 1990. Laws and rules for sanitary sewage collection, treatment, and disposal. 10 NCAC 10A .1900 N. Carolina Dept. of Environ. Health and Natural Resources, Div. of Environ. Health.

O'Brien, E. L., and S. W. Buol. 1984. Physical transformation in a vertical soil-saprolite sequence. Soil Sci. Soc. Am. J. 48:354-357.
Olson, R. V . , and R. Ellis. 1982. Iron. p. 301-312. A.L. Page et ale (ed.) Methods of Soil Analysis, Part 2. 2nd ed. Agron. Monogr. 9. ASA and SSSA, Madison, WI.
Olsen, S.R., and L.E. Sommers. 1982. Phosphorus. p. 403-430. In A.L. Page et al. (ed.) Methods of Soil Analysis, Part 2. 2nd ed. Agron. Monogr. 9. ASA and SSSA, Madison, WI.
Pavich, M. J. 1986. Processes and rates of saprolite production and erosion on a foliated granitic rock of the Virginia Piedmont. p. 551-590. In S. M. Coleman, and D. P. Dethier (ed.) Rates of chemical weathering of rocks and mineral s. Academic Press, Inc. Or1 ando., FL.
Pavich, M. J., G. W. Leo, S. F. Obermeier, and J. R. Estabrook. 1989. Investigations of characteristics, origin, and residence time of the upland residual mantle of the Piedmont of Fairfax County, Virginia. U.S. Geological Survey Professional Paper 1352, U.S. Gov. Print. Office Washington, DC.
Perkins, R. J. 1989. On site wastewater disposal. Lewis Pub1 ishers, Inc. Chelsea, MI.
Rhoades, J. D. 1982. Cation exchange capacity. p. 149-157. h A . 1 . Page et al. (ed.) Methods of Soil Analysis. Part 2. 2nd ed. Agron. Monogr. 9. ASA and SSSA, Madison, WI.
Robarge, W. P., and I. J. Fernandez, compilers. 1992. Quality assurance methods manual for 1 aboratory analytical techniques. EPA/600/x-xx/xxxx. U.S. Environmental Protection Agency, O f f i c e o f Research and Development, Corvallis, OR.
Schoeneberger, P. J. 1990. Physical properties and water movement through a soil and saprol i te at different geomorphic positions. Ph.D. Dissertation, Dept. of Soil Sci., N. Carolina State Univ., Raleigh, NC.
Schoeneberger, P., and A. Amoozegar. 1990. Directi onal saturated hydraul ic conductivity and macropore morphology of a soi 1 -saprol i te sequence. Geoderma 46 : 31-49.
Schoeneberger, P. J., S. B. Weed, A. Amoozegar, and S. W. Buol, 1992, Color Zonation Associated with Fractures in a Felsic Gneiss Saprolite. Soil Sci. SOC. Am. 3 . 56:1855-1859.
Simpson, G. G. 1986. Hydraul ic characteristics of soil-saprol i te profiles from the North Carolina Piedmont. p. 147-154. Proc. of the 29th Annual Meeting o f the Soil Sci. Soc. of N. Carolina. Jan. 21-22, 1986.

Soil Survey Staff. 1984. Procedures for collecting soil samples and methods of analysis for soil survey. Soil Survey Investigation Report No. 1. USDA-SCS, U.S. Gov.'Print. Office, Washington, DC.
Soil Survey Staff. 1990. Keys to soil taxonomy. U.S. Dept. Agric., Soil Management Support Services, Tech. Monograph No. 19. 4th ed. Virgi ni a Polytechnic Inst. and State Univ., Blacksburg, VA.
Surbrugg, J. E. 1992. Water and solute distributions in soil/saprolite continuum under on-site wastewater disposal systems. Ph.D. Dissertation, Dept. of Soil Sci., N. Carolina State Univ., Raleigh, NC.
Theisen, A. A., and M. E. Harward. 1962. A paste method for preparation of slides for clay mineral identification by x-ray diffraction. Soil Sci. Soc. Am. Proc. 26:90-91.
Topp, G. C., J. L . Davis, and A. P. Annan. 1982. Electromagnetic determination of soil water content using TDR: I. Applications to wetting front and steep gradients. Soil Sci. Soc. Am. J. 46:672-678.
Vepraskas, M. J., M. T. Hoover, and J. Bouma. 1991a. Sampl ing strategies for assessing hydraul ic conductivity of water-conducting voids in saprol i te. Soil Sci. Soc. Am. J. 55:165-170.
Vepraskas, M. J., A. G. Jongmans, M. T. Hoover, and J. Bouma. 1991b. Hydraul ic conductivity of saprol i te as determined by channel s and porous groundmass. Soil Sci. Soc. Am. J. 55:932-938.
Warrick, A. W., and D. R. Nielsen. 1980. Spatial variability of soil physical properties in the field. p. 319-344. In D. Hillel (ed.) Applications of soil physics. Academic Press, New York, NY.
Welby, C. W. 1981. A technique for evaluating the hydraulic conductivity of saprolite. Water Resources Res. Inst. of the Univ. of N. Carolina. Raleigh, NC. Report 1164.


Guertal, W. R. 1992, Physical, chemical, and mineralogical properties of selected soil-saprol ite sequences in the Lake Hyco region of North Carolina. Ph.D. Dissertation, Dept. of Soil Sci., N. Carolina State Univ., Raleigh, NC.
Guertal, W. R., and H. J. Kleiss. 1992. Physical, chemical, and mineralogical characteristics of selected soil-saprol i te sequences i n the Lake Hyco region, North Carolina. p. 113-122. Proc. of the 35th Annual Meeting of the Soil Sci. Soc. of N. Carolina. Raleigh, NC.
Guertal, W. R., M. J. Vepraskas, H. J. Kleiss, and A. Amoozegar. 1992. Identification of hydraul ical ly active macropores for on-si te wastewater disposal in a soil-saprolite sequence. p. 105-112. In Proc. of the 35th Annual Meeting of the Soil Sci. Soc. o f N. Carolina. Raleigh, NC.
Guertal, W. R., M. J. Vepraskas, A. Amoozegar, and H. J. Kleiss. 1991. Identification of hydraul ical ly active macropores for on-si te wastewater disposal in a soil-saprol ite sequence. p. 312. In Agronomy Abstracts. ASA, Madison, WI.
Hoover, M. T. , A. Amoozegar, H. J. Kleiss, and W. R. Guertal. 1991. Morphology and soil water re1 ationships of solum/saprol i te sequences. p. 313. Agronomy Abstracts. ASA, Madison, MI.
Surbrugg, J. E. 1992. Water and solute distributions i n soil/saprol ite continuum under on-si te wastewater disposal systems. Ph. D. Dissertation, Dept. of Soil Sci., N. Carolina State Univ., Raleigh, NC.
Surbrugg, J. E., and A. Arnoozegar. 1991. Treatment of wastewater in a North Carolina Piedmont soil and saprolite. p. 53 .IJ Agronomy Abstracts. ASA, Madison, WI.
Surbrugg, J. E. , and A. Amoozegar. 1991. Treatment o f wastewater by a Piedmont soil and saprol ite. p. 88-98 in Proc. o f the 34th Annual M e e t i n g o f t h e s o i l Sci. Soc. o f N . Carolina. Raleigh, NC.
Surbrugg, J. E., and A. Amoozegar. 1992. Physical, chemical and hydraulic properties of soil and saprolite used for wastewater disposal. p . 61. In Agronomy Abstracts. ASA, Madison, MI. -
