t implications for' manpower planning:. pub date-, . … · aap. a \ incidence of...
TRANSCRIPT
DOCUMENT RESUME ,
ED 215 549 EC 142'409rr
AUTHOR Ortiz, Alba A'.; Yates, James R. .
TITLE.tIncidence of'Exceptionality among Hispanics:Implications for' Manpower Planning:.
PUB DATE-, . Apr 81NOTE 24p.
EDRS PRICE MF01/PC01 Plub Postage.. \M.4dirk
DESCRIPTORS
ABSTRACT
;
,
Demography; *Disabilities; Educational' Trends;Elementary Secondary Education; *EmploymentProjections; *HispanicAmericans; *Incidence; *Labor'Needs; Needs Assessment
,
Based on-Texas Education Agency data, the studyexamined the incidence of handicapped Hispanics with systematitimplications formanpower planninq7.'Incidence figures are'analyzedterms of trends from 1974-1979 inspecial education services toHispanics, demographics, variables affecting service incidence(policy /law', litigation, lack of.assessment perionnel, inadequateprocedures, lack of bilingual personnel, bilingual education,increased awareness, and manpower needs).' Noted among findings arethat large percentages of emotionally disturbed, auditorialayhandicapped, and visually handicapped students are not receivingservices; thare has been a decrease in lev4l of services to Hispanicswho are mentally retarded or speech handicapped; the1980 censusshowed Hispanics 'to be the-fastest growing language minority in thisotountryvandthene has been an increase in litigation and a growingtrend toward malpractice suits directed at'individuals,participatingin identifiCationA,plaament, and teaching processes resulting inreal damages to milierity children. aqive Step plan for determiningmanpower needs ib.outlined and applied to project manpower needs forexceptional Hi4panic students. Tables-with statistical data areprovided.,(SB)
0
************************************************************************ -
Reproductions supplied: -bey EDRS are the best 'that can be madefrom the original document. .
**************************************************1.**1***************i*

e
r
s
v
le
.r c
)
U.S. 00ARTMENT OF EDUCATIONNATIONAL INSTITUTE OF EDUCATION
RESOURCES INFORMATION
CENTER (ERIC/."''This document has been reproddced asreceived from the persim or organdatronoriginating it
Mipor changes have been made to improvereproduction quality r I
Points of view or opinions stated in this documeht do not necessanly represent official NIE
POS1t1041 or poky
I -
iis..:
. ..
.
. INCIDENCE OF EXCEPTIONALITY AMONG HISPANICS:
... 0
1 t
IMPLICATIONS FOR MANPOWER PLANNING/
f
Alba A. Ortiz-James R. Yates
i.,
,
The Univers ity.of Texas at Austin-,
EDB 216.Austin, Texas
(512) 471-7255, (512) 837-6150
..,..1'
April 1981/
"PERMISSION TO REPRODUCE THISMAJ)ERIAL HAS BEEN G TED BY
-.4r 1.0.../.
TO THE EDUCATIONAL RESOURCES- INFORMATION CENTER (ERIC)."
3
I.
i t
o
i
f
4
'1
\1.,
*
.
O.
AAP
a
\
INCIDENCE OF EXCEPTIONALITY AMONGHISPANICS:>"
IMPLICATION`,
FOR MANPOWER PLANIVNG
In1978-1979, there were741,981 Hispanics' in Tekas public
schools; 82,393 were labeled handicapped. Because Hispanics comprised 26
percent of the gerpral student population and 25 percent of the handicapped-
4 .
population, itowould appear that special education programs ha,d \reached
parity; representation.of Hispanics in special education was consonant
with thii group'S representatio4 in the general student population.
However, when the number of Hispanic students served, by special education
programs compared with traditional ly accepted incidence figures for
handicapping conditions, serious questions surfote relative to parity,.
labels, -placements, and service.delivery for exceptional Hispanics.
This is the first known study exami nit ng incidence of handi capped
Hiipanic.s with systematic- jmpl'ICations for manpower planning. While the
study is specific to one state, the procedures and planning models utilized
are -generally appl itable
The professional literature indicates that minority ,children are
over-rdpresented in classes for the handicapped and especially in classes. .
C
for; the mental ly retarded.' FoNexample, Dunn (1968)- postulated that
minority children constitute 60 to 80 percent of chil dren enrol led in this
country's special,education -programs. In' a cdmprehensive study of special4.
education placement procedures in Riverside, California, Mercer (1976)
found three times more Mexican American chil dreri and two and one-hal f time's
more Blacks Plan. wofild'be expected firm their percentage of rep'esentation
,. 3

Exceptional Hispanics
2
i1 thethe population-qualified for classes for the mentally retarded.
Contrary: to the literature, Texas,-Hispanics are under-represented in all
categories of' handicapping conditions with the exception of learning disa-
bilities.
Insert Table A about here
Mackie's (1965) traqtional incidence figures are used_in Table A
to project the number of Hispanic students expected in each handicapping
category. FOr example, the Mackie incidence of learning disabled in the ./general population is two percent, Applying this 'two percent figure to the 0
tnumber. of1Hispanics in Texas schools, one Zuld expect .14,840 Hispanics to
-
6
be labeledlearqing disabled. however, Texas Educatio-n Agency data report
43,502 learning di sabled Hispanits,1 an incidence_ of 5.9 percent. The i11ci -e
dence of 5.9 percent exceeds the 2 percent incidence by 293 percent. ., ,
Interestingly, Overrepresentation in learning di sabi 1 i ties is' contradictory
to lkerature which indicates that minority ch-Ndren are less likely to be
placed in this category (Franks, 197-U. Data.,in Table A' al so illustratesg
the folocitng:- -e
1. Seventy -eight percent of al 1 exception(' Hi spanics are served in
. learning sabil i ties and speech, hearing, and language programs.
2. Several categori es reflect a large' percentage of children hot4.receiving services. For example, 86 percent of. the expected
number of emotionally disturbed Hispanics are not receiving
services, 75 percent.;:of the auditorially handicapped, and 47
percent of the visually handicapped.
4

c
Exceptional Hispanics
3. The larger number of Hi spanic students diagnosed as learning
di sabled raises serious _questions of equity and accuracy of
di agdo4ic processes.
,4. Compared to white, non-Hispanic -students,. there js a di spropor-
tionate representation of Aispanics in programs for the mental ly
retarded. Of the 38.,381 mental lyetarded studen4 irl Texas, 37
percent were white, non- Hispanic, yet, white non-Hi spanics
comprised 58 percent of th-d student population. Hispanics
comprised 16 percent of the student population but 28 percent of
the mentally retarded population.
5. The category- of speech, handicap 'came osest to expected levels
of service. iOity percent of the expec ed 'number of studPnts ,-4
1were idebti f i ed.
Trends in.Special EducationService Si to Hispanics
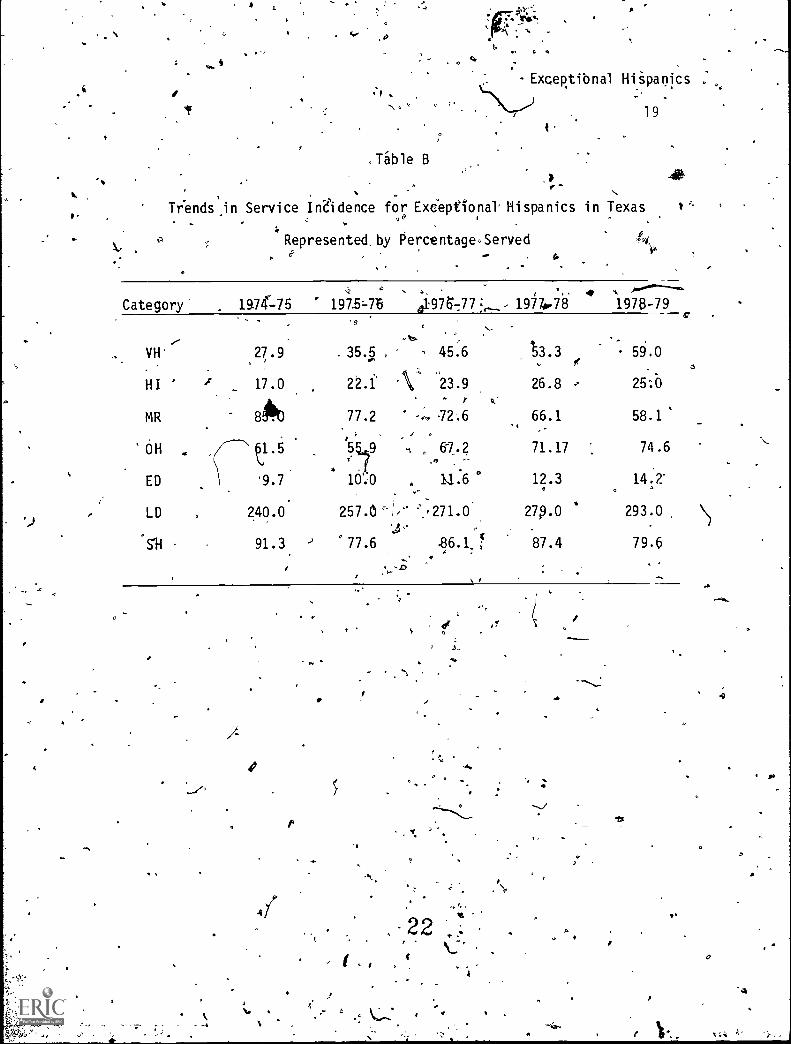
Table 13' presents service incidence figures for Texas Hispanics ;in
special education from 1974-1979. Hispanics ,have been underrepresented in,-
al 1 categories. of handfcappi ng conditions, with the exception of learning
disabilities, since 1974. However, there has been a steady increase in
. almost al 1 handicapping categories indicating a growing concern and accep-
tance of service obligations by local education agencies..-lop
It Must be noted that there has been a lecrease' in level of services1
to Hispanics who are mental ly retarded or speech handicapped. The decline
in service incidence has been most dramatic in the mental retardation cater -,
k gory. Since 1974, service has decreased by 27 percent.
5
0.
4
e
Except4ional Hispanics
4
Insert Table ,B about here
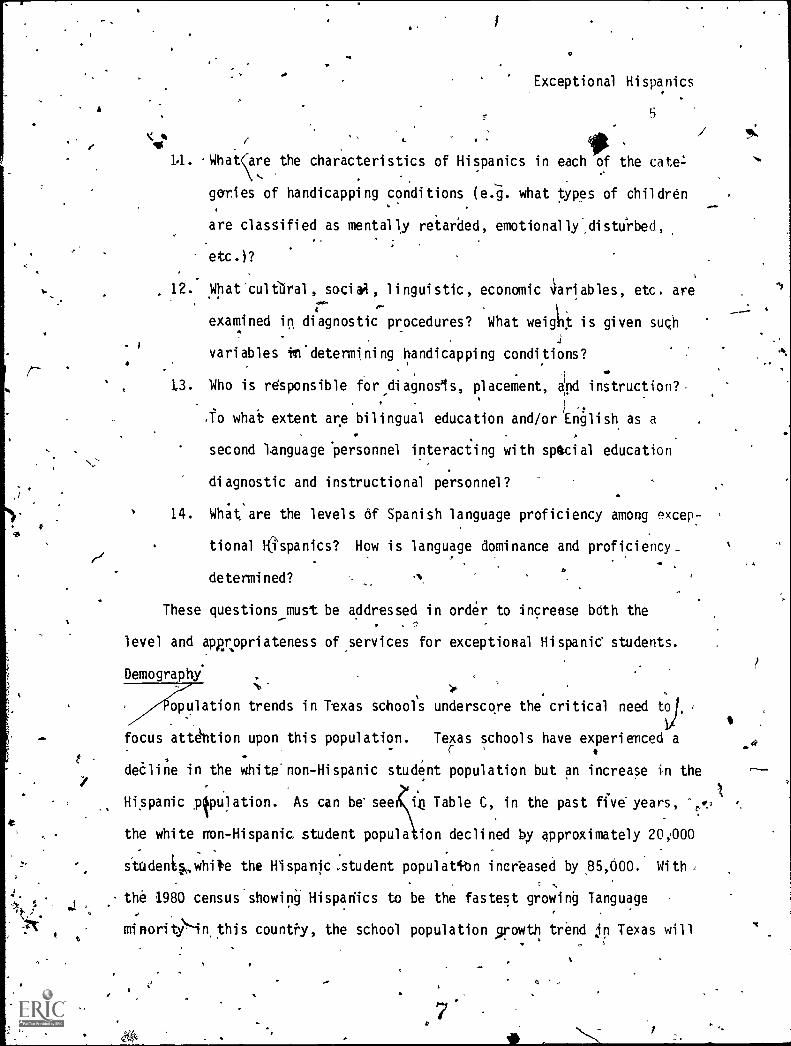
Demographic Questions Related to Incidence
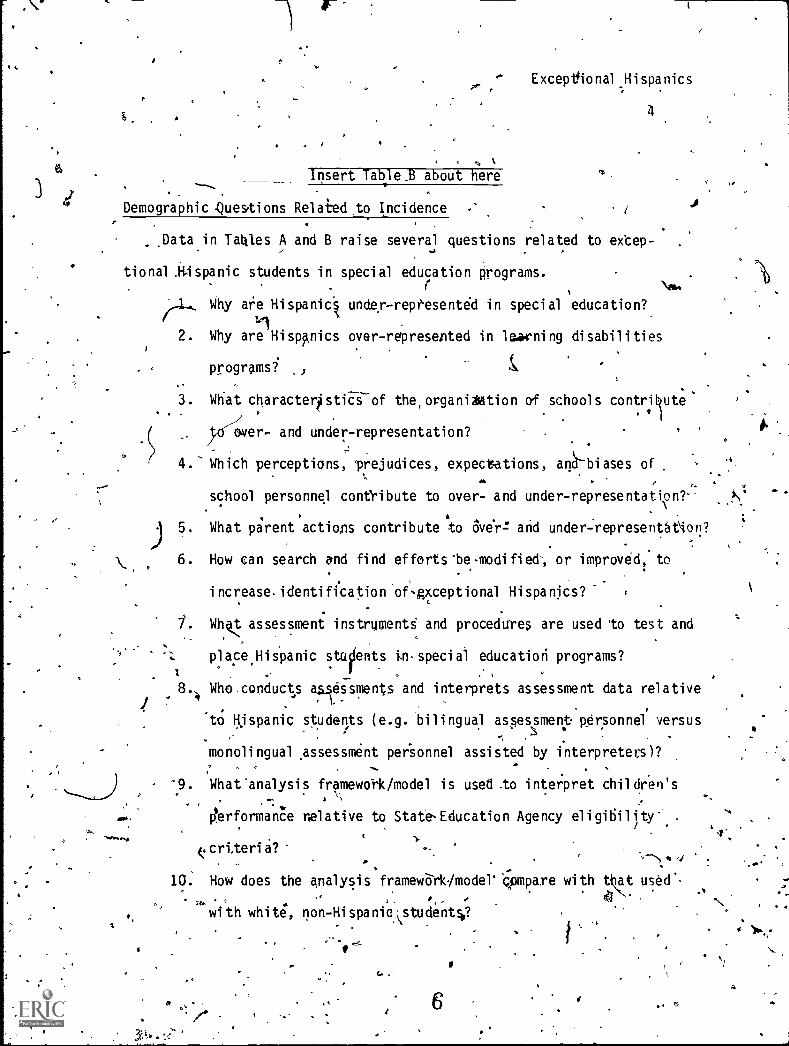
,Data in Tallies A and B raise several questions related to ex'cep-,
tional .H-ispanic students in special education programs.
Why are Hi spanick under-represented in special education?
2. Why areHispanics over-represented in learning disabilities
programs?
3. What characteristics of the, organiziation of schools contribute,
over- and under-representation?
4. Which perceptions, prejudices, expectations, arla-bi ases of..- ,
school personnel contribute to over- and under-representation? .'\. ,. , ;
5. What parent actions contribute to over= and under-representation?
6. How can search and find efforts *be -modi fled', or improved to
increase. identification of-exceptional Hispanics?
7. Whkt assessment instruments and procedures are used to test and
place.Hispanic students tn. speci al educatiori programs?
1 . . . .. 2.
i 8'4 Who .conducts a.slessments and interprets assessment data relative, .to Hispanic students (e.g. bilingual assessment personnel versus
.1 .
monolingual _assessment personnel assisted by interpreters)?a
'9. What 'analysis framework/model is used to interpret children's
performance nelative to State-Education Agency eligibility' .
' .
cri.teri a? --. , '--Th. -I
10. How does the analysis framework /model' Ompare with that used'..
wi- th white, non-Hi spaniestuct;ntV,
14a..
a
.1
0
Exceptional Hispanics
5
114
14. What(are the characteristics of Hispanics in each of the sate=
gerri es of handicapping conditions (e.g. what 'types of children
are classified as mentally retarded, emotionally.,disttirbed,
etc.)?
12. What'cultbral , , linguistic, economic 4ariables, etc. are
examined in diagnostic procedures? What weight is given such
variables itn.determining handicapping conditions?
13. Who is responsible for,diagnosis, placement, and instruction?
,fo wha:t extent are bilingual education and/or English as a
second language personnel interacting with spitscial education
diagnostic and instructional personnel?
14. What are the levels 6f Spanish language proficiency among excep-
tional Ifispanics? How is language dominance and proficiency_
determined? 0
These questions must be addressed in order to increase bOth the
level and appropriateness of ,services for exceptional Hispanic' students.
Demography
opulation trends in Texas school s underscore the critical need to
focus att6ition upon this population. Texas schools have experienced a-
dealine in the white. non-Hispanic student population but an increase in the
Hispanic .ptpulation. As can be see tu Table C, in the past five" years,
the white rron-Hispanic, student popula ion declined by approximately 20;000
studentswhife the Hispanic :student populatitn increased by 85,000. With
the 1980 census showing Hispadics to be the fastest growing language
minorit?in, this country, the school population growth trend jn Texas will
,
0
Exceptional Hispanics
6
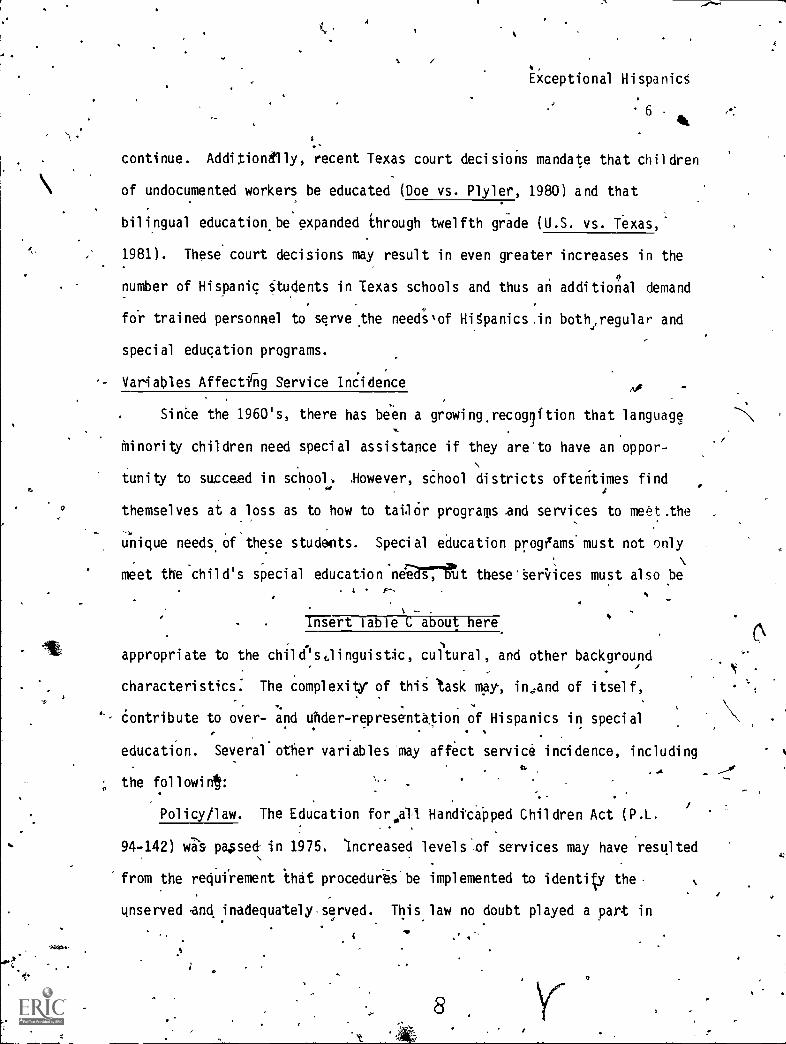
..continue. Addi ly, recent Texas court decisions mandate that children
of undocumented workers be educated (Doe vs. Plyler, 1980) and that
bilingual education be expanded through twelfth grade (U.S. vs. texas,
1981). These court decisions may result in even greater increases in the
number of Hispanic students in Texas schools and thus an additional demand
fo'r trained personnel to serve the need; xof Hispanics in both regular and
special education programs.
Variables Affecting Service Incidence Ai
SinCe the 1960's, there has been a growingrecogition that language
Minority children need special assistance if they are'to have an oppor-.
tunity to succeed in school. .However, school districts oftentimes findle
themselves at a loss as to how to tathir programs .and services to meet.the
unique needs Of these studects. Special education progizams must not only
meet the child's special education needr-tut these §eritices must al so be1,
1
Insert Table C about here
.appropriate to the child's,linguistic, cultural, and other background
characteristics: The complexity of this 'task may, in.:and of itself,
Contribute to over- and uhder-representktion of Hispanics in special. ,
education. Several other variables may affect service incidence, including
the following;
Policy/law. The Education for_all Handicapped Children Act (P.L.
94-142) was- posed in 1975. Increased levels',of services may have resulted
from the requirement that procedur-es'be implemented to identiV the
unserved ,and inadequately-served. This law no doubt played a part in
8
7.
4
Exceptional Hispanics
7
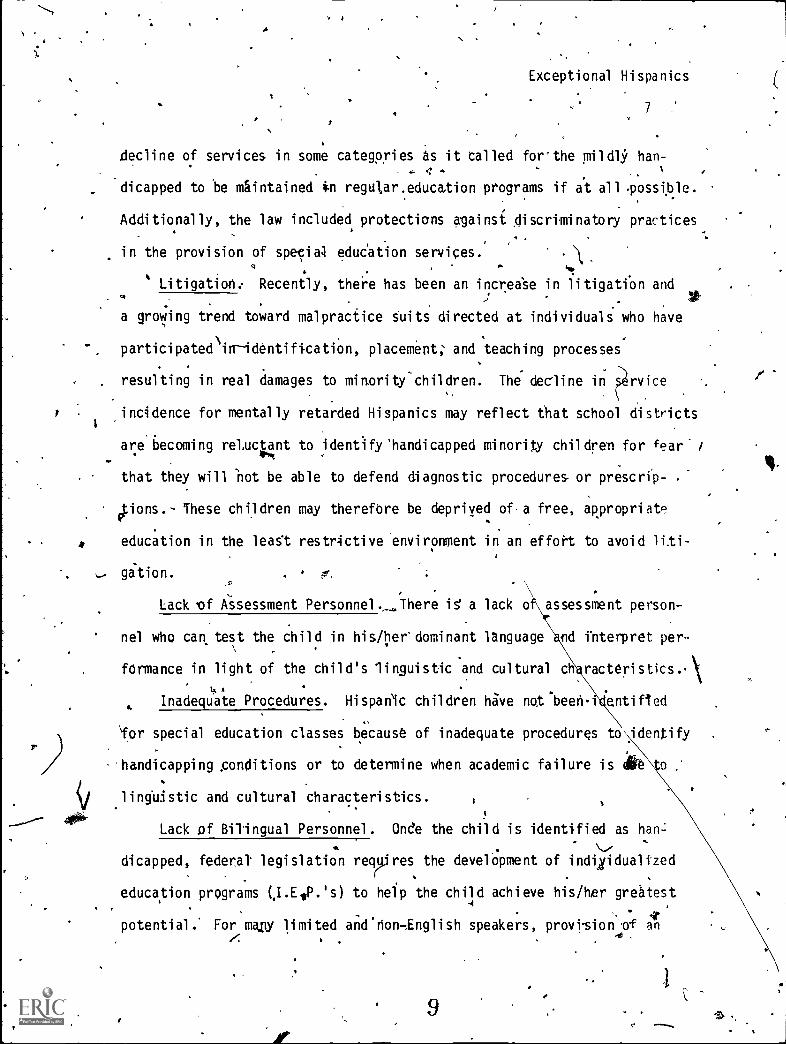
decline of services in some categories As it Called for'the mildly han-<
dicapped to 'be maintained 4n regular.education programs if at all ossible.
Additionally, the law included protections against discriminatory practices
in the provision of special education services
, .
Litigation: Recently, there has been an increase in litigatfOn and.
, *.
. , . . .
a growing trend toward malpractice Suits directed at individuals who have
participatedNin-identif cation, placement; and teaching processes,
. resulting in real damages to min,ority'children. The decline in ry ice
incidence for mentally retarded Hispanics may reflect that school districts
are becoming retucgnt to identify 'handicapped minority chil dre'n for fear /
that they will not be able to defend diagnostic procedures, or prescrfp- .
ions.- These children may therefOre be deprived of a free, appropriate
education in the leaSt restrictive environment in an effort to avoid
401i,
gation.
.
Lack of Assessment Personnel ._.There is a lack o assessment person-
nel who can test the child in his/her' dominant language d interpret per-,, .
fOrmance in light of the child's linguistic and cultural h racteristics., \
4 Inadequate Procedures. Hispanic children hive not.
beeh-i.
entified
for special education classes because of inadequate procedures to identify .
handicapping conditions or to determine when academic failure is ile
linguistic and cultural characteristics.
Lack of Bilingual Personnel. Onde the child is identified as ham:
dicapped, federal legislation reqyres the development of indfyidualtzed
education programs (I.E.,P.'s) to help the child achieve his /her greatest4
o
potential.' For may limited anerion-English speakers, provision of an-yr .

,.
I r' iExceptional Hispanics
-8
. -appropriate education cannot be realized because of the lack of bilingual
i
special education personnel. Therefore, fewer Hispanics -are proyided spe-.
ci al education 'services.
7: Bilingual Education.. Si nce 1968, there has been an increase .i n the
avail abi 1 i ty of bi I i ngual education prOgrams for civil dren ,of 1 i mi ted
English language proficiency. Decline in service incidence 'far the Men-,
tal ry retarded may indicate that bilingual education programs have become.., .
alternatives to special education plkements. Placement in such programS
is made in the hope that putting the child in a ass wi th a 'teacher who
speaks his/her language will , in and of itself,, remedy deficit. -`condttion(s). Bilingual educators often find that they do not have the
necessary' training to determine whether a child is handicapped or to pro-c. - -, , .
vide educational interventions which will help handicapped students achieve,
their potential. Further, teachers are at a loss as to how to prevent
inappropriate placement of exceptional children in their classes.
InNested Awareness'. IDecline in service incidence in the category
of speech handicaps may be attributed to increased understanding of the
. I
''.
nature of the second language acquisition and- awareness 6f the-influence of6
*native langua'ge development on the 'development of English language skills.4
Speech pathologists may be less likely to categorize as di sorders thosek
speech and language errors which have been. determined to be \charactei stic/ ././.
of Spanish speakers who learn English as a second la age.. , .
Manpower'Needs
The di scuission of oven and under-representation of .Hi spa nic-
children in special reducation ,has beeri attributed to several factor's: :\
\\
10 .........._41
a
A ,
S
.4
afr-Exceptional Hispanics
9
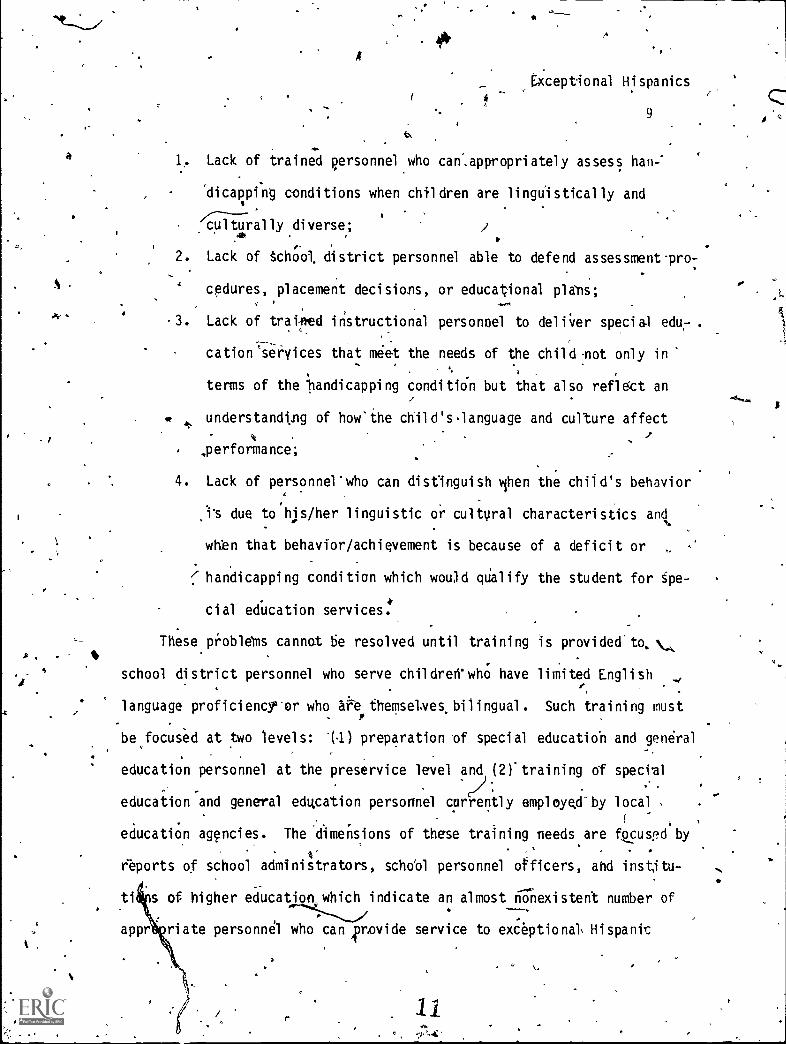
1. Lack of trained personnel who can ,appropriately assess hail:
dicappiny conditions when chtl dren are 1 i ngui stical ly and
orally ly di verse;
2. Lack of tchool, di strict personnel able to defend assessment -pro-
cedures, placement decisions, or educational plays; t,
3. Lack of trained instructional personnel to deliver special edu,- .
cation `se'r'vices that meet the needs of the child -not only in0,
terms of the 'handicapping condition but that al so reflect an
understanding of how' the chil d's .language and culture affect
,performance;
4. Lack of personnel 'who can distinguish when the child's behavior
,i's due to his/her 1 i ngui stic or cul tural characteristics and,
when that behavior/achievement is because of a deficit or
( handicapping condition which would qUal ify the student for spe-
cial education services!
These problefis cannot be resolved until training is provi ded. to, \,,,
school di strict personnel who serve chil drerl who have limited Engli sh
language proficiency'-or who are themselves, bi I ingual . Such training must
be focused at two level s: (1) preparation of special education and general
education personnel at the preservice level and (2) training of special
education and general editcation personnel currently empl oyesi by 1 ocal
A
education agencies. The dimerisions of these training needs are focuspd by
reports of school administrators, scho'ol personnel officers, and insti tu-
t s of higher education which indicate an almost nOnexi stent number of
appr ri ate personnel who can provide service to exceptional, Hispanict .
4
.r
-, 4P ---- -"%k . t . ... - .
2) ,l. r
.. it-
,. . "%0. ,/ Exceptional Hispanics
v.. 11)
n
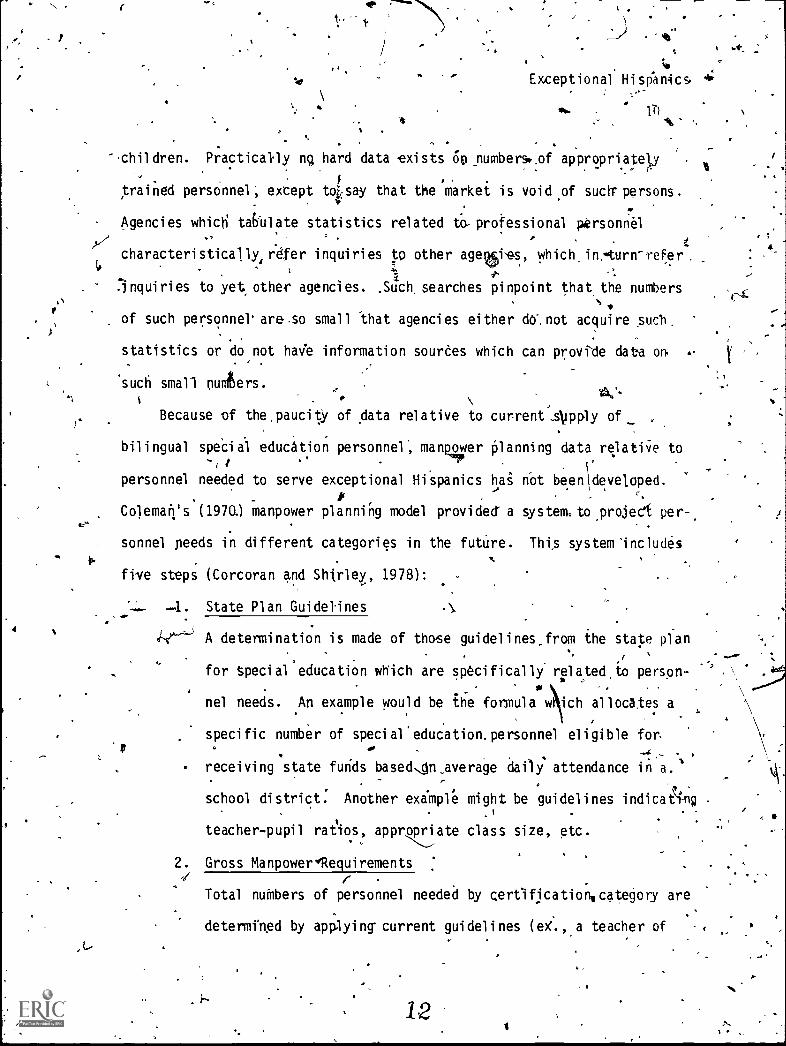
.children. Practically ng hard data exists 60 numbers..of appropriately
.
trained persOnnel ; except toitsay that the market is void of such persons .
Agencies which ta61 ate statistics related to- professional personnel
characteristically, refer inquiries to other age5ises, which in.turn-refer .
inquiries to yet, other agencies. .SUCh. searches pinpoint that the numbers
of such personnel' are .so smal 1 that agenci es either d0-, not acqui re sucli
statistics or d o not hay.e information sources which can provide data on. ,
'such small (miters.4:-
Because of the pauci v of data relative to current 4pply of
bilingual special education personnel ', ma np4er Planning data relaticie to-1 /
personnel needed to serve exceptional Hi spa nics hai not been \ developed.
P r .
Coleman's (1970J manpower planni lig model provided' a system. to ,project per-
sonnel needs in di fferent categories in the futUre. This system :includes
five steps (Corcoran and Shirley, 1978):
-4. State Plan Guidelines
A determination is made of those guidelines -from the state plan
.
for special education which are specifically related to person-.
nel needs. An example would be the formula w ich al locates a
specific number of speci al education, personnel eligible for
.
receiving state furids basedAn average daily attendance i n a.
school district. Another exdmple might be guidelines indi1
teacher-pupil ratios, appropri ate class size, etc .
2. Gross Manpower 4Requi rements
ITotal numbers of personnel needed by certIficationi catejory are
deterrrin,ed by applyi ng current gui del i nes W. , a teacher of
12
I
ExceptionarHispanics .
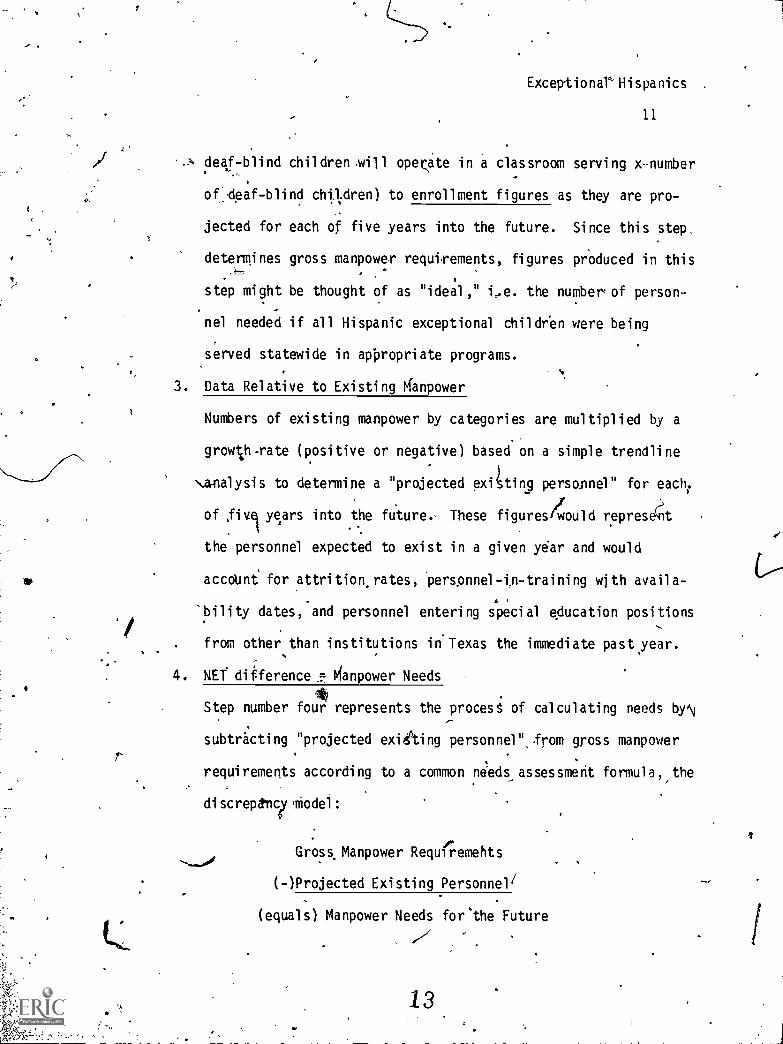
deaf -blind children opeate in a classroom serving x-- number
of_deaf-blind children) to enrollment figures as they are pro-
jected for each of five years into the future. Since this step,
determines gross manpower requirements, figures produced in this
step might be thought of as "ideal," i.e. the number of person-.
nel needed if all Hispanic exceptional children were being
served statewide in appropriate programs.
3. Data Relative to Existing Manpower
Numbers of existing manpower by categories are multiplied by a
growth -rate (positive or negative) based on a simple trendline
\analysis to determine a "projected exiting personnel" for each
of fivl years into the future.- These figures4ould repres4t
the personnel expected to exist in a given year and would
account' for attrition, rates, 'pers.onnel-tn-training with avail a-
'bility dates, and personnel entering special education positions
. from other than institutions in'Texas the immediate past year.
4. NET difference = Manpower Needs
Step number four represents the process of calculating needs by'
subtracting "projected exiting personnel", from gross manpower
requirements according to a common needs assessment formula, the
discrepenviodel:
Gross.Manpower Requi;emehts
(-)Projected Existing Personnel/
(equals) Manpower Needs for'the Future
13

r
(
I
5. Development of Programs - .
Based on figures yielded in Step #4 (calculating by,categories
Exceptional Hispanics
128
, -
of 'specific kinds of personnel) the organizatiQn. (Texas
'Education1Agency) undertakes the development of programs
designed to meet future needs for manpower in special educatiOn
in Texas. Two. broad categories of program development might be/as follows:
4
A. In-service Training
Development of programs with local and regional education,
t. 14.
agencies to retrain existing personnel for roles in.
special
education whew. demand is greater than supply.
B. Pre-service Training
Articulation with training institutions i
1n Texas to develop
r-e.-----(or to ctt back) programs which train personnel in spec'ific
categorical areas.
--.In the following sections, this model is used to project manpower needs,,fori
./
,
exceptional Hispanic students..
Determining Guidelines and Enrollment----,,...
a. r.
Table, D reflects the largest number of children In a particular.
category that can be served by one te&hez. This approach .43/i el ds. the
,most conservative projection possible, that is, the minimum number ofE,
,
teachers needed. .
,A Insert Table D about here
"ar g
14
E.,
'I 4
A
.
.9
.
N

A2
Exceptional Hispanics-,c
/ 13
These- figures represent actual teacher-pupil .ratios inTexas 'for
:the 1972-1973 school year,, the last year for which such figures are
avaifable.
Projected -State Enrollments in Special Education
'Projection of 'total enrollment Of Hispanics in special education is
based on ,a simple growth factor relative to total school Average Daily
AttendriCe (ADA). (See Table E and F.)
Insert Table' c, about here
Projected Enrollments by Handicapping.Condition
Based on a growth factor of 3.8 percent the projected Hispanic stu-
de-tit enrollment for 1979-1984 is given in Table F.,
`Insert Table F here
Percentof "Full Gapacity" Services
Full capacity means all expected handicapped studenti are ideritified
and served. Accordirig to Mackie (1965) exceptional students would comprise
11.2. percent of, the su,dent population.
Insert Table G here
As has been noted, .if only combined incidence figures; for han-
dicipping conditions are inspected, it appears that the state is providing
services to the expected- number of handicapped Hispanic. students (11-12
percent as seen in Table G). However; examination'of the service incidence
figures indicates underrepresentation in all categories with the exception .
of learning disabilities, Manpower projtions mast be sensitive to

K
11
Exceptional,. Hi spanics
.increased ability. to identify the unserved and to decrease overrepresen- .
tation in learning disabilities categories. Therefore, while figures
suggest the greatest personnel needs to be for the learning disabled and ,A kE;
speech handicapped, it. is .important that the characteristics of studentS
placed in'such program be examined to determine whether the need is deter- ,
mined by inappropriate . identification, placement or based upon a real han-,
/di cappi N condition. ditionally, manpower projections must' address both
an increase in enrollment and an increase in services provided.
Table H projects the number of exceptional Hispanic stude.n who
would be served in 137971984 based on the concept of full capacity.
Insert Table H here.
Gross Manpower Needs
%npower needs fol. handicapped Hispanics were .detehird by dividing
the number of Hispanic stidentsprojected in each categorical area by the
corresponding teacher-pupil ratio. Table I gives projected manpower needs
to 1983-1984.
Insert Table I about titre
"Gross-manpower°requirements to serve Hispanic exceptional children
...0"1indicate a critical need for Institutions of Higher Education to dramati-
cally emphasize bilingual special education personnel programs to meet the
critical shortage. (See Table J.) -
Insert Table J about here
16.
t

".41.
:.;4.
Exceptional Hispanics
": 15
Steps.3, 4, and 5 of Coleman's model could note complgted because
g .data. ;For example, there is little data available about'
existing bilingual special education personriel in each categorical area.
Therefore, it is not possible to determine the exact magnitude' of discre-
pancy between supply and demand..- Thdre is also a lack of data relative to
projected attrition based on factors such as maternity leave, retirement,
death, or relocation. Data is not, available to determine' personnel .
becoming availabld.." However, the fact that no data is available supports
'the 'conclusion that the discrepancy °is great. Training units of the educa-4
tional enterprise must be infolued and supported in their efforts to
address the critical manpower needs -associated with h 'serving handicapped
Hispanics.
tt
17
.7
ogo
4
J.
Exceptional ,Hi spa nics
16
REFERENCES
Adeinlan, H. An interactive*view of causality. Academic Therapy, 1970
,6, 43-52.
Bilingual Education act, P.L. 951561, Education Amendments of 1978,
Title VII. Rosslyn, Va:: National ClearipeOuse.for Bilingual
Education, 1979.
Coleman, B. An integrated system for manpower- planning. Business
Horizons, 1970, 13, 89-95.
Corcoran, K. & Shirley, J. Model for projecting special education man-
. power needs in Texas,'A repot to the Council for Personnel
Preparation for the Handicappe4, Austin, Texas, 1978.
Doe v. Plyler,` 62k3 f..2d 448, 456-57 (5th/Cir. 1980).
Dunn, L. L.. Special Education for the Mildly Retarded--Isliuch of It
Justified. Exceptional Children, 1968, 35, 5-2,2.
.Education for All Handicapped Children Act of 1975, Public Law 94-142.lot
Federal' Regtsker, Tuesday, August 23, 197-7,
Franks, D. J. Ethnic' and So.cial Status °Characteristics>vf Children in
EMR and CD Classes. Exceptional Children, 1971, 37, 537-538.
Lau v. Nichols, 414 U.S. 563 (1974).
Kackte, R. P. Spotlighting advances in special education.' Exceptional.
Children, 1965, 32, 77-81.
'Mercer, J. ,Pluralistic Diagnosis in the Evaluation of Black and Chicano
Children; A Procedure for Taking Socio- Cultural Variables into
Account in Clinical Assessment. 4n-C. A. Hernandez, M. J. Haug,
"S.
;18
'

Exceptional- Hi spanic;\
17
& N. N. Wagner Chicanos; Social and Psychological Perspectives
St. Louis: G. V. Mosby, 1976.
U,S. v.. Texas, Civil Action 5281, 5th Circuit, U.S. District Court,
Tyler Division, Jan. 9, 1981.
V
.-r
L
r
19
$
I
*W.
VS71-"

.
4
Table.c'N
A
Summary4of Special Education Servicepincidence for Hispanics in Texas for 1978-1979
0,
Type of Handicap
Mackie'sTraditionally _ Expected No.* . Total' ('
Accepted of Handicapped ,Being
Incidence Hispanics - Served
Visually Handicapped .10 ' 742 438
Hearing Impaired ..60. 4,452' 1,L15
OrthopedicallyHandicapped and Other -.50,
.
3,710. \ ?,767.0
Health Impaired,-,..
.
oMenfally Retarded 2.50 k 18,550 10,782
/
Emotionally Disturbed 2.00 . 14,840 2,108
.
Learning Disabled 2.00 14,840 ,- 43,502
Speech Handicapped 3.50 25,969 20,684 80%
20
ti
% ofExpected. Curre
No. Being' . Seryice
Served Inc
59% .O&
24%
75%
58%
14%
293%
.37
i
1.40, .4. .
. .28
5:90,,,,
. 2.80f71
NOTE: Thete figures are based on the Texas Education Agency's Fall survey of general studentpopulation and the report of all special education students, ingOiding students contracted t2,
approved non - public schools for 1978-1979. The Hispanic student population was 741,98Lk.'
*These figures are based on Mackie's (1965) traditional Incidence figures.
\
0CD
"7:3rt0
.
4,
I
D
.Tible B
- Exoeptibnal Hispanics
19t
4.0
Trends ,in Service Indldence for Exceptional' Hispanics in Texas. . .0
\-,, Represented by fiercentage,Served
,
p
.,Category . 1g74e-75 197.576 41976-,77 19770,78 1978-79
27.9
HI * 17.0
MR 84Ik
OH
ED 9.7
LD 240.0
SH 91.3.
. 35§ 45.6
22.1' 23.9
77.2
.55,9 67.2. .1
10:0 14.6°
257.0 271.0.
477.6
1
13.3fr
26.8 -
66.1
59.0
25 :0
58.1
71.17 74.6
12.3 1412'
279.0 293.0
87.4 79.6
41
1
p
0'
s
2 A
6
O

Exceptional Hispanics
20 ,
40
Table-C
Population Trends among ispanic and White Students
in Texas Public Schools
Year
,Total-School
Population
1974-1975 2,785,296
1975-1976. .2,812;888
k
1976-1977 2,839,864".1977-1978 2,856,361
. 1978-1979, 2,867,254
White Hispanic
1,687,231' 6t7.123
(60.6%) (23.6%)
1,683,505 680,820
(59.8%)
.
1,685,958
(59.4%1,t
700,656.
(24.7%)
1,687,828 721,846
(53.8%) (25.3%)
1,667,978,/
t
741,981
(25.9 %)
S.
23,
t

4
Table D
Exceptional Hispanits
Category
Maximum Pupil/Teacher Ratios or the Handicapped
Teacher r../C9
0,
Pupils/
VH 1 11
AH 1 24
COHJ 1 22
EMR 1 14
Ea 1 '`19
LLD 1 31
ASH 1'
CI68
,