t mentals monthly chart pack - nedbank 1 1 techmentals monthly chart pack march 2017 we re-launch...
TRANSCRIPT

Confidential 1
1
TECHMENTALS MONTHLY CHART PACK March 2017
We re-launch our monthly TechMentals chart pack which consists of our favourite charts – ones that we monitor closely. We include a combination of technical and fundamental charts across a wide range of asset classes and countries. Over the month (February 2017) global financial conditions have improved supporting risks assets in general. Global dollar liquidity conditions remain favourable. Our velocity of money indicator is in positive territory for the first time since 2015.
Mehul Daya
Strategy: Research Analyst
Tel : +27 11 295 8838
Neels Heyneke
Senior Strategist
Tel: +27 11 535 4041

2 Source: DataStream, Nedbank CIB
GLOBAL VELOCITY OF MONEY (VOM) INDICATOR AND 'REAL-TIME' MONEY MULTIPLIER
VOM INDICATOR IS IN POSITIVE TERRITORY FOR THE FIRST TIME SINCE 2015.
• Our Velocity of Money Indicator is a proprietary indicator that we monitor closely. It is a
modernized version of Irving Fisher‘s work on the Quantity Theory of Money, MV=PQ. It is a
composite indicator that uses a number of variables such as changes in money multipliers,
changes in yield curves, corporate spreads and others. It is a useful indicator to understand the
'animal spirits' of the global economy and is also a leading indicator when compared to PMIs,
stock prices and business cycle indicators.
Contents
Velocity of money indicators
Growth Metrics
Global Dollar liquidity indicators
Equities vs Bonds
FX
Corporate credit
Financial Conditions
Global Uncertainty
South Africa TechMentals
Multi-Asset Class Scanner
Tactical & Strategic views
-40
-30
-20
-10
0
10
20
30
40
2000 2002 2004 2006 2008 2010 2012 2014 2016 2018
Global Velocity of money indicator
VoM indicator (yoy%)
Tech bubble
9/11attacks
Subprime Metldown
EZ debt crisis
Taper Tantrum
QE 1
QE 2/LTRO
Abenomics
ECB QE
China CNY devalue
↑USD
Global bond bear market
China GDP 15%
BRICS term coined
Oil @ $139 bbl

3
The Citi Group Economic Surprise indices track how economic data releases are faring relative to expectations. Source: DataStream, Nedbank CIB
Velocity of money indicators
Growth Metrics
Global Dollar liquidity indicators
Equities vs Bonds
FX
Corporate credit
Financial Conditions
Global Uncertainty
South Africa TechMentals
Multi-Asset Class Scanner
Tactical & Strategic views
CITI ECONOMIC SURPRISE INDICES (WITH 3M MA)
The growth environment remains intact according to the Citi Economic Surprise indices.
Contents
4 Source: DataStream, Nedbank CIB
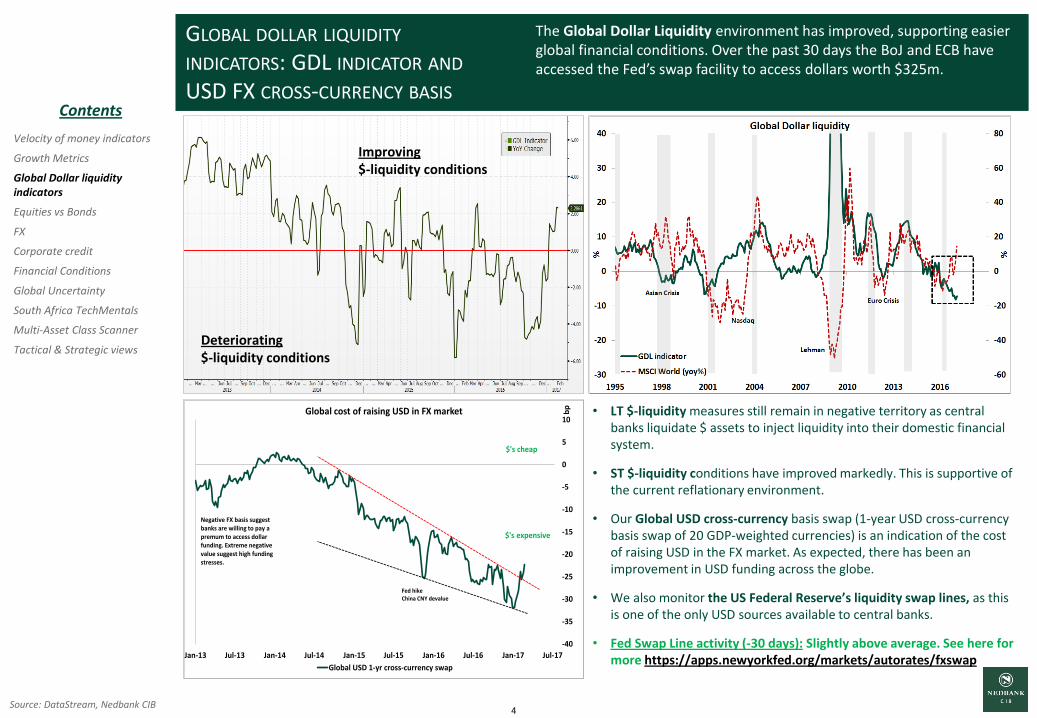
GLOBAL DOLLAR LIQUIDITY INDICATORS: GDL INDICATOR AND USD FX CROSS-CURRENCY BASIS
• LT $-liquidity measures still remain in negative territory as central banks liquidate $ assets to inject liquidity into their domestic financial system.
• ST $-liquidity conditions have improved markedly. This is supportive of the current reflationary environment.
• Our Global USD cross-currency basis swap (1-year USD cross-currency basis swap of 20 GDP-weighted currencies) is an indication of the cost of raising USD in the FX market. As expected, there has been an improvement in USD funding across the globe.
• We also monitor the US Federal Reserve’s liquidity swap lines, as this is one of the only USD sources available to central banks.
• Fed Swap Line activity (-30 days): Slightly above average. See here for more https://apps.newyorkfed.org/markets/autorates/fxswap
Velocity of money indicators
Growth Metrics
Global Dollar liquidity indicators
Equities vs Bonds
FX
Corporate credit
Financial Conditions
Global Uncertainty
South Africa TechMentals
Multi-Asset Class Scanner
Tactical & Strategic views
Improving $-liquidity conditions
Deteriorating $-liquidity conditions
The Global Dollar Liquidity environment has improved, supporting easier global financial conditions. Over the past 30 days the BoJ and ECB have accessed the Fed’s swap facility to access dollars worth $325m.
Contents
-40
-35
-30
-25
-20
-15
-10
-5
0
5
10
Jan-13 Jul-13 Jan-14 Jul-14 Jan-15 Jul-15 Jan-16 Jul-16 Jan-17 Jul-17
bpGlobal cost of raising USD in FX market
Global USD 1-yr cross-currency swap
Negative FX basis suggest banks are willing to pay a premum to access dollar funding. Extreme negative value suggest high funding stresses.
Fed hikeChina CNY devalue
$'s cheap
$'s expensive

5 Source: DataStream, Nedbank CIB
EQUITIES VS BONDS PERFORMANCE
Velocity of money indicators
Growth Metrics
Global Dollar liquidity indicators
Equities vs Bonds
FX
Corporate credit
Financial Conditions
Global Uncertainty
South Africa TechMentals
Multi-Asset Class Scanner
Tactical & Strategic views
ST - World
LT - World
ST - SA
LT - SA
World Equity vs Bond relative performance remains above the long-term resistance line. SA Equity vs Bond relative performance reversed from the resistance line that has been in place since 2008/2009 (the relative is now on its way to the bottom of the channel that has been in place since 2013).
Contents

6
Note: Dollar bull market cycles taken from low to high in the cycle using Fed’s USD trade weighted index and then based to 100 from month 0.
Source: DataStream, Nedbank CIB
Velocity of money indicators
Growth Metrics
Global Dollar liquidity indicators
Equities vs Bonds
FX
Corporate credit
Financial Conditions
Global Uncertainty
South Africa TechMentals
Multi-Asset Class Scanner
Tactical & Strategic views
FX MARKET We remain of the opinion that a correction phase in the dollar is unfolding. The C-wave of the correction pattern is still outstanding, targeting a move to 96.45 However, over the long-term we are USD bulls. Looking at previous USD bull cycles the bull trend remains on track.
Contents
DXY
7 Source: DataStream, Nedbank CIB
Velocity of money indicators
Growth Metrics
Global Dollar liquidity indicators
Equities vs Bonds
FX
Corporate credit
Financial Conditions
Global Uncertainty
South Africa TechMentals
Multi-Asset Class Scanner
Tactical & Strategic views
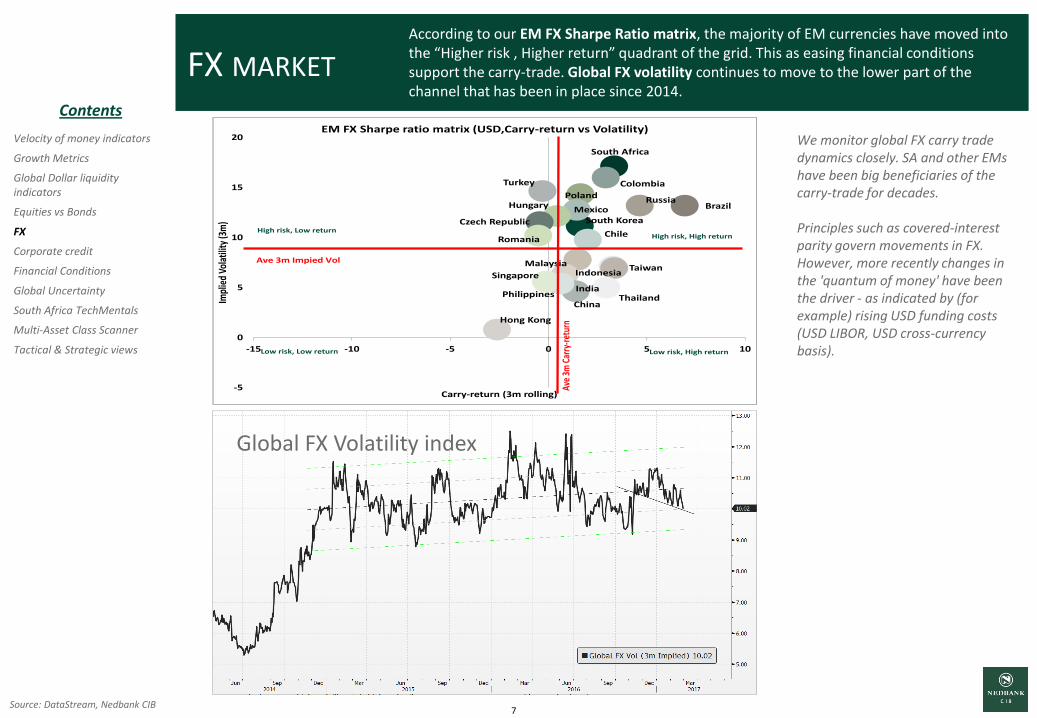
Global FX Volatility index
FX MARKET
We monitor global FX carry trade dynamics closely. SA and other EMs have been big beneficiaries of the carry-trade for decades. Principles such as covered-interest parity govern movements in FX. However, more recently changes in the 'quantum of money' have been the driver - as indicated by (for example) rising USD funding costs (USD LIBOR, USD cross-currency basis).
According to our EM FX Sharpe Ratio matrix, the majority of EM currencies have moved into the “Higher risk , Higher return” quadrant of the grid. This as easing financial conditions support the carry-trade. Global FX volatility continues to move to the lower part of the channel that has been in place since 2014.
Contents
South Africa
Colombia
Mexico
Turkey
BrazilRussia
South Korea
PolandHungary
Malaysia
Czech Republic
ChileRomania
IndonesiaTaiwan
Singapore
China
IndiaPhilippines Thailand
Hong Kong
-5
0
5
10
15
20
-15 -10 -5 0 5 10
Impl
ied
Vola
tility
(3m
)
Carry-return (3m rolling)
EM FX Sharpe ratio matrix (USD,Carry-return vs Volatility)
Ave 3m Impied Vol
Ave
3mCa
rry-
retu
rn
High risk, High return
Low risk, High returnLow risk, Low return
High risk, Low return

8 Source: DataStream, Nedbank CIB
Velocity of money indicators
Growth Metrics
Global Dollar liquidity indicators
Equities vs Bonds
FX
Corporate credit
Financial Conditions
Global Uncertainty
South Africa TechMentals
Multi-Asset Class Scanner
Tactical & Strategic views
CORPORATE CREDIT SPREADS
Global corporate credit spreads remain rich.
Contents
HY Corp spreads per region
Asia/EM HY Corp spreads

9 Source: DataStream, Nedbank CIB
Velocity of money indicators
Growth Metrics
Global Dollar liquidity indicators
Equities vs Bonds
FX
Corporate credit
Financial Conditions
Global Uncertainty
South Africa TechMentals
Multi-Asset Class Scanner
Tactical & Strategic views
GLOBAL FINANCIAL CONDITIONS
The high correlation between the GS Global Financial Conditions index and EM/SA risk assets remains intact.
vs EM Equities vs EM Bonds
vs SA Equities vs SA FX
Contents

10
Source: Harvard-Baker, Bloom & Davis www.policyuncertainty.com
Velocity of money indicators
Growth Metrics
Global Dollar liquidity indicators
Equities vs Bonds
FX
Corporate credit
Financial Conditions
Global Uncertainty
South Africa TechMentals
Multi-Asset Class Scanner
Tactical & Strategic views
Political events to watch in 2017
March UK Proposed Data for Triggering Article 50
March Netherlands General Election
March US debt ceiling Extension Expires
March-April Italy Potential General Election
23 April/7 May French Presidential Elections
May G7 Summit in Italy
July G20 Summit in Germany
September/October Germany Federal elections
October/November China 19th Congress Communist Party meeting
December South Africa ANC Party Conference
GLOBAL ECONOMIC POLICY UNCERTAINTY INDEX
The Global Economic Uncertainty (EPU) Index for February 2017 fell to below Brexit levels amid some political calm and transparency from the Trump Administration. However, tensions remain in Asia – especially with N. Korea and its on-going missile tests.
Contents
11 Source: DataStream, Nedbank CIB
Velocity of money indicators
Growth Metrics
Global Dollar liquidity indicators
Equities vs Bonds
FX
Corporate credit
Financial Conditions
Global Uncertainty
South Africa TechMentals
Multi-Asset Class Scanner
Tactical & Strategic views
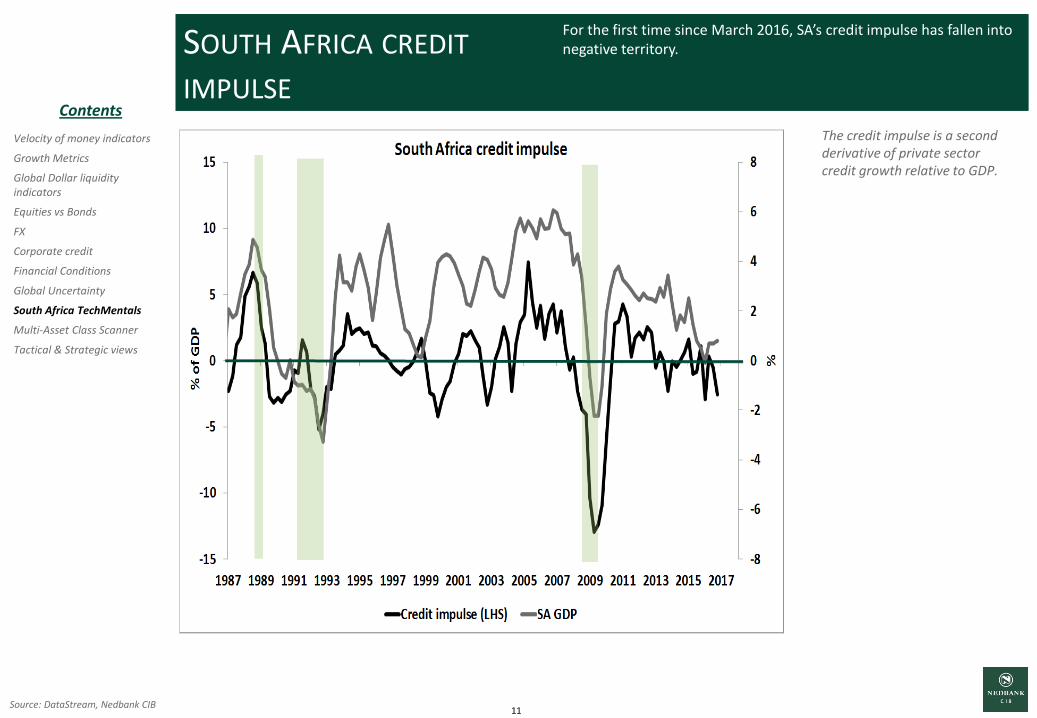
SOUTH AFRICA CREDIT IMPULSE
The credit impulse is a second derivative of private sector credit growth relative to GDP.
For the first time since March 2016, SA’s credit impulse has fallen into negative territory.
Contents

12 Source: Bloomberg, JSE
Velocity of money indicators
Growth Metrics
Global Dollar liquidity indicators
Equities vs Bonds
FX
Corporate credit
Financial Conditions
Global Uncertainty
South Africa TechMentals
Multi-Asset Class Scanner
Tactical & Strategic views
Factor tilt Description Monthly % YTD %
JSE All Share Market capitalization-weighted index.
-1.31 +1.67
JSE Top 40 40 largest companies by market capitalization.
-2.08 +1.19
SA Growth Stocks Excess returns from stocks with stronger past performance.
-1.4 +2.53
SA Value Stocks Stocks that have low prices relative to their fundamental value.
-1.1 -0.23
SA JSE Growth vs Value Factor Tilt Performance
SOUTH AFRICA EQUITY MARKET THEMATICS
SA growth/value relative outperformance took a breather over the month. However, we expect the outperformance to continue as financial conditions remain supportive. Longer term, we favour stocks that are orientated towards value.
Contents
13 Source: MSCI, Bloomberg , DS
Velocity of money indicators
Growth Metrics
Global Dollar liquidity indicators
Equities vs Bonds
FX
Corporate credit
Financial Conditions
Global Uncertainty
South Africa TechMentals
Multi-Asset Class Scanner
Tactical & Strategic views
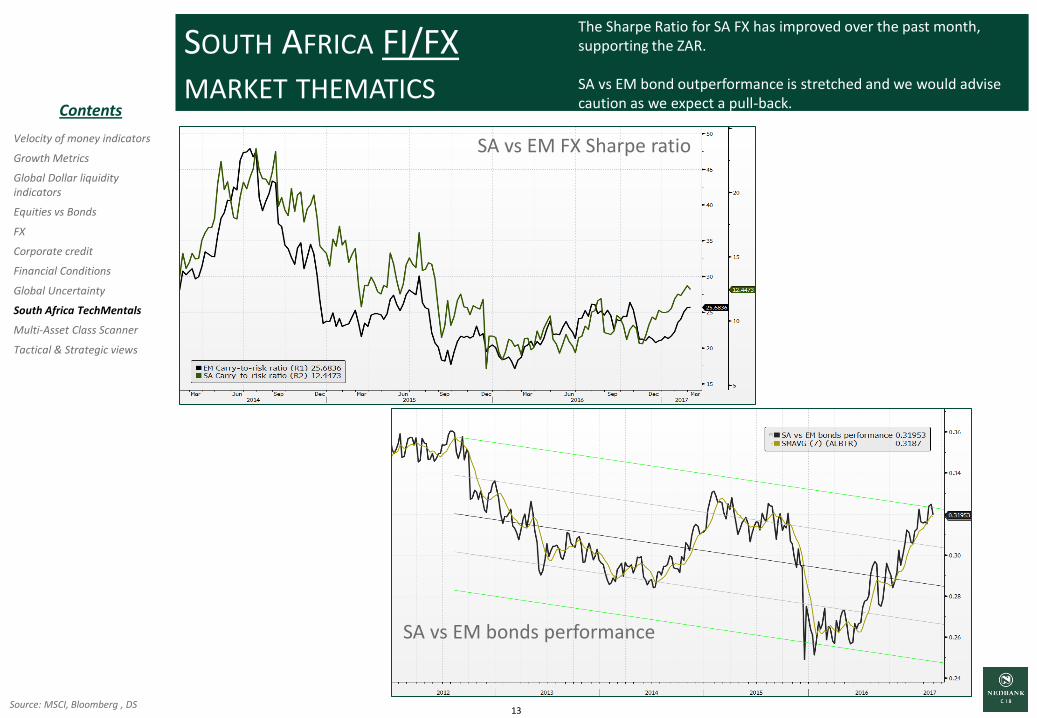
SA vs EM FX Sharpe ratio
SOUTH AFRICA FI/FX MARKET THEMATICS
The Sharpe Ratio for SA FX has improved over the past month, supporting the ZAR. SA vs EM bond outperformance is stretched and we would advise caution as we expect a pull-back.
SA vs EM bonds performance
Contents

14
Note: Overbought and oversold conditions are determined by using technical price indicators such as RSI and MACD. Source: DataStream, Nedbank CIB
Velocity of money indicators
Growth Metrics
Global Dollar liquidity indicators
Equities vs Bonds
FX
Corporate credit
Financial Conditions
Global Uncertainty
South Africa TechMentals
Global Asset Class Scanner
Tactical & Strategic views
Global HY, S&P, EM $-Bonds, MSCI World, EM FX Vol = OVERBOUGHT China 10 yr Govi, AUD/USD, Australia 10yr, Russia Micex = OVERSOLD
Contents
0 10 20 30 40 50 60 70 80
China Govi 10yr
AUD vs USD
Australia Govi 10yr
Russia Micex Index
US Govi 10yr
EUR/USD 3m Vol
US Govi 10yr 3m Vol
Commodity 3m Vol
EM equity 3m Vol
SA Govi 10 yr
VIX
SA Top40
Copper
US Dollar Index
USD/ZAR
Gold
Platinum
SA Trade Weighed Rand
CRB Raw Materials Index
EM FX Carry Index
EUR/USD ccy basis 3m
USDZAR 3m Vol
Global FX Carry Index
EUR/ZAR
Iron Ore
USD/BRL 3m Vol
EM LCY Bond index
USD/RUB 3m Vol
EM FX vol
MSCI WORLD
EM USD Bond Index
S&P500
Global HY corp credit
Cross-Asset Over Bought/Sold Scanner
Overbought territory
Oversold territory

15 Source: DataStream, Nedbank CIB
SUMMARY OF VIEWS
Velocity of money indicators
Growth Metrics
Global Dollar liquidity indicators
Equities vs Bonds
FX
Corporate credit
Financial Conditions
Global Uncertainty
South Africa TechMentals
Multi-Asset Class Scanner
Tactical & Strategic views
Underweight Neutral Overweight
Level Initiated - - - 0 + + +
Equities Levels
SA 45700 l
US 2264 l
Europe 3300 l
EM's 886 l
Fixed Income
SA 10yr 8.78 l
US 10yr 2.34 l
Global 1.46 l
EM LCY 6.77 l
Corp HY 3.51 l
Forex
USD/ZAR 13.74 l
US Dollar 101 l
EUR/USD 1.06 l
EM FX vs USD 235 l
Other
Brent $ 55 l
Gold $ 1197 l
EUR & YEN ccy
swap vs USD-47 / -77
l
Cash ZAR 357 l
Cash $ 185 l
l Strategic (12 months)
Tactical (3-6 months)
→ Increase
← Decrease
@ a Glance - Our Asset Class Views
*Notes : SA = Top40 , US=S&P500, Europe=
EuroStox50 , EM = MSCI EM, Global bond =JPM GB
yld, EM LCY= EM GBI yld, Corp HY= CSI Barc HY, EM
FX= Bloomberg EM FX carry index, Cash (ZAR)=
STEFI, Cash (USD)= LIBOR TR 6m Cash index
Themes
Over the long-term we expect returns from equities to be low, given where valuations are and as the world remains in a balance sheet recession only boosted from time to time by short-term reflationary actions by central banks (ie fundamentals have not changed). The corrective/reflationary rally we are expecting over the next quarter would bode well for equities in general. We expect growth to outperform value during this period. A rally in global bond yields would be bullish for interest rate sensitive sectors.
The contraction in global money supply in the Eurodollar system should continue amid stringent banking regulations, slowing global trade and capital flows. The impact of the contraction in global dollar-liquidity would filter through into markets via the global carry-trade, leaving the bond/FX market very volatile and dislocated from traditional fundamentals. The effects of ‘financial plumbing’ should play an increasing role going forward.
In South Africa the growth forecast remains weak. The lack of meaningful structural reforms should continue to negatively impact the real economy. We can expect another volatile year for the rand and bonds, caused not only by local forces but also by international forces through the global carry-trade and Eurodollar system. SA equities will most likely again be influenced by international themes. During the expected rally in 1Q17, we expect growth stocks to outperform value but for them to underperform for the year as a whole.
Risk to our views
Should a disorderly rise in global interest rates during 1Q17 (sparked by forced deleveraging in the highly geared bond markets) occur, a tightening of financial conditions would lead to the risk-on phase being short-lived.
A stronger dollar would indicate a contraction in the global money supply, which would have the same effect as the abovementioned.
China still remains a risk that we will be monitoring closely. There is a real risk that controlled financial tightening attempted by authorities may spill over into the real economy faster than expected. This would impact EM sentiment and commodities negatively, leaving our tactical call at risk.
Rising populism and growing uncertainty regarding world politics is also a factor that has the potential to derail the
reflationary environment that we are expecting.
Contents

THANK YOU
Analyst Certification Each research analyst principally responsible for the preparation and content of all or any identified portion of this research report ('Report') hereby certifies that, with respect to each company or security or any identified portion of the Report with respect to a company or security that is discussed by the research analyst in this Report, all of the views expressed in this Report accurately reflect his/her personal views about that company or securities as at the date of this Report. Views expressed in respect of a particular company or security in this Report may be different from, or inconsistent with, the observations and views of other research analysts due to the differences in evaluation criteria. Further, each research analyst certifies that no part of his/her compensation was, is, or will be, directly or indirectly, related to the specific recommendations or views expressed by him/her in this Report. Potential Conflicts of Interest Research analysts employed by Nedbank Limited (acting through its Nedbank Capital division) ('Nedbank') or its ultimate holding companies or any direct or indirect subsidiary undertakings of such holding companies affiliates ('Affiliates')(collectively, the 'Group') are compensated from revenues generated by various members of the Group. Research analysts do not receive compensation based upon revenues from specific transactions. In respect of the securities of a company that such research analyst covers, the Group generally requires that research analyst and any member of his/her household to disclose any trades and holdings in such securities. In addition, Group policy requires that research analysts make written disclosure to their employer if they serve as an officer, director or advisory board member of a company that he/she covers. The Group comprises a full service investment bank and a commercial bank engaged in providing investment banking, asset management, financing, financial advisory services and other commercial and investment banking products and services to a wide range of corporations and individuals. In the ordinary course of the Group's trading, brokerage, asset management and financing activities, any member of the Group may, at any time, hold ownership positions of [up to] 1% of any of the companies mentioned in this Report, may deal as principal or agent for more than one party in, or hold short positions, long positions of less than 1%, and may trade or otherwise effect transactions, for its own account or the accounts of customers, in debt or equity securities or loans of third parties or any other person that may be involved in a transaction/project in connection with a company or securities referenced in this Report. The Group recognises its responsibility for compliance with relevant securities laws in relation to such activities and has implemented the required information barriers and control systems in respect thereof. In addition, the Group may have and may in the future have investment and commercial banking, trust and other relationships with parties other than the companies mentioned in this Report, which parties may have interests with respect to the companies and the securities referred to herein. Members of the Group, in the course of such other relationships, may acquire information about the companies and/or securities mentioned herein or such other parties. Be advised that no member of the Group shall have an obligation to disclose any such information, or the fact that any member of the Group is in possession of such information, to the recipients of this Report. Furthermore, members of the Group may have fiduciary or other relationships whereby such member may exercise voting power over securities of certain companies, which securities may from time to time include securities of the companies referred to herein. Recipients of this Report are advised that any or all of the foregoing arrangements, as well as more specific disclosures set forth below, may at times give rise to potential conflicts of interest. Disclaimer and Copyright This Report is not directed to, or intended for use by or distribution to, directly or indirectly, in whole or in part, any person or entity who is a citizen or resident of or located in any locality, state, country or other jurisdiction where such distribution, publication, availability or use would be contrary to law or regulation or which would subject any member of the Group to any registration or licensing requirement within such jurisdiction. This Report has been issued or approved for issue by a representative of Nedbank and has been forwarded to you solely for information purposes and for your consideration. The information contained in this Report is confidential and is not intended to be, nor should it be construed as, 'advice' as contemplated in the Financial Advisory and Intermediary Services Act, 2002 or otherwise, or a direct or indirect invitation or inducement to any person to engage in investment activity relating to any securities or any derivative instrument or any other rights pertaining thereto of any company mentioned herein ('financial instruments'). Information and opinions presented in this Report were obtained or derived from public sources that Nedbank believes are reliable but makes no representations as to their accuracy or completeness. Any opinions, forecasts or estimates herein constitute a judgement as at the date of this Report and should not be relied upon. There can be no assurance that future results or events will be consistent with any such opinions, forecasts or estimates. Past performance should not be taken as an indication or guarantee of future performance and no representation or warranty, express or implied is made regarding future performance. The price, value of and income from any of the financial instruments mentioned in this Report can fall as well as rise. Certain transactions including those involving futures, options and other derivative instruments can give rise to substantial risk of loss and are not suitable for all investors. Before entering into any transaction, you should independently take advice on and evaluate the risks and potential benefits of the transaction. Opinions, forecasts and estimates expressed in this Report are subject to change without notice and may differ or be contrary to opinions, forecasts and estimates expressed by other business areas in the Group as a result of using different assumptions and criteria. Furthermore, the Group (including each member's directors, employees, representatives and agents) accepts no responsibility or liability (whether in delict, contract or otherwise) for any loss arising from the use of or reliance placed upon the material presented in this Report, except that this exclusion of liability does not apply to the extent that liability arises under specific statutes or regulations applicable to any member of the Group. In addition, members of the Group may have issued, and may in the future issue, other reports that are inconsistent with, and reach different conclusions from, the information presented in this Report. Those reports reflect the different assumptions, views and analytical methods of the research analysts who prepared them and Nedbank is under no obligation to ensure that such other reports are brought to the attention of any recipient of this Report. Members of the Group may be involved in many businesses that relate to companies and financial instruments mentioned in this Report. Any prices or levels contained herein are preliminary and indicative only and do not represent bids or offers. These indications are provided solely for your information and consideration. The information contained in this Report may include results of analyses from a quantitative model which represent potential future events that may or may not be realized, and is not a complete analysis of every material fact representing any product, company or financial instrument. Any estimates included herein constitute the judgment of the research analyst as of the date hereof and are subject to change without any notice. This Report may provide the addresses of, or contain hyperlinks to, websites. Except to the extent to which the Report refers to website material of Nedbank, Nedbank has not reviewed the linked site and takes no responsibility for the content contained therein. Such address or hyperlink (including addresses or hyperlinks to Nedbank’s own website material) is provided solely for your convenience and information and the content of the linked site does not in any way form part of this Report. Accessing such website or following such link through this Report or Nedbank’s website is entirely at your own risk Directors, officers and/or employees of any member of the Group may at any time, to the extent permitted by law, own or have a position in the financial instruments of any company or related company referred to herein, and may add to or dispose of any such position or act as a principal in any transaction in such financial instruments. Nedbank and/or its Affiliates may make a market in these instruments for its customers and for its own account. Accordingly, Nedbank and/or its Affiliates may have a position in any such instrument at any time. Directors, officers and/or employees of Nedbank and/or its Affiliates may also be directors of companies mentioned in this Report. Nedbank and/or its Affiliates may from time to time provide or solicit investment banking, underwriting or other financial services to, for or from any company referred to herein. The financial instruments referred to may not be suitable for the specific investment objectives, financial situation or individual needs of recipients and should not be relied upon in substitution for the exercise of independent judgement. It is recommended that you obtain independent advice if you are in doubt about such investments or investment services. This Report is intended for use by professional and sophisticated business investors only. Structured financial instruments are complex instruments, typically involve a high degree of risk and are intended for sale only to sophisticated investors who are capable of understanding and assuming the risks involved. The market value of any structured financial instrument may be affected by changes in economic, financial and political factors (including, but not limited to, spot and forward interest and exchange rates), time to maturity, market conditions and volatility, and the credit quality of a company or reference company. Any investor interested in purchasing a structured financial instrument/ product should conduct their own investigation and analysis of the product and consult with their own professional advisers as to the risks involved in making such a purchase. Some investments discussed in this Report may have a high level of volatility. High volatility investments may experience sudden and large falls in their value causing losses when that investment is realised. Those losses may equal your original investment. Indeed, in the case of some investments the potential losses may exceed the amount of initial investment and, in such circumstances, you may be required to pay more money to support those losses. Income yields from investments may fluctuate and, in consequence, initial capital paid to make the investment may be used as part of that income yield. Some investments may not be readily realisable and it may be difficult to sell or realise those investments, similarly it may prove difficult for you to obtain reliable information about the value, or risks, to which such an investment is exposed.] To our readers in the United Kingdom, this report has been issued by Nedbank Limited, a firm authorised by the Prudential Regulation Authority and regulated in the United Kingdom by the Financial Conduct Authority and the Prudential Regulation Authority. Nedbank Limited is a member of the Johannesburg Stock Exchange Limited (the ‘JSE', which is authorised and regulated by the JSE Limited. This Report is not for distribution to private customers. This Report has been issued in the United Kingdom only to persons of a kind described in Article 19 (5), 38, 47 and 49 of the Financial Services and Markets Act 2000 (Financial Promotion) Order 2005 (all such persons being referred to as 'relevant persons'). Any investment or investment activity to which this Report relates is only available to relevant persons and will be engaged in only with relevant persons. In other EEA countries, this Report has been issued to persons regarded as professional investors (or equivalent) in their home jurisdiction. This Report is not intended for use by, or distribution to, persons in the United States that do not meet the definition of a major US institutional investor under Rule 15a-6 under the US Securities Exchange Act of 1934 ('Rule 15a-6'). The financial instruments described herein may not have been registered under the US Securities Act of 1933 (the 'Securities Act') and may not be offered or sold in the United States unless they have been registered under the Securities Act, or pursuant to an exemption from, or in transactions not subject to, the registration requirements of the Securities Act, and in compliance with any applicable securities laws of any state or other jurisdiction of the United States. Any US persons or recipients of this Report located in the United States that are interested in trading financial instruments referred to in this Report should only effect such transactions through a US-registered broker-dealer. The distribution of this Report in certain jurisdictions may be prohibited or restricted by rules, regulations and/or laws of such jurisdictions and persons into whose possessions this presentation comes should inform themselves about and observe any such restrictions. Any failure to comply with such prohibitions or restrictions may constitute a violation of the laws of such other jurisdictions. All material presented in this Report, unless specifically indicated otherwise, is under copyright to Nedbank. None of the material, nor its content, nor any copy of it, may be altered in any way, transmitted to, copied or distributed to any other party, without the prior written permission of Nedbank. All trademarks, service marks and logos used in this Report are trademarks or service marks or registered trademarks or service marks of Nedbank or its Affiliates.