t-plastin, a cytoskeletal protein - universität zu...
TRANSCRIPT

T-plastin, a cytoskeletal protein with
important function in axonal growth,
acts as a modifier of spinal muscular atrophy
Inaugural-Dissertation
zur
Erlangung des Doktorgrades
der Mathematisch-Naturwissenschaftlischen Fakultät
der Universität zu Köln
vorgelegt von
Gabriela-Elena Oprea,
geborene Bordeianu
aus Bukarest
2007

Doctoral Thesis "Identification of T-plastin as Gene Modifier in SMA Discordant Families" was
performed primarily at the Institute of Human Genetics, University of Bonn from september 2002 to
march 2004 and at the Institute of Human Genetics, University of Cologne from march 2004 to 2007.
The microarray analysis was performed at the Institute of Genetics and Centre for Molecular Medicine
Cologne, and the genome scan analysis as well as all pyrosequences, were performed at the Cologne
Centre for Genomics (CCG). The confocal imaging was performed at the Institute for Biochemistry I,
University of Cologne and at the Centre for Molecular Medicine University of Cologne (CMMC).
Berichterstatter/in Prof. Dr. rer.nat. Brunhilde Wirth
Prof. Dr. rer. nat. Diethard Tautz
Tag der letzten mündlichen Prüfung: 5 Juni 2007

For my dear husband, Costy.

ACKNOWLEDGEMENTS
There are lots of people I would like to thank for a huge variety of reasons. Firstly, I would like to thank my Supervisor, Prof. Dr. Brunhilde Wirth for giving me the opportunity to work in her group and for her encouragement all through my doctoral studies. I could not have imagined having a better advisor and mentor for my PhD. Thank-you to my examiners, Prof. Dr. Diethard Tautz and Prof. Dr. Helmut Klein. I hearthly thank Prof. Dr. Peter Nürnberg and Gudrun Nürnberg for the wonderful collaboration and help on the genome-wide scan analysis; to Prof. Dr. J. L. Schultze and Dr. Svenia Debey with the excellent help on microarray analysis and data interpretation. I would like to deeply thank to all past and present members of the “SMA group”, especially to Sandra Kröber for her brilliant technical assistance, Frank Schönen for his kind help whenever asked, Heidrun Raschke for introducing me into the cell culture “world” and for her friendship, Markus Riessland for helpful and stimulating discussions and comments on the draft, Maike Warnstedt for critical reading the draft and for the huge help with German language whenever needed, to Irmgard Hölker for her friendship, good advice and encouragement, specially in hard moments. I especially thank to Mohammad Reza Tolliat for his excellent assistance with pyrosequencing. I am grateful to Dr. Francisco Rivero-Crespo for his advice in immunofluorescent experiments and for his kind help in handling the confocal microscope. I would like to say a big “thank-you” to Dr. Ramirez Alfredo for his help in establishing the setup for measuring axons length and whenever a question concerning fluorescence microscopy asked. I especially thank Nina Dalibor and Oddette Mukabayire-Kramer for their friendship, good advice and encouragement. I also warmly thank to all Romanian friends for their great support, encouragements, help, for wonderful holidays and for remanding me how active and full of surprises Romanian people are. I’ve missed you a lot, gays. The heartiest gratitude goes to my family for wonderful support and encouragements. On a different note, I would like to thank the coffee producers for keeping me thinking and for making me feel okay about drinking so much coffee. Finally, I owe my warmest thanks to my “male team” at home, my husband Costy, for his encouragement, throughout the whole course of my work, for his help to keep my foot always firmly on the ground. I will always love you. Thank you, and Be Well and Happy!

TABLE OF CONTENTS I
TABLE OF CONTENTS
TABLE OF CONTENTS
LIST OF ABBREVIATIONS
1. INTRODUCTION.……………………………………………………………..1
1.1. Clinical and pathological features of spinal muscular atrophy………………2
1.2. Survival motor neuron (SMN) gene.……………………………………………….3
1.3. Gene conversion, deletion and de novo mutations…………………………….6
1.4. Survival motor neuron transcripts....……………………………………………...7
1.5. The SMN protein and its functions……………………………………………….10
1.5.1. SMN complex……………………………………………………………………………………13
1.5.2. Motor neuron specific functions of the SMN protein………………………………………...19
1.5.3. Regulation of the SMN protein during development and cellular differentiation………….25
1.6. Animal models of SMA……………………………………………………………..26
1.7. Therapeutic prospects of SMA……………………………………………………27
1.8. SMA discordant families…………………………………………………………...30
2. AIMS………………………………………………………………………….35
3. SUBJECTS AND MATERIALS……………………………………………36
3.1. Patients samples…………………………………………………………………….36
3.2. Biological samples………………………………………………………………….37
3.3. Equipment……………………………………………………………………………37
3.4. Chemicals…………………………………………………………………………….39
3.5. Kits……………………………………………………………………………………..39
3.6. Reagents, enzymes and additional supplies for cell culture procedures…40
3.7. Primary antibodies…………………………………………………………………..41
3.8. Secondary antibodies………………………………………………………………41
3.9. Solutions and media………………………………………………………………...41
3.9.1. Frequently used buffers and solutions………………………………………………………..41

TABLE OF CONTENTS II
3.9.2. Media for eukaryotic and tissue culture procedures………………………………………….46
3.9.3. Media for prokaryotic cells………………………………………………………………………47
3.10. Software and databases……………………………………………………..47
3.11. Primers and siRNAs…………………………………………………………..48
4. METHODS……………………………………………………………………57
4.1. Prokaryotic cells……………………………………………………………………..57
4.1.1. Bacteriology……………………………………………………………………………………...57
4.1.2. Transformation of bacteria by heat-shock…………………………………………………….57
4.2. Eukaryotic cells………………………………………………………………………58
4.2.1. Cell culture……………………………………………………………………………………….58
4.2.1.1. EBV transformation of peripheral blood lymphocytes…………………………………..58
4.2.1.2. EBV-transformed lymphoblastoid cell culture……………………………………………58
4.2.1.3. Human fibroblasts cell culture……………………………………………………………..59
4.2.1.4. HEK293 cell culture…………………………………………………………………………59
4.2.1.5. PC12 cell culture…………………………………………………………………………….59
4.2.1.6. PC12 differentiation: treatment of PC12 cells with NGF………………………………..60
4.2.1.7. Cell harvesting and freezing……………………………………………………………….60
4.2.1.8. Cell thawing and recovering…………………………………………………………….....60
4.3. DNA techniques………………………………………………………………………61
4.3.1. Plasmid preparation (Mini prep) using Quantum Prep® Plasmid MiniPrep Kit
(Bio-Rad)………………………………………………………………………………………….61
4.3.2. DNA isolation from fresh blood…………………………………………………………………61
4.3.3. DNA isolation from cell culture…………………………………………………………….……62
4.3.4. DNA electrophoresis…………………………………………………………………………….62
4.3.4.1. Agarose gel………………………………………………………………………………….62
4.3.4.2. Sequencing gel……………………………………………………………………………...62
4.3.5. Construction of gene constructs and DNA cloning…………………………………………..63
4.3.6. Sequencing………………………………………………………………………………………64
4.3.6.1. Big-Dye sequencing………………………………………………………………………..64
4.3.6.2. Clean-up of dye-terminator sequencing reactions………………………………………64
4.3.6.3. Pyrosequencing……………………………………………………………………………..65
4.3.7. DNA modification: bisulfite treatment………………………………………………………….66
4.3.8. DNA amplification………………………………………………………………………………..67

TABLE OF CONTENTS III
4.3.8.1. Polymerase chain reaction (PCR)…………………………………………………………67
4.3.8.2. Reverse-transcription PCR (RT-PCR)…………………………………………………….68
4.3.8.3. Multiplex PCR………………………………………………………………………………..68
4.3.8.4. Nested PCR………………………………………………………………………………….68
4.3.8.5. PCR of bisulfite treated DNA………………………………………………………………69
4.3.8.6. PCR for genotyping…………………………………………………………………………70
4.3.9. PCR products purification……………………………………………………………………….70
4.3.10. DNA quantification by spectrophotometry…………………………………………………….70
4.3.11. DNA extraction from agarose gels…………………………………………………………… 71
4.3.12. DNA-protein interaction………………………………………………………………………….71
4.3.12.1. 32P labelling of oligonucleotide probe…………………………………………………71
4.3.12.2. In vivo footprinting………………………………………………………………………72
4.3.12.2.1. Genomic DNA isolation…………………………………………………………...72
4.3.12.2.2. Piperidine cleavage………………………………………………………………..73
4.3.12.2.3. Ligation-mediated PCR (LM-PCR)………………………………………………73
4.4. RNA techniques………………………………………………………………………75
4.4.1. RNA isolation……………………………………………………………………………………..75
4.4.1.1. RNA isolation from fresh blood…………………………………………………………….75
4.4.1.2. TRIzol method for RNA isolation from cell culture……………………………………….75
4.5. Autoradiography……………………………………………………………………..76
4.6. Protein biochemistry………………………………………………………………..76
4.6.1. Protein isolation, expression and purification………………………………………………..76
4.6.1.1. Bacterial overexpression: expression and purification of SMN-GST
fusion protein……………………………………………………………………………….76
4.6.1.2. Expression of T-plastin protein in the TNT® T7 Quick Coupled
Transcription/Translation Reaction (Promega)………………………………………….77
4.6.1.3. Protein isolation from fresh blood…………………………………………………………78
4.6.1.4. Protein isolation from cell culture using RIPA buffer (fibroblasts,
EBV-transformed lymphoblastoid cell lines, HEK293 cells, PC12 cells)……………..78
4.6.1.5. Protein isolation from cell culture using IP buffer (HEK293 cells, PC12 cells)…..…..78
4.6.2. Protein quantification by spectrophotometry (Bradford assay)……………………………..78
4.6.3. Generation of polyclonal antibody against T-plastin…………………………………………79
4.6.4. Protein analysis………………………………………………………………………………….79
4.6.4.1. SDS-PAGE electrophoresis……………………………………………………………….79
4.6.4.2. Antibodies……………………………………………………………………………………80

TABLE OF CONTENTS IV
4.6.4.3. Protein transfer………………………………………………………………………………81
4.6.4.4. Western blot………………………………………………………………………………….82
4.6.5. Protein-protein interaction………………………………………………………………………82
4.6.5.1. Co-immunoprecipitation…………………………………………………………………….82
4.6.5.2. Magne GSTTM Pull-Down assay…………………………………………………………...82
4.7. Cell transfection……………………………………………………………………...83
4.7.1. Transient transfection of T-plastin-V5-tagged plasmid in HEK293 and PC12 cells………83
4.7.2. Transient transfection of T-plastin siRNA oligos into PC12 cells…………………………..84
4.7.3. Co-transfection of T-plastin-V5-tagged plasmid DNA and SMN siRNA oligos
into PC12 cells…………………………………………………………………………………...84
4.8. Cell imaging…………………………………………………………………………..85
4.8.1. Immunocytochemistry (ICC)…………………………………………………………………….85
4.8.2. Confocal scanning fluorescence microscopy………………………………………………....86
4.8.3. Non-confocal fluorescence microscopy……………………………………………………….86
4.8.4. Measurement of neurite outgrowth…………………………………………………………….86
4.9. Microarray analysis………………………………………………………………….86
4.9.1. RNA Cleanup with RNeasy MinElute Cleanup Kit (Qiagen)………………………………...87
4.9.2. Quantification and analysis of purity of RNA………………………………………………….87
4.9.3. Synthesis of double stranded cDNA from total RNA…………………………………………88
4.9.3.1. First strand cDNA synthesis……………………………………………………………….88
4.9.3.2. Second strand cDNA synthesis……………………………………………………………88
4.9.3.3. Clean-up of double stranded cDNA with Sample Cleanup Module (Affymetrix)……..88
4.9.4. Synthesis and purification of biotin labelled cRNA…………………………………………...89
4.9.4.1. Synthesis of biotin labelled cRNA…………………………………………………………89
4.9.4.2. cRNA cleanup with Sample Cleanup Module (Affymetrix)……………………………..89
4.9.4.3. Quantifying the cRNA (IVT: in vitro transcription-product)……………………………..90
4.9.4.4. Checking unfragmented samples on gel electrophoresis………………………………90
4.9.5. Fragmenting cRNA for target preparation…………………………………………………….90
4.9.6. Target hybridization……………………………………………………………………………..90
4.9.7. Microarrays……………………………………………………………………………………….91
4.9.8. Fluidic station set up and experimental procedure…………………………………………..91
4.9.8.1. Preparing fluid station………………………………………………………………………92
4.9.8.2. SAPE staining solution……………………………………………………………………..92
4.9.8.3. Antibody solution mix……………………………………………………………………….92

TABLE OF CONTENTS V
4.9.8.4. Scanning the microarray……………………………………………………………………93
4.9.9. Array profile……………………………………………………………………………………….93
4.9.9.1. Instrument / software requirements……………………………………………………….93
4.9.9.2. Critical specification for HG-U133A 2.0 array……………………………………………93
4.9.10. Probe array image inspection…………………………………………………………………..94
4.9.11. Average background and noise values………………………………………………………..94
4.9.12. B2 oligo performance……………………………………………………………………………94
4.9.13. Poly-A controls: dap, lys, phe, thr, trp………………………………………………………….94
4.9.14. Hybridization controls: bioB, bioC, bioD and cre……………………………………………..95
4.9.15. Internal controls genes…………………………………………………………………………..95
4.9.16. Percent genes present…………………………………………………………………………..95
4.9.17. Scaling and normalization factors……………………………………………………………...95
4.9.18. Single array analysis…………………………………………………………………………….95
4.9.18.1. Detection algorithm……………………………………………………………………..96
4.9.18.2. Detection p-value……………………………………………………………………….96
4.9.18.3. Detection call……………………………………………………………………………96
4.9.18.4. Signal algorithm…………………………………………………………………………96
4.9.19. Comparison analysis (experiment vs. baseline arrays)…………………………………......97
4.9.19.1. Change algorithm……………………………………………………………………….97
4.9.19.2. Change p-value…………………………………………………………………………98
4.9.19.3. Change call………………………………………………………………………………98
4.9.19.4. Signal Log Ratio algorithm……………………………………………………………..98
4.9.19.5. The logic of logs…………………………………………………………………………98
4.9.19.6. Basic data interpretation……………………………………………………………….99
4.9.19.7. Interpretation of metrics………………………………………………………………..99
4.9.20. Online informatics resource…………………………………………………………………...100
4.9.21. Data analysis and software……………………………………………………………………100
4.10. Genome scan analysis……………………………………………………..100
4.10.1. Arrays……………………………………………………………………………………………100
4.10.2. Statistical analysis……………………………………………………………………………...101
4.10.2.1. Non-parametric linkage analysis using MERLIN software………………………..101
4.10.2.2. Parametric linkage analysis ………………………………………………………….101
4.11. Additional statistical methods…………………………………………….102
TABLE OF CONTENTS VI
5. RESULTS…………………………………………………………………..103
5.1. Search for SMA modifying factor(s) by candidate gene approach……….103
5.1.1. Selection of candidate genes…………………………………………………………………103
5.1.2. Selection of ZNF265 gene……………………………………………………………………103
5.1.3. Molecular analysis of ZNF265 gene in SMA discordant families…………………………104
5.1.4. Selection of hnRNP-R gene…………………………………………………………………..105
5.1.5. Molecular analysis of hnRNP-R at DNA and RNA level……………………………………163
5.1.6. Selection of HDAC6 gene……………………………………………………………………..173
5.1.7. Testing of DNA polymorphism in HDAC6 gene……………………………………………..108
5.2. Search for SMA modifying genes by differential expression
using Affymetrix microarray technology………………………………………108
5.2.1. The microarray screen for EBV-transformed lymphoblastoid cell RNAs revealed
up- and down-regulated genes in asymptomatic vs. symptomatic sibs in SMA
discordant families……………………………………………………………………………...109
5.2.2. Gene selection………………………………………………………………………………….111
5.2.3. Confirmation of microarray data by semi-quantitative RT-PCR …………………………..113
5.2.4. Validation of microarray-based results in another four SMA discordant families ……….114
5.2.5. Description of NR1I3 candidate……………………………………………………………….115
5.2.6. Description of T-plastin candidate…………………………………………………………….116
5.3. T-plastin, a potential gene modifier in SMA discordant families…………..121
5.3.1. T-plastin and SMN transcripts are expressed at high level in spinal cord
and muscles …………………………………………………………………………………….121
5.3.2. Characterization of T-plastin antibody ……………………………………………………….123
5.3.3. T-plastin is expressed in both EBV-transformed lymphoblastoid cells and
fresh blood belonging to unaffected sibs SMN1-deleted…………………………………...124
5.3.4. T-plastin is expressed in 6.5 % in the control population …………………………..……..125
5.3.5. Validation of the significant difference of T-plastin expression between
unaffected and affected sibs at protein level………………………………………………...127
5.3.6. Functional analysis of T-plastin protein………………………………………………………127
5.3.6.1. SMN and T-plastin associate together in vivo, but do not interact directly………….127
5.3.6.2. Endogenous SMN co-localizes with V5-tagged T-plastin in the perinuclear
area of HEK293 cells………………………………………………………………………130
5.3.6.3. T-plastin and SMN levels increase under NGF stimulation in PC12 cells…………..131
5.3.6.4. The affinity of T-plastin for SMN increases during neurite outgrowth………………..133
5.3.6.5. Endogenous T-plastin and SMN co-localize along neurites and at the

TABLE OF CONTENTS VII
growth cone level in PC12 cells-derived neurons………………………………………134
5.3.6.6. T-plastin-depleted PC12 cells exhibit a significant reduction in neurite length……..137
5.3.6.7. T-plastin overexpression in PC12 cells leads to an increase in size
of the neurites………………………………………………………………………………138
5.3.6.8. T-plastin overexpression is able to rescue partially the neurite length
in SMN-depleted PC12 cells……………………………………………………………...142
5.3.6.9. Molecular analysis of T-plastin coding region, promoter, 3’UTR and intron 1...…….144
5.3.7. Expression analysis of T-plastin gene………………………………………………………..144
5.3.7.1. T-plastin CpG island: quantitative evaluation of methylation
levels using pyrosequencing……………………………………………………………....145
5.3.7.2. In vivo footprinting of T-plastin enhancer in EBV-transformed
lymphoblastoid cells of SMA discordant families……………………………………….147
5.3.7.3. Haplotype analysis of the T-plastin genomic region revealed
a trans-acting mechanism to regulate its expression………………………………...…149
5.4. Search for modifying genes by genome-wide scan analysis………………153
5.4.1. Power simulation of the genome scan analysis……………………………………..………153
5.4.2. Non-parametric linkage data interpretation………………………………………………….154
5.4.3. Parametric linkage data interpretation……………………………………………………….155
5.4.4. Gene organization into categories according to their molecular function………………...156
6. DISCUSSION……………………………………………………………….158
6.1. ZNF265, hnRNP-R and HDAC6 are not responsible for
the phenotypic variability of the SMA discordant sibs…………………….158
6.2. T-plastin, a novel candidate gene detected by expression
Profiling analysis…………………………………………………………………..156
6.3. T-plastin is expressed in all unaffected sibs that carry SMN1
deletion/mutation and in 6.5 % of the control population…………………..162
6.4. T-plastin in activated by a trans-acting factor………………………………...163
6.5. T-plastin might play an important role during NMJ formation……………..164
6.6. T-plastin and SMN form a novel axon-specific complex……………………164
6.7. T-plastin is involved in neurite-like extension formation in
differentiated PC12 cells…………………………………………………………..167
6.8. Genome-wide scan in SMA discordant families revealed
the evidence for new susceptibility loci………………………………………..168

TABLE OF CONTENTS VIII
6.9. Future directions……………………………………………………………………171
7. SUMMARY………………………………………………………………….173
8. ZUSAMMENFASSUNG…………………………………………………...175
9. PUBLICATIONS, LECTURES AND POSTER CONTRIBUTIONS…..177
9.1. ORIGINAL PUBLICATIONS
9.2. PRINTED LECTURE CONTRIBUTIONS
9.3. PRINTED POSTER CONTRIBUTIONS
10. REFERENCES………………………………………………………….178
APPENDIX
Figures:
I. F1 Pedigrees of the SMA discordant families
II. F2 pcDNA 3.1_T-plastin_V5 vector map
III. F3 Human T-plastin transcript
IV. F4 T-plastin genomic region
V. F5 T-plastin promoter-1st exon-1st intron (1 kb) region after bisulfite treatment
VI. F6 T-plastin expression analysis by RT-PCR in 79 SMA patients
VII. F7 Simulation of the genome scan analysis under the assumption of recessive
mode of inheritance
VIII. F8 Simulation of the genome scan analysis under the assumption of dominant
mode of inheritance
IX. F9 Methylation status of T-plastin CpG sites in SMA discordant families
X. F10 Methylation status of T-plastin CpG sites in two control groups
XI. F11 Haplotype blocks within T-plastin genomic region
XII. F12 Motor axons defects in smn morphants are rescued by overexpression of
human T-plastin RNA

TABLE OF CONTENTS IX
Tables:
I. T1 Classical SMA patients checked for T-plastin expression
II. T2 Phenotypic and genotypic description of SMA discordant families used for genome-
wide scan
III. *T3 Up-regulated transcripts detected by microarray analysis in SMA discordant families
IV. *T4 Down-regulated transcripts detected by microarray analysis in SMA discordant
families
V. *T5 Up-regulated transcripts detected by microarray analysis in classical SMA patients
VI. *T6 Down-regulated transcripts detected by microarray analysis in classical SMA
patients
VII. *T7 Susceptibility regions detected by the genome-wide scan analysis in SMA
discordant families
VIII. *T8 Raw data for each chromosomal region detected by the genome-wide scan
analysis
IX. *T9 Raw data for methylation analysis of T-plastin CpG island in two control populations
X. *T10 Raw data for methylation analysis of T-plastin CpG island in SMA discordant
families
XI. *T11 Raw data for T-plastin haplotype blocks analysis
ERKLÄRUNG
CURRICULUM VITAE
*: The tables are contained in the attached CD-ROM.

LIST OF ABBREVIATION X
LIST OF ABBREVIATION
aa
A
ABPs
APS
bp
BSA
C
cDNA
cM
cm
CNS
DEPC
D-MEM
DMS
DMSO
DNA
DTT
EBV
EDTA
e.g.
EMG
ER
ESE
ESS
et al.
FBS
FCS
FL
FITC
FDA
For
FVC
G
g
GSH
GST
amino acid
adenine
ammonium persulphate
actin binding proteins
base pair
bovine serum albumin
cytosine
complementary DNA
centimorgan
centimeter
central nervous system
diethylpyrocarbonate
Dulbecco’s modified Eagle medium
dimethyl sulphate
dimethylsulfoxide
deoxyribonucleic acid
dithiotreitol
Epstein-Barr virus
ethylenediaminetetraacetic acid
exempli gratia
electromyography
endoplasmic reticulum
exonic splicing enhancer
exonic splicing silencer
et alii
fetal bovine serum
fetal calf serum
full length
fluorescein isothiocyanate
Food and Drug Administration
forward
forced vital capacity
guanine
acceleration due to gravity
glutathione
glutathione-S-transferase
LIST OF ABBREVIATION XI
h
HAT
HDAC
HMT
HPRT
ICC
i.e.
IP
IPTG
ISS
kb
kDa
l
LD
LMPCR
M
m
Mb
MBPs
min
ml
mm
mM
mRNA
NGF
ng
nm
NMJs
Nmol
NPL
nt
OMIM
PAGE
PBS
PCR
PFA
pH
pmol
hour
histone acetyltransferase
histone deacetylase
histone methyltransferase
hypoxanthine phosphoribosyltransferase
immunocytochemistry
id est
immunoprecipitation
isopropyl 1-thio-β-D-galactoside
intronic splicing silencer
kilobases
kilodalton
liter
linkage disequilibrium
ligation-mediated PCR
molar
milli-
megabases
methyl CpG binding proteins
minute
millilitre
millimeter
millimolar
messenger RNA
nerve growth factor
nanogram
nanometer
neuromuscular junctions
nanomol
non-parametric linkage
nucleotide
Online Mendelian Inheritance in Man
polyacrylamide gel electrophoresis
phosphate-buffered saline
polymerase chain reaction
paraformaldehyde
power of hydrogen
picomol

LIST OF ABBREVIATION XII
PPi
Rev
RNA
RNAi
rpm
RT
SAHA
SD
SDS
sDMA
SGs
siRNA
SMA
SMARD
SMN
SMN∆7
snoRNP
snRNPs
ss
T
TEMED
UTR
VPA
versus
µ
µg
µl
µM
µm
#
pyrophosphate
reverse
ribonucleic acid
RNA interference
revolutions per min
reverse transcription
suberoylanilide hydroxamid acid
standard deviation
sodium dodecyl sulphate
symmetrically dimethylated arginine
stress granules
small interfering RNA
autosomal recessive spinal muscular atrophy
SMA with respiratory distress
survival motor neuron
survival motor neuron protein lacking exon 7
small nucleolar ribonucleoproteins
small nuclear ribonucleoprotein
splice site
thymine
N,N,N’,N’-tetramethylethylenediamine
untranslated region
valproic acid
vs.
micro-
microgram
microliter
micromolar
micrometer
number

INTRODUCTION 1
1. INTRODUCTION
Spinal muscular atrophy (SMA) is an autosomal recessive neurodegenerative disease characterized by
loss of lower motor neurons in the anterior horn of the spinal cord, accompanied by progressive wasting of
associated muscles, and ultimately, paralysis. It is estimated to be the second most common autosomal
recessive disease with an overall incidence of around 1 in 10,000 live births and a carrier frequency that
may be as high as 1 in 35 (Cusin et al. 2003; Feldkotter et al. 2002). SMA exists in a broad spectrum
ranking from very severe infantile to very mild chronic forms of the disease, and is conventionally
classified into four groups (type I-IV) on the basis of age of onset and achieved motor milestones (Munsat
and Davies 1992). The mutational mechanism behind SMA, in around 94 % of typical cases, is lack of
SMN1 gene due to either SMN1 deletion or SMN1 to SMN2 conversion. Furthermore, around 35 different
small intragenic mutations have been reported (Ogino and Wilson 2004; Sun et al. 2005; Wirth 2000).
SMN1 is located on chromosome 5q13 in a highly complex genetic region containing a variety of
pseudogenes and repetitive elements due to an inverted duplication of approximately 500 kilobases. SMN
is present in two versions, SMN1 (telomeric) and SMN2 (centromeric) which differ by only one nucleotide
in the coding region. A transition of a cytosine to a thymine in SMN2 exon 7 alters the splicing pattern,
creating a truncated transcript (SMN∆7) which encodes a non-functional protein lacking the last 16
residues at the C-terminal end. The truncated SMN2 isoform is less stable and has a reduced self-
oligomerization activity (Lorson et al. 1998; Pellizzoni et al. 1998). As a consequence, the SMN2 gene
produces reduced amounts of full-length SMN that cannot fully compensate the absence of SMN1,
leading to specific degeneration of motor neurons in the spinal cord (Coovert et al. 1997; Lefebvre et al.
1997).
There are numerous other forms of spinal muscular atrophy which share certain characteristics with
proximal SMA, however, they are genetically distinct and often affect different subsets of neurons and
muscles. They include autosomal dominant forms of the disease (Sambuughin et al. 1998; van der
Vleuten et al. 1998), X-linked forms (Kobayashi et al. 1995; La Spada et al. 1991), recessive forms that
affect the distal muscles (Viollet et al. 2002), and a severe form of SMA with respiratory distress
(SMARD) (Grohmann et al. 2001).
In contrast to proximal SMA, spinal muscular atrophy with respiratory distress (SMARD) type I has been
linked to chromosome 11q13-q21 (Grohmann et al. 1999) with mutations in IGHMPP2 gene (Grohmann et
al. 2001). In SMARD1 distal muscles and upper limbs are more affected than in SMA, and the major
symptom is paralysis of the diaphragm (Grohmann et al. 1999). Spinal and bulbar muscular atrophy, also
called Kennedy’s disease, is a rare, adult-onset form of motor neuron disease that is less common than
proximal type I, II and III SMA. This X-linked form of spinal and bulbar muscular atrophy has a different
genotype and is associated with CAG repeat mutations (La Spada et al. 1991).
Interestingly, in rare cases homozygous absence of the SMN1 gene in unaffected siblings of patients with
SMA can be observed (Brahe et al. 1995; Cobben et al. 1995; Hahnen et al. 1995). The presence of
phenotypic discordance in SMA families is rare, mainly female-specific and can be found in some 10 % of

INTRODUCTION 2
families with type III SMA and 1.2 % of families with type II SMA (Wirth 2002). The finding that
homozygous deletion of SMN1 and identical SMN2 copy number present discordant phenotypes strongly
implies that additional factors, except for SMN1 and SMN2, are influencing the SMA phenotypes.
1.1. Clinical and pathological features of spinal muscular atrophy
SMA was first described in the 1890s by Guido Werdnig of the University of Vienna and Johann Hoffman
of Heidelberg University. Beginning with Byers and Banker (Byers and Banker 1961) the classification of
SMA according to severity was used to facilitate prognostication. The relationship between age of onset
and severity was supported by Dubowitz's observation (Dubowitz 1964): age of onset is the only means of
predicting outcome at the time of diagnosis. Based on the work of an international collaboration (Munsat
1995; Munsat and Davies 1992) most pediatric neurologists now use the following nomenclature:
I. Patients with type I SMA (Werdnig-Hoffman disease) for the symptoms before age 6
months is characterized by severe generalized muscle hypotonia. Patients never
achieve the ability to sit, and death usually occurs from respiratory insufficiency within
the first two years without respiratory support.
II. Patients with type II SMA (intermediate) have onset after 6 months of age and before
18 months of age. They achieve the ability to sit unsupported but never stand or walk
unaided. Prognosis in this group is largely dependent of the degree of respiratory
involvement.
III. Patients with type III SMA (Kugelberg-Welander disease) usually have their first
symptoms between 18 months of age and early childhood. They are able to stand and
walk independently at some point during their disease course but often become
wheelchair bound during youth or adulthood. Life expectancy is not usually reduced in
this group.
IV. Patients with type IV SMA have onset in late childhood or adulthood (as late as the fifth
or sixth decades).
The clinical symptoms in all four groups of SMA include:
• hypotonia;
• symmetrical muscle weakness and atrophy (predominantly of proximal muscle of the shoulder and
pelvic girdle);
• tremor of fingers and hands;
• fasciculation of the tongue muscles;
• hyporeflexia and, at a later stage, contractures of some muscle groups. The diaphragm and
extraocular muscles remain unaffected until late stages of the disease and there is little or no
impairment of sensory system (Hausmanowa-Petrusewicz et al. 2000; Zalewska and
Hausmanowa-Petrusewicz 2000).
The symptoms are due to the selective degeneration of alpha motor neurons in the spinal cord and cranial

INTRODUCTION 3
motor nuclei, leading to the progressive muscle weakness, atrophy and paralysis. Patients with SMA tend
to have the greatest rate of loss of muscle power at disease onset (Crawford 2004). This may manifest as
a period during which there is clear loss of strength or there may be only the absence of normal motor
milestone gains with early growth and development. After this early phase, the rate of loss of muscle
strength may slow or stabilize for many years in surviving patients. A recent study indicates that the rate of
motor neuron loss may mirror this clinical disease course (Swoboda et al. 2005).
1.2. Survival motor neuron (SMN) gene
Identifying the genes involved in SMA was complicated by the highly complex and unstable nature of the
genome region where they are localized and by phenotypes that range in severity from the very severe
(type I) to intermediate (type II) and to very mild (type III and IV) (Pearn 1980).
Linkage of autosomal recessive SMA to chromosome 5q11.2-q13.3 was reported in 1990 (Brzustowicz et
al. 1990; Melki et al. 1990). One feature of the DNA region containing the SMA gene is that it contains
numerous repeated genes and markers. Moreover, the genetic marker loci and genes have very similar
copies of each other. This critical region is prone to de novo genomic rearrangements including unequal
crossing-over, intrachromosomal rearrangements and gene conversions (Melki et al. 1994b; Wirth et al.
1997a). This region was shown to contain a complex genomic structure with an inverted and duplicated
DNA segment of about 500 kb (Lefebvre et al. 1995). Each 500 kb segment, which can be present in 0 to
4 copies per chromosome contains 5 genes:
1. the survival of motor neuron gene (SMN);
2. the BIRC1 (baculoviral IAP repeat-containing 1) gene, also known as NAIP (neuronal
apoptosis inhibitory protein);
3. the SERF1 (small EDRK-rich factor 1) gene, also known as H4F5;
4. the GTF2H2 (general transcription factor II H) gene or p44;
5. the OCLN (occludin) gene.
The polymorphic region is proximally flanked by the unique gene RAD17 and distally by TFNR gene
(Kelter et al. 2000) (Fig. 1).
Fig. 1 Diagram of the “SMA region” showing the duplication pattern along the scale (in Mb) and the
gene content of the region. Interchromosomal (red) and intrachromosomal duplications (blue) are
indicated (Schmutz et al. 2004).
INTRODUCTION 4
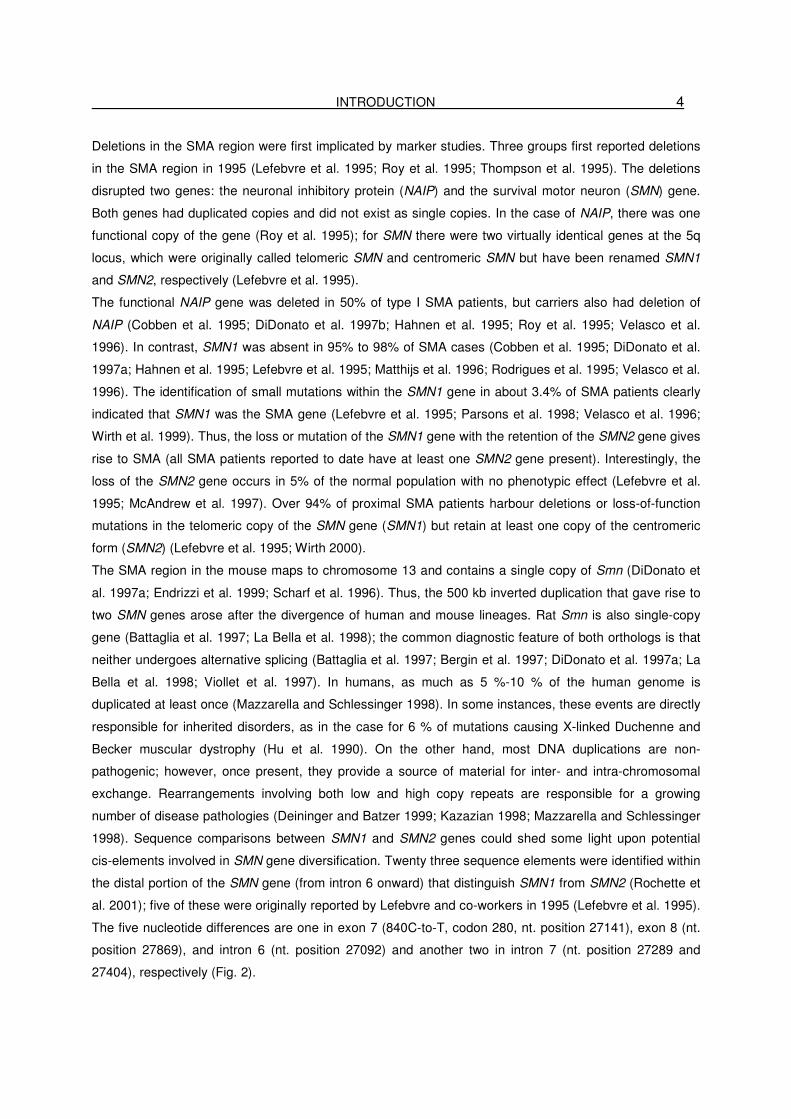
Deletions in the SMA region were first implicated by marker studies. Three groups first reported deletions
in the SMA region in 1995 (Lefebvre et al. 1995; Roy et al. 1995; Thompson et al. 1995). The deletions
disrupted two genes: the neuronal inhibitory protein (NAIP) and the survival motor neuron (SMN) gene.
Both genes had duplicated copies and did not exist as single copies. In the case of NAIP, there was one
functional copy of the gene (Roy et al. 1995); for SMN there were two virtually identical genes at the 5q
locus, which were originally called telomeric SMN and centromeric SMN but have been renamed SMN1
and SMN2, respectively (Lefebvre et al. 1995).
The functional NAIP gene was deleted in 50% of type I SMA patients, but carriers also had deletion of
NAIP (Cobben et al. 1995; DiDonato et al. 1997b; Hahnen et al. 1995; Roy et al. 1995; Velasco et al.
1996). In contrast, SMN1 was absent in 95% to 98% of SMA cases (Cobben et al. 1995; DiDonato et al.
1997a; Hahnen et al. 1995; Lefebvre et al. 1995; Matthijs et al. 1996; Rodrigues et al. 1995; Velasco et al.
1996). The identification of small mutations within the SMN1 gene in about 3.4% of SMA patients clearly
indicated that SMN1 was the SMA gene (Lefebvre et al. 1995; Parsons et al. 1998; Velasco et al. 1996;
Wirth et al. 1999). Thus, the loss or mutation of the SMN1 gene with the retention of the SMN2 gene gives
rise to SMA (all SMA patients reported to date have at least one SMN2 gene present). Interestingly, the
loss of the SMN2 gene occurs in 5% of the normal population with no phenotypic effect (Lefebvre et al.
1995; McAndrew et al. 1997). Over 94% of proximal SMA patients harbour deletions or loss-of-function
mutations in the telomeric copy of the SMN gene (SMN1) but retain at least one copy of the centromeric
form (SMN2) (Lefebvre et al. 1995; Wirth 2000).
The SMA region in the mouse maps to chromosome 13 and contains a single copy of Smn (DiDonato et
al. 1997a; Endrizzi et al. 1999; Scharf et al. 1996). Thus, the 500 kb inverted duplication that gave rise to
two SMN genes arose after the divergence of human and mouse lineages. Rat Smn is also single-copy
gene (Battaglia et al. 1997; La Bella et al. 1998); the common diagnostic feature of both orthologs is that
neither undergoes alternative splicing (Battaglia et al. 1997; Bergin et al. 1997; DiDonato et al. 1997a; La
Bella et al. 1998; Viollet et al. 1997). In humans, as much as 5 %-10 % of the human genome is
duplicated at least once (Mazzarella and Schlessinger 1998). In some instances, these events are directly
responsible for inherited disorders, as in the case for 6 % of mutations causing X-linked Duchenne and
Becker muscular dystrophy (Hu et al. 1990). On the other hand, most DNA duplications are non-
pathogenic; however, once present, they provide a source of material for inter- and intra-chromosomal
exchange. Rearrangements involving both low and high copy repeats are responsible for a growing
number of disease pathologies (Deininger and Batzer 1999; Kazazian 1998; Mazzarella and Schlessinger
1998). Sequence comparisons between SMN1 and SMN2 genes could shed some light upon potential
cis-elements involved in SMN gene diversification. Twenty three sequence elements were identified within
the distal portion of the SMN gene (from intron 6 onward) that distinguish SMN1 from SMN2 (Rochette et
al. 2001); five of these were originally reported by Lefebvre and co-workers in 1995 (Lefebvre et al. 1995).
The five nucleotide differences are one in exon 7 (840C-to-T, codon 280, nt. position 27141), exon 8 (nt.
position 27869), and intron 6 (nt. position 27092) and another two in intron 7 (nt. position 27289 and
27404), respectively (Fig. 2).

INTRODUCTION 5
Fig. 2 Genomic structure, nucleotide, and splicing differences between SMN1 and SMN2. The SMN
gene copies can be distinguished by 5 nucleotide exchanges, of which only the C-to-T transition in
exon 7 is localized within the coding region. This nucleotide exchange in exon 7 is a translationally
silent mutation. Therefore, full-length SMN1 and full-length SMN2 mRNA encode identical proteins.
However, the C-to-T transition disrupts an exonic splicing enhancer resulting in alternative
splicing of SMN2 pre-mRNA and skipping of exon 7. SMN2∆7 transcripts encode a truncated and
unstable protein (Wirth et al. 2006a).
SMN gene duplication occurred after the divergence of rodents and primates about 75-110 million years
ago but prior to the separation of human and chimpanzee lineages more than 5-7 million years ago
(Bergstrom et al. 1998; Gagneux et al. 1999; Horai et al. 1995). This duplication does not appear to have
an obvious phenotypic effect, and the presence of two SMN genes may have provided a selective
advantage; whereas ablation of the single ancestral SMN gene in the mouse causes embryonic lethality
(Schrank et al. 1997), the presence of SMN2 provides partial compensation in human as demonstrated by
the finding that human fetuses with SMA develop much further and much longer than Smn-deficient mice
(Crawford and Pardo 1996). As many as 20 %-50 % of duplicated genes are preserved but are subjected
to loss-of-function mutations that led to gene diversification (Lynch and Conery 2000). The C-to-T
mutation in exon 7 of the SMN2 gene probably represents one such loss-of-function mutation, precluding
SMN2 from completely complementing the loss of SMN1 (Rochette et al. 2001).
Some 3.4 % of patients with SMA are compound heterozygotes with a deletion of SMN1 on one
chromosome and an intragenic SMN1 mutation on the other chromosome (Wirth et al. 1999). About 35
subtle mutations have been identified so far, many of these being missense mutations shown to disturb
the proper function of the SMN1 protein (Buhler et al. 1999; Lorson and Androphy 1998; Sun et al. 2005).
About 4 % of patients showing a clear SMA phenotype undistinguishable from proximal SMA fail to show
any mutation within the SMN1 gene pointing towards genetic heterogeneity (Wirth et al. 1999).

INTRODUCTION 6
1.3. Gene conversion, deletion and de novo mutation
Homozygous absence of either SMN1 in patients with SMA or of SMN2 in controls can be the result of two
different mechanisms: deletion or gene conversion (Burghes 1997; Wirth et al. 1997a; Wirth et al. 1997b).
Approximately 50 % of type I SMA patients have a single copy of SMN2 on each chromosome, so that the
SMN1 gene is deleted and SMN2 copy number is unaffected (DiDonato et al. 1994; Lefebvre et al. 1995;
Melki et al. 1994a; Wirth et al. 1995b). The genotype of one SMN2 copy on each chromosome, together
with the loss of NAIP, occurs only on type I SMA chromosomes and implies a large deletion (Burlet et al.
1996; DiDonato et al. 1994; Lefebvre et al. 1995; Melki et al. 1994b; Rodrigues et al. 1996; Wirth et al.
1995a). In type II and type III SMA although patients lack SMN1, they most often have one chromosome
with one copy of SMN2 and have the other chromosome with two copies of SMN2 (Fig. 3) (DiDonato et al.
1994; Wirth et al. 1995a). In type II and III SMA, the SMN1 gene is missing, but the NAIP gene is present,
as are the markers that lie in the 5' end of the SMN1 gene.
Ag1-CA C212 C212 Ag1-CAAg1-CA C212 C212 Ag1-CA
Majority of type I
SMA patients
Majority of type II
and III SMA patients
Majority of type I
SMA patients
Majority of type II
and III SMA patients
Normal 5q chromosome SMN2 SMN1
Ag1-CA C212 C212 Ag1-CAAg1-CA C212 C212 Ag1-CA
Majority of type I
SMA patients
Majority of type II
and III SMA patients
Majority of type I
SMA patients
Majority of type II
and III SMA patients
Ag1-CA C212 C212 Ag1-CAAg1-CA C212 C212 Ag1-CAAg1-CA C212 C212 Ag1-CAAg1-CA C212 C212 Ag1-CA
Majority of type I
SMA patients
Majority of type II
and III SMA patients
Majority of type I
SMA patients
Majority of type II
and III SMA patients
Normal 5q chromosome SMN2 SMN1
Fig. 3 Schematic representation of the most frequently observed SMA chromosomes in acute SMA
(type I) and mild SMA (type II/III). While type I SMA chromosomes usually carry true SMN1
deletions on both 5q13 homologs, type II and III SMA chromosomes carry either on one or on both
5q13-homologs an increased SMN2 copy number caused by gene conversion of SMN1 into SMN2
(Wirth 2000).
Because the SMN1 gene is not detected but the markers reveal that the locus is still present, another
mechanism besides deletion of SMN1 must be operating; the most likely mechanism is conversion of
SMN1 to SMN2. Because the SMN1 gene is absent in all SMA types, the increase in SMN2 copy number
indicates that a large number of type II and III SMA chromosomes contain a converted allele, rather than a
deleted allele. In conversion of SMN1 to SMN2, there is gain of copy number of SMN2, which will alter the

INTRODUCTION 7
distribution of SMN2 alleles; deletion of SMN1 will not alter the distribution of SMN2 alleles. Chimeric
genes have been identified as SMA alleles and can arise by one of two mechanisms:
1. a deletion that removes the material between the SMN1 and SMN2 gene and fuses the 5' end of
the SMN2 gene to the 3' end of the SMN1 gene or,
2. a conversion event that effects exon 7, but not exon 8 of the SMN1 gene (Hahnen and Wirth
1996).
The chimeric genes formed by deletion and joining of the SMN2 to SMN1 are severe-SMA alleles.
Hahnen et al. (1996) showed that chimeric SMN genes can occur in type I SMA chromosomes such that
there is one chimeric gene on one chromosome 5 (evidence is based on marker studies). Gene
conversion leads to an increase of copy number of either SMN1 or SMN2, with simultaneous decrease of
the SMN counterparts. When SMN1 is converted into SMN2, the chromosomes carry two SMN2 copies
and no SMN1. When SMN2 is converted into SMN1 the chromosomes carry two SMN1 copies and no
SMN2. In the first case an “SMA chromosome” with an increased number of SMN2 is generated, in the
second case a “normal chromosome” with two SMN1 genes on one chromosome will arise. Additionally, a
high percentage of unequal crossing-over, causing either deletions or duplications can be observed in the
region that arise as a consequence of the polymorphic character of the 500 kb repeated units. These
mechanisms are also responsible for about 2 % of de novo mutations observed among patients with SMA.
1.4. Survival motor neuron transcripts
Almost every protein-coding gene in humans is interspersed by non-coding sequences, known as introns.
Splicing is the post-transcriptional process in which these introns are excised from precursor mRNA
molecules (pre-mRNA) and the coding exons are ligated (Horiuchi and Aigaki 2006).
The SMN gene is ubiquitously expressed. SMN1 produces mainly full-length transcripts that contain all
nine exons (1, 2a, 2b, 3-8) whereas SMN2 produces mainly alternatively spliced transcripts that lack exon
7 and carry only a small amount (~10%) of full-length (FL) transcripts (Burglen et al. 1996; Helmken et al.
2003; Lefebvre et al. 1995). FL-SMN transcripts derived from both SMN copies encode an identical FL-
SMN protein composed of 294 amino acids, with a stop codon located in exon 7. In comparison, the
SMN2∆7 transcripts encode a truncated SMN protein of 282 amino acids, with a C-terminus that differs
from the FL-SMN protein by the last 4 amino acids. The truncated protein is unstable and shows a
reduced oligomerization capacity which has been shown to be essential for the proper SMN function
(Burglen et al. 1996; Lefebvre et al. 1995; Lorson and Androphy 1998; Lorson et al. 1999; Lorson et al.
1998). Additionally, both SMN genes produce very low amounts of alternatively spliced transcripts lacking
either exon 3, exon 5 or both (Gennarelli et al. 1995). Skipping of these exons produces in frame proteins
lacking the respective encoded domains. Especially the loss of exon 3 is of particular interest, since the
corresponding region contains a so called Tudor domain that is essential for the interaction of SMN with
Sm proteins. Absence or missense mutations within the Tudor domain either abolish or reduce the ability
of SMN to interact with Sm proteins (Buhler et al. 1999; Mohaghegh et al. 1999; Sun et al. 2005).

INTRODUCTION 8
SMN exon 7 spans 54 nucleotides and harbours a stop codon at nt position 49 to 51. The last position of
exon 7 is an adenosine residue, which places exon 7 into the minor group of internal exons lacking a 3'-
end G residue (Burge et al. 1999). Exon 7 is characterized by a weak 3'ss due to a suboptimal
polypyrimidine tract (Lim and Hertel 2001). Correct splicing of exon 7 depends on various cis-acting
elements (enhancers and silencers) localized within exon 7 as well as within the introns 6 and 7 (Cartegni
and Krainer 2002; Hofmann et al. 2000; Hofmann and Wirth 2002; Kashima and Manley 2003; Lorson and
Androphy 2000; Lorson et al. 1999; Miyaso et al. 2003; Young et al. 2002b). They are recognized by
various splicing factors, SR and SR-like proteins as well as hnRNPs (Cartegni and Krainer 2002; Helmken
et al. 2003; Hofmann et al. 2000; Hofmann and Wirth 2002; Young et al. 2002b). Most of the elements
seem to be highly conserved and are also involved in pre-mRNA splicing of the murine Smn gene
(DiDonato et al. 2001). There is no tissue specificity observed concerning the ratio of FL-SMN vs. SMN∆7
in a certain individual as demonstrated by quantitative RT-PCR (Helmken et al. 2003; Lorson et al. 1999).
In 1999, Lorson and colleagues demonstrated that C-to-T transition in exon 7 is sufficient to cause
skipping of this exon of the SMN2 gene. They constructed wildtype SMN1 and SMN2 minigenes (exon 6
to exon 8) as well as hybrid minigenes in which the five nucleotide differences were exchanged one by
one either on the SMN1 background with SMN2 specific nucleotides or vice-versa, followed by in vivo
splicing and analysis of SMN transcripts (Lorson et al. 1999). They demonstrated that an exonic splicing
enhancer (ESE) is disrupted by the C-to-T exchange within the SMN2 gene, thus being responsible for the
alternative splicing (Lorson and Androphy 2000; Lorson et al. 1999). Later, Cartegni and Krainer stated
that the C-to-T exchange lies within a conserved heptamer motif, an ESE, CAGACAA, which is directly
recognized by the SR-rich splicing-factor SF2/ASF in SMN1, but not in SMN2 derived transcripts. UV-
crosslinking experiments showed specific interaction of SF2/ASF with exon 7 SMN1 but not with SMN2,
thus promoting exon 7 inclusion (Cartegni and Krainer 2002). In contrast to these findings, the group of
Manley demonstrated that the C-to-T exchange in SMN2 creates a new exonic splicing silencer rather
than disrupting an ESE, which finally functions as a binding site for the repressor protein hnRNP-A1. It has
been shown that the reduction of hnRNP-A1 in HeLa cells by RNA interference promotes exon 7 inclusion
in SMN2. Using in vitro UV-cross linking, hnRNP-A1 was found to bind exon 7 of SMN2 but not of SMN2
(Kashima and Manley 2003). A controversial debate is still ongoing and further experiments have to prove
which of the hypotheses is correct. Meanwhile, Singh and colleagues showed that the 5' end of exon 7
contains an extended inhibitory context composed of several overlapping sequence motifs. Together, they
regulate a larger sequence than the hnRNP-A1 binding site (Singh et al. 2004a, b).
In addition to the 5' end ESE and/or ESS, another ESE is found in the center of exon 7 that binds the SR-
like splicing factor Htra2-β1 (Hofmann et al. 2000). Htra2-β1 is the ortholog of D. melanogaster tranformer-
2 (Tra 2), a gene essential for sex differentiation which is regulated by alternative splicing (Baker 1989). It
is likely to be an important developmental regulator of alternative splicing that acts by binding to purine-
rich elements in or near exons (Tacke et al. 1998). Tra2-β1 binds and enhances the incorporation of a
novel testis-specific alternative exon of the homeodomain- interacting protein kinase HipK3 (HipK3-T) and
promotes exclusion of another exon in the HipK3 gene, the ubiquitous alternative (U) exon (Venables et

INTRODUCTION 9
al. 2005). A similar situation was recently reported, whereby Tra2-β1 promotes inclusion of exon 10 and
exclusion of exon 2 of the important neural protein Tau (Wang et al. 2005).
The gene for Htra2-β has been mapped to chromosome 3q26.2-q27, contains 10 exons, and the coding
region spans 21 kb (Nayler et al. 1998). RT-PCR and analysis of Htra2-β cDNA indicated that at least four
different Htra2-β isoforms are generated by alternative splicing: Htra2-β1 (exons 1, 3-10), Htra2-β2 (exons
1-2), Htra2-β3 (exons 1,4-10), and Htra2-β4, which is generated by over reading the polyadenylation
signal in exon 2a using the 5’ splice site of exon 2b (Nayler et al. 1998). Two of these isoforms, Htra2-β3
and Htra2-β4, appear to be tissue-specific and developmentally regulated, whereas Htra2-β1 and Htra2-
β2 are ubiquitously expressed bearing high levels in brain and testis (Nayler et al. 1998). Protein-RNA
binding experiments showed a strong interaction of Htra2-β1 with the GA-rich region localized in the
center of exon 7 of SMN1 and SMN2 producing correctly spliced transcripts (Hofmann et al. 2000;
Hofmann and Wirth 2002). In addition, the splicing factor SRp30 (an SR-rich splicing factor) as well as
hnRNP-G and RPM (belonging to the group of hnRNPs) directly bind Htra2-β1 and further enhance the
inclusion of exon 7 (Hofmann and Wirth 2002; Young et al. 2002b) (Fig. 4).
Fig. 4 Splicing regulation of SMN exon 7. (A) SMN1 exon 7 contains a heptamer sequence (SE1) at
the 5’ end that is recognized by the SR-protein SF2/ASF. (B) In SMN2, the C-to-T transition disrupts
the critical heptamer sequence within SE1, and the splicing factor SF2/ ASF cannot bind anymore
to exon 7, which results in skipping of this exon. Furthermore, the C-to-T transition in SMN2 exon
7 promotes an inhibitory effect of hnRNP-A1 and thus facilitates the exclusion of exon 7 (Wirth et
al. 2006b).

INTRODUCTION 10
Both SMN1 and SMN2 contain an ESE in the central part of exon 7 (SE2) that is recognized by Htra2-β1
and its interacting partners hnRNP-G and SRp30c. Overexpression of the SE2-dependent splicing factors
restores FL-SMN2 transcript to about 80 %. At the 3’end of exon 7, another exonic splicing enhancer
(SE3) has been identified. Furthermore, intron 7 contains an ISS (ISS-N1) that exerts its function on the
positive acting exonic and intronic elements (curved arrows in Fig. 4). The trans-acting splicing factors that
bind the intronic splicing elements or SE3 are not yet identified (Wirth et al. 2006a).
The abundant heterogeneous nuclear ribonucleoproteins (hnRNPs) that coat nascent transcripts often
inhibit splicing, and the effect of Tra2-β1 on the splicing of tau and SMN is antagonized by hnRNP-A1 and
hnRNP G (Andreadis 2005; Hofmann et al. 2000; Hofmann and Wirth 2002; Kashima and Manley 2003;
Nasim et al. 2003; Venables et al. 2000). This network of splicing factor binding to the central ESE in exon
7 is the most likely responsible for the 10-15 % FL-mRNA generated by SMN2. Overexpression of these
splicing factors either separate or in combination restores the splicing capacity of SMN2 minigenes up to
80 % and substantially increases endogenous SMN protein levels (Brichta et al. 2003; Hofmann et al.
2000; Hofmann and Wirth 2002). A potential therapy of SMA based on the modulation of the SMN2
splicing pattern that increases FL-SMN levels has been hypothesized (Hofmann et al. 2000).
Exon 7 skipping in SMN2 is furthermore facilitated by two intronic splicing silencer localized in intron 6
from -112 to -68 bp (element 1) and intron 7 from +59 to +72 (element 2) (Miyajima et al. 2002; Miyaso et
al. 2003). However, mutations or deletions within these regions do not affect the correct splicing of wild
type SMN1 pre-mRNA. A 33 kD protein has been shown to interact with element 1 of SMN2 but not of
SMN1. Element 2 possesses a characteristic stem-loop structure, in which the correct matching of the
nucleotides within the stem is essential. In these works, other genes with a complete matching of the
nucleotides within the stem-loop have been identified, although the experimental proof for the role in the
regulation of splicing still has to be given (Miyajima et al. 2002; Miyaso et al. 2003).
1.5. The SMN protein and its functions
SMN is a ubiquitously expressed protein with a molecular weight of 38kDa. It has been highly conserved
through evolution. In humans, SMN is a protein found in the cytoplasm and the nucleus of cells, where it is
present throughout the nucleoplasm and is highly enriched within discrete bodies called gems (for
“Gemini” of Cajal bodies) (Liu and Dreyfuss 1996).
SMN protein is encoded by eight exons generating a multidomain polypeptide. It contains the central
Tudor domain (encoded by exon 3) flanked by a N-terminal lysine (K)-rich sequence (encoded by exon 2)
and in the C-terminal regions, by a proline (P)-rich region (encoded by exons 4 and 5), a tyrosine-glycine
(YG)-box (encoded by exon 6) and the exon 7 encoded domains. Missense mutations have been
identified in several of these regions, suggesting that each of these domains may be functionally
important. The Tudor domain, named because of its structural homology to repeats of the Drosophila
tudor protein, is conserved among different RNA-binding proteins (Ponting 1997; Selenko et al. 2001) and

INTRODUCTION 11
Table 1 The SMN protein is present as part of a large macromolecular complex containing a
number of common core components and a set of transiently or substoichiometrically interacting
partners.
SMN complex component
Direct/Indirect SMN interaction
Function Reference
Core components
Gemin1 (SMN) + (Liu et al. 1997; Lorson et
al. 1998)
Gemin2 (SIP 1) + snRNP biogenesis and pre-mRNA splicing
(Liu et al. 1997)
Gemin3 (DP103) + snRNP biogenesis and pre-mRNA splicing
(Campbell et al. 2000;
Charroux et al. 1999)
Gemin4 (GIP1) - snRNP biogenesis and pre-mRNA splicing
(Charroux et al. 2000;
Meister et al. 2000)
Gemin5 (p175) + snRNP biogenesis and pre-mRNA splicing s
(Gubitz et al. 2002)
Gemin6 - snRNP biogenesis and pre-mRNA splicing
(Pellizzoni et al. 2001b)
Gemin7 + snRNP biogenesis and pre-mRNA splicing
(Baccon et al. 2002)
Gemin8 - snRNP biogenesis and pre-mRNA splicing
(Carissimi et al. 2006)
unrip - snRNP biogenesis and pre-mRNA splicing
(Grimmler et al. 2005;
Meister et al. 2001b)
Substrates and substoichiometric components
Sm proteins + snRNP biogenesis and pre-mRNA splicing
(Friesen and Dreyfuss
2000; Liu et al. 1997)
LSm4 + snRNP biogenesis and pre-mRNA splicing
(Brahms et al. 2001;
Friesen and Dreyfuss
2000)
Fibrillarin + Assembly of snoRNPs (Jones et al. 2001;
Pellizzoni et al. 2001a)
GAR1 + Assembly of snoRNPs (Pellizzoni et al. 2001a)
Coilin + Recruitment of SMN to Cajal bodies (Hebert et al. 2001)
U1-A, U2-A’ unknown snRNP biogenesis (Liu et al. 1997)
Profilin + Control of actin dynamics (Giesemann et al. 1999)
ZPR1 (zinc-finger protein 1)
+ Caspase activation and apoptosis; snRNP assembly/maturation
(Gangwani et al. 2001)
OSF (Osteoclast-stimulating factor)
+ Regulation of osteoclast formation and activity
(Kurihara et al. 2001)
Nucleolin and B23 - Cell growth and proliferation control, programmed cell death, cell surface signal transduction, and differentiation and maintenance of neural tissues
(Lefebvre et al. 2002)
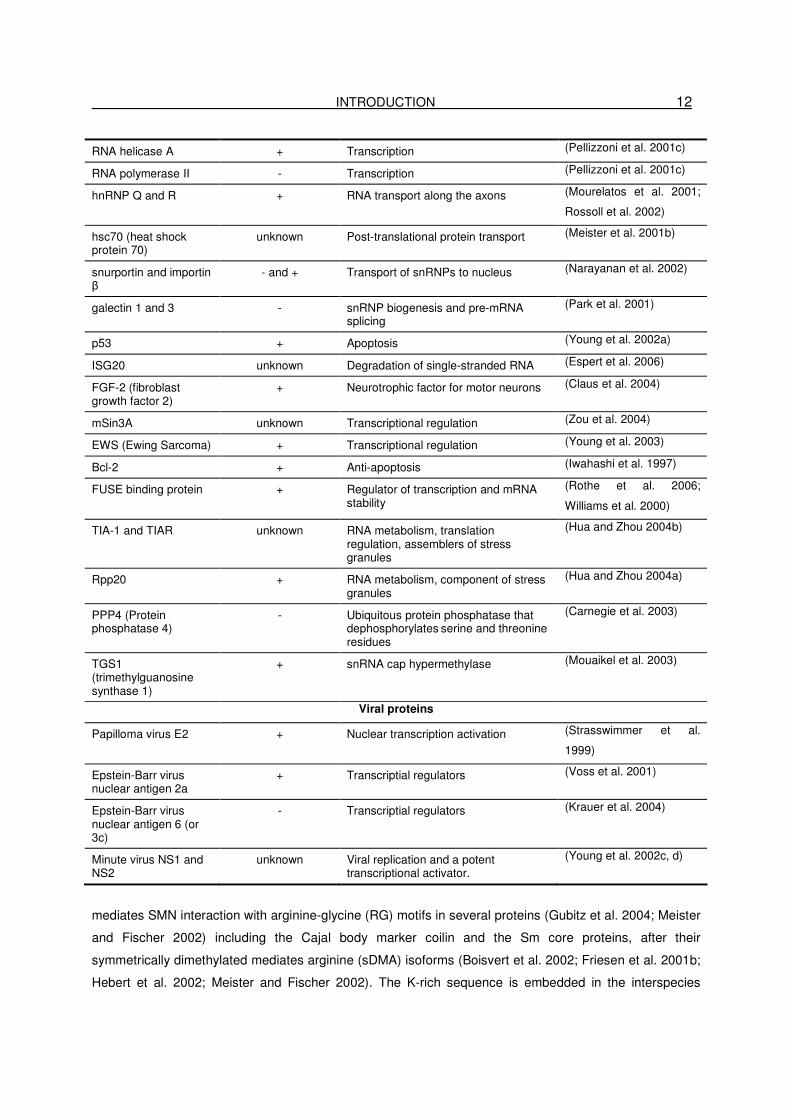
INTRODUCTION 12
RNA helicase A + Transcription (Pellizzoni et al. 2001c)
RNA polymerase II - Transcription (Pellizzoni et al. 2001c)
hnRNP Q and R + RNA transport along the axons (Mourelatos et al. 2001;
Rossoll et al. 2002)
hsc70 (heat shock protein 70)
unknown Post-translational protein transport (Meister et al. 2001b)
snurportin and importin β
- and + Transport of snRNPs to nucleus (Narayanan et al. 2002)
galectin 1 and 3 - snRNP biogenesis and pre-mRNA splicing
(Park et al. 2001)
p53 + Apoptosis (Young et al. 2002a)
ISG20 unknown Degradation of single-stranded RNA (Espert et al. 2006)
FGF-2 (fibroblast growth factor 2)
+ Neurotrophic factor for motor neurons (Claus et al. 2004)
mSin3A unknown Transcriptional regulation (Zou et al. 2004)
EWS (Ewing Sarcoma) + Transcriptional regulation (Young et al. 2003)
Bcl-2 + Anti-apoptosis (Iwahashi et al. 1997)
FUSE binding protein + Regulator of transcription and mRNA stability
(Rothe et al. 2006;
Williams et al. 2000)
TIA-1 and TIAR unknown RNA metabolism, translation regulation, assemblers of stress granules
(Hua and Zhou 2004b)
Rpp20 + RNA metabolism, component of stress granules
(Hua and Zhou 2004a)
PPP4 (Protein phosphatase 4)
- Ubiquitous protein phosphatase that dephosphorylates serine and threonine residues
(Carnegie et al. 2003)
TGS1 (trimethylguanosine synthase 1)
+ snRNA cap hypermethylase (Mouaikel et al. 2003)
Viral proteins
Papilloma virus E2 + Nuclear transcription activation (Strasswimmer et al.
1999)
Epstein-Barr virus nuclear antigen 2a
+ Transcriptial regulators (Voss et al. 2001)
Epstein-Barr virus nuclear antigen 6 (or 3c)
- Transcriptial regulators (Krauer et al. 2004)
Minute virus NS1 and NS2
unknown Viral replication and a potent transcriptional activator.
(Young et al. 2002c, d)
mediates SMN interaction with arginine-glycine (RG) motifs in several proteins (Gubitz et al. 2004; Meister
and Fischer 2002) including the Cajal body marker coilin and the Sm core proteins, after their
symmetrically dimethylated mediates arginine (sDMA) isoforms (Boisvert et al. 2002; Friesen et al. 2001b;
Hebert et al. 2002; Meister and Fischer 2002). The K-rich sequence is embedded in the interspecies

INTRODUCTION 13
conserved RNA-binding domain (Bertrandy et al. 1999; Lorson et al. 1998). The P-rich domain associates
with the actin-binding protein profilin (Giesemann et al. 1999). The YG-box domain is implicated in self-
association in vitro (Lorson and Androphy 1998)and a putative cytoplasmic retention signal is encoded by
exon 7 (Zhang et al. 2003). The central Tudor domain cooperates with the YG-box and the K-rich
sequence for the accumulation of SMN in Cajal bodies. One explanation for the role of the YG-box in
Cajal bodies localization is that self-oligomerization might enhance SMN accumulation in Cajal bodies by
promoting binding to Cajal bodies components, such as snRNPs (Fischer et al. 1997; Liu et al. 1997;
Pellizzoni et al. 2001a; Wang and Dreyfuss 2001b). The K-rich sequence encoded by the exon 2b is
required for the nucleolar accumulation of truncated SMN proteins (Renvoise et al. 2006). All directly and
indirectly interacting SMN partners known so far are listed in table 1 (Wirth et al. 2006b).
Gems have similarities in size and number to Cajal (coiled) bodies and are often associated with them (Liu
and Dreyfuss 1996). Cajal bodies were first described in 1903 and are known to contain high levels of
factors involved in the transcription and processing of many types of nuclear RNAs, including small
nuclear ribonucleoproteins (snRNPs), nucleolar ribonucleoproteins (snoRNPs), and the three eukaryotic
RNA polymerases (Gall 2003a, b; Ogg and Lamond 2002). However, since Cajal bodies are deficient in
DNA, nascent pre-mRNA, and non-snRNP essential for splicing factors, they are probably not active sites
for transcription or splicing (Ogg and Lamond 2002). Instead, they most likely are locals where the
assembly and/or modification of the nuclear transcription and RNA processing machinery take place (Gall
2003a, b). Double-label immunofluorescence microscopy using antibodies against SMN as a marker of
gems, and p80-coilin as a marker for Cajal bodies (Andrade et al. 1991), revealed that gems and Cajal
bodies mostly co-localize in some cell lines and adult tissues but are separated in fetal tissues and several
types of cultured cells (Paushkin et al. 2002). This indicates that gems and Cajal bodies are distinct
nuclear structures that have a dynamic functional relationship. The interaction between gems and Cajal
bodies may be mediated, at least in part, by the capacity of SMN and coilin to bind each other (Hebert et
al. 2001). Gems are also separated from interchromatin granule clusters (or speckles), which are DNA –
free nuclear domains composed of densely packed ribonucleoprotein particles enriched in mature
snRNPs and protein splicing factors (Almond et al. 2003). Newly assembled spliceosomal mRNPs re-
entering the nucleus associate with SMN (Narayanan et al. 2004) and transiently move into Cajal bodies
(Jady et al. 2003; Sleeman et al. 2001). The role of Cajal bodies in snRNP maturation steps (Jady et al.
2003; Nesic et al. 2004) and in regeneration of snRNPs after splicing has been described (Pellizzoni et al.
1998; Schaffert et al. 2004; Stanek and Neugebauer 2004). It has been shown that cells transfected with
SMA mutants showed severe reduction of snRNPs in Cajal bodies (Renvoise et al. 2006).
1.5.1. SMN complex
When isolated from cultivated cells, a large proportion of cellular SMN is present as part of a multisubunit
macromolecular entity. SMN protein oligomerizes and forms a stable complex called the SMN complex,
with a group of proteins named the Gemins. These include Gemin 2 (formerly SIP1) (Liu et al. 1997),

INTRODUCTION 14
Gemin 3/ DP103 (a DEAD-box RNA helicase) (Campbell et al. 2000; Charroux et al. 1999), Gemin 4
(Charroux et al. 2000; Meister et al. 2000), Gemin 5/ p175 (a WD repeat protein) (Gubitz et al. 2002),
Gemin 6 (Pellizzoni et al. 2001b), Gemin 7 (Baccon et al. 2002) and Gemin 8 (Carissimi et al. 2006). This
complex is large and sediments in sucrose gradients as hetero-disperse particles of 30-70 S (Paushkin et
al. 2002). The Gemins co-localize with SMN in gems and are also present throughout the cytoplasm and,
albeit at lower levels, in the nucleoplasm (Baccon et al. 2002; Charroux et al. 1999; Charroux et al. 2000;
Gubitz et al. 2002; Liu et al. 1997; Pellizzoni et al. 2002a).
Gemin 4 is the only SMN complex component that also localizes to the nucleolus (Charroux et al. 2000;
Paushkin et al. 2002). Based on their stable association with SMN, the Gemins can be considered as
integral components of the SMN complex and are readily isolated by coimmunoprecipitation using anti-
SMN antibodies or antibodies to the Gemins, even under stringent high salt conditions (750 mM NaCl)
(Paushkin et al. 2002). The function of the multi-unit SMN-complex relies on the ordered interplay of the
nine components SMN, Gemin 2-8 and unrip. Recent studies have revealed a framework of the SMN-
complex with SMN, Gemin 7 and Gemin 8 as its backbone (Otter et al. 2006) (Fig. 5).
Fig. 5 Schematic representation of all interactions within the SMN-complex. SMN, Gemin 7 and
Gemin 8 provide a binding platform for the other components of the complex. SMN binds Gemin 2,
Gemin 3 and Gemin 8. Gemin 8 interacts in turn with Gemin 4 and Gemin 7. Gemin 7 recruits unrip
and Gemin 6 via direct interaction (Otter et al. 2006).

INTRODUCTION 15
These three proteins provide a binding platform for the other components of the complex via multiple
interactions: SMN binds to Gemin 2 (Baccon et al. 2002), Gemin 3 (Campbell et al. 2000; Charroux et al.
1999) and Gemin 8. Gemin 8, in turn, interacts with Gemin 4 and 7. Finally, Gemin 7 recruits unrip and
Gemin 6 via direct interaction (Baccon et al. 2002; Carissimi et al. 2006; Grimmler et al. 2005). The
peripheral protein Gemin 5 can be dissociated upon treatment with high salt (Otter et al. 2006). This
finding suggests its incorporation into the complex via weak interaction mediated by Gemin 2 and possibly
Gemin 4.
Conflicting data regarding the function of Gemin 5 have been recently reported (Battle et al. 2006; Feng et
al. 2005; Shpargel and Matera 2005). In two reports RNAi was used to show that Gemin 2 is dispensable
for the assembly reaction (Feng et al. 2005; Shpargel and Matera 2005). In contrast, evidence for an
essential role of Gemin 5 in the formation of U snRNPs has been provided in another recent report (Battle
et al. 2006).
Gemin 2 was formerly referred to an SIP-1 (SMN interacting protein 1) and binds to a distinct site at the N-
terminus (aa 13-14) of SMN. Although Gemin 2 and SMN are closely interacting proteins, part of the same
complex, the same pathway and exhibit the same cellular location in gems and cytoplasm, it has been
shown that SIP1 is neither responsible for 5q-unlinked SMA nor for the phenotypic variability observed in
SMA families (Helmken et al. 2000). The SMN protein likely plays a central role in the structural
organization of the SMN complex as it is the essential to bring together the different subunits. The
presence of multiple subunits and the seemingly modular organization of the SMN complex due to SMN’s
ability to oligomerize, which is impaired in SMN mutants of SMA patients (Lorson et al. 1998; Pellizzoni et
al. 1999), support the current view of the SMN complex as a dynamic macromolecular machine capable of
multiple tasks.
The SMN complex interacts with several proteins, some of which can be considered SMN complex
substrates. Among these substrates are the Sm proteins and Sm-like (Lsm) proteins of the snRNPs,
which are essential components of the splicing machinery. Intriguingly, each component of the SMN
complex has the capacity to bind to a subset of the Sm/Lsm proteins (Baccon et al. 2002; Charroux et al.
1999; Charroux et al. 2000; Gubitz et al. 2002; Liu et al. 1997; Pellizzoni et al. 2002b). Additional SMN
complex substrates are the snoRNP proteins, fibrillarin and GAR1, as well as hnRNP U, Q and R, RNA
helicase A, coilin, nucleolin, and Epstein–Barr virus nuclear antigen 2 (Barth et al. 2003; Hebert et al.
2001; Jones et al. 2001; Lefebvre et al. 2002; Mourelatos et al. 2001; Pellizzoni et al. 2001a; Rossoll et al.
2002). Recently, it was also reported that protein phosphatase 4 (PPP4), a ubiquitous essential protein
serine/threonine phosphatase, is associated with the SMN complex via binding to Gemin4 and/or Gemin3,
and overexpression of catalytic (PPP4c) and regulatory (R2) domains of PPP4 was found to modify the
temporal localization of newly formed snRNPs in HeLa cells (Carnegie et al. 2003). However, whether and
how this phosphatase protein affects the functions of Gemin 3, Gemin 4 and/or the SMN complex awaits
further clarification. Gemin 3 and 4 have also been shown to be components of a 15S microRNP complex
that contains eIF2C2, a member of the Argonaute protein family, and numerous miRNAs (Dostie et al.
2003; Mourelatos et al. 2002). These findings raised the interesting possibility that SMN deletions or loss-

INTRODUCTION 16
of-function mutations in SMA patients may also affect the activity of miRNPs by, for example, affecting the
balance of the shared complex components Gemin 3 and 4 between SMN complexes and miRNPs
(Dostie et al. 2003). Finally, the list of proteins reported to interact with SMN also includes several proteins
that neither contain RG-rich motifs nor interact with RNPs, such as profilin, the FUSE binding protein,
ZRP1, p53, and the NS1 protein of min virus of mice (Young et al. 2002a; Young et al. 2002c). Recent
studies have demonstrated that the zinc finger protein ZPR1 is part of a cytoplasmic snRNP complex that
contains SMN, Sm proteins, U snRNA, snuportin 1 and importin β (Narayanan et al. 2002). The binding
partner of ZPR1 in the SMN complex has not been yet identified, but it has been established that ZPR1
does not bind directly to SMN (Gangwani et al. 2001). ZPR1 co-localizes with SMN in the nucleus where
both proteins accumulate in gems and Cajal bodies. It is likely that the binding of ZPR1 to SMN
complexes is significant because mutations that are associated with SMA disease disrupt the association
of ZPR1 with SMN complexes (Gangwani et al. 2001). Furthermore, it is established that SMA patients
express low levels of ZPR1 (Helmken et al. 2003). Zpr1 gene silencing and Zpr1 gene disruption in mouse
development has demonstrated that ZPR1 is an essential protein (Gangwani et al. 2005). ZPR1 deficiency
causes defects in both the cytoplasmic and nuclear population of spliceosomal snRNPs. Specifically
cytoplasmic snRNPs are not detected in Zpr1-/- embryos. Furthermore, ZPR1 deficiency markedly disrupts
the subnuclear structures (gems and Cajal bodies) where final maturation of snRNP complexes is
observed (Gangwani 2006).
Most of the SMN complex substrates identified so far are constituents of various RNP complexes and
contain sequence domains enriched in arginine and glycine residues. These RG-rich domains were
shown to mediate the binding to the SMN complex (Barth et al. 2003; Brahms et al. 2001; Friesen et al.
2001a; Pellizzoni et al. 2001a; Pellizzoni et al. 2001c) and this motif among these binding partners may
explain how the SMN complex can recognize such a multitude of different substrates. Moreover,
modification of specific arginine residues within these RG-rich domains by symmetrical dimethylation
greatly enhances the affinity of several of these substrates to SMN (Barth et al. 2003; Brahms et al. 2001;
Friesen et al. 2001a).
It is of note that most SMN complex substrates characterized so far are components of various RNP
complexes that are involved in diverse aspects of RNA processing. Studies in Xenopus laevis oocytes and
mammalian cells have shown that SMN is involved in several aspects of cellular RNA metabolism
including: snRNP assembly, pre-mRNA splicing, transcription and biogenesis of small nucleolar RNPs
(sno RNPs) (Buhler et al. 1999; Fischer et al. 1997; Jones et al. 2001; Meister et al. 2001a; Meister et al.
2002; Meister and Fischer 2002; Pellizzoni et al. 2001a; Pellizzoni et al. 2001c; Pellizzoni et al. 1998;
Pellizzoni et al. 2002b; Yong et al. 2002). It therefore became apparent that the SMN complex might take
part in many aspects of cellular RNA metabolism. Indeed, a well-characterized function of the SMN
complex is its role in the assembly of the spliceosomal snRNPs (Yong et al. 2004).
The spliceosome is the macromolecular entity that promotes and controls the splicing reaction. Within the
assembled spliceosome, intron excision occurs in two chemical steps: first 5’ss cleavage and lariat
formation, then 3’ss cleavage and exon ligation. Following exon ligation, complete spliceosome

INTRODUCTION 17
Fig. 6 The U snRNP biogenesis pathway. A cartoon model of the U1 snRNP maturation is shown.
Subsequent to transcription and capping, the pre-U1 snRNA becomes complexed with several
factors. In the following step the Sm proteins interact with the U snRNA’s Sm site. This step is
facilitated by the SMN complex. Subsequent to cap hypermethylation and 3’ trimming, the snRNP
Sm core is imported into the nucleus. Import is mediated by snurportin 1, which binds to the
snRNA’s m3G cap (Will and Luhrmann 2001).

INTRODUCTION 18
disassembly would then free up its components for de novo synthesis of other spliceosomes. The
functional subunits of the spliceosome are uridine-rich small nuclear ribonucleoproteins particles (U
snRNP), which are composed of one (U1, U2, U5) or two (U4/U6) uridine-rich RNAs and characteristic
sets of proteins (Will and Luhrmann 2001). Spliceosomes and their U snRNP subunits are formed in a
highly ordered process. Seven so-called Sm proteins, which are common to all spliceosomal U snRNPs,
are assembled on the U snRNA to form the core structure of these particles (Kambach et al. 1999a;
Kambach et al. 1999b). These “Sm core domains” of U snRNPs additionally receive a distinct set of
proteins, which confer specific activities to each snRNP (Will and Luhrmann 2001). During the past
decade, it became evident that the assembly of U snRNP core structures requires assistance by the SMN
protein in vivo. Using cell extracts and affinity purified components, it was shown that the SMN complex is
essential and sufficient to mediate the ATP-dependent assembly of the seven-membered ring of the
common Sm proteins around a highly conserved sequence motif of less than 10 nucleotides, called the
Sm site, present in most snRNAs (Fig. 6).
The best-characterized function of the SMN complex is the assembly of the heptameric core of Sm
proteins on spliceosomal snRNAs (Meister et al. 2002; Yong et al. 2004). After transcription, the Sn class
of snRNAs (U1, U2, U4 and U5) are exported to the cytoplasm where they are assembled with the seven
Sm proteins (SmB/B’), SmD1 to SmD3, SmE, SmF and SmG to form the Sm core. Newly translated Sm
proteins bind first to pICln and the PRMT5 complex, which carries out the symmetrical dimethylation of
specific arginine residues of a subset of Sm proteins, and then to the SMN complex (Friesen et al. 2001a;
Friesen et al. 2001b; Friesen et al. 2002; Meister et al. 2001a; Meister et al. 2001b). This post-
translational modification is carried out by a 20S arginine methyltransferase complex, the methylosome
that contains the methyltransferase JBP1/ PRMT5, pICln, and MEP50 (a WD repeat protein) (Friesen et
al. 2001a; Friesen et al. 2002; Meister et al. 2001a). The SMN protein complex is required for the specific
assembly of Sm core complexes in U snRNAs. This is mediated by SMN interaction with the U snRNA
(Yong et al. 2004) and with the Arg/Gly-rich COOH tails of SmB, SmD1 and SmD3 (Friesen and Dreyfuss
2000). High-affinity interactions with SMN require these Sm proteins to be modified to contain symmetrical
dimethyl-arginine (Brahms et al. 2001; Friesen et al. 2001a). SMN plays a second role in the maturation of
snRNPs following the assembly of snRNAs with Sm proteins. The Sm core undergoes hypermethylation
to form the 2’, 2’, 7’-trimethyl-guanosine (TMG)5’-cap that is required for the recruitment of import
receptors necessary for the translocation of snRNPs into the nucleus (Will and Luhrmann 2001).
Trimethylguanosine synthase 1 (TSG1), the enzyme that is responsible for the formation of the TMG 5’-
cap, interacts with SMN (Mouaikel et al. 2003). The hypermethylated 5’-cap of U snRNA recruits snuportin
1 to the snRNP complex (Huber et al. 1998) and snuportin 1 is able to bind both SMN (Narayanan et al.
2002) and importin β (Huber et al. 1998) to facilitate nuclear import of mature snRNP complexes.
Moreover, the SMN complex was found to function as a specificity factor for this assembly process by
ensuring that Sm cores are only formed on the correct RNA molecules (Pellizzoni et al. 2002b). The ability
of the SMN complex to facilitate and safeguard accurate snRNP assembly is based on its capacity to bind
both Sm proteins and also snRNAs. Indeed, the SMN complex binds directly with high affinity and in

INTRODUCTION 19
sequence-specific manner to several snRNAs (Yong et al. 2004; Yong et al. 2002). These observations
suggest that the SMN complex brings the protein and RNA components together for snRNP assembly,
thus serving as a genuine assemblyosome for Sm cores on snRNAs. Clearly, in the intricate
microenvironment of the cell, a stringent specificity of snRNP assembly is of pivotal importance since
haphazard binding of Sm proteins to nontarget RNAs would interfere with the functions of these RNAs.
Thus, the SMN complex is not only an essential mediator of snRNP assembly but also provides stringent
control over this process. Aside from its roles in snRNP assembly, the SMN complex most likely functions
in the formation of other RNPs. For example, based on its direct interactions with fibrillarin and GAR1, two
protein constituents of box C/D and box H/ACA snoRNPs, respectively, the SMN complex may play a role
in the biogenesis of snoRNPs, which are involved in the post-transcriptional processing and modification
of ribosomal RNAs (Jones et al. 2001; Pellizzoni et al. 2001a). Furthermore, a dominant negative mutant
of SMN, SMN∆N27, inhibits pre-mRNA splicing in vitro (Pellizzoni et al. 1998). Transient expression of this
mutant in HeLa cells leads to a dramatic reorganization of snRNPs, RNA polymerase II (Pol II)
transcription and processing machinery in the nucleus, probably by impairing the regeneration of
functionally active snRNPs or other components of the spliceosome and the components of the Pol II
transcription complex (Pellizzoni et al. 2001a; Pellizzoni et al. 1998). The involvement of the SMN
complex in the biogenesis of the Pol II transcription factories may be mediated by its ability to interact with
RNA helicase A, which binds Pol II and functions in transcription (Nakajima et al. 1997; Pellizzoni et al.
2001c). Recent reports have also suggested specific roles for SMN in the motor neuron. Studies in
zebrafish using SMN-specific antisense morpholinos to knock down the SMN protein level throughout the
entire embryo revealed motor axon-specific pathfinding defects (McWhorter et al. 2003). Furthermore,
primary motor neurons isolated from a transgenic SMA mouse model were reported to exhibit reduced
axon growth in culture when compared to motor neurons isolated from wild-type mice (Rossoll et al.
2003). The same study also showed that overexpression of SMN and hnRNP R in differentiating PC12
cells promotes neurite outgrowth and modulates the localization of β-actin mRNA in neurites, thus raising
the possibility that SMN is involved in the transport of specific mRNA molecules in motor axons (Rossoll et
al. 2003). However, whether the clinical symptoms of SMA are caused by deficiencies in functions of SMN
that are specific to the motor neuron or common to all cells but at higher demand in this cell type must still
be resolved.
1.5.2. Motor neuron specific functions of the SMN protein
The SMN protein is ubiquitously expressed in all cells, but the reason why a lack of SMN full-length
protein specifically affects motor neurons remains unknown. The promoters of SMN1 and SMN2 were
found to be virtually identical (Boda et al. 2004; Monani et al. 1999). Monani et al. identified an
approximately 200 base pair element within the two promoters that results in high gene expression
specifically in motor neurons (Monani et al. 1999). In 2004, Boda et al. transfected embryonic neurons and
fibroblasts cells with a construct containing 4.6 kb of the SMN promoter and found that reporter gene

INTRODUCTION 20
expression was specifically higher in neurons vs. fibroblast cells. These studies suggest that the SMN
promoter is most active in motor neurons (Boda et al. 2004).
This issue of why reduced levels of a housekeeping protein like SMN may eventually lead to motor neuron
degeneration in SMA remains to be solved.
I. While the cause of motor neuron specific death in SMA patients is unknown, there are studies that
suggest that the loss of motor neurons may not necessarily be the result of problems in assembly of U
snRNPs and the resulting effect on mRNA splicing (Jablonka et al. 2004). A link between a defect of
snRNP biogenesis and SMA is suggested by the impaired interaction with Sm proteins of SMN mutants
of SMA patients and by the reduced snRNP assembly activity of extracts from SMA fibroblasts (Buhler
et al. 1999; Pellizzoni et al. 1999; Wan et al. 2005). However, it is not known whether or how
deficiencies in a function required by all cells may lead to the preferential degeneration of motor neurons
in the spinal cord. One possibility is that motor neurons have a greater requirement for SMN function in
snRNP assembly compared with other cell types. The first evidence that SMN function in snRNP
assembly may not be uniformly required in all cells has been shown by (Gabanella et al. 2005). The
levels of SMN activity observed in snRNP assembly were different among tissues and were most
prominent in the developing CNS, due to the presence of a larger pool of SMN complexes competent for
snRNP assembly in extracts from neuronal tissues. This observation may have important implications
on the pathophysiological consequence of SMN deficiency in SMA patients. Jablonka et al. found that
the majority of SMN protein that is unbound to Gemin 2 is localized in the axons and dendrites of motor
neurons. Here, the SMN protein does not appear to be part of the same complex in the cell body that is
involved in the assembly of U snRNPs (Jablonka et al. 2001). For the first time was demonstrated that
SMN co-localizes with Gemin 2 and Gemin 3 in granules that distribute to neuronal processes and
growth cones of primary hippocampal and motor neurons, and ES cell-derived motor neurons (Zhang et
al. 2006). The observation for the lack of spliceosomal Sm proteins in processes suggests an additional
function for SMN complexes that are localized to neuronal processes (Zhang et al. 2006).
II. Recently, growing evidence has pointed out that the association between SMN and the cytoskeleton in
axons and the axonal transport of SMN may be of relevance in the pathogenesis of SMA. The results of
a study by Pagliardini et al. in 2000 suggest that SMN protein may be involved in axonal and dendritic
transport of specific mRNAs (Pagliardini et al. 2000). It has been demonstrated that SMN protein
accumulates in the axons and growth cones of neuron-like cells in vivo (Fan and Simard 2002) and
anterior horn cells in vivo (Tizzano et al. 1998). These observations have been bolstered by
experiments identifying the presence of SMN-containing granules within the neurites of chick cortical
neurons and rat spinal motor neurons that associate with microtubules and exhibit bidirectional
movement between the cell body and the growth cone (Zhang et al. 2003). These particles are RNP
particles and suggest a specific role for the SMN protein in neuronal cells and, perhaps, an even more
specific one in motor neurons. The same group observed that the SMN∆7 protein appears to be
confined to the nucleus and may not translocate down axons. Neurons with a majority of SMN∆7 protein
were found to have neurites that were 25 % shorter than neurons with FL-SMN. These results point to a

INTRODUCTION 21
motor neuron specific function of SMN in SMA (Zhang et al. 2003). It is now fairly well-established that
SMN can bind RNA (Bertrandy et al. 1999; Lorson and Androphy 1998) and ribonucleoprotein particles
(Jones et al. 2001; Liu and Dreyfuss 1996; Mourelatos et al. 2001). In addition to being a constituent of
snRNPs, SMN may well be a constituent of a different RNP complex that in motor axons is capable of
transporting specific RNAs to the growth cone in response to local cues during development. Data
indicating a specific interaction between SMN and β-actin mRNA mediated by the protein hnRNP-R
level support this idea (Rossoll et al. 2003). Reduced growth cone size, β-actin levels, and shorter
neurites in primary motor neurons from SMA mice add further weight to this line of thought. In yet
another report, FL-SMN appears to interact with two novel binding proteins, hnRNP-R and hnRNP-Q.
These two proteins, like the Gemins, will not interact with the truncated SMN protein isoforms
(Mourelatos et al. 2001; Rossoll et al. 2002). hnRNP-Q appears necessary for efficient pre-mRNA
splicing in vivo (Mourelatos et al. 2001). Interestingly, hnRNP-R is specifically co-localized with SMN in
motor axons and growth cones (Rossoll et al. 2002). The potential involvement of SMN protein in axonal
processes, such as the translocation of β-actin mRNA (Rossoll et al. 2003) and/or the stability of β-actin
mRNA (Jablonka et al. 2004), is perhaps a strong indication as to why the defect in the SMN1 gene may
specifically lead to the loss of motor neurons and SMA. A 54 nucleotide sequence within 3’ UTR of β-
actin mRNA, termed the zipcode, is both necessary and sufficient for β-actin mRNA localization
(Kislauskis et al. 1994). The mRNA binding protein, zipcode binding protein (ZBP1) binds directly to the
β-actin zipcode (Ross et al. 1997) and this interaction is required for mRNA localization (Farina et al.
2003). ZBP1 has a nuclear localization and export sequences, and its shuttling between the nucleus
and the cytoplasm allows for the export of an mRNP localization complex (Oleynikov and Singer 2003).
In fibroblasts, the β-actin mRNP complex with ZBP1 is localized predominantly along actin filaments
(Oleynikov and Singer 2003). In neurons, ZBP1 and β-actin mRNA are also co-localized in granules that
are transported predominantly along microtubules, which allows for longer distance trajectories
(Tiruchinapalli et al. 2003). Since, hnRNP-R was shown to associate with β-actin mRNA and enhances
its localization, an SMN-hnRNP-R complex might contribute to β-actin mRNA localization. An exciting
study showed that knock-down of SMN in zebrafish resulted in axon-specific pathfinding defects, that
were partially rescued by full-length human SMN, but not by SMN∆7 (McWhorter et al. 2003). These
studies suggest an inefficiency of SMN associated RNPs in motor neuron axons in SMA. As motor
neurons have unusually long axons, their localized mRNPs could be more vulnerable to low levels of
SMN. The presence of SMN in axons and dendrites of nerve cells, at a long distance from the nucleus,
indicates some additional role for this protein, with profound implications for the characteristic loss of
motor neurons in spinal muscular atrophy. In 2005, Sharma et al. found that SMN has some role in the
transport of mRNPs in neuronal processes. The “axonal” SMN was found to be a part of a complex that
is similar to that involved in nuclear splicing, except that it lacks the Sm core proteins of the nuclear
snRNPs and is not associated with coilin p80, the marker protein of nuclear Cajal bodies. In addition,
SMN may link the transport of mRNA and actin cytoskeleton via its interaction with profilin IIa (Sharma
et al. 2005). Profilin can sequester actin monomers or promote polymerization by desequestering of

INTRODUCTION 22
actin from the thymosin/ β-actin pool and by adding these monomers to the free barbed ends of
microfilaments (Pantaloni and Carlier 1993). Profilin also interacts with phosphatidylinositol 4,5-
biphosphate (Lassing and Lindberg 1985) and with proline-rich sequences in Ena/VASP proteins
(Gertler et al. 1996; Lambrechts et al. 2000b), N-WASP (Rohatgi et al. 1999) and diaphanous-related
formin (Braun et al. 2002; Lambrechts et al. 2000b; Obermann et al. 2005; Watanabe et al. 1997). Five
profilin isoforms have been identified in mammals, profilin I, IIa, IIb, III and IV, of which IIa and IIb arise
from alternative splicing (Braun et al. 2002; Lambrechts et al. 2000b; Obermann et al. 2005). Profilin I is
expressed ubiquitously, while profilin IIa is the major isoform in neuronal tissues both during
development and in adult life (Lambrechts et al. 2000a). Profilin is also found in gems and Cajal bodies
in the nucleus where it co-localizes with SMN, p-80 coilin and the Sm core proteins (Giesemann et al.
1999). The specific interaction with profilin IIa and the failure of profilin IIa to interact with pathogenic
SMN mutants open a new view on the role of SMN in SMA pathogenesis. As a regulator of actin
dynamics, profilin IIa is involved in correct neurite outgrowth (Da Silva et al. 2003). Knockdown of both
profilin I and II inhibited neurite outgrowth (Sharma et al. 2005), possibly impairing actin dynamics by
reducing the availability of profilin-G-actin complexes for microfilament growth. Co-localization of
profilins with SMN in nuclear gems/Cajal bodies (Giesemann et al. 1999) and recent interest in the role
of nuclear actin in intranuclear transport (Percipalle et al. 2001) raise the possibility of active transport of
SMN complexes within the nucleus. Unrip (unr-interacting protein) is a novel member of the GH-WD
repeat protein family and was identified as a component of SMN complexes purified from HeLa cells
(Meister et al. 2001b). Although unrip itself has no intrinsic RNA binding properties, it has been shown to
interact directly with unr, which is a member of the cold shock family of single stranded RNA-binding
proteins (Hunt et al. 1999). Involvement with many aspects of RNA metabolism, and not splicing alone,
is an emerging theme in studies of SMN and its associated proteins. By high-resolution fluorescence
and quantitative imaging methods, it was possible to detect the presence and cotransport of an SMN-
Gemin complex in neuronal processes and ES cell-derived motor neurons (Zhang et al. 2006). In
contrast, spliceosomal Sm proteins were confined to the nucleus and perinuclear cytoplasm. The data
suggested the presence of SMN and Gemin containing particles that do not co-localize (Zhang et al.
2006). These results suggest the presence of diverse types of SMN complexes that have functions in
neurons, other than its well characterized role to assemble snRNPs in all cells.
III. The idea of proteins involved not just in mRNA localization but also in regulating translation in neurites is
not new. Both, FMRP, the defective protein in Fragile X mental retardation syndrome, and the
cytoplasmic poly A element binding protein, have been implicated in these roles (Bassell and Kelic
2004). SMN may have a similar role in motor neurons, thus explaining the specific defect characteristic
of the disease phenotype.
IV. The involvement of SMN in RNA metabolism continues to be investigated in order to further understand
the molecular biology of the disease. A 2004 study by Anderson et al. found that the RNA binding
protein BRUNOL3 is up-regulated in the heterozygous SMA (i.e., Smn +/-) mice and human primary cell
cultures (Anderson et al. 2004). This up-regulation correlated with more severe SMA phenotypes. SMN

INTRODUCTION 23
and BRUNOL3 are both expressed at similar stages of development and BRUNOL3 has a specific
neuromuscular expression pattern. Two members of the hnRNP protein family were described as
binding partners of SMN. hnRNP-R and hnRNP-Q interacted with wild type Smn, but not with mutated
Smn isoforms (Rossoll et al. 2002). Both hnRNP-R and hnRNP-Q specifically bind mRNAs and are
involved in mRNA processing including editing, in mRNA transport and finally act as regulators which
modify binding to ribosomes and RNA translation (Mourelatos et al. 2001; Pellizzoni et al. 1999). Such
functions appear highly important for neurons with long processes, in particular motor neurons in which
specific mRNAs have to be transported over long distances.
V. The first evidence that SMN interacts with the transcription corepressor mSin3A revealed that a subset
of SMN protein may be involved in the repression of genes critical to motor neuron survival. mSin3A-
interacting domain is encoded by exon 6 of SMN (Zou et al. 2004). In mammalian cells, mSin3 is
expressed as the highly related mSin3A and mSin3B proteins (Ayer et al. 1995). mSin3 associates with
histone deacetylases (HDACs), methyl transferases and other factors to regulate the accessibility to
chromatin (Sif et al. 2001; Wysocka et al. 2003; Yang et al. 2003; Zhang and Dufau 2002).
VI. Motor neuron loss in SMN-deficient cells appears to be due to apoptosis (Fidzianska 2002; Fidzianska
and Rafalowska 2002; Soler-Botija et al. 2002). SMN might have a direct role in the apoptotic process;
SMN protein has been shown to associate in vitro and in vivo with p53, a tumor suppressor protein that
regulates neuronal death by apoptosis (Young et al. 2002a). The tumor suppressor protein p53 is a
multifunctional factor involved in cell cycle control (Sherr 2000; Sherr and Weber 2000), DNA repair
(Huang et al. 1996), transcription activation (Fritsche et al. 1993; Hupp et al. 1992), and apoptosis
(Vousden 2000; Vousden and Woude 2000). p53 can induce apoptosis through several pathways,
including mechanisms that are dependent or independent of p53-mediated transcriptional activity (Bates
and Vousden 1999; Vousden 2000). SMN interacts directly with p53 and the region encoded by SMN
exon 2 mediates the SMN-p53 association (Young et al. 2002a). The degree of inhibition correlates with
the effects of each mutation on SMN dimerization and SMA disease severity. Following endogenous
p53 activation, SMN and p53 accumulates in Cajal bodies. In contrast, in SMA patients-derived
fibroblasts with very low SMN protein level, p53 is localized within the nucleolus and not in Cajal bodies
(Young et al. 2002a). The interaction between p53 and SMN suggests that the two proteins have an
associated function. SMN can function as an anti-apoptotic factor in neuronal cells and has been
reported to functionally interact with the anti-apoptotic factor Bcl-2 in a tissue culture model (Iwahashi et
al. 1997; Kerr et al. 2000). An anti-apoptotic function of SMN may be significant, with regards to
disease, because surviving motor neurons from SMA patients display signs of apoptosis, such as
chromatolysis and swelling (Broccolini et al. 1999; Simic et al. 2000). Mutations in SMN in SMA patients
destroy its anti-apoptotic synergy with Bcl-2, suggesting that it is this defect that underlies the
pathogenesis of SMA (Iwahashi et al. 1997). The loss of function of both SMN and NAIP proteins is
probably responsible for neuronal-cell death in SMA, suggesting that anti-apoptotic proteins may
regulate neuronal survival. By using the SV vector system, Kerr et al. showed that full-length SMN
INTRODUCTION 24
inhibits virus-induced neuronal apoptosis, whereas the SMN mutants derived from SMA patients
(Y272C and SMN∆7) enhance neuronal apoptosis (Kerr et al. 2000).
VII. It has been demonstrated that SMN interacts with various proteins, including Papilloma virus E2, a
nuclear regulator of viral gene expression (Strasswimmer et al. 1999), minute virus of mice NS1 which
performs a critical function in viral gene expression and genome replication (Young et al. 2002c, d), and
Epstein-Barr virus nuclear antigen 6, a transcriptional regulator which also plays a role in the EBV-
induced immortalization of primary B-lymphocytes in vitro (Krauer et al. 2004). The association with
SMN is assumed to be required to maintain the function of these viral proteins. This function links SMN
to gene expression regulation that may be impaired in motor neurons belonging to SMA patients.
VIII. SMN protein facilitates also the assembly of stress granules (Hua and Zhou 2004b). Cytoplasmic RNA
granules in germ cells (polar and germinal granules), somatic cells (stress granules and processing
bodies), and neurons (neuronal granules) have emerged as important players in the post-transcriptional
regulation of gene expression. RNA granules contain various ribosomal subunits, translation factors,
decay enzymes, helicases, scaffold proteins, and RNA-binding proteins, and they control the
localization, stability, and translation of their RNA cargo (Anderson and Kedersha 2006). So-called heat
stress granules (SGs) contain mRNA encoding most cellular proteins but exclude mRNAs encoding
heat shock proteins (Nover et al. 1989). These cytoplasmic microdomains form when translation is
initiated under conditions in which the concentration of the active eukaryotic translation initiation factor 2
(eIF2)-guanosine triphosphate (GTP)-transfer RNA for methionine (tRNAMet) ternary complex is reduced
(Anderson and Kedersha 2002). In response to stress, eukaryotic cells reprogram mRNA metabolism to
repair stress-induced damage and adapt to changed conditions. During this process, the translation of
mRNA encoding “housekeeping” proteins is aborted, whereas the translation of mRNAs encoding
molecular chaperones and enzymes involved in damage repair is enhanced. Selective recruitment of
specific mRNA transcripts into SGs is thought to regulate their stability and translation (Anderson and
Kedersha 2002). Stalled 48S preinitiation complexes are the core constituents of SGs, which include
small but not large ribosomal subunits as well as the early translation initiation factors eIF2, eIF3, eIF4E
and eIF4G (Kimball et al. 2003). In addition, SGs contain PABP1 (Kedersha et al. 1999), the p54/Rck
helicase (Wilczynska et al. 2005), the 5’-3’ exonuclease XRN1 (Kedersha et al. 2005), and many RNA-
binding proteins that regulate mRNA structure and function, including HuR (Gallouzi et al. 2000),
Staufen (Thomas et al. 2005), Smaug (Baez and Boccaccio 2005), TTP (Stoecklin et al. 2004), Fragile
X mental retardation protein (Mazroui et al. 2002), G3BP (Tourriere et al. 2003), CPEB (Wilczynska et
al. 2005) and SMN (Hua and Zhou 2004b). SGs also contain putative scaffold proteins such as Fas-
activated serine/theronine phosphoprotein (Kedersha et al. 2005). FRAP analysis revealed that many
SG-associated RNA-binding proteins (e.g. TIA1, TIAR, TTP, G3BP and PABP) rapidly shuttle in and out
of SGs despite the large size (several micrometers) and apparent solidity of these cytoplasmic domains
(Kedersha et al. 2000; Kedersha et al. 2005). Given that these proteins also regulate mRNA translation
and decay, their rapid flux through SGs supports the notion that SGs are triage centers that shorten,
remodel and export specific mRNA transcripts for reinitiation, decay or storage. The assembly of
INTRODUCTION 25
translationally inactive initiation complexes lacking eIF2 allows the RNA-binding protein TIA-1 or TIAR
(or both) to redirect untranslated mRNAs from polyribosomes to stress granules. By regulating the
equilibrium between polysomes and stress granules, TIA-1 and TIAR may influence the frequency with
which individual transcripts are sorted for translation or triage in both stressed and unstressed cells.
Endogenous cytoplasmic SMN co-localizes with TIA-1/R and G3BP in SGs, implicating a novel function
for SMN (Hua and Zhou 2004b). Detailed analysis suggested that to form large and smooth granules,
the Tudor domain as well as exon 6 and exon 7 are indispensable. Defects of SGs formation in SMA
fibroblasts, which express lower levels of SMN protein, support the notion that SMN plays a role in SG
formation.
1.5.3. Regulation of SMN protein during development and cellular differentiation
SMN is highly expressed during embryogenesis, but levels decline rapidly after birth. In SMA transgenic
mice, the length of the dendrites is significantly reduced whereas the number of motor neurons is not
significantly affected as compared to controls (Jablonka et al. 2000). Conditional neuronal knock-out mice
(SMN∆7) lack axonal sprouting (Cifuentes-Diaz et al. 2002). Consistent with these findings, knock-down
of the Smn protein by antisense morpholinos in zebrafish-embryos revealed a significant axonal
dysmorphology. These fail to reach motor neuron endplates due to early branching and truncation, which
suggests an important role of SMN in the pathfinding of axons (McWhorter et al. 2003).
In 2006, Giavazzi et al. clearly demonstrated the early presence of SMN in the developing CNS. By
investigation of the expression and regional localization of the SMN protein during prenatal and postnatal
development in the germinative neuroepithelium, spinal cord, brainstem, cerebellum and cerebral cortex
from human samples, Giavazzi et al. found that at the earliest examined embryonic age (6 weeks, 3 days)
all cells within the spinal cord were immunoreactive for SMN. This expression pattern of SMN was also
evident in the ventricular and subventricular zones of the developing neocortex at the gestational age of
14 weeks (Giavazzi et al. 2006). The presence of SMN in the nuclei of all cells during early development
is consistent with the housekeeping functions so far proposed for SMN, such as the role in spliceosomal
assembly and pre-mRNA maturation, which has been suggested as the basic cellular mechanisms
leading to SMA (Pellizzoni et al. 1998). The SMN expression became clearly evident in axons at later
development stages. At 22 weeks gestation, axons from motor neurons leaving the spinal cord and
entering the neural roots and axons in the descending corticospinal tract at the level of bulbar pyramids
were intensely SMN- immunoreactive (Giavazzi et al. 2006). The axonal expression of SMN was still
clearly evident at early postnatal days, like in the bulbar neuropil at birth, and tended later to decrease as
demonstrated by the reduction and disappearance of SMN staining in the pyramidal tract. This suggests a
novel role for SMN that becomes predominant in neurons at a certain phase of their development.

INTRODUCTION 26
1.6. Animal models of SMA
Animal models of SMA are vitally important in continuing to understand why the disease is caused by a
loss of the SMN protein. Mice have only one Smn gene, as opposed to the human genome which contains
two, SMN1 and SMN2. As it is probably the case in humans, complete knock-out of the Smn gene in mice
is embryonically lethal (Schrank et al. 1997). Nematode, fly and mouse models with no functional SMN
protein have a uniformly early embryonic lethal phenotype.
A heterozygous knock-out mouse model (Smn+/-) leads to motor neuron degeneration between birth and
six months of age, and this model resembles one aspect of human type III SMA (Jablonka et al. 2000).
Other mouse models of SMA have been generated by introducing the human SMN2 transgene into the
mice that homozygously lack Smn (Smn-/-); this mimics the genetics of the human disease (Hsieh-Li et al.
2000; Monani et al. 2000). A mutant SMN A2G transgene, when expressed in the presence of SMN2 in a
Smn-/- mouse, created a mild SMA mouse (clinically and pathologically similar to type III); the mutation in
the SMN2 transgene appeared to cause a delay in the onset of motor neuron loss (Monani et al. 2003).
Homozygous SMN knock-out mice with 8 copies of human SMN2 are phenotypically normal, which clearly
suggests that sufficient full-length SMN from SMN2 can completely ameliorate the disease phenotype and
makes SMN2 the most obvious target to modulate in therapeutic strategies (Monani et al. 2000).
The Cre/loxP recombination system of bacteriophage P1 is another approach used to create mouse
models of SMA. This system was used to selectively knock-out Smn exon 7 from either neurons or
skeletal muscle and to circumvent embryonic death that resulted from a lack of Smn gene. Mice with
neuron-specific Smn exon 7 deletion displayed severe and progressive motor defects, resulting in death at
a mean age of 25 days. After death, morphological analysis was performed and muscle denervation was
evident in several skeletal muscles (Frugier et al. 2000). In a 2004 study of neuron specificity, specific
regions of the CNS were examined in the course of SMA progression in the Cre/loxP model. Axonal
degeneration of the phrenic and facial motor nerves and cell body loss of motor neurons in the spinal cord
was observed beginning at 20 days of age (Ferri et al. 2004).
Cre/loxP recombinase directed deletion of Smn exon 7 in skeletal muscles led to progressive muscular
dystrophy with muscle paralysis beginning approximately 3 weeks after birth. From 15 days of age, the
Smn transcript lacking exon 7 was predominantly transcribed and death occurred at a mean age of 33
days. This mouse study indicates that the defect in the Smn gene affects skeletal muscle, and the effects
in the skeletal muscle may contribute to the motor problems in patients with SMA (Cifuentes-Diaz et al.
2001).
Animal models in fruit fly (Drosophila melanogaster) and zebrafish (Danio rerio) have also been
generated, and they are expected to be particularly useful in understanding the pathology and physiology
of SMN deficits. The recently isolated Drosophila Smn mutant suggests that neuromuscular junction
defects are a characteristic of the disease phenotype (Chan et al. 2003). The motor neuron development
in zebrafish is well understood, and defects in axon-specific pathfinding were discovered in zebrafish that
had reduced levels of SMN in the embryo (McWhorter et al. 2003).

INTRODUCTION 27
A mammalian cell culture model of SMA was created using RNA interference-based elimination of the
murine Smn mRNA in P19 teratocarcinoma cells. This could be another useful model for understanding
the pathophysiology of the disease (Trulzsch et al. 2004).
1.7. Therapeutic prospects of SMA
Currently, there is no cure or treatment to repair the nerve damage, but support care including
physiotherapy and respiratory drainage are very important. The prognosis for individuals with SMA varies
depending on the type of SMA and the degree of respiratory function. Development of a therapy for spinal
muscular atrophy is an exceptional challenge for the scientific community. Meanwhile, SMA seems to
become one of the first inherited diseases in humans which may be cured by transcriptional activation and
correction of the splicing of a copy gene. Disclosure of the molecular cause of SMA and the molecular
basis of the alternative splicing of SMN2 exon 7 gives the opportunity to develop therapeutic strategies
that modulate transcription, splicing and translation regulation of SMN2. Various therapeutic strategies
have been considered so far:
1. Elevation of the endogenous FL-SMN protein level encoded by SMN2
- transcriptional SMN2 activation via the gene promoter
- restoration of the correct splicing of SMN2 pre-mRNA
- taking advantage of the pathway being responsible for the translation regulation of SMN2 in
some unaffected individuals carrying homozygous SMN1 mutations
2. Compensation of the lack of sufficient SMN protein by
- stem cell therapy
- gene therapy
3. Improvement of motor neuron viability through alternative pathways
Since each SMA patient lacking SMN1 carries one to four or sometimes even more SMN2 gene copies
(Brahe 2000; Burghes 1997; Feldkotter et al. 2002), researchers world-wide eagerly started to search for
substances that increase SMN2-derived SMN protein levels in order to identify candidate drugs for SMA
therapy. Several compounds were described to increase SMN protein levels in fibroblasts and/or
lymphoblastoid cell lines derived from SMA patients, including the histone deacetylase (HDAC) inhibitors:
sodium butyrate (Chang et al. 2001), valproic acid (Brichta et al. 2003; Sumner et al. 2003),
phenylbutyrate (Andreassi et al. 2004), SAHA and M344 (Hahnen et al. 2006; Riessland et al. 2006), as
well as interferon (Baron et al. 2000), hydroxyurea, a cell cycle inhibitor (Chang et al. 2002), aclarubicin,
an anthacycline antibiotic (Andreassi et al. 2001), sodium vanadate, a phosphatase inhibitor (Zhang et al.
2001), and indoprofen, a nonsteroidal anti-inflammatory drug (Lunn et al. 2004). HDAC inhibitors are
acting on both, transcriptional activation and/or splicing correction of SMN2 pre-mRNA, indoprofen and
interferon are activating the transcription of SMN2 only, whereas aclarubicin and sodium vanadate are
only facilitating the correct splicing of exon 7 of SMN2 pre-mRNA. While most of these substances are not

INTRODUCTION 28
suitable for SMA therapy due to unfavourable toxicity profiles, some HDAC inhibitors are already FDA
(Food and Drug Administration) approved drugs and used in the therapy of various diseases.
One of the most exciting findings in SMA research was the identification of HDAC inhibitors as a group of
drugs that increase the SMN protein levels in vitro and in vivo by activating the transcription and/or
correcting the splicing of SMN2. Activation and repression of gene transcription largely depends on
chromatin structure. Chromatin consists of DNA, histones and non-histone proteins. Approximately two
superhelical turns of DNA containing 146 base pairs are wrapped around an octamer of core histones H4,
H3, H2A and H2B forming the basic unit named nucleosome (Luger et al. 1997). Nucleosomes are
repeating units building up the chromatin and showing a dynamic structure that can be condensed or
relaxed depending on the balance of post-transcriptional histone modifications. Post-transcriptional
modifications occurring at the N-terminal tails of histones are subject to acetylation, methylation and
phosphorylation. The enzymes responsible for the acetylation are histone acetyltransferases (HATs) that
add acetyl groups to N-terminal lysines of H3 and H4 histones. Thus the chromatin structure becomes
more relaxed and transcription factor complexes have better access to promoter regions in order to
activate gene transcription. In contrast, histone deacetylases (HDACs) remove acetyl groups, the
chromatin structure becomes more compact and gene transcription is repressed. Histone modifications
are reversible (Marks et al. 2004; Zhang and Reinberg 2001). In humans, there are three classes of
HDAC enzymes. Class I includes HDAC 1, 2, 3, and 8; these are small molecules of 22-25 kDa localized
exclusively in the nucleus. Class II includes HDAC 4, 5, 6, 7, 9, and 10, these are larger molecules of 120-
135 kDa shuttling between nucleus and cytoplasm in response to certain cellular signals. Class III HDACs
are most likely not acting on histones, but rather on transcription factors such as p53 or p21 (Marks et al.
2004).
The first HDAC inhibitor shown to increase SMN levels in EBV-transformed lymphoblastoid cell lines was
sodium butyrate (NaBu). Furthermore, SMN transgenic mice treated with NaBu survived double as long
as compared to untreated mice (Chang et al. 2001). Sodium butyrate is characterized by a very short
terminal half-life of only a few minutes in human serum and is therefore inadequate for SMA therapy.
Phenylbutyrate, a sodium butyrate derivative, has a longer half-life in human serum (2-4 h) than sodium
butyrate and in patients with urea cycle disorders it appears to be well tolerated (Maestri et al. 1996). In
fibroblast cell cultures from type I, II or III SMA patients, SMN2-mRNA full-length transcript levels were
increased in a transcription assay after treatment with phenylbutyrate. This drug was also effective in
elevating the amount of SMN protein and the number of gems (Andreassi et al. 2004). Preliminary findings
in a clinical trial suggest that the phenylbutyrate treatment in type II SMA patients improved motor
functions on the Hammersmith functional scale (Mercuri et al. 2006). Leukocytes from type II or III SMA
patients had an increase in SMN2 full-length mRNA following oral administration of phenylbutyrate (Brahe
et al. 2005). The promising results of these recent studies indicate that further investigation of
phenylbutyrate is warranted and necessary.
VPA (valproic acid) mainly inhibits HDAC2. Besides of reversible binding to the catalytic center, it also
facilitates its effect on HDAC2 through increased ubiquitination of HDAC2 followed by elevated

INTRODUCTION 29
proteasomal degradation (Kramer et al. 2003). VPA is characterized by a much more suitable half-life of
about 8-10 h in human serum and significantly increases SMN protein levels in cultured fibroblast cell
lines. Treatment of cultured fibroblasts with 0.5 µM to 500 µM VPA increased the SMN2 mRNA and
protein level about 2-4 fold depending on the SMN2 copy number. An exceptionally interesting finding was
that VPA not only activates the transcription of the SMN gene but also restores the correct splicing of
SMN2 transcripts most likely through Htra2-β1, which showed similarly increased values of about 2-4 folds
in VPA treated cells (Brichta et al. 2003). These findings suggest a double mechanism of action on SMN2
in humans. Additionally, VPA activates the transcription of SMN in neuroectodermal tissue such as
organotypic hippocampal brain slices from rat and humans (obtained from epilepsy surgery) as well as rat
motor neurons (Brichta et al. 2003; Hahnen et al. 2006). The effect of VPA (1-10 mM) on SMN expression
in cultured fibroblasts derived from SMA patients has been confirmed by Sumner and colleagues (Sumner
et al. 2003).
Among the second generation HDAC inhibitors, M344 and SAHA evolved as potent candidate drugs by
increasing SMN2 protein levels already at low micromolar doses in human organotypic hippocampal brain
slices as well as in rat motor neurons (Hahnen et al. 2006; Riessland et al. 2006).
High-throughput screening led to the detection of aclarubicin, a drug that modifies the splicing pattern of
SMN2. Aclarubicin treated fibroblast cell cultures derived from type I SMA patients had higher levels of
exon 7 containing transcript. In fact, the amount of SMN protein and gems was reported to be at normal
level after the treatment. Unfortunately, aclarubicin is highly toxic and not likely to be useful in the clinic
(Andreassi et al. 2001).
A recent study by Chang et al. provides possible evidence that the SMN protein is degraded by the
ubiquitin-proteasome pathway. Since there appears to be a correlation between the amount of full-length
SMN protein and the severity of the disease, proteasome inhibitors are a potential new treatment target
(Chang et al. 2004).
Neuroprotective targets include glutamate excitotoxicity. As studied in models of ALS, anti-glutamate
agents such as gabapentin and riluzole have been shown to have a mild neuroprotective effect. In one of
the earliest randomized double blind trials, gabapentin was tested in patients with type II or III SMA; no
benefit was observed in patients as assessed by muscle strength or forced vital capacity (FVC) (Miller et
al. 2001). Another study with gabapentin found that after 12 months, patients with type II or III SMA who
were tested with the drug demonstrated a significant improvement in leg and arm muscle strength. There
were not, however, any improvements in FVC or timed functional tests (Merlini et al. 2003). Riluzole, a
glutamate inhibitor, was tested in mice and humans with SMA. Riluzole treatment in SMA mice had a
neuroprotective effect on the progress of the terminal axon degeneration in neurons (Haddad et al. 2003).
A riluzole study in SMA patients by Russman et al. found that the drug appears to be safe (Russman et al.
2003). To the 10 participants in this limited study were given riluzole orally for nine months, and there
were no beneficial effects reported (Russman et al. 2003). A clinical trial of riluzole in patients with type I
SMA is currently underway. Other neuroprotective drugs, such as anti-apoptotic agents, free radical

INTRODUCTION 30
scavengers, and trophic factors, are also being investigated as therapies to SMA remain to be
established.
Albuterol, a beta-adrenergic agonist, has been shown to increase muscle strength in healthy volunteers
(Caruso et al. 1995). It is also being studied for the treatment of Duchenne Muscular Dystrophy. Kinali et
al. gave albuterol orally to children with type II and III SMA for six months (Kinali et al. 2002). The study
reported a statistically significant increase in clinical outcome measurements of muscle strength, FVC and
lean body mass and no serious side effects. There were, however, several participants that had an
increase in joint contractures during the course of the study (Kinali et al. 2002).
The non-steroidal anti-inflammatory drug (NSAID) and cyclooygenase (COX) inhibitor indoprofen was
found by high-throughput screening to up-regulate production of endogenous SMN protein and to increase
the number of nuclear gems. Pregnant mice treated with indoprofen had more embryos with the SMA
phenotype (mice that homozygously lacked Smn and had one copy of the human SMN2 transgene).
Therefore, indoprofen increased the viability of SMA mice in this mouse model. The drug did not appear to
alter the splicing pattern of the genes, which offers an exciting possibility of combination with drugs that
modify mRNA splicing. The authors speculate that indoprofen acts co-translationally (Lunn et al. 2004).
Studies investigating gene therapy and stem cell replacement therapy are currently underway. Most
recently, gene therapy using a lentivirus vector successfully delivered SMN1 to various muscles in a
mouse model of SMA, which restored SMN protein to motor neurons via retrograde transport (Azzouz et
al. 2004).
Independently, two research groups showed that small synthetic molecules are able to restore the correct
splicing of exon 7 leading to significantly elevated levels of FL-SMN2 transcripts (Cartegni and Krainer
2003; Skordis et al. 2003). Cartegni and Krainer developed so called antisense peptide nucleic acids
(PNAs) which are peptide chimeric molecules. The PNAs have a natural peptide-like backbone and
standard nucleobases that form highly specific and stable complexes with the target RNA. At the C-
terminus, the PNA is bound to a peptide composed of 10 RS repeats. These molecules are nuclease
resistant, form stable PNA-RNA complexes and can cross the cell membrane (Cartegni and Krainer
2003). Skordis and colleagues designed tailed oligoribonucleotides that were complementary to SMN2
exon 7 and contained additional noncomplementary sequences (tails) that were predicted to mimic ESE
sequences (GAA repeats, known to efficiently recruit Htra2-β1) (Skordis et al. 2003). Although these
molecules act very efficiently in experiments in vitro, it is not yet known if a systemic administration is
successful and, most importantly, if they will pass the blood-brain barrier.
1.8. SMA discordant families
Genotype modification is a phenomenon in which one or several genes determine the rate of development
of a character, whereas the fact of the presence or absence of the character is determined by another
gene. Genes which change the function of the main gene are called modifiers. The existence of gene
modifiers is a widely spread phenomenon. Apparently, each gene in an organism interacts with others and

INTRODUCTION 31
therefore acts as their modifier (Davies et al. 2005).
Understanding the genetic factors underlying common disorders is a difficult task because each gene and
environmental factors can contribute a small risk. In this regard, there exists a land between Mendelian
and multifactorial disorders. This land is inhabited by genes, such as modifier genes and redundant genes
that have many effects on the phenotype. Understanding the mode of action of these genes will help in
determining how susceptibility genes may interact to give rise to a multifactorial phenotype (Davies et al.
2005).
In most SMA families, there is a high degree of similarity between the clinical picture of affected siblings
(Rudnik-Schöneborn et al. 1994). Nevertheless, there are quite a few reports in which large phenotypic
variability has been described among siblings with identical 5q13 homologs (Brahe et al. 1995; Cobben et
al. 1995; Hahnen et al. 1995; Wang et al. 1996). Of the 5q13-linked SMA patients, 94.4 % show
homozygous absence of SMN1 exon 7 and 8 or exon 7 only, whereas 3.6 % present a compound
heterozygosity with a subtle mutation on one chromosome and a deletion/gene conversion on the other
chromosome (Wirth 2000). In most families affected by SMA, siblings with the same genotype share
similar phenotypes including age of onset and motor abilities. In the phenotypically SMA discordant
families, all siblings carrying identical homozygous SMN1 mutations also have identical SMN2 copy
numbers and identical 5q13 haplotypes, ruling out SMN2 or a gene in the SMA region as a potential
modifier. The severity of SMA is strongly influenced by SMN2, the highly homologous copy of SMN1. The
more SMN2 copies a patient has, the milder is the SMA phenotype (Burghes 1997; Campbell et al. 1997;
McAndrew et al. 1997; Wirth et al. 1999). Using real-time PCR, quantitative analysis of SMN2 copy
number was carried out in 375 patients with type I, II or III SMA. 80 % of patients with type I SMA were
found to have 1 or 2 copies of SMN2, 82 % of type II patients had 3 copies and 96 % of patients with type
III SMA carried 3 or 4 copies of the gene (Feldkotter et al. 2002). Increasing the production of full-length
SMN protein from SMN2 transcripts is one of the main targets of research in SMA as increased full-length
SMN protein levels would be expected to result in clinical improvement.
The fact that siblings with identical 5q13-homologous absence of SMN1 can show variable phenotypes
suggests that SMA is also modified by other factors which function either on transcriptional level, to
produce more full-length transcripts, or on translational level, to increase the amount of SMN2 protein.
Along with that, an increased level of full-length SMN transcript and protein in unaffected SMN1-deleted
siblings is observed in comparison with their affected siblings. The intrafamilial variability is especially
interesting since the milder affected sibs or the unaffected SMN1-deleted sibs are in most cases females
(Brahe et al. 1995; Cobben et al. 1995; Hahnen et al. 1995; Wang et al. 1996; Wirth et al. 1999). It cannot
be completely excluded that the healthy SMN-deleted sibs will develop SMA later in their lives. However,
the clinical picture and age of onset of SMA in sibs is often rather concordant, and a variation in age of
onset of >15 years between sibs (as seen) is extremely rare (Rudnik-Schöneborn et al. 1994).
A candidate gene approach including analysis of SMN and SMN-interacting proteins was performed in 13
phenotypically SMA discordant families (Helmken et al. 2003). The RNA levels of full-length and ∆7SMN
determined from EBV-transformed cell lines were identical, except for one single case. By analyzing the

INTRODUCTION 32
SMN protein expression in 7 SMA discordant families with affected and asymptomatic siblings, the
asymptomatic individuals revealed significantly higher levels as compared to their affected siblings in
lymphoblastoid cell lines (Fig. 7 A) but not in primary fibroblast lines (Fig. 7 B). These data indicate that an
SMA modifier directly acts on the translation regulation or stability of SMN. Additionally, eight SMN
interacting proteins (Gemin 2, Gemin 3, RNA helicase A, ZPR1, profilin 2, hnRNP-Q; FUSE binding
protein and p80 coilin), as well as 2 proteins (Htra2-β1 and hnRNP-G) involved in the splicing regulation of
SMN exon 7 were investigated in all 7 SMA discordant families. Corresponding genes were analyzed on
DNA level by sequencing the complete region and on RNA level by semi-quantitative RT-PCR. Neither of
the families presented differences among the siblings. However, similar to SMN, all SMN interacting
proteins that were analyzed by quantitative Western blot (Gemin 2, Gemin 3, hnRNP-Q, ZPR1) revealed a
significant increase in their expression levels in asymptomatic individuals (Fig. 7 A).
Fig. 7 Semi-quantitative analysis of SMN-interacting proteins in cell lines derived from discordant
families and control individuals in two independent Western blots. (A) In lymphoblastoid cell lines
the expression level of SMN and of proteins interacting with SMN, as well as of Htra2-β1, differs
noticeably between homozygously deleted unaffected individuals and their affected siblings. The
expression level of p53 as well as SRp20 was the same in affected and unaffected individuals.
Analysis with antibodies against β-tubulin and β-actin verified that equal amounts of total protein
lysates were loaded. U unaffected sib, C control individual. (B) Western blot analysis of protein
content in primary fibroblast cultures. Protein levels of SMN, Gemin 2, and Htra2-β1 are not down-
regulated in affected individuals (type IIIa and IIIb SMA) compared with unaffected siblings
(Helmken et al. 2003).

INTRODUCTION 33
Therefore, it has been suggested that the intrafamilial phenotype variability is not based on any of the
genes examined so far (Helmken et al. 2003; Helmken et al. 2000; Helmken and Wirth 2000). Htra2-β1
was found to be up-regulated similarly. However, Htra2-β1 failed to present any difference on DNA and
RNA level in discordant families (Helmken and Wirth 2000). Nevertheless, this SR-like splicing factor
reverts the SMN2 exon 7 splicing pattern when overexpressed (Hofmann et al. 2000). Therefore, the
expression level of Htra2-β1 in SMA discordant families it has been tested.
Strikingly, the Htra2-β1 protein level was decreased depending on the SMN level and phenotype. A
reduced amount of the remaining SMN protein correlates with a decrease of Htra2-β1 independent of the
modifying pathway, since it applies to discordant and non-discordant families. Another essential splicing
factor, SRp20, was not affected by an alteration of the SMN protein level. However, since SMN does not
interact with Htra2-β1, an indirect mechanism of regulation is most likely responsible for the correlation of
the expression level between SMN and Htra2-β1 (Helmken et al. 2003).
Interestingly, only for one discordant family a significant difference in the ratio of FL-SMN vs. SMN∆7 was
observed, while the total amount was the same. In all other families the ratio FL-SMN vs. SMN∆7, as well
as total amount of SMN transcripts, was identical among affected and unaffected siblings. But
nevertheless, affected siblings bear reduced levels of SMN protein, whereas unaffected siblings have as
much SMN protein as control individuals (Helmken et al. 2003).
Given the fact that no sequence or transcription differences among intrafamilial siblings were found, it has
been postulated that the SMA phenotype is modified by a factor that directly influences the SMN protein
complex (Helmken et al. 2003). Moreover, this modulating effect is tissue-specific, because only in protein
samples derived from lymphoblastoid cell lines, but not from primary fibroblast, a difference was observed.
One can only speculate that the differential expression caused by the modifying gene also occurs in spinal
cord. Nevertheless, there is no way to approach this issue at the moment, since no SMA discordant mice
are known so far. Previous studies of alternatively spliced SMN2 transcripts, protein level or number of
gems from fibroblasts or lymphoblastoid cell lines also failed to show any significant difference between
type III SMA patients and controls (Coovert et al. 1997; Gavrilov et al. 1998; Lefebvre et al. 1997), a
situation similar to the most of our phenotypic SMA discordant families.
From the conclusion that modulation of SMN expression in discordant siblings seems to happen at the
translational level, it has been assumed that SMN-interacting proteins, such as Gemin 2, Gemin 3, ZPR1
and hnRNP-Q may act as potential modifying factors. Interestingly, in both SMA discordant families and
type I-III SMA patients, as response to reduced SMN protein levels, a down-regulation of SMN-interacting
proteins in gems (Gemin 2, Gemin 3, ZPR1), as well as hnRNP-Q, which links SMN to splicing has been
observed (Mourelatos et al. 2001; Rossoll et al. 2002). This indicates that the SMN protein level regulates
the expression of its interacting partners analysed, except for p53. For Gemin 2, a tight co-regulation with
SMN has been determined in SMA patients and heterozygous mice (Jablonka et al. 2001; Wang and
Dreyfuss 2001b). hnRNP-Q protein was suggested to have a probable function in RNA transport along
axons and thus a significant decrease may contribute to the degeneration of alpha-motor neurons (Rossoll
et al. 2002).

INTRODUCTION 34
However, highly interesting was the finding that the required amount of SMN and of the SMN-interacting
proteins in the SMA discordant families were excedingly different compared with the type I-III SMA
patients. Thus type III SMA patients of discordant families reveal SMN levels similar to those of type I
patients of non-discordant families. This is most likely the result of the modifying gene(s) acting in
phenotypically discordant families. Furthermore, since the elevated SMN protein levels in the discordant
families clearly correlate with the phenotype (reduced amounts in patients vs. high amount in unaffected
siblings) the effect cannot be due the EBV transformation, but due to an intrinsic mechanism, obviously
the modifying gene.
By direct sequencing or DHPLC analysis of Gemin 2, Gemin 3, RNA helicase A, ZPR1, hnRNP-Q,
p80coilin, FUSE binding protein and hnRNP-G, the existence of any mutation, polymorphism or
transcription variance among discordant siblings was excluded. This demonstrated that these genes are
highly unlikely to act as SMA modifying factor(s) (Helmken et al. 2003; Helmken et al. 2000; Helmken and
Wirth 2000). The discovery of the modifying factor that prevents these individuals from developing SMA
might be of therapeutic relevance. It remains speculative whether or not the molecular mechanism that
prevents these individuals from developing SMA is regulated by a gender-specific factor (Helmken and
Wirth 2000).

AIMS 35
2. AIMS
The molecular basis of spinal muscular atrophy (SMA) is the loss of the survival of motoneuron (SMN1)
gene function, while the severity of the disease is mainly influenced by the copy number of SMN2 genes,
a nearly identical copy of SMN1. In most SMA families unaffected siblings share similar phenotypes
including age of onset and motor abilities. However, in rare cases significant phenotypical discrepancies
were found among the siblings carrying identical mutations of SMN1 and identical number of SMN2
copies, suggesting the influence of a SMA modifying gene. In very mildly affected or asymptomatic
siblings, high SMN protein levels are expressed by SMN2 genes, protecting these persons from
developing SMA.
The main objective of this work was to find the natural factor(s) that is/are able to protect some individuals
from developing SMA despite the fact that they carry the same homozygous SMN1 mutations. Several
complementary strategies were used to maximize the chance to identify SMA modifying gene(s):
1. The initial part of the project was focused on a candidate gene approach to search for
mutations/polymorphisms or expression differences on DNA or RNA level of three putative
modifying genes (ZNF265, hnRNP-R and HDAC6) in SMA discordant families. The selection
of these candidates was made on the presumption that proteins that associate with the SMN
protein and/or are involved in the same pathway might act as potential modifiers. Both
ZNF265 and hnRNP-R associate with SMN and are involved in RNA metabolism. HDAC6 and
SMN are both involved in gene repression pathways.
2. In a second step, a search for differentially expressed genes in phenotypically SMA
discordant families using Affymetrix microarray was performed. RNA targets were isolated
from EBV-transformed lymphoblastoid cells belonging to one SMA discordant family where a
tissue-specific action of the modifier gene already has been shown. This profiling gene
expression analysis was approached in the hope to identify up- and down-regulated
transcripts that might rescue the SMA phenotype.
3. The third part of the work was concentrated on a genome-wide scan analysis of world-wide
collected SMA families to further identify potential modifying genes by linkage and association
studies.
Combined analysis of all these three approaches should allow the identification of candidate genes, genes
that were planned to be further characterized at molecular and protein level, as well as to investigate how
they might modulate the disease severity and might have a regulatory effect on the SMN protein
expression and function.
In its main part, the dissertation work deals with the analysis and characterization of T-plastin, the most
important SMA modifying candidate gene, identified by the differential gene expression analysis.
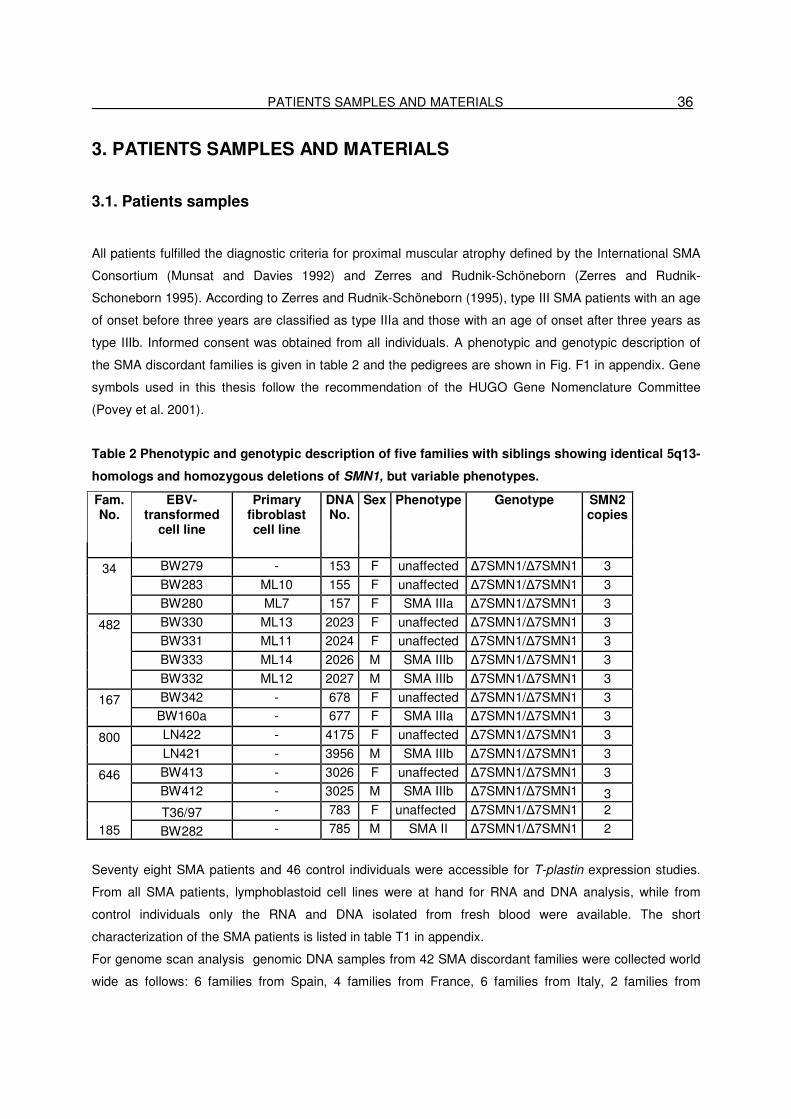
PATIENTS SAMPLES AND MATERIALS 36
3. PATIENTS SAMPLES AND MATERIALS
3.1. Patients samples
All patients fulfilled the diagnostic criteria for proximal muscular atrophy defined by the International SMA
Consortium (Munsat and Davies 1992) and Zerres and Rudnik-Schöneborn (Zerres and Rudnik-
Schoneborn 1995). According to Zerres and Rudnik-Schöneborn (1995), type III SMA patients with an age
of onset before three years are classified as type IIIa and those with an age of onset after three years as
type IIIb. Informed consent was obtained from all individuals. A phenotypic and genotypic description of
the SMA discordant families is given in table 2 and the pedigrees are shown in Fig. F1 in appendix. Gene
symbols used in this thesis follow the recommendation of the HUGO Gene Nomenclature Committee
(Povey et al. 2001).
Table 2 Phenotypic and genotypic description of five families with siblings showing identical 5q13-
homologs and homozygous deletions of SMN1, but variable phenotypes.
Fam. No.
EBV-transformed
cell line
Primary fibroblast cell line
DNA No.
Sex Phenotype Genotype SMN2 copies
34 BW279 - 153 F unaffected ∆7SMN1/∆7SMN1 3
BW283 ML10 155 F unaffected ∆7SMN1/∆7SMN1 3
BW280 ML7 157 F SMA IIIa ∆7SMN1/∆7SMN1 3
482 BW330 ML13 2023 F unaffected ∆7SMN1/∆7SMN1 3
BW331 ML11 2024 F unaffected ∆7SMN1/∆7SMN1 3
BW333 ML14 2026 M SMA IIIb ∆7SMN1/∆7SMN1 3
BW332 ML12 2027 M SMA IIIb ∆7SMN1/∆7SMN1 3
167 BW342 - 678 F unaffected ∆7SMN1/∆7SMN1 3
BW160a - 677 F SMA IIIa ∆7SMN1/∆7SMN1 3
800 LN422 - 4175 F unaffected ∆7SMN1/∆7SMN1 3
LN421 - 3956 M SMA IIIb ∆7SMN1/∆7SMN1 3
646 BW413 - 3026 F unaffected ∆7SMN1/∆7SMN1 3
BW412 - 3025 M SMA IIIb ∆7SMN1/∆7SMN1 3
T36/97 - 783 F unaffected ∆7SMN1/∆7SMN1 2
185 BW282 - 785 M SMA II ∆7SMN1/∆7SMN1 2
Seventy eight SMA patients and 46 control individuals were accessible for T-plastin expression studies.
From all SMA patients, lymphoblastoid cell lines were at hand for RNA and DNA analysis, while from
control individuals only the RNA and DNA isolated from fresh blood were available. The short
characterization of the SMA patients is listed in table T1 in appendix.
For genome scan analysis genomic DNA samples from 42 SMA discordant families were collected world
wide as follows: 6 families from Spain, 4 families from France, 6 families from Italy, 2 families from
PATIENTS SAMPLES AND MATERIALS 37
Netherlands, 7 families from USA, 5 families from Poland and 12 families from Germany. In all SMA
discordant families at least two siblings with different phenotypes (affected vs. asymptomatic or different
types of SMA) were available. In 38 families the parents were available. A detailed view of the families is
shown in table T2 in appendix.
3.2. Biological samples
RNA isolated from brain, spinal cord and muscle belonging to one SMA fetus was used in expression
analyses. The RNA was isolated from these tissues by the TRIzol method. RNA from the same tissues but
from adult, control individuals were purchased from ClonTech as follows:
• Human brain RNA, Cat.#. 636530
• Human skeletal muscle RNA, Cat.#. 636534
• Human spinal cord RNA, Cat.#. 636554
3.3. Equipment
Centrifuges:
Allegra X22-R, Beckman Coulter
5415 D, Eppendorf
5415 R, Eppendorf
Heating block: HTMR-133, HLC
Spectrophotometer:
BioPhotometer, Eppendorf
Cuvettes: UV-Vette, Eppendorf
Thermocycler:
GeneAmp 9600, Perkin Elmer
GeneAmp 9700, Applied Biosystems
Polyacrylamide gel electrophoresis chamber:
Model S2, Biometra
Agarose gel electrophoresis chamber:
SGE-020-02, CBS Scientific
pH meter: pH Level 1, inoLab
SDS gel electrophoresis chamber:
Mini-Protean 3 Cell, Biorad
Tissue culture hood:
Hera Safe, Heraeus
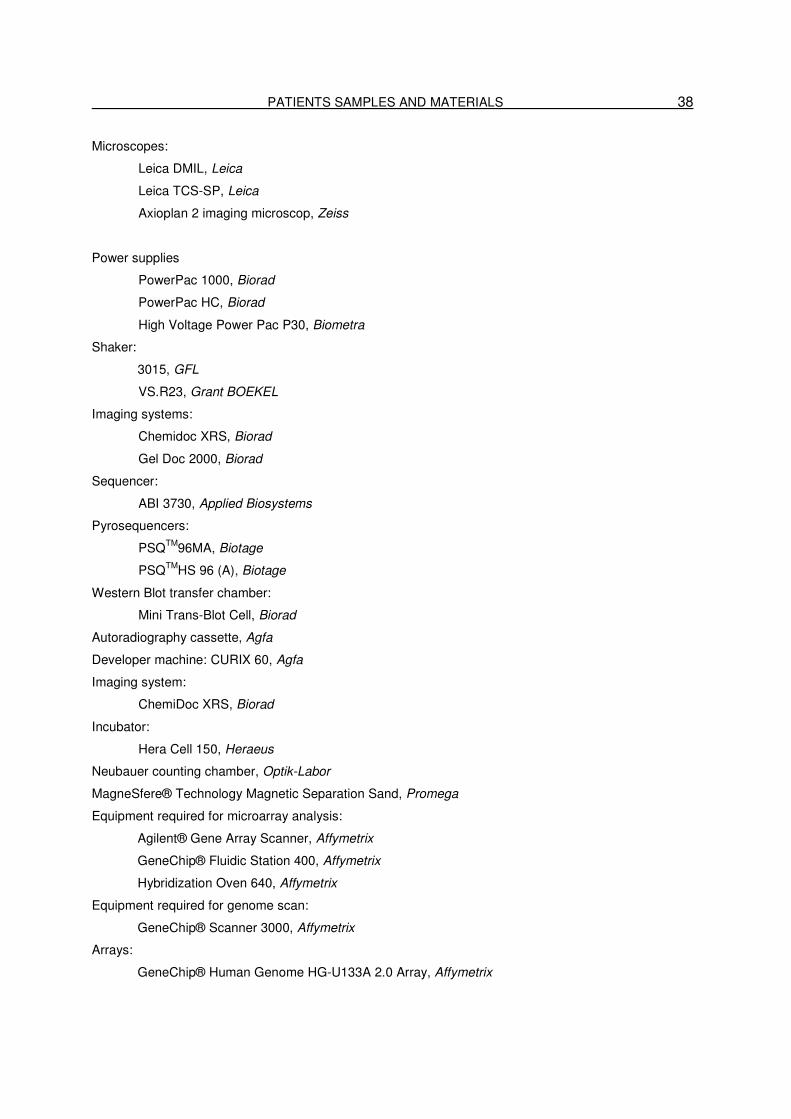
PATIENTS SAMPLES AND MATERIALS 38
Microscopes:
Leica DMIL, Leica
Leica TCS-SP, Leica
Axioplan 2 imaging microscop, Zeiss
Power supplies
PowerPac 1000, Biorad
PowerPac HC, Biorad
High Voltage Power Pac P30, Biometra
Shaker:
3015, GFL
VS.R23, Grant BOEKEL
Imaging systems:
Chemidoc XRS, Biorad
Gel Doc 2000, Biorad
Sequencer:
ABI 3730, Applied Biosystems
Pyrosequencers:
PSQTM96MA, Biotage
PSQTMHS 96 (A), Biotage
Western Blot transfer chamber:
Mini Trans-Blot Cell, Biorad
Autoradiography cassette, Agfa
Developer machine: CURIX 60, Agfa
Imaging system:
ChemiDoc XRS, Biorad
Incubator:
Hera Cell 150, Heraeus
Neubauer counting chamber, Optik-Labor
MagneSfere® Technology Magnetic Separation Sand, Promega
Equipment required for microarray analysis:
Agilent® Gene Array Scanner, Affymetrix
GeneChip® Fluidic Station 400, Affymetrix
Hybridization Oven 640, Affymetrix
Equipment required for genome scan:
GeneChip® Scanner 3000, Affymetrix
Arrays:
GeneChip® Human Genome HG-U133A 2.0 Array, Affymetrix

PATIENTS SAMPLES AND MATERIALS 39
GeneChip® Mapping 10K Array, Affymetrix
Gel dryer:
Mididry D62, Biometra
Membrane pump:
Type MP26, Biometra
Concentrator 5301, Eppendorf
3.4. Chemicals
Whenever possible, only chemicals with the purity grade “pro analysis” were used for the experiments
described in this work. All standard chemicals and organic solvents were purchased from the following
companies: Roche Molecular Biochemicals, Mannheim; Invitrogen, Niederlande, BV, Leek (Netherlands);
Merk, Darmstadt; MWG, Ebersberg; Amersham, Freiburg; Promega, Mannheim; Sigma Chemie,
Taufkirchen; Serva, Heidelberg; Stratagene, La Jolla (USA); Applichem, Darmstadt; Roth, Karlsruhe. For
RNA isolation and analysis, only chemicals free of RNases have been used.
3.5. Kits
Big Dye® Terminator v1.1 Cycle Sequencing Kit, Applied Biosystem
Bioarray High Yield RNA TranscripLabeling Kit (ENZO), Affymetrix
CpGenome DNA Modification Kit, MP Biomedicals
Custom Superscript ds-cDNA synthesis Kit, Invitrogen
DyeExTM 2.0 Spin Kit, Qiagen
GeneChip ® Eukaryotik Hybridization Control Kit, Affymetrix
GeneChip IVT Labeling Kit, Affymetrix
MagneGSTTM Pull-Down system, Promega
PAXgene Blood RNA Kit, Qiagen
pcDNA 3.1/V5-His-TOPO® Kit, Invitrogen
Pyro Gold Reagent, PSQ HS 96A, Biotage
Pyro Gold Reagent, PSQ 96 MA, PyroMakTM ID, Biotage
Pyro Gold SQA Reagents, PSQ 96 MA, PyroMakTM ID, Biotage
Qiaex II Gel Extraction Kit, Qiagen
QIAquick PCR Purification Kit, Qiagen
Quantum Prep® Plasmid MiniPrep Kit, Bio-Rad
RNeasy MinElute Cleanup Kit, Qiagen
RNeasy Mini Kit, Qiagen
SuperScript First-Strand Synthesis System for RT-PCR Kit, Invitrogen

PATIENTS SAMPLES AND MATERIALS 40
SuperSignal West Pico Chemiluminiscent Substrate Kit, Pierce
Top10 One Shot Kit, Invitrogen
TnT T7 QuickCoupled Reticulocyte Lysate, Promega
Zenon® AlexaFluor® 488 Mouse IgG1 Labeling Kit, Invitrogen
Zenon® AlexaFluor® 568 Mouse IgG1 Labeling Kit, Invitrogen
Zenon® AlexaFluor® 488 Mouse IgG2a Labeling Kit, Invitrogen
Zenon® AlexaFluor® 568 Mouse IgG2a Labeling Kit, Invitrogen
Zenon® AlexaFluor® 568 Mouse IgG1 Labeling Kit, Invitrogen
Zenon® AlexaFluor® 568 phalloidin, Invitrogen
Zenon® AlexaFluor® 488 Rabbit IgG Labeling Kit, Invitrogen
Zenon® AlexaFluor® 568 Rabbit IgG Labeling Kit, Invitrogen
3.6. Reagents, enzymes and additional supplies for cell culture procedures
Reagents
Oligo d(T) primers, # SP230, Operon
Blue Slik, # 42500.01, Serva
Ready-to-Go PCR beads, # 279559-01, Amersham
100 bp DNA Ladder, # 15628-050, Invitrogen
1 kb DNA Ladder, # 15615-016, Invitrogen
Precision Plus Protein All Blue Standards, # 161-0373, Bio-Rad
Dimethylsulfate, # D5279-05, Sigma
γ-32P-ATP, # PB10168-250, Amersham
Piperidine, # 104094, Sigma
DAPI, # H-1200, Vector Laboratories Inc
Protein G Sepharose 4 Fast Flow, # 17-0618-01, GE Healthcare
Sephadex G-50 spin columns, # 17-0045-02, GE Healthcare
Enzymes
RQ1 RNase-Free DNase, # M6101, Promega
Taq DNA Polymerase Recombinant, cat. # 10342020, Invitrogen
Ribonuclease H, # 18021014, Invitrogen
T4 DNA Ligase 100 U, # M1801, Promega
T4 Polynucleotide Kinase 500 U, # E70031Y Amersham
Vent DNA polymerase 200 U, # M0254S, NEB

PATIENTS SAMPLES AND MATERIALS 41
Additional materials for cell culture procedures
SuperFect Transfection Reagent, # 301305, Qiagen
DharmaFECTTM 1 Transfection Reagent, T-2001-03, Dharmacon
DharmaFECTTM 4 Transfection Reagent, T-2004-03, Dharmacon
Nerve growth factor 2.5S, # 13257019, Invitrogen
EBV supernatant
DMSO, # D2650, Sigma
Cyclosporin A, # 30024, Sigma
OPTIMEM® I, # 31985, Invitrogen
Tissue culture dish, 60 mm, Collagen Type I coated, # 628950, Greiner Bio-One GmbH
6 well multiwell plate, Collagen Type I coated, # 657950, Greiner Bio-One GmbH
Collagen I, 22 mm Round No.1 German Glass Coverslips, # 354089, BD Bioscience
Disposable Filter Unit 0.45 µm FP30/0.45 CA-S, # 10462100, Whatman
Disposable Filter Unit 0.2 µm FP30/0.2 CA-S, # 10462200, Whatman
3.7. Primary antibodies
α-SMN, monoclonal IgG1, # S55920, BD Transduction Laboratories
α-T-plastin, polyclonal IgG1, Eurogentec
α-β-tubulin, monoclonal IgG1, # T4026, Sigma
α-β-actin, monoclonal IgG2a, Sigma
α-V5, monoclonal IgG2a, # R96025, Invitrogen
3.8. Secondary antibodies
Horseradish peroxidase conjugated goat anti-mouse IgG, # 115-035-000, Dianova
Horseradish peroxidase conjugated goat anti-rabbit IgG, # 31460, Pierce
3.9. Solutions and Media
3.9.1. Frequently used buffers and solutions
Ammonium Persulfate (APS) solution (10%):
APS
Deionized H2O
For 10 ml
1.0 g
to a final volume of 10 ml

PATIENTS SAMPLES AND MATERIALS 42
Blocking solution (6%):
Nonfat dry milk
TBS Tween buffer
Bradford solution:
Coomassie Brilliant Blue G250
H3PO4 (85%)
Ethanol (95%)
Deionized H2O
Cell lysis solution:
0.2 M NaCl
0.1 mM TrisCl (pH 8.0)
5 mM EDTA
0.2 % SDS
Proteinase K
Diethylpyrocarbonate (DEPC) treated H2O:
DEPC
Deionized H2O
DNA loading buffer (10x):
100 mM EDTA (pH 7.7)
1% SDS
50% Glycerol
0.1% Bromphenol Blue
Deionized H2O
dNTP mix:
dNTP (100 mM)
Deionized H2O
Electrophoresis buffer (10X):
Tris-Base
store at -20oC
For 100 ml
6 g
To a final volume of 100 ml
For 1l
100 mg
100 ml
50 ml
To a final volume of 1 l
Store at 4oC
For 100 ml
4 ml of 5 M stock
10 ml of 1 M stock
1 ml of 0.5 M stock
2 ml of 10% stock
add fresh 10 µl of 100 µg/µl stock per 0.5 ml
For 1 l
1 ml
To a final volume of 1 l
Mix overnight and autoclave
For 50 ml
10 ml 0.5 M EDTA (pH 7.7)
2.5 ml 20% SDS
28.7 ml 87% Glycerol
0.05 g
To a final volume of 50 ml
For 1 ml
12.5mM of each dNTP (total volume: 50 µl)
To a final volume of 1000 µl
For 1 l
30.29 g

PATIENTS SAMPLES AND MATERIALS 43
Glycine
SDS
Deionized H2O
Ethidium bromide solution (1%):
Ethidium bromide
Deionized H2O
IP buffer:
150 mM NaCl
50 mM Tris-HCl pH 7.5
5 mM EDTA
0.5% NP40
1% Triton x 100
100 mM IPTG stock solution:
IPTG (Isopropyl-β-D-Thiogalactosid), Sigma
Deionized H2O
Laemmli buffer for SDS PAGE (2x):
Tris-Base
Glycerol
Bromphenol Blue
SDS
(prior to use: β-Mercaptoethanol)
Deionized H2O
Lysis buffer (pH 7.4):
155 mM NH4Cl
10 mM KHCO3
0.1 mM EDTA
Deionized H2O
Deionized H2O
144.12 g
10.0 g
To a final volume of 1 l
For 100 ml
1.0 g
to a final volume of 100 ml
store in the dark at 4oC
for 500 ml
4.383 g
25 mL of 1M Tris-HCl (pH 7.5)
25 ml of 100 mM EDTA (pH 8.0)
25 ml of 10% v/v NP40
50 ml of 10% v/v Triton x 1000
For 20 ml
500 mg
20 ml
Store at -20oC
for 100 ml
0.757 g
20 ml
10 mg
6 g
10 ml
To a final volume of 90 ml without β-
Mercaptoethanol and store at room temperature
For 500 ml
77.5 ml 1M NH4Cl
5 ml 1 M KHCO3
100 µl 0.5 M EDTA
400 ml
Adjust pH to 7.4 with HCl
To a final volume of 500 ml
Store at 4oC

PATIENTS SAMPLES AND MATERIALS 44
10x One-Por-All (OPA) buffer, Amersham
PCR buffer (10x):
500 mM KCl
100 mM Tris-HCl (pH 8.3)
15 mM MgCl2
0.1% gelatine
Deionized H2O
Phosphate buffered saline (PBS) (10x):
12o mM NaCl
2.7 mM KCl
5 mM Na2HPO4
5 mM Na2HPO4 (pH 7.3)
Deionized H2O
Deionized H2O
Ponceau solution:
50.5% Ponceau s
1% Acetic acid glacial
Deionized H2O
2x Quick Ligation buffer:
132 mM Tris-Cl
20 mM MgCl2
2 mM DTT
2 mM ATP
15% PEG
RIPA buffer:
150 mM NaCl
1% IGEPAL
0.5% Doc (Deoxycholic acid)
0.1% SDS (Sodium Dodecyl sulfate)
50 mM Tris (pH 8.6)
For 500 ml
250 mM 1 M KCl
50 ml 1 M Tris (pH 8.3)
7.5 ml 1 M MgCl2
0.5 g
To a final volume of 500 ml
Sterile filtration
For 1 l
80.0 g
2.0 g
14.4 g
2.4.g
To a volume of 800 ml
Adjust pH to 7.4
To a final volume of 1 l and autoclave
For 100 ml
0.5 g
1 ml
To a final volume of 100 ml
For 25 ml
3.3 ml of 1 M stock
0.5 ml of 1 M stock
50 µl of 1 M stock
Add fresh 100 µl of 500 mM stock
3.75 ml
Adjust the pH to 7.6
For 50 ml
1.5 ml 5 M NaCl
5 ml 10% IGEPAL
2.5 ml 10% DOC
0.5 ml 10 % SDS
2.5 ml 1 M Tris (pH 8.6)
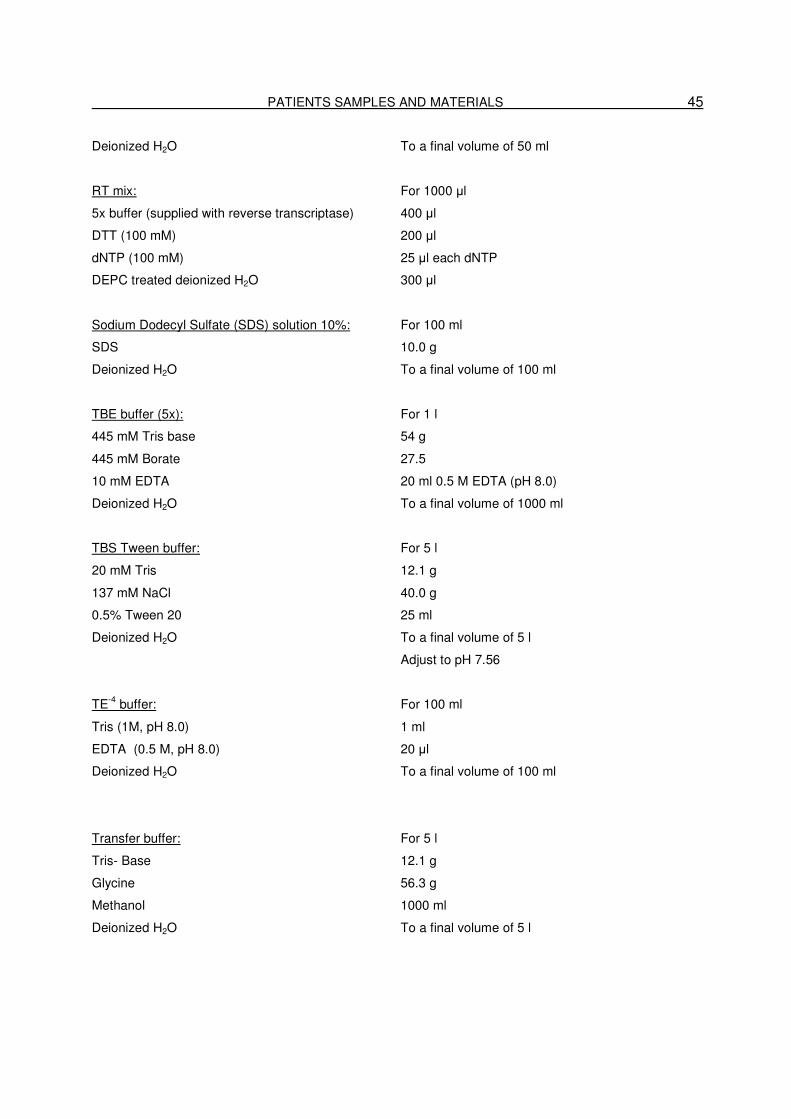
PATIENTS SAMPLES AND MATERIALS 45
Deionized H2O
RT mix:
5x buffer (supplied with reverse transcriptase)
DTT (100 mM)
dNTP (100 mM)
DEPC treated deionized H2O
Sodium Dodecyl Sulfate (SDS) solution 10%:
SDS
Deionized H2O
TBE buffer (5x):
445 mM Tris base
445 mM Borate
10 mM EDTA
Deionized H2O
TBS Tween buffer:
20 mM Tris
137 mM NaCl
0.5% Tween 20
Deionized H2O
TE-4 buffer:
Tris (1M, pH 8.0)
EDTA (0.5 M, pH 8.0)
Deionized H2O
Transfer buffer:
Tris- Base
Glycine
Methanol
Deionized H2O
To a final volume of 50 ml
For 1000 µl
400 µl
200 µl
25 µl each dNTP
300 µl
For 100 ml
10.0 g
To a final volume of 100 ml
For 1 l
54 g
27.5
20 ml 0.5 M EDTA (pH 8.0)
To a final volume of 1000 ml
For 5 l
12.1 g
40.0 g
25 ml
To a final volume of 5 l
Adjust to pH 7.56
For 100 ml
1 ml
20 µl
To a final volume of 100 ml
For 5 l
12.1 g
56.3 g
1000 ml
To a final volume of 5 l

PATIENTS SAMPLES AND MATERIALS 46
Tris-HCl (1 M pH 6.8):
Tris-HCl
Deionized H2O
Tris-HCl (1.5 M, pH 8.8):
Tris-HCl
Deionized H2O
3.9.2. Media for eukaryotic cell and tissue
culture procedures
Medium for human fibroblasts:
DMEM with 4500 mg/l Glucose, L-Glutamine,
Pyruvate (#4196-029, Invitrogen)
Fetal calf serum (Biochrom)
Penicillin-Streptomycin (Invitrogen)
Amphotericin B (PromoCell)
Medium for human EBV-transformed
lymphoblastoid cells:
RPMI 1640 Medium without L.Glutamine (#31870-
025, Invitrogen)
Fetal calf serum (Biochrom)
Penicillin-Streptomycin (Invitrogen)
Amphotericin B (PromoCell)
L-Glutamine
Medium for HEK293 cells:
DMEM w/Glutamax-I (#61965-026, Invitrogen)
Fetal calf serum (Biochrom)
Penicillin-Streptomycin (Invitrogen)
Amphotericin B (PromoCell)
Medium for undifferentiated PC12 cells:
DMEM with 4500 mg/l Glucose, L-Glutamine,
Pyruvate (#4196-029, Invitrogen)
For 400 ml
60.0 g
To a final volume of 400 ml
Adjust pH to 6.8
For 400 ml
90.5
To a final volume of 400 ml
Adjust pH to 8.8
For 556.4 ml
500.0 ml
50.0 ml
5.0 ml
1.4 ml of a stock with the concentration 250 µg/ml
For 631.4 ml
500.0 ml
120.0 ml
5.0 ml
1.4 ml of a stock with the concentration 250 µg/ml
5.0 ml of a stock with the concentration 200 mM
For 556.4 ml
500.0 ml
50.0 ml
5.0 ml
1.4 ml of a stock with the concentration 250 µg/ml
For 555.0 ml
500.0 ml

PATIENTS SAMPLES AND MATERIALS 47
Fetal bovine serum (Invitrogen)
Horse serum (Invitrogen)
Medium for differentiated PC12 cells:
DMEM with 4500 mg/l Glucose, L-Glutamine,
Pyruvate (#4196-029, Invitrogen)
Fetal bovine serum (Invitrogen)
3.9.3. Media for prokaryotic cells
LB medium:
NaCl
Yeast Extract, Applichem
Bacto-Trypton, Applichem
MgSO4
Deionized H2O
LB-agar for agar plates:
Bacto Agar, Applichem
LB medium
SOC medium, Invitrogen
25.0 ml
50.0 ml
For 525.0 ml
500.0 ml
25.0 ml
For 500 ml
5 g
2.5 g
5 g
1.2 g
Up to 500 ml
Adjust pH to 6.7-7.0
For 500 ml
7.5 g
Up to 500 ml
3.10. Software and databases:
Microsoft® Office Professional Edition 2003, Microsoft Corporation (word processing, data analysis)
Adobe Photoshop 8.0.1., Adobe systems Inc. (image editing)
EndNote 9, Thomson ResearchSoft (organization of the references)
SigmaPlot 9.0, Systat Software, Inc (creation of graphs)
OneDScan, Scananalytik (densitometric analysis of agarose gels and western blots)
Quantity One 4.5.1., Biorad (scanning and densitometric analysis of the gels and western blots)
FinchTV Version 1.3.1., Geospiza Inc. (analysis of sequencing results)
BioEdit 7.0.4.1., Tom Hall (DNA sequence alignment and analysis)
Pyro Q-CpG software, Biotage (analysis of the pyrograms)
PSQ-Assy Design, Biotage (design of pyrosequencing primers)

PATIENTS SAMPLES AND MATERIALS 48
NCBI www.ncbi.nlm.nih.gov
HUSAR http://genius.embnet.dkfz-heidelberg.de
Pfam www.sanger.ac.uk/Pfam
ENSEMBL www.ensembl.org
GDB http://www.gdb.org
UCSC Genome Browser www.genome.ucsc.edu/cgi-bin/hgGateway
Medline www.ncbi.nlm.nih.gov/PubMed
OMIM www.ncbi.nlm.nih.gov/entrez/query.fcgi?db=OMIM
iHOP www.ihop-net.org/UniPub/iHOP
NetAffx www.netaffx.com
Gene Onthology www.geneonthology.org
3.11. Primers and siRNAs
All primers were purchased from the companies MWG or Metabion and used for PCR, semi-quantitative
RT-PCR, sequencing, pyrosequencing and genotyping. Primers were delivered in lyophilized form and
subsequently diluted in HPLC water to achieve primer stock solutions with a concentration of 100 pmol/µl.
Stock solutions were stored in aliquots at -20oC and served for the preparation of working solutions with
the concentration of 10 pmol/µl.
For the candidate gene approach three SMN-interacting proteins (ZNF265, MIM: 604347; HDAC6, MIM:
300272; hnRNP-R, MIM: 607201) were chosen to be screened for mutations or nucleotide variants. All 11
exons of ZNF265 gene were sequenced on genomic level in five SMA discordant families using primers
listed in table 3.
Table 3 Oligonucleotides used to sequence the complete conding region of ZNF265 gene.
Locus # Primer name
Sequence 5’→3’ Tm (oC)
Amplicon size (bp)
-34 1905 ZNFEX1F ATAGCTGCGGGTGGCTGT 58 454
+488 1854 ZNFEX1R AAAGCTTCCACTAACAAACTC
+2205 1855 ZNFEX2-3F TTCCAGATATGTAGTGAGGAC 57 385
+2590 1856 ZNFEX2-3R CCAGATCTATTATTTTGGAAG
+3914 1857 ZNFEX4F TCTGCTTAAATGGTTCAGTCC 57 384
+4298 1858 ZNFEX4R CACTTACTGTGGCTCTACTCG
+8361 1859 ZNFEX5F TTTTTTGTTGTCTGGAGATTTG 56 367
+8728 1860 ZNFEX5R AATTTCAAAATGCTTGTCAGC
+8612 1961 ZNFEX6F AGTGCAATTTGAGTCTTCAGC 57 357
+8969 1982 ZNFEX6R TATTTTCACCAAGTGTCTGAGG
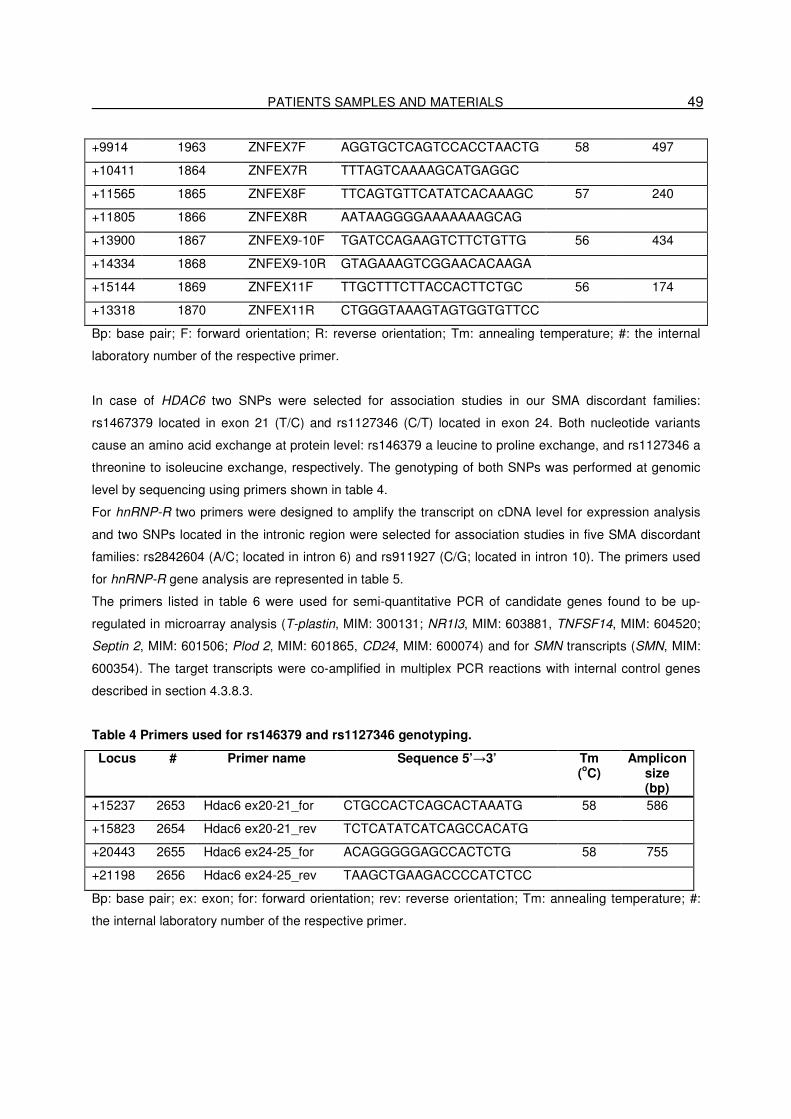
PATIENTS SAMPLES AND MATERIALS 49
+9914 1963 ZNFEX7F AGGTGCTCAGTCCACCTAACTG 58 497
+10411 1864 ZNFEX7R TTTAGTCAAAAGCATGAGGC
+11565 1865 ZNFEX8F TTCAGTGTTCATATCACAAAGC 57 240
+11805 1866 ZNFEX8R AATAAGGGGAAAAAAAGCAG
+13900 1867 ZNFEX9-10F TGATCCAGAAGTCTTCTGTTG 56 434
+14334 1868 ZNFEX9-10R GTAGAAAGTCGGAACACAAGA
+15144 1869 ZNFEX11F TTGCTTTCTTACCACTTCTGC 56 174
+13318 1870 ZNFEX11R CTGGGTAAAGTAGTGGTGTTCC
Bp: base pair; F: forward orientation; R: reverse orientation; Tm: annealing temperature; #: the internal
laboratory number of the respective primer.
In case of HDAC6 two SNPs were selected for association studies in our SMA discordant families:
rs1467379 located in exon 21 (T/C) and rs1127346 (C/T) located in exon 24. Both nucleotide variants
cause an amino acid exchange at protein level: rs146379 a leucine to proline exchange, and rs1127346 a
threonine to isoleucine exchange, respectively. The genotyping of both SNPs was performed at genomic
level by sequencing using primers shown in table 4.
For hnRNP-R two primers were designed to amplify the transcript on cDNA level for expression analysis
and two SNPs located in the intronic region were selected for association studies in five SMA discordant
families: rs2842604 (A/C; located in intron 6) and rs911927 (C/G; located in intron 10). The primers used
for hnRNP-R gene analysis are represented in table 5.
The primers listed in table 6 were used for semi-quantitative PCR of candidate genes found to be up-
regulated in microarray analysis (T-plastin, MIM: 300131; NR1I3, MIM: 603881, TNFSF14, MIM: 604520;
Septin 2, MIM: 601506; Plod 2, MIM: 601865, CD24, MIM: 600074) and for SMN transcripts (SMN, MIM:
600354). The target transcripts were co-amplified in multiplex PCR reactions with internal control genes
described in section 4.3.8.3.
Table 4 Primers used for rs146379 and rs1127346 genotyping.
Locus # Primer name Sequence 5’→3’ Tm (oC)
Amplicon size (bp)
+15237 2653 Hdac6 ex20-21_for CTGCCACTCAGCACTAAATG 58 586
+15823 2654 Hdac6 ex20-21_rev TCTCATATCATCAGCCACATG
+20443 2655 Hdac6 ex24-25_for ACAGGGGGAGCCACTCTG 58 755
+21198 2656 Hdac6 ex24-25_rev TAAGCTGAAGACCCCATCTCC
Bp: base pair; ex: exon; for: forward orientation; rev: reverse orientation; Tm: annealing temperature; #:
the internal laboratory number of the respective primer.

PATIENTS SAMPLES AND MATERIALS 50
Table 5 Primers used for hnRNP-R expression and genotyping.
Locus # Primer name Sequence 5’→3’ Tm (oC)
Amplicon size (bp)
5’ UTR 2023 hnRNP-R-ex123_for GATACCATCGGACAGGATTTC 58 474
Exon 4 2037 hnRNP-R-ex123_for TCCAGTGGTCACATCAAGTG
+16550 2004 SNP2842604_for ATTTGAAGCAGCATTGTTAATG 57 310
+16860 2005 SNP2842604_rev GATTTTGGTATAATGAGGGGG
+25039 2006 SNP911927_for CCATGCCTGGCCTATCTCAC 57 367
+25406 2007 SNP911927_rev CCCAACTAAGTTTCCTTCAGT
Bp: base pair; ex: exon; for: forward orientation; rev: reverse orientation; Tm: annealing temperature; #:
the internal laboratory number of the respective primer.
Table 6 Oligonucleotides used for semi-quantitative PCRs.
Locus # Primer name Sequence 5’→3’ Tm (oC
Amplicon size (bp)
Ex 1 575 SMN_for ATCCGCGGGTTTGCTATG 57 290
Ex 2 1927 SMN_rev GTTGTAAGGAAGCTGCAGTAT
Ex 6 2335 Septin2_for GTTGAAATTGAAGAGCGAGG 57 570
Ex 10 2336 Septin2_for AGTCATTGTGCTCTGGGTTC
Ex 4 2331 Plastin 3T_for TGATATTGCCAAGACCTTCC 58* 980
Ex 11 2332 Plastin 3T_rev AGGATTGACACCAAGAGAGTTC
Ex 1 2345 CD24_for TACCCACGCAGATTTATTCC 58* 495
Ex 1 2346 CD24_rev TGTCCATATTTCTCAAGCCAC
Ex 3 2351 TNSF14_for GAGCGAAGGTCTCACGAGGTCA 58 418
Ex 3 2352 TNSF14_rev CCAGGCGTTCATCCAGCACA
Ex 4 2353 Plod2_for AAAGGCAAACCACAAAGTGG 58* 337
Ex 7 2354 Plod2_rev ATTCTTAGCTCTGGCTTTGCC
Ex 2 2349 NR1I3_for CTACCACTTTAATGCGCTGACT 57 584
Ex 6 2330 NR1I3_rev GTCTTTGGAGACAGAAAGTGG
Ex 2 2343 NR1I3_for AATGCGCTGACTTGTGAGG 57 319
Ex 4 2344 NR1I3_rev ACAAACTGTTCAAACATGGTGC
Bp: base pair; Ex: exon; for: forward orientation; rev: reverse orientation; Tm: annealing temperature; *:
5% of DMSO solution was added to the PCR reaction; #: the internal laboratory number of the respective
primer
The primers listed in table 7 were used for sequencing of the complete coding region of the T-plastin gene
(from exon 1 to exon 16), of the 3’UTR region as well as the two regulatory elements of the gene (the
promoter region and the first part of the intron 1). T-plastin sequence (AF117295) was numbered with
nucleotide 1 representing the first transcription site. The primer locations are shown in Fig. F4 in appendix
section.
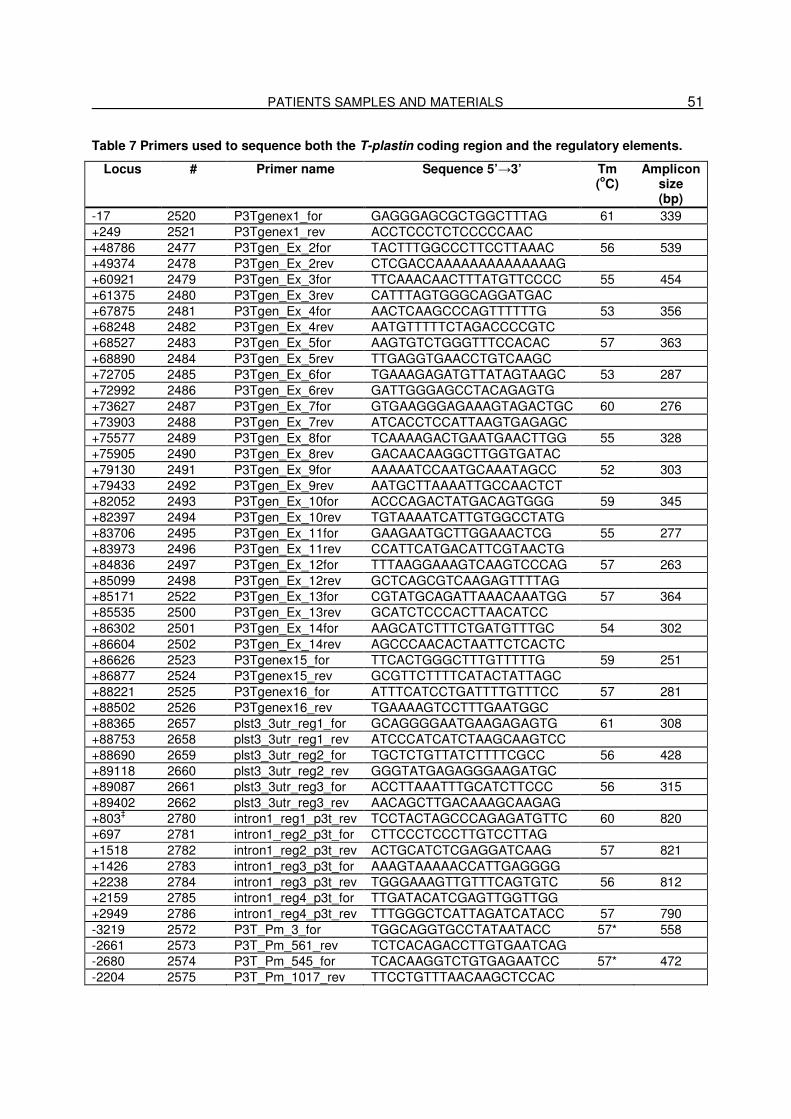
PATIENTS SAMPLES AND MATERIALS 51
Table 7 Primers used to sequence both the T-plastin coding region and the regulatory elements.
Locus # Primer name Sequence 5’→3’ Tm (oC)
Amplicon size (bp)
-17 2520 P3Tgenex1_for GAGGGAGCGCTGGCTTTAG 61 339 +249 2521 P3Tgenex1_rev ACCTCCCTCTCCCCCAAC +48786 2477 P3Tgen_Ex_2for TACTTTGGCCCTTCCTTAAAC 56 539 +49374 2478 P3Tgen_Ex_2rev CTCGACCAAAAAAAAAAAAAAG +60921 2479 P3Tgen_Ex_3for TTCAAACAACTTTATGTTCCCC 55 454 +61375 2480 P3Tgen_Ex_3rev CATTTAGTGGGCAGGATGAC +67875 2481 P3Tgen_Ex_4for AACTCAAGCCCAGTTTTTTG 53 356 +68248 2482 P3Tgen_Ex_4rev AATGTTTTTCTAGACCCCGTC +68527 2483 P3Tgen_Ex_5for AAGTGTCTGGGTTTCCACAC 57 363 +68890 2484 P3Tgen_Ex_5rev TTGAGGTGAACCTGTCAAGC +72705 2485 P3Tgen_Ex_6for TGAAAGAGATGTTATAGTAAGC 53 287 +72992 2486 P3Tgen_Ex_6rev GATTGGGAGCCTACAGAGTG +73627 2487 P3Tgen_Ex_7for GTGAAGGGAGAAAGTAGACTGC 60 276 +73903 2488 P3Tgen_Ex_7rev ATCACCTCCATTAAGTGAGAGC +75577 2489 P3Tgen_Ex_8for TCAAAAGACTGAATGAACTTGG 55 328 +75905 2490 P3Tgen_Ex_8rev GACAACAAGGCTTGGTGATAC +79130 2491 P3Tgen_Ex_9for AAAAATCCAATGCAAATAGCC 52 303 +79433 2492 P3Tgen_Ex_9rev AATGCTTAAAATTGCCAACTCT +82052 2493 P3Tgen_Ex_10for ACCCAGACTATGACAGTGGG 59 345 +82397 2494 P3Tgen_Ex_10rev TGTAAAATCATTGTGGCCTATG +83706 2495 P3Tgen_Ex_11for GAAGAATGCTTGGAAACTCG 55 277 +83973 2496 P3Tgen_Ex_11rev CCATTCATGACATTCGTAACTG +84836 2497 P3Tgen_Ex_12for TTTAAGGAAAGTCAAGTCCCAG 57 263 +85099 2498 P3Tgen_Ex_12rev GCTCAGCGTCAAGAGTTTTAG +85171 2522 P3Tgen_Ex_13for CGTATGCAGATTAAACAAATGG 57 364 +85535 2500 P3Tgen_Ex_13rev GCATCTCCCACTTAACATCC +86302 2501 P3Tgen_Ex_14for AAGCATCTTTCTGATGTTTGC 54 302 +86604 2502 P3Tgen_Ex_14rev AGCCCAACACTAATTCTCACTC +86626 2523 P3Tgenex15_for TTCACTGGGCTTTGTTTTTG 59 251 +86877 2524 P3Tgenex15_rev GCGTTCTTTTCATACTATTAGC +88221 2525 P3Tgenex16_for ATTTCATCCTGATTTTGTTTCC 57 281 +88502 2526 P3Tgenex16_rev TGAAAAGTCCTTTGAATGGC +88365 2657 plst3_3utr_reg1_for GCAGGGGAATGAAGAGAGTG 61 308 +88753 2658 plst3_3utr_reg1_rev ATCCCATCATCTAAGCAAGTCC +88690 2659 plst3_3utr_reg2_for TGCTCTGTTATCTTTTCGCC 56 428 +89118 2660 plst3_3utr_reg2_rev GGGTATGAGAGGGAAGATGC +89087 2661 plst3_3utr_reg3_for ACCTTAAATTTGCATCTTCCC 56 315 +89402 2662 plst3_3utr_reg3_rev AACAGCTTGACAAAGCAAGAG +803‡ 2780 intron1_reg1_p3t_rev TCCTACTAGCCCAGAGATGTTC 60 820 +697 2781 intron1_reg2_p3t_for CTTCCCTCCCTTGTCCTTAG +1518 2782 intron1_reg2_p3t_rev ACTGCATCTCGAGGATCAAG 57 821 +1426 2783 intron1_reg3_p3t_for AAAGTAAAAACCATTGAGGGG +2238 2784 intron1_reg3_p3t_rev TGGGAAAGTTGTTTCAGTGTC 56 812 +2159 2785 intron1_reg4_p3t_for TTGATACATCGAGTTGGTTGG +2949 2786 intron1_reg4_p3t_rev TTTGGGCTCATTAGATCATACC 57 790 -3219 2572 P3T_Pm_3_for TGGCAGGTGCCTATAATACC 57* 558 -2661 2573 P3T_Pm_561_rev TCTCACAGACCTTGTGAATCAG -2680 2574 P3T_Pm_545_for TCACAAGGTCTGTGAGAATCC 57* 472 -2204 2575 P3T_Pm_1017_rev TTCCTGTTTAACAAGCTCCAC

PATIENTS SAMPLES AND MATERIALS 52
-2225 2576 P3T_Pm_998_for TGGAGCTTGTTAAACAGGAATC 56* 406 -1818 2577 P3T_Pm_1404_rev TCAAAAAAGCTTACATTGGTCC -1850 2578 P3T_Pm_1372_for CTACCCTACTCGGACCAATG 59* 478 -1358 2579 P3T_Pm_1850_rev TTTTCTACTGGTTCAGGTTTGG -1372 2580 P3T_Pm_1836_for TGAACCAGTAGAAAATCTCCCA 56* 443 -929 2581 P3T_Pm_2279_rev AGAAAAAGTCTAAGCCCTTTCC -951 2582 P3T_Pm_2257_for AGGAAAGGGCTTAGACTTTTTC 56* 623 -328 2583 P3T_Pm_2880_rev TTGGGAACAAGAATTTGAATG -349 2584 P3T_Pm_2859_for GCATTCAAATTCTTGTTCCC 53* 396 +47 2585 P3T_Pm_3255_rev CTCAGACAACTTCTGCACCTC Bp: base pair; Ex: exon; for: forward orientation; P3T or plst3: Plastin 3 (T isoform); Pm: promoter; reg:
region; rev: reverse orientation; Tm: annealing temperature; *: 5% of DMSO solution was added to the
PCR reaction; #: the internal laboratory number of the respective primer; ‡: the forward primer used to
sequence the first region of the T-plastin 3’UTR region was primer # 2525.
The primers listed in tables 8 and 9 were used for T-plastin CpG island analysis by pyrosequencing. The
CpG island was divided in 7 regions (named from CpG1 to CpG7) and two primer pairs for each region
were designed for nested PCR amplification. In the first round primers shown in table 8 were used and in
the second round of PCR amplification the internal primers listed in table 9 were used. For each region in
the second PCR round designed primers with or without biotin label depending on the orientation of the
sequencing primer were used in pyrosequencing (see table 10). The primers listed in tables 8 and 9, as
well as all CpGs within the T-plastin genomic region are shown in Fig. F5 in appendix section.
Table 8 Primers sequences for the first round of nested PCR amplification of T-plastin CpG island.
Start Position
# Name Sequence 5’→3’ Tm (oC)
Am. (size) (bp)
Q
-291 2820 CpG1_1stbis_P3T_for AGTTAGGTATGTTGCATTT 48 364 +
+84 2821 CpG1_1stbis_P3T_rev CAAAATCCTAAATCTAACC
-31 2767 CpG2_1stbis_P3T_for GGTTGGTAGGAGGGGAGGG 57 291 -
+261 2823 CpG2_1stbis_P3T_rev AAAACTCCAACTAAAATTTCTC
+66 2824 CpG3_1stbis_P3T_for GGTTAGATTTAGGATTTTG 48 346 +
+412 2825 CpG3_1stbis_P3T_rev AACCCAAAACTAACAACAA
+240 2826 CpG4_1stbis_P3T_for GAGAAATTTTAGTTGGAGTTTT 52 382 +
+622 2772 CpG4_1stbis_P3T_rev ACTTAAACCAACCAAATCACC
+537 2915 CpG5_1stbis_P3T_for GATTTAGGAAATTT 42 276 -
+813 2916 CpG5_1stbis_P3T_rev AAAAAATACTATCCTACT
+740 2917 CpG6_1stbis_P3T_for AGTTTTTTTATGAGTAAGTA 45 269 +
+1009 2918 CpG6_1stbis_P3T_rev ATAAACACAAACAAATACAA
+796 3119 CpG7_1stbis_P3T_for AGTAGGATAGTATTTTTT 43 493 -
+1289 3120 CpG7_1stbis_P3T_rev ACCTTCTACAAAAATTC
1stbis: first round of bisulfite treated DNA; bp: base pair; CpG: CpG region; for: forward orientation P3T:
Plastin 3 (T isoform); rev: reverse orientation; Q: Q-solution; Tm: annealing temperature; #: the internal
laboratory number of the respective primer.

PATIENTS SAMPLES AND MATERIALS 53
Table 9 Oligonucleotide sequences for the second round of nested PCR amplification of T-plastin
CpG island.
Start position
# Name Sequence 5’→3’ Tm (oC)
Am. Size (bp)
Q
-256 2899 Bio-CpG1_2ndbis_P3T_for
Biotin-TAAGTAGGAAGGGGAGATTTAG
56.5 291 +
+46 2766 CpG1_2ndbis_P3T_rev CACTCAAACAACTTCTACACCT -256 2765 CpG1_2ndtbis_P3T_for TAAGTAGGAAGGGGAGATTTAG 56.5 291 + +46 2900 Bio-
CpG1_2ndbis_P3T_rev Biotin-CACTCAAACAACTTCTACACCT
+25 2967 Bio-CpG2_2ndbis_P3T_for
Biotin-AGGTGTAGAAGTTGTTTGAGTG
60 212 +
+237 2768 CpG2_2ndbis_P3T_rev ACCTCCCTCTCCCCCAACC +25 2822 CpG2_2ndbis_P3T_for AGGTGTAGAAGTTGTTTGAGTG 60 212 + +237 2901 Bio-
CpG2_2ndbis_P3T_rev Biotin-ACCTCCCTCTCCCCCAACC
+146 2902 Bio-CpG3_2ndbis_P3T_for
Biotin-TGGGTAGGAGTGGGTTT 51 223 -
+369 2770 CpG3_2ndbis_P3T_rev ACCACTTAATACAATAAAATAC +146 2769 CpG3_2ndbis_P3T_for TGGGTAGGAGTGGGTTT 51 223 - +369 2968 Bio-
CpG3_2ndbis_P3T_rev Biotin-ACCACTTAATACAATAAAATAC
+308 2903 Bio-CpG4_2ndbis_P3T_for
Biotin-GGGAGTTTTTTTATTAGTATT
52 271 -
+579 2827 CpG4_2ndbis_P3T_rev AAAAAATAACAAACTACTAACTC +308 2771 CpG4_2ndbis_P3T_for GGGAGTTTTTTTATTAGTATT 52 271 - +579 2904 Bio-
CpG4_2ndbis_P3T_rev Biotin-AAAAAATAACAAACTACTAACTC
+557 2905 Bio-CpG5_2ndbis_P3T_for
Biotin-GAGTTAGTAGTTTGTTATTTTTT
50 235 -
+792 2906 CpG5_2ndbis_P3T_rev CCAAAAATATTCTCCTACTAAA +557 2773 CpG5_2ndbis_P3T_for GAGTTAGTAGTTTGTTATTTTTT 50 235 - +792 2907 Bio-
CpG5_2ndbis_P3T_rev Biotin-CCAAAAATATTCTCCTACTAAA
+771 2909 Bio-CpG6_2ndbis_P3T_for
Biotin-TTTAGTAGGAGAATATTTTGA
52 195 +
+966 2910 CpG6_2ndbis_P3T_rev ATAAACTATTACCTCCCTCC +771 2908 CpG6_2ndbis_P3T_for TTTAGTAGGAGAATATTTTGA 52 195 + +966 2969 Bio-
CpG6_2ndbis_P3T_rev Biotin-ATAAACTATTACCTCCCTCC
+917 3123 Bio-CpG7_2nd_P3T_for
Biotin- TTTGGAGAGAGAGAGT 40.3 327 -
+1272 3122 CpG7_2nd_P3T_rev TCAACCTTCTACACCAC +917 3121 CpG7_2nd_P3T_for TTTGGAGAGAGAGAGT 40.3 327 - +1272 3124 Bio-
CpG7_2nd_P3T_rev Biotin- TCAACCTTCTACACCAC
2ndbis: second round of bisulfite treated DNA; bio: biotin; bp: base pair; for: forward orientation; CpG:
CpG region; P3T: Plastin 3 (T isoform); rev: reverse orientation; Q: Q-solution; Tm: annealing
temperature; #: the internal laboratory number of the respective primer.

PATIENTS SAMPLES AND MATERIALS 54
Table 10 Sequencing primers used to analyse T-plastin CpG island.
CpG region # Primer orientation
Sequence 5’→3’ Examined CpGs
CpG1 2955 For TTTGGGTGTTTATTTT -155 2920 For AGTTGATGTGATAGG -111 2956 Rev CCACCATTAACT -63, -80 2922 Rev CCTCCTACCAACCCCC -37, -45, -49, -52 2921 Rev CTCAAACAACTTCTACA +23, -10
CpG2 2923 For TGTAGAAGTTGTTTG +47, +54, +57, +64 2924 For TAAGTGTTTTGTA +110, +113, +116, +131,
+141 2957 Rev CCTACAAAACACTTA +93, +85 2925 For TGGGTAGGAGTGGGTTT +163, +174 3108 For GTTAAGTTTAGTAGG +196, +200, +203, +208,
+215 CpG3 2927 Rev TCACTCACACCCAT +288, +282, +278
2965 For GGGAGAGGGAGG +238 2966 For AAATGGGTGTGAGT +306, +329, +332, +340
CpG4 2929 For AGTTTGGGTTGGAGT +424, +450, +453, +458, +464
2960 For AAGTGGAAAGGGAG +480, +498 2930 Rev TAACAAACTACTAA +555, +539, +535
CpG5 2961 Rev TCTCCAAAACCCCAAAAT +623, +600, +595, +591 2962 Rev AAACCTCATACCTTCCCT +669, +657, +651 2932 Rev AATACTTACTCATAAA +733, +729, +727, +724,
+718 CpG6 2963 For AGTAGGATAGTATTTT +814
2964 Rev ACCTCTCTCTCTCCAAAAAT +913, +902, +893, +890, +885, +881, +879, +877, +873, +867
3110 Rev ATAAACTATTACCTCCC +945, +942 CpG7 3127 For TTGTAATGAGAGG +1051,+1057, +1060, +1070,
+1083 3128 For TTAGTTTTAAAGTTG +1104, +1107, +1110 3129 For TTAGTGTGTTGGT +1129, +1135, +1139,
+1142, +1149, +1154, +1172 3133 Rev AACCTCTCATTAC +1034, +1021 3134 Rev CACAAACAAATACAA +983, +972
For: forward orientation; CpG: CpG region; Rev: reverse orientation; #: the internal laboratory number of
the respective primer.
The primers used to amplify and to genotype 15 tagging SNPs within the T-plastin genomic region are
listed in table 11. All primers were designed using PSQ-Assay software.

PATIENTS SAMPLES AND MATERIALS 55
Table 11 Primer sequences and genotyping details.
# Name Label Sequence 5’→3’ Tm
(oC)
Am.
Size
(bp)
Alleles
3148 rs17096100_for - GGGGCTGTATTACTTGGCCTTAAA 71.5 234 A/C
3149 rs17096101_rev biotin ATGACGTGTAAGGTCCCAACAAC
3150 rs17096102_seq - CAATAATAAAACTGATGAAG
3151 rs10875528_for biotin AGGGAACATGGATAAAGAACAAGA 69 106 G/T
3152 rs10875529_rev - CACTGGTGTTTTAAAACGCTGAAT
3153 rs10875530_seq - TGTTAAAAAATATGTATACC
3154 rs17326695_for - TTGGCCTCACATATTCAGAAATC 69 184 C/T
3155 rs17326695_rev biotin TTGGAGGCTTCCTATGAAAAAAGT
3156 rs17326695_seq - GGCTAGTGCTGTGGAG
3157 rs1557770_for biotin GTTCCCCAACATGCCGTTA 70 234 G/T
3158 rs1557770_rev - TGCAGGGAGAGGAGAATGGT
3159 rs1557770_seq - ATCTTGTGGGATTAATAAA
3160 rs2522179_for - CCAGGAAATGATGAAGGCTATTGA 71 238 C/T
3161 rs2522179_rev biotin TGAATGCATGGGTTGGCTTAT
3162 rs2522179_seq - AGAGCCAAATTATCATTAAG
3163 rs2522180_for - GCCCTTTGGCAAGAAAACGA 72 155 A/T
3164 rs2522180_rev biotin TGGGGACTTCTGCATACATGAAT
3165 rs2522180_seq - GAGCCACACCCCATT
3166 rs17326716_for biotin AGAAGCCAGCGTCTTAAAAGCTAT 69 117 A/T
3167 rs17326716_rev - TGCCCTAGTCTAAGATTAACCTCG
3168 rs17326716_seq - GTCTAAGATTAACCTCGTCA
3169 rs2522188_for - GATTGAATGCAGAAGCAGATATGA 68.5 216 C/T
3170 rs2522188_rev biotin TCAAAAATTGCGACTACGAAAC
3171 rs2522188_seq - TTCTAGGTTAAACATTAAAG
3175 rs6643869_for - GGGTTATTGGAGCAGTGTACGT 69 173 A/G
3176 rs6643869_rev biotin TGTGACTGAAGGCTAACTCTACCC
3177 rs6643869_seq - AGGTTTTAGATATATCCAAG
3178 rs5987946_for biotin TGTCATCCTGCCCACTAAATGTAC 71 208 C/T
3179 rs5987946_rev - CGGGAGAGAGAACACTTCAAAGA
3180 rs5987946_seq - CAGTGCTCTTTTTCTCAAT
3181 rs5987947_for biotin GGCTCACCATAGCAAGTGAAAT 69 240 C/T
3182 rs5987947_rev - ATGGCCCTCGATCTTCTGA

PATIENTS SAMPLES AND MATERIALS 56
3183 rs5987947_seq - ACTTAGTCAATTTGCTTCTT
3184 rs5987956_for - CTAGAAGAGATAGGAAGGGCCTCA 69 68 C/T
3185 rs5987956_rev biotin AATGACAGGAGAGAAGCCAAATA
3186 rs5987956_seq - ATAGGAAGGGCCTCA
3187 rs5987763_for biotin AATACAGATTTTGCTGGGTCTGCT 70.5 158 A/G
3188 rs5987763_rev - CATTTGGGGGCATAGCATTT
3189 rs5987763_seq - AAGGAATAGTGTACTACAAT
3190 rs2843611_for biotin TGACTGTGGATGAATGAAACATAA 68.5 159 A/G
3191 rs2843611_rev - TCGAGTCGCTTAATGTAAAGCC
3192 rs2843611_seq - ACCACTTTTTAATCCTCTC
3193 rs12390767_for biotin TTTTACAAGGTCCCATGAGTTGAG 70 164 C/T
3194 rs12390767_rev - AGGGCTAGACAGGAATCAGATCA
3195 rs12390767_seq - ATCAAGTATGTGACATTTCT
Am: amplicon; Bp: base pair; for: forward orientation; rev: reverse orientation; seq: primer used for
sequencing; Tm: annealing temperature; #: the internal laboratory number of the respective primer.
In addition, four small interfering RNAs (siRNAs) have been used for the transfection experiments of rat
PC12 cells. They are listed below:
• Rn_PLS3_2HPsiRNA, #SI07192366, Qiagen (target: rat T-plastin transcript)
• Rn_PLS3_3HPsiRNA, #SI01962373, Qiagen (target: rat T-plastin transcript)
• Rn-SMN1_1HPsiRNA, #SI00265860, Qiagen (target : rat SMN1 transcript)
• AllStar Negative Control siRNA, #1027280, Qiagen
All siRNA were pre-designed by the Qiagen company based on the rat T-plastin or SMN transcripts. The
siRNAs were delivered in lyophilized form. To obtain a 20 µM stock solution, 250 µl siRNA Suspension
Buffer (Qiagen), were added to 5 nmol siRNA. Subsequently, the dilution was incubated at 90oC for 1 min
and at 37oC for another 60 min according to the manufacturer’s protocol to disrupt higher aggregates.
Stocks were stored at -20oC and further diluted with siRNA Suspension Buffer to obtain 1 µM working
dilutions prior to use.
METHODS 57
4. METHODS
4.1. Prokaryotic cells
4.1.1. Bacteriology
Escherichia coli has been engineered to improve culture performance and synthesis of a recombinant
protein. Experiments using E. coli cells should always be done on fresh cultures, either from a freshly
streaked plate or from a glycerol stock. The E. coli cultures are routinely cultured at 37oC on Luria-Bertani
(LB) agar or in LB broth containing Ampicillin (30 µg/ml). Most strains of bacteria including E. coli can be
stored for one to two years in glycerol solution at -20oC. At -70oC they can be stored almost for life time.
0.5 ml of glycerol solution was prepared in 2 ml screw-cap vial. 1 ml of an overnight-grown culture was
transferred into the vial, throughly vortexed and stored at -70oC. To revive a stored strain, some culture
was streaked on the LB plate containing appropiate antibiotics for a single colony.
4.1.2. Transformation of bacteria by heat-shock
In bacteria, transformation refers to a genetic change brought about by taking up and expressing DNA and
competence refers to the state of being able to take up DNA. Artificial competence is not encoded in the
cell's genes. Instead it is induced by laboratory procedures in which cells are passively made permeable
to DNA, using conditions that do not normally occur in nature. These procedures are comparatively easy
and simple, and are widely used to genetically engineer bacteria. Artificially competent cells of standard
bacterial strains may also be purchased frozen, ready to use. Chilling cells in the presence of divalent
cations such as Ca2+ (in CaCl2) prepares the cell walls to become permeable to plasmid DNA. Cells are
incubated with the DNA and then briefly heat shocked, which causes the DNA to enter the cell. This
method works well for circular plasmid DNAs but not for linear molecules such as fragments of
chromosomal DNA.
Two µl of the cloning reaction were added into a vial of One Shot ® TOP10 chemically competent cells E.
coli (Invitrogen), mixed gently and incubated on ice for 25 min. The cells were heat-shocked for 30 sec at
42oC in a water bath and immediately transferred to ice. Two hundred fifty µl of room temperature SOC
medium were added, the tubes tightly capped were shaking horizontally at 37oC at 200 rpm for 1 h. Two
different volumes from each transformation (50 µl and 100 µl, respectively) were plated on prewarmed
selective plates (containing 80 µg ampicillin) and incubated overnight at 37oC. From the each plate 8
colonies were picked and resuspended in 10 µl of ddH2O. Two µl of resuspended colonies were used to
direct analysis by PCR of the positive transformants. A combination of T7 forward primer
(T7_promoter_for: 5’-TAATACGACTCACTATAGGG-3’, Invitrogen) and the reverse primer that binds
within the insert has been used. The reactions were incubated 10 min at 94oC to lyse the cells and to
inactivate nucleases. The PCR products were visualized by agarose gel electrophoresis. Once a correct

METHODS 58
clone was identified, the remaining resuspended colony was used to inoculate a liquid culture for DNA
extraction and long term storage.
4.2. Eukaryotic cells
4.2.1. Cell culture
4.2.1.1. EBV transformation of peripheral blood lymphocytes
Epstein Barr Virus (EBV) transformation is a reliable method to immortalize mammalian cells.
Transformation of peripheral blood lymphocytes by EBV is a laboratory procedure developed as a
combination of a sound scientific operation and state-of-the-art technology involving tissue culture.
Immortalization of cells takes 6-8 weeks to generate large amounts of cells that can be indefininitely
grown as a continuing source of genetic material, RNA and proteins.
Heparinized blood cells were transferred to 50 ml Falcon tubes, treated with 40 ml of lysis buffer to lyse
red blood cells and incubated for 10 min at room temperature. Samples were then centrifuged at 1,500
rpm for 10 min at room temperature. The supernatant was carefully removed and another 40 ml lysis
buffer added to the pellets. Samples were centrifuged in the same conditions and the supernatant was
completely removed with a pipette and 2 ml of EBV supernatant were added and mixed well. Tubes were
incubated for 1 h at 37oC to allow the infection of B lymphocytes by EBV. Three ml of RPMI medium
(Invitrogen) supplemented with 25 % FCS, 1 % P/S, 1 % L-glutamine and 0.3 % Amphotericin were added
to the tubes and the content was then transferred to sterile flasks that contained 10 µl of cyclosporine (10
µg/ml). The cells usually start showing morphological changes after 3 to 4 days when dividing cells can be
seen as dumbbell shaped structures under an inverted microscope. Typical morphological changes
manifested by an actively growing cell culture comprise cellular clumps which can be seen with a naked
eye. Usually it takes six to eight weeks to obtain a fully transformed culture showing typical manifestation
of big cellular masses.
4.2.1.2. EBV-transformed lymphoblastoid cell culture
EBV infects only certain mammalian epithelial cells and B lymphocytes. In vitro, EBV immortalizes B-cells
by activating a number of cell cycle regulating genes as well as B-cell specific genes (Gussander and
Adams 1984; Klaman and Thorley-Lawson 1995). Usually B-cell infections are latent and only strong
stimulation can cause the lytic cycle. EBV DNA is replicated as an episomal ring and 10-20 copies per cell
are typical (Gussander and Adams 1984) . The cell lines from human lymphocytes serve as a permanent
source for DNA, RNA and protein isolation and this technique has found widespread use as the principal
method of generating a permanent source of DNA for genotyping.

METHODS 59
Epstein-Barr virus-transformed lymphoblastoid cells from type I–III SMA patients, discordant siblings and
control individuals were transferred into 40 ml flasks using RPMI 1640 Medium (Invitrogen). Cells were
incubated for 2-4 weeks at 5 % CO2 and 37°C.
4.2.1.3. Human fibroblasts cell culture
Interesting opportunities have arisen in the past to carry out biochemical studies on cultures of fibroblasts
from biopsies taken from humans. Cell culture provides a powerful tool for studying the role of fibroblasts
in various contexts (Witowski and Jorres 2006). Skin material obtained from primary culture of fibroblasts
was obtained from surgical specimens that are disposed.
2x10⁵
cells of fibroblast cultures derived from SMA patients, discordant siblings and control individuals
were transferred into 10 cm dishes using DMEM medium with 4500 mg/L glucose, L-glutamine and
pyruvate (Invitrogen). Cells were incubated for 2-3 days at 5 % CO2 and 37°C.
4.2.1.4. HEK293 cell culture
HEK293 cells were generated by transformation of human embryonic kidney cell cultures (hence HEK)
with sheared adenovirus 5 DNA, and were first described in 1977 (Graham et al. 1977). Standard HEK293
cells do not adhere well to tissue culture dishes and this line has been extensively used as an expression
tool for recombinant proteins (Thomas and Smart 2005).
2x10⁶ HEK293 cells were seeded onto 10x14 cm Petri dishes and cultured at 37oC in 5 % CO2 in
Dulbecco’s Modified Eagle Medium (DMEM) containing 4 mM L-glutamate, 4.5 mg/ml glucose and 0.11
mg/ml sodium pyruvate (Invitrogen), supplemented with 100 U/ml Penicillin and 100 µg/ml Streptomycin
until >90 % confluence.
4.2.1.5. PC12 cell culture
PC12 cells are a secondary cell line that was originally derived from a pheochromocytoma (a tumor of the
adrenal gland) that developed in an irradiated rat. Under ordinary culture conditions, they have properties
similar to those of immature rat adrenal chromaffin cells (Greene and Tischler 1976). PC12 cells represent
a useful model for the analysis of neuronal differentiation (Greene and Tischler 1976).
PC12 cells were plated on the collagen-coated dishes or coverslips (BD Bioscience). Undifferentiated
adherent PC-12 cells were cultured in DMEM supplemented with 10 % horse serum, 5 % fetal bovine
serum, 1:100 dilution of Pen/Strep. Cells were grown at 37oC in 5 % CO2.
METHODS 60
4.2.1.6. PC12 differentiation: treatment of PC12 cells with NGF
One important feature of PC12 cells is their ability to respond to nerve growth factor (NGF), and therefore
they serve as a model system for primary neuronal cells. NGF-treated PC12 cells cease proliferation,
grow long neurites, and show changes in cellular composition associated with neuronal differentiation
(Greene and Tischler 1976). When grown in the presence of nerve growth factor (NGF), PC12 cells
extend neurites, become electrically excitable, become more responsive to exogenously applied
acetylcholine, have increased numbers of calcium channels, and increase the biosynthesis of several
neurotransmitters (Greene et al. 1982).
When cells were 50-60 % confluent, the medium was removed, cells washed one time with PBS and
differentiated in DMEM with 5 % fetal bovine serum (low-serum conditions) supplemented with 100 ng/ml
NGF. Differentiation was complete after 3-4 days.
4.2.1.7. Cell harvesting and freezing
Cryogenic preservation (storage below -100°C) of cell cultures is widely used to maintain backups or
reserves of cells without the associated effort and expense of feeding and caring for them. A wide variety
of chemicals provide adequate cryoprotection. However, dimethylsulfoxide (DMSO) and glycerol are the
most convenient and widely used. DMSO is most often used at a final concentration of 5 to15 % (v/v).
Prior to freezing cells were maintained in an actively growing state to insure maximum health and a good
recovery. The culture medium was changed the previous day.
Adherent cells were harvested by trypsinization and the trypsin was neutralized by adding a double
volume of medium and transferred to a centrifuge tube. Cells were centrifuged for 10 min at 1500 RPM
and the supernatant was discarded. Cells were resuspended in 1 ml 90 % FCS and 10 % DMSO sterile
filtered through an 0.2 µM filter.
When PC12 cells were 70-90 % confluent, cells were dislodged from the dish, collected by low speed
centrifugation, and frozen in DMEM with 15 % FBS and 10 % DMSO.
EBV-transformed lymphoblastoid cells were centrifuged for 10 min at 1500 RPM and the supernatant was
discarded. Cells were resuspended in 1 ml 90 % RPMI 1640 medium, 9 % DMSO and 1 % FCS sterile
filtered through a 0.2 µm filter.
Freezing samples were placed in styrofoam container with lid and frozen at –80oC. Once frozen, cells
were stored in a liquid nitrogen tank.
4.2.1.8. Cell thawing and recovery
Using appropriate safety equipment, the vials were removed from its storage location and transferred to a
37oC water bath to thaw. Rapid thawing (60-90 sec at 37oC) provides the best recovery for most cell
cultures; it reduces or prevents the formation of damaging ice crystals within cells during rehydration. The

METHODS 61
content of the vials was then transferred to a 50 ml Falcon tube and cell samples centrifuged 10 min at
2,000 rpm. The supernatant was discarded and cells resuspended in 5 ml of medium, transferred to a
suitable flask or culture dish and incubated under normal conditions.
4.3. DNA techniques
4.3.1. Plasmid preparation (Mini prep) using Quantum Prep® Plasmid MiniPrep Kit (Bio-Rad)
The original alkaline lysis method for purifying plasmid DNA from bacterial cultures requires organic
reagents to obtain high-quality DNA. This kit uses a proprietary silica matrix to bind DNA. Two ml of an
overnight culture were transferred to a microcentrifuge tube and cells were pelleted by centrifugation for
30 sec at top speed. All supernatant was removed by pipetting. The cell pellet was completely
resuspended with 200 µl of the Cell Resuspension Solution by vortexing. 250 µl of Cell Lysis Solution
were added and mixed by gently inverting the capped tube about 10 times. When cell lysis had occured,
the solution became viscous and slightly clear. 250 µl of Neutralization Solution were added and a visible
precipitate formed after inverting the capped tube about 10 times. Cell debries were pelleted for 5 min in a
microcentrifuge. While waiting for the centrifugation step, a spin column was inserted into a 2 ml Wash
Tube. The supernatant was transferred to a spin Column and 200 µl of throughly suspended matrix were
added and mixed up and down. Samples were centrifuged for 30 sec at high speed. The filtrate was
discarded and the matrix was washed twice with 400 µl of Wash Buffer by centrifugation for 30 sec. After
the last wash, samples were centrifuged at top speed for 2 min to remove residual traces of ethanol. The
column was placed in a clean 1.5 ml tube and 100 µl of deionized water were added to elute DNA. After a
centrifugation step at top speed, the columns were discarded and the eluted DNA stored at -20oC.
4.3.2. DNA isolation from fresh blood
Human genomic DNA can be isolated from fresh blood either by phenol/chloroform method or by salting
out procedure (Miller et al. 1988). The salting out procedure was used to extract DNA from fresh blood.
This procedure avoids using phenol and chloroform by using high salt concentrations to remove proteins.
It is rapid, safe and inexpensive. Ten ml of blood sample were collected in tubes containing EDTA as anti-
coagulant and then transferred to a 50 ml Falcon tube and supplemented with lysis buffer to a final volume
of 50 ml. After mixing and incubation on ice for 15 min, samples were centrifuged at 4oC and 2,000 rpm for
15 min. the supernatant was discarded and the remaining leukocytes pellet was suspended in 10 ml of
nucleus lysis buffer. After addition of 700 µl 10 % SDS solution and 400 µl Pronase E solution (20 mg/ml),
samples were shaken at 37oC in a water bath overnight. On the next day, digested cell lysates were
supplemented with 3.2 ml saturated NaCl solution vigourously mixed and centrifuged two times at 4,000
rpm for 10 min. The supernatant was then transferred to a new 50 ml Falcon tube, the protein pellet was

METHODS 62
discarded. After precipitating the DNA from the supernatant using isopropanol, the DNA was fished with a
glass stick, washed with 70 % ethanol, air dried, and finally diluted in 200 to 500 µl TE-4.
4.3.3. DNA isolation from cell culture
DNA extraction is a routine procedure to collect DNA for subsequent molecular analysis. There are three
basic steps in a DNA extraction: first, the cells are broken by grinding and the membrane lipids are
removed by adding a detergent. Second, the cellular and histone proteins are removed by adding a
protease, by precipitation with sodium or ammonium acetate, or by using a phenol-chloroform extraction
step. Third, the DNA is precipitated in cold ethanol or isopropanol. DNA is insoluble in alcohol and clings
together. In this step is also the salt removed.
Genomic DNA was isolated from EBV-transformed lymphoblastoid cell lines from SMA patients, controls
and SMA discordant families. Cells were transferred into a 50 ml Falcon tube and centrifuged for 10 min at
2,000 rpm at room temperature. The supernatant was removed and 2.7 ml of cell lysis buffer were added
to the cells and incubated overnight at 37oC to extract DNA. After the incubation time 2 vol of isopropanol
were added and the tubes were inverted till the DNA became visible. Tubes were centrifuged at +4oC for
20 min at top speed. Carefully the supernatant was discarded, removed and pellets were washed with 70
% ethanol and centrifuged in the same conditions. After removing the supernatant, samples were allowed
to dry at room temperature for 20 min and let to dissolve in 100 µl of HPLC water for three days at room
temperature.
4.3.4. DNA electrophoresis
4.3.4.1. Agarose gel
Gel electrophoresis is a technique used to separate macromolecules (nucleic acids) that differ in size,
charge or conformation. When nucleic acid molecules that have a consistent negative charge imparted by
their phosphate bone, are placed in an electric field, they migrate toward the anode. Agarose is a
polysaccharide extracted from seaweed. It is typically used at concentrations of 0.5 to 3 %. Agarose gels
have a large range of separation, but relatively low resolving power. For DNA fragments from about 150 to
800 bp an agarose gel of 2 % concentration was prepared by dissolving the proper amount in TBE buffer.
For the fragment larger than 800 bp an 1 % agarose gel was used.
4.3.4.2. Sequencing gel
The purpose of sequencing is to determine the order of the nucleotides of a DNA fragment. After the
sequencing reaction, the mixture of strands, all of different length and all ending with a radioactive label
have to be separated. This is done on a acrylamide gel, which is capable of separating DNA molecules on

METHODS 63
a gel electrophoresis. Smaller fragments migrate faster, so the DNA molecules are separated according to
their size.
The products for in vivo footprinting analysis were run on a 20 % sequencing gel. The gel was prepared
as follows: 40 g urea were dissolved in 16 ml acrylamide/bisacrylamide (19:1), 8 ml TBE buffer and HPLC
water up to 80 ml. The solution was filtrated to remove the urea crystals. Carefully, both plates were
cleaned first with ddH2O. The front plate was then cleaned three times with 70 % ethanol and the back
plate once with 70 % ethanol and then treated with BlueSlick (Serva). When the gel was ready to apply,
400 µl APS and 55 µl TEMED were added to the gel. Once polymerized (after 2-3 h) the gel was
assembled in the electrophoresis tank and filled with 1x TBE as buffer. Samples were heated at 95oC for 5
min, cooled on ice, spun briefly and loaded. The gel was run at 40 W constant power, until the loading
buffer reached the bottom of the gel.
4.3.5. Construction of gene constructs and DNA cloning
Cell cloning requires that the foreign DNA fragments which are introduced into a host cell must be able to
replicate. If not, the foreign DNA would soon be diluted out as the host cell undergoes many rounds of cell
division. However, foreign DNA fragments will generally lack an origin of replication that will function in the
host cell. They require, therefore, to be attached to an independent replicon so that their replication is
controlled by the replicon's origin of replication. Plasmids are small circular double-stranded DNA
molecules which individually contain very few genes. Their existence is intracellular, being vertically
distributed to daughter cells following host cell division, but they can be transferred horizontally to
neighboring cells during bacterial conjugation.
The PCR products were cloned in the pcDNA3.1 vector using the pcDNA3.1/V5-His© TOPO© TA
Expression Kit (Invitrogen) which provides a highly efficient one-step cloning strategy for the direct
insertion of Taq polymerase-amplified PCR products. Because this vector does not contain an ATG
initiation codon, the native initiation codon was included to express the desired protein. The PCR products
were cloned in frame with the V5 epitope and polyhistidine tag in order to detect and/or purify the tagged
protein (a map of the construct is summarized in Fig. F2 in appendix section).
Table 12 Components for cloning reactions.
Reagent Volume
Fresh PCR product 4 µl
Salt solution 1 µl
TOPO© vector 1 µl
Total reaction 6 µl
The primers used to clone T-plastin were primers #2454 (T-plastin_for: 5’-
GAGGTGCAGAAGTTGTCTGAG-3’) and #2586 (T-plastin_rev: 5’- CACTCTCTTCATTTCCCTGC-3’)

METHODS 64
using as template RNA isolated from one primary fibroblast line. The PCR reactions were set in 25 µl
reaction volume using 2 µl cDNA as described in section 4.3.8.1. The PCR products were checked by
agarose gel electrophoresis. The TOPO© cloning reaction was set as shown in table 12.
The reactions were mixed gently and incubated for 25 min at room temperature. The reactions were
placed on ice and proceed to One Shot® Chemical Transformation as described in Section 1.1. Two
different volumes from each transformation (50 µl and 100 µl, respectively) were plated on prewarmed
selective plates (containing 80 µg ampicillin) and incubated overnight at 37oC. From each plate 8 colonies
were picked and resuspended in 10 µl of ddH2O. Two µl of resuspended colonies were used to direct
analysis by PCR of the positive transformants. A combination of T7 forward primer (see section 4.1.2) and
the reverse primer that binds within the insert has been used. The reactions were incubated 10 min at
94oC to lyse the cells and to inactivate nucleases. The PCR products were visualized by agarose gel
electrophoresis. Once a correct clone was identified, the remaining resuspended colony was used to
inoculate a liquid culture for DNA extraction and long term storage (GVO# 300: pcDNA 3.1-T-plastin-V5
vector).
4.3.6. Sequencing
4.3.6.1. Big-Dye sequencing
DNA sequencing, first devised in 1975, has become a powerful technique in molecular biology, allowing
analysis of genes at the nucleotide level. The ideal working temperature for the polymerase is 60oC
(normally it is 72oC), but because it has to incorporate dNTPs which are chemically modified with a
fluorescent label, the temperature is lowered. Cycle sequencing was performed with the BigDye®
Terminator v1.1 Cycle Sequencing Kit according to the manufacturer’s instruction (Applied Biosystem),
using 60 ng of template DNA (PCR product) or 300 ng of plasmid DNA, respectively. To the reaction tubes
1 µl Mix, 1 µl primer (see table 3 for ZNF265 gene, table 4 for HDAC6, table 5 for hnRNP-R and table 7 for
T-plastin gene), and 3 µl of 5 x sequencing buffer were added in a total volume of 12 µl. Cycle sequencing
included a 5 min initial denaturation at 94oC followed by 26 cycles of 10 sec at 94oC, 5 sec at 50oC and 4
min at 60oC, with a final extension of 7 min at 72oC.
4.3.6.2. Clean-up of dye-terminator sequencing reactions
The purification of the sequencing products was performed using DyeExTM 2.0 Spin Kit (Qiagen). The
DyeEx 2.0 procedure is based on the gel-filtration chromatography, which separates molecules according
to their molecular weight. When sequencing reactions are applied onto DyeEx 2.0 spin column, impurities
such as dye terminators and salts diffuse into the pores and are retained in the gel-filtration material while
DNA fragments, which are too large to enter the pores, are eluted in the flow-through. Spin columns were
gently vortexed to resuspend the resin and the cap of columns was removed. The bottom closure of the
METHODS 65
spin columns was snaped off and spin columns were placed in a 2 ml collection tube. Columns were
centrifuged for 3 min at 3,000 rpm. Carefully the spin columns were transferred to clean centrifuge tubes
and the sequencing reactions were applied slowly to the gel bed. The sequencing reaction was pipetted
directly onto the center of the gel-bed surface and then centrifuged in the same conditions. Spin columns
were removed from the microcentrifuge tubes and the eluated DNA samples were then dried in a vacuum
centrifuge.
4.3.6.3. Pyrosequencing
Pyrosequencing is a DNA sequencing technique that is based on the detection of released pyrophosphate
(PPi) during DNA synthesis. In a cascade of enzymatic reactions, visible light is generated that is
proportional to the number of incorporated nucleotides (Ronaghi 2001). This method presents a DNA-
template-primer complex with a dNTP in the presence of exonuclease-deficient Klenow DNA polymerase.
The four nucleosides are sequencially added to the reaction mix in a predetermined order. If the
nucleotide is complementary to the template base and thus incorporated, PPi is released. PPi is used as
substrate, together with adenosine 5’-phosphosulfate (APS), by ATP sulphurylase, which results in the
formation of adenosine triphosphate (ATP). Luciferase then converts the ATP to oxyluciferin, AMP and
PPi and visible light that is detected by either a luminometer or charge-coupled device. The light produced
is proportional to the number of nucleosides added to the extended primer chain, and results in a peak
indicating the number and the type of the nucleotide present in the form of a program (Fakhrai-Rad et al.
2002). After generation of the template by PCR the product is purified using streptavidin-coated magnetic
beads. Two applications of pyrosequencing were approached: the genotyping of single-nucleotide
polymorphisms and methylation analysis. For analysis of SNPs by pyrosequencing, the 3’ end of a primer
is designed to hybridize one or a few bases before the polymorphic position. For the CpG methylation
analysis, the design is flexible, as the distance from the first base to be sequenced can be varied. The
primer can usually be positioned in a region free of CpG sites. The approach uses bisulfite treatment and
PCR to differentiate methylated cytosines from unmethylated cytosines. Pyrosequencing was carried out
using PSQ 96MA System (Biotage) according to the manufacturer’s protocol, including single strand
binding protein (PyroGold reagent).
In a 96-well PCR plate containing 25 µl PCR reaction, 70 µl of mix containing 3 µl Streptavidin Sepharose
HP beads, 50 µl binding buffer and 17 µl HPLC water were added. The plate was vortexed for 10 min at
room temperature to keep the beads dispersed. Then, the Vacuum Prep Tool was slowly lowered into the
PCR plate to capture the beads containing the immobilized templates on the filter probes. The Vacuum
Prep Tool was moved in 70 % ethanol for 5 sec, then in denaturation solution (10 mM NaOH) for 5 sec
and in washing buffer for 5 sec as well. After releasing the vacuum, the beads were released in a PSQ 96
Plate Low, pre-filled with 0.5 µM sequencing primer (see table 10 for methylation analysis and table 11 for
haplotype analysis) in 40 µl annealing buffer by moving the Vacuum Prep Tool in small circles rubbing the
filter probes against the bottom of the wells. The plate with samples was heated at 85oC for two min and
METHODS 66
then let cool at room temperature. The enzyme and substrate, as well as nucleotides, were pipetted
according to the volume information given in the PSQ CpG Software or in the PSQ 96 MA SNP software
v2.1. All samples were analyzed in the PSQ 96 instrument (Biotage).
4.3.6. DNA modification: bisulfite treatment
Methylation of cytosines located 5’ to guanosine is known to have a profound effect on the expression of
many eukaryotic genes (Bird 1992). In the bisulfite reaction, all unmethylated cytosines are deaminated
and sulfonated, converting them to uracils, while 5-methylcytosines remain unaltered.
The bisulfite modification of DNA samples was performed using CpGenomeTM DNA Modification Kit
(Qbiogene).
One µg DNA in 100 µl of water (10 ng/ml) together with 3M NaOH were mixed and incubated 10 min at
50oC on a heat block. 550 µl of freshly prepared DNA Modification Reagent I were added to the samples
and incubated at 50oC for 16 h in a heat block. During this incubation time, bases are exposed by
denaturing the DNA to its single stranded form using mild heat at an alkaline pH. Reagent I contains a
sodium salt of bisulfite ion (HSO4-) that causes unmethylated cytosine to be sulfonated and hydrolytically
deaminated, yielding a uracil sulfonate intermediate. After 16 h incubation with Reagent I, 5 µl of well-
suspended DNA Modification Reagent III were added to the DNA samples together with 750µl of DNA
Modification Reagent II and mixed briefly.
DNA solutions were incubated at room temperature for 10 min. During this incubation time DNA is bound
to a micro-particulate carrier (Reagent III) in the presence of another salt (Reagent II). Samples were
centrifuged for 10 sec at 5,000 x g to pellet the DNA Reagent III. DNA was desalted by adding 1 ml of 70
% EtOH and centrifuged for 10 sec at 5,000 x g. The supernatant was discarded and this step was
repeated for a total of three times. After the supernatant from the third wash has been removed, the tubes
were centrifuged at high speed for 2 min and the remaining supernatant removed with a plastic pipette tip.
The conversion to uracil was completed by alkaline desulfonation and desalting using 50 µl of the 20 mM
NaOH 90 % ethanol solution. The pellet was resuspended by vortexing and incubated at room
temperature for 5 min. Pellets were spun for 10 min at 5,000 x g to move all the contents to the tip of tube.
Pellets were washed with 1 ml of 90 % ethanol, vortexed and spun again. The supernatant was removed
and this step was repeated one additional time.
After the supernatant from the second wash has been removed, samples were centrifuged at high speed
for 3 min and all of the remaining supernatant was removed. Pellets were air dried for 20 min at room
temperature. The DNA was eluted from the carrier by heating at 60oC for 15 min in TE buffer. Samples
were centrifuged at high speed for 3 min and the supernatant transferred to a new tube.
Bisulfite treated DNA samples were stored at -20oC and proceded to pyrosequencing.

METHODS 67
4.3.8. DNA amplification
4.3.8.1. Polymerase chain reaction (PCR)
PCR is based on the recognition by a short piece of single stranded DNA (the primer) of a sequence on a
larger, single stranded fragment of DNA (template strand). When the primer recognizes the template and
anneals to the recognition sequence, the 3’-end of the primer is used by DNA polymerase to synthesize a
new DNA strand (elongation). When the temperature is raised, the new DNA strand will denature from the
template, and the template is once again open for annealing of a new primer when the temperature is
decreased. By adding a second primer which recognizes the template strand complementary to the first
template, the elongation can proceed in the direction of the first primer. In the first round of elongation,
this, ideally, will double the amount of template strands.
PCR involves preparation of the sample, the master mix and the primers, followed by detection and
analysis of the reaction products. The DNA samples used were either genomic DNA, cDNA (obtained
after RT-PCR reaction) or plasmid DNA. The PCR reactions were prepared as described in table 13.
Table 13 Reaction components for PCR.
Component Volume/reaction ( µl)
Master mix
Sterile water
1.25 mM dNTP
10xPCR Buffer
25mM MgCl2
Primer for
Primer rev
Taq polymerase
Template
Genomic DNA, cDNA, plasmid DNA
Total volume
variable
4
2.5
1
1
1
0.3
variable*
25
*: 20 ng genomic DNA, 40 ng cDNA, 40 ng plasmid DNA.
Information about primers (number, sequence, annealing temperatures) are shown in table 3 for ZNF265,
table 4 for HDAC6, table 5 for hnRNP-R and table 7 for T-plastin.
The cycling conditions were according to the primer annealing temperature, fragment length and the CG
content.
The standard PCR conditions were: 10 min at 94oC denaturation, followed by 31 cycles of 30 sec at 94oC,
30 sec at annealing temperature shown in table 4, and 30 sec at 72oC. The final extension step was at
72oC for 10 min. The PCR products were resolved on an 1-2 % agarose gel.

METHODS 68
4.3.8.2. Reverse-transcription PCR (RT-PCR)
Reverse-transcription (RT-reaction) is a process in which single-stranded RNA is reversely transcribed
into complementary DNA (cDNA) by using a reverse-transcriptase enzyme, primer, dNTPs, RNase
inhibitor. RT-reaction is also called first strand cDNA synthesis.
RNA was isolated from EBV-transformed lymphoblastoid cell lines, primary fibroblast, HEK296 cell and
PC12 cells, respectively, using TRIzol (Invitrogen). First-strand cDNA synthesis was performed using
“SuperScript First-Strand Synthesis System for RT-PCR Kit” (Invitrogen).
Two µg of RNA were used as template for first-strand synthesis. Together with 1µl oligo-d(T) primers and
1µl dNTP, the RNA was denatured at 65oC for 5 min. The RNA samples were then placed on ice and 4 µl
of RT-buffer, 4 µl of 25 mM MgCl2, 2 µl of 0.1 M DTT and 1 µl of RNase OUT were added. After mixing,
the tubes were placed for 2 min at 37oC. Then 0.25 µl SuperScript II were added to the samples and the
cDNA synthesis was performed at 37oC for 1 h. The reaction was stopped by 15 min. incubation at 70oC.
In order to remove the RNA, 1 µl of RNase H was added and the samples were incubated for 20 min at
37oC.
4.3.8.3. Multiplex PCR
Multiplex polymerase chain reaction is a variant of PCR, in which two or more loci are simultaneously
amplified in the same reaction. The multiplex PCR reactions of all target genes using 2 µl cDNA were
performed using the primers described in table 3. As internal control the HPRT gene using primer #785
and #786 (HPRT_for: 5’-TGTAATGACCAGTCAACAGG-3’ and HPRT_rev: 5’-
ATTGACTGCTTCTTACTTTCT-3’) or the actin gene using primer #2473 and #2474 (actin_cDNA_for: 5’-
CAGAAGGATTCCTATGTGGG-3’ and actin_cDNA_rev: 5’-TTGAAGGTAGTTTCGTGGATG-3’) were co-
amplified. In a total volume of 25 µl 10 pmol of each primer of the target transcript and 5 pmol of each
primer of the internal control, 200 µM dTNPs, 1U Taq polymerase and 1 µl 50 mM MgCl2 were added. 5 %
DMSO was used in the PCR reactions as indicated with “*” in table 6. Cycling conditions included a 10
min initial denaturation at 94oC, followed by 22 cycles to ensure quantitative measurements during linear
phase of 30 sec at 94oC, 30 sec at the annealing temperature specified in table 5 for hnRNP-R and table 6
for SMN, Septin 2, T-plastin, CD24 and Plod 2, 25-45 sec at 72oC and a final extension of 10 min at 72oC.
PCR products were resolved on an 0.8-1.5 % agarose gel.
4.3.8.4. Nested PCR
Nested PCR means that two-pairs of PCR primers were used for a single locus. The locus is amplified in a
first round by the first primer pair. The second pair of primers (nested primers) binds within the first PCR
product and produces a second PCR product that will be shorter than the first one. This strategy has been
used to amplify besides all CpG regions for pyrosequencing, NR1I3 gene (see table 6). Two µl cDNA were

METHODS 69
used in 25 µl PCR reaction as final volume. To the DNA were added 4 µl of 1.25 mM dNTPs mix, 2.5 µl of
10xPCR buffer, 1 µl of 50 mM MgCl2 and 10 pmol of each primer #2349 and #2330, 5% DMSO and 1U
Taq-polymerase. Cycling conditions for the first round included a 10 min initial denaturation step at 94oC
followed by 20 cycles of 30 sec at 94oC, 1 min at 57oC, 45 sec at 72oC and a final extension of 10 min at
72oC. Five µl of PCR product amplified in the first round were used for a second round of amplification
using as internal primers 10 pmol of each NR1I3 primer (#2343 and #2344). The reactions were prepared
as described in section 4.3.8.3 and run in the same conditions.
4.3.8.5. PCR of bisulfite treated DNA
The efficacy of bisulfite PCR is generally low; mispriming and non-specific amplification often occurs due
to the T richness of the target sequences. Therefore, a good primer design is crucial, since the dimer
formations are greatly facilitated by the T and A richness of the sense and antisense oligos, respectively.
Moreover, the primers designed for the bisulfite-treated template frequently amplify non-specific PCR
products because of the mispriming of the highly redundant genome generated by the treatment. Ideally, 2
sets of primers should be designed to anneal to the DNA. The primers should be 20-21 bp in length and
should possess similar dissociation temperatures. The product produced after the second round should be
100-200 bp in size. Internal secondary structure should be avoided. For the second round one primer is
biotinylated to the 5’-end. PCR assays were designed to amplify the whole CpG island in the T-plastin
promoter region. Primers targeted CpG-free regions to ensure that the PCR product would proportionally
represent the methylation characteristics of the source DNA. Pyrosequencing primers were subsequently
designed to focus on a series of seven “target” CpG regions, named CpG1 to CpG7 regions. In total, 99
CpG dinucleotides were checked for analysis, and in each assay one or two non-CpG cytosines provided
an internal control of the completeness of bisulfite treatment. The nested PCR procedure consisted of
amplification of 1 µl of the bisulfite treated DNA in a final volume of 25 µl with 2.5 µl of 10xPCR buffer, 4 µl
of 1.25 mM dNTPs, 1 µl of 50 mM MgCl2, 10 pmol of external primers (table 8) and 1U of Taq-polymerase.
When necessary 5 µl of Q-solution (Qiagen) were added as indicated in table 5. The PCR conditions were
as follows: an initial denaturation step for 10 min at 94oC followed by 5 min at 80oC and 45 cycles of 30
sec at 94oC, 1 min at the annealing temperature described in table 5 and 30 sec at 72oC. The final
extension was performed for 10 min at 72oC. The internal primers used in the second round of the nested
PCR are listed in table 9. When a sequencing primer in the forward orientation was desired for the
pyrosequencing reaction, then a reverse biotinylated primer was chosen and vice versa. Two µl of the first
round PCR reaction were used together with 2.5 µl of 10xPCR buffer, 4 µl of 1.25 mM dNTPs, 1 µl of 50
mM MgCl2, 10 pmol of unbiotinylated primer, 0.3 pmol of biotinilated primer and 1U of Taq-polymerase in
a total of 25 µl PCR reaction. In some cases, the addition of 5 µl of Q-solution improved the efficiency of
the PCR reaction (tables 8 and 9). The PCR cycling program was optimized as described for the first
round using the annealing temperature indicated in table 9. Confirmation of PCR products quality and
freedom of contamination was established on a 2 % agarose gel with ethidium bromide staining.

METHODS 70
4.3.8.6. PCR for gentotyping
PCR was performed on genomic DNA isolated from five SMA discordant families, five SMA patients that
showed T-plastin expression in RNA samples extracted from EBV-transformed cell lines and two families
of healthy volunteers that showed T-plastin expression in RNA samples isolated from fresh blood. PCR
primers were designed using Primer PSQ Assay Design (Biotage). Primer sequences, annealing
temperatures and the target SNPs are described in table 8. PCR was carried out using 5 ng genomic DNA
together with 2.5 µl of 10xPCR buffer, 4 µl of 1.25 mM dNTPs, 1 µl of 50 mM MgCl2, 10 pmol of
unbiotinylated primer, 0.3 pmol of biotinylated primer and 1U of Taq polymerase in a total of 25 µl PCR
reaction. PCR conditions were 10 min at 94oC followed by 35 cycles of 30 sec at 94oC, 1 min at the
annealing temperature described in table 8 and 30 sec at 72oC. The final extension was performed for 10
min at 72oC.
4.3.9. PCR products purification
The PCR products were purified using QIAquick PCR Purification Kit (Qiagen). This kit is designed for
rapid DNA cleanup of double- or single-stranded PCR products (100 bp -10 kb). Five volumes of buffer PB
were added to 1 volume of the PCR sample, mixed and transferred to the QIAquick columns. Samples
were centrifuged for 1 min at high speed and the flow-through discarded. The PCR products were washed
with 700 µl buffer PE and another centrifugation step under the same conditions performed. To remove
residual ethanol from the membrane, an additional centrifugation step for 2 min at top speed was
performed. The samples were eluted in 40 µl ddH2O that were applied directly to the center of each
QIAquick membrane. Columns were centrifuged for 1 min at high speed and the purified PCR products
stored at 4oC.
4.3.10. DNA quantification by spectrophotometry
The concentration of DNA sample can be checked by the use of UV spectrophotometry. Both RNA and
DNA absorb UV light very efficiently making it possible to detect and quantify either at concentrations as
low as 2.5 ng/µl. Based on extinction coefficient, the absorbance at 260 nm in a 1-cm quartz cuvette of a
50 µg/ml solution of double stranded DNA or a 40 µg/ml solution of single stranded RNA is equal to 1. The
DNA concentration was calculated as follows:
DNA concentration (µg/ml) = (OD 260) x (dilution factor) x (50 µg DNA/ml)/ (1 OD260 unit)
The ratio of the absorbance at 260 nm/ absorbance at 280 nm is a measure of the purity of a DNA
sample; it should be between 1.65 and 1.85.
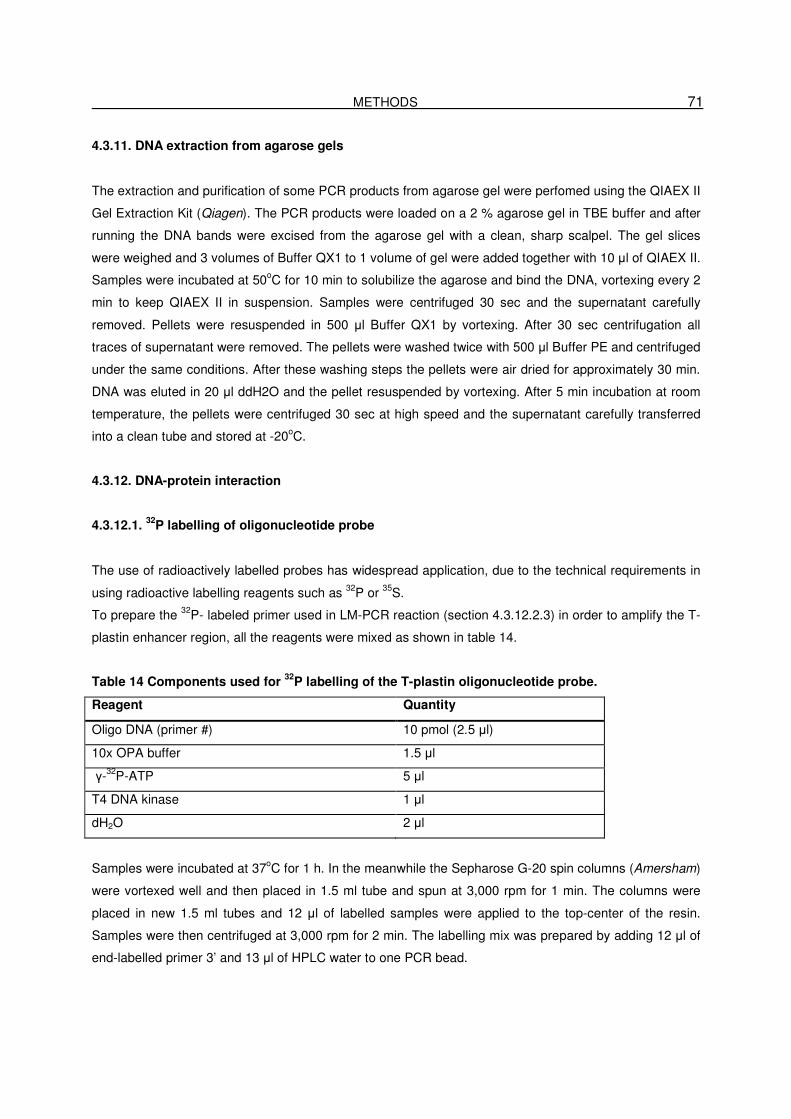
METHODS 71
4.3.11. DNA extraction from agarose gels
The extraction and purification of some PCR products from agarose gel were perfomed using the QIAEX II
Gel Extraction Kit (Qiagen). The PCR products were loaded on a 2 % agarose gel in TBE buffer and after
running the DNA bands were excised from the agarose gel with a clean, sharp scalpel. The gel slices
were weighed and 3 volumes of Buffer QX1 to 1 volume of gel were added together with 10 µl of QIAEX II.
Samples were incubated at 50oC for 10 min to solubilize the agarose and bind the DNA, vortexing every 2
min to keep QIAEX II in suspension. Samples were centrifuged 30 sec and the supernatant carefully
removed. Pellets were resuspended in 500 µl Buffer QX1 by vortexing. After 30 sec centrifugation all
traces of supernatant were removed. The pellets were washed twice with 500 µl Buffer PE and centrifuged
under the same conditions. After these washing steps the pellets were air dried for approximately 30 min.
DNA was eluted in 20 µl ddH2O and the pellet resuspended by vortexing. After 5 min incubation at room
temperature, the pellets were centrifuged 30 sec at high speed and the supernatant carefully transferred
into a clean tube and stored at -20oC.
4.3.12. DNA-protein interaction
4.3.12.1. 32P labelling of oligonucleotide probe
The use of radioactively labelled probes has widespread application, due to the technical requirements in
using radioactive labelling reagents such as 32P or 35S.
To prepare the 32P- labeled primer used in LM-PCR reaction (section 4.3.12.2.3) in order to amplify the T-
plastin enhancer region, all the reagents were mixed as shown in table 14.
Table 14 Components used for 32P labelling of the T-plastin oligonucleotide probe.
Reagent Quantity
Oligo DNA (primer #) 10 pmol (2.5 µl)
10x OPA buffer 1.5 µl
γ-32P-ATP 5 µl
T4 DNA kinase 1 µl
dH2O 2 µl
Samples were incubated at 37oC for 1 h. In the meanwhile the Sepharose G-20 spin columns (Amersham)
were vortexed well and then placed in 1.5 ml tube and spun at 3,000 rpm for 1 min. The columns were
placed in new 1.5 ml tubes and 12 µl of labelled samples were applied to the top-center of the resin.
Samples were then centrifuged at 3,000 rpm for 2 min. The labelling mix was prepared by adding 12 µl of
end-labelled primer 3’ and 13 µl of HPLC water to one PCR bead.
METHODS 72
4.3.12.2. In vivo footprinting
A variety of methods are available to analyze protein–DNA interactions in vivo. One method commonly
used to examine the interaction of proteins and DNA is in vivo footprinting. DMS in vivo footprinting was
used to determine the regions that contribute to the differential expression pattern in human tissues in an
in vivo setting. In principle, the small molecule DMS diffuses rapidly into the nuclei of living cells and
methylates guanine residues in the major groove of DNA and, to a lesser extent, adenine residues in the
minor groove (Maxam and Gilbert 1980; Mueller and Wold 1989). Dimethyl sulfate alkylates at the N7
position of guanines or N3 position of adenines in double-stranded DNA; the resultant lability of the
methylated purines is the basis for the guanine and adenine base-specific cleavage sequencing (Maxam
and Gilbert 1980). Transcription factors binding to the DNA inhibit or stimulate guanine methylation,
leading to protection or hypermethylation, respectively. Such genomic footprints were visualized by
comparing samples of DNA that have been exposed to the methylating agent DMS in the living cell (in
vivo) with samples treated with this agent.
In vivo footprinting was performed on EBV-transformed lymphoblastoid cell lines belonging to five SMA
discordant families and controls. In vivo footprinting was accomplished by treatment of cells with dimethyl
sulfate (DMS). Cells in exponentially growing suspension cultures were counted and harvested by
centrifugation at 500 x g. To obtain partial DMS methylation in vivo, three individual samples of 108 cells
each were treated with 1 ml of growth medium containing 1 % DMS for 2 min at 37oC. Exposure to DMS
was stopped by the addition of 49 ml of ice-cold PBS followed by immediate low-speed centrifugation
(1,500 rpm). Residual DMS was removed by an additional PBS wash. The pelleted cells were
resuspended in 3.0 ml of PBS.
4.3.12.2.1. Genomic DNA isolation
The genomic DNA of DMS-treated EBV-transformed lmphoblastoid cell lines were obtained by adding 2.7
ml of the cell lysis solution. Samples were allowed to incubate at 37oC overnight, after which the genomic
DNA was phenol-chloroform extracted and ethanol precipitated. Briefly, to the tubes containing DMS-
treated DNA an equal volume of phenol-chloroform solution was added. Tubes were inverted several
times and centrifuged for 10 min at +4oC at top speed. The top phase (DNA sample) was transferred to a
tube containing equal volume of phenol-chloroform and then mixed and centrifuged under the same
conditions. The top phase was transferred to a new tube containing equal volume of chloroform, mixed
and again centrifuged as above. The top phase was removed to a fresh tube and 1/10 vol of 3 M Natrium
Acetate and 3 vol of 100 % ethanol were added to the samples. DNA samples were incubated on ice 10
min and centrifuged for 10 min in cold at top speed. Supernatants were discarded and DNA pellets
washed once with 80 % ethanol and centrifuged under the same conditions. The ethanol was then
removed and pellets dried for 30 min at room temperature. Pellets were resuspended in 100 µl of HPLC
water and let to dissolve overnight at 37oC.

METHODS 73
4.3.12.2.2. Piperidine cleavage
Piperidine is a 1-ring heterocyclic compound formed from the polyamine cadaverine in the human
intestine. After DMS chemical modification, the polynucleotide chain become succeptible to cleavage by
piperidine (Rubin and Schmid 1980). Following in vivo DMS treatment, extracted genomic DNA from each
cell type was cleaved at all methylated guanines by incubation in 200 µl of 1 M piperidine for 30 min at
90°C. The piperidine was removed by lyophilization, and the cleaved DNA pellets were resuspended in
360 µl of TE buffer. Residual piperidine was removed by two successive ethanol precipitations. The first
entailed addition of 40 µl of 3 M sodium acetate followed by 1 ml of 100 % ethanol and incubation for
30 min at -70°C. DNA samples were pelleted by microcentrifugation for 15 min at 4°C and resuspended in
500 µl of TE buffer. The DNA pellets were ethanol precipitated a second time by the addition of 170 µl of
8 M ammonium acetate and 670 µl of isopropanol and incubation for at least 30 min at -70°C. The
precipitated samples were pelleted by microcentrifugation as described above, washed with 500 µl of 75 %
ethanol, and microcentrifuged for 5 min at room temperature. The resulting DNA pellets were resuspended
in double-distilled water to a final concentration of 0.4 µg/µl.
4.3.12.2.3. Ligation-mediated PCR (LM-PCR)
LM-PCR is based on the principle of detecting the cleavage products of a footprinting reagent (such as
dimethyl sulfate followed by piperidine cleavage) in a gene of interest within a genomic DNA sample by
primer extension with a gene-specific primer followed by the blunt ligation of an asymmetric linker
(designed to ligate in only one orientation) that is not gene-specific.
PCR amplification with a nested, gene-specific PCR primer and a primer corresponding to the sequence of
the linker yields detectable levels of the family of cleavage products that can then be resolved by gel
electrophoresis and detected by autoradiography after a final nested primer extension with an end-labeled
primer (Mueller and Wold 1989).
The general strategy of LM-PCR implies the first strand synthesis using a gene-specific primer (primer 1)
that is hybridized to the cleaved DNA substrate. Annealed primer 1 is then extended with a DNA
polymerase to create a blunt end at the site of the original cleavage event. To this blunt end a staggered
linker (with one blunt end) of defined length and sequence is ligated. After the ligation reaction, the DNA is
exponentially ampified using a primer that recognizes the ligated sequence (linker primer) and a gene-
specific primer (primer 2). After exponential amplification, the LM-PCR product is visualized by primer
extension of a radioactively labelled third gene-specific primer (primer 3).
Two micrograms of DMS-treated and piperidine-cleaved genomic DNA were used for LMPCR. Single-
stranded DNA fragments with guanine residues at both termini result from the DMS treatment and
piperidine cleavage. To provide appropriate substrates for linker ligation, double-stranded, blunt-ended
molecules were generated by primer extension from T-plastin-specific enhancer (oligonucleotide 1A). This
first-strand primer extension was accomplished by incubation of 2 µg of DMS-treated and piperidine-
METHODS 74
cleaved DNA with 0.3 pmol of oligonucleotide 1A, 1× Vent DNA polymerase buffer (New England Biolabs),
4 mM MgSO4, 0.25 mM of each deoxynucleoside triphosphate, 2.5 µl of 10x Vent polymerase buffer, 2 µl
MgSO4, 5 % DMSO and 0.5 U of Vent DNA polymerase (New England Biolabs) in a total volume of 25 µl.
The DNA was denatured at 94°C for 5 min, annealed by incubation at 55°C for 20 min, and extended by a
subsequent incubation of 10 min at 72°C. Ligation of the unidirectional linker described by Mueller and
Wold (Mueller and Wold 1989), was completed by the addition of 5 µl of 100 pmol of double stranded
linker, 10 µl of 2 x Quick ligase buffer, 2 µl of 100 mM ATP and 1 U of T4 DNA ligase to the PCR product.
This mixture was incubated at 16°C overnight, after which the DNA was recovered by ethanol
precipitation. Briefly, to the ligated products 5 µl of 3M Natrium acetate, 2.5 µl of glycogen and 250 µl 100
% ethanol were added. The content was mixed gently and incubated at -20oC for 1 h. Samples were then
centrifuged at 10,000 rpm in cold for 15 min. The ethanol was removed and pellets were washed with 70
% ice-cold ethanol by centrifugation under the same conditions. Precipitated DNA samples were air dried
for 30 min at room temperature and resuspended in 22.5 µl HPLC water. The ligated DNA was then mixed
with 10 pmol of primer 2 and applied on one PCR bead. The mixture was pipetted untill it appeared clear.
These samples were placed in a thermocycler, denaturated for 10 min at 95oC and cycled 25 times with a
profile of 95°C for 1 min, 63°C for 2 min, and 72°C for 1 min, with a final extension of 4 min at 72°C.
Following amplification, T-plastin-enhancer specific PCR products were labeled by the addition of 5 µl of
labeling cocktail and subjected to a first denaturation step for 5 min at 95oC followed by 5 rounds of 95°C
for 2 min, 63°C for 2 min, and 72°C for 3 min. The last extension step was performed at 72oC for 5 min.
Each reaction mixture was then subjected to phenol-chloroform extraction and ethanol precipitation prior
to electrophoresis on a 20 % sequencing polyacrylamide gel. The reactions were visualized by
autoradiography with Kodak BioMax MR.
The oligonucleotide sequences of the nested T-plastin enhancer primer set used for the analysis of the
sense strand by LM-PCR were oligonucleotide Enhancer 1_for (#3208): 5'-ACCTGACCCTGCAAAATCC-
3' (start position -912); oligonucleotide Enhancer 2_for (#3209): 5'-TCTCTGAGTTGATTTTGGATATACG-
3' (start position -880) ; and oligonucleotide Enhancer 3_for (#3210): 5'-
GTTGATTTTGGATATACGATGAACC-3' (start position -874).
Oligonucleotide sequences of the nested primer set used to analyze the minus strand by LM-PCR were
oligonucleotide Enhancer 1_rev (#3211): 5'-CCAGAGAAAATTTGGAGACATG' (start position -694);
oligonucleotide Enhancer 2_rev (#3212): 5'-TACTCTCCCCAGACTGCCATTTC-3' (start position -736);
and oligonucleotide Enhancer 3_rev (#3213): 5'-CCCAGACTGCCATTTCTTCTC-3' (start position -744).
The design and location of LM-PCR primers is summerized in Fig. F4 in appendix.
The unidirectional linker oligonucleotide sequences have been described by Mueller and Wold and are as
follows: Longer linker, 5'-GCGGTGACCCGGGAGATCTGAATTC-3', and Shorter linker, 5'-
GAATTCAGATC-3'.

METHODS 75
4.4. RNA techniques
4.4.1. RNA isolation
4.4.1.1. RNA isolation from fresh blood
Total RNA (from fresh blood) was isolated using PAXgene Blood RNA Kit (PreAnalytix) which allows the
isolation of total RNA from 2.5 ml human whole blood collected in the PAXgene Blood RNA tube.
PAXgene blood RNA tubes were let stand at room temperature as recommended by the manufacturer.
Total RNA isolation from blood samples collected in PAXgene tubes was carried out on day three after
blood sampling. The PAXgene Blood RNA tubes were centrifuged for 10 min at 4,500 rpm. The
supernatant was removed by decanting and 5 ml RNase-free water were added to the pellet. The pellet
was resuspended by vortexing and centrifuged for 10 min at 4,500 rpm. The entire supernatant was
discarded and the pellet was resuspended in 360 µl Buffer BR1 by vortexing. The samples were
transferred into 1.5 ml microcentrifuge tubes and 300 µl Buffer BR2 and 40 µl Proteinase K were added to
the samples. After vortexing, the samples were incubated for 10 min at 55oC on a heating block at
maximum speed. The samples were centrifuged for 3 min at maximum speed and the supernatant was
transferred to a fresh 1.5 ml tube. 350 µl 100 % ethanol was added and mixed by vortexing. The samples
were transferred to the PAXgene column and centrifuged for 1 min at 10,000 rpm. 700 µl Buffer BR3 was
added to the column and centrifuged for 1 min at 10,000 rpm. The samples were washed 2 times with 500
µl Buffer BR4 each and eluted in 40 µl Buffer BR5. The eluate was incubated for 5 min at 65oC in a
heating block for denaturation and chilled immediately on ice.
4.4.1.2. TRIzol method for RNA isolation from cell culture
RNA was isolated from EBV-transformed lymphoblastoid cell cultures, human fibroblasts, HEK293 and
PC12 cells using TRIzol (Invitrogen). Cells were pelleted by centrifugation in a 1.5 ml Eppendorf tube, and
all supernatant removed (PBS or culture medium). Cells were resuspended by flicking the tube. Cells
were lysated with 1 ml TRIzol per 1x10⁷ cells by repetitive pipetting carefully, avoiding spillage. The
suspension was mixed until all cell debris dissolved, and no clumps were apparent. The mixture was
incubated at room temperature for 5 min to complete homogenisation. At this point the samples were
frozen at –80ºC for one night. 0.2 ml chloroform was added to the samples, gently mixed, and incubated
10 min at room temperature. Samples were centrifuged at 12,000 rpm for 15 min at 4°C. The upper, clear
part was transferred into new tubes and 2 vol isopropanol added, mixed well and incubated at room
temperature for 10 min. Samples were centrifuged at 12,000 rpm for 10 min at 4°C. The supernatant was
removed and pellets were washed with 100 µl 75 % ethanol. After an additional centrifugation step under
the same conditions (10 min, 12,000 rpm, 4oC) the pellets were air dried for 10 min. Pellets were dissolved

METHODS 76
in the proper amount DEPC treated H2O. Each RNA sample was diluted in 100 µl H2O and absorption
measured at 260 nm.
4.5. Autoradiography
Autoradiography is a technique using X-ray film to visualize molecules or fragments of molecules that
have been radioactively labeled. Autoradiography has many applications in the laboratory. This method
was used to visualize the DNA fragments applied on a sequencing gel do detect the protein-DNA
interaction (in vivo footprinting). When the gel run was finished, the gel was allowed to cool for 15 min at
room temperature. The shorter plate was removed carefully without breaking the gel, and the gel was
fixed in 10 % methanol/ 10 % acetic acid for 20 min, by placing the gel plate in a tray and carefully pouring
on sufficient fix to cover the gel, without the level of the liquid rising over the entire plate. Carefully a piece
of pre-wet 3 MM paper in fixing solution was placed onto the gel, then a second 3 MM paper, and the two
papers were peeled away with the gel attached. The additional piece of 3 MM paper was discarded and
the paper with the gel placed on the gel dryer. The gel was covered with Saran-wrap and dried under
vacuum for 30 min, with the heating turned up to maximum, and with dry ice place under the vacuum
draining flask. The gel was exposed overnight to BioMax film at -70oC using a BioMax screen.
4.6. Protein biochemistry
4.6.1. Protein isolation, expression and purification
4.6.1.1. Bacterial overexpression: expression and purification of SMN-GST fusion protein
In general, fusion proteins between a protein with glutathione-S-transferase (GST), are soluble and are
easily purified from lysed cells under nondenaturing conditions by absorbtion with glutathione-agarose
beads, followed by elution in the presence of free glutathione. pGEX vectors can be used in bacterial
systems to express foreign polypeptides. Each pGEX vector contains an open reading frame encoding
GST, followed by unique restriction endonuclease sites for BamH I, Sma I, and Eco RI. After subcloning of
the SMN cDNA fragment into the pGEX vector (GVO# 331 pGEX-SMN-GST wt; kindly provided by A.
Burghes) in the correct reading frame, the competent E. coli cells were transformed and selected on LB
ampicillin plates. The transformed colonies were picked after 16 h incubation at 37oC into 4 ml LB/
ampicillin medium. A control culture inoculated with bacteria transformed with the parental pGEX vector
was included. The liquid cultures were incubated with vigorous agitation in a 37oC shaking incubator for 16
h. The expression of fusion protein was induced by adding 100 mM IPTG. The incubation time was
continued another 7 h. Liquid cultures were transferred to microcentrifuge tubes and centrifugated 1 min
at maximum speed at room temperature. The immobilization of GST-fusion proteins was performed onto
MagneGSTTM Particles using MagneGSTTM Pull-Down System (Promega). The MagneGSTTM Pull-Down

METHODS 77
System provides GSH-linked magnetic particles that allow simple immobilization of GST-fusion bait
proteins from bacterial lysates. After discarding the supernatants, pellets were resuspended in 200 µl of
Cell Lysis Reagent by pipetting at room temperature. To reduce viscosity and to increase the purity of
GST-fusion protein, 2 µl of RQ1 RNase/free DNase were added and cell suspensions incubated at room
temperature for 30 min on a rotating platform. During this incubation the MagneGSTTM Particles were
thoroughly resuspended by inverting the bottle several times to obtain a uniform suspension. Twenty µl of
MagneGSTTM particles were pipetted into a 1.5 ml tube and tubes were placed in the magnetic stand to
allow the MagneGSTTM Particles to be captured by the magnet. Carefully the supernatant was removed
and discarded. The tubes were removed from the magnetic stand and by adding 250 µl of MagneGSTTM
Binding/ Wash Buffer the particles were resuspended by pipetting. This step was repeated two more
times. After the final wash, particles were resuspended in 100 µl of MagneGSTTM Binding/ Wash Buffer
and 200 µl of cell lysate containing the GST-fusion protein or the GST control and incubated with constant
gentle mixing for 30 min at room temperature on a rotating platform. The tubes were placed in the
magnetic stand and the MagneGSTTM Particles were allowed to be captured by the magnet. The
supernatants were removed and saved for gel analysis. 250 µl of MagneGSTTM Binding/ Wash Buffer were
added to the particles, gently mixed and incubated at room temperature for 5 min while mixing
occasionally by tapping. The tubes were placed in the magnetic stand and the supernatant carefully
removed and discarded. Another 250 µl of MagneGSTTM Binding/ Wash Buffer were added to the particles
and mixed gently by inverting the tube. The tubes were placed in the magnetic stand and supernatant
removed and discarded. The washing step was repeated for a total of three washes. After the last wash,
the particles were resuspended in 20 µl of MagneGSTTM Binding/ Wash Buffer. Five µl of the immobilized
GST-fusion or GST control were used for the GST Pull-Down Assay.
4.6.1.2. Expression of the T-plastin protein in the TNT® T7 Quick Coupled Transcription/
Translation Reaction (Promega)
The TNT® T7 Quick Master Mix allows the convenient single-tube coupled transcription/ translation of
genes cloned downstream from T7 RNA polymerase promoters. TNT® T7 Quick Coupled transcription/
translation reactions are typically performed in a total volume of 50 µl, which generally yields sufficient
material for two pull-down reactions of 20 µl each and for analysis of transcription/ translation efficiency.
Table 15 TNT® T7 Quick Reaction Using pcDNA 3.1-T-plastin-V5 plasmid DNA.
Components Reaction Using Unlabeled Methionine
TNT® T7 Quick Master Mix 40 µl
Methionine, 1 mM 1 µl
Plasmid DNA template (0.5 µg/ µl) 2 µl
Nuclease- Free Water 7 µl

METHODS 78
All the reagents were removed from -70oC and thawed on ice. The reaction components were assembled
as shown in table 15 using as template pcDNA3.1-T-plastin-V5 plasmid. In the negative control reaction,
no plasmid DNA was added. The reactions were incubated at 30oC for 90 min and stored at -20oC.
4.6.1.3. Protein isolation from fresh blood
The proteins from fresh blood were isolated using BD Vacutainer CPT Cell Preparation Tube with Sodium
Citrate (Preanalytical Systems, Becton Dickinson and Company, Franklin Lakes). The blood was collected
into the tube using the standard technique for BD Vacutainer Evacuated Blood Collection Tubes. After
collection, the tubes were stored upright at room temperature until centrifugation. Blood samples were
centrifuged at room temperature for 15 min at 3,000 rpm. After centrifugation, approximately half of the
plasma was aspirated without disturbing the cell layer. The cell layer was collected with a Pasteur pipette
and transferred to a 15 ml size canonical centrifuge tube. Up to 15 ml PBS were added and the cells were
mixed by inverting the tubes 5 times. The samples were then centrifuged 15 min at 1,600 rpm and the
supernatant was discarded. The cells were washed with 10 ml PBS by inverting the tubes 5 times. After
10 min centrifugation at 1,600 rpm the supernatant was removed and the cells were harvested in RIPA
buffer.
4.6.1.4. Protein isolation from cell culture using RIPA buffer (fibroblasts, EBV-transformed
lymphoblastoid cell lines, HEK293 cells, PC12 cells)
Fibroblast cells, EBV-transformed lymphoblastoid cell cultures, HEK293 and PC12 cells were harvested in
RIPA buffer (150 mM NaCl, 1 % NP40, 0.5 % DOC, 0.1 % SDS, 50 mM Tris, pH 8.0) to prepare protein
extracts. The samples were incubated for 15 min at room temperature and centrifuged at +4oC for 30 min
at top speed. The supernatants were transferred in new 1.5 ml tubes.
4.6.1.5. Protein isolation from cell culture using IP buffer (HEK293 cells, PC12 cells)
HEK293 and PC12 cells were harvested in IP-buffer (25 mM HEPES pH 8.0, 150 mM KCl, 2 mM EDTA,
20 mM NaF, 1 mM DTT, 0.5 % NP40) to prepare protein extracts. The samples were incubated for 15 min
at room temperature and then centrifuged at +4oC for 30 min at top speed.
4.6.2. Protein quantification by spectrophotometry (Bradford assay)
In contrast to nucleic acids, proteins have a UV absorption maximum of 280 nm, mostly due to the
tryptophan residues. The Bradford assay is a rapid and accurate method commonly used to determine the
total protein concentration of a sample. The assay is based on the observation that the absorbance
maximum for an acidic solution of Coomassie Brilliant Blue G-250 shifts from 465 nm to 595 nm when
METHODS 79
binding to protein occurs. Both hydrophobic and ionic interactions stabilize the anionic form of the dye,
causing a visible color change. Within the linear range of the assay (~5-25 mg/mL), the more protein
present, the more Coomassie binds. Bradford solution was used as blank and the samples were diluted
1:500 in Bradford solution. After 10 min at room temperature the protein concentration was read using a
spectrophotometer.
4.6.3. Generation of polyclonal antibody against T-plastin
Rabbit polyclonal antibody against human T-plastin was produced by immunization of two rabbits at the
Eurogentec Company with a synthetic polypeptide (H2N-MATTQISKDELDELKC-CONH2). The antibody
recognizes 16 aa localized at the N-terminus of the T-plastin protein. The standard program for rabbit
antibody was an 87 day program. Peptide antibody production is initiated by the judicious selection of a
peptide sequence from the antigen’s amino acid sequence, and is followed by the synthesis of the peptide
and conjugation to a carrier protein. The peptide conjugate is then used for the immunization in place of
the natural antigen. In the host animal, antibodies will be raised against the peptide sequence. The 2-
month 2-rabbit program offers the rapid production of protein polyclonal antibodies. The program includes
four immunizations, pre-immune test sample, small bleed and final bleed. The antibody is purified to
eliminate other proteins by affinity purification that is the most common technique. The specificity of T-
plastin antibody was determined by Western blot using either T-plastin protein transcribed in TnT system
or proteins isolated from human fibroblasts, HEK293 cells, PC12 cells and EBV-transformed
lymphoblastoid cell cultures. Three different dilutions were checked: 1:1,000; 1: 2,500 and 1: 5,000. The
optimal conditions were found to be the blot incubation with a 1:5,000 anti-T-plastin antibody dilution.
4.6.4. Protein analysis
4.6.4.1. SDS-PAGE electrophoresis
Electrophoresis is a technique used to separate and sometimes purify macromolecules -especially
proteins and nucleic acid- that differ in size, charge or conformation. Proteins can have either a net
positive or a net negative charge, and migrate according to their charge. SDS-polyacrylamide gel
electrophoresis (SDS-PAGE) separates proteins according to their molecular weights. Polyacrylamide is a
crosslinked polymer of acrylamide. The length of the polymer chain is dictated by the concentration of
acrylamide used, which is typically between 3.5 % and 20 %. Because oxygen inhibits the polymerization
process, they must be poured between glass plates. The first step was to prepare the gel cassette
sandwich. Before setting up the casting stand assembly, the casting stand, casting frames and glass
plates were cleaned and dried. The casting frame was placed upright with pressure clamps in the open
position and facing toward on a flat surface. A short plate was placed on the top of spacer plate and the
two glass plates were placed into the casting frame. The gel cassette assembly was placed then on the

METHODS 80
gray casting stand gasket. Both running gel solution and stacking gel solution were pepared as descibed
in table 16.
Table 16 Discontinuous 12% polyacrylamide gel preparation.
Running gel solution Stacking gel solution
Component Volume (ml) Component Volume (ml)
Acrylamide/ bisacrylamide mix 10.8 Acrylamide/ bisacrylamide mix 2
1.5M Tris/HCl pH= 8.8 7.5 1M Tris/HCl pH= 6.8 5.6
Distilled water 1.4 Distilled water 1.25
10% SDS 0.2 10 % SDS 0.1
10% APS 0.1 10 % APS 0.05
TEMED 0.1 TEMED 0.05
The running gel was poured smoothly to prevent it from mixing with air and some 100 % ethanol was
layered on the top of the gel to avoid polymerization inhibition. The gel was allowed to polymerize for 30
min, when the ethanol was removed and discarded. The stacking gel solution was poured until the top of
the short plate was reached. The desired comb was inserted between the spacers and the stacking gel
was allowed to polymerize for 30 min. Then, the comb was gently removed and the walls were rinsed
throughly with distilled water.
The gel cassette was removed from the casting stand and placed into the slots at the bottom of each side
of the electrode assembly and lowered into the mini tank. The inner chamber was filed with 125 ml of
runing buffer until the level reaches halfway between the tops of the taller and shorter glass plates of the
gel cassette. 200 ml of running buffer were added to the lower buffer chamber. The electrical leads were
inserted into a suitable power supply and 100 volt constant were used for electrophoresis. When
electrophoresis was complete, the gel was removed by gently separating the two plates of the gel
cassette. The gel was removed by floating it off the glass plate by inverting the gel and plate under
transfer solution.
4.6.4.2. Antibodies
Antibodies used in these experiments were as follows:
• Mouse monoclonal anti-β-tubulin (Sigma);
• Mouse monoclonal anti-SMN (BD, Transduction Laboratories);
• Mouse monoclonal anti-β-actin (Sigma);
• Mouse monoclonal anti-V5 (Invitrogen);
• Rabbit polyclonal anti-T-plastin (Eurogentec);
• Phalloidin conjugated with AlexaFluor 568 (Invitrogen);
• Horseradish peroxidase conjugated goat anti-mouse IgG (Dianova);

METHODS 81
• Horseradish peroxidase conjugated goat anti-rabbit IgG (Pierce)
Table 17 Recommended dilutions for Western blot and immunocytochemistry analysis.
Antibody (anti-) Western blot Immunocytochemistry
Primary antibodies
SMN 1: 5,000 1: 500
T-plastin 1: 5,000 1: 500
β-tubulin 1: 2,000 n.u.
β-actin 1: 10,000 n.u.
Phalloidin n.u. 1: 200
V5 1: 5,000 1: 500
Secondary antibodies
Mouse IgG 1: 2,500 n.u.
Rabbit IgG 1: 10,000 n.u.
n.u.: not used
4.6.4.3. Protein Transfer
This procedure is the middle step of the 3-step process of Western immunoblotting. The first step was
SDS-PAGE to resolve a mixture of proteins by size. The second step detailed in this protocol, is the
transfer of resolved proteins from the gel to a membrane support (i.e., nitrocellulose) via electroelution.
The product of this second step is referred to as the blot. The protein transfer buffer was chilled (+4oC)
and the nitrocellulose membrane was cut to the dimensions of the gel. The nitrocellulose membrane was
soaked in transfer buffer until needed. Two fiber pads and two filter papers were slowly submerged into a
container that sufficiently allowed the fiber pads and filter papers to be immersed in transfer buffer until
completely wet. The pads were pressed down while they were submerged to remove air bubbles trapped
inside pads. The colored gel holder cassette was placed on the assembly tray. The presoaked fiber pad
and filter paper were placed on the top of the black side of the cassette and air bubbles were removed
with a roller. The gel was placed carefully on the filter paper avoiding air bubbles formation. The precut
nitrocellulose membrane was placed over the front side of the gel. A wet filter paper and fiber pad were
placed on the top of the membrane and by rolling, any air bubbles were removed. The white side of the
gel holder cassette was lowered and the handle was locked into the close position. The locked gel holder
cassette was moved from the assembly tray into the groove of the blotter tank, aligning the white side of
the cassette with the red electrode. A stir bar was added to the transfer tank and placed on the stir plate.
A frozen ice pack was placed into the transfer tank in the compartment behinde the black electrode. The
tank was filled with transfer buffer to the level marked on the tank. The electroelution was performed at
constant voltage of 30 volt overnight.

METHODS 82
4.6.4.4. Western blot
Western blot analysis can detect one protein in a mixture of any number of proteins. This method is
dependent on the use of high-quality antibody directed against a desired protein. All the following
incubations and washes were conducted at +4oC with gentle shaking using an oscillating platform shaker.
Volumes are specified for 8.7 x 13.3 cm Bio-Rad gel blots. Blots were incubated for 2 h in 50 ml 6 % Milk-
TBS-Tween. The membranes were transferred to a tray containing the primary antibody diluted in 10 ml of
2 % blocking buffer and incubated for 2 h. Blots were washed three times, for 10 min each, with 0.1 %
TBS-Tween. The secondary antibody diluted according to table 17 into 2 % blocking buffer was added
and incubated for 1 h. Membranes were washed for five times, for 5 min each, with 0.1 % TBS-Tween.
Immunostaining of the membranes and detection of the signal with Chemiluminescent reagent (Pierce)
was carried out according to standard protocols.
4.6.5. Protein-protein interaction
4.6.5.1. Co-immunoprecipitation
Immunoprecipitation is a technique in which an antigen is isolated by binding to a specific antibody
attached to a sedimentable matrix. Antibodies can be bound noncovalently to immunoadsorbents such as
protein A- or protein G-agarose, or can be coupled covalently to a solid-phase matrix. HEK293 and PC12
cells were harvested in IP-buffer. Fifty µl of protein-G-sepharose resin slurry (50 % slurry in lysis buffer)
per 1 ml of cell lysate were used to pre-clear the lysate for 1 h at +4oC. Samples were centrifuged for 1
min at 2,000 rpm and the supernatant transferred to a sterile microcentrifuge tube on ice. Equivalent
amounts of pre-cleared cellular extracts were incubated with 4 µl of polyclonal anti-T-plastin antibody
bound to protein-G-sepharose and rocked for 4 h at +4oC. Samples were centrifuged for 1 min at 2,000
rpm at +4oC, the supernatant removed and bound fractions were washed in 400 µl IP- buffer four times.
After the last wash, 20 µl of SDS-PAGE sample buffer were added to the resin. Samples were heated at
95oC for 2 min, centrifuged for 1 min at 2,000 rpm, resolved by 12 % SDS-PAGE and transferred to
nitrocellulose and detected with monoclonal anti-SMN or anti-β-actin antibody using chemiluminescence
(Pierce).
4.6.5.2. Magne GSTTM Pull-Down assay
GST pull-down uses a GST-fusion protein (bait) bound to glutathione (GSH)-coupled particles to affinity
purify any proteins (prey) that interacts with the bait. Bait and prey proteins can be obtained from multiple
sources including cell lysates, purified proteins, expression systems and in vitro transcription/translation
systems. The prey protein, T-plastin, was expressed in the transcription/ translation reaction (from
Promega); the E. coli expressed GST-fusion (bait) protein (SMN-GST) was immobilized on the the Magne

METHODS 83
GSTTM Particles. To each 5 µl aliquot of particles carrying GST-fusion protein or GST control 20 µl of the
TNT® T7 Quick coupled transcription/ translation reaction were added. The MagneGSTTM Binding/ Wash
Buffer was added to a final volume of 200 µl for each pull-down reaction. Samples were incubated for 1 h
at room temperature on a rotating platform with gentle mixing. At the end of this incubation period,
samples were briefly vortexed to remove non-specific adherent proteins and reduce background. Tubes
were placed in a magnetic stand and supernatant (C4) carefully removed and saved for analysis. 400 µl of
MagneGSTTM Binding/ Wash Buffer were added and mixed gently by inverting the tube. Samples were
incubated for 5 min at room temperature while mixing occasionally by tapping the tube. Tubes were
placed in a magnetic stand and supernatants were removed and discarded. Another 400 µl of
MagnGSTTM Binding/ Wash Buffer were added and the samples were mixed by tapping the tubes. After
placing the tubes in a magnetic stand and discarding the supernatant, the wash step was repeated for a
total of five washes. After the last wash, 20 µl of 1x SDS loading buffer were added and samples were
eluted by incubation for 5 min at room temperature with mixing. The tubes were placed in the magnetic
stand and the eluate was removed for analysis. For Western blot analysis, 50 % of undiluted eluted
sample (after boiling) was loaded onto the 12 % SDS-PAGE gel.
4.7. Cell transfection
Transfection -delivery of foreign molecules such as DNA into eukaryotic cells- has become a powerful tool
for the study and control of gene expression, e.g. for biochemical characterization, mutational analyses, or
investigation of the effects of regulatory elements or cell growth behaviour. When cells are transiently
transfected, the DNA is introduced into the nucleus of the cell, but does not integrate into the chromosome
(Tang et al. 1996). This means that many copies of the gene of interest are present, leading to high levels
of the expressed protein. Transcription of the transfected gene can be analyzed within 24-96 h after
introduction of the DNA depending on the construct used. Optimization of cell culture technique is
necessary to ensure that cells are healthy and in optimal conditions for transfection.
4.7.1. Transient transfection of T-plastin-V5-tagged plasmid in HEK293 and PC12 cells
HEK293 cells were grown in DMEM medium supplemented with 10 % FCS. Conventional PC12 cells
were cultured in DMEM supplemented with 5 % FBS and 10 % horse serum. For all transfection
experiments, 2 x 10⁴ cells/ml were plated on 60 mm culture dishes the day before transfection. PC12 cells
and HEK293 were transfected with either pcDNA3.1-T-plastin_V5 plasmid or empty vector. For PC12 cells
transfections only collagen-coated coverslips and 60 mm culture dishes were used in order to increase the
adherent capacity of the cells. On the day of transfection, 5 µg of plasmid DNA was diluted with cell
growth medium containing no serum, proteins or antibiotics to a total volume of 150 µl. The solution was
mixed for a few sec and spun down to remove drops from the top of the tube. 30 µl SuperFect
Transfection Reagent (Qiagen) were added to the DNA solution and samples were incubated 10 min at

METHODS 84
room temperature to allow transfection-complex formation. While complex formation took place, the
growth medium was aspirated from the culture dish and cells washed once with PBS. One ml cell growth
medium (containing serum and antibiotics) was added to the reaction tube containing the transfection
complexes. After pipetting up and down twice, the transfection complexes were transferred immediately to
the cells in the 60 mm dishes. Cells were incubated with the transfection complexes for 3 h under their
normal growth conditions. When the incubation time was out, the medium containing the remaining
complexes was removed from the cells by gentle aspiration, and cells were washed once with 4 ml PBS.
Fresh cell growth medium (containing serum and antibiotics) was added and cells were grown under their
normal growth conditions over night. To obtain maximal levels of gene expression in PC12 cells, a second
round of transfection under the same conditions was performed after 24 h and cells were assessed for
expression of the transfected gene after 48 and 72 h, respectively.
4.7.2. Transient transfection of T-plastin siRNA oligos into PC12 cells
Cells were diluted in antibiotic-free medium (DMEM, low serum conditions) to a concentration of 5x 10⁴
cells/ ml. 200 µl of cells were plated into each 24-well collagen-coated plate and incubated overnight at
37oC with 5 % CO2. Twenty five µl of 1 µM siRNA solution were diluted with 25 µl OPTIMEM medium and
1 µl of transfection reagent (DharmaFECT 1 or 4) in 49 µl OPTIMEM medium in separate tubes. The
tubes were incubated for 5 min at room temperature. The content of the two tubes was combined, mixed
by pipetting up and down and incubated for 20 min at room temperature. At the end of the incubation time
400 µl of DMEM medium were added to the transfection mix. In the meanwhile, the culture medium was
removed from the wells and 400 µl of transfection mix added. Cells were incubated at 37oC in 5 % CO2 for
24 h. After 24 h, another transfection under the same conditions was performed. Cells were incubated
additionally for 48-72 h. For ICC experiments, the transfection was performed on collagen-coated
coverslips under the same conditions.
4.7.3. Co-transfection of T-plastin-V5-tagged plasmid DNA and SMN siRNA oligos into PC12 cells
One day before transfection, 5x10⁶ PC12 cells were plated in medium without antibiotics on collagen-
coated coverslips in 60 mm collagen-coated Petri dishes. Two µg of plasmid DNA (pcDNA3.1-T-plastin-V5
or empty vector) together with 100 pmol SMN siRNA or control siRNA were co-transfected using
Lipofectamine 2000 Transfection Reagent (Invitrogen) after 20 min incubation at room temperature.
Before use, 10 µl of Lipofectamine 2000 were diluted in 490 µl OPTIMEM medium without serum and
incubated for 5 min at room temperature. Cells were incubated with the transfection complexes overnight
under their normal conditions. For a high efficiency of transfection, 24 h after the first transfection, a
second transfection was performed under the same conditions.

METHODS 85
4.8. Cell imaging
4.8.1. Immunocytochemistry (ICC)
ICC is a technique used to assess the presence of a specific protein or antigen in cells (cultured cells, cell
suspension) by use of a specific antibody, which binds to it, thereby allowing visualization and
examination under a microscope.
1. Adherent cell culture slide preparation. The adherent cells were grown on coverslips in 60 mm
Petri dishes at 37oC, 5 % CO2. When they reached 40-60 % confluence, cells were thoroughly
washed 3 times with PBS for 2 min each wash step.
2. Fixation. To ensure free access to the antibody to its antigen, the cells must be fixed and
permeabilized. Organic solvents such as alcohols and acetone remove lipids and dehydrate the
cells, while precipitating the proteins on the cellular architecture. Crosslinking reagents (such as
paraformaldehyde) form intermolecular bridges, normally through free amino groups, thus creating
a network of linked antigens. Crosslinkers preserve cell structure better than organic solvents, but
may reduce the antigenicity of some cell components, and require the addition of a
permeabilization step, to allow the access of the antibody to the specimen. Three appropriate
fixation methods were chosen according to the relevant application:
i. Acetone fixation. Cells were fixed in -20oC acetone for 5 min
ii. Methanol-Acetone mix fixation. Cells were fixed in 1:1 methanol and acetone mixture
at -20oC for 10 min
iii. Paraformaldehyde-Acetone fixation. Cells were fixed in 4 % PFA at 37oC for 15 min
and then permeabilized with cooled acetone for 5 min at -20oC.
3. Antibody Staining. The next step of cell staining involves incubation of cell preparations with the
antibody. Unbound antibody is removed by washing and the bound antibody was detected
directly. The primary antibody was directly labelled using Zenon labelling technology that utilizes a
fluorophore-labelled Fab fragment directed against the Fc portion of an intact IgG primary
antibody in order to form a labelling complex. The antibody was labelled with a Zenon IgG
labelling reagent to obtain 3:1 molar ratio of Fab to antibody target. One µg of antibody in 20 µl
PBS was mixed with 5 µl of the Zenon IgG labelling reagent and incubated 5 min at room
temperature. Five µl of the Zenon blocking reagent were added to the reaction mixture. The
solution was incubated 5 min at room temperature. After that the antibody solution was applied to
samples and incubated for 1 h at room temperature protected from light. When staining was
complete, the cell samples were washed three times with PBS. A second fixation was performed
and when fixation was completed, the cell samples were washed again three times with PBS. The
cell samples were counterstained with DAPI.
4. In the next step, cells were examined under the non- or confocal microscope

METHODS 86
4.8.2. Confocal scanning fluorescence microscopy
Confocal laser scanning microscopy (CLSM or LSCM) is a valuable tool for obtaining high resolution
images and 3-D reconstructions. The key feature of confocal microscopy is its ability to produce blur-free
images of thick specimens at various depths. Images are taken point-by-point and reconstructed with a
computer, rather than projected through an eyepiece. The principle for this special kind of microscopy was
developed by Marvin Minsky in 1953, but it took another thirty years and the development of lasers for
confocal microscopy to become a standard technique toward the end of the 1980s.
Confocal images were taken with an inverted Leica TCS-SP laser-scanning microscope with a 63xHCX
PL APO NA 1.32 or 100x HCX PL APO 1.40 oil immersion objectives. Fluorochromes Alexa 488, FITC
and Alexa 568 were excited with the 488 nm Argon laser and the 543 nm Helium Neon laser, respectively.
Emission fluorescence was collected in red (> 543 nm) and green (488 nm) channels simultaneously.
Images were collected and processed using AdobePhotoshop Software.
4.8.3. Non-confocal fluorescence microscopy
A fluorescence microscope is a light microscope used to study properties of organic or inorganic
substances using the phenomena of fluorescence and phosphorescence instead of, or in addition to,
reflection and absorption. In most cases, a component of interest in the specimen is specifically labelled
with a fluorescent molecule called a fluorophore (such as GFP, green fluorescent protein). The cells were
observed and analyzed using an Axioplan 2 imaging microscope (Zeiss) equipped with an AxioCam
camera.
4.8.4. Measurement of neurite outgrowth
Typically, PC12 cells were plated on collagen-coated coverslips and cultured overnight. NGF (100 ng/ml)
was added to the cells in culture medium containing 5 % FBS serum. After stimulation for the indicated
times with NGF, cells were washed and fixed with 4 % PFA. For each experiment at least three different
coverslips from three independent experiments were used for the measurement. Cells were photographed
with an Axioplan imaging microscope at 100 x magnification. A bar of 20 µm was placed and used as
standard to determine the length of neurites from each cell. Approximately, a total of 200 cells per
coverslip were measured for neurite length.
4.9. Miroarray
Microarrays are simply ordered sets of DNA molecules of known sequence. Usually rectangular, they can
consist of a few hundred to hundreds of thousands of sets. Each individual feature goes on the array at
precisely defined location on the substrate. The microarray technology consists of spotting PCR products
or long oligonucleotides (50mer-70mer) on glass slides at densities of up to 6,000 spots/cm2. These slides

METHODS 87
are hybridized using fluorescent targets (cDNAs or genomic DNAs). The fluorescent molecules most
commonly used are members of the cyanine family, Cy3 or Cy5. After hybridization, the signals are
detected using a fluorescence scanner. The use of two different fluorochromes allows the determination of
hybridization signals from two distinct strains in one single experiment. Once the fluorescent intensities
have been obtained, the major part of the work is the analysis of the data in order to extract the biological
information.
4.9.1. RNA Cleanup with RNeasy MinElute Cleanup Kit (Qiagen)
After TRIzol RNA extraction a cleanup using Qiagen RNeasy MinElute Cleanup Kit (Qiagen) is performed
to obtain better yields of cRNA from the in vitro transcription-labeling reaction. A maximum of 45 µg RNA
in a maximum volume of 200 µl can be used in the RNA cleanup protocol. This amount corresponds to the
binding capacity of the RNeasy MiniElute spin columns. The samples were adjusted to a volume of 100 µl
with RNase-free water. 350 µl buffer RLT were added and mixed thoroughly. 250 µl of 96 % ethanol was
added to the diluted RNA samples and mixed thoroughly by pipetting. 700 µl of the sample were applied
to an RNeasy MinuElute spin column placed in a 2 ml collection tube. Samples were centrifuged for 15
sec at 8,000 x g (> 10,000 rpm). The flow-through and collection tube were discarded. The spin columns
were transferred in new 2 ml collection tubes and 500 µl of buffer RPE was added on the column. The
column was washed for 15 sec by centrifugation at 8,000 x g. The flow-through was removed and 500 µl
of 80 % ethanol was added to the column. To dry the membrane, samples were centrifuged for 2 min at
8,000 x g. The flow-through and collection tubes were discarded. The columns were transferred into new
2 ml collection tubes and centrifuged for 5 min at full speed to avoid carryover of ethanol. It is important to
dry the silica membrane since residual ethanol may interfere with downstream reactions e.g. elution of
RNA. To elute, the spin columns were transferred to new 1.5 ml collection tube and 14 µl of RNAse-free
water were added directly onto the center of the silica-gel membrane. Samples were eluted by
centrifugation for 1 min at maximum speed.
4.9.2. Quantification and analysis of purity of RNA
The absorbance was checked at 260 and 280 nm for determination of sample concentration and purity. To
ensure significance, readings of A260 should be greater than 0.1. The A260/A280 ratio should be close to
2.0 for pure RNA (ratios between 1.8 and 2.3 are acceptable). For accurate values the absorbance
measurements were made in 10 mM TrisCl, pH 7.5. The spectrophotometer was calibrated with the same
solution.
RNA concentration (µg/ml) = (OD 260) x (dilution factor) x (40 µg RNA/ml)/(1 OD260 unit)
The integrity and size distribution of total RNA purified with RNeasy Kit can be checked by agarose gel
electrophoresis and ethidium bromide staining. The respective ribosomal bands should appear as sharp

METHODS 88
bands on the stained gel. 28S ribosomal RNA bands should be present with an intensity approximately
twice that of the 18S RNA band. If the ribosomal bands in a given lane are not sharp, but appear as a
smear as smaller sized RNAs, it is likely that the RNA sample suffered major degradation during
preparation.
4.9.3. Synthesis of double stranded cDNA from total RNA
4.9.3.1. First strand cDNA synthesis
The cDNA synthesis was performed using SuperScript II (Life Technologies) following the supplier’s
instructions. The following HPLC purified primer was used:
T7-(dT) 24 primer
5’- GGCCAGTGAATTGTAATACGACTCACTATAGGGAGGCGG(dT)24-3’
The 40 µg RNA samples together with T7-(dT)24 primer (100 pmol/µl) in DEPC-water (for final reaction
volume of 20 µl) were incubated at 70o C for 10 min for primer hybridization. After a quick spin the
samples were placed on ice. To the reaction tubes 4 µl of 5x first strand cDNA buffer, 2 µl of 0.1 M DTT
and 1 µl of 10 mM dNTP mix were added and samples were incubated at 42o C for two min to allow the
temperature adjustment. 5 µl of SuperScript II RT (200 U/µl) was added to the tube and incubated at 42oC
for 1 h to allow the first strand synthesis.
4.9.3.2. Second strand cDNA synthesis
Samples were centrifuged briefly to bring down condensation on sides of tube and first strand reaction
tubes were placed on ice. To the first strand reaction tubes the second strand final reaction components
were added: 91 µl DEPC-H2O, 30 µl 5x second strand reaction buffer, 3 µl 10 mM dNTP mix, 1 µl 10
U/E.coli DNA ligase, 4 µl of 10 U/E.coli DNA polymerase I, 2 U/µl E.coli RNase H. Tubes were gently
tapped to mix, then briefly spun in a microcentrifuge to remove condensation and incubated at 16oC for 2
h in a cooling waterbath.
After incubation time, 2 µl of 10U T4 DNA polymerase were added and samples were returned to 16oC for
5 min. Then 10 µl 0.5 M EDTA was added and samples were used for clean-up procedure.
4.9.3.3. Clean-up of double stranded cDNA with Sample Cleanup Module (Affymetrix)
600 µl cDNA Binding Buffer were added to the 162 µl final double-stranded cDNA synthesis preparation.
The colour of the mixture was checked to be yellow, similar to cDNA Binding Buffer without the cDNA
synthesis reaction. 500 µl of the sample were added to the cDNA cleanup spin column sitting in a 2 ml
Collection Tube and centrifuged for 1 min at 8,000 x g (> 10,000 rpm). Flow through was discarded. The
spin column was reloaded with the remaining mixture and centrifuged as above. The flow-through was
METHODS 89
removed as well as the collection tube. The spin column was transferred into a new 2 ml collection tube
and 750 µl cDNA wash buffer were pipetted onto the spin column followed by a centrifugation step for 1
min at 8,000 x g. The cap of the spin column was opened and centrifuged for 5 min at maximum speed to
allow complete drying of the membrane. The flow-through and the collection tube were removed. The spin
column was then transferred into a 1.5 ml collection tube and 14 µl of cDNA elution buffer were added
directly onto the spin column membrane and samples were incubated for 1 min at room temperature and
then centrifuged 1 min at maximum speed to elute.
4.9.4. Synthesis and purification of biotin labelled cRNA
4.9.4.1. Synthesis of biotin labelled cRNA
The GeneChip IVT Labeling Kit has been used to synthesize the biotin-labelled cRNA for both the one-
cycle and two cycle target labelling assay. Following the cDNA cleanup step the concentration of cDNA
has been determined for further applications. The needed amount of template cDNA was then transferred
to RNase-free microcentrifuge tube and the following reaction components were added in the order
indicated in the protocol: RNase free water (to give a final reaction volume of 40 µl), 4 µl 10x IVT Labeling
Buffer, 12 µl IVT Labeling NTP Mix, 4 µl IVT Labeling Enzyme Mix. Carefully the reagents were mixed and
collected at the bottom of the tube by brief (5 sec) microcentrifugation. Samples were incubated at 37oC
for 16 h. To prevent condensation that may result from water-bath-style incubators, incubations were
performed in a thermal cycler.
4.9.4.2. cRNA cleanup with Sample Cleanup Module (Affymetrix)
To the in vitro transcription reaction 60 µl of RNase-free water were added and mixed by vortexing for 3
sec. Then 350 µl IVT cRNA Binding Buffer were added to the samples and mixed by vortexing for 3 sec.
250 µl of 100 % ethanol were added to the lysate and mixed very well by pipetting. The 700 µl sample
was then transferred to the IVT cRNA cleanup spin column sitting in a 2 ml collection tube and centrifuged
for 15 sec at 8,000 x g. The flow-through and collection tube were discarded and the spin column
transferred into a new 2 ml collection tube. 500 µl IVT cRNA Wash Buffer were added onto the spin
column and samples were centrifuged for 15 sec at 8,000 x g. After discarding the flow-through, 500 µl 80
% ethanol were pipetted onto the spin column and centrifuged under the same conditions as above. The
flow-through was removed and the spin column was centrifuged with the cap opened for 5 min at
maximum speed to allow complete drying of the membrane. Both flow-through and collection tubes were
then removed. The columns were placed into new 1.5 ml collection tubes and 11 µl of RNase-free water
were added directly onto the spin column membrane. Samples were the centrifuged for one min at top
speed to elute.

METHODS 90
4.9.4.3. Quantifying the cRNA (IVT -in vitro transcription-product)
In order to determine the cRNA (IVT product) yield the spectrophotometer analysis has been used. For
photometric quantification of the purified cRNA 0.5 µl cRNA were diluted in 69.5 µl TE (1:140 dilution). The
absorbance was checked at 260 nm and 280 nm to determine sample concentration and purity. For
calculation of cRNA when using total RNA as starting material, an adjusted cRNA yield might be
calculated to reflect carryover of unlabeled total RNA. Using an estimate of 100 % carryover, the formula
below has been used to determine adjusted cRNA yield:
Adjusted cRNA yield= RNAm – (total RNAi)(y)
RNAm = amount of cRNA measured after IVT (µg)
Total RNAi = starting amount of total RNA (µg)
y = fraction of cDNA reaction used in IVT
The adjusted yield was then used for fragmentation procedure.
4.9.4.4. Checking unfragmented samples on gel electrophoresis
One aliquot (1 µg) of the purified IVT product was saved for analysis by gel electrophoresis. Gel
electrophoresis of the IVT product is done to estimate the yield and size distribution of labelled transcripts.
Parallel gel runs of unpurified and purified IVT product can help to determine the extent of a loss of
sample during the clean-up process. The RNA samples and markers were mixed with loading dye and
TE-buffer and heated to 65oC for 5 min before loading on the gel. To visualize the RNA the gel was
stained with ethidium bromide.
4.9.5. Fragmenting cRNA for target preparation
The cRNA must be at a minimum concentration of 0.6 µg/µl to start the fragmentation procedure. 2 µl of 5
x Fragmentation Buffer were added for every 8 µl of RNA plus RNase-free water to a final volume of 40 µl.
The Fragmentation Buffer has been optimized to break down full length cRNA to 35-200 bases fragments
by metal-induced hydrolysis. Samples were incubated at 94oC for 35 min. After incubation time tubes were
placed on ice and one aliquot (1 µg) saved for gel analysis. The standard fragmentation procedure should
produce a distribution of RNA fragment sizes from approximately 35-200 bases. Fragmented samples
were stored at -20oC undiluted until ready to perform the hybridization.
4.9.6. Target hybridization
Probe array was first equilibrated at room temperature before use. It is important to allow the array to
normalize to room temperature completely. Meanwhile, the following components were mixed for each
sample.

METHODS 91
Table 18 Hybridization cocktail used for HG-U133A arrays.
Reagent Standard array Final component
concentration
Fragmented cRNA 15 µg 0.05 µg/µl
Oligonucleotide B2 (3nM) 5 µl 50 pM
20x eukaryotic hybridization controls
(bioB, bioC, bioD, cre)
15 µl 1.5, 5, 25 and 100 pM
respectively
Hering sperm DNA 10 mg/ml 3 µl 0.1 mg/ml
Acetylated BSA 50 mg/ml 3 µl 0.5 mg/ml
2x hybridization buffer 150 µl 1x
H2O To final of 300 µl
Final volume 300 µl
The hybridization cocktail was heated to 99oC for 5 min in a heat block. Meanwhile the array was wet by
filling it through one of the septa with 250 µl 1x Hybridization Buffer and incubated at 45oC for 10 min with
rotation (60 rpm). When the incubation time for hybridization cocktail was over, it was transferred for 5 min
to a 45oC heat block. Then, the hybridization cocktail was centrifuged at maximum speed for 5 min to
remove any insoluble material from the hybridization mixture.
The buffer solution from the probe array cartridge was removed and filled with 250 µl of the clarified
hybridization cocktail avoiding any insoluble matter in the volume at the bottom of the tube. The probe
array was then placed in the rotisserie box in a 45oC oven. Arrays were rotated at 60 rpm and let to
hybridize for 16 h.
4.9.7. Microarrays
The GeneChip Human Genome U133A Array (HG-U133A) (Affymetrix) has been used which offers
comprehensive analysis of genome-wide expression on a single array. HG-U133A is a single array
representing 14,500 well-characterized human genes that can be used to explore human biology and
disease processes. It comprised more than 22,000 probe sets and 500,000 distinct oligonucleotide
features.
4.9.8. Fluidic station set up and experimental procedure
After 16 h of hybridization, the hybridization cocktail was removed from the probe array and set aside in a
microcentrifuge tube. The probe array was filled completely with 259 µl of non-stringent wash buffer.

METHODS 92
4.9.8.1. Preparing fluid station
First the file location was defined and then the experiment name and information were entered. The intake
buffer reservoir A was changed to non-stringent wash buffer and the intake buffer reservoir B to stringent
wash buffer. For the water reservoir autoclaved, distilled water was used.
4.9.8.2. SAPE staining solution
Streptavidin phycoerythrin (SAPE) was removed from the refrigerator and the tube tapped to mix it well
before preparing the stain solution. The components were mixed as indicated in table 19.
Table 19 Preparation of the SAPE solution.
Components Volume Final concentration
2x MES Stain Buffer 600 µl 1 x
Acetylated BSA 50 mg/ml 48 µl 2 mg/ml
SAPE (1 mg/ml) 12 µl 1 mg/ml
H2O, mol-biol grade 540 µl
Total 1,200 µl
All the components were very well mixed and centrifuged for 5 min at room temperature at maximum
speed. The supernatant was removed without carryover of insoluble material at the bottom of the tube and
divided into 2 aliquots of 600 µl each to be used for stains 1 and 3 respectively.
4.9.8.3. Antibody solution mix
The antibody solution was prepared as indicated in table 20.
Table 20 Antibody solution mix preparation.
Components Volume Final concentration
2x MES Stain Buffer 300 µl 1 x
50 mg/ml acetylated BSA 24 µl 2 mg/ml
10 mg/ml Normal Goat IgG 6 µl 0.1 mg/ml
0.5 mg/ml biotinylated antibody 3.6 µl 3 µg/ml
H2O, mol-biol grade 226.4 µl
total 600 µl
In the fluidic station dialog box on the workstation, the correct experiment name was selected in the drop-
down Experiment list. When the washing/staining program was finished, the probe array window was

METHODS 93
checked for large bubbles or air pockets.
4.9.8.4. Scanning the microarray.
Before starting the workstation the laser was switched on. The scanner was warmed up prior to scanning
by turning the laser on at least 15 min before use. The experiment to be scanned from the drop-down list
was chosen and Run button was clicked and the instruction followed.
4.9.9. Array profile
Sequences used in the design of the HG-U133A array were selected from GeneBank, dbEST and
RefSeq. The sequence clusters were created from the UniGene database (Build 133, April 20, 2001).
Oligonucleotide probes complementary to each corresponding sequence are synthesized in situ on the
array. Eleven pairs of oligonucleotide probes are used to measure the level of transcription of each
sequence represented on the GeneChip Human Genome U133A 2.0 Array.
4.9.9.1. Instrument/software requirements
The GeneChip Operating Software (GCOS) including the GeneChip Scanner 3000 High-Resolution
Scanning Patch has been used.
4.9.9.2. Critical specification for HG-U133A 2.0 Array
The GeneChip® Human Genome U133A 2.0 Array is a single array representing 14,500 well-
characterized human genes that can be used to explore human biology and disease processes (table 21).
Oligonucleotide probes complementary to each corresponding sequence are synthesized in situ on the
array. Eleven pairs of oligonucleotide probes are used to measure the level of transcription of each
sequence represented on the GeneChip Human Genome U133A 2.0 Array (HG-U133A 2.0).
Table 21 HG-U133A 2.0 Array.
HG-U133A 2.0 Array
Number of arrays in set 1
Number of transcripts 18,400
Number of genes 14,500
Number of probe sets >22,000
Feature size 11 µm
Oligonucleotide probe length 25-mer
Probe pairs/sequence 11

METHODS 94
Control sequences included
• Hybridization controls
• Poly-A controls
• Normalization control set
• Housekeeping / Control genes
Bio B, bio C, bio D, cre
dap, lys, phe, thr
100 probe stes
GAPDH, beta-actin,
ISGF3 (STAT1)
Detection sensitivity
(as measured by detection of pre-labelled transcripts derived from human
cDNA clones in a complex human background)
1:100,000
4.9.10. Probe array image inspection
The array was inspected for the presence of image artefacts (i.e. high/ low intensity spots, scratches, high
regional or overall background etc.).
4.9.11. Average background and noise values
Although there are no official guidelines regarding background, Affymetrix has found that typical Average
Background values range from 20 to 100 for arrays scanned with Gene Array Scanners calibrated to the
new PMT setting (10 % of maximum). Arrays being compared should ideally have comparable
background values.
4.9.12. B2 Oligo performance
The boundaries of the probe area are easily identified by the hybridization of B2 oligo, which is spiked into
each hybridization cocktail. B2 Oligo serves as a positive hybridization control and is used by the software
to place a grid over the image. Variation in B2 hybridization intensities across the array is normal and
does not indicate variation in hybridization efficiency.
4.9.13. Poly-A controls: dap, lys, phe, thr, trp
Dap, lys, phe, thr and trp are B. subtilis genes that have been modified by the addition of poly-A tails, and
cloned into pBluescript vectors, which contain both T3 and T7 promoter sequences. Amplifying these poly-
A controls with T3 RNA polymerase will yield sense RNAs, which can be spiked into a complex RNA
sample, carried through the sample preparation process, and evaluated like internal control genes.
Amplifying these genes with T7 RNA polymerase and biotinylated ribonucleotides will yield antisense
cRNA, which can be spiked into a hybridization cocktail and evaluated like the 20xEukaryotic
Hybridization Controls (bioB, bioC, bioD and cre).

METHODS 95
4.9.14. Hybridization controls: bioB, bioC, bioD and cre
BioB, bioC and bioD represent genes in the biotin synthesis pathway of E. coli. Cre is the recombinase
gene from P1 bacteriophage. The GeneChip Eukaryotic Hybridization Controls are composed of a mixture
of biotin-labelled cRNA transcripts of bioB, bioC, bioD and cre prepared in staggered concentrations (1.5
pM, 5 pM, 25 pM and 100 pM for bioB, bioC, bioD and cre, respectively).
The 20x Eukaryotic Hybridization Controls are spiked into the hybridization cocktail, independent of RNA
sample preparation and are thus used to evaluate sample hybridization efficiency to gene expression
arrays. BioB is at the level of assay sensitivity (1:100,000 complexity ratio) and should be called “Present”
at least 50 % of the time. BioC, bioD and cre should always be called “Present” with increasing signal
values, reflecting their relative concentrations.
4.9.15. Internal controls genes
For the majority of the GeneChip expression arrays, actin and GAPDH are used to asses RNA sample
and assay quality. Specifically, the signal values of the 3’ probe set to the 5’ probe set is generally no
more than 3.
4.9.16. Percent genes present
The number of probe sets called “Present” relative to the total number of probe sets on the array is
displayed as a percentage in the Expression Report file. Percent Present (% P) values depend on multiple
factors including cell/tissue type, biological or environmental stimuli, probe array type and overall quality of
RNA. Replicate samples should have similar p values.
4.9.17. Scaling and normalization factors
For replicates and comparisons involving a relatively small number of changes, the scaling/ normalization
factors (calculated by the global method) should be comparable among arrays. Scaling/normalization
factors calculated by the “Selected Probe Sets” method should also be equivalent for arrays being
compared.
4.9.18. Single array analysis
Single array analysis was used to build databases of gene expression profiles, facilitate sample
classification and transcript clustering, and monitor gross expression characteristics. In addition, the
analysis provided the initial data required to perform comparisons between experiment and baseline
arrays. The analysis generated a detection p-value which was evaluated against user-definable to
METHODS 96
determine the detection call. This call indicated whether a transcript was reliably detected (Present) or not
detected (Absent). Additionally, a signal value was calculated which assigned a relative measure of
abundance to the transcript.
4.9.18.1. Detection algorithm
The detection algorithm used probe pairs intensities to generate a detection p-value and assigned a
Present, Marginal or Absent call. Each probe pair in a probe set was considered as having a potential vote
in determining whether the measured transcript is detected (Present) or not detected (Absent). The vote
was described by a value called the determination score (R). The score was calculated for each probe
pair and was compared to a predefined threshold Tau. Probe pairs with scores higher than Tau voted for
the presence of the transcript. Probe pairs with scores lower than Tau voted for the absence of the
transcript. The voting result was summarized as a p-value. The higher the discrimination scores are above
Tau, the smaller the p-value and the more likely the transcript will be present. The lower the discrimination
scores are below Tau, the larger the p-value and the mote likely the transcript will be absent.
4.9.18.2. Detection p-value
A lower p-value is a reliable indicator that the result is valid and that probability of the error in the
calculation is small.
4.9.18.3. Detection call
The user-modifiable detection p-value cut-offs, Alpha 1 (α1) and Alpha 2 (α2) provide boundaries for
defining Present, Marginal or Absent calls. At the default settings, determinated for probe sets with 16-20
probe pairs (defaults α1= 0.04 and α2= 0.06), any p-value that falls below α1 is assigned a Present call,
and above α2 is assigned an Absent call. Marginal calls are given to probe sets which have p-values
between α1 and α2.
4.9.18.4. Signal algorithm
Signal is a quantitative metric calculated for each probe set, which represents the relative level of
expression of a transcript. Similar to the detection algorithm, each probe pair in a probe set is considered
as having a potential vote in determining the signal value. The vote, in this case, is defined as an estimate
of the real signal due to the hybridization of the target. The mismatch intensity is used to estimate stray
signal. The real signal is estimated by taking the log of the perfect match intensity after subtracting the
stray signal estimate. The probe pair vote is weighted more strongly if this probe pair signal value is closer
to the median value for a probe set. Once the weight of each probe pair is determined, the mean of the

METHODS 97
weighted intensity values for a probe set is identified. This mean is corrected back to linear scale and is
output as signal.
When the mismatch intensity is lower than the perfect match intensity, then the mismatch is informative
and provides an estimate of the stray signal. Rules are employed in the signal algorithm to ensure that
negative signal values are not calculated. Negative values do not make physiological sense and make
further data processing, such as log transformation, difficult. Mismatch values can be higher than perfect
match values for a number of reasons, such as cross hybridization. If the mismatch is higher than the
perfect match, the Mismatch provides no additional information about the estimate of stray signal.
4.9.19. Comparison analysis (experiment vs. baseline arrays)
In a Comparison Analysis, two samples, hybridized to the GeneChip probe arrays of the same type, are
compared against each other in order to detect and quantify changes in gene expression. One array is
designed as the baseline and the other as an experiment. The analysis compared the different values of
each probe pair in the baseline array to its matching probe pair on the experiment array. Two sets of
algorithms are used to generate change significance and change quantity metrics for every probe set. A
change algorithm generates a change p-value and an associated change. A second algorithm produces a
quantitative estimate of the change in gene expression of Signal Log Ratio.
Before comparing two arrays, scaling and normalization methods must be applied. Scaling and
normalization correct for variations between two arrays. Two primary sources of variation in array
experiments are biological and technical differences. Biological differences may arise from many sources
such as genetic background, growth conditions, time, weight, sex, age and replication. Technical variation
can be due to the experimental variables such as quality and quantity of the target hybridized, reagents,
stain and handling error. Normalization and scaling techniques can be applied by using data from a
selected user-defined group of probe sets, all from all probe sets. When normalization is applied, the
intensity of the probe sets (or selected probe sets) from the experiment are normalized to the intensity of
the probe sets (or selected probe sets) on the baseline array. When scaling is applied, the intensity of the
probe sets (or selected probe sets) from the experimental array and that from the baseline array are
scaled to a user-defined target intensity. In general, global scaling in the preferred method is required
when comparing two arrays.
4.9.19.1. Change algorithm
During a comparison analysis, each probe set on the experiment array is compared to its counterpart on
the baseline array, and a change p-value is calculated indicating an increase, decrease, or no change in
gene expression.

METHODS 98
4.9.19.2. Change p-value
A total of three, one-sided p-values are computed for each probe set. These are combined to give one
final p-value which is provided in the data analysis output. The p-value ranges in scale from 0.0 to 1.0 and
provides a measure of the likelihood of change and direction. Values close to 0 indicate likelihood for an
increase in transcript expression level in the experiment array compared to the baseline, whereas values
close to 1.0 indicate likelihood for a decrease in transcript expression level. Values near 0.5 indicate a
weak likelihood for change in either direction. Hence, the p-value scale is used to generate discrete
change calls using thresholds.
4.9.19.3. Change call
The final change p-value described above is categorized by the cutoff values called gamma 1 and gamma
2. These cut-offs provide boundaries for the change calls: Increase (I), Marginal Increase (MI), No Change
(NC), Marginal Decrease (MD), or Decrease (D).
4.9.19.4. Signal Log Ratio algorithm
The Signal Log Ratio estimates the magnitude and direction of change of a transcript when two arrays are
compared (experiment vs. baseline). It is calculated by comparing each probe pair on the experiment
array to the corresponding probe pair on the baseline array. This strategy cancels out differences due to
different probe binding coefficients and is therefore more accurate than a single array analysis. The log
scale is base 2, making it intuitive to interpret the Signal Log Ratios in terms of multiples of two. Thus, a
Signal Log ratio of 1.0 indicates an increase of the transcript level by two fold and -1.0 indicates a
decrease by two fold. A Signal Log Ratio of zero would indicate no change.
Table 22 Terminology comparison (statistical algorithms vs. empirical algorithms).
Statistical algorithms Empirical algorithms
Signal Average difference
Detection Absolute call
Change Difference call
Signal Log Ratio Fold change
4.9.19.5. The logic of logs
Quantitative changes in gene expression are reported as a Signal Log Ratio in the statistical algorithms as
opposed to a fold change that was reported in the empirical algorithms. Since log2 is used, a Signal Log
Ratio of 1 equals a fold change of 2 and a Signal Log Ratio of 2 equals a fold change of 4. Alternatively,

METHODS 99
the following formula might be used:
2 Signal Log Ratio
Signal Log Ratio ≥ 0
Fold Change={
(-1) x 2 –(Signal Log Ratio) Signal Log Ratio < 0
4.9.19.6. Basic data interpretation
The use of GeneChip gene expression arrays allows interrogation of several thousands of transcripts
simultaneously. One of the formidable challenges of this assay is to manage and interpret large data sets.
One standardized approach for sorting gene expression data involves the following metrics:
• Detection
• Change
• Signal Log Ratio
Detection is the qualitative measure of presence or absence for a particular transcript. A fundamental
criterion for significance is the correlation of the detection calls for a particular transcript between samples.
When looking for robust increases, it is important to select for transcripts that are called “Present” in the
experimental sample. It has been eliminated the “Absent” to “Absent” changes, which are uninformative.
Change is the qualitative measure of increase or decrease for a particular transcript. When looking for
both significant increases and decreases, it is important to eliminate “No Change” calls.
Signal Log Ratio is the quantitative measure of the relative change in the transcript abundance. Robust
changes can be consistently identified by selecting transcripts with a fold change of > 2 for increases and
< 2 for decreases. This corresponds to a Signal Log Ratio of 1 and -1, respectively.
4.9.19.7. Interpretation of metrics
When sorting through gene expression data in Microarray Suite, some transcripts provided conflicting
information. Here are some examples:
1. A transcript is called “Increase” but has a Signal Log Ratio of less than 1.0.
2. A transcript is called “No Change” but has a Signal Log Ratio of greater than 1.0.
3. A transcript is called “Absent” in both experimental and baseline files but is also called “Increase”.
These contradictions arise due to the fact that detection, change and Signal Log Ratio are calculated
separately. The benefit of this approach is that transcripts can be assessed using three independent
metrics. Thus, in order do determine the most robust changes it is crucial to use all three metrics in
conjunction. Basic steps for determining robust increases are:
1. to eliminate probe sets in the experimental sample called “Absent”
2. to select for probe sets called “Increase”
3. to eliminate probe sets with a Signal Log Ratio of bellow 1.0.
METHODS 100
Basic steps for determining robust decreases:
1. to eliminate probe sets in the baseline sample called “Absent”.
2. to select for probe sets called “Decrease”.
3. to eliminate probe sets with a Signal Log Ratio of above -1.0.
4.9.20. Online Informatics Resource
The NetAffx website (www.netaffx.com) is a unique resource created by Affymetrix that allows researchers
to correlate their GeneChip array results to a catalog of array design and annotation information. These
annotations provide structural and functional information, helping to draw biologically relevant conclusions
about the experimental results.
4.9.21. Data analysis and software
For data collection, assessment and statistical analyses, the Affymetrix Microarray Analysis Suite Version
5.0 program (MAS5.0) has been used. Quality control assessment included the percentage of probe sets
called present, signal-to-background ratio and 3’ to 5’ ratio in housekeeping controls for IVT procedure
validation. For data analysis each array was scaled to an overall intensity of 100 to enable comparison of
all hybridization data. Resulting CEL files were further analyzed with DNA-Chip Analyzer (dCHIP 1.2®) and
R software (Bioconductor project). Changes in the expression profile between the two different
experimental groups were determined by comparison analysis which contained the change indicating a
qualitative call (increase, decrease, no change) in transcript level differences. Statistical significance was
calculated by 2-sample 2-tailed Student’s t test. Comparisons were considered statistically significant at p
< 0.05.
4.10. Genome scan analysis
Genome-wide linkage scans have traditionally employed panels of microsatellite markers spaced at
intervals of approximately 10 cM across the genome. However, there is a growing realization that a map
of closely spaced single-nucleotide polymorphisms (SNPs) may offer equal or superior power to detect
linkage, compared with low-density microsatellite maps.
4.10.1. Arrays
The genome scan was carried out using 10K (10,000 SNPs) Affymetrix chip at the service facility of the
Cologne Centre for Genomics (www.ccg.uni-koeln.de). Each array contained 11,555 biallelic polymorphic
sequences randomly distributed throughout the genome, except for the Y chromosome. Each SNP on the
array is represented by 40 different 25 bp oligonucleotides, each with slight variations that allow accurate

METHODS 101
genotyping. The median physical distance between SNPs is ~ 150 kb and the mean distance between
SNPs is 210 kb. The average heterozygosity for these SNPs is 0.37 with an average minor allele
frequency of 0.25.
The samples were prepared for the chip hybridization according to the manufacturer’s instructions
(Affymetrix Inc., Santa Clara, CA, USA), using 250 ng DNA of each proband. For reading the hybridization
signals, the GeneChip Scanner 3000 (Affymetrix Inc.) was used and the data was analyzed using the
GDAS program (version 2.0; Affymetrix Inc.). Of the 11,555 SNPs on the GeneChipTM Mapping 10 K
Array, 301 SNPs were X-linked and 360 were not physically mapped in NCBI build 34. The SNP
annotation files (www.affymetrix.com) include the genetic positions of the SNPs related to deCODE,
Marshfiled and SLIM1 maps.
4.10.2. Statistical analysis
Linkage analysis is the interference of the position of two or more loci by examining patterns of allele
transmission from parent to offspring, or patterns of allele sharing by relatives. Linkage analysis is a
statistical test to look if the genetic marker co-segregates with the loci (disease) in the families. The result
of the linkage analysis is represented by LOD scores at various recombination fractions with positive (3)
scores for linkage and negative (-2) against linkage. LOD scores of 3 shows a significant evidence for
linkage, with 5 % chance of error.
4.10.2.1. Non-parametric linkage analysis using MERLIN software
The general idea of non-parametric linkage (NPL) analysis is that, in the vicinity of a disease locus, sib
pairs who are concordant for disease status (i.e. both affected or both unaffected) should show an
increase in allele-sharing, and those who are discordant for disease status (i.e. one affected and one
unaffected) should show a decrease in allele sharing, from the level of allele-sharing expected of sib pairs.
MERLIN is a program for carrying out single and multipoint non-parametric linkage, QTL, and Variance
Component analysis (Abecasis et al. 2002). It is very similar in functionality to GENEHUNTER, except it
only carries out non-parametric linkage analysis. One of the main advantages of MERLIN is that it was
designed with the intention of analysing dense SNP maps (Abecasis et al. 2002). To this end it utilises
sparse inheritance trees in the same way as the newer versions of GENEHUNTER (Kruglyak et al. 1996)
to, but it also employs several other algorithms which enhance performance. In comparison to
GENEHUNTER and ALLEGRO (Gudbjartsson et al. 2000), MERLIN is approximately 30 times faster.
4.10.2.2. Parametric linkage analysis
Parametric linkage analysis requires mod of inheritance to be specified prior to analysis. Standard LOD
score analysis is called parametric because, it requires precise genetic model, detailing disease allele

METHODS 102
frequency, marker allele frequency, and penetrance of each genotype (Abreu et al. 1999). The penetrance
is defined as the frequency of expression of an allele when in present in the genotype of the organism (for
instance if 9/10 of individuals carrying an allele, the trait is said to be 90 % penetrant). As parametric
linkage analysis is more powerful when the specified model is close to the true underlying mode of
inheritance (Abreu et al. 1999), it has been carried out parametric analyses using one dominant (0.0000,
1.0000, 1.0000) and one recessive (0.0000, 0.0000, 1.0000) inheritance model. For a polygenic trait,
evidence for linkage at a given locus may not be detectable assuming genetic homogeneity that is in the
complete data set of linked and unlinked families. It has been therefore computed heterogeneity lod
scores (HLOD) for varying proportions of linked families (α) using Genehunter V2.0. Due to the small size
of the individual families investigated each family contributed relatively little linkage information, making it
difficult to divide them into distinct categories of linked and unlinked families. We assessed the genome-
wide significance level of the linkage results empirically using Allegro V1.0. Multipoint linkage analysis in
complex diseases requires the use of fast algorithms that can handle many markers and a large number of
moderately sized pedigrees with unknown mode of inheritance.
4.11. Additional statistical methods
Data are present as means (+/- SD) and analyzed using Student’s t test with p<0.05 considerate
significant. The t-test assessed whether the means of two groups are statistically different from each
other.

RESULTS 103
5. RESULTS
5.1. Search for SMA modifying factor(s) by candidate gene approach
A combination of linkage mapping and a candidate gene approach has been the most successful method
of identifying disease genes to date. The candidate gene approach is useful for quickly determining the
association of the genetic variant with a disorder and for identifying genes of modest effect.
The presence of phenotypic discordance in SMA families that are characterized by SMN1-deleted sibs
with identical SMN2 copy number but discordant phenotypes (Cobben et al. 1995; Hahnen et al. 1995;
Wang et al. 1996; Wirth et al. 1999) strongly implies that additional factors, except for SMN1 and SMN2
are influencing the SMA phenotype.
SMN-interacting proteins, such as Gemin 2, Gemin 3, ZPR1, p80 coilin, FUSE binding protein, profilin IIa,
RHA, hnRNP-G and hnRNP-Q, were shown to be tight co-regulated with SMN in SMA discordant families
(Helmken et al. 2003; Helmken et al. 2000). Molecular analysis of these genes showed no mutation or
nucleotide difference, and no differential RNA expression, and failed to be classified as SMA modifying
genes. It is known already that many mutations do not result in amino acid changes, however, and
therefore do not alter the resulting protein or its function. Furthermore, many mutations occur in non-
coding DNA regions and might be associated with an altered phenotype or increased disease risk.
Therefore, another three candidate genes (ZNF265, HDAC6 and hnRNP-R) were further investigated at
DNA and/or RNA level, in hope to identify potential modifying factors that prevent some siblings from
developing SMA despite the lack of SMN1.
5.1.1. Selection of candidate genes
5.1.1.1. Selection of ZNF265 gene
Gene transcription and pre-mRNA splicing are dynamic and highly coordinated processes that occur in a
spatially organized manner in the nucleus (Singer and Green 1997). Splicing takes place in the
spliceosome, a large RNA-protein complex composed of various small nuclear ribonucleoprotein particles
(snRNPs), and many other protein factors that include members of the highly conserved serine/arginine
rich (SR) protein family. SR proteins, by RNA-protein and protein-protein interactions, coordinate the
passage of the spliceosomal complex though the splicing reaction (Caceres et al. 1997; Fu 2004; Manley
and Tacke 1996).
ZNF265 (formally named “Zis”) is a zinc finger- and RS domain-containing protein (Adams et al. 2000;
Karginova et al. 1997) that was first identified, along with rennin, because of its modulated expression in
differentiating renal juxtaglomerural cells (Karginova et al. 1997); it is now known to be expressed by most
tissues, especially early in development (Adams et al. 2000). ZNF265 co-localizes with SMN in the
nucleus, as well as with the authentic SR protein SC35 (at the periphery of the SC35-staining aggregates)

RESULTS 104
and with the snRNP protein antigen Sm (Adams et al. 2001). ZNF265 also co-localizes with the
transcription factors YY1 and p300 (Adams et al. 2001), both of which have been shown to co-localize
within active transcriptional compartments and, in the case of p300, with RNA polymerase II (Bannister
and Kouzarides 1996; Ogryzko et al. 1996; von Mikecz et al. 2000; Yang et al. 1996). These co-
localizations are consistent with a role of ZNF265 in transcription and/or splicing. In this regard, ZNF265
may be co-transcriptionally recruited with RNA polymerase II to pre-mRNA transcripts, as has been
reported for other RS domain-containing proteins (Corden and Patturajan 1997). The fact that ZNF265
interacts with U1-70K and U2AF35 point to its early commitment to the spliceosome, as the latter factors
are necessary for the first detectable association between splice sites during formation of the E complex
(Michaud and Reed 1993; Wu and Maniatis 1993; Xiao and Manley 1998). Based on the composition of
affinity-purified E complex, this association has been proposed to occur through direct or indirect
interaction of U1snRNP and U2AF35 bound to the 5’ and 3’ splice sites, respectively (Michaud and Reed
1993). One model has suggested that SF2/ASF or SC35 was subsequently able to form a bridge between
U1-70K and U2AF35 (Wu and Maniatis 1993). The finding that ZNF265 interacts more strongly with U1-
70K than with U2AF35, suggests that earlier binding of ZNF265 to U1-70K, as opposed to U2AF35, during
recruitment to the spliceosome (Adams et al. 2001).
In vitro splicing reactions showed that ZNF265 is immunoprecipitated in a complex that includes spliced
mRNA (Adams et al. 2001). This result indicated that ZNF265 binds directly or indirectly to mRNA, but
much less to pre-mRNA. This property is shared with other splicing factors, such as SF2/ASF and RNPS1
(Hanamura et al. 1998; Mayeda et al. 1999), both of which synergistically stimulate general splicing.
ZNF265 can regulate alternative splicing in a concentration-dependent manner (Adams et al. 2001).
Namely, overexpression of ZNF265 resulted in exclusion of exons 2 and 3 from the Tra2-β1 pre-mRNA,
which led to an increase in the production of the β3 alternatively spliced isoform (Adams et al. 2001).
In conclusion, ZNF265 co-localizes with the spliceosome, associate with mRNA and essential splicing
factors U1-70K and U2AF35, as well as regulates the alternative splicing of Tra2-β1. Therefore, it was
obvious to ask whether ZNF265 might influence the variability of the SMA phenotype.
5.1.1.2. Molecular analysis of ZNF265 gene in SMA discordant families
To answer the question whether ZNF265 gene can be a modifying factor for SMA phenotype variability,
the gene was analyzed in 30 sibs belonging to 12 SMA discordant families (families are marked with “1” in
table T2 in appendix). All SMA discordant families displayed identical 5q13 haplotypes and identical
SMN1 mutations on both parental chromosomes but variably phenotypes (unaffected and affected, types
II and III or types IIIa and IIIb, respectively). ZNF265 gene (located on chromosome 1) was searched for
DNA sequence variances by sequencing the complete coding region from genomic fragments that
encompass each of the 11 exons by using intronic flanking primers (see table 3 from Methods). Neither a
mutation nor a polymorphism within the coding region or exon-intron boundaries was identified. It has
been concluded therefore that the intrafamilial phenotypic variability in SMA discordant families is not

RESULTS 105
caused by mutations/polymorphisms within ZNF265 gene.
5.1.1.3. Selection of hnRNP-R gene
Heterogeneous nuclear ribonucleoproteins (hnRNPs), which directly bind to nascent RNA polymerase II
transcripts, play an important role in both transcript-specific packaging and alternative splicing of pre-
mRNAs. Using yeast two-hybrid techniques, Rossoll et al. (2002) identified hnRNPR (Rossoll et al. 2002)
and the highly related gry-rbp/hnRNPQ (Mourelatos et al. 2001) as novel SMN interaction partners.
hnRNPs are among the most abundant proteins in the eukaryotic nucleus and play important role in
processing of precursor mRNA (Dreyfuss et al. 1993; Weighardt et al. 1996). They assemble on nascent
RNA polymerase II transcripts to form hnRNP complexes, where they co-localize with small nuclear
snRNPs. hnRNP proteins have a modular structure consisting of one or more RNA binding domains and
at least another auxiliary domain, which mediates protein-protein interactions but may also contribute to
nucleic acid binding (Biamonti and Riva 1994; Dreyfuss et al. 1993; Weighardt et al. 1996).
Among the three types of RNA binding motifs identified in hnRNP proteins, the consensus sequence RNA
binding domain (RBD), also named RNA recognition motif (RRM), is the most frequently found motif (Burd
and Dreyfuss 1994). hnRNP-R is mainly expressed in motor axons and at much lower degree in sensory
axons. Highest expression levels of hnRNP-R during development of the spinal cord can be found during
late embryogenesis around E19 (Rossoll et al. 2002). The reduction of hnRNP-R level after birth
apparently is due to post-transcriptional and/or post-translational mechanisms as previously observed for
Gemin 2 (Jablonka et al. 2001; Wang and Dreyfuss 2001a).
hnRNP-R co-localizes with SMN in the cytoplasm of the motor neurons including the axons. It was also
found in the nucleus but not concentrated in gems (Rossoll et al. 2002). Thus it is unlikely that hnRNP-R
participates in specific functions of SMN complexes such as pre-mRNA splicing and regeneration of the
spliceosomal complexes (Pellizzoni et al. 1999).
hnRNP-R specifically binds mRNAs, being involved in mRNA processing including editing, in mRNA
transport and finally acts as a regulator, which modify binding to ribosomes and RNA translation (Blanc et
al. 2001; Grosset et al. 2000; Mizutani et al. 2000). Such functions appear highly important for neurons
with long processes, in particular motor neurons in which specific mRNAs have to be transported over
long distances.
The length of motor axons can exceed the diameter of the cell body by a factor of more that 5,000, thus
underlining the relevance of control mechanism for mRNA transport to distant cellular sites such as to
growth cones or motor endplates (Gallant 2000; Mohr and Richter 2000). Smn and hnRNP-R are
concentrated and co-localize in the distal axon of isolated embryonic motor neurons. At the electron
microscopic level, it could be demonstrated that Smn immunoreactivity is associated with microtubules in
motor axons during post-natal development (Pagliardini et al. 2000). hnRNP-R interacts with wild type
murine Smn but not with truncated or mutant Smn forms identified in SMA (Mourelatos et al. 2001).
Because hnRNP-R and SMN are closely interacting proteins, part of the same cellular protein complex,

RESULTS 106
the same pathway and exhibit the same cellular location in motor neurons, hnRNP-R was a good
candidate as potential modifier in SMA discordant families.
5.1.1.4. Molecular analysis of hnRNP-R at DNA and RNA level
In order to test whether hnRNP-R might act as modifying factor in SMA, five SMA discordant families
(marked with “2” in table T2 in appendix) were tested for SNPs association with SMA/unaffected
phenotype. In contrast to mutations, which occur at low frequencies (less than 1%) in the general
population, polymorphisms are common genetic variants, occurring more frequently (Davies et al. 2005)
Within genes, the number of SNPs varies widely, from one or two to several hundred. It is likely however,
that all SNPs are not equally important, and analysis is often restricted to those in: a) exons, particularly if
leading to an amino acid substitution; b) regulatory regions, which may affect binding of transcription
factors; c) exon/intron boundaries, which may influence splicing; d) conserved regions, as this usually
implies a significant function (Davies et al. 2005). No SNP was found within the hnRNP-R gene coding
region but two SNPs located in the intronic region were selected for association studies in all five SMA
discordant families: rs2842604 (A/C) located in intron 6 and rs911927 (C/G) located in intron 10. The
nucleotide variants were checked by sequencing the target region from genomic fragments. Both SNPs
were successfully genotyped in the five SMA discordant families comprising 7 unaffected SMN1-deleted
sibs and 6 affected (type III SMA) SMN1-deleted sibs. For all five families the DNA samples from parents
were also available. As shown in table 23 no association between a certain allele and SMA phenotype
was found.
Table 23 Genotyped SNPs across the hnRNP-R locus in five SMA discordant families.
dbSNP number Position Allele variant Unaffected sibs
SMN1-deleted
Affected sibs
SMN1-deleted
rs28426064 +16727 A/C A/C AA CC A/C AA CC
3 3 1 4 1 1
rs911927 +25167 C/G C/G CC GG C/G CC GG
3 1 3 3 2 1
Additionally, hnRNP-R gene was checked at transcription level to verify whether any difference between
discordant sibs at RNA level could be observed. In order to prove this hypothesis, quantitative analysis of
RT-PCR products using primers that were localized in 5’UTR region and exon 4 amplifying hnRNP-R from
lymphoblastoid cell lines from 13 sibs of five SMA discordant families was performed. No quantitative
difference between hnRNP-R transcripts and the total amount of RNA was found. A representative image
is shown in Fig. 8 for three SMA discordant families.
Therefore, hnRNP-R was excluded to act as potential modifier in SMA discordant families

RESULTS 107
5.1.1.5. Selection of HDAC6 gene
Histone deacetylases (HDACs) have been intensively scrutinized over the past few years for two main
reasons. First, they have been linked mechanistically to the pathogenesis of cancer, as well as several
other diseases. Second, small-molecule HDAC inhibitors exist that have capacity to interfere with HDAC
100
bp
hnRNP-R
HPRT
# 646
BW
413
BW
412
U III
# 482
BW
330
BW
332
BW
279
BW
283
U III U III
# 34
100
bp
hnRNP-R
HPRT
# 646
BW
413
BW
412
U III
# 482
BW
330
BW
332
BW
279
BW
283
U III U III
# 34
Fig. 8 Semi-quantitative analysis of RT-PCR products of hnRNP-R gene from EBV-transformed
lymphoblastoid cell lines in three SMA discordant families. HPRT gene was used as internal
control. No difference in hnRNP-R transcript level was detected between SMA discordant sibs.
Family number is indicated at the top. U: unaffected; III: type III SMA.
activity and can therefore achieve significant biological effects in preclinical models of cancer (Minucci and
Pelicci 2006). HDAC enzymes operate together with many proteins, with various functions, such as
recruitment, co-repression or chromatin remodelling, are involved in forming a complex that results in the
repressor complex (de Ruijter et al. 2003). There are two protein families with HDAC activity: the SIR2
family of NAD+-dependent HDACs and the classical HDAC family. Members of the classical HDAC family
fall into two different phylogenetic classes, class I and class II (Bjerling et al. 2002; Fischle et al. 2002).
The class I HDACs (HDAC 1,2,3 and 8) are most closely related to the yeast (Saccharomyces cerevisiae)
transcriptional regulated RPD3. Class II HDACs (HDAC 4, 5, 6, 7, 9 and 10) share domains with similarity
to HDAC1, another deacetylase found in yeast (Bjerling et al. 2002).
HDAC6 is evolutionarily most closely related to HDAC10. HDAC6 is a rather unique enzyme within the
classical family of HDACs, because it contains two catalytic domains arranged in tandem (Marks et al.
2001; Yoshida et al. 2001). HDAC6 was originally cloned as a member of the histone deacetylase family
reportedly expressed in several tissues including the testis, liver and brain (Grozinger et al. 1999; Verdel
and Khochbin 1999). It was later shown, however, that HDAC6 enhances cell motility through the
deacetylation of α-tubulin, indicating that HDAC6 is related to cell migration rather than transcriptional
regulation (Haggarty et al. 2003; Hubbert et al. 2002; Palazzo et al. 2003).
In addition, a recent report showed that HDAC6 is also related to the transported of misfolded protein in
the proteasome system (Kawaguchi et al. 2003). The expression of HDAC6 is regulated by estradiol in the
estrogen receptor α-positive breast cancer cells, MCF-7 (Saji et al. 2005). The up-regulation of HDAC6 in
MCF-7 cells caused morphological changes, and enhanced migration ability through deacetylation of α-

RESULTS 108
tubulin (Saji et al. 2005).
Because SMN protein was found to be involved in gene repression (Zou et al. 2004) via interaction with
HDAC proteins, HDAC6 gene (besides, located on chromosome X) was chosen as candidate gene as
potential modifier in SMA model.
5.1.1.6. Testing of DNA polymorphisms in HDAC6 gene
The human genome contains about 10-30 million SNPs with an average of SNP every 100-300 bases
(Montpetit et al. 2006). More than 4 million SNPs have been identified and the information is publicly
available. SNPs occur mostly outside the coding regions but SNPs in the coding regions would be
interesting as they add to variation in the function of the protein. Therefore, two SNPs located in the
coding region of HDAC6 gene were found interesting since both of them cause an amino acid exchange
at protein level. One SNP, rs146379 (T/C; position +15625) located in exon 21 causes a leucine to proline
exchange at position 700; rs1127346 (C/T; position +20681) located in exon 24 causes a threonine to
isoleucine substitution at position 994. Both SNPs were genotyped in the same five families as above and
no informative SNP was found. For rs1467379 all individuals (both unaffected and affected) were carrying
T allele; for rs1127346 all sibs were carrying the C allele. Both SNPs were not informative and no
conclusion could be drawn. Therefore HDAC6 gene was excluded to function as potential factor able to
modify the SMA phenotype. Other molecular mechanisms must be responsible for the intrafamilial
phenotypic discrepancies in SMA discordant families, mechanisms hard to be detected by candidate gene
approach.
5.2. Search for SMA modifying genes by differential expression profiling using
Affymetrix microarray technology
Gene expression profiling has been applied to many aspects of human biology including stress responses
of human cells (Belcher et al. 2000; Guillemin et al. 2002; Iyer et al. 1999), identification of signalling
cascades (Coller et al. 2000; Diehn et al. 2002; Fambrough et al. 1999; Shaffer et al. 2000), or regulated
expression of cell cycle-associated genes (Mirza et al. 2003; Whitfield et al. 2002). For clinical
investigation and medicine, gene expression signatures are used to better define biological processes that
might be associated with disease, therapy or severe adverse events following therapy (Debey et al. 2004)
Examination of gene expression levels can provide insights into the temporal changes that occur in
induced cells and into the molecular differences between various cells or tissue samples. Microarrays
detect gene expression levels in parallel by measuring the hybridization of mRNA to many thousands of
genes immobilized on a glass surface (the “chip”) providing a sensitive and high-throughput method well
suited to take advantage of the sequence and clones produced in genome sequencing efforts (Keller and
Yao 2002).

RESULTS 109
5.2.1. The microarray screen for EBV-transformed lymphoblastoid cell RNAs revealed up-
and down-regulated genes in asymptomatic vs. symptomatic sibs in SMA discordant
families
To address the clinically relevant difference between symptomatic vs. asymptomatic sibs with SMN1
deletion, in SMA discordant families, a gene expression profiling of EBV-transformed lymphoblastoid cells
from one SMA discordant family and four classical SMA patients was carried out using oligonucleotide
arrays. Total RNA isolated from EBV-transformed lymphoblastoid cell cultures from SMA discordant family
#482 (that comprises two unaffected sibs- BW 330 and BW 331- and two affected ones- BW 332 and BW
333), two type I (BW 226 and BW 409) and two type III (BW 12 and BW 309) SMA patients (marked with
“3” in table T1 in appendix) was used to hybridize HG-U133A Affymetrix chip to detect transcripts
differentially expressed in asymptomatic vs. symptomatic sibs. The two types of SMA patients (type I and
type III) were used under the assumption that only the transcripts differentially expressed due to the
modifier gene and not due to the lack of SMN protein would be detected. In the first step of analysis, the
data from unaffected siblings (tables T3 and T4 that are contained in the attached CD-ROM) were
compared with the data from affected sibs to obtain pools of transcripts up- and down-regulated in
unaffected than affected sibs. Then, these pools of data were compared with the transcripts found to be
differentially expressed in the two SMA types used as controls (tables T5 and T6 that are contained in the
attached CD-ROM). In this manner, all the transcripts co-regulated by SMN1 deletion were excluded. The
SMA discordant family #482 (for a detailed characterization of this family see Fig. F1 in appendix) in the
microarray expression experiment comprises two unaffected females (BW 330 and BW 331, respectively)
and two affected males (BW 332 and BW 333). Each healthy female was compared with each affected
male so that four combinations were possible (BW 330 vs. BW 332; BW 330 vs. BW 333; BW 331 vs. BW
332; BW 331 vs. BW 333). The unaffected sibs were analyzed as “baseline” in comparison with the
affected sibs that were analyzed as “experiment”. All transcripts that were found to be up-regulated in the
“baseline” were collected as “increase baseline” and are listed in table T3 that is contained in the attached
CD-ROM. All transcripts that were found to be down-regulated in the “baseline” vs. “experiment” were
collected as “decrease baseline” and are shown in table T4 that is contained in the attached CD-ROM. In
the “increase baseline” analysis 106 transcripts were found to be up-regulated and only 28 (24.5 %) were
detected to be differentially expressed in all four combinations (100 %). In the “decreased baseline” 180
transcripts were found to be down-regulated in unaffected sibs and 48 (26.6 %) were differentially
expressed in all four combinations (100 %).
A functional classification of the 286 transcripts detected to be regulated in SMA discordant sibs was
performed by collecting annotations and keywords from NettAffx website
(http://www.affymetrix.com/analysis/index.affx). The genes were categorized according to the biological
process (Fig. 9 A and D), molecular function (Fig. 9 B and E), or to the cellular component to which they
belong (Fig. 9 C and F). The most up-regulated transcripts in unaffected vs. affected SMA discordant sibs
were involved in cell-cycle control (10 %), signal transduction and transcription (each 11 %) (Fig. 9 A). The

RESULTS 110
Fig. 9 Percentage of the transcripts regulated in SMA discordant sibs serving a known molecular
function, participating in known biological processes and forming known pathways. Genes were
grouped according to their annotations as defined by NetAffx. In the case of very small group
sizes or of the hypothetical transcripts a new group was created termed “Other/unknown Genes”.
Percent of both up-regulated (A, B and C) and down-regulated (D, E and F) transcripts are
categorized according to biological process (A and D), molecular function (B and E) or to cellular
compartment (C and F). When a transcript was involved in more then one process/function it was
scored for each category. The inserts (pie charts) show that the majority of the transcripts were
included into summarized categories.

RESULTS 111
proteins encoded by the respective genes were found to bind either nucleotides (12 %) or/and other
proteins (16 %) (Fig. 9 B). The location for these proteins was found to be mostly in the nucleus (25 %)
(Fig. 9 C). The most down-regulated genes in unaffected sibs have an important role either in immune
response (17 %) or in signal transduction (20 %) (Fig. 9 D). The proteins bind DNA (9 %), nucleotides (9.9
%), receptors (11 %), metal ions (12 %) or other proteins (13.8 %) (Fig. 9 E).
Interestingly, in both data sets (up- or down-regulated transcripts), genes and functions related to nucleus,
plasma membrane and the membrane fraction represent about half of all regulated transcripts ( 39.35 %
in the up-regulated transcripts set and 49.37 % in the down-regulated transcripts set, respectively).
It is important to bear in mind that the observed differences in this study was found by analysis of the RNA
from lymphocytes rather than motor neurons, the cell type affected in SMA patients. Given the fact that it
is impossible to have this biological material, the EBV-transformed lymphoblastoid cell cultures were the
best options. In 2003, a study on EBV-transformed lymphoblastoid cell cultures belonging to 15 SMA
discordant families showed that the potential modifier acts in a tissue-specific manner (Helmken et al.
2003). The effect of the modifier was detected in lymphocytes but not in primary fibroblasts cells from
SMA discordant families. A potential finding of this study concerns a series of transcripts which are highly
differentially regulated in SMA modified phenotype, which may play a role in SMA and represent
candidates for as yet unidentified disease-protecting gene(s) and, maybe, unknown pathways for SMN.
5.2.2. Gene selection
Selection of relevant genes is a common task in most gene expression studies. The detection of the most
significantly differentially expressed genes has been a central research focus. It has been analyzed the
global expression of transcripts in the lymphoblastoid cells of SMA discordant individuals. Differentially
expressed genes potentially involved in the protection to develop SMA are summarized in table 24.
There were considered those RNAs that were more then 3 fold abundant/less abundant in the
asymptomatic than symptomatic sibs. Thus, from 28 transcripts found up-regulated in the “baseline
experiment” only 6 RNAs were called “Present”, “Increase” (see 4.9.19.6 Basic data interpretation) and
having a mean of the Signal Log Ratio of > 1.5 (value that corresponds to a 3 fold increase), fulfilling the
selection criteria for up-regulated genes. From 48 transcripts found down-regulated in “baseline
experiment”, 12 transcripts were called “Absent”, “Decrease” and having a mean of Signal Log Ration < -
1.5 (value that corresponds to a 3 fold decrease). By this study there were also detected various genes
whose expressions are affected in a different manner by the lack of SMN1 gene in SMA discordant sibs
(table 24).
Because we assumed that the modifier gene should be up-regulated in unaffected sibs (protecting in this
manner the SMN1-deleted individuals to develop SMA) the study was focused on the transcripts that have
been found to be up-regulated in unaffected (BW 330 and BW 331) compared with their affected sibs (BW
332 and BW 333).

RESULTS 112
Table 24 Expression changes in genes potentially involved in the regulation of SMA modified
phenotype. The gene candidates presented similar Signal Log Ratios for each comparison made
(for a more detailed overview see tables T3 and T4 that are contained in the attached CD-ROM).
Gene
symbol
Gene bank
number
Gene name Mean
of
Log
Ratio
Fold change
(Affymetrix)
Change
PLS3 NM_005032 Plastin 3 (T isoform) 5.23 39 Increase
NR1I3 AV699347 Nuclear receptor subfamily 1, group
I, member 3
4.8 29 Increase
CD24 NM_013230 Small cell lung carcinoma cluster 4
antigen
2.2 5 Increase
PLOD 2 NM_000935 Procollagen-lysine, 2-oxoglutarate,
5-deoxygenase (lysine hydroxylase)
1.78 3.5 Increase
TNFSF14 NM_003807 Tumor necrosis factor (ligand)
superfamily, member 14
1.6 3 Increase
SEPT 2 AL568374 Septin 2 1.6 3 Increase
IL1R2 U64094 Soluble type II interleukin-1 receptor -4.6 25.6 Decrease
DPYD NM_000110 Dihydropyrimidine dehydrogenase -4.2 19 Decrease
SYNJ2 AF318616 Synaptojanin 2 -3.6 12.8 Decrease
T-Star NM_006558 Sam68-like phosphotyrosine protein -3.5 12 Decrease
GPM6A D49958 Glycoprotein M6A -3 8 Decrease
GA733 NM_002353 Gastrointestinal tumor-associated
antigen GA7331-1 protein
-3 8 Decrease
APP NM_000484 Amyloid beta (A4) precursor protein -2.6 6.4 Decrease
D4S234 NM_014392 Neuron specific protein -2.4 5.6 Decrease
AICDA AB040431 Activation-induced cytidine
deaminase
-2.2 4.8 Decrease
CRE-
BPa
NM_004904 cAMP response element-binding
protein
-1.5 3 Decrease
CYP7B1 NM_004820 Cytochrome P450, subfamily VIIB
polypeptide 1
-2 4 Decrease
UNC13 NM_006377 Unc-13 homolog B (C.elegans) -2 4 Decrease

RESULTS 113
5.2.3. Confirmation of microarray data by semi-quantitative RT-PCR
The expression profile of total RNA isolated from EBV-transformed lymphoblastoid cell lines belonging to
one SMA discordant family revealed up-regulation of six candidate genes in asymptomatic individuals: T-
plastin (PLS3), SEPTIN 2, CD24, NR1I3, PLOD 2 and TNFSF14. Validation of microarray-based results
was achieved using semi-quantitative PCR analysis. The same batch of RNAs used in microarray analysis
isolated from the same SMA discordant family was employed and quantification revealed a good
correlation between the fold change obtained in microarray and RT-PCR only for T-plastin, NR1I3 and
CD24 transcripts (Fig. 10 A). The two techniques demonstrated a generally similar degree of differential
expression only in these three cases. This selection step excluded from our study the three candidates
(SEPTIN 2, TNSF14 and PLOD 2) that showed by RT-PCR no significant difference between unaffected
and affected individuals (Fig. 10 B). By this method only the transcripts found to be up-regulated above 5
fold in the microarray analysis were confirmed.
Fig. 10 Confirmation of the microarray-based results in SMA discordant family #482.
(A) RT-PCR analysis in one SMA discordant family #482 revealed up-regulation of three candidate
genes (T-plastin, NR1I3 and CD24) in unaffected vs. affected sibs. (B) Transcript levels of SEPTIN
2, TNFSF14 and PLOD 2 are not up-regulated in unaffected individuals compared with the affected
ones. HPRT and actin were used as internal genes to verify that equal amounts of RNA were
loaded. Family number is indicated at the top. Representative results are shown from multiple
separate experiments. U: unaffected sib; III: type III SMA.

RESULTS 114
5.2.4. Validation of microarray-based results in another four SMA discordant families
In order to prove that all three remaining selected transcripts are indeed good candidates as modifier
factors, their expression levels were compared in four additional SMA discordant families where
lymphoblastoid cell lines were available (Fig.11). Total RNA was isolated from EBV-transformed
lymphoblastoid cell cultures and by RT-PCR analysis only two transcripts (T-plastin and NR1I3) showed a
correlation between the transcript expression and the phenotype. It is not excluded that by this method an
increased level below 3 fold could not be detected because of the semi-quantitative PCR detection power.
Fig. 11 Expression analysis by RT-PCR of three candidate genes in four additional SMA discordant
families. (A) T-plastin gene was found expressed in three additional SMA discordant families. In
the family #800 no difference in expression between unaffected (U) vs. affected (III) sib was
observed. (B) NR1I3 gene showed a correlation of expression with the phenotype for two
additional SMA families (fam #34 and #167). In the other two families (#800 and #646) no difference
could be seen. (C) CD24 expression does not correlate with the phenotype. HPRT and actin gene
were used as loading control. Family numbers are indicated at the top. 100 bp: DNA ladder, U:
unaffected; III: type III SMA.
RESULTS 115
For T-plastin the same significant difference was found between affected and unaffected siblings in three
out of four SMA discordant families. In family #800, the two phenotypically different sibs showed equally
T-plastin expression (Fig. 11 A). Additionally, T-plastin was found in an unaffected SMN1-deleted mother
(Fig. 15 A) as compared to her affected son (data not shown). For the second selected transcript, NR1I3,
an up-regulation of the candidate was found in asymptomatic vs. symptomatic sibs in two other SMA
discordant families (#34 and #167) (Fig. 11 B). In the other two families (#800 and #646) no significant
difference was observed. Regarding the CD24 transcript, was differentially expressed, but no correlation
between phenotype and its expression was observed (Fig. 11 C). At this step another candidate (CD24)
was excluded as potential modifier in SMA model.
Further investigations of the possible involvement of the two remaining candidate genes (NR1I3 and T-
plastin) in SMA disease model were performed. The two most highly expressed genes in unaffected sibs
detected by microarray method were confirmed by RT-PCR to be differentially expressed in SMA
discordant sibs and therefore were analyzed by linking each gene to their chromosomal location and with
the help of databases: NetAffx (Affymetrix), Ensembl, USCS, NCBI.
5.2.5. Description of NR1I3 candidate
Nuclear receptor subfamily 1, group I, member 3 (NR1I3); MIM: 603881; 1q23.3. The constitutive
androstane receptor (CAR; NR1I3) is a nuclear hormone receptor that is predominantly expressed in the
liver (Baes et al. 1994; Wei et al. 2002). It has been implicated in the metabolism of xenobiotics and drugs
(Wang et al. 2004; Wei et al. 2000; Zhang et al. 2002), carcinogens (Xie et al. 2003), steroids (Xie et al.
2003), heme (Huang et al. 2003; Huang et al. 2004; Xie et al. 2003), bile acids (Guo et al. 2003; Saini et
al. 2004; Zhang et al. 2004), and thyroid hormone (Maglich et al. 2004). Furthermore, there is evidence
that CAR activity impinges on cholesterol homeostasis (Kocarek and Mercer-Haines 2002; Wang et al.
2003) and signalling pathways that control food consumption (Qatanani et al. 2004). In large part, the
effects that CAR exerts on these processes are dependent on the receptor's ability to modulate hepatic
gene expression (Maglich et al. 2002; Ueda et al. 2002). The battery of CAR target genes include
members of all three phases of xeno/endobiotic metabolism and clearance, such as certain cytochrome
P450, UDP-glucuronosyltransferase, sulfotransferase, glutathione transferase, aldehyde dehydrogenase,
and avidin-biotinylated enzyme complex transporter families (Maglich et al. 2002; Ueda et al. 2002). Thus
far, CAR response elements have been mapped in a number of the corresponding human genes, including
CYP2B6 (Sueyoshi et al. 1999; Wang and Negishi 2003), CYP3A4 (Goodwin et al. 2002), CYP3A5 (Burk
et al. 2004), CYP2C8 (Ferguson et al. 2005), CYP2C9 (Ferguson et al. 2002), CYP2C19 (Chen et al.
2003), UGT1A1 (Sugatani et al. 2001), MDR1 (Burk et al. 2005), and ALAS1 (Podvinec et al. 2004). NR1I3
is a nuclear receptor that acts as a specific, retinoid-independent activator. In the mouse, the constitutive
activity of this receptor, which they called CAR-beta (constitutive androstane receptor-beta), results from a
ligand-independent recruitment of transcriptional coactivators such as SRC1 (Forman et al. 1998). Zhang
and colleagues identified in 2002 the xenobiotic receptor CAR as a key regulator of acetaminophen

RESULTS 116
metabolism and hepato toxicity (Zhang et al. 2002). Known CAR activators as well as high doses of
acetaminophen induced expression of 3 acetaminophen-metabolizing enzymes in wildtype but not in
CAR-null mice, and the CAR-null mice were resistant to acetaminophen toxicity. Inhibition of CAR activity
by administration of the inverse agonist ligand androstanol 1 h after acetaminophen treatment blocked
hepatotoxicity in wildtype but not in CAR-null mice. The same group found that administration of
androstanol even 3 h after the toxic acetaminophen dose resulted in a 50 % protection in wildtype mice
(Zhang et al. 2002).
Most studies of CAR regulation have focused on mouse CAR. In mouse, CAR is localized cytosolically in
the absence of inducer, such as the prototypical inducer phenobarbital (Kawamoto et al. 1999; Zelko et al.
2001). Recent studies have identified a number of CAR interacting proteins that complex with the cytosolic
receptor, including two heat shock proteins that may function to anchor CAR to the cytoskeleton
(Kobayashi et al. 2003; Yoshinari et al. 2003). Upon exposure to an inducing agent, CAR is released from
this complex by a mechanism that probably involves protein phosphatase 2A, in turn accumulating in the
nucleus, where the receptor heterodimerizes with RXR and subsequently interacts with coregulators such
as SRC-1 (Makinen et al. 2002) to regulate target genes. It is currently unknown whether CAR activity is
governed similarly in human hepatocytes although the available evidence supports such a hypothesis
(Maglich et al. 2003; Pascussi et al. 2000). It is odd that most of the inducing agents that act through the
CAR signalling pathway do not interact directly with the receptor (Huang et al. 2004; Moore et al. 2000;
Zhang et al. 2002).
5.2.6. Description of T-plastin candidate
T-plastin (fimbrin); MIM: 300131; Xq23. T plastin is an actin binding protein broadly expressed with role
in actin filament organization. The actin cytoskeleton is involved in cell motility, cell-substrate interactions,
transport processes, cytokinesis, and the establishment and maintenance of cell morphology (Schmidt
and Hall 1998).
Of particular importance are the actin crosslinking proteins, which direct the formation of distinct F-actin
assemblies and integrate these actin complexes into overall cellular physiology through their
responsiveness to signals such as calcium fluxes and phosphorylation events (Matsudaira 1994). The
largest family of actin crosslinking proteins, which includes fimbrin, α-actinin and β-spectrin, is
characterized by the conserved ~250 amino acids F-actin binding domain (ABD) (Matsudaira 1991). The
fimbrins are unique among the ABD-containing crosslinking proteins, as they possess two tandem repeats
of the ABD within a single polypeptide chain (Wu et al. 2001). Due to the close proximity of the ABDs,
plastin directs the formation of tightly bundled F-actin assemblies that participate in dynamic processes,
including cytokinesis in yeast (Wu et al. 2001) and host cell invasion by enteropathic bacteria (Adam et al.
1995; Galan and Zhou 2000; Prevost et al. 1992). T-plastin posses an N-terminal headpiece that contains
two segments with homology to calcium binding EF-hands modules. The crooslinking activities of the
three human isoforms (T, L and I) are modulated by calcium, although in different manners depending on

RESULTS 117
the isoform and phosphorylation state (de Arruda et al. 1990; Namba et al. 1992). The two ABDs are
composed of two tandemly arranged 125 amino acids residues calponin homology (CH) domains. The
majority of the ABD-containing crosslinking proteins form non-covalent homodimers, resulting in bivalent
molecules that support the crosslinking of adjacent actin filaments (Fig. 12). The specific features of the
dimerization domains control the separation and relative orientation of the ABDs and thus function as a
critical determinant of the mechanical behaviour of the resulting F-actin networks (Matsudaira 1991).
Recently, it has been shown that ABP1 of T-plastin is not only involved in actin-bundling, but may also
control actin turnover, stabilization and assembly, independently of its bundling capacity (Giganti et al.
2005). Each CH domain is composed of four α-helical segments, in which three form a loose bundle of
helices, with the fourth α-helix perpendicular to the major bundle. These segments are connected by
extended and variable loops and sometimes two additional short helices. The complete crystal structure of
plastin has not yet been resolved, but the structure of the N-terminal actin-binding domain 1 (ABD1) of T-
plastin and the complete crosslinking core of Arabidopsis thaliana plastin and of Schizosaccharomyces
pombe plastin have been solved (Goldsmith et al. 1997; Klein et al. 2004). Additional methods, such as
electron microscopy, image analysis and homology modelling, have led to a general model of the plastin
structure and to a view of how this protein crosslinks actin filaments (Fig. 12).
Fig. 12 Domain organization of plastin isoforms from different species. A scale (in amino acids) is
drawn on top of the figure. Domains in blue have no or less functionality. ABD=actin-binding
domain. Note that each actin-binding domain consists of two CH domains. Human T- and L-plastin
contain an NES, but it is unknown if plastins from other species are also endowed with a similar
targeting signal (Delanote et al. 2005b).

RESULTS 118
The actin crosslinking core of plastin has a compact architecture (Klein et al. 2004), and the ABDs pack in
such a way that the CH1 domain and the CH4 domain make contact, involving conserved residues on the
molecular surface of the CH1–CH4 interface. Electron density in regions connecting the CH domains is
poorly defined, indicating that these segments are highly dynamic. The potential structural plasticity of
ABD1 by reorganization of the CH domains is also confirmed by other crystal structures of utrophin,
dystrophin, plectin and α-actinin (Garcia-Alvarez et al. 2003; Keep et al. 1999; Liu et al. 2004).
Using an actin affinity matrix to identify actin-binding proteins in the budding yeast Saccharomyces
cerevisiae, the Sac6 protein was identified, which localizes with cytoplasmic actin cables and cortical actin
patches (Drubin et al. 1988). Its actin regulatory role was confirmed when the gene encoding this protein
was found to suppress an actin mutation (Adams et al. 1989). Sac6p shows 43 % and 36 % identity with
chicken plastin and human plastin, respectively. Mutant budding yeast cells lacking this gene display
temperature sensitivity defects in growth, morphology, endocytosis and sporulation (Adams et al. 1991;
Kubler and Riezman 1993). Surprisingly, overexpression of Sac6p is lethal (Sandrock et al. 1999). This
could be explained by competition with an essential actin-binding protein, or by titrating out some other
essential factors for growth. Next to stabilizing actin filaments, yeast plastin also has a role in the
polymerization of G-actin (Cheng et al. 1999).
Adams and colleagues demonstrated a high degree of functional conservation between evolutionarily
divergent plastins (Adams et al. 1995). They demonstrated that human T- and L-plastin could both
substitute for yeast plastin in a Sac6 null mutant, and restore functional defects. However, the third
isoform, I-plastin, could not complement this temperature sensitive growth defect, illustrating the functional
differences between human isoforms. The fission yeast Schizosaccharomyces pombe also contains a
plastin homologue, called Fim1. It is not essential for viability but has a role in cell morphogenesis. In
mitotic cells, Fim1 plays a role in formation of the actin ring during cytokinesis (Nakano et al. 2001).
Dictyostelium discoideum plastin shows 48 %–50 % identity with human plastins, and localizes to cortical
structures associated with cell surface extensions (Prassler et al. 1997). In the ciliate Tetrahymena, plastin
is localized in the cleavage furrow bundle during cytokinesis of dividing cells (Watanabe et al. 1998). This
protein crosslinks actin filaments in a calcium-insensitive manner (Shirayama and Numata 2003;
Watanabe et al. 2000). Tetrahymena plastin has a higher affinity for actin than the other plastin forms
(Shirayama and Numata 2003). At least 3 plastin-like proteins may exist in the plant model system
Arabidopsis thaliana (Kovar et al. 2000; McCurdy and Kim 1998). The AtFim1 isoform contains an
additional 65 amino acids at its carboxy-terminal end, and is Ca2+ insensitive because of less conserved
Ca2+- binding domains. AtFim1 inhibits Zea mays profilin-induced actin depolymerization in vitro and in
vivo (Kovar et al. 2000). L-plastin is often used as a myeloid lineage protein marker in zebrafish (Danio
rerio) (Herbomel et al. 1999). Spatio-temporal expression of the L-plastin zebrafish homologue reveals a
high level of conservation between zebrafish and mammals. Thus zebrafish constitutes an informative
model system for the study of normal and anomalous human myelopoiesis (Bennett et al. 2001).
Generally, plastins are located in focal adhesions, ruffling membranes, lammellipodia, filopodia, or in
specialized surface structures with highly ordered microfilaments bundles such as microvilli and

RESULTS 119
stereocilia. Sometimes they co-localize with stress fibers. In vertebrates, plastin contributes to the
formation of specialized structures such as intestinal microvilli (Glenney et al. 1981; Mooseker 1983) and
auditory stereocilia (Hofer et al. 1997). T-plastin is associated with the actin core bundle of microspikes in
epithelial cells (Daudet and Lebart 2002) and was proposed to participate in the assembly of all these
structures mentionated above (Arpin et al. 1994). In mesenchymal cell, T-plastin localizes to focal
adhesion and the leading edge (Arpin et al. 1994), a broad lamellar membrane extension harbouring a
dynamic branched actin network (Svitkina and Borisy 1999). T-plastin causes the reorganization and
elongation of the actin structure by the WASP-Arp2/3 complex polymerization unit, and concomitantly
increases actin-based forced (Giganti et al. 2005). Several independent reports indicate that T-plastin is
involved in the cellular response to DNA-damaging agents and toxins. T-plastin expression is enhanced in
cisplatin-resistant human bladder, prostatic, head and neck cancer cell lines, in comparison to their
cisplatin-sensitive counterparts (Hisano et al. 1996). Cisplatin is an anticancer agent that acts by binding
to DNA and interfering with DNA repair. T-plastin mRNA was 12-fold more abundant in cisplatin-resistant
cells in comparison to parental cells (Hisano et al. 1996). Furthermore, T-plastin was also up-regulated in
UV radiation-resistant cells (Higuchi et al. 1998). Increased expression of T-plastin has been observed in
Chinese hamster ovary (CHO) cells in which G2 arrest has been induced by X-radiation and by
topoisomerase II inhibitor, etoposide (Sasaki et al. 2002). In contrast, when T-plastin expression was
down-regulated, radiation-induced G2 arrest decreased in CHO cells, indicating a correlation between T-
plastin expression and G2/M cell-cycle control (Sasaki et al. 2002). In an animal model of the auto-
immune disease, systemic lupus erythematosus (SLE, a chronic rheumatoid disease) and in human
patients, antibodies against T and L-plastin (a second plastin isoform expressed only in leukocytes) were
found in serum (Mine et al. 1998). The presence of T- and L-plastin antibodies was correlated with the
presence of the anti-Sm antibody, a typical SLE auto-antibody that recognizes a nuclear antigen. T-plastin
was also found to be involved in invasion by at least two enteropathic bacteria: Shigella flexneri and
Salmonlella typhimurium (Adam et al. 1995; Prevost et al. 1992; Zhou et al. 1999). These two bacteria
have different mechanisms for entering non-phagocytic cells by using specific effector proteins. In both
cases, T-plastin was involved in cytoskeletal rearrangements during bacterial invasion. These
rearrangements consist of distinct nucleation zones involving strong actin polymerization in close
proximity to the contact site between bacterium and cell. These structures then push cellular protrusions
during invasions of Sigella flexeri (Adam et al. 1995; Prevost et al. 1992). During Salmonella typhimurium
invasions, T-plastin is first recruited to membrane ruffles induced by bacterium via a Cdc42-dependent
signalling process that is activated by the bacterial effector protein, SopE. Then, another secreted
bacterial effector protein, SipA, forma a complex with T-plastin and F-actin, which results in a marked
increase in the actin-bundling activity of T-plastin. SipA also inhibits actin depolymerization. This leads to
stabilization of actin filaments at the point of bacterium-host cell contact, which leads to more efficient
Salmonella internalization (Zhou et al. 1999). Although T-plastin has a clear role in actin-bundling, there is
sometimes apparently incongruent information as to their exact actin-binding properties. Actin-bundling
activity by mammalian plastins has been clearly established, but there is additional evidence for actin
RESULTS 120
filament stabilization (Nakano et al. 2001) and for filament anti-depolymerization activities (Belmont and
Drubin 1998; Brower et al. 1995; Giganti et al. 2005; Lebart et al. 2004). In some organisms (yeast and
plants), there is even indication that plastins have actin polymerization ability (Cheng et al. 1999; Kovar et
al. 2000).
The actin cytoskeleton of eukaryotic cells a dynamic meshwork that is involved in many biological
phenomena such as cell motility, cell substrate adhesion, intracellular transport, endo- and exocytosis,
cytokinesis and cell morphology (Delanote et al. 2005b). Cell morphology and motility depend on the
remodelling of the cytoskeletal architecture and require locally restricted membrane protrusion and
invagination, driven by cycles of actin polymerization and depolymerization (Carlier et al. 2003a; Carlier et
al. 2003b; Pollard 2003; Pollard et al. 2000). L-plastin, was first noted as a polypeptide which appeared to
be induced accompanying tumorigenesis of human fibroblasts (Goldstein et al. 1985; Leavitt et al. 1982;
Leavitt and Kakunaga 1980). Constitutive expression of the L-plastin was found to be restricted to
replicative hematopoietic cells while constitutive expression of T-plastin appeared to be a property of other
replicative cells of solid tissues such as fibroblasts, endothelial cells and epithelial cells. However, many
different types of human tumor-derived cell lines (non-hematopoietic cell types) were found to synthesize
both L- and T-plastin together, suggesting that L-plastin gene was activated constitutively accompanying
tumorigenesis (de Arruda et al. 1990; Lin et al. 1988). These two human cell type-specific isoforms have
80 % amino acid identity (Lin et al. 1988). I-plastin was discovered as a polypeptide that is specifically
expressed in the small intestine, colon and kidney and is 86 % identical to the chicken fimbrin isoform (Lin
et al. 1993a; Lin et al. 1993b; Lin et al. 1994b). The three isoforms share 70 % homology in their amino
acid sequence but are encoded by three distinct genes on chromosomes 3 (I-plastin), 13 (L-plastin), and
X (T-plastin) (Lin et al. 1993a; Lin et al. 1993b; Lin et al. 1994b).
Overexpression of T- or L-plastin in a fibroblast-like cell line induced cell rounding and simultaneous actin
stress fiber rearrangements. In polarized epithelial cells, overexpression of T-plastin increased the length
and density of microvilli (Leavitt et al. 1982; Leavitt and Kakunaga 1980; Lin et al. 1993b).
T-plastin may serve as potential target for Rho proteins by mediating their remodelling role. RhoA and
Rac1 control the formation of the distinct actin-containing structures, stress fibers and membrane ruffles,
respectively (Ridley and Hall 1992a, b; Ridley et al. 1992). The involvement of T-plastin in the Rho
cascades provides a molecular basis for how Rho proteins regulate the formation of specialized actin-
containing structures such as filopodia or stress fiber (Dutartre et al. 1996). T-plastin protein was found to
be redistributed together with VASP in HtTA-1 cells overexpressing V12CDC42Hs into highly dynamic
membranes regions (Dutartre et al. 1996). CDC42Hs is one of the Rho protein subgroup and represents
the human homologue of the yeast Saccharomyces cerevisiae CDC42Sc (Shinjo et al. 1990). CDC42Sc
was originally identified as a cell cycle gene essential for proper bud orientation (Adams et al. 1990;
Johnson and Pringle 1990). V12CDC42Hs is a constitutively activated mutant with a glycine (position 12)
to valine substitution which exhibits decreased intrinsic GTPase activity (Hart et al. 1991). In human HeLa-
derived HtTA-1 cells, expression of V12CDC42Hs is driven by a tetracycline-repressible promoter and
may be induced upon removal of the antibiotic from the culture medium (Gossen and Bujard 1992). VASP

RESULTS 121
(vasodilatator-stimulated phosphoprotein) is a substrate for cAMP and cGMP-dependent protein kinases
(Reinhard et al. 1992). The observed redistribution of T-plastin in HtTA-1 cells expressing V12CDC42Hs
provides a link between the Rho protein and its regulatory function in remodelling the actin cytoskeleton.
CDC42Hs might either transduce a regulatory signal to plastin, or might direct the assembly of docking
sites for plastin and thereby might determine the sites where plastin will be recruited and will generate
actin bundle (Dutartre et al. 1996).
T-plastin interacts also with ataxin-2 (ATX2) in mouse brain (Ralser et al. 2005b). It has been proposed
that ATX2 might function in RNA metabolism (Shibata et al. 2000). In addition, ATX2 interacts with the
cytoplasmic poly(A)-binding protein (PABP) (Ralser et al. 2005a) that functions in translation initiation and
mRNA decay regulation and forms part of the so-called stress granules (Kedersha and Anderson 2002;
Kedersha et al. 2000). The interaction of T-plastin with ATX2 links this protein to RNA metabolism
pathway and/or function in translation.
Taken together, T-plastin protein was found an ideal candidate for our study. Further investigations into
the cellular role of T-plastin were required to explore and elucidate its function in related pathways with
SMN protein. Another reason for taking this gene differentially expressed in SMA discordant families was
the hope to discover additional molecular mechanisms that might mediate or contribute to the protection of
some individuals to develop SMA.
5.3. T-plastin, a potential gene modifier in SMA discordant families
T-plastin gene, identified from the microarray analysis was a very interesting gene, since it is located on
chromosome X. This correlates with the observation that in almost all SMA discordant families mainly the
females are protected to develop SMA despite lacking SMN1 gene (see Fig. 1 in appendix). Besides, the
remaining candidate gene was chosen because of its expression pattern and potential connection with
SMA (see below). T-plastin gene was found to be significantly higher expressed in asymptomatic sibs,
revealing 39-fold increase in comparison with symptomatic ones (see 4.9.19.6. Basic data interpretation).
5.3.1. T-plastin and SMN transcripts are expressed at high level in spinal cord and
muscles
To test T-plastin expression in different tissues, two biological samples were selected: first, one SMA fetus
in order to check the T-plastin expression during development in SMA model; second, RNA isolated from
one control, adult individual purchased from ClonTech. The RNA samples were used in RT-PCR reactions
using T-plastin and SMN primers listed in table 6. As internal control, HPRT gene was co-amplified. In
both SMA fetus and adult control, T-plastin was found to be expressed at high levels in spinal cord and
muscles pointing out a very important involvement of T-plastin in these tissues (Fig. 13). As expected the
SMN expression level in the SMA fetus was reduced in spinal cord. This data confirm the previously
published results of Lefebvre et al. in 1997 and Burlet et al. in 1998. Importantly, low levels of SMN do not

RESULTS 122
induce low level of T-plastin. In the same manner, SMN was found to be expressed at high levels in spinal
cord of control samples.
It has been previously reported that the relative amount of SMN transcript in normal human fetal tissues
was higher in kidney and brain and similar in skeletal muscle, heart and thymus of 16-week-old fetuses.
Fig. 13 (A) Semi-quantitative RT-PCR of T-plastin relative to HPRT in muscle (lane1), spinal cord
(lane 2) and brain (lane 3) from a SMA fetus. T-plastin is highly expressed in spinal cord as
compared to SMN in the SMA fetus. The diagrammatic representation shows the T-plastin and
SMN expression relative to HPRT; mean values ± S.D. (n=3) are given. (B) T-plastin and SMN are
expressed at high levels in spinal cord and muscle in adult, healthy control sample.
The amount of SMN protein in skeletal muscle, heart, brain and kidney was higher during fetal life than in
postnatal period, as compared with actin and β-tubulin protein levels (Burlet et al. 1998). The SMN protein
level was markedly deficient in fetal muscle tissues from all three forms of SMA, being more reduced in
severe than milder forms, as compared with age-matched controls (Burlet et al. 1998). Nerve impulses,
which travel from the brain, along the spinal cord and onto motor neurons, control the muscle movements.
The neurons affected in SMA are the lower motor neurons. These neurons are found in a specific part of
the spinal cord, whereas the upper motor neurons reside in the brain. This means that the brain is not

RESULTS 123
affected. The accumulation of SMN in growth cones and NMJs during neuronal differentiation and
neuromuscular maturation suggests that cytoplasmic SMN may possess a neuronal- and muscle-specific
function (Fan and Simard 2002). Given the fact that T-plastin is highly expressed in both spinal cord and
muscle in normal tissues, it points out a high implication of this gene in the structure and specific
functions, very possible at NMJs level.
5.3.2. Characterization of T-plastin antibody
A polyclonal antibody was raised against human T-plastin by immunization of two New Zealand rabbits
with a synthetic peptide (H2N-MATTQISKDELDELKC-CONH2) corresponding to the N-terminus of the
protein (see Methods). Since human and murine T-plastin bear 100 % identical epitope sequence, this
antibody is useful for recognizing both human and murine proteins. The specificity of the T-plastin
antibody was demonstrated by Elisa and preabsorbtion assays (Eurogentec) and subsequently confirmed
by Western blot analysis. To detect endogenous T-plastin, 10 µg of total protein extract from cell lysates of
human HEK293, primary fibroblasts, EBV-transformed lymphoblastoid cell lines and rat PC12 cells were
resolved by 12% SDS-PAGE gels and electrophoretically transferred to nitrocellulose membranes
overnight.
Fig. 14 Verification of the specificity of the polyclonal antibody against T-plastin. (A) Proteins were
extracted from HEK293 cells (lane 1), rat PC12 cells (lane 2), human fibroblast cell lines (lane 3 and
4) and EBV transformed lymphoblastoid cell lines (lane 5, expressing T-plastin and lane 6 not
expressing T-plastin). The anti-T-plastin antibody recognized T-plastin at 68 kDa. (B) A
recombinant T-plastin-V5 protein was obtained by use of the TnT system (Promega). The T-plastin
protein was detected either by using the unpurified anti-T-plastin serum (left) or the anti-V5 tag
antibody (right). As negative control a TnT negative reaction without adding plasmid DNA (TnT-)
was performed in the same conditions. The unspecific bands were detected by comparison with
the TnT negative reaction. The size of the protein ladder is specified on the left side of the figure.
TnT+: TnT reaction with DNA plasmid added.

RESULTS 124
The optimal conditions for Western blot were determined at 1:5,000 dilution in 2 % Milk-TBS Tween
solution with 3 h incubation at 4oC. On the Western blot of whole cell lysate of HEK293 cell, PC12 cells,
primary fibroblasts, and EBV-transformed lymphoblastoid cells, the antibody recognized corresponding to
the predicted 68 kDa T-plastin band (Fig. 14 A). Additionally, the T-plastin antibody was checked for the
specificity using Western blot against recombinant T-plastin protein produced by the TnT system
(Promega). A plasmid encoding human T-plastin V5-tagged was used for the in vitro
transcription/translation reaction and 2 µl of TnT reaction mix resolved on 12 % SDS-PAGE gel. The blots
were probed either with an anti-V5 tag antibody or with the polyclonal antibody against T-plastin. Both
antibodies recognized specifically the T-plastin band around 70 kDa (Fig. 14 B).
5.3.3. T-plastin is expressed in both EBV-transformed lymphoblastoid cells and native
blood belonging to unaffected SMN1-deleted sibs
Unlike the L and I isoforms, which are expressed in a limited number of cell types, T-plastin is expressed
in a wide variety of tissues, including the epithelium, endothelium, fibroblasts, muscles and brain (Lin et al.
1994). In this respect, T-plastin actually resembles a housekeeping gene, except that its expression is
uniquely excluded from all leukocytes (Lin et al. 1999). To prevent the T-plastin gene to be expressed,
leukocytes are endowed with a specific suppressing factor or are devoid of a T-plastin gene-specific
activating factor. In either case, this type of gene regulation must be unique, because no other gene has
such a sharply contrasted expression pattern divided between leukocytes and non-leukocytes. Thus, a
systematic analysis of the mechanisms governing T-plastin gene expression should provide an
opportunity to identify novel regulatory gene sequences and transcription factors. To exclude that the T-
plastin expression in EBV-transformed lymphoblastoid cell lines was not induced by the EBV
transformation, the T-plastin expression was also analyzed in native blood. To determine and whether the
difference between the unaffected and affected sibs can be demonstrated directly from unfractionated
whole blood, RT-PCR and Western blot analyses were performed on the total RNA/proteins isolated from
peripheral blood from one unaffected SMN1-deleted individual (#783) that showed T-plastin expression in
the EBV-transformed lymphoblastoid cells (EBV T36/91).
The total RNA was subjected to multiplex PCR reaction using as internal control HPRT gene (Fig. 15 A).
The total protein lysates extracted from both EBV-transformed lymphoblastoid cells and fresh blood were
loaded onto a 12% SDS-PAGE gel and analyzed by Western blot with antibodies against T-plastin. As
shown in Fig. 15 B, T-plastin protein can be readily detected from the whole blood.
The RNA and protein data on cells isolated from fresh blood demonstrated that T-plastin expression is not
restricted to solid tissues and is expressed among the hematopietic cell types in unaffected sibs belonging
to SMA discordant families. In the same time it has been excluded any activation mechanism during the
EBV transformation. The significance of T-plastin protein in hematopietic cells in unaffected, healthy sibs
remains to be determined and points out to an unique mechanism that might activate T-plastin gene in
leukocytes. This mechanism behind T-plastin activation in fresh blood in unaffected sibs is unknown and

RESULTS 125
requires further investigations.
A.
T-plastin
HPRT
B.
100
bp
1 2
Nat
ive
blo
od
EB
V T
36/9
1
783
75 kDa
50 kDa
T-plastin
β-tubulin
A.
T-plastin
HPRT
T-plastin
HPRT
B.
100
bp
1 2
Nat
ive
blo
od
EB
V T
36/9
1
783
75 kDa
50 kDa
T-plastin
β-tubulin
Fig. 15 Confirmation of T-plastin expression in both lymphoblastoid cell culture and peripheral
fresh blood in one asymptomatic sib homozygous deleted for SMN1 gene. (A) RT-PCR analysis of
one unaffected mother carrying a homozygous deletion of SMN1, who showed the same
expression in EBV transformed cell lines and native blood, excluding an activation of T-plastin due
to EBV transformation. 100bp: DNA ladder. (B) Western blot analysis revealed that T-plastin is
translated in both analyzed tissues. β-tubulin was used as loading control. The size of the protein
ladder is specified on the left side of the figure.
5.3.4. T-plastin is expressed in 6.5 % in the control population
T-plastin is normally absent in hematological cell types but widely distributed at various levels in other
tissue types and nonhematopoietic malignancies (Lin et al. 1993b). Among all tissues/cells surveyed, T-
plastin was shown to be absent from all hematopoietic cell types or whole blood studied and from
malignant B-cell and T-cell lines studied (Lin et al. 1999).
Detection of T-plastin expression at both RNA and protein level in unaffected individuals that carry
homozygous SMN1 deletion revealed that T-plastin expression might be a rare event that happen in
human population. This observation supports the idea that T-plastin expression is not restricted only to
solid tissues. Whether the correlation of T-plastin expression in SMA discordant families with the
phenotype is highly significant is going to be calculated. All unaffected SMN1-deleted sibs expressed T-
plastin in EBV-transformed lymphoblastoid cells. To test whether the expression pattern is unique for SMA
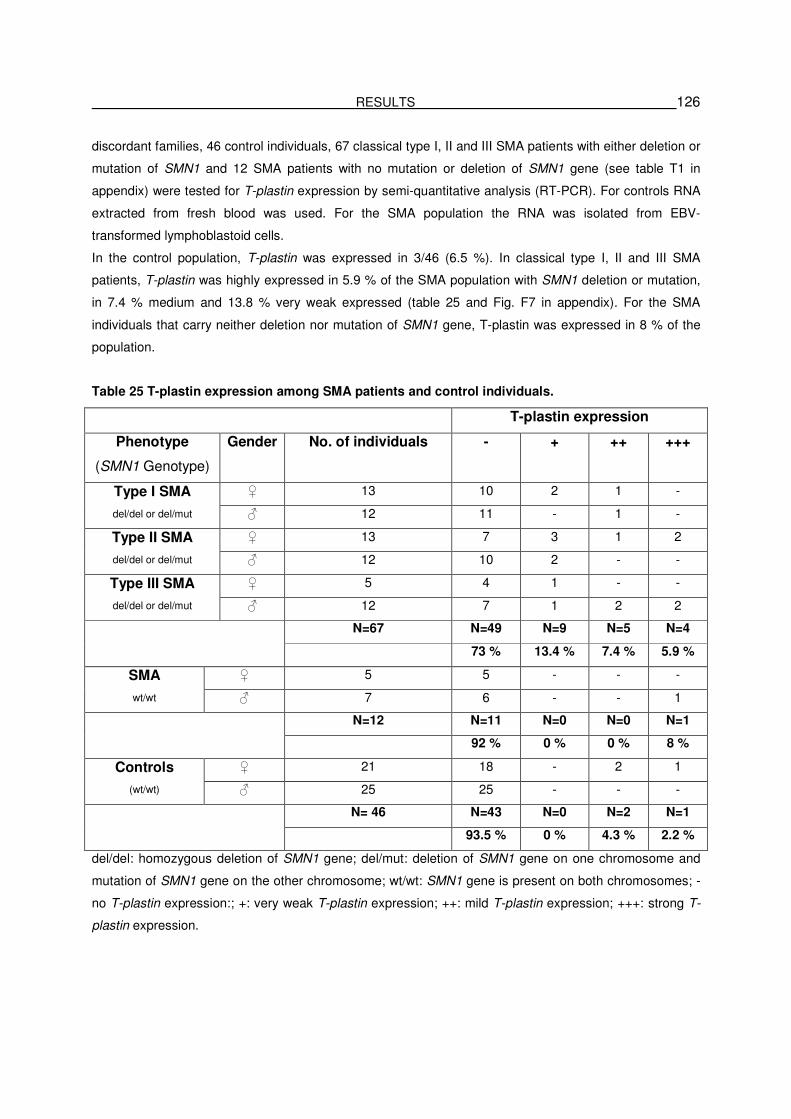
RESULTS 126
discordant families, 46 control individuals, 67 classical type I, II and III SMA patients with either deletion or
mutation of SMN1 and 12 SMA patients with no mutation or deletion of SMN1 gene (see table T1 in
appendix) were tested for T-plastin expression by semi-quantitative analysis (RT-PCR). For controls RNA
extracted from fresh blood was used. For the SMA population the RNA was isolated from EBV-
transformed lymphoblastoid cells.
In the control population, T-plastin was expressed in 3/46 (6.5 %). In classical type I, II and III SMA
patients, T-plastin was highly expressed in 5.9 % of the SMA population with SMN1 deletion or mutation,
in 7.4 % medium and 13.8 % very weak expressed (table 25 and Fig. F7 in appendix). For the SMA
individuals that carry neither deletion nor mutation of SMN1 gene, T-plastin was expressed in 8 % of the
population.
Table 25 T-plastin expression among SMA patients and control individuals.
del/del: homozygous deletion of SMN1 gene; del/mut: deletion of SMN1 gene on one chromosome and
mutation of SMN1 gene on the other chromosome; wt/wt: SMN1 gene is present on both chromosomes; -
no T-plastin expression:; +: very weak T-plastin expression; ++: mild T-plastin expression; +++: strong T-
plastin expression.
T-plastin expression
Phenotype
(SMN1 Genotype)
Gender No. of individuals - + ++ +++
♀ 13 10 2 1 - Type I SMA
del/del or del/mut ♂ 12 11 - 1 -
♀ 13 7 3 1 2 Type II SMA
del/del or del/mut ♂ 12 10 2 - -
♀ 5 4 1 - - Type III SMA
del/del or del/mut ♂ 12 7 1 2 2
N=67 N=49 N=9 N=5 N=4
73 % 13.4 % 7.4 % 5.9 %
♀ 5 5 - - - SMA
wt/wt ♂ 7 6 - - 1
N=12 N=11 N=0 N=0 N=1
92 % 0 % 0 % 8 %
♀ 21 18 - 2 1 Controls
(wt/wt) ♂ 25 25 - - -
N= 46 N=43 N=0 N=2 N=1
93.5 % 0 % 4.3 % 2.2 %

RESULTS 127
This expression pattern is unexpected since no expression of this gene was observed in the lymphocyte
cells so far in the control population. This study revealed for the first time the evidence that T-plastin
expression in fresh blood is a rare event that occurs in 6.5 % of the control population. Moreover, the
expression of T-plastin itself in leukocytes is not enough to protect the individuals to develop SMA.
Additional factors that modulate T-plastin expression function or localization may be important.
This result explains, at least in part, the case of family #800 where both unaffected and affected sibs
express T-plastin, but one is protected to develop SMA. The LN 421 individual resembles the case of the
classical SMA patients that express T-plastin by an unidentified mechanism, but this is not the complete
background to drive to a protected phenotype. Like in complex diseases, a certain genotype can protect or
predispose for a certain phenotype but not exclusively. To find out whether this is the case, an analysis of
the haplotype blocks in T-plastin genomic region of individuals divided in “expression” vs. “non-
expression” groups was carried out (see 5.3.8.3 Haplotype analysis of the T-plastin genomic region
reveals a trans-acting mechanism to regulate T-plastin its expression).
5.3.5. Validation of the significant difference of T-plastin expression between unaffected
and affected sibs at protein level
To determine whether the T-plastin transcripts were associated with protein expression, Western blot
analysis was performed using the polyclonal antibody against T-plastin. From five SMA discordant
families, proteins from EBV-transformed lymphoblastoid cells and primary fibroblasts cultures from one
SMA discordant family were analyzed by Western blot analysis. All blots were first probed with anti-β-
tubulin antibody to ensure that equal amount of proteins were loaded on the SDS-PAGE gel for each
family. Afterwards the same blots were reprobed and analyzed for the expression level of T-plastin.
Similar to the findings from RT-PCR, the affected sibs did not express T-plastin protein, but the protein
was expressed in unaffected sibs (Fig. 16 A). In contrast, in lysates extracted from primary fibroblasts
cultures, no protein expression differences could be observed (Fig. 16 B).
In 2003 it has been also demonstrated by Helmken and colleagues that the modulating effects of a
modifying factor is likely to be tissues-specific, because only in protein samples derived from
lymphoblastoid cell lines, but not primary fibroblasts, a difference in SMN and SMN-interacting partners
levels was observed (Helmken et al. 2003). In the same way, these results support the idea that the
modulating effects of T-plastin are tissue-specific.
5.3.7. Functional analysis of T-plastin protein
5.3.7.1. SMN and T-plastin associate together in vivo, but do not interact directly
It has been described that SMN interacts with cytoskeletal protein profilin IIa in vivo (Sharma et al. 2005).
To find the relevance of the interplay between T-plastin and SMN protein in a related pathway, it has been
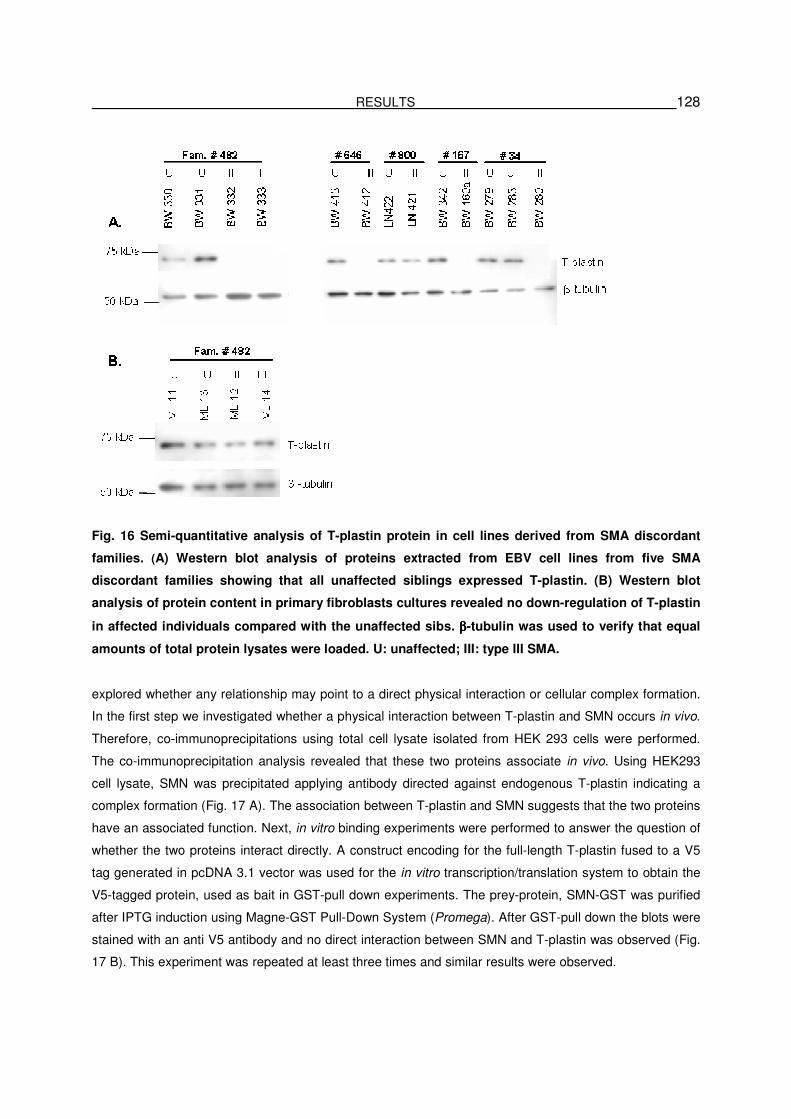
RESULTS 128
Fig. 16 Semi-quantitative analysis of T-plastin protein in cell lines derived from SMA discordant
families. (A) Western blot analysis of proteins extracted from EBV cell lines from five SMA
discordant families showing that all unaffected siblings expressed T-plastin. (B) Western blot
analysis of protein content in primary fibroblasts cultures revealed no down-regulation of T-plastin
in affected individuals compared with the unaffected sibs. ββββ-tubulin was used to verify that equal
amounts of total protein lysates were loaded. U: unaffected; III: type III SMA.
explored whether any relationship may point to a direct physical interaction or cellular complex formation.
In the first step we investigated whether a physical interaction between T-plastin and SMN occurs in vivo.
Therefore, co-immunoprecipitations using total cell lysate isolated from HEK 293 cells were performed.
The co-immunoprecipitation analysis revealed that these two proteins associate in vivo. Using HEK293
cell lysate, SMN was precipitated applying antibody directed against endogenous T-plastin indicating a
complex formation (Fig. 17 A). The association between T-plastin and SMN suggests that the two proteins
have an associated function. Next, in vitro binding experiments were performed to answer the question of
whether the two proteins interact directly. A construct encoding for the full-length T-plastin fused to a V5
tag generated in pcDNA 3.1 vector was used for the in vitro transcription/translation system to obtain the
V5-tagged protein, used as bait in GST-pull down experiments. The prey-protein, SMN-GST was purified
after IPTG induction using Magne-GST Pull-Down System (Promega). After GST-pull down the blots were
stained with an anti V5 antibody and no direct interaction between SMN and T-plastin was observed (Fig.
17 B). This experiment was repeated at least three times and similar results were observed.

RESULTS 129
Fig. 17 T-plastin associates with SMN. (A) T-plastin and SMN associates in vivo as shown by co-
immunoprecipitation. Western blot analysis of HEK293 cell lysates incubated with polyclonal anti-
T-plastin antibody bound to protein G-Sepharose for IP reaction and stained with monoclonal anti-
SMN antibodies on Western blot. The T-plastin protein precipitated endogenous SMN protein (lane
3). In the negative control (lane 2) protein G-beads carrying T-plastin antibody in IP buffer were
used (lane 1: total protein extract isolated from HEK293 cells was loaded to serve as positive
control for SMN protein). (B) SMN and T-plastin do not interact directly with each other. Full-length
T-plastin-V5 protein produced by the TnT system (Promega) and GST-fused SMN were subjected
to pull down reaction using MagneGST Pull-Down System (Promega). For Western blot analysis an
anti-V5 antibody was used to detect the recombinant T-plastin protein. Lane 1: positive control for
T-plastin-V5; lane 2: the TnT reaction with no plasmid DNA added; lane 3: the SMN-GST protein
precipitated no T-plastin protein; lane 4: C4, supernatant saved after capture; lane 5: IP negative:
immunoprecipitation using the TnT negative reaction.
Taken together, these observations suggest that T-plastin and SMN are part of the same complex, but
another protein represents the link that brings together the two proteins. The protein content of the T-
plastin-SMN complex is unknown and requires further investigations.

RESULTS 130
5.3.7.2. Endogenous SMN co-localizes with V5-tagged T-plastin in the perinuclear area of HEK293
cells
In mammalian COS cells, T-plastin-GFP localized preferentially to membrane ruffles, lamellopodium
protrusions, and adhesion sites (Timmers et al. 2002), which broadly corresponds to the reported
distribution of T-plastin in various animal cell types observed after immunostaining (Dutartre et al. 1996;
Prassler et al. 1997).
Because all plastin isoforms regulate the actin cytoskeleton, they have always been considered as
cytoplasmic proteins. Very recently, it has been reported that endogenous as well overexpressed T-plastin
was able to shuttle between nucleus and cytoplasm in HeLa and Jurkat cells (Delanote et al. 2005a). It
has been identified a strong leucin-rich nuclear export signal (NES) in T-plastin.
The SMN protein is found in the cytoplasm and nucleus (Battaglia et al. 1997; Lefebvre et al. 1997). In the
nucleus of most cells, SMN is concentrated in structures termed gems, which often co-localize with coiled
bodies (Liu and Dreyfuss 1996).
Fig. 19 Co-localization of the endogenous SMN and T-plastin-V5 in the perinuclear area of HEK293
cells. Double staining of T-plastin-V5 with anti-V5 antibody conjugated with AlexaFluor 568 (red)
and of SMN with anti-SMN-FITC antibody (green) showed co-localization of both proteins mainly in
the perinuclear area of transfected cells. White arrows indicate gems.

RESULTS 131
To study the expression of T-plastin in mammalian cells, transfected HEK293 with 1 µg of plasmid
encoding for the full-length-V5 tagged T-plastin cells were analyzed for the presence of recombinant T-
plastin protein and endogenous SMN by indirect immunofluorescence staining using a monoclonal
antibody against SMN directly labelled with FITC and a monoclonal antibody directed against V5 tag to
detect the recombinant T-plastin protein.
T-plastin was located in the cytoplasm, mainly in a perinuclear distribution, while SMN localized in both
cytoplasm (in a diffused manner) (Fig. 18) and nucleus (as gems, indicated with white arrows in Fig. 18).
The co-localization in the perinuclear area of the two proteins supports the idea that cytoplasmic
complexes comprising SMN and T-plastin are formed in mammalian cells.
5.3.7.3. T-plastin and SMN levels increase under NGF stimulation in PC12 cells.
PC12 cells were used as a model system to test the expression of T-plastin during neurite outgrowth, a
hallmark of neuronal differentiation. PC12 cells are rat phaeochromocytoma cells of sympathoadrenal
origin and represent a useful model for the analysis of neuronal differentiation (Greene and Tischler
1976). Treatment of undifferentiated PC12 cells with nerve growth factor (NGF) drives differentiation into a
sympathetic neuronal phenotype and outgrowth of neurites.
The effects of neuronal differentiation under NGF treatment in PC12 cells were analyzed for the
expression of both T-plastin and SMN. PC12 cells were grown on collagen-coated culture dishes and
stimulated with NGF for one, two and three days, respectively. The whole cell lysates were applied on 12
% SDS-PAGE gel and Western blots were first probed with an antibody against β-tubulin to ensure that
equal amounts of protein were loaded. The same blots were reprobed with an anti-SMN antibody and a
polyclonal anti-T-plastin antibody. At least three independent experiments were analyzed by Western blot
and subsequently densitometrically evaluated. The housekeeping gene, β-tubulin used as loading control
did not display changes of expression levels (Fig. 19). It has been already demonstrated that NGF
treatment of PC12 cells does not change the levels of β-actin and β-tubulin (Yu and Rasenick 2006).
Both, T-plastin and SMN proteins became up-regulated upon stimulation of cells with NGF for 24, 48 and
72 h, respectively, as shown in Fig. 19. An increase of SMN protein levels in PC12 cells has been
reported previously as a consequence of neuronal differentiation (van Bergeijk et al. 2007). SMN was also
found up-regulated during neuritogenesis in PC12-derived, dexamethasone-inducible UR16 cell line
(Navascues et al. 2004). The UR16 cell line has been created by Guerrero et al. (1988) and is a stable
PC12 subline that contains a mouse N-ras gene driven by dexamethasone-inducible promoter (Guerrero
et al. 1988). Quantitative immunoblotting analysis revealed that SMN levels are up-regulated to similar
extents in both the nucleus and cytoplasm (Navascues et al. 2004). Dynamic regulation of the actin
network, particularly at the growth cone, is an important element of neuronal differentiation and plasticity.
An up-regulation of transcripts encoding proteins in actin gelation, actin depolymerization, formation and
organization of actin filaments, linkage of signaling pathways to F-actin reorganization and alteration of
actin organization in dendrites and growth cone was already shown (Angelastro et al. 2000). The diversity

RESULTS 132
of the roles of these proteins underscores the complexity of the mechanisms by which NGF regulates
actin function and points to several new candidates that might mediate NGF-promoted synaptic plasticity.
Fig. 19 Expression of T-plastin and SMN proteins during neuronal differentiation of PC12 cells. (A)
PC12 cells were grown on collagen coated dishes and treated with 100 ng/ml nerve growth factor
(NGF) for 24, 48 and 72h, respectively, or non-treated (mock, lane 1) and harvested after the
indicated times. Equal amounts of total cell lysates were analyzed by Western blot analysis with
antibodies against β-tubulin (control). The Western blot analysis showed that T-plastin and SMN
level increased after 24 h under NGF stimulation and remains at high level during neurite
outgrowth. (B) Protein levels were quantified by densitometry, normalized against β-tubulin and
statistically analyzed by t-test. Data show mean values ± SD of three independent experiments.
*p<0.005; **p<0.001.
Tau protein is classically defined as a microtubule-associated protein that plays an important role in
promotion and stabilization of axonal microtubules (Hashiguchi et al. 2000; Maas et al. 2000). Interaction
between tau and actin is dependent on NGF treatment (Yu and Rasenick 2006). Endogenous tau
expression is low in PC12 cells without NGF treatment, and increases after NGF stimulation (Drubin et al.
1985). In the same manner, T-plastin protein levels that associate with SMN and/or actin may increase
under NGF stimulation in differentiating PC12 cells.
T-plastin was significantly up-regulated in PC12 cells during neuronal differentiation within three days of
continuous NGF induction. It has been shown previously that Gemin 2 and SmB, two binding partners of
SMN, did not display changes of expression levels during differentiation of PC12 cells (van Bergeijk et al.
2007). The same group showed that PRMT5 (the protein that adds methyl groups at Sm proteins arginine-
rich motifs) like the other components of the SMN complex, was not altered during differentiation of PC12

RESULTS 133
cells. Interestingly, during the course of neuronal differentiation coilin levels decreased, indicating a
putative concomitant change in Cajal body number and structure (van Bergeijk et al. 2007). It has been
shown that SMN and Gemin, as well as SMN and Sm proteins containing particles do not co-localize in
living neurons (Zhang et al. 2006).
These results demonstrate that SMN is not co-regulated with other components of the SMN complex and
the methylosome during differentiation of PC12 cells, suggesting an independent role of this protein. The
presence of SMN and T-plastin in one and the same complex may point toward diverse types of SMN
complexes that have functions in neurons, other than its well characterized role to assemble snRNPs in all
cells.
5.3.7.4. The affinity of T-plastin for SMN increases during neurite outgrowth
To further establish T-plastin-SMN association, co-immunoprecipitation experiments were carried out in
NGF differentiated PC12 cells. Protein extracts of PC12 cells isolated at different NGF stimulation time
points were analyzed by immunoprecipitation experiments using antibodies against T-plastin for IP and
against SMN and β-actin for Western blot. In Fig. 20 it is shown that when PC12 cells were exposed to
NGF for 36 h, the interaction of T-plastin with SMN increased up to 20 % (Fig. 20 A and B), while, the
interaction of T-plastin with β-actin was not changed. NGF treatment did not alter the amount of β-actin or
tubulin (as shown above).
It was also been found that the interaction between T-plastin and SMN occurred after 8 h of NGF
treatment, increased under a long-term (36-72 h) NGF stimulation. The increase was significant (p<0.002)
(Fig. 20 B) and after 72 h NGF treatment the affinity of T-plastin for SMN increased up to 50 %. These
studies suggest that NGF stimulation of PC12 cells might induce the reorganization of SMN and promote
T-plastin interaction with SMN during neurite differentiation.
The protein-protein-interactions in a certain complex could be permanent or transient. Transient
complexes associate and disassociate in vivo according to the environment or to the presence of external
factors and involve proteins that also exist as independent entities (Nooren and Thornton 2003a, b) In
contrast a permanent interaction is usually very stable (Nooren and Thornton 2003a).
The T-plastin protein associates permanent with SMN (Fig. 17 A) but, interestingly, under NGF stimulation
a transient complex occurs suggesting that during neuronal differentiation, a signal might trigger SMN to
T-plastin (or T-plastin to SMN) and together contribute to a specific function during this biological process.
SMN protein was shown already to be involved in more than one multiprotein complex (Gubitz et al. 2004;
Monani 2005; Rossoll et al. 2003; Yong et al. 2004; Zhang et al. 2006). The formation of a complex
between T-plastin and SMN might play a central role during PC12 differentiation and is important to find
the reason for the high specificity of T-plastin for SMN in this biological process.

RESULTS 134
Fig. 20 Analysis of in vivo interaction between T-plastin and SMN, and between T-plastin and β-
actin during neurite differentiation. (A) PC12 cells stimulated with 100 ng/ml NGF for 8, 36, 48, 60
and 72 h were used for immunoprecipitation experiments using anti-T-plastin antibody. Western
blot analyses showed that T-plastin precipitated both SMN and β-actin with different affinities.
Equal loading was verified with anti-ββββ-tubulin antibody. (B) The diagrammatic representation
shows the quantitative analysis of T-plastin association with SMN, and β-actin during neurite
outgrowth. Only the affinity between T-plastin and SMN was significantly increased but not of T-
plastin to β-actin. Data shown represent the mean ± SD of three independent immunoprecipitates
(**p<0.002).
5.3.7.5. Endogenous T-plastin and SMN co-localize along neurites and at the growth cone level in
PC12 cells-derived neurons
In general, the members of the plastin family have been identified in cellular regions with a high actin
filament turnover. The plastin homologue fimbrin forms actin filament bundles in vitro and in vivo oriented
with the same polarity (Coluccio and Bretscher 1989; Matsudaira et al. 1983). The relevance of T-plastin
protein expression in unaffected sibs was further analyzed using PC12 cell-derived neurons using
confocal immunofluorescence microscopy.
Differentiated PC12 cells were analyzed for the presence of T-plastin protein by indirect
immunofluorescence staining using the polyclonal antibody against T-plastin. After two and three days of
NGF treatment, neuronal- and glial-like cells appeared. We detected diffuse T-plastin staining within the
cytoplasm and, interestingly T-plastin protein accumulated in growth cone-like structures and varicosities
of neuronal-like cells during the formation of neurite processes (Fig. 21 A).

RESULTS 135
SMN accumulates in growth cone-like structures during neuronal differentiation, making SMN a new
marker of growth cones (Fan and Simard 2002). Given the abundance of actin in neurites and growth
cones, the distribution of T-plastin and actin was assessed by superimposing images of T-plastin
conjugated with AlexaFluor 488 with AlexaFluor 568 phalloidin staining- the later binding F-actin. After 24
h NGF treatment, T-plastin co-localizes with F-actin within the cytoplasm under the membrane cortex and
at growth cone levels (Fig. 21 B).
The redistribution and accumulation of cytoplasmic SMN at the periphery of the cell body and in growth
cone-and filopodia like structures in both neuronal- and glial-like cells has already been shown (Fan and
Simard 2002). Subcellular localization in growth cones was confirmed by demonstrating the presence of
GAP43, a protein involved in neurite outgrowth (Aigner and Caroni 1995) along the neurite processes and
localization of both SMN and GAP43 within growth cones.
Profilin IIa, a motor neuron-specific microfilament-associated, actin-binding protein involved in actin
polymerization (Lambrechts et al. 2000b; Lambrechts et al. 1997) has been shown to interact directly with
SMN (Giesemann et al. 1999). These interaction may mediate actin and SMN transport in neurite
outgrowth. Two additional SMN partners (Mourelatos et al. 2001; Rossoll et al. 2002), namely the RNA-
binding proteins hnRNP-R and hnRNP-Q co-localize with SMN in distal axons of embryonic motor
neurons (Rossoll et al. 2002).
In plant epidermal cells and yeast cells, plastin-GFP was also found to associate with specific elements of
the actin filament cytoskeleton. In plant cells, fluorescence localized to fine actin filaments within
transvacuolar cytoplasmic strands and within the cell cortex. The thicker actin cables within the subcortex,
visualised by rhodamine-phalloidin labelling, were not observed with plastin-GFP (Timmers et al. 2002).
In the case of yeast cells, plastin-GFP only associated with cortical actin patches (Timmers et al. 2002). T-
plastin is a cytoplasmic protein broadly expressed regulating actin assembly and cellular motility. The
actin skeleton plays an important role in axon initiation, growth, guidance, branching and retraction, and
also in synapse formation and stability (Luo 2002). It has been observed that Smn associates with
cytoskeletal elements in spinal dendrites and axons (Pagliardini et al. 2000).
Recently, cytoskeletal-based active transport of Smn-containing granules in neuronal processes and
growth cones has been demonstrated in transfected cultured neurons (Zhang et al. 2003). Deficiency of
Smn protein leads to alteration of β-actin protein and mRNA localization in axons and growth cones
(Rossoll et al. 2003). The reduced level of β-actin suggests that functions such as growth cone movement
and the release of synaptic vesicles (Bloom et al. 2003), which also require actin, might be disturbed in
SMA and thus contribute to the specific pathology of SMA disease.

RESULTS 136
Fig. 21 Co-localization of endogenous T-plastin with SMN and F-actin in neurites and the growth
cones in PC12 derived neurons. (A) T-plastin (green) and SMN (red) were detected by double-
labeled immunofluorescence using anti-T-plastin antibody directly conjugated with AlexaFluor 488
and anti-SMN antibody directly conjugated with AlexaFluor 568. Higher magnification of one
region (inset from top panel is enlarged in bottom panel) shows the frequent co-localization
between SMN and T-plastin within neurites (white arrows) and growth cones (orange arrow). (B)
Co-localization of F-actin and T-plastin at growth cones in PC12 derived motor neurons. F-actin
was stained with phalloidin conjugated with AlexaFluor 568 (red) and anti-T-plastin antibody
directly conjugated to AlexaFluor 488 (green). The co-localization (indicated by arrows) at growth
cones was observed. Bar: 20 µm.

RESULTS 137
5.3.7.6. T-plastin-depleted PC12 cells exhibit a significant reduction in neurite length
To address the role of T-plastin in PC12 cell differentiation, PC12 cells in which endogenous T-plastin was
knocked down were generated. To model this effect of T-plastin loss in cultured PC12 cells siRNA oligos
directed against rat T-plastin and DharmaFect 4 Transfection reagent (Dharmacon) were used. PC12 cells
were cultured in collagen type-I coated culture dishes and for immunostaining procedures differentiating
PC12 cells were grown on collagen type I-coated coverslips (see Methods) to increase the attachment of
PC12 cells during transfection procedures.
The efficacy of antisence T-plastin siRNA oligos was evaluated by Western blot analysis (Fig. 22 A and B)
of whole cell lysates harvested from PC12 cells transfected either with control siRNA or with T-plastin
siRNA oligos. The proteins were resolved on 12 % SDS-PAGE gel and transferred to a nitrocellulose
membrane; blots were probed first with anti-β-tubulin antibody and then with anti-T-plastin antibody to
detect the efficiency of the knocking-down procedure.
Fig. 22 Knock-down of T-plastin in PC12 cells. (A) PC12 cells were treated either with control
siRNA (lane 1 and 6) or with siRNA directed against N- terminus of rat T-plastin (lanes 2-5 and 7-
10) using as transfection reagent DharmaFect 4 (Dharmacon). PC12 cells were double transfected
(a second transfection step was performed 24 h after the first transfection). Cells were allowed to
differentiate 48 h (left) or 72 h (right) under NGF (100 ng/ml) stimulation. Western blot analysis
revealed a significant reduction in the amount of T-plastin in T-plastin siRNA treated PC12 cells as
compared to control siRNA treated PC12 cells. (B) Knock-down of T-plastin protein level was
determined relative to ββββ-tubulin. Results represent the mean ± SD from four independent
experiments (p<0.001 compared with control siRNA treated cells by t-test).

RESULTS 138
The experiments were repeated four times and a double-step transfection protocol was approached.
Therefore, after 24 h after the first transfection, a second transfection step was performed and cells were
allow to differentiate 48 or 72 h under NGF after the second transfection step. With this technique, T-
plastin protein in transfected PC12 cells was nearly undetectable at two and three days in vitro (Fig. 22 A).
Densitometrically analysis of T-plastin signals showed a significant decrease of 93 ± 3% relative to β-
tubulin and compared to cells trasfected with control siRNA on day two and three after the second
transfection and neuronal differentiation (Fig. 22 B).
In cultured PC12 cells-derived neurons in which T-plastin expression was suppressed, there was much
greater percentage of shorter neurons (Fig. 23 A, lane 2) when compared with PC12 cells transfected with
control siRNA (Fig. 23 A, lane 1). In the same time, the complexes localized at the growth cones seem to
be disturbed as long as no clear growth cone structure could be observed (Fig. 23 B).
Silencing of T-plastin by siRNA in PC12 cells-derived neurons resulted in a significant reduction in the
average axon length. To study the effect of suppression on neurite outgrowth, neurite lengths were
measured by morphometrical analysis of maximum neurite lengths (van Bergeijk et al. 2007).
More than 200 cells in three independent experiments were measured and the reduction was significant
(p< 0.05) as shown in Fig 24. These results indicate that T-plastin is required for normal axon outgrowth.
Because T-plastin is ubiquitously expressed in epithelial cells, it is more likely that inactivation of T-plastin
may play a role in modulating the actin cytoskeleton. In transformed cells, altered cell morphology is often
accompanied by decreased expression of actin-binding proteins (Janmey and Chaponnier 1995;
Vandekerckhove et al. 1990). It is conceivable that down-regulation of T-plastin leads to an aberrant G2/M
cell-cycle control and consequently to an increase in damage sensitivity (Sasaki et al. 2002). It has been
shown that the bundling activity of T-plastin is regulated by GTPase-mediated transduction pathway
(Dutartre et al. 1996; Zhou et al. 1999).
5.3.7.7. T-plastin overexpression in PC12 cells leads to an increase in size of the neurites
To answer the question whether T-plastin might modulate neurite outgrowth, PC12 cells were transiently
transfected with a construct that encodes for the human full-length T-plastin protein. The efficiency of the
transfection was assessed by Western blot (Fig. 25). The T-plastin-V5 tagged protein was successfully
expressed after 48 and 72 h, respectively, under NGF treatment. The same blots were reprobed with an
anti-T-plastin antibody to check for the increased T-plastin expression as compared to mock. PC12 cells
overexpressing T-plastin were double transfected as described in methods and allowed to differentiate for
48 and 72 h and afterwards were double immunostained with either antibodies directed against V5 and
SMN or against V5 and with AlexaFluor 568 phalloidin. It has been observed that upon NGF treatment,
PC12 cells that overexpressed T-plastin extended more and longer neurites compared to cells that do not
overexpressed T-plastin (Fig. 23 lane 3). To confirm this observation, neurite outgrowth was quantified.
Cells with neurites were defined as ones that possess at least one neurite of greater than two-body length
and 100 cells were assayed in each group. It has been found that cells overexpressing T-plastin

RESULTS 139
Fig. 23 T-plastin modulates neurite outgrowth. (A) PC12 cells were transfected either with control
siRNA, T-plastin siRNA, T-plastin-V5 plasmid DNA or simultaneously with both, T-plastin-V5
plasmid DNA and T-plastin siRNA (as indicated above the figure) and allowed to differentiate for 72
h under NGF. Neuron-like processes from T-plastin-depleted PC12 cells (lane 2) exhibited a
significant reduction in neurites length (relative changes of neurites length are shown in Fig. 24
B).compared with control siRNA treated cells (lane 1) In lane 3, PC12 cells overexpressing T-
plastin showed longer neurites and an increase in secondary structure number. Overexpression of
T-plastin in SMN-depleted PC12 cells shoed partial rescue of the neurite length (lane 4). (B) Insets
from lane 2 top panel, are enlarged at higher magnification. The distribution of SMN protein at
growth cone level seems to be disturbed. Bar: 20 µm.

RESULTS 140
Fig. 24 To asses neurite length, cells were plated as described in Methods and treated with 100
ng/ml NGF. (A) For quantification of the neurite length only the neurons that allowed a clear
distinction between axon and dendrites were scored. After transfection and neuronal
differentiation of PC12 cells, maximum lengths of neurites were determined after three days of
differentiation. PC12 cells were stained with phalloidin conjugated with AlexaFluor 568.
Representative images are shown. Bar: 10 µm. (B) Mean value of neurite length of each group is
graphically shown as determined from total counted neuron axons (n=100 for each group) **p <
0.002 when compared with control treated cells by t-test.

RESULTS 141
showed longer neurites with approximately 10 % (SD +/- 4.1) (Fig. 24 B). It has previously shown that in
differentiating PC12 cells, overexpression of Smn as well as hnRNP-R leads to enhanced neurite
outgrowth. These effects depends on the interaction of these two proteins (Rossoll et al. 2003). T-plastin
protein functions in the formation of actin bundles that are required for cell locomotion and maintenance of
the cellular architecture. Cultured fibroblasts that overexpressed T-plastin showed increased motility and
altered cellular architecture, cells presenting more cytoplasmic pseudopods (Arpin et al. 1994).
Overproduction of T-plastin in fibroblast-like CV-1 cells did not led to such striking modifications of the
cortical actin cytoskeleton (Arpin et al. 1994) as was observed with villin (Friederich et al. 1989); high
production level of T-plastin caused a partial loss of adherence and rounding-up of the cells. T-plastin was
recruited to villin-induced F-actin spikes (Friederich et al. 1989) and the avidity of overproduced T-plastin
for F-actin structures in CV-1 cells is increased in the presence of villin and depends on a specific
organization of microfilaments (Arpin et al. 1994).
Fig. 25 Western blot analysis of PC12 cells transfected with human T-plastin-V5 plasmid DNA. High
levels of T-plastin were expressed after 48 h and 72 h as shown by staining with V5 antibodies to
detect the recombinant protein. Control PC12 cells were transfected with the empty pcDNA 3.1
vector. The blots were striped and reprobed with an antibody against T-plastin to check for the
overexpressed amounts of T-plastin.
It has been shown that IGF-1 (insulin-like growth factor-1) is a potent and specific activator and enhancer
of axon outgrowth by cortical spinal motor neurons both in vitro and in vivo (Ozdinler and Macklis 2006).
At the same time, 10 % of axons overexpressing T-plastin (Fig. 23 A, lane 3; Fig. 26 A) were significantly
higher elongated when compared with the control siRNA treated cells. Along the neurites were observed
growth-cone-like structures where T-plastin and SMN co-localize (Fig. 26 A). These results suggest that T-
plastin might act in both initiation of axonal growth and in the same time in axon elongation. In epithelial

RESULTS 142
cell line LLC-PK1, the overexpressed T-plastin isoform remained associated with highly organized actin
bundles of the microvilli and was able to increase the length and density of the brush border microvilli,
particularly at the periphery of the cell (Arpin et al. 1994). About 30 % of transfected differentiated PC12
cells that overexpressed T-plastin showed cytoplasmic hair-like projections (Fig. 26 B). This morphological
alteration obviously reflects that overexpression of T-plastin induced changes in the cytoskleletal proteins.
Fig. 26 Representative images of PC12 cells transfected with T-plastin-V5 that were allowed to
differentiate for 72 h with NGF. (A) After fixation, cells were double stained with SMN antibody
conjugated with AlexaFluor 568 and with anti-V5 antibody conjugated with AlexaFluor 488 to
detect the T-plastin localization. Along the axons T-plastin and SMN co-localize at growth cone
and growth cone-like structures (indicated by arrows). (B) 30 % of PC12 cells derived neurons
overexpressing T-plastin showed hair-like cytoplasmic projection. Bar: 20 µm.
5.3.7.8. T-plastin overexpression is able to rescue partially the neurite length in SMN-depleted
PC12 cells
Because reduced SMN protein levels lead to reduced axonal growth (Jablonka et al. 2000), we examined
whether overexpression of T-plastin in SMN-depleted PC12 cells affects neurite outgrowth in
differentiating neuronal cells. For this purpose, PC12 cells were co-transfected with expression constructs
for wild-type T-plastin and SMN siRNA oligos. Western blot of lysates revealed successful down-
regulation of SMN as well as overexpression of the T-plastin protein (Fig. 27 A and B). Morphologically,

RESULTS 143
none obvious abnormalities were detected but the neurites were assessed for measurements (Fig. 23
lane 4, Fig. 24 A). Neurite lengths were measured after two or three days in culture with NGF. The size of
the neurites was intermediate between the T-plastin-depleted cells and T-plastin overexpressing axons
(Fig. 24 B). T-plastin was able at least in part to rescue the length of neurites. Taken together these
experiments demonstrated that T-plastin is a potent enhancer of axon elongation. This role is highly
relevant to understand the basic developmental biology of motor neurons population and to develop future
treatments to promote the survival of vulnerable or diseased motor neurons involved in SMA. It is also
relevant for developing strategies for regenerating injured spinal cord.
Fig. 27 Overexpression of T-plastin and knockdown of SMN in PC12 cells. (A) PC12 cells were co-
transfected with siRNA oligos directed against rat Smn transcripts and with a pcDNA 3.1 plasmid
that encodes for the human T-plastin using Lipofectamine 2000 reagent (Invitrogen). Cells were
incubated overnight and a second round of transfection under the same conditions was
performed. Cells were allowed to differentiate for 48 h and 72 h, respectively. Cells were harvested,
and lysates were analyzed by Western blot with antibodies against β-tubulin, SMN and V5-tag.
Endogenous SMN was successfully down-regulated whereas expression of the recombinant T-
plastin was shown by staining with anti-V5 antibody. (B) Quantitative analysis of SMN protein in
PC12 cells after knocking-down Smn with siRNA oligos directed against rat Smn. **: p<0.002.

RESULTS 144
5.3.7.9. Molecular analysis of the T-plastin coding region, promoter, 3’UTR and intron 1
The structure of L-plastin and T-plastin genes were found to be similar in that both were approximately 90
kb in length with 16 exons each (Lin et al. 1993b). The gene is located on human chromosome X and
encodes for a 68 kDa polypeptide. To answer the question of whether T-plastin activation in asymptomatic
individuals might be the cause of any mutation in the coding region, all 16 exons were screened for any
nucleotide differences in 5 SMA discordant families (marked with “5” in T2 in appendix). The complete
coding region from genomic fragments was sequenced using intronic flanking primers (see table 7 and
Fig. F4 in appendix). Additionally, the whole 3’UTR region was sequenced and no mutation or DNA
sequence variation was found. Therefore, to find the mechanism responsible for the activation of T-plastin
gene in unaffected sibs that carry SMN1 deletion or mutation, the regulatory elements known to regulate
T-plastin expression were sequenced. It is known that T-plastin promoter includes 3 kb of the upstream
flanking region from the start site. The basal promoter is located within 300 bp upstream of the primary
transcription initiation site (Lin et al. 1999). A potential enhancer has been mapped approximately 500 bp
upstream of the basal promoter (Lin et al. 1999). An unusual feature of the T-plastin gene sequence is the
high density of CpG dinucleotides in a 1.5 kb region spanning the region from the 5’ vicinity of the
transcription initiation site to the beginning of the first intron (Lin et al. 1999). Thus, the T-plastin enhancer-
promoter-first exon-first intron region was screened in all discordants individuals and again no nucleotide
variation was found. Taken together, these results suggested that the intrafamilial phenotypic variability in
SMA families associated with T-plastin expression cannot be explained by either mutation or
polymorphism in the complete coding region, 3’UTR region or regulatory elements. Other molecular
mechanisms must be responsible for differential T-plastin expression: either an epigenetic modification of
the CpG island or an activation/inactivation mechanism of the T-plastin enhancer.
5.3.8. Expression analysis of the T-plastin gene
The only known epigenetic modification of DNA in mammals is methylation of cytosine at position C5 in
CpG dinucleotide (Bird 2002). The mammalian DNA methylation machinery is composed of two
components, the DNA methyltransferases (DMTs), which establish and maintain DNA methylation
patterns, and the methyl-CpG-binding proteins (MBPs) which are involved in “reading” methylation marks
(Hendrich and Tweedie 2003; Robertson 2002). In normal cells, DNA methylation occurs predominantly in
repetitive genomic regions including satellite DNA and parasitic elements (such as long interspersed
transposable elements (LINES), short interspersed transposable elements (SINES) and endogenous
retroviruses) (Yoder et al. 1997). CpG islands, particularly those associated with promoters, are generally
unmethylated, although an increasing number of exceptions are being identified (Bird 1986; Song et al.
2005). DNA methylation represses transcription directly, by inhibiting the binding of specific transcription
factors, and indirectly, by recruiting methyl-CpG-binding proteins and their associated repressive
chromatin remodelling activities (Robertson 2005). The T-plastin promoter-first exon-first intron region has

RESULTS 145
the characteristics of a CpG island (Lin et al. 1999). It is known that genes having the so-called CpG
island can be regulated by DNA methylation at the C nucleotide of CG dinucleotides (Bird 1986; Eden and
Cedar 1994). Thus, the CG-rich 1.5 kb region of the T-plastin gene appears to be a typical CpG island and
therefore a potential target for methylation.
5.3.8.1. T-plastin CpG island: quantitative evaluation of methylation level using pyrosequencing
method
The finding that many genes controlling normal cellular homeostasis can be silenced inappropriately by
structural chromatin changes that involve DNA methylation has encouraged a search for agents that might
reverse these changes and, therefore, restore principal cellular pathways. The dimethylating agent 5-
azocytidine and its deoxy derivative 5’-aza-2’deoxycytidine were first synthesized in Czechoslovakia as
potential chemotherapeutic agents for cancer (Cihak 1974). The analysis of DNA methylation was
revolutionized by the introduction of sodium bisulfite conversion of genomic DNA. The differential rates at
which cytosine and 5-methyl cytosine are deaminated by sodium bisulfite to yield uracil and thymine,
respectively showed that the usefulness of this chemical reaction in conjunction with PCR amplification
and sequencing (Frommer et al. 1992).
To investigate the inactivation mechanism of T-plastin gene in affected SMN1-deleted sibs and the most
of the control and SMA population, 16 samples were selected for methylation analysis by pyrosequencing.
All 16 samples were males showing an SMA phenotype and were checked by RT-PCR for T-plastin
expression (the samples are marked with “4” in table T1 in appendix and the complete raw data are
shown in table T9 that is contained in the attached CD-ROM). Eight patients showed T-plastin expression
were grouped as “T-plastin-positive population”; another eight samples were selected from the non-
expressing T-plastin SMA patients and grouped as “T-plastin-negative population”. Only male samples
were included in the pyrosequencing experiment in order to avoid any “methylation noise” due to the
inactivated X chromosome in female samples. This analysis was performed under the assumption that if
T-plastin expression is regulated by DNA methylation, a higher methylation level should be expected in “T-
plastin-negative” group. The methylation mean for each sample was calculated as the mean of the
methylation of the complete analyzed CpG region. No difference in methylation level could be observed
between the two groups (Fig. 28 A). Therefore, the positive group had similar methylation level as the
negative control group. As shown already by Lin et al. in 1999, no correlation between the two groups
could be detected, suggesting that methylation does not play an important role in T-plastin expression.
To investigate the possibility of the CpG island as potential target for methylation, Lin and colleagues
selected three T-plastin expressing cell lines (HT-1080, HuT-12 fibrosarcoma cells and MCF-7 breast
carcinoma cells) and five T-plastin-negative lines and cells (CEM, K562, Jurkat, Molt-4 leukemia cells and
PBL) for comparison (Lin et al. 1999). The T-plastin CpG island was unmethylated in cultured cells that do
not express T-plastin but was variably methylated at different locations in cultured cells that do not
express T-plastin. However, because the T-plastin CpG island was found unmethylated in T-plastin-

RESULTS 146
negative PBL, it does not appear that DNA methylation plays a role in the inactivation of T-plastin gene in
normal lymphocytes (Lin et al. 1999).
The possible difference in methylation profile was also checked in five SMA discordant families (marked
with “4” in table T2 in appendix) using the DNA isolated from EBV-transformed lymphoblastoid cells from
unaffected and affected sibs, respectively. Surprisingly, the levels of methylation for female samples
where very low in the analyzed region, suggesting the possibility that T-plastin CpG island might be
hypomethylated even on the inactivated X-chromosome (Fig. 28 B). The complete raw data of methylation
analysis for both SMA discordant families and control groups are contained in the attached CD-ROM.
The methylation level was calculated and for each CpG site and again no significant difference was
observed between unaffected vs. affected SMA discordant sibs (Fig. F9 in appendix), or between T-
plastin-positive population” vs. T-plastin-negative population” (Fig. F10 in appendix).
Fig. 28 Methylation analysis of T-plastin CpG islands using Pyro Q-CpG Software. (A) DNA
samples were isolated from EBV-transformed cell lines belonging to 8 males (“T-plastin-positive
population” group) who showed T-plastin expression and 8 males that failed to show any T-plastin
expression (“T-plastin-negative population” group) by RT-PCR. Both control groups showed
similar ranges of methylation (~8 %). (B) CpG methylation pattern within the T-plastin CpG island
region in five SMA discordant families. No significant difference was observed between the
unaffected (n=7) vs. affected SMA discordant sibs (n=6), both groups presenting methylation
levels close to 16 %. The methylation percentage was calculated as the methylation mean of all 99
CpG sites analyzed in each group. The error bars indicate SD.

RESULTS 147
The results showed that the CpG island located in the promoter-first exon-first intron region is not
methylated in both unaffected and affected SMN1-deleted sibs. In conclusion, the DNA methylation of the
CG-rich region located within the T-plastin genomic area is not responsible for the activation of this gene
in unaffected sibs SMN1-deleted in SMA discordant families. Another mechanism should be the cause for
the differential expression of T-plastin in phenotypically discordant sibs.
5.3.8.2. In vivo footprinting of T-plastin enhancer in EBV-transformed lymphoblastoid cells of SMA
discordant families
Within the eukaryotic nucleus, each gene is embedded within a chromosomal environment of other DNA
sequences that have the potential to affect its expression. In some cases, regulatory elements-enhancers
or silencers-associated with nearby genes could be close enough to disrupt normal expression patterns. In
other cases, a transcriptionally active gene is surrounded by regions of condensed chromatin that could
overflow their borders and silence the gene (Bell et al. 2001). Promoters consist of several composite
elements and/or individual binding sites for transcription factors. Enhancers also consist of composite
elements and/or single binding sites. They modulate the level of transcription depending on the type of
tissue, developmental stage, stage of the cell cycle, induction by hormones or other molecular signals
(Buratowski 1994). An enhancer can act over many kb 3’ or 5’ from the transcription start site, possibly
from within an intron, and its activity does not depend on its orientation. Within 250 bp upstream from the
first exon of T-plastin gene, an Sp1 motif, a CCAAT box and four AP2 motifs were identified (Lin et al.
1999). However, no sequence similar to the canonical TATA box on the transcription initiator (Smale and
Baltimore 1989) was found in this region. A more stringent analysis resulted in the identification of a few
AP1 motifs, a TEF1 motif and a CREB motif in the first exon (Lin et al. 1999). An enhancer was mapped to
within a 20 bp fragment, approximately 500 bp upstream of the basal promoter (Lin et al. 1999). A
summarized overview of T-plastin genomic region is represented in Fig. F4 in appendix. The T-plastin
promoter has a weak basal activity and expression may be controlled by upstream enhancer elements
and by methylation of the CpG island (Lin et al. 1999). Therefore, to answer to the important question by
which mechanism T-plastin is activated in unaffected SMN1-deleted sibs, the investigation whether T-
plastin enhancer binding site is occupied in EBV-transformed lymphoblastoid cell lines was verified by an
in vivo footprinting approach using dimethylsulphate (DMS) treatment and ligation-mediated PCR (LM-
PCR).
EBV-transformed cell lines derived form 5 SMA discordant families (marked with “4” in table T2 in
appendix), two positive controls and two negative controls for T-plastin expression (marked with “2” in
table T2 in appendix) were treated in vivo with DMS, which resulted in partial methylation of guanines at
the N7 position. DNA was then extracted from the cells and cleaved at the methylated bases by treatment
with piperidine. A representative autoradiogram from the in vivo footprint analysis of EBV-transformed
lymphoblastoid cell lines by LM-PCR is shown in Fig. 29, on the minus strand. The portion of the gel
corresponds to nucleotides -744 to -849 (84 nt) within T-plastin genomic region. As shown, comparison
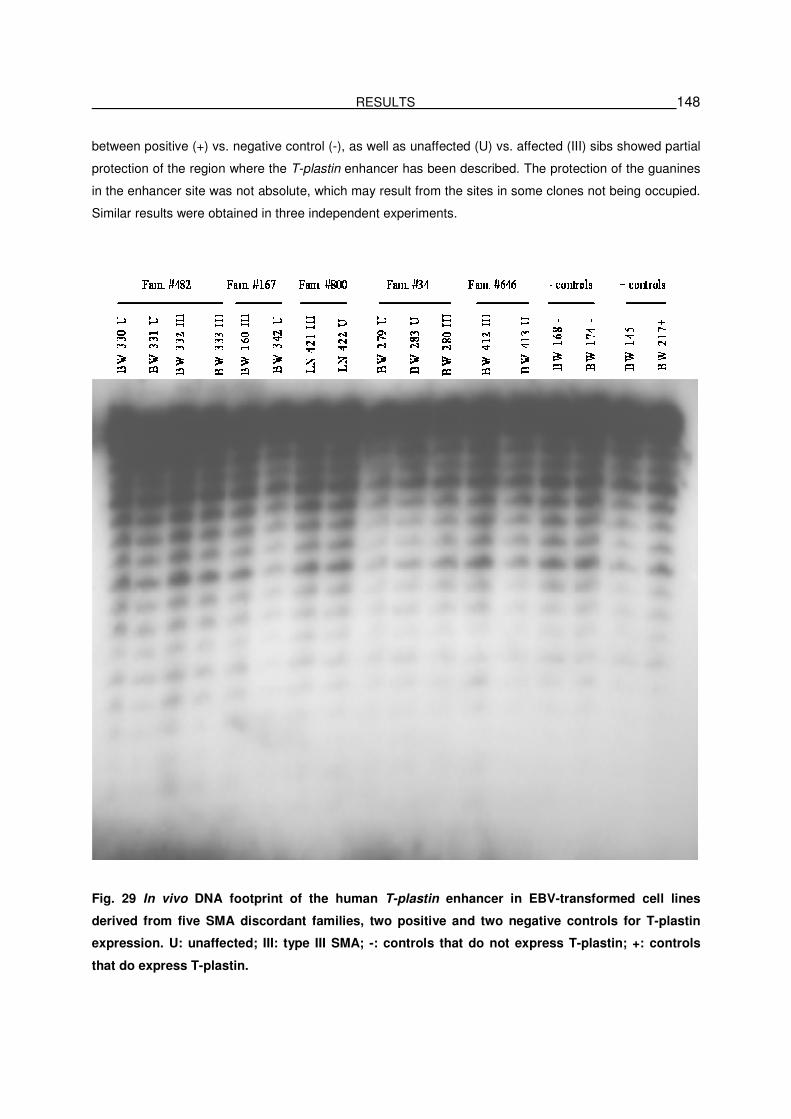
RESULTS 148
between positive (+) vs. negative control (-), as well as unaffected (U) vs. affected (III) sibs showed partial
protection of the region where the T-plastin enhancer has been described. The protection of the guanines
in the enhancer site was not absolute, which may result from the sites in some clones not being occupied.
Similar results were obtained in three independent experiments.
Fig. 29 In vivo DNA footprint of the human T-plastin enhancer in EBV-transformed cell lines
derived from five SMA discordant families, two positive and two negative controls for T-plastin
expression. U: unaffected; III: type III SMA; -: controls that do not express T-plastin; +: controls
that do express T-plastin.

RESULTS 149
5.3.8.3. Haplotype analysis of the T-plastin genomic region revealed a trans-acting mechanism to
regulate its expression
Searching for the mechanism that is responsible for the activation of T-plastin gene in asymptomatic
SMN1-deleted sibs by sequencing, epigenetic analysis and DNA footprinting failed to show any difference
at DNA level within the T-plastin genomic region. In hope to find the answer whether T-plastin expression
is regulated at transcription level by an so far unidentified cis-element, a haplotype association study was
carried out in 12 SMA discordant families (see table T2 in appendix; the SMA discordant families are
marked with “3”), 2 control families (see table T10 in appendix), 4 SMA classical families (see table T10 in
appendix) were T-plastin was observed to be expressed by the SMA patients (that are marked with “1” in
table T1 in appendix) and 7 male SMA patients that do express T-plastin (see table T1 in appendix; the
SMA patients are marked with “1”). Searches for correlations between human genetic variations and
disease phenotypes have often been fruitful for strongly hereditary diseases, but have had limited success
at finding genetic risk factors for complex diseases (Castellana et al. 2006). This failure is likely due at
least in part to the challenges of distinguishing many relatively weak correlations from the noise produced
by chance associations with the millions of known sites of common variation. Haplotypes are a
combination of alleles at different markers along the same chromosome that are inherited as a unit
(Castellana et al. 2006). Many methods are based on the haplotype block model (Daly et al. 2001), which
proposed that the genome consists of discrete regions of strongly correlated variations separated by
recombination hotspots, across which correlations have been eliminated by frequent historical
recombination. Or they may use haplotypes to identify “haplotype tagging SNPs” (htSNPs), a subset of
SNPs that contain most of the information contained in the full SNP set (Johnson et al. 2001), which can
reduce the cost of genotyping and the difficulty of finding meaningful associations in the resulting data.
Information about recombination is important for locating disease-causing mutation by linkage methods
and has a profound effect on the extent of statistical association between the presence of two SNPs in the
genome, known as linkage disequilibrium- a key property for disease association studies across the
human genome (Crawford and Nickerson 2005).
The specific role of the haplotypes in a candidate gene association study depends on the hypothesis
being tested. For example, haplotypes can represent a combined effect of several sites along the same
chromosome (cis-acting loci) that cannot be detected when sites are tested one by one (Crawford and
Nickerson 2005). Therefore, a haplotype-based association study was carried out in hope to answer the
question why not all T-plastin-expressing individuals are protected to develop SMA, and whether the T-
plastin expression is induced by a cis-or a trans-acting factor/element. For the female SMA patients, the
parents were necessary in order to reconstruct the T-plastin haplotype blocks. For the male SMA patients,
the parents were not necessary, given the fact that the T-plastin gene is localized on chromosome X. All
individuals were directly genotyped by pyrosequencing. The pedigree or family based method relies on
the fact that different loci on the same chromosome (haplotype) will be inherited as a unit unless they are
separate by recombination event (Crawford and Nickerson 2005).

RESULTS 150
Fig. 30 Linkage disequilibrium (LD) of the SNP markers in the T-plastin genomic region (block one
in the upper part and block two in the lower part) in the HapMap. Standard colour scheme is used
to display linkage disequilibrium with red colour for very strong LD, pink red and blue for
intermediate LD, and white for no LD.
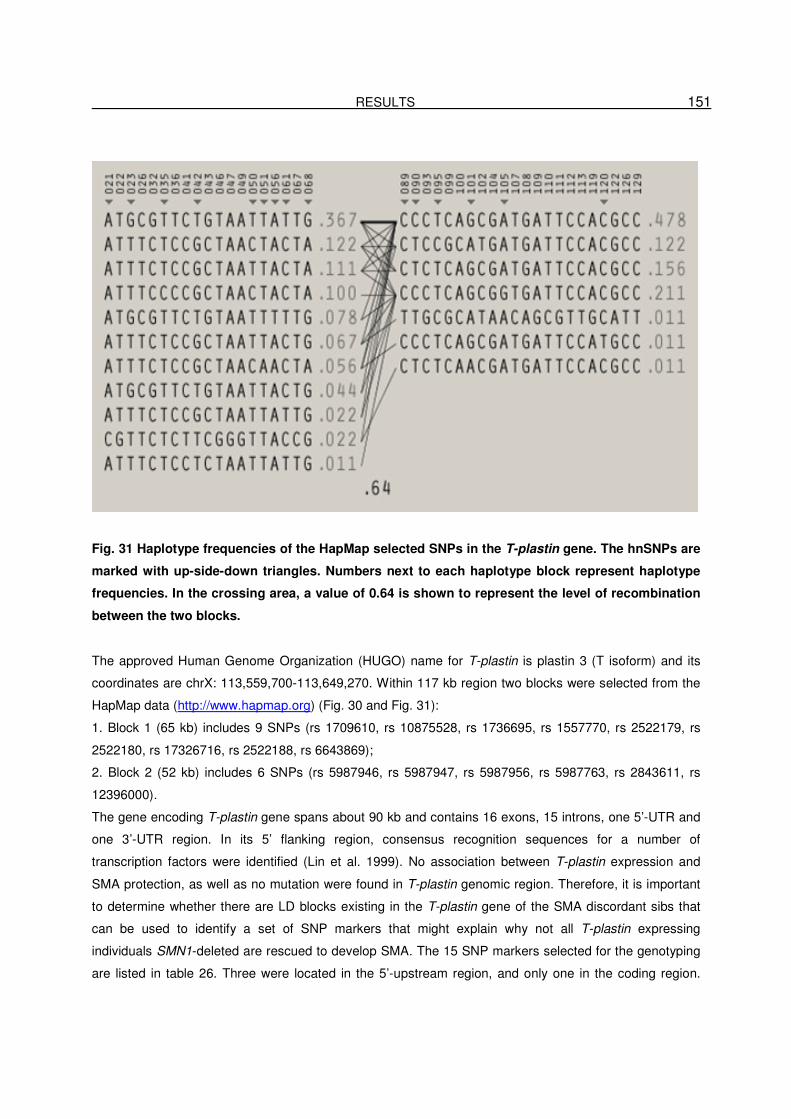
RESULTS 151
Fig. 31 Haplotype frequencies of the HapMap selected SNPs in the T-plastin gene. The hnSNPs are
marked with up-side-down triangles. Numbers next to each haplotype block represent haplotype
frequencies. In the crossing area, a value of 0.64 is shown to represent the level of recombination
between the two blocks.
The approved Human Genome Organization (HUGO) name for T-plastin is plastin 3 (T isoform) and its
coordinates are chrX: 113,559,700-113,649,270. Within 117 kb region two blocks were selected from the
HapMap data (http://www.hapmap.org) (Fig. 30 and Fig. 31):
1. Block 1 (65 kb) includes 9 SNPs (rs 1709610, rs 10875528, rs 1736695, rs 1557770, rs 2522179, rs
2522180, rs 17326716, rs 2522188, rs 6643869);
2. Block 2 (52 kb) includes 6 SNPs (rs 5987946, rs 5987947, rs 5987956, rs 5987763, rs 2843611, rs
12396000).
The gene encoding T-plastin gene spans about 90 kb and contains 16 exons, 15 introns, one 5’-UTR and
one 3’-UTR region. In its 5’ flanking region, consensus recognition sequences for a number of
transcription factors were identified (Lin et al. 1999). No association between T-plastin expression and
SMA protection, as well as no mutation were found in T-plastin genomic region. Therefore, it is important
to determine whether there are LD blocks existing in the T-plastin gene of the SMA discordant sibs that
can be used to identify a set of SNP markers that might explain why not all T-plastin expressing
individuals SMN1-deleted are rescued to develop SMA. The 15 SNP markers selected for the genotyping
are listed in table 26. Three were located in the 5’-upstream region, and only one in the coding region.

RESULTS 152
Most of them were located in non-coding region and just one in the 3’-downstream area. The first block
spans the 5’-upstream region and the whole promoter-first exon-first intron region and is followed by the
second block crossing a 52 kb region. This spans the T-plastin genomic region from exon 2 to 3’-
downstream region (Fig. 30). The T-plastin htSNPs are represented for the European population in Fig.
31. Only one haplotype with a frequency of 0.367 in block 1 suggests that this is the most frequent
haplotype in European population representing about 40 % of the total haplotypes identified at this locus
(Fig. 31, left). For block 2, two haplotypes were found with a frequency of 0.478 and 0.221, respectively.
Together, these two most frequent haplotypes represent 68 % of the total haplotypes found in this
particular region (Fig. 31, right). The recombination frequency between the two blocks is 64 % (Fig. 31,
crossing area).
Table 26 Chromosomal positions and gene location of the T-plastin SNPs
# SNP ID Chromosome position Location in T-plastin gene Variation allele *
1 rs17096100 114672875 5’-upstream A/C
2 rs10875528 114674791 5’-upstream G/T
3 rs17326695 114694801 5’-upstream C/T
4 rs1557770 114701431 Exon 1 G/T
5 rs2522179 114712647 Intron 1 C/T
6 rs2522180 114714000 Intron 1 A/T
7 rs17326716 114724272 Intron 1 A/T
8 rs2522188 114728933 Intron 1 C/T
9 rs6643869 114738023 Intron 1 A/G
10 rs5987946 114763159 Intron 3 C/T
11 rs5987947 114764437 Intron 3 C/T
12 rs5987956 114777911 Intron 8 C/T
13 rs5987763 114779799 Intron 8 A/G
14 rs2843611 114784651 Intron 10 A/G
15 rs12390767 114796311 3’-downstream C/T
*: Variation allele sequences are based on the plus strand sequence
All the individuals taken in the study were genotyped by pyrosequencing and the raw data are represented
in table T11 in appendix. No correlation between a certain haplotype and T-plastin expression was
observed and the calculation of the significance of the association is in progress. An overview on the
haplotypes blocks reconstruction is given in table T12 in appendix.
Taken together, the T-plastin haplotype blocks analysis strongly suggests that the T-plastin expression is
regulated by a trans-acting factor and further investigations are required to identify putative factors able to
regulate T-plastin transcription.

RESULTS 153
5.4. Search for modifying genes by genome-wide scan analysis
Genom-wide association studies have recently received a great deal of attention as a tool for detecting the
genetic variation responsible for human common diseases. SNP markers are preferred over microsatelite
markers for association studies, because of their high abundance along the human genome (SNPs with
minor allele frequency >0.1 occur once every ~600 kb) (Wang et al. 1998), their low mutation rate, and the
accessibility of high-throughput genotyping. Recent studies (Daly et al. 2001; Dawson et al. 2002; Gabriel
et al. 2002; Johnson et al. 2001; Patil et al. 2001) have shown that the human genome can be portionated
into blocks with limited haplotype diversity, such that only a small fraction of SNPs captures most
haplotypes. Haplotype blocks, together with the corresponding tag SNPs and common haplotypes
determined by haplotype block-partitioning algorithms, can be used in the genome-wide association
studies, as well as in the fine-scale mapping of complex disease genes.
To identify susceptibility loci for SMA modifying factors and potential activator factors able to modulate T-
plastin expression, a genome-wide analysis was conducted in a set of 42 SMA discordant families of
different origin (see table T2 in appendix) composed of 172 individuals. In 38 families, at least two siblings
with different phenotypes (affected vs. asymptomatic or different types of SMA) plus parents were
available. This valuable and unique collection of families allowed us to carry out a whole genome scan in
order to search for the modifying gene(s). Nowadays, one of the most common methods to study
associations between genetic variation in “candidate” modifier genes and clinical phenotype is the
identification of single nucleotide polymorphisms (SNPs). In contrast to gene mutations occurring in less
than 1 % of the individuals in a population, SNPs are present in more than 1 % of the individuals and
comprise common genetic variation in normal individuals (Davies et al. 2005). Evidence of linkage
between a SNP and disease phenotype indicates that the SNP is located in a modifier gene or that the
SNP is in linkage with a modifier gene.
The readily available GeneChip Mapping 10K SNP array was recently shown to allow detection of
homozygous deletions, amplifications, and copy number reductions of regions >10 Mb in polyploid cells
from tumor cell lines, using genotypes in combination with copy number information from hybridization
intensities (Bignell et al. 2004). The power of any modifier gene study is determined by population size,
the degree of clinical effect on the gene in question and the allele frequency (Davies et al. 2005).
5.4.1. Power simulation of the genome scan analysis
Initially a linkage study was simulated including 38 discordant SMA families. Under the assumption of a
recessive mode of inheritance of a single modifying locus in all families a maximum LOD score of 10.03,
and under the assumption of a dominant mode of inheritance a maximum LOD score of 7 could be
achieved (see F8 and F9 in appendix). Under the assumption that only 75 % of the families are linked to
the modifying locus a LOD score of 5.2 could be achieved for a recessive mode of inheritance and a LOD
score of 3.8 could be reached for a dominant mode of inheritance. In 28/38 families (74 %) the females

RESULTS 154
are less affected or even asymptomatic as compared to their more severely affected brothers or sisters.
By assuming that a gender specific modifier might act, ¾ of the families might likely be linked to only one
locus. The LOD score would fall under the statistical significance of z=3 if only half of the families were
linked to a certain modifier gene. A maximum LOD score of 2.5 could be achieved for a recessive and 1.8
for a dominant mode of inheritance.
Fig. 32 Summary of the genome-scan for SMA modifying susceptibility loci in 42 SMA discordant
families. The figure shows non-parametric analysis using MERLIN software.
5.4.2. Non-parametric linkage data interpretation
The genome scan was performed by comparison of unaffected/milder affected sibs with the affected/
more sever affected sibs, individually assuming each of the different modes of transmission described
(recessive and dominant). Each SNP was scored as AA, BB (homozygous) or AB (heterozygous)
depending on the genotype or as “no call” in the event of equivocal results. “No call” results were excluded
and informative loci selected.
Non-parametric multipoint linkage analysis was performed using allele frequency with MERLIN software
(Abecasis et al. 2002). The results are summarized in Fig. 32. The most significant allele sharing among
affected relatives in families was detected on chromosome 5 with a LOD score above 4. The peak is
located in the SMN gene region as a proof that all affected individuals share the same genotype (SMN1
deletion). No other susceptibility loci reached the significant evidence for linkage. In addition, suggestive
evidence of linkage was detected on chromosomes 1, 3, 8 and 9 with a LOD score above 2.

RESULTS 155
5.4.3. Parametric linkage data interpretation
Because the non-parametric analysis includes information only from affected individuals, its power to
detect linkage is expected to be lower than the power of parametric approaches that use information from
all available relatives (Lee et al. 2000). Therefore we carried out the parametric linkage analysis under the
assumption of heterogeneity. Under the assumption that the modifying gene is present in the unaffected
or less affected sibs and is inherited in a recessive mod three regions (on chromosome 3, 7 and 16,
respectively) were found as susceptibility regions. None of the regions detected by this assumption
reached a significant LOD score of 3 (Fig. 33 A).
Under the assumption that the modifier gene is inherited in a dominant mod, three loci were detected: the
highest on chromosome 7, followed by a lower peak located on chromosomes 22 (Fig. 33 B). Again no
significant LOD score of 3 was reached by any of the loci. By various programs Allegro, GENEHUNTER
and MODscore and by varying some of the parameters the same region from chromosome 22 was
obtained. A summary of parametric linkage analysis for regions detected on chromosomes 3, 7, 16 and 22
is shown in table 27. Interestingly, the same region on chromosome 7 was detected as suggestive region
in both assumptions with a LOD score around 1.5. The displayed suggestive regions are summarized in
table T6 that is contained in the attached CD-ROM.
Fig. 33 Parametric analysis under the assumption of recessive (A) or dominant (B) mod of
inheritance using ALLEGRO software. The highest pick under recessive mode of inheritance was
located on chromosome 3 and reached a LOD score of 1.67 (A). The highest pick under dominant
mod of inheritance reached a LOD score of 1.69 on chromosome 7 (B).

RESULTS 156
Table 27 Susceptibility regions on chromosomes 3, 7, 16 and 22 detected by parametric linkage
analysis.
Mode of
inheritance
LOD
score
Chromosome % of the families that
contributed to the
LOD score
Region
(in Mb)
Limiting SNPs
(from-to)
Recessive 1.67 3q 0.7 12 rs951300-rs1874952
1.38 16p 0.54 8 rs2077685-rs1366076
Dominant 1.69 7p 0.50 3.8 rs1316623-rs31032848
1.09 22q 0.48 2.3 rs4437069-rs2340603
5.4.4. Gene organization into categories according to their molecular function
The purpose for the genome-scan analysis was to detect loci that influence clinical features of SMA
disease. A linkage to the regions that contain putative modifier genes of the SMA disorder was expected
to give us one or more modifier genes.
Fig. 34 Percentage of genes grouped according to their annotation as defined by Gene Ontology
(Ashburner et al. 2000). The percent of known genes is shown for each group. The insert (pie
chart) shows that 37 % of the identified genes by genome scan analysis do not have a known
molecular function.

RESULTS 157
The design included a distinction between unaffected/less affected phenotype and affected/more affected
phenotype. As shown in table T2 in appendix, 11 families comprise discordant unaffected vs. affected sibs
and 31 families comprise discordant less affected vs. more affected sibs. The genes were grouped
according to their annotations as defined by Gene Ontology. Gene Ontology (Ashburner et al. 2000)
represents a controlled vocabulary to described genes and gene products attributies in an organism
(http://www.geneontology.org). The three organizing principles of Gene Ontology are molecular function,
biological process and cellular component. The genes found in all four suggestive loci were grouped
according to their corresponding molecular function (Fig. 34).
Most of the genes were found to be involved in transcription regulation (7 %), DNA binding (8 %), and
either to bind or to function as receptors (9 %). Twenty percent of the genes were grouped as “Others”
when small group sizes or single cases were annotated. A high percentage of genes had unknown
function or the product was hypothetical (37 %). These results suggest that the proteins involved in these
pathways pathways that act in signalling and/or DNA regulation/transcription might be critical in SMA
development and progression.
Signal transduction at the cellular level refers to the movement of signals from outside the cell to inside.
The movement of signals can be simple, like that associated with receptor molecules of the acetylcholine
class: receptors that constitute channels which, upon ligand interaction, allow signals to be passed in the
form of small ion movement, either into or out of the cell. These ion movements result in changes in the
electrical potential of the cells that, in turn, propagates the signal along the cell. More complex signal
transduction involves the coupling of ligand-receptor interactions to many intracellular events. These
events include phosphorylations by tyrosine kinases and/or serine/threonine kinases. Protein
phosphorylations change enzyme activities and protein conformations. The eventual outcome is an
alteration in cellular activity and changes in the program of genes expressed within the responding cells.

DISCUSSION 158
6. DISCUSSION
Spinal muscular atrophy (SMA) is an autosomal recessive neuromuscular disorder that results in the loss
of motor neurons in the spinal cord. The genomic region containing the defective gene is located in 5q13
and is particularly instable and prone to large-scale deletions. The presence of phenotypic discordance in
SMA families provides the unique chance to identify the highly complex regulation of SMN protein and to
identify additional factors able to influence the SMA phenotype, except for SMN2 gene.
Using a combination of candidate gene approach, microarray and genome-wide scan analyses, the
present study revealed for the first time the evidence that at both molecular and transcriptional levels,
SMA discordant sibs present a number of genes differentially expressed/regulated that are likely to act as
SMA modifier genes. Together, these three approaches were chosen in order to maximize the chance to
find potential modifiers of the spinal muscular atrophy phenotype.
6.1. ZNF265, hnRNP-R and HDAC6 are not responsible for the phenotypic
variability of the SMA discordant sibs
The candidate gene approach was performed in hope that any SMN-interacting protein might modulate
SMN transcription/translation and functions as potential modifier of the SMA discordant phenotypes. It
was therefore obvious to ask whether proteins that either, interact, associate or are involved in the same
pathway with SMN influence the variability of the SMA phenotype of the discordant sibs. ZNF265, hnRNP-
R and HDAC6 were checked either for mutations or expression differences in SMA discordant sibs.
ZNF265 co-localizes with SMN in the nucleus, with the SR protein SC35, snRNP protein antigen Sm
(Adams et al. 2001), YY1 and p300 (Adams et al. 2001), both of which have been shown to co-localize
within active transcriptional compartments and, in the case of p300, with RNA polymerase II (Bannister
and Kouzarides 1996; Ogryzko et al. 1996; von Mikecz et al. 2000; Yang et al. 1996). These co-
localizations are consistent with a role of ZNF265 in transcription and/or splicing. In vitro splicing reactions
showed that ZNF265 is immunoprecipitated in a complex that includes spliced mRNA (Adams et al. 2001).
This result indicated that ZNF265 binds directly or indirectly to mRNA, but much less to pre-mRNA.
Overexpression of ZNF265 resulted in exclusion of exons 2 and 3 from the Tra2-β1 pre-mRNA, which led
to an increase in the production of the β3 alternatively spliced isoform (Adams et al. 2001). Taken
together, it was obvious to ask whether ZNF265 might influence the variability of the SMA phenotype,
since localizes with SMN and influences the alternative splicing of hTra2-β1, the splicing factor
responsible for the up-regulation of full-length transcripts encoded by SMN2 gene.
The analysis of ZNF265 gene in 30 sibs belonging to 12 SMA discordant families by sequencing the
complete coding region revealed neither a mutation nor a polymorphism within the coding region or exon-
intron boundaries. It has been concluded therefore that the intrafamilial phenotypic variability in SMA
discordant families is not caused by mutations/polymorphisms within ZNF265 gene.
hnRNP-R is mainly expressed in motor axons and at much lower degree in sensory axons. Highest

DISCUSSION 159
expression levels of hnRNP-R during development of the spinal cord can be found during late
embryogenesis around E19 (Rossoll et al. 2002). The reduction of hnRNP-R level after birth apparently is
due to post-transcriptional and/or post-translational mechanisms as previously observed for Gemin 2
(Jablonka et al. 2001; Wang and Dreyfuss 2001a). hnRNP-R co-localizes with SMN in the cytoplasm of
the motor neurons including the axons. Thus it is unlikely that hnRNP-R participates in specific functions
of SMN complexes such as pre-mRNA splicing and regeneration of the spliceosomal complexes
(Pellizzoni et al. 1999). hnRNP-R specifically binds mRNAs, being involved in mRNA processing including
editing, in mRNA transport and finally acts as a regulator, which modify binding to ribosomes and RNA
translation (Blanc et al. 2001; Grosset et al. 2000; Mizutani et al. 2000). Such functions appear highly
important for neurons with long processes, in particular motor neurons in which specific mRNAs have to
be transported over long distances. Because hnRNP-R and SMN are closely interacting proteins, part of
the same cellular protein complex, the same pathway and exhibit the same cellular location in motor
neurons, hnRNP-R was a good candidate as potential modifier in SMA discordant families.
In order to test whether hnRNP-R might act as modifying factor in SMA, five SMA discordant families were
tested for SNPs association with SMA/unaffected phenotype. No nucleotide variance was found within the
hnRNP-R gene coding region but two SNPs located in the intronic region were selected for association
studies in all five SMA discordant families: rs2842604 (A/C) and rs911927 (C/G). The nucleotide variants
were checked by sequencing and no association between a certain allele and SMA phenotype was found.
Additionally, hnRNP-R gene was checked at transcription level to verify whether any difference between
discordant sibs at RNA level could be observed and again no difference at hnRNP-R transcript levels and
was observed. Therefore, and hnRNP-R, as ZNF265, was excluded to act as potential modifier in SMA
discordant families.
HDAC6 is expressed in several tissues including the testis, liver and brain (Grozinger et al. 1999; Verdel
and Khochbin 1999). It was later shown, however, that HDAC6 enhances cell motility through the
deacetylation of α-tubulin, indicating that HDAC6 is related to cell migration rather than transcriptional
regulation (Haggarty et al. 2003; Hubbert et al. 2002; Palazzo et al. 2003). In addition, a recent report
showed that HDAC6 is also related to the transported of misfolded protein in the proteasome system
(Kawaguchi et al. 2003). Because SMN protein was found to be involved in gene repression (Zou et al.
2004) via interaction with HDAC proteins, HDAC6 gene (besides, located on chromosome X) was chosen
as candidate gene as potential modifier in SMA model.
Therefore, two SNPs located in the coding region of HDAC6 gene were found interesting since both of
them cause an amino acid exchange at protein level. One SNP, rs146379 causes a leucine to proline
exchange at position 700; the other one, rs1127346 causes a threonine to isoleucine substitution at
position 994. Both SNPs were not informative since all individuals (both unaffected and affected) were
carrying T allele for rs1467379 and for C allele for rs1127346. Therefore HDAC6 gene was excluded as
well to function as potential factor able to modify the SMA phenotype.
Taken together, these experiments supported the idea that other molecular mechanisms must be
responsible for the intrafamilial phenotypic discrepancies in SMA discordant families, mechanisms hard to

DISCUSSION 160
be detected by candidate gene approach. A number of proteins were already identified to interact either
directly or indirectly with SMN (see table 1). A part of them have been already analyzed for a potential
modifying effect on SMA discordant phenotype. Gemin 2, Gemin 3, p80 coilin, ZPR1, hnRNP-Q, FUSE
binding protein, profilin 2 a/b, hnRNP-G, RHA and p53 were shown to have no influence on SMA
phenotype (Helmken et al. 2003; Helmken et al. 2000). Furthermore, hTra2-β1, the splicing factor
responsible for up-regulation of full-length SMN2 transcript (Hofmann et al. 2000), failed as well to show
any difference at both DNA and RNA level in SMA discordant families (Helmken and Wirth 2000).
Therefore, a differential gene expression profiling in SMA discordant siblings was the best option. The
microarray technology provides the insight into temporal changes that occur in cells, and into the
molecular differences between unaffected and affected SMA discordant siblings.
6.2. T-plastin, a novel candidate gene detected by expression profiling analysis
cDNA microarray is a potent powerful tool to monitor global transcription profile of hundreds to tens of
thousand of genes at once (Alizadeh and Staudt 2000; Golub et al. 1999). To more closely define and
elucidate the mechanism(s) leading to protection against SMA phenotype in vivo, the gene expression
profile of SMA discordant sibs was examined by Affymetrix oligonucleotide arrays. This study provides for
the first time a detailed insight into a complex set of in vivo differences in SMA discordant phenotypes.
Using cultured lymphoblastoid cell lines of unaffected vs. affected SMN1-deleted individuals, 286 out of
22,000 probe sets were differentially regulated in SMA discordant sibs (tables T3 and T4 that are
contained in attached CD-ROM). Identification of transcriptional up- or down-regulated gene classes might
facilitate the understanding of molecular mechanisms underlying SMN biological functions.
Total RNA isolated from EBV-transformed lymphoblastoid cell cultures from SMA discordant family #482,
two type I and two type III SMA patients was used to hybridize HG-U133A Affymetrix chip to detect
transcripts differentially expressed in asymptomatic vs. symptomatic sibs. The two types of SMA patients
(type I and type III) were used under the assumption that only the transcripts differentially expressed due
to the modifier gene and not due to the lack of SMN protein would be detected. The data from unaffected
siblings were compared with the data from affected sibs and pools of transcripts up- and down-regulated
in unaffected than affected sibs were detected. To exclude all the transcripts co-regulated by SMN1
deletion, these transcripts pools were compared with the transcripts found to be differentially expressed in
the two SMA types used as controls. Because we assumed that the modifying factor(s) should be
expressed/over-expressed in asymptomatic sibs protecting them in this way to develop SMA, the up-
regulated genes were the central issue of expression profiling analysis. The most highly represented
genes in up-regulated transcripts group are involved in metal ion binding or acts as receptors or enzymes
(Fig. 9 B). It is notable that a large number of proteins also play a role in DNA binding and nuclei acids
binding (Fig. 9 B). It is important to point out that these expression differences were identified in the RNA
samples isolated from EBV-transformed lymphoblastoid cell lines rather than motor neurons, the cell type
DISCUSSION 161
affected by the loss/lower amount of the SMN protein. Therefore, these differences in expression between
SMA discordant sibs may reflect only in part the transcripts modulated by the modifier(s).
Therefore, for the confirmation analysis using RT-PCR, the six candidate genes (T-plastin, SEPTIN 2,
NR1I3, CD24, TNFSF14 and PLOD 2) were selected based on the fold difference in gene expression
profiling. Only two candidates (T-plastin and NR1I3) (Fig. 11 and 12) confirmed the Affymetrix based
results. The two candidates were found to be expressed/overexpressed in all unaffected individuals from 5
SMA discordant families. For NR1I3, an up-regulation in asymptomatic vs. symptomatic sibs was found
only in three SMA discordant families. Because it was hard to connect this gene to SMA pathology and
development (see 5.2.5. Description of NR1I3 candidate), we focus on the remaining candidate. RT-PCR
and Western blot studies showed that T-plastin is consistently up-regulated in unaffected SMN1-deleted
sibs (Fig. 10, 11 and 16). This protein has not been previously associated with SMA. The high levels of
expression for T-plastin in fresh blood (Fig. 15), and perhaps in the motor neurons of the unaffected
SMN1-deleted sibs, suggested a possible role for this protein in maturation of motor neurons. T-plastin
was found to be expressed in all unaffected individuals in SMA discordant families, except for family #800,
where both unaffected and affected sibs showed its expression (see 6.3 T-plastin is expressed in all
unaffected sibs that carry SMN1 deletion/mutation and in 6.5 % of the control population).
This approach revealed for the first time the up-regulation of a cytoskeletal protein, namely T-plastin,
implying that this pathway is likely to be modified in unaffected sibs SMN1-deleted. Another cytoskeletal
protein, SEPTIN 2, was found also to be up-regulated 3-fold but the different expression could not be
confirmed by RT-PCR (Fig. 10).
Plastins are actin-bundling proteins highly conserved from yeast to humans (Shirayama and Numata
2003; Watanabe et al. 2000; Wu et al. 2001). T-plastin contributes to protrusive force generation in two
ways – by crosslink formation and by filament stabilization (Giganti et al. 2005). This is in agreement with
the observation that overexpression of this protein in cultured epithelial cells can cause the elongation of
microvilli (Arpin et al. 1994). In line with a role in the biogenesis of membrane protrusions, T-plastin
associates with the developing actin cytoskeleton of embryonic intestinal microvilli (Chafel et al. 1995) and
stereocilia of the inner ear (Daudet and Lebart 2002). T-plastin might control actin turnover and the length
of the actin filaments in these structures, which is crucial for their biological function (Schneider et al.
2002). T-plastin is associated not only with the F-actin bundle of epithelial cell microvilli but also with the
leading edge of migrating fibroblasts (Arpin et al. 1994), which contains a branched network of filaments
(Svitkina and Borisy 1999) that this protein might stabilize. In line with this, yeast plastin is required for the
stabilization of Arp2/3-dependent branched network of filaments in actin patches (Young et al. 2004).
Taken together, these observations suggest that T-plastin causes the reorganization and elongation of an
actin structure initiated by the WASP-Arp2/3 complex polymerization unit, and concomitantly increases
actin-based force (Giganti et al. 2005). This complex has a crucial role in the formation of branched-actin-
filament networks during diverse processes ranging from cell motility to endocytosis (Goley et al. 2006).
The transformation of cytoplasm from a liquid to a solid was observed to be tightly associated with the
cells’ ability to move, and this sol-to-gel transition is now known to be caused by changes in the state of

DISCUSSION 162
polymerization and organization of the actin protein (Stossel 1994). Actin is found only in eukaryotes. It
comprises a highly conserved family of proteins, that fall into three broad classes: α-, β- and γ-isoforms
(dos Remedios et al. 2003). Actin binds a substantial number of proteins, collectively called actin binding
proteins (ABPs) (Pollard and Cooper 1986). At least twelve ABPs are membrane-associated proteins, and
another nine are membrane receptors or ion transporters. Thirteen ABPs crosslink actin filaments,
whereas others enable filaments to interact with other elements of the cytoskeleton. Actin also binds more
then thirty other ligands including drugs and toxins (dos Remedios and Thomas 2001). Classification of
these ABPs can be reduced to monomer-binding proteins, filament-depolymerizing proteins, filament end-
binding proteins, filament severing proteins, crosslinking proteins, stabilizing proteins and motor proteins
(dos Remedios et al. 2003). The actin crosslinking proteins direct the formation of distinct F-actin
assemblies and integrate the actin complexes into overall cellular physiology through their responsiveness
to signals such as calcium fluxes and phosphorylation events (Matsudaira 1994).
6.3. T-plastin is expressed in all unaffected sibs that carry SMN1 deletion/mutation
and in 6.5 % of the control population
T-plastin is normally absent in hematological cell types but widely distributed at low levels in other tissue
types and nonhematopoietic malignancies (Lin et al. 1993b). Among all tissues/cells surveyed, T-plastin
was shown to be absent from all hematopoietic cell types or whole blood studied and from malignant B-
cell and T-cell lines studied (Lin et al. 1999). We determined that the difference between the unaffected
and affected sibs is demonstrated directly from unfractionated whole blood. Western blot analysis on
protein isolated from peripheral blood from one unaffected SMN1-deleted individual (#783) that showed T-
plastin expression in the EBV-transformed lymphoblastoid cells (EBV T36/91) showed that T-plastin
protein can be readily detected from the whole blood (Fig. 15). This observation in lymphocytes cells
isolated from fresh blood demonstrated that T-plastin expression is not restricted to solid tissues and is
expressed among the hematopietic cell types in unaffected sibs belonging to SMA discordant families. In
the same time it has been excluded any activation mechanism during the EBV transformation. The
significance of T-plastin protein in hematopietic cells in unaffected, healthy sibs remains to be determined
and points out to a unique mechanism that might activate T-plastin gene in leukocytes. This mechanism
behind T-plastin activation in fresh blood in unaffected sibs is unknown and requires further investigations.
Detection of T-plastin expression at both RNA and protein level in unaffected individuals that carry
homozygous SMN1 deletion revealed that T-plastin expression might be a rare event that happen in
human population. We demonstrated that this expression pattern is unique for SMA discordant families,
as long as all unaffected sibs analyzed for T-plastin expression showed its expression by both RT-PCR
and Western blot. In the control population, T-plastin was expressed in 3/46 (6.5%). In classical type I, II
and III SMA patients, T-plastin was highly expressed in 5.9 % of the SMA population with SMN1 deletion
or mutation, and in 20.8 % medium or weak expressed. For the SMA individuals that carry neither deletion
nor mutation of SMN1 gene, T-plastin was expressed in 8 % of the population. This study revealed for the

DISCUSSION 163
first time the evidence that T-plastin expression in fresh blood is a rare event that occurs in 6.5 % of the
control population. Moreover, the expression of T-plastin itself in leukocytes is not enough to protect the
individuals to develop SMA. Additional factors that modulate T-plastin expression function or localization
may be important. This result explains, at least in part, the case of family #800 where both unaffected and
affected sibs express T-plastin, but one is protected to develop SMA. The LN 421 individual resembles the
case of the classical SMA patients that express T-plastin by an unidentified mechanism, but this is not the
complete background to drive to a protected phenotype. The factor(s) responsible for this unique gene
regulation in both SMA discordant families and the control population required further investigations.
6.4. T-plastin is activated by a trans-acting factor
To answer the question what might be the reason for differentially expression of T-plastin gene in
discordant SMA sibs, the complete coding region and the cis-regulatory elements were checked by
sequencing in the first step. Because no mutation or nucleotide variation could be found in any of the
analyzed region, the activation of T-plastin in both lymphocytes from fresh blood and EBV-transformed
lymphoblastoid cell lines in asymptomatic sibs was assessed by epigenetic changes in the CpG island
region described by Lin et al. (Lin et al. 1999). DNA methylation is a well-recognized epigenetic modifier in
the control of gene expression.
In this study the pyrosequencing method was used to determine the methylation profile of T-plastin CpG
island. Initial experiments demonstrated that the pyrosequencing method gives accurate and reproducible
estimates of methylated cytosine content of one to six CpGs simultaneously (Colella et al. 2003; Tost et
al. 2003; Uhlmann et al. 2002). The profile of CpG island methylation was assessed in EBV-transformed
lymphoblastoid cell lines belonging to five SMA discordant families, eight T-plastin expressing and eight T-
plastin non-expressing controls. Comparison between the two types of controls, expressing or not T-
plastin suggested no correlation between methylation and T-plastin expression (Fig. 28 A). The T-plastin
CpG island methylation has been investigated and reported in the literature by Lin and colleagues (Lin et
al. 1999) and are similar with our data. However, a comparison between SMA discordant sibs was
performed in hope to explain the activation mechanism in asymptomatic siblings and again no difference
in methylation level was detected (Fig. 28 B).
An enhancer was mapped to within a 20 bp fragment, approximately 500 bp upstream of the basal
promoter (Lin et al. 1999). Therefore, we investigated whether T-plastin enhancer binding might be
occupied in EBV-transformed lymphoblastoid cell lines derived from SMA discordant families by in vivo
footprinting approach using dimethylsulphate (DMS) treatment and ligation-mediated PCR (LM-PCR).
Preliminary results indicate that the enhancer might be occupied on the active X chromosome (Fig. 29).
Comparison between the SMA discordant sibs or between controls that express or not T-plastin suggest a
partially protection within the enhancer region (Fig. 29). This may have resulted from the sites in some
clones not being occupied in case of males, or/and from the inactivated X chromosome in the case of
female individuals. These observations indicate that some proteins might be bound in the T-plastin

DISCUSSION 164
enhancer region but, nevertheless, further investigations are required.
Because not all T-plastin-expressing individuals are protected to develop SMA, 12 SMA discordant
families, 2 control families, 4 classical SMA families together with 7 male SMA patients were used to
determine the haplotypes in T-plastin region responsible for this discrepancy and to answer the question
whether T-plastin expression is induced by a cis-or a trans-acting factor/element. A set of 15 htSNPs
identified in the T-plastin genomic region was used in association studies to correlate a certain haplotype
with T-plastin expression. No correlation was found, suggesting that additional factors may play a role in
regulation of the T-plastin gene expression in both SMA discordant families and control population.
All these observations reported here support the idea that the expression of the T-plastin gene does not
depend on any cis-element described in T-plastin genomic region, and likely a trans-acting element/factor
might be responsible for the unexpected T-plastin expression in fresh blood in healthy SMN1-deleted sibs
and in some 6.5 % of the control population. It can not be ruled out the likely possibility that there are
additional regulatory regions in the T-plastin gene that have been so far not detected.
6.5. T-plastin might play an important role during NMJ formation
T-plastin is an actin crosslinking protein that causes the reorganization and elongation of the actin
structures (Giganti et al. 2005). For the first time, T-plastin was found to be up-regulated in asymptomatic
SMN1-deleted sibs. This study shows that T-plastin and SMN associate together (Fig. 17 A and 20 A) but
do not interact directly (Fig. 17 B). Clinical studies (Crawford and Pardo 1996) coupled with the data from
recently developed animal models (Cifuentes-Diaz et al. 2001; Frugier et al. 2000; Monani et al. 2000)
point toward the possibility that SMA is a developmental defect in neuromuscular interaction (Greensmith
and Vrbova 1997). Consequently, the expression of T-plastin gene was investigated in one SMA fetus and
one adult control using RNA samples isolated from brain, spinal cord and muscle. Interestingly, T-plastin
was found to be expressed at very high levels in spinal cord and high levels in muscles (Fig. 13). These
observations suggest that T-plastin protein might be involved in maturation of NMJ. It has been reported
that the amount of SMN varies during myogenesis in vitro (Burlet et al. 1998) and is down-regulated in
adult compared with fetal skeletal muscle and spinal cord (Williams et al. 1999). The presence of SMN
and T-plastin at high levels in spinal cord and skeletal muscle during embryogenesis may be crucial
during NMJ maturation. Functional interaction between the motor neuron and its target muscle is critical in
NMJ formation (Fan and Simard 2002). Taken together, these observations provide a strong evidence for
T-plastin involvement during neuronal differentiation and neuromuscular maturation, suggesting that T-
plastin may posses a motor neuron-specific function.
6.6. T-plastin and SMN form a novel axon-specific complex
SMN accumulates in growth-cone-like structures during neuronal differentiation (Fan and Simard 2002).
The presence of SMN in axons and dendrites of nerve cells, at a long distance from the nucleus, indicates

DISCUSSION 165
some additional role for this protein for the characteristic loss of motor neurons in SMA (Sharma et al.
2005).
Rat pheochromacytoma PC12 cells differentiate in the presence of NGF into cells with long neurite
extensions or neuronal processes (Tischler and Greene 1975). Although they are not motor neurons, this
model is an useful in vitro model (Greene and Tischler 1976). SMN was found to be concentrated at the
ends of neuronal processes, the growth cones and at branch points (Jablonka et al. 2001). This study
shows for the first time that T-plastin co-localizes with SMN and F-actin within the cytoplasm and along
the neurite-like extensions, branch points and growth cones (Fig. 21 and 23). This novel association
opens a new view on the role of T-plastin-SMN complex in SMA pathogenesis. It has been reported that a
complex SMN-Gemin 2 present in axons and dendrites is deficient of spliceosomal Sm proteins (Zhang et
al. 2006) suggesting that additional functions except for snRNP biogenesis might be responsible for motor
neuron degeneration in SMA.
Several studies have surveyed the global change of differentially expressed genes in PC12 cells, before
and after NGF treatment (Angelastro et al. 2000; Brown et al. 1999; Lee et al. 2005; Mayumi et al. 1998).
SMN protein level has been already reported to be up-regulated after 24 h NGF stimulation in PC12 cells
(Navascues et al. 2004). Interestingly, T-plastin amount was also found to be up-regulated in differentiated
PC12 cells under NGF stimulation (Fig. 19). Diverse actin binding proteins, such as thymosin β4 and
Arp2/3 have been shown to be induced by NGF in PC12 cells (Angelastro et al. 2000). Arp2 and Arp3
belong to a recently discovered family of proteins that are related to the sequence and structure of actin
(Machesky and May 2001). These two actin-like proteins are assembled into Arp2/3 complex that is
associated with dynamic cortical regions of mammalian cells that are rich in cytoskeletal actin (Cossart
2000). Nucleation of filament assembly by Arp2/3, first observed by Welch et al. (Welch et al. 1997a;
Welch et al. 1997b; Welch et al. 1997c), is unlike any other ABP. Extracellular signals, such as growth
factors are transmitted through G-protein-coupled receptors to Wiskott-Aldrich syndrome protein (WASP),
the neuronal homolog of WASP (N-WASP), or suppressor of cAMP receptor 1 (Scar 1) (dos Remedios et
al. 2003). Activated WASP has sites that bind both an actin monomer and the Arp2/3 complex (Amann
and Pollard 2001). T-plastin modulates actin dynamics and generate force independent of cross-bridge
formation in a WASP-Arp2/3-dependent polymerization system, a mechanism that might be applicable to
other F-actin-stabilizing and/or bundling proteins (Giganti et al. 2005). Because T-plastin does not affect
the polymerization kinetics of the pure actin in vitro (Giganti et al. 2005), it is unlikely that this protein
increases the rate of actin polymerization by keeping Arp2/3-nucleated filaments uncapped or by
nucleating new free barbed ends. T-plastin might act through its stabilizing effect and might influence the
elongation phase of actin filaments nucleated by Arp2/3 or generated by cofilin-mediated severing (Giganti
et al. 2005).
The Rho GTP-binding family proteins are important regulators of cytoskeleton organization (Hall 1998)
and several reports showed a transient up-regulation of Rho mRNA under NGF treatment in PC12 cells
(Lee et al. 2005; Zalcman et al. 1995). Rho GTPases activate WASP/WAVE (WASP family Verprolin-
homologous; WAVE or Scar) proteins that induce actin polymerization via the Arp2/3 complex (Millard et
DISCUSSION 166
al. 2004). The involvement of Rho GTPases in actin cytoskeleton organization has been directly
demonstrated by microinjecting serum-starved Swiss 3T3 fibroblasts with a constitutively activated mutant
RhoA. This treatment led to a dramatic change in the cell shape and stimulated actin polymerization
(Peterson et al. 1990). Subsequent analysis demonstrated that indeed, RhoA and Rac1 control the
formation of distinct actin-containing structures, stress fiber and membrane ruffles, respectively (Ridley
and Hall 1992a, b; Ridley et al. 1992). Several GTPases, including RhoA, RhoB, RhoD and Cdc42 affect
specific steps of vesicle trafficking between different intracellular compartments (Bader et al. 2004; Matas
et al. 2005). The filaments crosslinked by T-plastin are closely bundled because of the proximity of the two
binding domains in its primary amino acid sequence. The redistribution of T-plastin in the presence of
active Cdc24 protein provides a link between the Rho protein and its regulatory function in the remodelling
of the actin cytoskeleton (Dutartre et al. 1996). How Cdc42 might regulate plastin activity in unknown. One
possibility is that Cdc42 transduces a regulatory signal to T-plastin. Another possibility is that Cdc42 might
direct the assembly of docking sites for plastin and thereby might determine the sites where plastin will be
recruited and will generate actin bundles (Dutartre et al. 1996). PI3-kinase activity is required for proper
localization of the Cdc42 at the tips of the growing axons (Schwamborn and Puschel 2004). Therefore,
redistribution of T-plastin under Cdc42 expression/activation into highly dynamic membrane regions is
consistent with the involvement of both proteins in cytoskeletal reorganization in growth cone guidance
and those associated with neuronal migration and polarization of axons and dendrites.
Interestingly, under NGF stimulation, the affinity of T-plastin for SMN protein increases in differentiated
PC12 cells (Fig. 20), suggesting that, the induced activation of Rho kinases by NGF treatment might
increase the ability of T-plastin protein to associate stronger with SMN protein and to participate actively in
the redistribution of SMN to the leading edge of the growing axons. Surprisingly, the affinity of T-plastin
protein for β-actin was not changed during neurite differentiation (Fig. 20), suggesting that this transient
interaction between T-plastin and SMN may be relevant for axonal outgrowth.
A number of ABPs have been reported to localize to the growth cone: ADF/cofilin (Endo et al. 2003;
Meberg 2000), Arp2/3 (Goldberg et al. 2000), filamin (Letourneau and Shattuck 1989), GAP43 (Dent and
Meiri 1992; Frey et al. 2000; He et al. 1997), profilin (Faivre-Sarrailh et al. 1993; Kim et al. 2001; Wills et
al. 1999), etc. SMN co-localizes with profilin II in gems and growth cones of differentiated PC12 cells
(Sharma et al. 2005). Profilin IIa is highly expressed in developing and adult neurons (Lambrechts et al.
2000a; Sharma et al. 2005) and, as a regulator of actin dynamics, it is involved in correct neurite
outgrowth (Da Silva et al. 2003). SMN co-localizes also with GAP43 (a major component of motile growth
cones) in growth cones (Aigner et al. 1995). Taken together, these results suggest that the role of SMN in
neurite outgrowth and axon pathfinding is based on the dynamic actin cytoskeleton.
When a chemoattractant is detected on one side of the growth cone, F-actin-driven protrusion is favoured
on that side of the growth cone (Bentley and O'Connor 1994; Lin et al. 1994a). This preferential protrusion
can take form of filopodia, lamellipodia/ruffles, and intrapodia (Dent and Gertler 2003). Thus, actin
anticapping and leaky capping proteins, such as Ena/VASP proteins and GAP43, respectively, are likely
to play important roles in this initial protrusion phase because these proteins are known to enhance actin

DISCUSSION 167
polymerization (Bear et al. 2002; Dent and Meiri 1998; He et al. 1997; Lanier et al. 1999). These newly
formed protrusions must then be stabilized against retraction. Any F-actin bundling/stabilizing proteins
(such as T-plastin, α-actinin, fascin, filamin) are likely to be essential for the continued protrusion of
filopodia or lamellipodia. The bundled and crosslinked actin filaments must be stabilized through a
mechanism that involves adhesion to substrate (Suter and Forscher 2000). In addition, severing/recycling
proteins such as cofilin and profilin may be activated to keep the level of free G-actin and barbed ends
high for continued polymerization (Endo et al. 2003; Meberg and Bamburg 2000). The interaction of SMN
protein with GAP43 (Aigner and Caroni 1995), T-plastin (Fig. 18, 19 and 22) and profilin (Sharma et al.
2005) suggests that SMN might be involved in directed protrusion, engorgement, and consolidation in
response to any attractive cue. SMN protein together with these three cytoskeletal proteins might play a
key role in the actin polymerization/depolymerization balance across the growth cone over time.
6.7. T-plastin is involved in neurite-like extension formation in differentiated PC12
cells
Understanding the pathway of action of the T-plastin protein in the neuron-like cells is central to define the
possible involvement of this protein in modifying the SMA phenotype in asymptomatic SMN1-deleted sibs.
The T-plastin protein has an essential housekeeping role in almost all cells, except for leukocytes (Lin et
al. 1999).
SMN deficient mouse motor neurons have reduced axon outgrowth, while overexpression of SMN in
PC12 cells leads to longer neurite extension (Rossoll et al. 2003). To assess the effect of T-plastin loss on
SMN localization and on neurite outgrowth, knockdown experiments were performed using antisence
oligos against rat T-plastin in differentiated PC12 cells. It was observed that the localization of SMN at the
growth cone was disturbed, and the length of neurites decreased significantly (Fig. 23, lane 2 and Fig. 24).
Instead, the overexpression of T-plastin protein in differentiated PC12 cells led to an increase in length of
neurite-like extensions up to 10 % compared with the control treated cells (Fig. 23, lane 3; Fig. 24 and Fig.
26 A). Taken together, these results suggest that, indeed, T-plastin plays a role in neurite outgrowth
during axonal differentiation. The increased length of the neurites in PC12 cells overexpressing T-plastin
may figure out how this protein might protect sibs with homozygous SMN1 deletion but overexpressing T-
plastin (Fig. 15 and 16) to develop SMA. One possible scenario is that T-plastin might stabilize the whole
growth cone protein complex and to convert this temporary change into a stable axon shaft. It has been
shown that the growth cone undergoes a systematic maturation that is continuously repeated during
elaboration of the axon (Bray and Chapman 1985). The three stages to form a new axon segment are
termed protrusion, engorgement and consolidation (Goldberg and Burmeister 1986). T-plastin protein as
bundling protein is probably capable to function in all these three steps depending on the internal state of
the growth cone. When SMN protein is present at low/lower levels in unaffected SMN1-deleted sibs, it is
possible that the overexpression of T-plastin might help the growth cone structure to reach its target (the
muscle in case of motor neurons) by its capacity to bundle and stabilize F-actin filaments. This hypothesis

DISCUSSION 168
is based on the observation that in differentiated SMN-depleted PC12 cells, the overexpression of T-
plastin rescued, at least partially, the neurite length (Fig. 23 lane 4; Fig. 24). The effect of T-plastin
loss/overexpression in neuron-like cells suggest that the axon growth, guidance (and perhaps branching)
might be susceptible to cytoskeletal perturbation due to involvement of T-plastin protein on F-actin
filament formation and stabilization.
It is known that SMN has no effect by its own on actin polymerization (Sharma et al. 2005), however when
T-plastin is overexpressed/expressed results in a positive effect of SMN on actin filament formation.
About 50 % of the translational machinery is associated with the cytoskeleton in eukaryotic cells (Hesketh
and Pryme 1991). Ribosomes and RNA are localized in restricted peripheral F-actin-rich domains of the
myelinated axon, called “Periaxoplasmic Ribosomal Plaques'” (PARPs) (Koenig and Martin 1996; Koenig
et al. 2000). Intracellular transport mechanisms are better known now. Specific adaptors proteins have
been identified in yeasts that link molecular motors to mRNA for transporting it to its target location (Long
et al. 2000). β-actin and γ-actin have distinctive distributions in embryonic cortical neurons in culture.
Normally, γ-actin is distributed uniformly throughout the cell body and neurites, but β-actin alone is
distributed along axons and enriched in growth cones and filopodia. Similarly, γ-actin mRNA is restricted
to the cell body, while β-actin mRNA is distributed along immature axons and enriched in growth cones.
Of interest is that the β-actin mRNA is localized in RNP-like granules that are in close proximity to
microtubules along axons, while in growth cones, RNPs co-localize with actin filaments (Bassell et al.
1998). This suggests that actin may be synthesized locally in growth cones where an enrichment of actin
is needed to support actin-based growth cone motility (Sotelo-Silveira et al. 2006). Local synthesis of both
actin and β-tubulin were also identified in axonal fields severed from sympathetic neuron cell bodies (Eng
et al. 1999). More than 20 proteins were identified, consisting of cytoskeletal proteins, heat shock proteins,
ER proteins, metabolic enzymes, antioxidant proteins, and proteins associated with neurodegenerative
diseases.
6.8. Genome-wide scan in SMA discordant families revealed evidence for new
susceptibility loci
Family studies strongly suggest that individual differences in the clinical features of illness are influenced
by familial factors (Cardno et al. 1999a; Cardno et al. 1999b; Cardno et al. 2002; Kendler et al. 1997).
Modifier genes have been most thoroughly studied in “single-gene” disorders such as cystic fibrosis.
Although variation in the CTFR gene is responsible for susceptibility to the disorder, clinical manifestations
have been associated with polymorphisms in other genes, as reviewed by Cutting (Cutting 2005). The
presence of such modifier genes may have several implications. Most importantly, they may lead to the
development of new treatments.
Another goal of the present study was to detect genomic region in which there is excess sharing by
unaffected SMN1-deleted individuals. Several regions yielded linkage analysis, however none of these
were significant. Regions on chromosomes 3q, 7p, 16p and 22q, respectively, are suggestive for linkage.

DISCUSSION 169
The results suggested that there is none major modifier locus but rather several loci that might contain
genes with potential modifying effect on the SMA phenotype. On the other hand, these peaks may reveal
the true location of genetic protecting factors for SMA; certainly, these results suggest that additional
typings are needed in these areas.
Three areas, one on chromosome 16p, one on chromosome 3q and another one on chromosome 22q,
respectively, are interestingly, since contain genes that were previously described to be involved either in
RNA processing or in response to stress, two pathways in which both T-plastin and SMN were reported to
be involved (see below).
On chromosome 16p, the best candidate as putative gene modifier for SMA is represented by A2BP1.
A2BP1 (ataxin-binding protein 1) is predominantly expressed in brain and muscle and co-localizes with
ataxin-2 (ATX2) in the trans-Golgi network (Shibata et al. 2000). A2BP1 has an RNP RNA-binding motif,
and ATX2 also contain two RNA splicing motifs, which are shared with snRNPs (Neuwald and Koonin
1998; Shibata et al. 2000). Interestingly, snRNPs have multiple RNP motifs which are present in A2BP1.
Thus, the complex of ataxin-2 and A2BP1 may be involved in RNA processing (Shibata et al. 2000). If the
RNA-binding domain in both proteins are functional, one possible role of the ataxin-2-A2BP1 complex may
be RNA transport in neurons (Shibata et al. 2000). Surprisingly, an interaction of ataxin-2 with T-plastin
was discovered in mouse brain, linking ataxin-2 to pathways that play a role in actin filament formation
and organization (Ralser et al. 2005b). Interestingly, proteomics-based results showed that T-plastin and
PABP are contained together in a large protein complexes of 216 subunits and 39 subunits mainly
consisting of proteins involved in RNA processing (Blagoev et al. 2003; Ho et al. 2002). This observation
is quite remarkable in the light that ataxin-2 directly interacts with the cytoplasmic PABP (poly-(A)-binding
protein) (Ralser et al. 2005a). In the nucleus, SMN appears to be directly involved in pre-mRNA splicing,
transcription and metabolism of ribosomal RNA (Jones et al. 2001; Pellizzoni et al. 2001c; Pellizzoni et al.
1998). Of special interest was the observation of an activation of genes involved in RNA metabolism in
Smn mutant mice (Olaso et al. 2006). Five percent of the genes regulated in Smn mutant mice were
involved in pre-mRNA splicing, ribosomal RNA processing or RNA decay (Olaso et al. 2006).
On chromosome 3p another gene (eIF2A) was found by the genome-scan analysis that might be
correlated to the response to stress. Stress response is a protective cellular process induced by a variety
of environmental stress including chemical exposure, heat shock and UV irradiation (Hua and Zhou
2004a). Stress granules are phase dense particles that appear in the cytoplasm of plant and animal cells
subjected to environmental stress (Kedersha et al. 1999; Nover et al. 1989). In mammalian cells, the
assembly of stress granules is initiated by phosphorylarion of eukaryotic initiation factor eIF2A (Kedersha
et al. 1999). The proteins found to accumulated in stress granules include the RNA-binding proteins TIA-1
(T-cell internal antigen 1), TIAR (TIA-1 related protein), and PABP, as well as a subset of eIFs, including
eIF2, eIF2B, eIF3, eIF4F and eIF4G (Kedersha and Anderson 2002; Kedersha et al. 2002; Kimball et al.
2003). eIF2A (eukaryotic initiation factor 2A), is a 65-kDa protein that catalyzes the formation of the
puromycin-sensitive 80S preinitiation complex and the poly (U)-directed synthesis of polyphenylalanine at
low Mg2+ concentration (Merrick and Anderson 1975). eIF2A might not function in the initiation of
DISCUSSION 170
translation of bulk mRNA but rather is involved in a small subset of mRNA initiation events (Zoll et al.
2002). These alternative initiation events could include re-initiation, internal initiation, or non-AUG
initiation. The initial stress response is mediated by the RNA-dependent protein kinase (PKR)-like ER
membrane-localized kinase (PERK), which is activated by homeodimerization and autophosphorylation in
response to ER stress (Harding et al. 1999; Liu et al. 2000). PERK activation in turns leads to
phosphorylation of the subset of eIF2A at Ser 51 resulting in transient inhibition of protein synthesis
(Harding et al. 1999). This inhibition of protein synthesis is thought to be important in re-establishing
cellular homeostasis by reducing the load of misfolded proteins (Park et al. 2007). Under conditions of ER
stress, translational attenuation resulting from phosphorylation of eIF2A is considered critical to decrease
the load on newly synthesized protein in the ER as well as to protect cells from potential noxious effects of
accumulated misfolded proteins (Park et al. 2007). This may allow cells to overcome the effects of ER
stress and avoid cell death. SMN co-localizes with TIA-1/R and G3BP2 in SGs (Hua and Zhou 2004a, b).
Several lines of evidence indicate that SMN is important for SG assembly. To form large and smooth
granules, the Tudor domain, as well as exon 6 and 7 of SMN are indispensable (Hua and Zhou 2004b).
Defects of SG formation in SMA fibroblasts, which express lower levels of SMN protein, support the notion
that SMN plays a role in SG formation (Hua and Zhou 2004b).
Stress granules are highly dynamic structures and resemble several nuclear RNA-containing structures
(e.g., speckles, coiled bodies, gems, and nucleoli) (Kedersha et al. 2000), that are sites of active RNA
metabolism (Gall et al. 1999; Mattern et al. 1999; Mintz and Spector 2000; Zeng et al. 1997). Stress
granules may be sites of mRNA triage at which untranslated mRNAs accumulate during stress before
being directed to sites of degradation, reinitiation or repackaging as mRNPs (Kedersha et al. 2000).
T-plastin has been shown to be involved in both pathways described above (RNA metabolism and
response to stress), and might play crucial functions in bringing together proteins involved in various
cellular processes in response to a particular signal. On the other hand, a combination of factors might be
responsible for the higher SMN and co-regulated SMN-interacting proteins as previously shown by
Helmken and co-workers (Helmken et al. 2003). Unknown proteins involved in translational processes are
likely to be involved directly in the protected SMA phenotype, whereas is unclear at this juncture whether
T-plastin is the cause or the result of the modified SMA phenotype. Interestingly, on chromosome 22q, two
enzymes involved in signal transduction (MAPK11 or p38β and MAPK12 or p38γ) were found good
candidates as potential/additional modifiers.
The MAPK pathway is a three layer signalling cascade, in which the MAPK elements (the most
downstream tier) are activated upon tyrosine and threonine phosphorylation within a conserved Thr–Xxx–
Tyr motif in the activation loop of the kinase domain. This phosphorylation is catalyzed by dual-specificity
kinases, MAPK kinases (MAPKK, MEK). MAPKKs are regulated by serine/threonine phosphorylation
within a conserved motif, located in the kinase activation loop, catalyzed by MAPKK kinases (MAPKKK or
MEKK; the most upstream tier). The latter are activated by various upstream activators, including kinases
and small GTP-binding proteins (Katz et al. 2007). The p38-MAPK is another stress-activated MAPK
cascade. p38-MAPK activation is mediated by phosphorylation on a conserved motif that includes a

DISCUSSION 171
glycine residue between the canonical threonine and tyrosine (Katz et al. 2007).
The p38 mitogen-activated protein kinases are activated in response to various extracellular signals in
eukaryotic cells and play a critical role in the cellular responses to these signals. The four mammalian
isoforms (p38α, p38β, p38γ, and p38δ) are coexpressed and coactivated in the same cells. The exact role
of each p38 isoform has not been entirely identified, in part due to the inability to activate each member
individually. Human p38α and p38β are ubiquitously expressed whereas p38γ is mainly expressed in
skeletal muscle (Avitzour et al. 2007).
The candidate modifier genes might influence the severity of SMA phenotype through a variety of
mechanisms. Each candidate gene should be tested simultaneously with all the other potential modifier
genes. Interaction can occur between the candidate genes, for example, when they act in the same
pathway.
6.9. Future directions
Although the absence of the SMN1 gene is responsible for the majority of the SMA cases, the clinical
phenotype in SMA discordant sibs confirms the rare occurrence of asymptomatic persons with SMN1
homozygous deletions.
In order to identify potential phenotypic modifiers, three methods were approached in order to maximize
the chance to detect them. T-plastin gene was identified in this study by microarray technology to be up-
regulated in all unaffected sibs belonging to six SMA discordant families.
It is now required to determine whether the differential expression of T-plastin gene is directly or indirectly
responsible for the modified SMA phenotype. Concomitantly, collaborations together with Christine E.
Beattie from Centre for Molecular Neurobiology, the Ohio State University and with Gary Bassel from
Department of Cell Biology, Atlanta are carrying out. We intend to puzzle out the T-plastin involvement in
vivo by approaching two directions:
I. First, we would like to define the localization of endogenous as well as overexpressed T-plastin in
N2A neuroblastoma cells and primary mouse motor neurons. The effects of T-plastin levels on
axon growth are planned to be checked in differentiated ES cells in motor neurons. It is also
intended to measure the axon length, the growth cone size, as well as the distribution of β-actin in
the distal part and growth cones of motor axons. Furthermore, SMN should be knocked down
using antisence RNA and T-plastin overexpressed by retroviral system in primary motor neuron
derived from mice.
II. Second, we would like to answer the question of whether T-plastin overexpression results in
motor axon defects in zebrafish and whether the overexpression of T-plastin rescues the axon
defects associated with Smn knockdown in an in vivo model. Our study is strongly supported by
the in vivo experiments in zebrafish. The lab of Christine Beattie showed that the motor axons
defects in smn morphants are rescued by overexpression of human T-plastin mRNA. Analysis of
motor axons showed a significant rescue of the aberrant axonal outgrowth in hT-plastin RNA

DISCUSSION 172
injected embryos (p>0.0001) compared to Smn MO alone (Fig. F11 in appendix) suggesting that
T-plastin is also playing an important role in the SMA zebrafish model as well.
The preliminary results are very exciting and the characterization of the T-plastin-SMN complex is in
progress in our lab.
Another goal of our study is to understand the activation mechanism of T-plastin gene in unaffected
SMN1-deleted sibs and in 6.5 % of the control population. The finding of the factor able to govern T-
plastin gene expression should provide an opportunity to discover novel regulatory mechanisms that may
act specifically in motor neurons from asymptomatic sibs with homozygous absence of SMN1 gene, but
differently from that mechanism found in rare cases of classical SMA patients that are not protected by T-
plastin expression itself.
The best candidate genes detected by the genome-wide scan analysis will be further analyzed.
Another in vivo approach on long term is to generate transgenic mice that overexpressed T-plastin
specifically in motor neurons and to cross bred these mice with SMA mice. This model will help us to
better decipher the effects of T-plastin overexpression during neuron differentiation and maturation.
Furthermore, modifier gene studies will lead to a better understanding of SMA pathophysiology and will
provide the possibility of new therapeutic interventions.

SUMMARY 173
7 SUMMARY
Spinal muscular atrophy (SMA) is a common inherited disorder characterized by neurodegeneration of α-
motor neurons. SMA is caused by mutation and/or deletion of the SMN1 gene that encodes the survival of
motor neuron protein (SMN). The severity of SMA is strongly influenced by the SMN2 gene, the highly
homologous copy of SMN1. The more SMN2 copies a patient has, the milder is the SMA phenotype.
Homozygous SMN1 deletion in unaffected persons is a rare event suggesting that the SMA phenotype is
modified by other factors.
Using a combination of candidate gene approach, expression profiling and genome-wide scan, the
present study reveals for the first time the evidence that at both molecular and transcriptional levels, SMA
discordant sibs present a number of genes differentially regulated/expressed that are likely to act as SMA
modifier genes.
By candidate gene approach, ZNF265, hnRNP-R and HDAC6 were excluded to be responsible for the
phenotypic discrepancies between SMA discordant sibs, since no difference at both DNA and RNA level
was detected in any analyzed gene.
The microarray expression analysis of the SMA discordant families revealed for the first time, a transcript
that encodes for a cytoskeletal protein, namely T-plastin, to be the most up-regulated gene in
asymptomatic vs. symptomatic SMN1-deleted sibs. Along with the up-regulation of T-plastin a number of
protein kinases and transcription factors were found slightly up-regulated suggesting that the cytoskeleton
together with signalling molecules might modulate the SMA phenotype. A closer look to a possible
involvement of T-plastin in SMA pathophysiology revealed exciting observations.
First, T-plastin was found to be expressed at high levels in spinal cord and muscle of fetal and adult
tissues by semi-quantitative PCR, an observation that provides a strong evidence for T-plastin implication
in neuronal differentiation and neuromuscular maturation. Moreover, T-plastin associates with SMN as
shown by Co-IP experiments, but this interaction, as demonstrated by in vitro binding assay, is mediated
by another so far unknown protein.
Second, T-plastin and SMN were found by immunofluorescence to co-localize along the axons, at branch
points and at the growth cones in neurite-like extensions in differentiated PC12 cells. Interestingly, the T-
plastin protein amount was found to be up-regulated in differentiated PC12 cells under NGF stimulation,
an observation that might propose a possible function for T-plastin as substrate for signalling molecules.
Moreover, under NGF stimulation, the affinity of T-plastin for SMN increased up to 50% suggesting that a
transient complex might occur during neuronal differentiation that contributes to a specific role during this
biological process.
Third, the effect of T-plastin loss/overexpression in differentiated PC12 cells (cells presenting either
shorter neurites when T-plastin was depleted or longer neurites when T-plastin was overexpressed) hints
to a perturbation in the axon growth, guidance (and perhaps branching) due to the involvement of T-
plastin in F-actin filament formation and stabilization. Interestingly, by in vitro experiments it has been
observed that in differentiated PC12 cells expressing low amount of SMN protein, but overexpressing T-

SUMMARY 174
plastin, the length of the neurites was rescued at least in part by higher T-plastin levels. This suggests that
a higher amount of T-plastin protein might help the growth cone structures to reach their target (the
muscle in case of motor neurons).
While all analyzed unaffected SMN1-deleted sibs expressed T-plastin in both peripheral blood and EBV-
transformed lymphoblastoid cell lines, only 6.5 % of the control population expressed T-plastin. In
classical SMA patients, T-plastin was highly expressed in 5.9 %, medium in 7.4 % and very weak in 13.4
%. Finally, 8 % patients without SMN1 mutations expressed T-plastin. These data suggest that T-plastin
expression in leukocytes happens as a rare event in humans and its expression in blood significantly
correlates with an SMA protection. Nevertheless, not all blood-T-plastin-expressing SMN1-deleted
individuals are SMA protected, which suggest a potential differential regulation in the spinal cord.
The answer to the question by which mechanism T-plastin is expressed in unaffected sibs with
homozygous absence of SMN1 gene or in control population and classical SMA patients, was not found.
No correlation between the T-plastin expression and any mutation or DNA variation in the T-plastin coding
region, promoter, 3’UTR or intron 1 was observed. Moreover, epigenetic analysis of the T-plastin
regulatory region (promoter-first exon-first intron) revealed no differences in DNA modification level. These
observations together with the haplotype analysis of two blocks described within the T-plastin genomic
region in both SMA discordant families and control population, strongly suggest that likely a trans- rather
than a cis-acting factor is responsible for the differential expression between SMA discordant sibs or
between SMA discordant families and control population. In hope to find additional modifying genes or
factors that are able to regulate T-plastin expression, a genome-wide scan analysis was performed in 42
SMA discordant families. Regions on chromosomes 3q, 7p, 16p and 22q, respectively, are suggestive for
linkage and require further investigations, however, none of these reached a significant LOD score.
Taken together, the discovery of the T-plastin protein as a modulator of the SMA phenotype provides the
opportunity to identify novel regulatory mechanisms that may act specifically in motor neurons from
asymptomatic sibs with SMN1 homozygous deletion.

ZUSAMMENFASSUNG 175
8 ZUSAMMENFASSUNG
Die Spinale Muskelatrophie (SMA) ist eine der häufigsten rezessiv erblichen Erkrankungen beim
Menschen, die sich durch Degeneration der α-Motoneuronen im Rückenmark kennzeichnet. SMA wird
durch homozygote Mutationen und/oder Deletionen des SMN1-Gens verursacht, welches für das survival
of motor neuron (SMN) Protein codiert. Der Schweregrad der SMA wird im Wesentlichen durch das
SMN2-Gen beeinflusst, eine hoch homologe Kopie des SMN1-Gens. Je mehr SMN2-Kopien ein Patient
hat, desto milder ist der SMA-Phänotyp. Das Auftreten von homozygoten SMN1-Deletionen bei nicht
betroffenen Personen ist sehr selten und weist auf eine Modifikation des SMA-Phänotyps durch andere
Faktoren hin.
Im Rahmen der Arbeit wurde in phänotypisch diskordanten SMA Familien eine Kombination aus
Kandidatengenstrategie, differentieller Expressionsuntersuchungen und genomweiter Kopplungsanalyse
bei der Suche nach einem SMA-modifizierendn Gen angewandt. Diese Studie liefert den ersten Beweis,
dass in phänotypisch diskordanten SMA Familien eine Reihe von Transkripten unterschiedlich
reguliert/exprimiert werden, die als potentielle SMA-modifizierende Gene in Frage kommen.
In der differentieller Expressionuntersuchung nach Microarray-Analyse zeigte T-Plastin, ein
Zytoskelettprotein, die stärkste Heraufregulation (39-fach) in allen asymptomatischen SMN1-deletierten
Geschwistern im Vergleich zu ihren betroffenen Geschwistern. Zusätzlich war auch eine Anzahl von
Proteinkinasen und Transkriptionsfaktoren verstärkt exprimiert, die gemeinsam darauf hindeuten, dass
das Zytoskelett zusammen mit verschiedenen Signalmolekülen möglicherweise den SMA-Phänotyp
modifizieren. Eine genauere Untersuchung einer möglichen Rolle von T-Plastin in der Pathophysiologie
von SMA führte zu folgenden Ergebnissen:
Erstens, wurde eine starke Expression mittels semi-quantitativer multiplex RT-PCR von T-Plastin im
fetalen und adulten Rückenmark und in Muskeln nachgewiesen, was einen starken Hinweis für eine
Beteiligung bei der neuronalen Differenzierung und der neuromuskulären Reifung darstellt.
Mitttels in vitro Co-Immunpräzipitation wurde gezeigt, dass T-Plastin mit SMN assoziieren kann, wobei es
sich nicht um eine direkte Interaktion handelt, wie es in vitro pull-down Experimente bewiesen. Zweitens,
Studien mittels Konfokaler Immunfluoreszenz-Lasermikroskopie zeigten eine Co-Lokalisation von T-
Plastin und SMN entlang der Axone, an Verzweigungen und an Wachstumskegeln in neuriten-ähnlichen
Ausläufern in differenzierten PC12-Zellen. Interessanterweise wurde eine erhöhte Menge an T-Plastin
Protein während der neuronalen Differenzierung von PC12-Zellen unter Stimulation mit neuronalem
Wachstumsfaktoren (NGF) gemessen, was nahe legt, dass T-Plastin ein mögliches Substrat für
unterschiedliche Signalmoleküle darstellen könnte. Ferner nahm die Affinität von T-Plastin für SMN unter
NGF-Stimulation um 50% zu. Dies läßt vermuten, dass während der neuronalen Differenzierung ein
transienter Komplex auftritt, der zu einer spezifischen Rolle in diesem biologischen Prozeß beiträgt.
Drittens, deuten die Auswirkungen des Verlustes bzw. der Überexpression von T-Plastin in differenzierten
PC12-Zellen (die Zellen zeigten kürzere Neuriten bei T-Plastin Depletion bzw. längere Neuriten bei T-
Plastin Überexpression) auf eine Störung des Wachstums, der Wegfindung und evtl. der Verzweigung von

ZUSAMMENFASSUNG 176
Axonen hin, was durch einen Einfluss von T-Plastin auf die Bildung und Stabilisierung von F-Aktin-
Filamenten erklärt werden könnte. Interessanterweise konnte in in vitro Experimenten beobachtet werden,
dass in differenzierten PC12-Zellen mit niedriger SMN-Expression aber einer Überexpression von T-
Plastin die Länge der Neuriten zumindest zum Teil durch höhere T-Plastin-Konzentrationen
wiederhergestellt werden konnte. Dies legt nahe, dass eine größere Menge des T-Plastin Proteins
möglicherweise den Wachstumskegeln dabei helfen kann, ihr Ziel zu erreichen (den Muskel im Falle von
Motoneuronen).
Während alle asymptomatischen SMN1-deletierten Geschwister T-Plastin sowohl im nativen Blut als auch
in Epstein-Barr-Virus (EBV) transformierten lymphoblastoiden Zellininien exprimierten, zeigten nur 6,5 %
der Kontrollen eine Expression im Blut. In klassischen SMA-Patienten fand sich eine starke Expression
des T-Plastins in 5,9 %, eine mittlere in 7,4 % und eine sehr schwache in 13,4 %. Dies deutet darauf hin,
dass die Expression von T-Plastin im Blut hochsignifikant mit einer SMA-Protektion korreliert. Da
allerdings nicht alle SMN1-deletieten Personen einen SMA-Schutz entwickeln, könnte dies auf eine im
Rückenmark unterschiedliche Regulation hinweisen. Die Antwort auf welche Mechanismen für die
Expression von T-Plastin in allen asymptomatischen Geschwistern, wenigen Kontrollen und SMA-
Patienten verantwortlich sind, konnte nicht abschließend beantwortet werden.
Es wurde weder eine Mutation oder DNA-Variation im codierenden Bereich, noch in der 3’ nicht-
translatierten Region, im Promotor oder Intron 1 des Genes identifiziert. Außerdem, haben auch
epigenetische Studien der CpG-reichen Promotorregion keine Unterschiede aufgedeckt.
Letztlich wurde eine umfangreiche Analyse der tagging SNPs (single nucleotide polymorphisms) der
Haplotypblöcke, die das T-Plastin auf genomischer Ebene abdecken in phänotypisch-diskordanten SMA-
Familien und Kontrollen durchgeführt und keine Assoziation mit der Expression des T-Plastin Gens
gefunden. Insgesamt weisen diese Ergebnisse auf eine trans-aktivierende Regulation der Expression von
T-Plastin im Blut hin.
Um diesen Faktor zu identifizieren, wurde eine genomweite Kopplungsanalyse in 42 phänotypisch
diskordanten SMA-Familien durchgeführt. Mehrere Regionen auf den Chromosomen 3q, 7p, 16p und 22q
zeigten eine mögliche Kopplung und müssen durch weitere Untersuchungen bestätigt werden.
Zusammenfassend stellt die Entdeckung des T-Plastin Proteins als Modulator des SMA-Phänotyps neue
Wege dar, regulatorische Mechanismen zu identifizieren, die spezifisch in Motoneuronen von
asymptomatischen Geschwistern mit SMN1-Deletion auftreten und von der Erkrankung schützen.

PUBLICATIONS, LECTURES AND POSTER CONTRIBUTIONS 177
9. PUBLICATIONS, LECTURES AND POSTER CONTRIBUTIONS 9.1. ORIGINAL PUBLICATIONS Helmken C., Hofmann Y., Schoenen F., Oprea G., Raschke H., Rudnik-Schoneborn S., Zerres K., Wirth
B. (2003) Evidence for a modifying pathway in SMA discordant families: reduced SMN level decreases the
amount of its interacting partners and Htra2-beta1. Hum Gen.114:11-21
Oprea G. E., McWhorter M., Rossoll W., Kröber S., Debey S., Schulze J. L., Wienker T. F., Beattie C.,
Bassell G., and Wirth B. (2007) Plastin-3 protects individuals with homozygous SMN1 deletions from
developing spinal muscular atrophy; Manuscript in preparation.
9.2. PRINTED LECTURE CONTRIBUTIONS
Oprea G., Wirth B. (2005) Identification of Potential Gene Modifiers in SMA Discordant Families. Medgen
17:51 (W08 03) (The 16th Annual Meeting of the German Society of Human Genetics, Neurogenetics
Session, Halle, Germany)
Helmken C., Bordeianu G., Hofmann Y., Schoenen F., Raschke H., Rudnik-Schoenenborn S., Zerres K.,
Wirth B. (2003) First Evidence for a Modifying Pathway in SMA Discordant Families. SMN regulates its
Interacting Partners and its own Splicing Factor hTra2β. Medgen. 15:276 (W4 01) (The 14th Annual
Meeting of the German Society of Human Genetics, Neurogenetics Session, Marburg, Germany)
9.3. PRINTED POSTER CONTRIBUTIONS
Oprea G., Wirth B. (2006) Identification of Potential Gene Modifiers in SMA Discordant Families. Medgen.
18:114 (P296) (The 17th Annual Meeting of the German Society of Human Genetics, Heidelberg,
Germany

REFERENCES 178
10. REFERENCES Abecasis GR, Cherny SS, Cookson WO, Cardon LR (2002) Merlin--rapid analysis of dense genetic maps
using sparse gene flow trees. Nat Genet 30: 97-101 Abreu PC, Greenberg DA, Hodge SE (1999) Direct power comparisons between simple LOD scores and
NPL scores for linkage analysis in complex diseases. Am J Hum Genet 65: 847-57 Adam T, Arpin M, Prevost MC, Gounon P, Sansonetti PJ (1995) Cytoskeletal rearrangements and the
functional role of T-plastin during entry of Shigella flexneri into HeLa cells. J Cell Biol 129: 367-81 Adams AE, Botstein D, Drubin DG (1989) A yeast actin-binding protein is encoded by SAC6, a gene found
by suppression of an actin mutation. Science 243: 231-3 Adams AE, Botstein D, Drubin DG (1991) Requirement of yeast fimbrin for actin organization and
morphogenesis in vivo. Nature 354: 404-8 Adams AE, Johnson DI, Longnecker RM, Sloat BF, Pringle JR (1990) CDC42 and CDC43, two additional
genes involved in budding and the establishment of cell polarity in the yeast Saccharomyces cerevisiae. J Cell Biol 111: 131-42
Adams AE, Shen W, Lin CS, Leavitt J, Matsudaira P (1995) Isoform-specific complementation of the yeast sac6 null mutation by human fimbrin. Mol Cell Biol 15: 69-75
Adams DJ, van der Weyden L, Kovacic A, Lovicu FJ, Copeland NG, Gilbert DJ, Jenkins NA, Ioannou PA, Morris BJ (2000) Chromosome localization and characterization of the mouse and human zinc finger protein 265 gene. Cytogenet Cell Genet 88: 68-73
Adams DJ, van der Weyden L, Mayeda A, Stamm S, Morris BJ, Rasko JE (2001) ZNF265--a novel spliceosomal protein able to induce alternative splicing. J Cell Biol 154: 25-32
Aigner L, Arber S, Kapfhammer JP, Laux T, Schneider C, Botteri F, Brenner HR, Caroni P (1995) Overexpression of the neural growth-associated protein GAP-43 induces nerve sprouting in the adult nervous system of transgenic mice. Cell 83: 269-78
Aigner L, Caroni P (1995) Absence of persistent spreading, branching, and adhesion in GAP-43-depleted growth cones. J Cell Biol 128: 647-60
Alizadeh AA, Staudt LM (2000) Genomic-scale gene expression profiling of normal and malignant immune cells. Curr Opin Immunol 12: 219-25
Almond BA, Hadba AR, Freeman ST, Cuevas BJ, York AM, Detrisac CJ, Goldberg EP (2003) Efficacy of mitoxantrone-loaded albumin microspheres for intratumoral chemotherapy of breast cancer. J Control Release 91: 147-55
Amann KJ, Pollard TD (2001) The Arp2/3 complex nucleates actin filament branches from the sides of pre-existing filaments. Nat Cell Biol 3: 306-10
Anderson KN, Baban D, Oliver PL, Potter A, Davies KE (2004) Expression profiling in spinal muscular atrophy reveals an RNA binding protein deficit. Neuromuscul Disord 14: 711-22
Anderson P, Kedersha N (2002) Visibly stressed: the role of eIF2, TIA-1, and stress granules in protein translation. Cell Stress Chaperones 7: 213-21
Anderson P, Kedersha N (2006) RNA granules. J Cell Biol 172: 803-8 Andrade LE, Chan EK, Raska I, Peebles CL, Roos G, Tan EM (1991) Human autoantibody to a novel
protein of the nuclear coiled body: immunological characterization and cDNA cloning of p80-coilin. J Exp Med 173: 1407-19
Andreadis A (2005) Tau gene alternative splicing: expression patterns, regulation and modulation of function in normal brain and neurodegenerative diseases. Biochim Biophys Acta 1739: 91-103
Andreassi C, Angelozzi C, Tiziano FD, Vitali T, De Vincenzi E, Boninsegna A, Villanova M, Bertini E, Pini A, Neri G, Brahe C (2004) Phenylbutyrate increases SMN expression in vitro: relevance for treatment of spinal muscular atrophy. Eur J Hum Genet 12: 59-65
Andreassi C, Jarecki J, Zhou J, Coovert DD, Monani UR, Chen X, Whitney M, Pollok B, Zhang M, Androphy E, Burghes AH (2001) Aclarubicin treatment restores SMN levels to cells derived from type I spinal muscular atrophy patients. Hum Mol Genet 10: 2841-9
Angelastro JM, Klimaschewski L, Tang S, Vitolo OV, Weissman TA, Donlin LT, Shelanski ML, Greene LA (2000) Identification of diverse nerve growth factor-regulated genes by serial analysis of gene expression (SAGE) profiling. Proc Natl Acad Sci U S A 97: 10424-9
Arpin M, Friederich E, Algrain M, Vernel F, Louvard D (1994) Functional differences between L- and T-plastin isoforms. J Cell Biol 127: 1995-2008

REFERENCES 179
Ashburner M, Ball CA, Blake JA, Botstein D, Butler H, Cherry JM, Davis AP, Dolinski K, Dwight SS, Eppig JT, Harris MA, Hill DP, Issel-Tarver L, Kasarskis A, Lewis S, Matese JC, Richardson JE, Ringwald M, Rubin GM, Sherlock G (2000) Gene ontology: tool for the unification of biology. The Gene Ontology Consortium. Nat Genet 25: 25-9
Avitzour M, Diskin R, Raboy B, Askari N, Engelberg D, Livnah O (2007) Intrinsically active variants of all human p38 isoforms. Febs J 274: 963-75
Ayer DE, Lawrence QA, Eisenman RN (1995) Mad-Max transcriptional repression is mediated by ternary complex formation with mammalian homologs of yeast repressor Sin3. Cell 80: 767-76
Azzouz M, Le T, Ralph GS, Walmsley L, Monani UR, Lee DC, Wilkes F, Mitrophanous KA, Kingsman SM, Burghes AH, Mazarakis ND (2004) Lentivector-mediated SMN replacement in a mouse model of spinal muscular atrophy. J Clin Invest 114: 1726-31
Baccon J, Pellizzoni L, Rappsilber J, Mann M, Dreyfuss G (2002) Identification and characterization of Gemin7, a novel component of the survival of motor neuron complex. J Biol Chem 277: 31957-62
Bader MF, Doussau F, Chasserot-Golaz S, Vitale N, Gasman S (2004) Coupling actin and membrane dynamics during calcium-regulated exocytosis: a role for Rho and ARF GTPases. Biochim Biophys Acta 1742: 37-49
Baes M, Gulick T, Choi HS, Martinoli MG, Simha D, Moore DD (1994) A new orphan member of the nuclear hormone receptor superfamily that interacts with a subset of retinoic acid response elements. Mol Cell Biol 14: 1544-52
Baez MV, Boccaccio GL (2005) Mammalian Smaug is a translational repressor that forms cytoplasmic foci similar to stress granules. J Biol Chem 280: 43131-40
Baker BS (1989) Sex in flies: the splice of life. Nature 340: 521-4 Bannister AJ, Kouzarides T (1996) The CBP co-activator is a histone acetyltransferase. Nature 384: 641-3 Baron P, Galimberti D, Meda L, Prat E, Scarpini E, Conti G, Moggio M, Prelle A, Scarlato G (2000)
Synergistic effect of beta-amyloid protein and interferon gamma on nitric oxide production by C2C12 muscle cells. Brain 123 ( Pt 2): 374-9
Barth S, Liss M, Voss MD, Dobner T, Fischer U, Meister G, Grasser FA (2003) Epstein-Barr virus nuclear antigen 2 binds via its methylated arginine-glycine repeat to the survival motor neuron protein. J Virol 77: 5008-13
Bassell GJ, Kelic S (2004) Binding proteins for mRNA localization and local translation, and their dysfunction in genetic neurological disease. Curr Opin Neurobiol 14: 574-81
Bassell GJ, Zhang H, Byrd AL, Femino AM, Singer RH, Taneja KL, Lifshitz LM, Herman IM, Kosik KS (1998) Sorting of beta-actin mRNA and protein to neurites and growth cones in culture. J Neurosci 18: 251-65
Bates S, Vousden KH (1999) Mechanisms of p53-mediated apoptosis. Cell Mol Life Sci 55: 28-37 Battaglia G, Princivalle A, Forti F, Lizier C, Zeviani M (1997) Expression of the SMN gene, the spinal
muscular atrophy determining gene, in the mammalian central nervous system. Hum Mol Genet 6: 1961-71
Battle DJ, Lau CK, Wan L, Deng H, Lotti F, Dreyfuss G (2006) The Gemin5 protein of the SMN complex identifies snRNAs. Mol Cell 23: 273-9
Bear JE, Svitkina TM, Krause M, Schafer DA, Loureiro JJ, Strasser GA, Maly IV, Chaga OY, Cooper JA, Borisy GG, Gertler FB (2002) Antagonism between Ena/VASP proteins and actin filament capping regulates fibroblast motility. Cell 109: 509-21
Belcher CE, Drenkow J, Kehoe B, Gingeras TR, McNamara N, Lemjabbar H, Basbaum C, Relman DA (2000) The transcriptional responses of respiratory epithelial cells to Bordetella pertussis reveal host defensive and pathogen counter-defensive strategies. Proc Natl Acad Sci U S A 97: 13847-52
Bell AC, West AG, Felsenfeld G (2001) Insulators and boundaries: versatile regulatory elements in the eukaryotic. Science 291: 447-50
Belmont LD, Drubin DG (1998) The yeast V159N actin mutant reveals roles for actin dynamics in vivo. J Cell Biol 142: 1289-99
Bennett CM, Kanki JP, Rhodes J, Liu TX, Paw BH, Kieran MW, Langenau DM, Delahaye-Brown A, Zon LI, Fleming MD, Look AT (2001) Myelopoiesis in the zebrafish, Danio rerio. Blood 98: 643-51
Bentley D, O'Connor TP (1994) Cytoskeletal events in growth cone steering. Curr Opin Neurobiol 4: 43-8 Bergin A, Kim G, Price DL, Sisodia SS, Lee MK, Rabin BA (1997) Identification and characterization of a
mouse homologue of the spinal muscular atrophy-determining gene, survival motor neuron. Gene 204: 47-53
REFERENCES 180
Bergstrom TF, Josefsson A, Erlich HA, Gyllensten U (1998) Recent origin of HLA-DRB1 alleles and implications for human evolution. Nat Genet 18: 237-42
Bertrandy S, Burlet P, Clermont O, Huber C, Fondrat C, Thierry-Mieg D, Munnich A, Lefebvre S (1999) The RNA-binding properties of SMN: deletion analysis of the zebrafish orthologue defines domains conserved in evolution. Hum Mol Genet 8: 775-82
Biamonti G, Riva S (1994) New insights into the auxiliary domains of eukaryotic RNA binding proteins. FEBS Lett 340: 1-8
Bignell GR, Huang J, Greshock J, Watt S, Butler A, West S, Grigorova M, Jones KW, Wei W, Stratton MR, Futreal PA, Weber B, Shapero MH, Wooster R (2004) High-resolution analysis of DNA copy number using oligonucleotide microarrays. Genome Res 14: 287-95
Bird A (1992) The essentials of DNA methylation. Cell 70: 5-8 Bird A (2002) DNA methylation patterns and epigenetic memory. Genes Dev 16: 6-21 Bird AP (1986) CpG-rich islands and the function of DNA methylation. Nature 321: 209-13 Bjerling P, Silverstein RA, Thon G, Caudy A, Grewal S, Ekwall K (2002) Functional divergence between
histone deacetylases in fission yeast by distinct cellular localization and in vivo specificity. Mol Cell Biol 22: 2170-81
Blagoev B, Kratchmarova I, Ong SE, Nielsen M, Foster LJ, Mann M (2003) A proteomics strategy to elucidate functional protein-protein interactions applied to EGF signaling. Nat Biotechnol 21: 315-8
Blanc V, Navaratnam N, Henderson JO, Anant S, Kennedy S, Jarmuz A, Scott J, Davidson NO (2001) Identification of GRY-RBP as an apolipoprotein B RNA-binding protein that interacts with both apobec-1 and apobec-1 complementation factor to modulate C to U editing. J Biol Chem 276: 10272-83
Bloom O, Evergren E, Tomilin N, Kjaerulff O, Low P, Brodin L, Pieribone VA, Greengard P, Shupliakov O (2003) Colocalization of synapsin and actin during synaptic vesicle recycling. J Cell Biol 161: 737-47
Boda B, Mas C, Giudicelli C, Nepote V, Guimiot F, Levacher B, Zvara A, Santha M, LeGall I, Simonneau M (2004) Survival motor neuron SMN1 and SMN2 gene promoters: identical sequences and differential expression in neurons and non-neuronal cells. Eur J Hum Genet 12: 729-37
Boisvert FM, Cote J, Boulanger MC, Cleroux P, Bachand F, Autexier C, Richard S (2002) Symmetrical dimethylarginine methylation is required for the localization of SMN in Cajal bodies and pre-mRNA splicing. J Cell Biol 159: 957-69
Brahe C (2000) Copies of the survival motor neuron gene in spinal muscular atrophy: the more, the better. Neuromuscul Disord 10: 274-5
Brahe C, Servidei S, Zappata S, Ricci E, Tonali P, Neri G (1995) Genetic homogeneity between childhood-onset and adult-onset autosomal recessive spinal muscular atrophy. Lancet 346: 741-2
Brahe C, Vitali T, Tiziano FD, Angelozzi C, Pinto AM, Borgo F, Moscato U, Bertini E, Mercuri E, Neri G (2005) Phenylbutyrate increases SMN gene expression in spinal muscular atrophy patients. Eur J Hum Genet 13: 256-9
Brahms H, Meheus L, de Brabandere V, Fischer U, Luhrmann R (2001) Symmetrical dimethylation of arginine residues in spliceosomal Sm protein B/B' and the Sm-like protein LSm4, and their interaction with the SMN protein. Rna 7: 1531-42
Braun A, Aszodi A, Hellebrand H, Berna A, Fassler R, Brandau O (2002) Genomic organization of profilin-III and evidence for a transcript expressed exclusively in testis. Gene 283: 219-25
Bray D, Chapman K (1985) Analysis of microspike movements on the neuronal growth cone. J Neurosci 5: 3204-13
Brichta L, Hofmann Y, Hahnen E, Siebzehnrubl FA, Raschke H, Blumcke I, Eyupoglu IY, Wirth B (2003) Valproic acid increases the SMN2 protein level: a well-known drug as a potential therapy for spinal muscular atrophy. Hum Mol Genet 12: 2481-9
Broccolini A, Engel WK, Askanas V (1999) Localization of survival motor neuron protein in human apoptotic-like and regenerating muscle fibers, and neuromuscular junctions. Neuroreport 10: 1637-41
Brower SM, Honts JE, Adams AE (1995) Genetic analysis of the fimbrin-actin binding interaction in Saccharomyces cerevisiae. Genetics 140: 91-101
Brown AJ, Hutchings C, Burke JF, Mayne LV (1999) Application of a rapid method (targeted display) for the identification of differentially expressed mRNAs following NGF-induced neuronal differentiation in PC12 cells. Mol Cell Neurosci 13: 119-30

REFERENCES 181
Brzustowicz LM, Lehner T, Castilla LH, Penchaszadeh GK, Wilhelmsen KC, Daniels R, Davies KE, Leppert M, Ziter F, Wood D, et al. (1990) Genetic mapping of chronic childhood-onset spinal muscular atrophy to chromosome 5q11.2-13.3. Nature 344: 540-1
Buhler D, Raker V, Luhrmann R, Fischer U (1999) Essential role for the tudor domain of SMN in spliceosomal U snRNP assembly: implications for spinal muscular atrophy. Hum Mol Genet 8: 2351-7
Buratowski S (1994) The basics of basal transcription by RNA polymerase II. Cell 77: 1-3 Burd CG, Dreyfuss G (1994) RNA binding specificity of hnRNP A1: significance of hnRNP A1 high-affinity
binding sites in pre-mRNA splicing. Embo J 13: 1197-204 Burge CB, Tuschl PA, Sharp PA (1999) Splicing of precursors to mRNAs by the spliceosomes, in:R.F.
Gesteland, J.F.Atkins (Eds.), The RNA World. Cold Spring Harbour Laboratory Press, Cold Spring Harbour, New York: 525-560
Burghes AH (1997) When is a deletion not a deletion? When it is converted. Am J Hum Genet 61: 9-15 Burglen L, Lefebvre S, Clermont O, Burlet P, Viollet L, Cruaud C, Munnich A, Melki J (1996) Structure and
organization of the human survival motor neurone (SMN) gene. Genomics 32: 479-82 Burk O, Arnold KA, Geick A, Tegude H, Eichelbaum M (2005) A role for constitutive androstane receptor
in the regulation of human intestinal MDR1 expression. Biol Chem 386: 503-13 Burk O, Koch I, Raucy J, Hustert E, Eichelbaum M, Brockmoller J, Zanger UM, Wojnowski L (2004) The
induction of cytochrome P450 3A5 (CYP3A5) in the human liver and intestine is mediated by the xenobiotic sensors pregnane X receptor (PXR) and constitutively activated receptor (CAR). J Biol Chem 279: 38379-85
Burlet P, Burglen L, Clermont O, Lefebvre S, Viollet L, Munnich A, Melki J (1996) Large scale deletions of the 5q13 region are specific to Werdnig-Hoffmann disease. J Med Genet 33: 281-3
Burlet P, Huber C, Bertrandy S, Ludosky MA, Zwaenepoel I, Clermont O, Roume J, Delezoide AL, Cartaud J, Munnich A, Lefebvre S (1998) The distribution of SMN protein complex in human fetal tissues and its alteration in spinal muscular atrophy. Hum Mol Genet 7: 1927-33
Byers RK, Banker BQ (1961) Infantile muscular atrophy. Arch Neurol 5: 140-64 Caceres JF, Misteli T, Screaton GR, Spector DL, Krainer AR (1997) Role of the modular domains of SR
proteins in subnuclear localization and alternative splicing specificity. J Cell Biol 138: 225-38 Campbell L, Hunter KM, Mohaghegh P, Tinsley JM, Brasch MA, Davies KE (2000) Direct interaction of
Smn with dp103, a putative RNA helicase: a role for Smn in transcription regulation? Hum Mol Genet 9: 1093-100
Campbell L, Potter A, Ignatius J, Dubowitz V, Davies K (1997) Genomic variation and gene conversion in spinal muscular atrophy: implications for disease process and clinical phenotype. Am J Hum Genet 61: 40-50
Cardno AG, Bowen T, Guy CA, Jones LA, McCarthy G, Williams NM, Murphy KC, Spurlock G, Gray M, Sanders RD, Craddock N, McGuffin P, Owen MJ, O'Donovan MC (1999a) CAG repeat length in the hKCa3 gene and symptom dimensions in schizophrenia. Biol Psychiatry 45: 1592-6
Cardno AG, Jones LA, Murphy KC, Sanders RD, Asherson P, Owen MJ, McGuffin P (1999b) Dimensions of psychosis in affected sibling pairs. Schizophr Bull 25: 841-50
Cardno AG, Sham PC, Farmer AE, Murray RM, McGuffin P (2002) Heritability of Schneider's first-rank symptoms. Br J Psychiatry 180: 35-8
Carissimi C, Saieva L, Baccon J, Chiarella P, Maiolica A, Sawyer A, Rappsilber J, Pellizzoni L (2006) Gemin8 is a novel component of the survival motor neuron complex and functions in snRNP assembly. J Biol Chem
Carlier MF, Le Clainche C, Wiesner S, Pantaloni D (2003a) Actin-based motility: from molecules to movement. Bioessays 25: 336-45
Carlier MF, Wiesner S, Le Clainche C, Pantaloni D (2003b) Actin-based motility as a self-organized system: mechanism and reconstitution in vitro. C R Biol 326: 161-70
Carnegie GK, Sleeman JE, Morrice N, Hastie CJ, Peggie MW, Philp A, Lamond AI, Cohen PT (2003) Protein phosphatase 4 interacts with the survival of motor neurons complex and enhances the temporal localisation of snRNPs. J Cell Sci Pt
Cartegni L, Krainer AR (2002) Disruption of an SF2/ASF-dependent exonic splicing enhancer in SMN2 causes spinal muscular atrophy in the absence of SMN1. Nat Genet 30: 377-84
Cartegni L, Krainer AR (2003) Correction of disease-associated exon skipping by synthetic exon-specific activators. Nat Struct Biol 10: 120-5
REFERENCES 182
Caruso JF, Signorile JF, Perry AC, Leblanc B, Williams R, Clark M, Bamman MM (1995) The effects of albuterol and isokinetic exercise on the quadriceps muscle group. Med Sci Sports Exerc 27: 1471-6
Castellana N, Dhamdhere K, Sridhar S, Schwartz R (2006) Relaxing haplotype block models for association testing. Pac Symp Biocomput: 454-66
Chafel MM, Shen W, Matsudaira P (1995) Sequential expression and differential localization of I-, L-, and T-fimbrin during differentiation of the mouse intestine and yolk sac. Dev Dyn 203: 141-51
Chan YB, Miguel-Aliaga I, Franks C, Thomas N, Trulzsch B, Sattelle DB, Davies KE, van den Heuvel M (2003) Neuromuscular defects in a Drosophila survival motor neuron gene mutant. Hum Mol Genet 12: 1367-76
Chang HC, Hung WC, Chuang YJ, Jong YJ (2004) Degradation of survival motor neuron (SMN) protein is mediated via the ubiquitin/proteasome pathway. Neurochem Int 45: 1107-12
Chang JG, Hsieh-Li HM, Jong YJ, Wang NM, Tsai CH, Li H (2001) Treatment of spinal muscular atrophy by sodium butyrate. Proc Natl Acad Sci U S A 98: 9808-13
Chang M, Bellaoui M, Boone C, Brown GW (2002) A genome-wide screen for methyl methanesulfonate-sensitive mutants reveals genes required for S phase progression in the presence of DNA damage. Proc Natl Acad Sci U S A 99: 16934-9
Charroux B, Pellizzoni L, Perkinson RA, Shevchenko A, Mann M, Dreyfuss G (1999) Gemin3: A novel DEAD box protein that interacts with SMN, the spinal muscular atrophy gene product, and is a component of gems. J Cell Biol 147: 1181-94
Charroux B, Pellizzoni L, Perkinson RA, Yong J, Shevchenko A, Mann M, Dreyfuss G (2000) Gemin4. A novel component of the SMN complex that is found in both gems and nucleoli. J Cell Biol 148: 1177-86
Chen Y, Ferguson SS, Negishi M, Goldstein JA (2003) Identification of constitutive androstane receptor and glucocorticoid receptor binding sites in the CYP2C19 promoter. Mol Pharmacol 64: 316-24
Cheng D, Marner J, Rubenstein PA (1999) Interaction in vivo and in vitro between the yeast fimbrin, SAC6P, and a polymerization-defective yeast actin (V266G and L267G). J Biol Chem 274: 35873-80
Cifuentes-Diaz C, Frugier T, Tiziano FD, Lacene E, Roblot N, Joshi V, Moreau MH, Melki J (2001) Deletion of murine SMN exon 7 directed to skeletal muscle leads to severe muscular dystrophy. J Cell Biol 152: 1107-14
Cifuentes-Diaz C, Nicole S, Velasco ME, Borra-Cebrian C, Panozzo C, Frugier T, Millet G, Roblot N, Joshi V, Melki J (2002) Neurofilament accumulation at the motor endplate and lack of axonal sprouting in a spinal muscular atrophy mouse model. Hum Mol Genet 11: 1439-47
Cihak A (1974) Biological effects of 5-azacytidine in eukaryotes. Oncology 30: 405-22 Claus P, Bruns AF, Grothe C (2004) Fibroblast growth factor-2(23) binds directly to the survival of
motoneuron protein and is associated with small nuclear RNAs. Biochem J 384: 559-65 Cobben JM, van der Steege G, Grootscholten P, de Visser M, Scheffer H, Buys CH (1995) Deletions of
the survival motor neuron gene in unaffected siblings of patients with spinal muscular atrophy. Am J Hum Genet 57: 805-8
Colella S, Shen L, Baggerly KA, Issa JP, Krahe R (2003) Sensitive and quantitative universal Pyrosequencing methylation analysis of CpG sites. Biotechniques 35: 146-50
Coller HA, Grandori C, Tamayo P, Colbert T, Lander ES, Eisenman RN, Golub TR (2000) Expression analysis with oligonucleotide microarrays reveals that MYC regulates genes involved in growth, cell cycle, signaling, and adhesion. Proc Natl Acad Sci U S A 97: 3260-5
Coluccio LM, Bretscher A (1989) Reassociation of microvillar core proteins: making a microvillar core in vitro. J Cell Biol 108: 495-502
Coovert DD, Le TT, McAndrew PE, Strasswimmer J, Crawford TO, Mendell JR, Coulson SE, Androphy EJ, Prior TW, Burghes AH (1997) The survival motor neuron protein in spinal muscular atrophy. Hum Mol Genet 6: 1205-14
Corden JL, Patturajan M (1997) A CTD function linking transcription to splicing. Trends Biochem Sci 22: 413-6
Cossart P (2000) Actin-based motility of pathogens: the Arp2/3 complex is a central player. Cell Microbiol 2: 195-205
Crawford DC, Nickerson DA (2005) Definition and clinical importance of haplotypes. Annu Rev Med 56: 303-20

REFERENCES 183
Crawford TO (2004) Concerns about the design of clinical trials for spinal muscular atrophy. Neuromuscul Disord 14: 456-60
Crawford TO, Pardo CA (1996) The neurobiology of childhood spinal muscular atrophy. Neurobiol Dis 3: 97-110
Cusin V, Clermont O, Gerard B, Chantereau D, Elion J (2003) Prevalence of SMN1 deletion and duplication in carrier and normal populations: implication for genetic counselling. J Med Genet 40: e39
Cutting GR (2005) Modifier genetics: cystic fibrosis. Annu Rev Genomics Hum Genet 6: 237-60 Da Silva JS, Medina M, Zuliani C, Di Nardo A, Witke W, Dotti CG (2003) RhoA/ROCK regulation of
neuritogenesis via profilin IIa-mediated control of actin stability. J Cell Biol 162: 1267-79 Daly MJ, Rioux JD, Schaffner SF, Hudson TJ, Lander ES (2001) High-resolution haplotype structure in the
human genome. Nat Genet 29: 229-32 Daudet N, Lebart MC (2002) Transient expression of the t-isoform of plastins/fimbrin in the stereocilia of
developing auditory hair cells. Cell Motil Cytoskeleton 53: 326-36 Davies J, Alton E, Griesenbach U (2005) Cystic fibrosis modifier genes. J R Soc Med 98 Suppl 45: 47-54 Dawson E, Abecasis GR, Bumpstead S, Chen Y, Hunt S, Beare DM, Pabial J, Dibling T, Tinsley E, Kirby
S, Carter D, Papaspyridonos M, Livingstone S, Ganske R, Lohmussaar E, Zernant J, Tonisson N, Remm M, Magi R, Puurand T, Vilo J, Kurg A, Rice K, Deloukas P, Mott R, Metspalu A, Bentley DR, Cardon LR, Dunham I (2002) A first-generation linkage disequilibrium map of human chromosome 22. Nature 418: 544-8
de Arruda MV, Watson S, Lin CS, Leavitt J, Matsudaira P (1990) Fimbrin is a homologue of the cytoplasmic phosphoprotein plastin and has domains homologous with calmodulin and actin gelation proteins. J Cell Biol 111: 1069-79
de Ruijter AJ, van Gennip AH, Caron HN, Kemp S, van Kuilenburg AB (2003) Histone deacetylases (HDACs): characterization of the classical HDAC family. Biochem J 370: 737-49
Debey S, Schoenbeck U, Hellmich M, Gathof BS, Pillai R, Zander T, Schultze JL (2004) Comparison of different isolation techniques prior gene expression profiling of blood derived cells: impact on physiological responses, on overall expression and the role of different cell types. Pharmacogenomics J 4: 193-207
Deininger PL, Batzer MA (1999) Alu repeats and human disease. Mol Genet Metab 67: 183-93 Delanote V, Van Impe K, De Corte V, Bruyneel E, Vetter G, Boucherie C, Mareel M, Vandekerckhove J,
Friederich E, Gettemans J (2005a) Molecular basis for dissimilar nuclear trafficking of the actin-bundling protein isoforms T- and L-plastin. Traffic 6: 335-45
Delanote V, Vandekerckhove J, Gettemans J (2005b) Plastins: versatile modulators of actin organization in (patho)physiological cellular processes. Acta Pharmacol Sin 26: 769-79
Dent EW, Gertler FB (2003) Cytoskeletal dynamics and transport in growth cone motility and axon guidance. Neuron 40: 209-27
Dent EW, Meiri KF (1992) GAP-43 phosphorylation is dynamically regulated in individual growth cones. J Neurobiol 23: 1037-53
Dent EW, Meiri KF (1998) Distribution of phosphorylated GAP-43 (neuromodulin) in growth cones directly reflects growth cone behavior. J Neurobiol 35: 287-99
DiDonato CJ, Chen XN, Noya D, Korenberg JR, Nadeau JH, Simard LR (1997a) Cloning, characterization, and copy number of the murine survival motor neuron gene: homolog of the spinal muscular atrophy-determining gene. Genome Res 7: 339-52
DiDonato CJ, Ingraham SE, Mendell JR, Prior TW, Lenard S, Moxley RT, 3rd, Florence J, Burghes AH (1997b) Deletion and conversion in spinal muscular atrophy patients: is there a relationship to severity? Ann Neurol 41: 230-7
DiDonato CJ, Lorson CL, De Repentigny Y, Simard L, Chartrand C, Androphy EJ, Kothary R (2001) Regulation of murine survival motor neuron (Smn) protein levels by modifying Smn exon 7 splicing. Hum Mol Genet 10: 2727-36
DiDonato CJ, Morgan K, Carpten JD, Fuerst P, Ingraham SE, Prescott G, McPherson JD, Wirth B, Zerres K, Hurko O, et al. (1994) Association between Ag1-CA alleles and severity of autosomal recessive proximal spinal muscular atrophy. Am J Hum Genet 55: 1218-29
Diehn M, Alizadeh AA, Rando OJ, Liu CL, Stankunas K, Botstein D, Crabtree GR, Brown PO (2002) Genomic expression programs and the integration of the CD28 costimulatory signal in T cell activation. Proc Natl Acad Sci U S A 99: 11796-801

REFERENCES 184
dos Remedios CG, Chhabra D, Kekic M, Dedova IV, Tsubakihara M, Berry DA, Nosworthy NJ (2003) Actin binding proteins: regulation of cytoskeletal microfilaments. Physiol Rev 83: 433-73
dos Remedios CG, Thomas DD (2001) An overview of actin structure and actin-binding proteins. Results Probl Cell Differ 32: 1-7
Dostie J, Mourelatos Z, Yang M, Sharma A, Dreyfuss G (2003) Numerous microRNPs in neuronal cells containing novel microRNAs. Rna 9: 180-6
Dreyfuss G, Matunis MJ, Pinol-Roma S, Burd CG (1993) hnRNP proteins and the biogenesis of mRNA. Annu Rev Biochem 62: 289-321
Drubin DG, Feinstein SC, Shooter EM, Kirschner MW (1985) Nerve growth factor-induced neurite outgrowth in PC12 cells involves the coordinate induction of microtubule assembly and assembly-promoting factors. J Cell Biol 101: 1799-807
Drubin DG, Miller KG, Botstein D (1988) Yeast actin-binding proteins: evidence for a role in morphogenesis. J Cell Biol 107: 2551-61
Dubowitz V (1964) Infantile Muscular Atrophy. a Prospective Study with Particular Reference to a Slowly Progressive Variety. Brain 87: 707-18
Dutartre H, Davoust J, Gorvel JP, Chavrier P (1996) Cytokinesis arrest and redistribution of actin-cytoskeleton regulatory components in cells expressing the Rho GTPase CDC42Hs. J Cell Sci 109 ( Pt 2): 367-77
Eden S, Cedar H (1994) Role of DNA methylation in the regulation of transcription. Curr Opin Genet Dev 4: 255-9
Endo M, Ohashi K, Sasaki Y, Goshima Y, Niwa R, Uemura T, Mizuno K (2003) Control of growth cone motility and morphology by LIM kinase and Slingshot via phosphorylation and dephosphorylation of cofilin. J Neurosci 23: 2527-37
Endrizzi M, Huang S, Scharf JM, Kelter AR, Wirth B, Kunkel LM, Miller W, Dietrich WF (1999) Comparative sequence analysis of the mouse and human Lgn1/SMA interval. Genomics 60: 137-51
Eng H, Lund K, Campenot RB (1999) Synthesis of beta-tubulin, actin, and other proteins in axons of sympathetic neurons in compartmented cultures. J Neurosci 19: 1-9
Espert L, Eldin P, Gongora C, Bayard B, Harper F, Chelbi-Alix MK, Bertrand E, Degols G, Mechti N (2006) The exonuclease ISG20 mainly localizes in the nucleolus and the Cajal (Coiled) bodies and is associated with nuclear SMN protein-containing complexes. J Cell Biochem
Faivre-Sarrailh C, Lena JY, Had L, Vignes M, Lindberg U (1993) Location of profilin at presynaptic sites in the cerebellar cortex; implication for the regulation of the actin-polymerization state during axonal elongation and synaptogenesis. J Neurocytol 22: 1060-72
Fakhrai-Rad H, Pourmand N, Ronaghi M (2002) Pyrosequencing: an accurate detection platform for single nucleotide polymorphisms. Hum Mutat 19: 479-85
Fambrough D, McClure K, Kazlauskas A, Lander ES (1999) Diverse signaling pathways activated by growth factor receptors induce broadly overlapping, rather than independent, sets of genes. Cell 97: 727-41
Fan L, Simard LR (2002) Survival motor neuron (SMN) protein: role in neurite outgrowth and neuromuscular maturation during neuronal differentiation and development. Hum Mol Genet 11: 1605-14
Farina KL, Huttelmaier S, Musunuru K, Darnell R, Singer RH (2003) Two ZBP1 KH domains facilitate beta-actin mRNA localization, granule formation, and cytoskeletal attachment. J Cell Biol 160: 77-87
Feldkotter M, Schwarzer V, Wirth R, Wienker TF, Wirth B (2002) Quantitative analyses of SMN1 and SMN2 based on real-time lightCycler PCR: fast and highly reliable carrier testing and prediction of severity of spinal muscular atrophy. Am J Hum Genet 70: 358-68
Feng W, Gubitz AK, Wan L, Battle DJ, Dostie J, Golembe TJ, Dreyfuss G (2005) Gemins modulate the expression and activity of the SMN complex. Hum Mol Genet 14: 1605-11
Ferguson SS, Chen Y, LeCluyse EL, Negishi M, Goldstein JA (2005) Human CYP2C8 is transcriptionally regulated by the nuclear receptors constitutive androstane receptor, pregnane X receptor, glucocorticoid receptor, and hepatic nuclear factor 4alpha. Mol Pharmacol 68: 747-57
Ferguson SS, LeCluyse EL, Negishi M, Goldstein JA (2002) Regulation of human CYP2C9 by the constitutive androstane receptor: discovery of a new distal binding site. Mol Pharmacol 62: 737-46
Ferri A, Melki J, Kato AC (2004) Progressive and selective degeneration of motoneurons in a mouse model of SMA. Neuroreport 15: 275-80

REFERENCES 185
Fidzianska A (2002) Suicide muscle cell programme-apoptosis. Ultrastructural study. Folia Neuropathol 40: 27-32
Fidzianska A, Rafalowska J (2002) Motoneuron death in normal and spinal muscular atrophy-affected human fetuses. Acta Neuropathol (Berl) 104: 363-8
Fischer U, Liu Q, Dreyfuss G (1997) The SMN-SIP1 complex has an essential role in spliceosomal snRNP biogenesis. Cell 90: 1023-9
Fischle W, Dequiedt F, Hendzel MJ, Guenther MG, Lazar MA, Voelter W, Verdin E (2002) Enzymatic activity associated with class II HDACs is dependent on a multiprotein complex containing HDAC3 and SMRT/N-CoR. Mol Cell 9: 45-57
Forman BM, Tzameli I, Choi HS, Chen J, Simha D, Seol W, Evans RM, Moore DD (1998) Androstane metabolites bind to and deactivate the nuclear receptor CAR-beta. Nature 395: 612-5
Frey D, Laux T, Xu L, Schneider C, Caroni P (2000) Shared and unique roles of CAP23 and GAP43 in actin regulation, neurite outgrowth, and anatomical plasticity. J Cell Biol 149: 1443-54
Friederich E, Huet C, Arpin M, Louvard D (1989) Villin induces microvilli growth and actin redistribution in transfected fibroblasts. Cell 59: 461-75
Friesen WJ, Dreyfuss G (2000) Specific sequences of the Sm and Sm-like (Lsm) proteins mediate their interaction with the spinal muscular atrophy disease gene product (SMN). J Biol Chem 275: 26370-5
Friesen WJ, Massenet S, Paushkin S, Wyce A, Dreyfuss G (2001a) SMN, the product of the spinal muscular atrophy gene, binds preferentially to dimethylarginine-containing protein targets. Mol Cell 7: 1111-7
Friesen WJ, Paushkin S, Wyce A, Massenet S, Pesiridis GS, Van Duyne G, Rappsilber J, Mann M, Dreyfuss G (2001b) The methylosome, a 20S complex containing JBP1 and pICln, produces dimethylarginine-modified Sm proteins. Mol Cell Biol 21: 8289-300
Friesen WJ, Wyce A, Paushkin S, Abel L, Rappsilber J, Mann M, Dreyfuss G (2002) A novel WD repeat protein component of the methylosome binds Sm proteins. J Biol Chem 277: 8243-7
Fritsche M, Haessler C, Brandner G (1993) Induction of nuclear accumulation of the tumor-suppressor protein p53 by DNA-damaging agents. Oncogene 8: 307-18
Frommer M, McDonald LE, Millar DS, Collis CM, Watt F, Grigg GW, Molloy PL, Paul CL (1992) A genomic sequencing protocol that yields a positive display of 5-methylcytosine residues in individual DNA strands. Proc Natl Acad Sci U S A 89: 1827-31
Frugier T, Tiziano FD, Cifuentes-Diaz C, Miniou P, Roblot N, Dierich A, Le Meur M, Melki J (2000) Nuclear targeting defect of SMN lacking the C-terminus in a mouse model of spinal muscular atrophy. Hum Mol Genet 9: 849-58
Fu XD (2004) Towards a splicing code. Cell 119: 736-8 Gabanella F, Carissimi C, Usiello A, Pellizzoni L (2005) The activity of the spinal muscular atrophy protein
is regulated during development and cellular differentiation. Hum Mol Genet 14: 3629-42 Gabriel SB, Schaffner SF, Nguyen H, Moore JM, Roy J, Blumenstiel B, Higgins J, DeFelice M, Lochner A,
Faggart M, Liu-Cordero SN, Rotimi C, Adeyemo A, Cooper R, Ward R, Lander ES, Daly MJ, Altshuler D (2002) The structure of haplotype blocks in the human genome. Science 296: 2225-9
Gagneux P, Wills C, Gerloff U, Tautz D, Morin PA, Boesch C, Fruth B, Hohmann G, Ryder OA, Woodruff DS (1999) Mitochondrial sequences show diverse evolutionary histories of African hominoids. Proc Natl Acad Sci U S A 96: 5077-82
Galan JE, Zhou D (2000) Striking a balance: modulation of the actin cytoskeleton by Salmonella. Proc Natl Acad Sci U S A 97: 8754-61
Gall JG (2003a) The centennial of the Cajal body. Nat Rev Mol Cell Biol 4: 975-80 Gall JG (2003b) [A role for Cajal bodies in assembly of the nuclear transcription machinery]. Tsitologiia 45:
971-5 Gall JG, Bellini M, Wu Z, Murphy C (1999) Assembly of the nuclear transcription and processing
machinery: Cajal bodies (coiled bodies) and transcriptosomes. Mol Biol Cell 10: 4385-402 Gallant PE (2000) Axonal protein synthesis and transport. J Neurocytol 29: 779-82 Gallouzi IE, Brennan CM, Stenberg MG, Swanson MS, Eversole A, Maizels N, Steitz JA (2000) HuR
binding to cytoplasmic mRNA is perturbed by heat shock. Proc Natl Acad Sci U S A 97: 3073-8 Gangwani L (2006) Deficiency of the zinc finger protein ZPR1 causes defects in transcription and cell
cycle progression. J Biol Chem 281: 40330-40 Gangwani L, Flavell RA, Davis RJ (2005) ZPR1 is essential for survival and is required for localization of
the survival motor neurons (SMN) protein to Cajal bodies. Mol Cell Biol 25: 2744-56
REFERENCES 186
Gangwani L, Mikrut M, Theroux S, Sharma M, Davis RJ (2001) Spinal muscular atrophy disrupts the interaction of ZPR1 with the SMN protein. Nat Cell Biol 3: 376-83
Garcia-Alvarez B, Bobkov A, Sonnenberg A, de Pereda JM (2003) Structural and functional analysis of the actin binding domain of plectin suggests alternative mechanisms for binding to F-actin and integrin beta4. Structure 11: 615-25
Gavrilov DK, Shi X, Das K, Gilliam TC, Wang CH (1998) Differential SMN2 expression associated with SMA severity. Nat Genet 20: 230-1
Gennarelli M, Lucarelli M, Capon F, Pizzuti A, Merlini L, Angelini C, Novelli G, Dallapiccola B (1995) Survival motor neuron gene transcript analysis in muscles from spinal muscular atrophy patients. Biochem Biophys Res Commun 213: 342-8
Gertler FB, Niebuhr K, Reinhard M, Wehland J, Soriano P (1996) Mena, a relative of VASP and Drosophila Enabled, is implicated in the control of microfilament dynamics. Cell 87: 227-39
Giavazzi A, Setola V, Simonati A, Battaglia G (2006) Neuronal-specific roles of the survival motor neuron protein: evidence from survival motor neuron expression patterns in the developing human central nervous system. J Neuropathol Exp Neurol 65: 267-77
Giesemann T, Rathke-Hartlieb S, Rothkegel M, Bartsch JW, Buchmeier S, Jockusch BM, Jockusch H (1999) A role for polyproline motifs in the spinal muscular atrophy protein SMN. Profilins bind to and colocalize with smn in nuclear gems. J Biol Chem 274: 37908-14
Giganti A, Plastino J, Janji B, Van Troys M, Lentz D, Ampe C, Sykes C, Friederich E (2005) Actin-filament cross-linking protein T-plastin increases Arp2/3-mediated actin-based movement. J Cell Sci 118: 1255-65
Glenney JR, Jr., Kaulfus P, Matsudaira P, Weber K (1981) F-actin binding and bundling properties of fimbrin, a major cytoskeletal protein of microvillus core filaments. J Biol Chem 256: 9283-8
Goldberg DJ, Burmeister DW (1986) Stages in axon formation: observations of growth of Aplysia axons in culture using video-enhanced contrast-differential interference contrast microscopy. J Cell Biol 103: 1921-31
Goldberg DJ, Foley MS, Tang D, Grabham PW (2000) Recruitment of the Arp2/3 complex and mena for the stimulation of actin polymerization in growth cones by nerve growth factor. J Neurosci Res 60: 458-67
Goldsmith SC, Pokala N, Shen W, Fedorov AA, Matsudaira P, Almo SC (1997) The structure of an actin-crosslinking domain from human fimbrin. Nat Struct Biol 4: 708-12
Goldstein D, Djeu J, Latter G, Burbeck S, Leavitt J (1985) Abundant synthesis of the transformation-induced protein of neoplastic human fibroblasts, plastin, in normal lymphocytes. Cancer Res 45: 5643-7
Goley ED, Ohkawa T, Mancuso J, Woodruff JB, D'Alessio JA, Cande WZ, Volkman LE, Welch MD (2006) Dynamic nuclear actin assembly by Arp2/3 complex and a baculovirus WASP-like protein. Science 314: 464-7
Golub TR, Slonim DK, Tamayo P, Huard C, Gaasenbeek M, Mesirov JP, Coller H, Loh ML, Downing JR, Caligiuri MA, Bloomfield CD, Lander ES (1999) Molecular classification of cancer: class discovery and class prediction by gene expression monitoring. Science 286: 531-7
Goodwin B, Hodgson E, D'Costa DJ, Robertson GR, Liddle C (2002) Transcriptional regulation of the human CYP3A4 gene by the constitutive androstane receptor. Mol Pharmacol 62: 359-65
Gossen M, Bujard H (1992) Tight control of gene expression in mammalian cells by tetracycline-responsive promoters. Proc Natl Acad Sci U S A 89: 5547-51
Graham FL, Smiley J, Russell WC, Nairn R (1977) Characteristics of a human cell line transformed by DNA from human adenovirus type 5. J Gen Virol 36: 59-74
Greene LA, Burstein DE, Black MM (1982) The role of transcription-dependent priming in nerve growth factor promoted neurite outgrowth. Dev Biol 91: 305-16
Greene LA, Tischler AS (1976) Establishment of a noradrenergic clonal line of rat adrenal pheochromocytoma cells which respond to nerve growth factor. Proc Natl Acad Sci U S A 73: 2424-8
Greensmith L, Vrbova G (1997) Disturbances of neuromuscular interaction may contribute to muscle weakness in spinal muscular atrophy. Neuromuscul Disord 7: 369-72
Grimmler M, Otter S, Peter C, Muller F, Chari A, Fischer U (2005) Unrip, a factor implicated in cap-independent translation, associates with the cytosolic SMN complex and influences its intracellular localization. Hum Mol Genet 14: 3099-111

REFERENCES 187
Grohmann K, Schuelke M, Diers A, Hoffmann K, Lucke B, Adams C, Bertini E, Leonhardt-Horti H, Muntoni F, Ouvrier R, Pfeufer A, Rossi R, Van Maldergem L, Wilmshurst JM, Wienker TF, Sendtner M, Rudnik-Schoneborn S, Zerres K, Hubner C (2001) Mutations in the gene encoding immunoglobulin mu-binding protein 2 cause spinal muscular atrophy with respiratory distress type 1. Nat Genet 29: 75-7
Grohmann K, Wienker TF, Saar K, Rudnik-Schoneborn S, Stoltenburg-Didinger G, Rossi R, Novelli G, Nurnberg G, Pfeufer A, Wirth B, Reis A, Zerres K, Hubner C (1999) Diaphragmatic spinal muscular atrophy with respiratory distress is heterogeneous, and one form Is linked to chromosome 11q13-q21. Am J Hum Genet 65: 1459-62
Grosset C, Chen CY, Xu N, Sonenberg N, Jacquemin-Sablon H, Shyu AB (2000) A mechanism for translationally coupled mRNA turnover: interaction between the poly(A) tail and a c-fos RNA coding determinant via a protein complex. Cell 103: 29-40
Grozinger CM, Hassig CA, Schreiber SL (1999) Three proteins define a class of human histone deacetylases related to yeast Hda1p. Proc Natl Acad Sci U S A 96: 4868-73
Gubitz AK, Feng W, Dreyfuss G (2004) The SMN complex. Exp Cell Res 296: 51-6 Gubitz AK, Mourelatos Z, Abel L, Rappsilber J, Mann M, Dreyfuss G (2002) Gemin5, a novel WD repeat
protein component of the SMN complex that binds Sm proteins. J Biol Chem 277: 5631-6 Gudbjartsson DF, Jonasson K, Frigge ML, Kong A (2000) Allegro, a new computer program for multipoint
linkage analysis. Nat Genet 25: 12-3 Guerrero I, Pellicer A, Burstein DE (1988) Dissociation of c-fos from ODC expression and neuronal
differentiation in a PC12 subline stably transfected with an inducible N-ras oncogene. Biochem Biophys Res Commun 150: 1185-92
Guillemin K, Salama NR, Tompkins LS, Falkow S (2002) Cag pathogenicity island-specific responses of gastric epithelial cells to Helicobacter pylori infection. Proc Natl Acad Sci U S A 99: 15136-41
Guo GL, Lambert G, Negishi M, Ward JM, Brewer HB, Jr., Kliewer SA, Gonzalez FJ, Sinal CJ (2003) Complementary roles of farnesoid X receptor, pregnane X receptor, and constitutive androstane receptor in protection against bile acid toxicity. J Biol Chem 278: 45062-71
Gussander E, Adams A (1984) Electron microscopic evidence for replication of circular Epstein-Barr virus genomes in latently infected Raji cells. J Virol 52: 549-56
Haddad H, Cifuentes-Diaz C, Miroglio A, Roblot N, Joshi V, Melki J (2003) Riluzole attenuates spinal muscular atrophy disease progression in a mouse model. Muscle Nerve 28: 432-7
Haggarty SJ, Koeller KM, Wong JC, Grozinger CM, Schreiber SL (2003) Domain-selective small-molecule inhibitor of histone deacetylase 6 (HDAC6)-mediated tubulin deacetylation. Proc Natl Acad Sci U S A 100: 4389-94
Hahnen E, Eyupoglu IY, Brichta L, Haastert K, Tränkle C, Siebzehnrübl FA, Riessland M, Hölker I, Claus P, Romstöck J, Buslei R, Wirth B, Blümcke I (2006) In vitro and ex vivo evaluation of second-generation histone deacetylase inhibitors for the treatment of spinal muscular atrophy. J Neurochem: 10.1111/j.1471-4159.2006.03868.x
Hahnen E, Forkert R, Marke C, Rudnik-Schoneborn S, Schonling J, Zerres K, Wirth B (1995) Molecular analysis of candidate genes on chromosome 5q13 in autosomal recessive spinal muscular atrophy: evidence of homozygous deletions of the SMN gene in unaffected individuals. Hum Mol Genet 4: 1927-33
Hahnen ET, Wirth B (1996) Frequent DNA variant in exon 2a of the survival motor neuron gene (SMN): a further possibility for distinguishing the two copies of the gene. Hum Genet 98: 122-3
Hall A (1998) Rho GTPases and the actin cytoskeleton. Science 279: 509-14 Hanamura A, Caceres JF, Mayeda A, Franza BR, Jr., Krainer AR (1998) Regulated tissue-specific
expression of antagonistic pre-mRNA splicing factors. Rna 4: 430-44 Harding HP, Zhang Y, Ron D (1999) Protein translation and folding are coupled by an endoplasmic-
reticulum-resident kinase. Nature 397: 271-4 Hart MJ, Eva A, Evans T, Aaronson SA, Cerione RA (1991) Catalysis of guanine nucleotide exchange on
the CDC42Hs protein by the dbl oncogene product. Nature 354: 311-4 Hashiguchi M, Sobue K, Paudel HK (2000) 14-3-3zeta is an effector of tau protein phosphorylation. J Biol
Chem 275: 25247-54 Hausmanowa-Petrusewicz I, Fidzianska A, Niebroj-Dobosz I, Dorobek M, Bojakowski J (2000)
Dystrophinopathies in females. Folia Neuropathol 38: 7-12

REFERENCES 188
He Q, Dent EW, Meiri KF (1997) Modulation of actin filament behavior by GAP-43 (neuromodulin) is dependent on the phosphorylation status of serine 41, the protein kinase C site. J Neurosci 17: 3515-24
Hebert MD, Shpargel KB, Ospina JK, Tucker KE, Matera AG (2002) Coilin methylation regulates nuclear body formation. Dev Cell 3: 329-37
Hebert MD, Szymczyk PW, Shpargel KB, Matera AG (2001) Coilin forms the bridge between Cajal bodies and SMN, the spinal muscular atrophy protein. Genes Dev 15: 2720-9
Helmken C, Hofmann Y, Schoenen F, Oprea G, Raschke H, Rudnik-Schoneborn S, Zerres K, Wirth B (2003) Evidence for a modifying pathway in SMA discordant families: reduced SMN level decreases the amount of its interacting partners and Htra2-beta1. Hum Genet 114: 11-21
Helmken C, Wetter A, Rudnik-Schoneborn S, Liehr T, Zerres K, Wirth B (2000) An essential SMN interacting protein (SIP1) is not involved in the phenotypic variability of spinal muscular atrophy (SMA). Eur J Hum Genet 8: 493-9
Helmken C, Wirth B (2000) Exclusion of Htra2-beta1, an up-regulator of full-length SMN2 transcript, as a modifying gene for spinal muscular atrophy. Hum Genet 107: 554-8
Hendrich B, Tweedie S (2003) The methyl-CpG binding domain and the evolving role of DNA methylation in animals. Trends Genet 19: 269-77
Herbomel P, Thisse B, Thisse C (1999) Ontogeny and behaviour of early macrophages in the zebrafish embryo. Development 126: 3735-45
Hesketh JE, Pryme IF (1991) Interaction between mRNA, ribosomes and the cytoskeleton. Biochem J 277 ( Pt 1): 1-10
Higuchi Y, Kita K, Nakanishi H, Wang XL, Sugaya S, Tanzawa H, Yamamori H, Sugita K, Yamaura A, Suzuki N (1998) Search for genes involved in UV-resistance in human cells by mRNA differential display: increased transcriptional expression of nucleophosmin and T-plastin genes in association with the resistance. Biochem Biophys Res Commun 248: 597-602
Hisano T, Ono M, Nakayama M, Naito S, Kuwano M, Wada M (1996) Increased expression of T-plastin gene in cisplatin-resistant human cancer cells: identification by mRNA differential display. FEBS Lett 397: 101-7
Ho Y, Gruhler A, Heilbut A, Bader GD, Moore L, Adams SL, Millar A, Taylor P, Bennett K, Boutilier K, Yang L, Wolting C, Donaldson I, Schandorff S, Shewnarane J, Vo M, Taggart J, Goudreault M, Muskat B, Alfarano C, Dewar D, Lin Z, Michalickova K, Willems AR, Sassi H, Nielsen PA, Rasmussen KJ, Andersen JR, Johansen LE, Hansen LH, Jespersen H, Podtelejnikov A, Nielsen E, Crawford J, Poulsen V, Sorensen BD, Matthiesen J, Hendrickson RC, Gleeson F, Pawson T, Moran MF, Durocher D, Mann M, Hogue CW, Figeys D, Tyers M (2002) Systematic identification of protein complexes in Saccharomyces cerevisiae by mass spectrometry. Nature 415: 180-3
Hofer D, Ness W, Drenckhahn D (1997) Sorting of actin isoforms in chicken auditory hair cells. J Cell Sci 110 ( Pt 6): 765-70
Hofmann Y, Lorson CL, Stamm S, Androphy EJ, Wirth B (2000) Htra2-beta 1 stimulates an exonic splicing enhancer and can restore full-length SMN expression to survival motor neuron 2 (SMN2). Proc Natl Acad Sci U S A 97: 9618-23
Hofmann Y, Wirth B (2002) hnRNP-G promotes exon 7 inclusion of survival motor neuron (SMN) via direct interaction with Htra2-beta1. Hum Mol Genet 11: 2037-49
Horai S, Hayasaka K, Kondo R, Tsugane K, Takahata N (1995) Recent African origin of modern humans revealed by complete sequences of hominoid mitochondrial DNAs. Proc Natl Acad Sci U S A 92: 532-6
Horiuchi T, Aigaki T (2006) Alternative trans-splicing: a novel mode of pre-mRNA processing. Biol Cell 98: 135-40
Hsieh-Li HM, Chang JG, Jong YJ, Wu MH, Wang NM, Tsai CH, Li H (2000) A mouse model for spinal muscular atrophy. Nat Genet 24: 66-70
Hu XY, Ray PN, Murphy EG, Thompson MW, Worton RG (1990) Duplicational mutation at the Duchenne muscular dystrophy locus: its frequency, distribution, origin, and phenotypegenotype correlation. Am J Hum Genet 46: 682-95
Hua Y, Zhou J (2004a) Rpp20 interacts with SMN and is re-distributed into SMN granules in response to stress. Biochem Biophys Res Commun 314: 268-76
Hua Y, Zhou J (2004b) Survival motor neuron protein facilitates assembly of stress granules. FEBS Lett 572: 69-74

REFERENCES 189
Huang LC, Clarkin KC, Wahl GM (1996) Sensitivity and selectivity of the DNA damage sensor responsible for activating p53-dependent G1 arrest. Proc Natl Acad Sci U S A 93: 4827-32
Huang W, Zhang J, Chua SS, Qatanani M, Han Y, Granata R, Moore DD (2003) Induction of bilirubin clearance by the constitutive androstane receptor (CAR). Proc Natl Acad Sci U S A 100: 4156-61
Huang W, Zhang J, Moore DD (2004) A traditional herbal medicine enhances bilirubin clearance by activating the nuclear receptor CAR. J Clin Invest 113: 137-43
Hubbert C, Guardiola A, Shao R, Kawaguchi Y, Ito A, Nixon A, Yoshida M, Wang XF, Yao TP (2002) HDAC6 is a microtubule-associated deacetylase. Nature 417: 455-8
Huber J, Cronshagen U, Kadokura M, Marshallsay C, Wada T, Sekine M, Luhrmann R (1998) Snurportin1, an m3G-cap-specific nuclear import receptor with a novel domain structure. Embo J 17: 4114-26
Hunt SL, Hsuan JJ, Totty N, Jackson RJ (1999) unr, a cellular cytoplasmic RNA-binding protein with five cold-shock domains, is required for internal initiation of translation of human rhinovirus RNA. Genes Dev 13: 437-48
Hupp TR, Meek DW, Midgley CA, Lane DP (1992) Regulation of the specific DNA binding function of p53. Cell 71: 875-86
Iwahashi H, Eguchi Y, Yasuhara N, Hanafusa T, Matsuzawa Y, Tsujimoto Y (1997) Synergistic anti-apoptotic activity between Bcl-2 and SMN implicated in spinal muscular atrophy. Nature 390: 413-7
Iyer VR, Eisen MB, Ross DT, Schuler G, Moore T, Lee JC, Trent JM, Staudt LM, Hudson J, Jr., Boguski MS, Lashkari D, Shalon D, Botstein D, Brown PO (1999) The transcriptional program in the response of human fibroblasts to serum. Science 283: 83-7
Jablonka S, Bandilla M, Wiese S, Buhler D, Wirth B, Sendtner M, Fischer U (2001) Co-regulation of survival of motor neuron (SMN) protein and its interactor SIP1 during development and in spinal muscular atrophy. Hum Mol Genet 10: 497-505
Jablonka S, Schrank B, Kralewski M, Rossoll W, Sendtner M (2000) Reduced survival motor neuron (Smn) gene dose in mice leads to motor neuron degeneration: an animal model for spinal muscular atrophy type III. Hum Mol Genet 9: 341-6
Jablonka S, Wiese S, Sendtner M (2004) Axonal defects in mouse models of motoneuron disease. J Neurobiol 58: 272-86
Jady BE, Darzacq X, Tucker KE, Matera AG, Bertrand E, Kiss T (2003) Modification of Sm small nuclear RNAs occurs in the nucleoplasmic Cajal body following import from the cytoplasm. Embo J 22: 1878-88
Janmey PA, Chaponnier C (1995) Medical aspects of the actin cytoskeleton. Curr Opin Cell Biol 7: 111-7 Johnson DI, Pringle JR (1990) Molecular characterization of CDC42, a Saccharomyces cerevisiae gene
involved in the development of cell polarity. J Cell Biol 111: 143-52 Johnson RW, Reveille JD, McNearney T, Fischbach M, Friedman AW, Ahn C, Arnett FC, Tan FK (2001)
Lack of association of a functionally relevant single nucleotide polymorphism of matrix metalloproteinase-1 promoter with systemic sclerosis (scleroderma). Genes Immun 2: 273-5
Jones KW, Gorzynski K, Hales CM, Fischer U, Badbanchi F, Terns RM, Terns MP (2001) Direct interaction of the spinal muscular atrophy disease protein SMN with the small nucleolar RNA-associated protein fibrillarin. J Biol Chem 276: 38645-51
Kambach C, Walke S, Nagai K (1999a) Structure and assembly of the spliceosomal small nuclear ribonucleoprotein particles. Curr Opin Struct Biol 9: 222-30
Kambach C, Walke S, Young R, Avis JM, de la Fortelle E, Raker VA, Luhrmann R, Li J, Nagai K (1999b) Crystal structures of two Sm protein complexes and their implications for the assembly of the spliceosomal snRNPs. Cell 96: 375-87
Karginova EA, Pentz ES, Kazakova IG, Norwood VF, Carey RM, Gomez RA (1997) Zis: a developmentally regulated gene expressed in juxtaglomerular cells. Am J Physiol 273: F731-8
Kashima T, Manley JL (2003) A negative element in SMN2 exon 7 inhibits splicing in spinal muscular atrophy. Nat Genet 34: 460-3
Katz M, Amit I, Yarden Y (2007) Regulation of MAPKs by growth factors and receptor tyrosine kinases. Biochim Biophys Acta
Kawaguchi Y, Kovacs JJ, McLaurin A, Vance JM, Ito A, Yao TP (2003) The deacetylase HDAC6 regulates aggresome formation and cell viability in response to misfolded protein stress. Cell 115: 727-38

REFERENCES 190
Kawamoto T, Sueyoshi T, Zelko I, Moore R, Washburn K, Negishi M (1999) Phenobarbital-responsive nuclear translocation of the receptor CAR in induction of the CYP2B gene. Mol Cell Biol 19: 6318-22
Kazazian HH, Jr. (1998) Mobile elements and disease. Curr Opin Genet Dev 8: 343-50 Kedersha N, Anderson P (2002) Stress granules: sites of mRNA triage that regulate mRNA stability and
translatability. Biochem Soc Trans 30: 963-9 Kedersha N, Chen S, Gilks N, Li W, Miller IJ, Stahl J, Anderson P (2002) Evidence that ternary complex
(eIF2-GTP-tRNA(i)(Met))-deficient preinitiation complexes are core constituents of mammalian stress granules. Mol Biol Cell 13: 195-210
Kedersha N, Cho MR, Li W, Yacono PW, Chen S, Gilks N, Golan DE, Anderson P (2000) Dynamic shuttling of TIA-1 accompanies the recruitment of mRNA to mammalian stress granules. J Cell Biol 151: 1257-68
Kedersha N, Stoecklin G, Ayodele M, Yacono P, Lykke-Andersen J, Fritzler MJ, Scheuner D, Kaufman RJ, Golan DE, Anderson P (2005) Stress granules and processing bodies are dynamically linked sites of mRNP remodeling. J Cell Biol 169: 871-84
Kedersha NL, Gupta M, Li W, Miller I, Anderson P (1999) RNA-binding proteins TIA-1 and TIAR link the phosphorylation of eIF-2 alpha to the assembly of mammalian stress granules. J Cell Biol 147: 1431-42
Keep NH, Norwood FL, Moores CA, Winder SJ, Kendrick-Jones J (1999) The 2.0 A structure of the second calponin homology domain from the actin-binding region of the dystrophin homologue utrophin. J Mol Biol 285: 1257-64
Keller ET, Yao Z (2002) Applications of high-throughput methods to cancer metastases. J Musculoskelet Neuronal Interact 2: 575-8
Kelter AR, Herchenbach J, Wirth B (2000) The transcription factor-like nuclear regulator (TFNR) contains a novel 55-amino-acid motif repeated nine times and maps closely to SMN1. Genomics 70: 315-26
Kendler KS, Karkowski-Shuman L, O'Neill FA, Straub RE, MacLean CJ, Walsh D (1997) Resemblance of psychotic symptoms and syndromes in affected sibling pairs from the Irish Study of High-Density Schizophrenia Families: evidence for possible etiologic heterogeneity. Am J Psychiatry 154: 191-8
Kerr DA, Nery JP, Traystman RJ, Chau BN, Hardwick JM (2000) Survival motor neuron protein modulates neuron-specific apoptosis. Proc Natl Acad Sci U S A 97: 13312-7
Kim YS, Furman S, Sink H, VanBerkum MF (2001) Calmodulin and profilin coregulate axon outgrowth in Drosophila. J Neurobiol 47: 26-38
Kimball SR, Horetsky RL, Ron D, Jefferson LS, Harding HP (2003) Mammalian stress granules represent sites of accumulation of stalled translation initiation complexes. Am J Physiol Cell Physiol 284: C273-84
Kinali M, Mercuri E, Main M, De Biasia F, Karatza A, Higgins R, Banks LM, Manzur AY, Muntoni F (2002) Pilot trial of albuterol in spinal muscular atrophy. Neurology 59: 609-10
Kislauskis EH, Zhu X, Singer RH (1994) Sequences responsible for intracellular localization of beta-actin messenger RNA also affect cell phenotype. J Cell Biol 127: 441-51
Klaman LD, Thorley-Lawson DA (1995) Characterization of the CD48 gene demonstrates a positive element that is specific to Epstein-Barr virus-immortalized B-cell lines and contains an essential NF-kappa B site. J Virol 69: 871-81
Klein MG, Shi W, Ramagopal U, Tseng Y, Wirtz D, Kovar DR, Staiger CJ, Almo SC (2004) Structure of the actin crosslinking core of fimbrin. Structure 12: 999-1013
Kobayashi H, Baumbach L, Matise TC, Schiavi A, Greenberg F, Hoffman EP (1995) A gene for a severe lethal form of X-linked arthrogryposis (X-linked infantile spinal muscular atrophy) maps to human chromosome Xp11.3-q11.2. Hum Mol Genet 4: 1213-6
Kobayashi K, Sueyoshi T, Inoue K, Moore R, Negishi M (2003) Cytoplasmic accumulation of the nuclear receptor CAR by a tetratricopeptide repeat protein in HepG2 cells. Mol Pharmacol 64: 1069-75
Kocarek TA, Mercer-Haines NA (2002) Squalestatin 1-inducible expression of rat CYP2B: evidence that an endogenous isoprenoid is an activator of the constitutive androstane receptor. Mol Pharmacol 62: 1177-86
Koenig E, Martin R (1996) Cortical plaque-like structures identify ribosome-containing domains in the Mauthner cell axon. J Neurosci 16: 1400-11
Koenig E, Martin R, Titmus M, Sotelo-Silveira JR (2000) Cryptic peripheral ribosomal domains distributed intermittently along mammalian myelinated axons. J Neurosci 20: 8390-400
REFERENCES 191
Kovar DR, Staiger CJ, Weaver EA, McCurdy DW (2000) AtFim1 is an actin filament crosslinking protein from Arabidopsis thaliana. Plant J 24: 625-36
Kramer OH, Zhu P, Ostendorff HP, Golebiewski M, Tiefenbach J, Peters MA, Brill B, Groner B, Bach I, Heinzel T, Gottlicher M (2003) The histone deacetylase inhibitor valproic acid selectively induces proteasomal degradation of HDAC2. Embo J 22: 3411-20
Krauer KG, Buck M, Belzer DK, Flanagan J, Chojnowski GM, Sculley TB (2004) The Epstein-Barr virus nuclear antigen-6 protein co-localizes with EBNA-3 and survival of motor neurons protein. Virology 318: 280-94
Kruglyak L, Daly MJ, Reeve-Daly MP, Lander ES (1996) Parametric and nonparametric linkage analysis: a unified multipoint approach. Am J Hum Genet 58: 1347-63
Kubler E, Riezman H (1993) Actin and fimbrin are required for the internalization step of endocytosis in yeast. Embo J 12: 2855-62
Kurihara N, Menaa C, Maeda H, Haile DJ, Reddy SV (2001) Osteoclast-stimulating factor interacts with the spinal muscular atrophy gene product to stimulate osteoclast formation. J Biol Chem 276: 41035-9
La Bella V, Cisterni C, Salaun D, Pettmann B (1998) Survival motor neuron (SMN) protein in rat is expressed as different molecular forms and is developmentally regulated. Eur J Neurosci 10: 2913-23
La Spada AR, Wilson EM, Lubahn DB, Harding AE, Fischbeck KH (1991) Androgen receptor gene mutations in X-linked spinal and bulbar muscular atrophy. Nature 352: 77-9
Lambrechts A, Braun A, Jonckheere V, Aszodi A, Lanier LM, Robbens J, Van Colen I, Vandekerckhove J, Fassler R, Ampe C (2000a) Profilin II is alternatively spliced, resulting in profilin isoforms that are differentially expressed and have distinct biochemical properties. Mol Cell Biol 20: 8209-19
Lambrechts A, Kwiatkowski AV, Lanier LM, Bear JE, Vandekerckhove J, Ampe C, Gertler FB (2000b) cAMP-dependent protein kinase phosphorylation of EVL, a Mena/VASP relative, regulates its interaction with actin and SH3 domains. J Biol Chem 275: 36143-51
Lambrechts A, Verschelde JL, Jonckheere V, Goethals M, Vandekerckhove J, Ampe C (1997) The mammalian profilin isoforms display complementary affinities for PIP2 and proline-rich sequences. Embo J 16: 484-94
Lanier LM, Gates MA, Witke W, Menzies AS, Wehman AM, Macklis JD, Kwiatkowski D, Soriano P, Gertler FB (1999) Mena is required for neurulation and commissure formation. Neuron 22: 313-25
Lassing I, Lindberg U (1985) Specific interaction between phosphatidylinositol 4,5-bisphosphate and profilactin. Nature 314: 472-4
Leavitt J, Goldman D, Merril C, Kakunaga T (1982) Changes in gene expression accompanying chemically-induced malignant transformation of human fibroblasts. Carcinogenesis 3: 61-70
Leavitt J, Kakunaga T (1980) Expression of a variant form of actin and additional polypeptide changes following chemical-induced in vitro neoplastic transformation of human fibroblasts. J Biol Chem 255: 1650-61
Lebart MC, Hubert F, Boiteau C, Venteo S, Roustan C, Benyamin Y (2004) Biochemical characterization of the L-plastin-actin interaction shows a resemblance with that of alpha-actinin and allows a distinction to be made between the two actin-binding domains of the molecule. Biochemistry 43: 2428-37
Lee KH, Ryu CJ, Hong HJ, Kim J, Lee EH (2005) CDNA microarray analysis of nerve growth factor-regulated gene expression profile in rat PC12 cells. Neurochem Res 30: 533-40
Lee YA, Ruschendorf F, Windemuth C, Schmitt-Egenolf M, Stadelmann A, Nurnberg G, Stander M, Wienker TF, Reis A, Traupe H (2000) Genomewide scan in german families reveals evidence for a novel psoriasis-susceptibility locus on chromosome 19p13. Am J Hum Genet 67: 1020-4
Lefebvre S, Burglen L, Reboullet S, Clermont O, Burlet P, Viollet L, Benichou B, Cruaud C, Millasseau P, Zeviani M, et al. (1995) Identification and characterization of a spinal muscular atrophy-determining gene. Cell 80: 155-65
Lefebvre S, Burlet P, Liu Q, Bertrandy S, Clermont O, Munnich A, Dreyfuss G, Melki J (1997) Correlation between severity and SMN protein level in spinal muscular atrophy. Nat Genet 16: 265-9
Lefebvre S, Burlet P, Viollet L, Bertrandy S, Huber C, Belser C, Munnich A (2002) A novel association of the SMN protein with two major non-ribosomal nucleolar proteins and its implication in spinal muscular atrophy. Hum Mol Genet 11: 1017-27
Letourneau PC, Shattuck TA (1989) Distribution and possible interactions of actin-associated proteins and cell adhesion molecules of nerve growth cones. Development 105: 505-19

REFERENCES 192
Lim SR, Hertel KJ (2001) Modulation of survival motor neuron pre-mRNA splicing by inhibition of alternative 3' splice site pairing. J Biol Chem 276: 45476-83
Lin CH, Thompson CA, Forscher P (1994a) Cytoskeletal reorganization underlying growth cone motility. Curr Opin Neurobiol 4: 640-7
Lin CS, Aebersold RH, Kent SB, Varma M, Leavitt J (1988) Molecular cloning and characterization of plastin, a human leukocyte protein expressed in transformed human fibroblasts. Mol Cell Biol 8: 4659-68
Lin CS, Chen ZP, Park T, Ghosh K, Leavitt J (1993a) Characterization of the human L-plastin gene promoter in normal and neoplastic cells. J Biol Chem 268: 2793-801
Lin CS, Lau A, Huynh T, Lue TF (1999) Differential regulation of human T-plastin gene in leukocytes and non-leukocytes: identification of the promoter, enhancer, and CpG island. DNA Cell Biol 18: 27-37
Lin CS, Park T, Chen ZP, Leavitt J (1993b) Human plastin genes. Comparative gene structure, chromosome location, and differential expression in normal and neoplastic cells. J Biol Chem 268: 2781-92
Lin CS, Shen W, Chen ZP, Tu YH, Matsudaira P (1994b) Identification of I-plastin, a human fimbrin isoform expressed in intestine and kidney. Mol Cell Biol 14: 2457-67
Liu CY, Schroder M, Kaufman RJ (2000) Ligand-independent dimerization activates the stress response kinases IRE1 and PERK in the lumen of the endoplasmic reticulum. J Biol Chem 275: 24881-5
Liu J, Taylor DW, Taylor KA (2004) A 3-D reconstruction of smooth muscle alpha-actinin by CryoEm reveals two different conformations at the actin-binding region. J Mol Biol 338: 115-25
Liu Q, Dreyfuss G (1996) A novel nuclear structure containing the survival of motor neurons protein. Embo J 15: 3555-65
Liu Q, Fischer U, Wang F, Dreyfuss G (1997) The spinal muscular atrophy disease gene product, SMN, and its associated protein SIP1 are in a complex with spliceosomal snRNP proteins. Cell 90: 1013-21
Long RM, Gu W, Lorimer E, Singer RH, Chartrand P (2000) She2p is a novel RNA-binding protein that recruits the Myo4p-She3p complex to ASH1 mRNA. Embo J 19: 6592-601
Lorson CL, Androphy EJ (1998) The domain encoded by exon 2 of the survival motor neuron protein mediates nucleic acid binding. Hum Mol Genet 7: 1269-75
Lorson CL, Androphy EJ (2000) An exonic enhancer is required for inclusion of an essential exon in the SMA-determining gene SMN. Hum Mol Genet 9: 259-65
Lorson CL, Hahnen E, Androphy EJ, Wirth B (1999) A single nucleotide in the SMN gene regulates splicing and is responsible for spinal muscular atrophy. Proc Natl Acad Sci U S A 96: 6307-11
Lorson CL, Strasswimmer J, Yao JM, Baleja JD, Hahnen E, Wirth B, Le T, Burghes AH, Androphy EJ (1998) SMN oligomerization defect correlates with spinal muscular atrophy severity. Nat Genet 19: 63-6
Luger K, Mader AW, Richmond RK, Sargent DF, Richmond TJ (1997) Crystal structure of the nucleosome core particle at 2.8 A resolution. Nature 389: 251-60
Lunn MR, Root DE, Martino AM, Flaherty SP, Kelley BP, Coovert DD, Burghes AH, Man NT, Morris GE, Zhou J, Androphy EJ, Sumner CJ, Stockwell BR (2004) Indoprofen upregulates the survival motor neuron protein through a cyclooxygenase-independent mechanism. Chem Biol 11: 1489-93
Luo L (2002) Actin cytoskeleton regulation in neuronal morphogenesis and structural plasticity. Annu Rev Cell Dev Biol 18: 601-35
Lynch M, Conery JS (2000) The evolutionary fate and consequences of duplicate genes. Science 290: 1151-5
Maas T, Eidenmuller J, Brandt R (2000) Interaction of tau with the neural membrane cortex is regulated by phosphorylation at sites that are modified in paired helical filaments. J Biol Chem 275: 15733-40
Machesky LM, May RC (2001) Arps: actin-related proteins. Results Probl Cell Differ 32: 213-29 Maestri NE, Brusilow SW, Clissold DB, Bassett SS (1996) Long-term treatment of girls with ornithine
transcarbamylase deficiency. N Engl J Med 335: 855-9 Maglich JM, Parks DJ, Moore LB, Collins JL, Goodwin B, Billin AN, Stoltz CA, Kliewer SA, Lambert MH,
Willson TM, Moore JT (2003) Identification of a novel human constitutive androstane receptor (CAR) agonist and its use in the identification of CAR target genes. J Biol Chem 278: 17277-83
Maglich JM, Stoltz CM, Goodwin B, Hawkins-Brown D, Moore JT, Kliewer SA (2002) Nuclear pregnane x receptor and constitutive androstane receptor regulate overlapping but distinct sets of genes involved in xenobiotic detoxification. Mol Pharmacol 62: 638-46

REFERENCES 193
Maglich JM, Watson J, McMillen PJ, Goodwin B, Willson TM, Moore JT (2004) The nuclear receptor CAR is a regulator of thyroid hormone metabolism during caloric restriction. J Biol Chem 279: 19832-8
Makinen J, Frank C, Jyrkkarinne J, Gynther J, Carlberg C, Honkakoski P (2002) Modulation of mouse and human phenobarbital-responsive enhancer module by nuclear receptors. Mol Pharmacol 62: 366-78
Manley JL, Tacke R (1996) SR proteins and splicing control. Genes Dev 10: 1569-79 Marks P, Rifkind RA, Richon VM, Breslow R, Miller T, Kelly WK (2001) Histone deacetylases and cancer:
causes and therapies. Nat Rev Cancer 1: 194-202 Marks PA, Richon VM, Miller T, Kelly WK (2004) Histone deacetylase inhibitors. Adv Cancer Res 91: 137-
68 Matas OB, Fritz S, Luna A, Egea G (2005) Membrane trafficking at the ER/Golgi interface: functional
implications of RhoA and Rac1. Eur J Cell Biol 84: 699-707 Matsudaira P (1991) Modular organization of actin crosslinking proteins. Trends Biochem Sci 16: 87-92 Matsudaira P (1994) Actin crosslinking proteins at the leading edge. Semin Cell Biol 5: 165-74 Matsudaira P, Mandelkow E, Renner W, Hesterberg LK, Weber K (1983) Role of fimbrin and villin in
determining the interfilament distances of actin bundles. Nature 301: 209-14 Mattern KA, van der Kraan I, Schul W, de Jong L, van Driel R (1999) Spatial organization of four hnRNP
proteins in relation to sites of transcription, to nuclear speckles, and to each other in interphase nuclei and nuclear matrices of HeLa cells. Exp Cell Res 246: 461-70
Matthijs G, Schollen E, Legius E, Devriendt K, Goemans N, Kayserili H, Apak MY, Cassiman JJ (1996) Unusual molecular findings in autosomal recessive spinal muscular atrophy. J Med Genet 33: 469-74
Maxam AM, Gilbert W (1980) Sequencing end-labeled DNA with base-specific chemical cleavages. Methods Enzymol 65: 499-560
Mayeda A, Badolato J, Kobayashi R, Zhang MQ, Gardiner EM, Krainer AR (1999) Purification and characterization of human RNPS1: a general activator of pre-mRNA splicing. Embo J 18: 4560-70
Mayumi K, Yaoi T, Kawai J, Kojima S, Watanabe S, Suzuki H (1998) Improved restriction landmark cDNA scanning and its application to global analysis of genes regulated by nerve growth factor in PC12 cells. Biochim Biophys Acta 1399: 10-8
Mazroui R, Huot ME, Tremblay S, Filion C, Labelle Y, Khandjian EW (2002) Trapping of messenger RNA by Fragile X Mental Retardation protein into cytoplasmic granules induces translation repression. Hum Mol Genet 11: 3007-17
Mazzarella R, Schlessinger D (1998) Pathological consequences of sequence duplications in the human genome. Genome Res 8: 1007-21
McAndrew PE, Parsons DW, Simard LR, Rochette C, Ray PN, Mendell JR, Prior TW, Burghes AH (1997) Identification of proximal spinal muscular atrophy carriers and patients by analysis of SMNT and SMNC gene copy number. Am J Hum Genet 60: 1411-22
McCurdy DW, Kim M (1998) Molecular cloning of a novel fimbrin-like cDNA from Arabidopsis thaliana. Plant Mol Biol 36: 23-31
McWhorter ML, Monani UR, Burghes AH, Beattie CE (2003) Knockdown of the survival motor neuron (Smn) protein in zebrafish causes defects in motor axon outgrowth and pathfinding. J Cell Biol 162: 919-31
Meberg PJ (2000) Signal-regulated ADF/cofilin activity and growth cone motility. Mol Neurobiol 21: 97-107 Meberg PJ, Bamburg JR (2000) Increase in neurite outgrowth mediated by overexpression of actin
depolymerizing factor. J Neurosci 20: 2459-69 Meister G, Buhler D, Laggerbauer B, Zobawa M, Lottspeich F, Fischer U (2000) Characterization of a
nuclear 20S complex containing the survival of motor neurons (SMN) protein and a specific subset of spliceosomal Sm proteins. Hum Mol Genet 9: 1977-86
Meister G, Buhler D, Pillai R, Lottspeich F, Fischer U (2001a) A multiprotein complex mediates the ATP-dependent assembly of spliceosomal U snRNPs. Nat Cell Biol 3: 945-9
Meister G, Eggert C, Fischer U (2002) SMN-mediated assembly of RNPs: a complex story. Trends Cell Biol 12: 472-8
Meister G, Fischer U (2002) Assisted RNP assembly: SMN and PRMT5 complexes cooperate in the formation of spliceosomal UsnRNPs. Embo J 21: 5853-63
Meister G, Hannus S, Plottner O, Baars T, Hartmann E, Fakan S, Laggerbauer B, Fischer U (2001b) SMNrp is an essential pre-mRNA splicing factor required for the formation of the mature spliceosome. Embo J 20: 2304-14

REFERENCES 194
Melki J, Abdelhak S, Sheth P, Bachelot MF, Burlet P, Marcadet A, Aicardi J, Barois A, Carriere JP, Fardeau M, et al. (1990) Gene for chronic proximal spinal muscular atrophies maps to chromosome 5q. Nature 344: 767-8
Melki J, Lefebvre S, Burglen L, Burlet P, Clermont O, Millasseau P, Reboulet S, Benichou B, Zeviani M, Le Paslier D, et al. (1994a) [Physical study of big fragments and search strategy of genes. Application to locus of infant spinal muscular atrophies]. C R Seances Soc Biol Fil 188: 495-8
Melki J, Lefebvre S, Burglen L, Burlet P, Clermont O, Millasseau P, Reboullet S, Benichou B, Zeviani M, Le Paslier D, et al. (1994b) De novo and inherited deletions of the 5q13 region in spinal muscular atrophies. Science 264: 1474-7
Mercuri E, Messina S, Battini R, Berardinelli A, Boffi P, Bono R, Bruno C, Carboni N, Cini C, Colitto F, D'Amico A, Minetti C, Mirabella M, Mongini T, Morandi L, Dlamini N, Orcesi S, Pelliccioni M, Pane M, Pini A, Swan AV, Villanova M, Vita G, Main M, Muntoni F, Bertini E (2006) Reliability of the Hammersmith functional motor scale for spinal muscular atrophy in a multicentric study. Neuromuscul Disord 16: 93-8
Merlini L, Solari A, Vita G, Bertini E, Minetti C, Mongini T, Mazzoni E, Angelini C, Morandi L (2003) Role of gabapentin in spinal muscular atrophy: results of a multicenter, randomized Italian study. J Child Neurol 18: 537-41
Merrick WC, Anderson WF (1975) Purification and characterization of homogeneous protein synthesis initiation factor M1 from rabbit reticulocytes. J Biol Chem 250: 1197-206
Michaud S, Reed R (1993) A functional association between the 5' and 3' splice site is established in the earliest prespliceosome complex (E) in mammals. Genes Dev 7: 1008-20
Millard TH, Sharp SJ, Machesky LM (2004) Signalling to actin assembly via the WASP (Wiskott-Aldrich syndrome protein)-family proteins and the Arp2/3 complex. Biochem J 380: 1-17
Miller RG, Moore DH, Dronsky V, Bradley W, Barohn R, Bryan W, Prior TW, Gelinas DF, Iannaccone S, Kissel J, Leshner R, Mendell J, Mendoza M, Russman B, Samaha F, Smith S (2001) A placebo-controlled trial of gabapentin in spinal muscular atrophy. J Neurol Sci 191: 127-31
Miller S, Dykes D, Polesky H (1988) A simple salting out procedure for extracting DNA from human nucleated cells. Nucl. Acid. Res.: 1216:1215
Mine M, Koarada S, Sai T, Miyake K, Kimoto M (1998) Peptide-binding motifs of the mixed haplotype Abetaz/Aalphad major histocompatibility complex class II molecule: a restriction element for auto-reactive T cells in (NZBxNZW)F1 mice. Immunology 95: 577-84
Mintz PJ, Spector DL (2000) Compartmentalization of RNA processing factors within nuclear speckles. J Struct Biol 129: 241-51
Minucci S, Pelicci PG (2006) Histone deacetylase inhibitors and the promise of epigenetic (and more) treatments for cancer. Nat Rev Cancer 6: 38-51
Mirza A, Wu Q, Wang L, McClanahan T, Bishop WR, Gheyas F, Ding W, Hutchins B, Hockenberry T, Kirschmeier P, Greene JR, Liu S (2003) Global transcriptional program of p53 target genes during the process of apoptosis and cell cycle progression. Oncogene 22: 3645-54
Miyajima H, Miyaso H, Okumura M, Kurisu J, Imaizumi K (2002) Identification of a cis-acting element for the regulation of SMN exon 7 splicing. J Biol Chem 277: 23271-7
Miyaso H, Okumura M, Kondo S, Higashide S, Miyajima H, Imaizumi K (2003) An intronic splicing enhancer element in survival motor neuron (SMN) pre-mRNA. J Biol Chem 278: 15825-31
Mizutani A, Fukuda M, Ibata K, Shiraishi Y, Mikoshiba K (2000) SYNCRIP, a cytoplasmic counterpart of heterogeneous nuclear ribonucleoprotein R, interacts with ubiquitous synaptotagmin isoforms. J Biol Chem 275: 9823-31
Mohaghegh P, Rodrigues NR, Owen N, Ponting CP, Le TT, Burghes AH, Davies KE (1999) Analysis of mutations in the tudor domain of the survival motor neuron protein SMN. Eur J Hum Genet 7: 519-25
Mohr E, Richter D (2000) Axonal mRNAs: functional significance in vertebrates and invertebrates. J Neurocytol 29: 783-91
Monani UR (2005) Spinal muscular atrophy: a deficiency in a ubiquitous protein; a motor neuron-specific disease. Neuron 48: 885-96
Monani UR, Coovert DD, Burghes AH (2000) Animal models of spinal muscular atrophy. Hum Mol Genet 9: 2451-7
Monani UR, McPherson JD, Burghes AH (1999) Promoter analysis of the human centromeric and telomeric survival motor neuron genes (SMNC and SMNT). Biochim Biophys Acta 1445: 330-6
REFERENCES 195
Monani UR, Pastore MT, Gavrilina TO, Jablonka S, Le TT, Andreassi C, DiCocco JM, Lorson C, Androphy EJ, Sendtner M, Podell M, Burghes AH (2003) A transgene carrying an A2G missense mutation in the SMN gene modulates phenotypic severity in mice with severe (type I) spinal muscular atrophy. J Cell Biol 160: 41-52
Montpetit A, Nelis M, Laflamme P, Magi R, Ke X, Remm M, Cardon L, Hudson TJ, Metspalu A (2006) An evaluation of the performance of tag SNPs derived from HapMap in a Caucasian population. PLoS Genet 2: e27
Moore LB, Parks DJ, Jones SA, Bledsoe RK, Consler TG, Stimmel JB, Goodwin B, Liddle C, Blanchard SG, Willson TM, Collins JL, Kliewer SA (2000) Orphan nuclear receptors constitutive androstane receptor and pregnane X receptor share xenobiotic and steroid ligands. J Biol Chem 275: 15122-7
Mooseker MS (1983) Actin binding proteins of the brush border. Cell 35: 11-3 Mouaikel J, Narayanan U, Verheggen C, Matera AG, Bertrand E, Tazi J, Bordonne R (2003) Interaction
between the small-nuclear-RNA cap hypermethylase and the spinal muscular atrophy protein, survival of motor neuron. EMBO Rep 4: 616-22
Mourelatos Z, Abel L, Yong J, Kataoka N, Dreyfuss G (2001) SMN interacts with a novel family of hnRNP and spliceosomal proteins. Embo J 20: 5443-52
Mourelatos Z, Dostie J, Paushkin S, Sharma A, Charroux B, Abel L, Rappsilber J, Mann M, Dreyfuss G (2002) miRNPs: a novel class of ribonucleoproteins containing numerous microRNAs. Genes Dev 16: 720-8
Mueller PR, Wold B (1989) In vivo footprinting of a muscle specific enhancer by ligation mediated PCR. Science 246: 780-6
Munsat TL (1995) Issues in amyotrophic lateral sclerosis clinical trial design. Adv Neurol 68: 209-18 Munsat TL, Davies KE (1992) International SMA consortium meeting. (26-28 June 1992, Bonn, Germany).
Neuromuscul Disord 2: 423-8 Nakajima T, Uchida C, Anderson SF, Parvin JD, Montminy M (1997) Analysis of a cAMP-responsive
activator reveals a two-component mechanism for transcriptional induction via signal-dependent factors. Genes Dev 11: 738-47
Nakano K, Satoh K, Morimatsu A, Ohnuma M, Mabuchi I (2001) Interactions among a fimbrin, a capping protein, and an actin-depolymerizing factor in organization of the fission yeast actin cytoskeleton. Mol Biol Cell 12: 3515-26
Namba Y, Ito M, Zu Y, Shigesada K, Maruyama K (1992) Human T cell L-plastin bundles actin filaments in a calcium-dependent manner. J Biochem (Tokyo) 112: 503-7
Narayanan U, Achsel T, Luhrmann R, Matera AG (2004) Coupled in vitro import of U snRNPs and SMN, the spinal muscular atrophy protein. Mol Cell 16: 223-34
Narayanan U, Ospina JK, Frey MR, Hebert MD, Matera AG (2002) SMN, the spinal muscular atrophy protein, forms a pre-import snRNP complex with snurportin1 and importin beta. Hum Mol Genet 11: 1785-95
Nasim MT, Chernova TK, Chowdhury HM, Yue BG, Eperon IC (2003) HnRNP G and Tra2beta: opposite effects on splicing matched by antagonism in RNA binding. Hum Mol Genet 12: 1337-48
Navascues J, Berciano MT, Tucker KE, Lafarga M, Matera AG (2004) Targeting SMN to Cajal bodies and nuclear gems during neuritogenesis. Chromosoma 112: 398-409
Nayler O, Cap C, Stamm S (1998) Human transformer-2-beta gene (SFRS10): complete nucleotide sequence, chromosomal localization, and generation of a tissue-specific isoform. Genomics 53: 191-202
Nesic D, Tanackovic G, Kramer A (2004) A role for Cajal bodies in the final steps of U2 snRNP biogenesis. J Cell Sci 117: 4423-33
Neuwald AF, Koonin EV (1998) Ataxin-2, global regulators of bacterial gene expression, and spliceosomal snRNP proteins share a conserved domain. J Mol Med 76: 3-5
Nooren IM, Thornton JM (2003a) Diversity of protein-protein interactions. Embo J 22: 3486-92 Nooren IM, Thornton JM (2003b) Structural characterisation and functional significance of transient
protein-protein interactions. J Mol Biol 325: 991-1018 Nover L, Scharf KD, Neumann D (1989) Cytoplasmic heat shock granules are formed from precursor
particles and are associated with a specific set of mRNAs. Mol Cell Biol 9: 1298-308 Obermann H, Raabe I, Balvers M, Brunswig B, Schulze W, Kirchhoff C (2005) Novel testis-expressed
profilin IV associated with acrosome biogenesis and spermatid elongation. Mol Hum Reprod 11: 53-64
Ogg SC, Lamond AI (2002) Cajal bodies and coilin--moving towards function. J Cell Biol 159: 17-21

REFERENCES 196
Ogino S, Wilson RB (2004) Spinal muscular atrophy: molecular genetics and diagnostics. Expert Rev Mol Diagn 4: 15-29
Ogryzko VV, Schiltz RL, Russanova V, Howard BH, Nakatani Y (1996) The transcriptional coactivators p300 and CBP are histone acetyltransferases. Cell 87: 953-9
Olaso R, Joshi V, Fernandez J, Roblot N, Courageot S, Bonnefont JP, Melki J (2006) Activation of RNA metabolism-related genes in mouse but not human tissues deficient in SMN. Physiol Genomics 24: 97-104
Oleynikov Y, Singer RH (2003) Real-time visualization of ZBP1 association with beta-actin mRNA during transcription and localization. Curr Biol 13: 199-207
Otter S, Grimmler M, Neuenkirchen N, Chari A, Sickmann A, Fischer U (2006) A comprehensive interaction map of the human SMN-complex. J Biol Chem
Ozdinler PH, Macklis JD (2006) IGF-I specifically enhances axon outgrowth of corticospinal motor neurons. Nat Neurosci 9: 1371-81
Pagliardini S, Giavazzi A, Setola V, Lizier C, Di Luca M, DeBiasi S, Battaglia G (2000) Subcellular localization and axonal transport of the survival motor neuron (SMN) protein in the developing rat spinal cord. Hum Mol Genet 9: 47-56
Palazzo A, Ackerman B, Gundersen GG (2003) Cell biology: Tubulin acetylation and cell motility. Nature 421: 230
Pantaloni D, Carlier MF (1993) How profilin promotes actin filament assembly in the presence of thymosin beta 4. Cell 75: 1007-14
Park JW, Voss PG, Grabski S, Wang JL, Patterson RJ (2001) Association of galectin-1 and galectin-3 with Gemin4 in complexes containing the SMN protein. Nucleic Acids Res 29: 3595-602
Park SH, Bolender N, Eisele F, Kostova Z, Takeuchi J, Coffino P, Wolf DH (2007) The cytoplasmic Hsp70 chaperone machinery subjects misfolded and endoplasmic reticulum import-incompetent proteins to degradation via the ubiquitin-proteasome system. Mol Biol Cell 18: 153-65
Parsons DW, McAndrew PE, Iannaccone ST, Mendell JR, Burghes AH, Prior TW (1998) Intragenic telSMN mutations: frequency, distribution, evidence of a founder effect, and modification of the spinal muscular atrophy phenotype by cenSMN copy number. Am J Hum Genet 63: 1712-23
Pascussi JM, Gerbal-Chaloin S, Fabre JM, Maurel P, Vilarem MJ (2000) Dexamethasone enhances constitutive androstane receptor expression in human hepatocytes: consequences on cytochrome P450 gene regulation. Mol Pharmacol 58: 1441-50
Patil N, Berno AJ, Hinds DA, Barrett WA, Doshi JM, Hacker CR, Kautzer CR, Lee DH, Marjoribanks C, McDonough DP, Nguyen BT, Norris MC, Sheehan JB, Shen N, Stern D, Stokowski RP, Thomas DJ, Trulson MO, Vyas KR, Frazer KA, Fodor SP, Cox DR (2001) Blocks of limited haplotype diversity revealed by high-resolution scanning of human chromosome 21. Science 294: 1719-23
Paushkin S, Gubitz AK, Massenet S, Dreyfuss G (2002) The SMN complex, an assemblyosome of ribonucleoproteins. Curr Opin Cell Biol 14: 305-12
Pearn J (1980) Classification of spinal muscular atrophies. Lancet 1: 919-22 Pellizzoni L, Baccon J, Charroux B, Dreyfuss G (2001a) The survival of motor neurons (SMN) protein
interacts with the snoRNP proteins fibrillarin and GAR1. Curr Biol 11: 1079-88 Pellizzoni L, Baccon J, Rappsilber J, Mann M, Dreyfuss G (2001b) Purification of native SMN complexes
and identification of Gemin6 as a novel component. J Biol Chem Pellizzoni L, Baccon J, Rappsilber J, Mann M, Dreyfuss G (2002a) Purification of native survival of motor
neurons complexes and identification of Gemin6 as a novel component. J Biol Chem 277: 7540-5 Pellizzoni L, Charroux B, Dreyfuss G (1999) SMN mutants of spinal muscular atrophy patients are
defective in binding to snRNP proteins. Proc Natl Acad Sci U S A 96: 11167-72 Pellizzoni L, Charroux B, Rappsilber J, Mann M, Dreyfuss G (2001c) A functional interaction between the
survival motor neuron complex and RNA polymerase II. J Cell Biol 152: 75-85 Pellizzoni L, Kataoka N, Charroux B, Dreyfuss G (1998) A novel function for SMN, the spinal muscular
atrophy disease gene product, in pre-mRNA splicing. Cell 95: 615-24 Pellizzoni L, Yong J, Dreyfuss G (2002b) Essential Role for the SMN Complex in the Specificity of snRNP
Assembly. Science 298: 1775-9 Percipalle P, Zhao J, Pope B, Weeds A, Lindberg U, Daneholt B (2001) Actin bound to the heterogeneous
nuclear ribonucleoprotein hrp36 is associated with Balbiani ring mRNA from the gene to polysomes. J Cell Biol 153: 229-36
Peterson CA, Gordon H, Hall ZW, Paterson BM, Blau HM (1990) Negative control of the helix-loop-helix family of myogenic regulators in the NFB mutant. Cell 62: 493-502

REFERENCES 197
Podvinec M, Handschin C, Looser R, Meyer UA (2004) Identification of the xenosensors regulating human 5-aminolevulinate synthase. Proc Natl Acad Sci U S A 101: 9127-32
Pollard TD (2003) The cytoskeleton, cellular motility and the reductionist agenda. Nature 422: 741-5 Pollard TD, Blanchoin L, Mullins RD (2000) Molecular mechanisms controlling actin filament dynamics in
nonmuscle cells. Annu Rev Biophys Biomol Struct 29: 545-76 Pollard TD, Cooper JA (1986) Actin and actin-binding proteins. A critical evaluation of mechanisms and
functions. Annu Rev Biochem 55: 987-1035 Ponting CP (1997) Tudor domains in proteins that interact with RNA. Trends Biochem Sci 22: 51-2 Povey S, Lovering R, Bruford E, Wright M, Lush M, Wain H (2001) The HUGO Gene Nomenclature
Committee (HGNC). Hum Genet 109: 678-80 Prassler J, Stocker S, Marriott G, Heidecker M, Kellermann J, Gerisch G (1997) Interaction of a
Dictyostelium member of the plastin/fimbrin family with actin filaments and actin-myosin complexes. Mol Biol Cell 8: 83-95
Prevost MC, Lesourd M, Arpin M, Vernel F, Mounier J, Hellio R, Sansonetti PJ (1992) Unipolar reorganization of F-actin layer at bacterial division and bundling of actin filaments by plastin correlate with movement of Shigella flexneri within HeLa cells. Infect Immun 60: 4088-99
Qatanani M, Wei P, Moore DD (2004) Alterations in the distribution and orexigenic effects of dexamethasone in CAR-null mice. Pharmacol Biochem Behav 78: 285-91
Ralser M, Albrecht M, Nonhoff U, Lengauer T, Lehrach H, Krobitsch S (2005a) An integrative approach to gain insights into the cellular function of human ataxin-2. J Mol Biol 346: 203-14
Ralser M, Nonhoff U, Albrecht M, Lengauer T, Wanker EE, Lehrach H, Krobitsch S (2005b) Ataxin-2 and huntingtin interact with endophilin-A complexes to function in plastin-associated pathways. Hum Mol Genet 14: 2893-909
Reinhard M, Halbrugge M, Scheer U, Wiegand C, Jockusch BM, Walter U (1992) The 46/50 kDa phosphoprotein VASP purified from human platelets is a novel protein associated with actin filaments and focal contacts. Embo J 11: 2063-70
Renvoise B, Khoobarry K, Gendron MC, Cibert C, Viollet L, Lefebvre S (2006) Distinct domains of the spinal muscular atrophy protein SMN are required for targeting to Cajal bodies in mammalian cells. J Cell Sci 119: 680-92
Ridley AJ, Hall A (1992a) Distinct patterns of actin organization regulated by the small GTP-binding proteins Rac and Rho. Cold Spring Harb Symp Quant Biol 57: 661-71
Ridley AJ, Hall A (1992b) The small GTP-binding protein rho regulates the assembly of focal adhesions and actin stress fibers in response to growth factors. Cell 70: 389-99
Ridley AJ, Paterson HF, Johnston CL, Diekmann D, Hall A (1992) The small GTP-binding protein rac regulates growth factor-induced membrane ruffling. Cell 70: 401-10
Riessland M, Brichta L, Hahnen E, Wirth B (2006) The benzamide M344, a novel histone deacetylase inhibitor, significantly increases SMN2 RNA/protein levels in spinal muscular atrophy (SMA) cells. Medgen: 113 (abstract P293)
Robertson KD (2002) DNA methylation and chromatin - unraveling the tangled web. Oncogene 21: 5361-79
Robertson KD (2005) DNA methylation and human disease. Nat Rev Genet 6: 597-610 Rochette CF, Gilbert N, Simard LR (2001) SMN gene duplication and the emergence of the SMN2 gene
occurred in distinct hominids: SMN2 is unique to Homo sapiens. Hum Genet 108: 255-66 Rodrigues NR, Owen N, Talbot K, Ignatius J, Dubowitz V, Davies KE (1995) Deletions in the survival
motor neuron gene on 5q13 in autosomal recessive spinal muscular atrophy. Hum Mol Genet 4: 631-4
Rodrigues NR, Owen N, Talbot K, Patel S, Muntoni F, Ignatius J, Dubowitz V, Davies KE (1996) Gene deletions in spinal muscular atrophy. J Med Genet 33: 93-6
Rohatgi R, Ma L, Miki H, Lopez M, Kirchhausen T, Takenawa T, Kirschner MW (1999) The interaction between N-WASP and the Arp2/3 complex links Cdc42-dependent signals to actin assembly. Cell 97: 221-31
Ronaghi M (2001) Pyrosequencing sheds light on DNA sequencing. Genome Res 11: 3-11 Ross AF, Oleynikov Y, Kislauskis EH, Taneja KL, Singer RH (1997) Characterization of a beta-actin
mRNA zipcode-binding protein. Mol Cell Biol 17: 2158-65 Rossoll W, Jablonka S, Andreassi C, Kroning AK, Karle K, Monani UR, Sendtner M (2003) Smn, the
spinal muscular atrophy-determining gene product, modulates axon growth and localization of beta-actin mRNA in growth cones of motoneurons. J Cell Biol 163: 801-12

REFERENCES 198
Rossoll W, Kroning AK, Ohndorf UM, Steegborn C, Jablonka S, Sendtner M (2002) Specific interaction of Smn, the spinal muscular atrophy determining gene product, with hnRNP-R and gry-rbp/hnRNP-Q: a role for Smn in RNA processing in motor axons? Hum Mol Genet 11: 93-105
Rothe F, Gueydan C, Bellefroid E, Huez G, Kruys V (2006) Identification of FUSE-binding proteins as interacting partners of TIA proteins. Biochem Biophys Res Commun 343: 57-68
Roy N, McLean MD, Besner-Johnston A, Lefebvre C, Salih M, Carpten JD, Burghes AH, Yaraghi Z, Ikeda JE, Korneluk RG, et al. (1995) Refined physical map of the spinal muscular atrophy gene (SMA) region at 5q13 based on YAC and cosmid contiguous arrays. Genomics 26: 451-60
Rubin CM, Schmid CW (1980) Pyrimidine-specific chemical reactions useful for DNA sequencing. Nucleic Acids Res 8: 4613-9
Rudnik-Schöneborn S, Rohrig D, Morgan G, Wirth B, Zerres K (1994) Autosomal recessive proximal spinal muscular atrophy in 101 sibs out of 48 families: clinical picture, influence of gender, and genetic implications. Am J Med Genet 51: 70-6
Russman BS, Iannaccone ST, Samaha FJ (2003) A phase 1 trial of riluzole in spinal muscular atrophy. Arch Neurol 60: 1601-3
Saini SP, Sonoda J, Xu L, Toma D, Uppal H, Mu Y, Ren S, Moore DD, Evans RM, Xie W (2004) A novel constitutive androstane receptor-mediated and CYP3A-independent pathway of bile acid detoxification. Mol Pharmacol 65: 292-300
Saji S, Kawakami M, Hayashi S, Yoshida N, Hirose M, Horiguchi S, Itoh A, Funata N, Schreiber SL, Yoshida M, Toi M (2005) Significance of HDAC6 regulation via estrogen signaling for cell motility and prognosis in estrogen receptor-positive breast cancer. Oncogene 24: 4531-9
Sambuughin N, Sivakumar K, Selenge B, Lee HS, Friedlich D, Baasanjav D, Dalakas MC, Goldfarb LG (1998) Autosomal dominant distal spinal muscular atrophy type V (dSMA-V) and Charcot-Marie-Tooth disease type 2D (CMT2D) segregate within a single large kindred and map to a refined region on chromosome 7p15. J Neurol Sci 161: 23-8
Sandrock TM, Brower SM, Toenjes KA, Adams AE (1999) Suppressor analysis of fimbrin (Sac6p) overexpression in yeast. Genetics 151: 1287-97
Sasaki Y, Itoh F, Kobayashi T, Kikuchi T, Suzuki H, Toyota M, Imai K (2002) Increased expression of T-fimbrin gene after DNA damage in CHO cells and inactivation of T-fimbrin by CpG methylation in human colorectal cancer cells. Int J Cancer 97: 211-6
Schaffert N, Hossbach M, Heintzmann R, Achsel T, Luhrmann R (2004) RNAi knockdown of hPrp31 leads to an accumulation of U4/U6 di-snRNPs in Cajal bodies. Embo J 23: 3000-9
Scharf JM, Damron D, Frisella A, Bruno S, Beggs AH, Kunkel LM, Dietrich WF (1996) The mouse region syntenic for human spinal muscular atrophy lies within the Lgn1 critical interval and contains multiple copies of Naip exon 5. Genomics 38: 405-17
Schmidt A, Hall MN (1998) Signaling to the actin cytoskeleton. Annu Rev Cell Dev Biol 14: 305-38 Schmutz J, Martin J, Terry A, Couronne O, Grimwood J, Lowry S, Gordon LA, Scott D, Xie G, Huang W,
Hellsten U, Tran-Gyamfi M, She X, Prabhakar S, Aerts A, Altherr M, Bajorek E, Black S, Branscomb E, Caoile C, Challacombe JF, Chan YM, Denys M, Detter JC, Escobar J, Flowers D, Fotopulos D, Glavina T, Gomez M, Gonzales E, Goodstein D, Grigoriev I, Groza M, Hammon N, Hawkins T, Haydu L, Israni S, Jett J, Kadner K, Kimball H, Kobayashi A, Lopez F, Lou Y, Martinez D, Medina C, Morgan J, Nandkeshwar R, Noonan JP, Pitluck S, Pollard M, Predki P, Priest J, Ramirez L, Retterer J, Rodriguez A, Rogers S, Salamov A, Salazar A, Thayer N, Tice H, Tsai M, Ustaszewska A, Vo N, Wheeler J, Wu K, Yang J, Dickson M, Cheng JF, Eichler EE, Olsen A, Pennacchio LA, Rokhsar DS, Richardson P, Lucas SM, Myers RM, Rubin EM (2004) The DNA sequence and comparative analysis of human chromosome 5. Nature 431: 268-74
Schneider ME, Belyantseva IA, Azevedo RB, Kachar B (2002) Rapid renewal of auditory hair bundles. Nature 418: 837-8
Schrank B, Gotz R, Gunnersen JM, Ure JM, Toyka KV, Smith AG, Sendtner M (1997) Inactivation of the survival motor neuron gene, a candidate gene for human spinal muscular atrophy, leads to massive cell death in early mouse embryos. Proc Natl Acad Sci U S A 94: 9920-5
Schwamborn JC, Puschel AW (2004) The sequential activity of the GTPases Rap1B and Cdc42 determines neuronal polarity. Nat Neurosci 7: 923-9
Selenko P, Sprangers R, Stier G, Buhler D, Fischer U, Sattler M (2001) SMN tudor domain structure and its interaction with the Sm proteins. Nat Struct Biol 8: 27-31
Shaffer AL, Yu X, He Y, Boldrick J, Chan EP, Staudt LM (2000) BCL-6 represses genes that function in lymphocyte differentiation, inflammation, and cell cycle control. Immunity 13: 199-212
REFERENCES 199
Sharma A, Lambrechts A, Hao le T, Le TT, Sewry CA, Ampe C, Burghes AH, Morris GE (2005) A role for complexes of survival of motor neurons (SMN) protein with gemins and profilin in neurite-like cytoplasmic extensions of cultured nerve cells. Exp Cell Res 309: 185-97
Sherr CJ (2000) Cell cycle control and cancer. Harvey Lect 96: 73-92 Sherr CJ, Weber JD (2000) The ARF/p53 pathway. Curr Opin Genet Dev 10: 94-9 Shibata H, Huynh DP, Pulst SM (2000) A novel protein with RNA-binding motifs interacts with ataxin-2.
Hum Mol Genet 9: 1303-13 Shinjo K, Koland JG, Hart MJ, Narasimhan V, Johnson DI, Evans T, Cerione RA (1990) Molecular cloning
of the gene for the human placental GTP-binding protein Gp (G25K): identification of this GTP-binding protein as the human homolog of the yeast cell-division-cycle protein CDC42. Proc Natl Acad Sci U S A 87: 9853-7
Shirayama S, Numata O (2003) Tetrahymena fimbrin localized in the division furrow bundles actin filaments in a calcium-independent manner. J Biochem (Tokyo) 134: 591-8
Shpargel KB, Matera AG (2005) Gemin proteins are required for efficient assembly of Sm-class ribonucleoproteins. Proc Natl Acad Sci U S A 102: 17372-7
Sif S, Saurin AJ, Imbalzano AN, Kingston RE (2001) Purification and characterization of mSin3A-containing Brg1 and hBrm chromatin remodeling complexes. Genes Dev 15: 603-18
Simic G, Seso-Simic D, Lucassen PJ, Islam A, Krsnik Z, Cviko A, Jelasic D, Barisic N, Winblad B, Kostovic I, Kruslin B (2000) Ultrastructural analysis and TUNEL demonstrate motor neuron apoptosis in Werdnig-Hoffmann disease. J Neuropathol Exp Neurol 59: 398-407
Singer RH, Green MR (1997) Compartmentalization of eukaryotic gene expression: causes and effects. Cell 91: 291-4
Singh NN, Androphy EJ, Singh RN (2004a) An extended inhibitory context causes skipping of exon 7 of SMN2 in spinal muscular atrophy. Biochem Biophys Res Commun 315: 381-8
Singh NN, Androphy EJ, Singh RN (2004b) In vivo selection reveals combinatorial controls that define a critical exon in the spinal muscular atrophy genes. Rna 10: 1291-305
Skordis LA, Dunckley MG, Yue B, Eperon IC, Muntoni F (2003) Bifunctional antisense oligonucleotides provide a trans-acting splicing enhancer that stimulates SMN2 gene expression in patient fibroblasts. Proc Natl Acad Sci U S A 100: 4114-9
Sleeman JE, Ajuh P, Lamond AI (2001) snRNP protein expression enhances the formation of Cajal bodies containing p80-coilin and SMN. J Cell Sci 114: 4407-19
Smale ST, Baltimore D (1989) The "initiator" as a transcription control element. Cell 57: 103-13 Soler-Botija C, Ferrer I, Gich I, Baiget M, Tizzano EF (2002) Neuronal death is enhanced and begins
during foetal development in type I spinal muscular atrophy spinal cord. Brain 125: 1624-34 Song F, Smith JF, Kimura MT, Morrow AD, Matsuyama T, Nagase H, Held WA (2005) Association of
tissue-specific differentially methylated regions (TDMs) with differential gene expression. Proc Natl Acad Sci U S A 102: 3336-41
Sotelo-Silveira JR, Calliari A, Kun A, Koenig E, Sotelo JR (2006) RNA trafficking in axons. Traffic 7: 508-15
Stanek D, Neugebauer KM (2004) Detection of snRNP assembly intermediates in Cajal bodies by fluorescence resonance energy transfer. J Cell Biol 166: 1015-25
Stoecklin G, Stubbs T, Kedersha N, Wax S, Rigby WF, Blackwell TK, Anderson P (2004) MK2-induced tristetraprolin:14-3-3 complexes prevent stress granule association and ARE-mRNA decay. Embo J 23: 1313-24
Stossel TP (1994) The machinery of cell crawling. Sci Am 271: 54-5, 58-63 Strasswimmer J, Lorson CL, Breiding DE, Chen JJ, Le T, Burghes AH, Androphy EJ (1999) Identification
of survival motor neuron as a transcriptional activator-binding protein. Hum Mol Genet 8: 1219-26 Sueyoshi T, Kawamoto T, Zelko I, Honkakoski P, Negishi M (1999) The repressed nuclear receptor CAR
responds to phenobarbital in activating the human CYP2B6 gene. J Biol Chem 274: 6043-6 Sugatani J, Kojima H, Ueda A, Kakizaki S, Yoshinari K, Gong QH, Owens IS, Negishi M, Sueyoshi T
(2001) The phenobarbital response enhancer module in the human bilirubin UDP-glucuronosyltransferase UGT1A1 gene and regulation by the nuclear receptor CAR. Hepatology 33: 1232-8
Sumner CJ, Huynh TN, Markowitz JA, Perhac JS, Hill B, Coovert DD, Schussler K, Chen X, Jarecki J, Burghes AH, Taylor JP, Fischbeck KH (2003) Valproic acid increases SMN levels in spinal muscular atrophy patient cells. Ann Neurol 54: 647-54

REFERENCES 200
Sun Y, Grimmler M, Schwarzer V, Schoenen F, Fischer U, Wirth B (2005) Molecular and functional analysis of intragenic SMN1 mutations in patients with spinal muscular atrophy. Hum Mutat 25: 64-71
Suter DM, Forscher P (2000) Substrate-cytoskeletal coupling as a mechanism for the regulation of growth cone motility and guidance. J Neurobiol 44: 97-113
Svitkina TM, Borisy GG (1999) Progress in protrusion: the tell-tale scar. Trends Biochem Sci 24: 432-6 Swoboda KJ, Prior TW, Scott CB, McNaught TP, Wride MC, Reyna SP, Bromberg MB (2005) Natural
history of denervation in SMA: relation to age, SMN2 copy number, and function. Ann Neurol 57: 704-12
Tacke R, Tohyama M, Ogawa S, Manley JL (1998) Human Tra2 proteins are sequence-specific activators of pre-mRNA splicing. Cell 93: 139-48
Tang MX, Redemann CT, Szoka FC, Jr. (1996) In vitro gene delivery by degraded polyamidoamine dendrimers. Bioconjug Chem 7: 703-14
Thomas MG, Martinez Tosar LJ, Loschi M, Pasquini JM, Correale J, Kindler S, Boccaccio GL (2005) Staufen recruitment into stress granules does not affect early mRNA transport in oligodendrocytes. Mol Biol Cell 16: 405-20
Thomas P, Smart TG (2005) HEK293 cell line: a vehicle for the expression of recombinant proteins. J Pharmacol Toxicol Methods 51: 187-200
Thompson TG, DiDonato CJ, Simard LR, Ingraham SE, Burghes AH, Crawford TO, Rochette C, Mendell JR, Wasmuth JJ (1995) A novel cDNA detects homozygous microdeletions in greater than 50% of type I spinal muscular atrophy patients. Nat Genet 9: 56-62
Timmers AC, Niebel A, Balague C, Dagkesamanskaya A (2002) Differential localisation of GFP fusions to cytoskeleton-binding proteins in animal, plant, and yeast cells. Green-fluorescent protein. Protoplasma 220: 69-78
Tiruchinapalli DM, Oleynikov Y, Kelic S, Shenoy SM, Hartley A, Stanton PK, Singer RH, Bassell GJ (2003) Activity-dependent trafficking and dynamic localization of zipcode binding protein 1 and beta-actin mRNA in dendrites and spines of hippocampal neurons. J Neurosci 23: 3251-61
Tischler AS, Greene LA (1975) Nerve growth factor-induced process formation by cultured rat pheochromocytoma cells. Nature 258: 341-2
Tizzano EF, Cabot C, Baiget M (1998) Cell-specific survival motor neuron gene expression during human development of the central nervous system: implications for the pathogenesis of spinal muscular atrophy. Am J Pathol 153: 355-61
Tost J, Dunker J, Gut IG (2003) Analysis and quantification of multiple methylation variable positions in CpG islands by Pyrosequencing. Biotechniques 35: 152-6
Tourriere H, Chebli K, Zekri L, Courselaud B, Blanchard JM, Bertrand E, Tazi J (2003) The RasGAP-associated endoribonuclease G3BP assembles stress granules. J Cell Biol 160: 823-31
Trulzsch B, Davies K, Wood M (2004) Survival of motor neuron gene downregulation by RNAi: towards a cell culture model of spinal muscular atrophy. Brain Res Mol Brain Res 120: 145-50
Ueda A, Hamadeh HK, Webb HK, Yamamoto Y, Sueyoshi T, Afshari CA, Lehmann JM, Negishi M (2002) Diverse roles of the nuclear orphan receptor CAR in regulating hepatic genes in response to phenobarbital. Mol Pharmacol 61: 1-6
Uhlmann K, Brinckmann A, Toliat MR, Ritter H, Nurnberg P (2002) Evaluation of a potential epigenetic biomarker by quantitative methyl-single nucleotide polymorphism analysis. Electrophoresis 23: 4072-9
van Bergeijk J, Rydel-Konecke K, Grothe C, Claus P (2007) The spinal muscular atrophy gene product regulates neurite outgrowth: importance of the C terminus. Faseb J
van der Vleuten AJ, van Ravenswaaij-Arts CM, Frijns CJ, Smits AP, Hageman G, Padberg GW, Kremer H (1998) Localisation of the gene for a dominant congenital spinal muscular atrophy predominantly affecting the lower limbs to chromosome 12q23-q24. Eur J Hum Genet 6: 376-82
Vandekerckhove J, Bauw G, Vancompernolle K, Honore B, Celis J (1990) Comparative two-dimensional gel analysis and microsequencing identifies gelsolin as one of the most prominent downregulated markers of transformed human fibroblast and epithelial cells. J Cell Biol 111: 95-102
Velasco E, Valero C, Valero A, Moreno F, Hernandez-Chico C (1996) Molecular analysis of the SMN and NAIP genes in Spanish spinal muscular atrophy (SMA) families and correlation between number of copies of cBCD541 and SMA phenotype. Hum Mol Genet 5: 257-63

REFERENCES 201
Venables JP, Bourgeois CF, Dalgliesh C, Kister L, Stevenin J, Elliott DJ (2005) Up-regulation of the ubiquitous alternative splicing factor Tra2beta causes inclusion of a germ cell-specific exon. Hum Mol Genet 14: 2289-303
Venables JP, Elliott DJ, Makarova OV, Makarov EM, Cooke HJ, Eperon IC (2000) RBMY, a probable human spermatogenesis factor, and other hnRNP G proteins interact with Tra2beta and affect splicing. Hum Mol Genet 9: 685-94
Verdel A, Khochbin S (1999) Identification of a new family of higher eukaryotic histone deacetylases. Coordinate expression of differentiation-dependent chromatin modifiers. J Biol Chem 274: 2440-5
Viollet L, Barois A, Rebeiz JG, Rifai Z, Burlet P, Zarhrate M, Vial E, Dessainte M, Estournet B, Kleinknecht B, Pearn J, Adams RD, Urtizberea JA, Cros DP, Bushby K, Munnich A, Lefebvre S (2002) Mapping of autosomal recessive chronic distal spinal muscular atrophy to chromosome 11q13. Ann Neurol 51: 585-92
Viollet L, Bertrandy S, Bueno Brunialti AL, Lefebvre S, Burlet P, Clermont O, Cruaud C, Guenet JL, Munnich A, Melki J (1997) cDNA isolation, expression, and chromosomal localization of the mouse survival motor neuron gene (Smn). Genomics 40: 185-8
von Mikecz A, Zhang S, Montminy M, Tan EM, Hemmerich P (2000) CREB-binding protein (CBP)/p300 and RNA polymerase II colocalize in transcriptionally active domains in the nucleus. J Cell Biol 150: 265-73
Voss MD, Hille A, Barth S, Spurk A, Hennrich F, Holzer D, Mueller-Lantzsch N, Kremmer E, Grasser FA (2001) Functional cooperation of Epstein-Barr virus nuclear antigen 2 and the survival motor neuron protein in transactivation of the viral LMP1 promoter. J Virol 75: 11781-90
Vousden KH (2000) p53: death star. Cell 103: 691-4 Vousden KH, Woude GF (2000) The ins and outs of p53. Nat Cell Biol 2: E178-80 Wan L, Battle DJ, Yong J, Gubitz AK, Kolb SJ, Wang J, Dreyfuss G (2005) The survival of motor neurons
protein determines the capacity for snRNP assembly: biochemical deficiency in spinal muscular atrophy. Mol Cell Biol 25: 5543-51
Wang CH, Xu J, Carter TA, Ross BM, Dominski MK, Bellcross CA, Penchaszadeh GK, Munsat TL, Gilliam TC (1996) Characterization of survival motor neuron (SMNT) gene deletions in asymptomatic carriers of spinal muscular atrophy. Hum Mol Genet 5: 359-65
Wang H, Faucette S, Moore R, Sueyoshi T, Negishi M, LeCluyse E (2004) Human constitutive androstane receptor mediates induction of CYP2B6 gene expression by phenytoin. J Biol Chem 279: 29295-301
Wang H, Faucette S, Sueyoshi T, Moore R, Ferguson S, Negishi M, LeCluyse EL (2003) A novel distal enhancer module regulated by pregnane X receptor/constitutive androstane receptor is essential for the maximal induction of CYP2B6 gene expression. J Biol Chem 278: 14146-52
Wang H, Negishi M (2003) Transcriptional regulation of cytochrome p450 2B genes by nuclear receptors. Curr Drug Metab 4: 515-25
Wang J, Dreyfuss G (2001a) A cell system with targeted disruption of the SMN gene: functional conservation of the SMN protein and dependence of Gemin2 on SMN. J Biol Chem 276: 9599-605
Wang J, Dreyfuss G (2001b) Characterization of functional domains of the SMN protein in vivo. J Biol Chem 276: 45387-93
Wang W, Dimatteo D, Funanage VL, Scavina M (2005) Increased susceptibility of spinal muscular atrophy fibroblasts to camptothecin-induced cell death. Mol Genet Metab 85: 38-45
Wang X, DeKosky ST, Wisniewski S, Aston, Kamboh MI (1998) Genetic association of two chromosome 14 genes (presenilin 1 and alpha 1-antichymotrypsin) with Alzheimer's disease. Ann Neurol 44: 387-90
Watanabe A, Kurasawa Y, Watanabe Y, Numata O (1998) A new Tetrahymena actin-binding protein is localized in the division furrow. J Biochem (Tokyo) 123: 607-13
Watanabe A, Yonemura I, Gonda K, Numata O (2000) Cloning and sequencing of the gene for a Tetrahymena fimbrin-like protein. J Biochem (Tokyo) 127: 85-94
Watanabe N, Madaule P, Reid T, Ishizaki T, Watanabe G, Kakizuka A, Saito Y, Nakao K, Jockusch BM, Narumiya S (1997) p140mDia, a mammalian homolog of Drosophila diaphanous, is a target protein for Rho small GTPase and is a ligand for profilin. Embo J 16: 3044-56
Wei P, Zhang J, Dowhan DH, Han Y, Moore DD (2002) Specific and overlapping functions of the nuclear hormone receptors CAR and PXR in xenobiotic response. Pharmacogenomics J 2: 117-26

REFERENCES 202
Wei P, Zhang J, Egan-Hafley M, Liang S, Moore DD (2000) The nuclear receptor CAR mediates specific xenobiotic induction of drug metabolism. Nature 407: 920-3
Weighardt F, Biamonti G, Riva S (1996) The roles of heterogeneous nuclear ribonucleoproteins (hnRNP) in RNA metabolism. Bioessays 18: 747-56
Welch MD, DePace AH, Verma S, Iwamatsu A, Mitchison TJ (1997a) The human Arp2/3 complex is composed of evolutionarily conserved subunits and is localized to cellular regions of dynamic actin filament assembly. J Cell Biol 138: 375-84
Welch MD, Iwamatsu A, Mitchison TJ (1997b) Actin polymerization is induced by Arp2/3 protein complex at the surface of Listeria monocytogenes. Nature 385: 265-9
Welch MD, Mallavarapu A, Rosenblatt J, Mitchison TJ (1997c) Actin dynamics in vivo. Curr Opin Cell Biol 9: 54-61
Whitfield ML, Sherlock G, Saldanha AJ, Murray JI, Ball CA, Alexander KE, Matese JC, Perou CM, Hurt MM, Brown PO, Botstein D (2002) Identification of genes periodically expressed in the human cell cycle and their expression in tumors. Mol Biol Cell 13: 1977-2000
Wilczynska A, Aigueperse C, Kress M, Dautry F, Weil D (2005) The translational regulator CPEB1 provides a link between dcp1 bodies and stress granules. J Cell Sci 118: 981-92
Will CL, Luhrmann R (2001) Spliceosomal UsnRNP biogenesis, structure and function. Curr Opin Cell Biol 13: 290-301
Williams BY, Hamilton SL, Sarkar HK (2000) The survival motor neuron protein interacts with the transactivator FUSE binding protein from human fetal brain. FEBS Lett 470: 207-10
Williams BY, Vinnakota S, Sawyer CA, Waldrep JC, Hamilton SL, Sarkar HK (1999) Differential subcellular localization of the survival motor neuron protein in spinal cord and skeletal muscle. Biochem Biophys Res Commun 254: 10-4
Wills Z, Marr L, Zinn K, Goodman CS, Van Vactor D (1999) Profilin and the Abl tyrosine kinase are required for motor axon outgrowth in the Drosophila embryo. Neuron 22: 291-9
Wirth B (2000) An update of the mutation spectrum of the survival motor neuron gene (SMN1) in autosomal recessive spinal muscular atrophy (SMA). Hum Mutat 15: 228-37
Wirth B (2002) Spinal muscular atrophy: state-of-the-art and therapeutic perspectives. Amyotroph Lateral Scler Other Motor Neuron Disord 3: 87-95
Wirth B, Brichta L, Hahnen E (2006a) Spinal muscular atrophy and therapeutic prospects. Prog Mol Subcell Biol 44: 109-32
Wirth B, Brichta L, Schrank B, Lochmuller H, Blick S, Baasner A, Heller R (2006b) Mildly affected patients with spinal muscular atrophy are partially protected by an increased SMN2 copy number. Hum Genet 119: 422-8
Wirth B, Hahnen E, Morgan K, DiDonato CJ, Dadze A, Rudnik-Schoneborn S, Simard LR, Zerres K, Burghes AH (1995a) Allelic association and deletions in autosomal recessive proximal spinal muscular atrophy: association of marker genotype with disease severity and candidate cDNAs. Hum Mol Genet 4: 1273-84
Wirth B, Herz M, Wetter A, Moskau S, Hahnen E, Rudnik-Schoneborn S, Wienker T, Zerres K (1999) Quantitative analysis of survival motor neuron copies: identification of subtle SMN1 mutations in patients with spinal muscular atrophy, genotype-phenotype correlation, and implications for genetic counseling. Am J Hum Genet 64: 1340-56
Wirth B, Rudnik-Schoneborn S, Hahnen E, Rohrig D, Zerres K (1995b) Prenatal prediction in families with autosomal recessive proximal spinal muscular atrophy (5q11.2-q13.3): molecular genetics and clinical experience in 109 cases. Prenat Diagn 15: 407-17
Wirth B, Schmidt T, Hahnen E, Rudnik-Schoneborn S, Krawczak M, Muller-Myhsok B, Schonling J, Zerres K (1997a) De novo rearrangements found in 2% of index patients with spinal muscular atrophy: mutational mechanisms, parental origin, mutation rate, and implications for genetic counseling. Am J Hum Genet 61: 1102-11
Wirth B, Tessarolo D, Hahnen E, Rudnik-Schoneborn S, Raschke H, Liguori M, Giacanelli M, Zerres K (1997b) Different entities of proximal spinal muscular atrophy within one family. Hum Genet 100: 676-80
Witowski J, Jorres A (2006) Peritoneal cell culture: fibroblasts. Perit Dial Int 26: 292-9 Wu JQ, Bahler J, Pringle JR (2001) Roles of a fimbrin and an alpha-actinin-like protein in fission yeast cell
polarization and cytokinesis. Mol Biol Cell 12: 1061-77 Wu JY, Maniatis T (1993) Specific interactions between proteins implicated in splice site selection and
regulated alternative splicing. Cell 75: 1061-70

REFERENCES 203
Wysocka J, Myers MP, Laherty CD, Eisenman RN, Herr W (2003) Human Sin3 deacetylase and trithorax-related Set1/Ash2 histone H3-K4 methyltransferase are tethered together selectively by the cell-proliferation factor HCF-1. Genes Dev 17: 896-911
Xiao SH, Manley JL (1998) Phosphorylation-dephosphorylation differentially affects activities of splicing factor ASF/SF2. Embo J 17: 6359-67
Xie W, Yeuh MF, Radominska-Pandya A, Saini SP, Negishi Y, Bottroff BS, Cabrera GY, Tukey RH, Evans RM (2003) Control of steroid, heme, and carcinogen metabolism by nuclear pregnane X receptor and constitutive androstane receptor. Proc Natl Acad Sci U S A 100: 4150-5
Yang L, Mei Q, Zielinska-Kwiatkowska A, Matsui Y, Blackburn ML, Benedetti D, Krumm AA, Taborsky GJ, Jr., Chansky HA (2003) An ERG (ets-related gene)-associated histone methyltransferase interacts with histone deacetylases 1/2 and transcription co-repressors mSin3A/B. Biochem J 369: 651-7
Yang XJ, Ogryzko VV, Nishikawa J, Howard BH, Nakatani Y (1996) A p300/CBP-associated factor that competes with the adenoviral oncoprotein E1A. Nature 382: 319-24
Yoder JA, Walsh CP, Bestor TH (1997) Cytosine methylation and the ecology of intragenomic parasites. Trends Genet 13: 335-40
Yong J, Golembe TJ, Battle DJ, Pellizzoni L, Dreyfuss G (2004) snRNAs contain specific SMN-binding domains that are essential for snRNP assembly. Mol Cell Biol 24: 2747-56
Yong J, Pellizzoni L, Dreyfuss G (2002) Sequence-specific interaction of U1 snRNA with the SMN complex. Embo J 21: 1188-96
Yoshida M, Furumai R, Nishiyama M, Komatsu Y, Nishino N, Horinouchi S (2001) Histone deacetylase as a new target for cancer chemotherapy. Cancer Chemother Pharmacol 48 Suppl 1: S20-6
Yoshinari K, Kobayashi K, Moore R, Kawamoto T, Negishi M (2003) Identification of the nuclear receptor CAR:HSP90 complex in mouse liver and recruitment of protein phosphatase 2A in response to phenobarbital. FEBS Lett 548: 17-20
Young ME, Cooper JA, Bridgman PC (2004) Yeast actin patches are networks of branched actin filaments. J Cell Biol 166: 629-35
Young PJ, Day PM, Zhou J, Androphy EJ, Morris GE, Lorson CL (2002a) A direct interaction between the survival motor neuron protein and p53 and its relationship to spinal muscular atrophy. J Biol Chem 277: 2852-9
Young PJ, DiDonato CJ, Hu D, Kothary R, Androphy EJ, Lorson CL (2002b) SRp30c-dependent stimulation of survival motor neuron (SMN) exon 7 inclusion is facilitated by a direct interaction with hTra2 beta 1. Hum Mol Genet 11: 577-87
Young PJ, Francis JW, Lince D, Coon K, Androphy EJ, Lorson CL (2003) The Ewing's sarcoma protein interacts with the Tudor domain of the survival motor neuron protein. Brain Res Mol Brain Res 119: 37-49
Young PJ, Jensen KT, Burger LR, Pintel DJ, Lorson CL (2002c) Minute virus of mice NS1 interacts with the SMN protein, and they colocalize in novel nuclear bodies induced by parvovirus infection. J Virol 76: 3892-904
Young PJ, Jensen KT, Burger LR, Pintel DJ, Lorson CL (2002d) Minute virus of mice small nonstructural protein NS2 interacts and colocalizes with the Smn protein. J Virol 76: 6364-9
Yu JZ, Rasenick MM (2006) Tau associates with actin in differentiating PC12 cells. Faseb J 20: 1452-61 Zalcman G, Closson V, Linares-Cruz G, Lerebours F, Honore N, Tavitian A, Olofsson B (1995) Regulation
of Ras-related RhoB protein expression during the cell cycle. Oncogene 10: 1935-45 Zalewska E, Hausmanowa-Petrusewicz I (2000) Effectiveness of motor unit potentials classification using
various parameters and indexes. Clin Neurophysiol 111: 1380-7 Zelko I, Sueyoshi T, Kawamoto T, Moore R, Negishi M (2001) The peptide near the C terminus regulates
receptor CAR nuclear translocation induced by xenochemicals in mouse liver. Mol Cell Biol 21: 2838-46
Zeng C, Kim E, Warren SL, Berget SM (1997) Dynamic relocation of transcription and splicing factors dependent upon transcriptional activity. Embo J 16: 1401-12
Zerres K, Rudnik-Schoneborn S (1995) Natural history in proximal spinal muscular atrophy. Clinical analysis of 445 patients and suggestions for a modification of existing classifications. Arch Neurol 52: 518-23
Zhang H, Xing L, Rossoll W, Wichterle H, Singer RH, Bassell GJ (2006) Multiprotein complexes of the survival of motor neuron protein SMN with Gemins traffic to neuronal processes and growth cones of motor neurons. J Neurosci 26: 8622-32

REFERENCES 204
Zhang HL, Pan F, Hong D, Shenoy SM, Singer RH, Bassell GJ (2003) Active transport of the survival motor neuron protein and the role of exon-7 in cytoplasmic localization. J Neurosci 23: 6627-37
Zhang J, Huang W, Chua SS, Wei P, Moore DD (2002) Modulation of acetaminophen-induced hepatotoxicity by the xenobiotic receptor CAR. Science 298: 422-4
Zhang J, Huang W, Qatanani M, Evans RM, Moore DD (2004) The constitutive androstane receptor and pregnane X receptor function coordinately to prevent bile acid-induced hepatotoxicity. J Biol Chem 279: 49517-22
Zhang Y, Dufau ML (2002) Silencing of transcription of the human luteinizing hormone receptor gene by histone deacetylase-mSin3A complex. J Biol Chem 277: 33431-8
Zhang Y, Reinberg D (2001) Transcription regulation by histone methylation: interplay between different covalent modifications of the core histone tails. Genes Dev 15: 2343-60
Zhang Z, Huang C, Li J, Leonard SS, Lanciotti R, Butterworth L, Shi X (2001) Vanadate-induced cell growth regulation and the role of reactive oxygen species. Arch Biochem Biophys 392: 311-20
Zhou D, Mooseker MS, Galan JE (1999) An invasion-associated Salmonella protein modulates the actin-bundling activity of plastin. Proc Natl Acad Sci U S A 96: 10176-81
Zoll WL, Horton LE, Komar AA, Hensold JO, Merrick WC (2002) Characterization of mammalian eIF2A and identification of the yeast homolog. J Biol Chem 277: 37079-87
Zou J, Barahmand-pour F, Blackburn ML, Matsui Y, Chansky HA, Yang L (2004) Survival motor neuron (SMN) protein interacts with transcription corepressor mSin3A. J Biol Chem 279: 14922-8

APPENDIX
APPENDIX

APPENDIX
Figures:
I. F1: Pedigrees of the SMA discordant families
II. F2: pcDNA 3.1_T-plastin_V5 vector map
III. F3: Human T-plastin transcript
IV. F4: T-plastin genomic region
V. F5:T-plastin promoter-1st exon-1
st intron region (1 kb) after bisulfite treatment
VI. F6: T-plastin expression analysis by RT-PCR in 79 SMA patients
VII. F7 Simulation of the genome scan analysis under the assumption of recessive mode of
inheritance
VIII. F8 Simulation of the genome scan analysis under the assumption of dominant mode of
inheritance
IX. F9 Methylation status of T-plastin CpG sites in SMA discordant families
X. F10 Methylation status of T-plastin CpG sites in two control groups
XI. F11 Haplotype blocks within T-plastin genomic region
XII. F12 Motor axons defects in smn morphants are rescued by overexpression of human T-plastin
RNA

APPENDIX

APPENDIX
III. Fig. F3 Human T-plastin Transcript
Nucleotide and amino acid sequence of T-plastin transcript (NM_013386). The 5’UTR and 3’UTR regions are highlighted on yellow background. The exon alternation is given in two different colours (black-blue). The primers used for DNA cloning (#2545 and #2586) and multiplex PCR (#2331 and #2332) are marked in red colour.
5’-UTR
1 GCGCTGGCTTTAGAGCCACAGCTGCAAAGATTCCGAGGTGCAGAAGTTGTCTGAGTGCGT
..............................Primer# 2454 (For)............
61 TGGTCGGCGGCAGTCGGGCCAGACCCAGGACTCTGCGACTTTACATCTTTAAATGGATGA
....................................................-M--D--E
121 GATGGCTACCACTCAGATTTCCAAAGATGAGCTTGATGAACTCAAAGAGGCCTTTGCAAA
3 --M--A--T--T--Q--I--S--K--D--E--L--D--E--L--K--E--A--F--A--K
181 AGTTGATCTCAACAGCAACGGATTCATTTGTGACTATGAACTTCATGAGCTCTTCAAGGA
23 --V--D--L--N--S--N--G--F--I--C--D--Y--E--L--H--E--L--F--K--E
241 AGCTAATATGCCATTACCAGGATATAAAGTGAGAGAAATTATTCAGAAACTCATGCTGGA
43 --A--N--M--P--L--P--G--Y--K--V--R--E--I--I--Q--K--L--M--L--D
301 TGGTGACAGGAATAAAGATGGGAAAATAAGTTTTGACGAATTTGTTTATATTTTTCAAGA
63 --G--D--R--N--K--D--G--K--I--S--F--D--E--F--V--Y--I--F--Q--E
361 GGTAAAAAGTAGTGATATTGCCAAGACCTTCCGCAAAGCAATCAACAGGAAAGAAGGTAT
83 --V--K--S--S--D--I--A--K--T--F--R--K--A--I--N--R--K--E--G--I
421 TTGTGCTCTGGGTGGAACTTCAGAGTTGTCCAGCGAAGGAACACAGCATTCTTACTCAGA
103 --C--A--L--G--G--T--S--E--L--S--S--E--G--T--Q--H--S--Y--S--E
481 GGAAGAAAAATATGCTTTTGTTAACTGGATAAACAAAGCTTTGGAAAATGATCCTGATTG
123 --E--E--K--Y--A--F--V--N--W--I--N--K--A--L--E--N--D--P--D--C
541 TAGACATGTTATACCAATGAACCCTAACACCGATGACCTGTTCAAAGCTGTTGGTGATGG
143 --R--H--V--I--P--M--N--P--N--T--D--D--L--F--K--A--V--G--D--G
601 AATTGTGCTTTGTAAAATGATTAACCTTTCAGTTCCTGATACCATTGATGAAAGAGCAAT
163 --I--V--L--C--K--M--I--N--L--S--V--P--D--T--I--D--E--R--A--I
661 CAACAAGAAGAAACTTACACCCTTCATCATTCAGGAAAACTTGAACTTGGCACTGAACTC
183 --N--K--K--K--L--T--P--F--I--I--Q--E--N--L--N--L--A--L--N--S
721 TGCTTCTGCCATTGGGTGTCATGTTGTGAACATTGGTGCAGAAGATTTGAGGGCTGGGAA
203 --A--S--A--I--G--C--H--V--V--N--I--G--A--E--D--L--R--A--G--K
781 ACCTCATCTGGTTTTGGGACTGCTTTGGCAGATCATTAAGATCGGTTTGTTCGCTGACAT
223 --P--H--L--V--L--G--L--L--W--Q--I--I--K--I--G--L--F--A--D--I
841 TGAATTAAGCAGGAATGAAGCCTTGGCTGCTTTACTCCGAGATGGTGAGACTTTGGAGGA
243 --E--L--S--R--N--E--A--L--A--A--L--L--R--D--G--E--T--L--E--E
901 ACTTATGAAATTGTCTCCAGAAGAGCTTCTGCTTAGATGGGCAAACTTTCATTTGGAAAA
263 --L--M--K--L--S--P--E--E--L--L--L--R--W--A--N--F--H--L--E--N

APPENDIX
961 CTCGGGCTGGCAAAAAATTAACAACTTTAGTGCTGACATCAAGGATTCCAAAGCCTATTT
283 --S--G--W--Q--K--I--N--N--F--S--A--D--I--K--D--S--K--A--Y--F
1021 CCATCTTCTCAATCAAATCGCACCAAAAGGACAAAAGGAAGGTGAACCACGGATAGATAT
303 --H--L--L--N--Q--I--A--P--K--G--Q--K--E--G--E--P--R--I--D--I
1081 TAACATGTCAGGTTTCAATGAAACAGATGATTTGAAGAGAGCTGAGAGTATGCTTCAACA
323 --N--M--S--G--F--N--E--T--D--D--L--K--R--A--E--S--M--L--Q--Q
1141 AGCAGATAAATTAGGTTGCAGACAGTTTGTTACCCCTGCTGATGTTGTCAGTGGAAACCC
343 --A--D--K--L--G--C--R--Q--F--V--T--P--A--D--V--V--S--G--N--P
R
1201 CAAACTCAACTTAGCTTTCGTGGCTAACCTGTTTAATAAATACCCAGCACTAACTAAGCC
363 --K--L--N--L--A--F--V--A--N--L--F--N--K--Y--P--A--L--T--K--P
1261 AGAGAACCAGGATATTGACTGGACTCTATTAGAAGGAGAAACTCGTGAAGAAAGAACCTT
383 --E--N--Q--D--I--D--W--T--L--L--E--G--E--T--R--E--E--R--T--F
Y
1321 CCGTAACTGGATGAACTCTCTTGGTGTCAATCCTCACGTAAACCATCTCTATGCTGACCT
403 --R--N--W--M--N--S--L--G--V--N--P--H--V--N--H--L--Y--A--D--L
Y
1381 GCAAGATGCCCTGGTAATCTTACAGTTATATGAACGAATTAAAGTTCCTGTTGACTGGAG
423 --Q--D--A--L--V--I--L--Q--L--Y--E--R--I--K--V--P--V--D--W--S
1441 TAAGGTTAATAAACCTCCATACCCGAAACTGGGAGCCAACATGAAAAAGCTAGAAAACTG
443 --K--V--N--K--P--P--Y--P--K--L--G--A--N--M--K--K--L--E--N--C
1501 CAACTATGCTGTTGAATTAGGGAAGCATCCTGCTAAATTCTCCCTGGTTGGCATTGGAGG
463 --N--Y--A--V--E--L--G--K--H--P--A--K--F--S--L--V--G--I--G--G
S
1561 GCAAGACCTGAATGATGGGAACCAAACCCTGACTTTAGCTTTAGTCTGGCAGCTGATGAG
483 --Q--D--L--N--D--G--N--Q--T--L--T--L--A--L--V--W--Q--L--M--R
M
1621 AAGATATACCCTCAATGTCCTGGAAGATCTTGGAGATGGTCAGAAAGCCAATGACGACAT
503 --R--Y--T--L--N--V--L--E--D--L--G--D--G--Q--K--A--N--D--D--I
1681 CATTGTGAACTGGGTGAACAGAACGTTGAGTGAAGCTGGAAAATCAACTTCCATTCAGAG
523 --I--V--N--W--V--N--R--T--L--S--E--A--G--K--S--T--S--I--Q--S
1741 TTTTAAGGACAAGACGATCAGCTCCAGTTTGGCAGTTGTGGATTTAATTGATGCCATCCA
543 --F--K--D--K--T--I--S--S--S--L--A--V--V--D--L--I--D--A--I--Q
1801 GCCAGGCTGTATAAACTATGACCTTGTGAAGAGTGGCAATCTAACAGAAGATGACAAGCA
563 --P--G--C--I--N--Y--D--L--V--K--S--G--N--L--T--E--D--D--K--H
1861 CAATAATGCCAAGTATGCAGTGTCAATGGCTAGAAGAATCGGAGCCAGAGTGTATGCTCT
583 --N--N--A--K--Y--A--V--S--M--A--R--R--I--G--A--R--V--Y--A--L
1921 CCCTGAAGACCTTGTGGAAGTAAAGCCCAAGATGGTCATGACTGTGTTTGCATGTTTGAT
603 --P--E--D--L--V--E--V--K--P--K--M--V--M--T--V--F--A--C--L--M
Primer# 2586 (Rev) 1981 GGGCAGGGGAATGAAGAGAGTGTAAAATAACCAATCTGAATAAAACAGCCATGCTCCCAG
623 --G--R--G--M--K--R--V--*-...................................
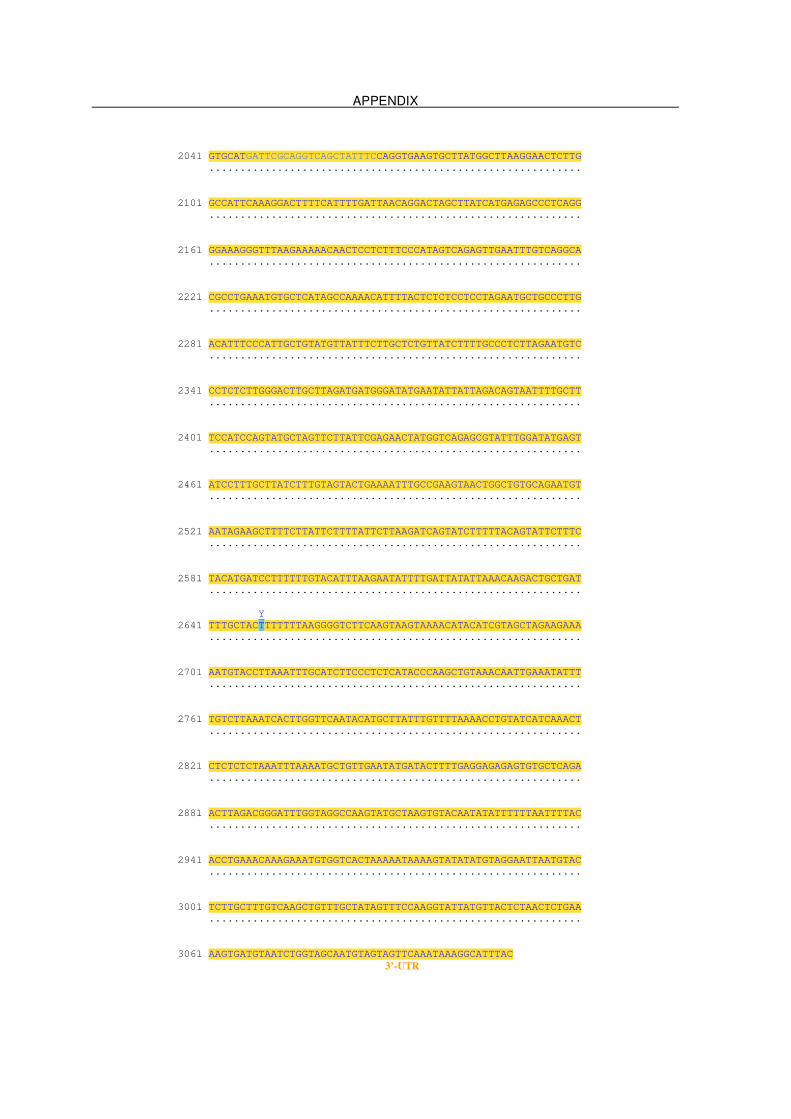
APPENDIX
2041 GTGCATGATTCGCAGGTCAGCTATTTCCAGGTGAAGTGCTTATGGCTTAAGGAACTCTTG
............................................................
2101 GCCATTCAAAGGACTTTTCATTTTGATTAACAGGACTAGCTTATCATGAGAGCCCTCAGG
............................................................
2161 GGAAAGGGTTTAAGAAAAACAACTCCTCTTTCCCATAGTCAGAGTTGAATTTGTCAGGCA
............................................................
2221 CGCCTGAAATGTGCTCATAGCCAAAACATTTTACTCTCTCCTCCTAGAATGCTGCCCTTG
............................................................
2281 ACATTTCCCATTGCTGTATGTTATTTCTTGCTCTGTTATCTTTTGCCCTCTTAGAATGTC
............................................................
2341 CCTCTCTTGGGACTTGCTTAGATGATGGGATATGAATATTATTAGACAGTAATTTTGCTT
............................................................
2401 TCCATCCAGTATGCTAGTTCTTATTCGAGAACTATGGTCAGAGCGTATTTGGATATGAGT
............................................................
2461 ATCCTTTGCTTATCTTTGTAGTACTGAAAATTTGCCGAAGTAACTGGCTGTGCAGAATGT
............................................................
2521 AATAGAAGCTTTTCTTATTCTTTTATTCTTAAGATCAGTATCTTTTTACAGTATTCTTTC
............................................................
2581 TACATGATCCTTTTTTGTACATTTAAGAATATTTTGATTATATTAAACAAGACTGCTGAT
............................................................
Y
2641 TTTGCTACTTTTTTTAAGGGGTCTTCAAGTAAGTAAAACATACATCGTAGCTAGAAGAAA
............................................................
2701 AATGTACCTTAAATTTGCATCTTCCCTCTCATACCCAAGCTGTAAACAATTGAAATATTT
............................................................
2761 TGTCTTAAATCACTTGGTTCAATACATGCTTATTTGTTTTAAAACCTGTATCATCAAACT
............................................................
2821 CTCTCTCTAAATTTAAAATGCTGTTGAATATGATACTTTTGAGGAGAGAGTGTGCTCAGA
............................................................
2881 ACTTAGACGGGATTTGGTAGGCCAAGTATGCTAAGTGTACAATATATTTTTTAATTTTAC
............................................................
2941 ACCTGAAACAAAGAAATGTGGTCACTAAAAATAAAAGTATATATGTAGGAATTAATGTAC
............................................................
3001 TCTTGCTTTGTCAAGCTGTTTGCTATAGTTTCCAAGGTATTATGTTACTCTAACTCTGAA
............................................................
3061 AAGTGATGTAATCTGGTAGCAATGTAGTAGTTCAAATAAAGGCATTTAC
3’-UTR

APPENDIX
IV. Fig. F4 T-plastin genomic region (human)
#:primer number used for PCR and/or sequencing; →: forward orientation; ←: reverse orientation; +1: transcription initiation start site. NOTE: WHEN TWO PRIMERS WITH DIFFERENT ORIENTATION OVERLAP, ONE IS UNDERLINED, THE OTHER IS ITALICIZED.
→#2572
-3211 GGTGGCAGGT GCCTATAATA CCAGCTACTT GGGAGGCTGA GGCAGGAGAA
-3161 TCGCTTGAAC CCGGGAGGCA GAGGTTGCAA TGAGCTGAGA CTGTGCCGTT
-3111 GCACTACAGC TGAGGTGACA ACAGTGAAAC TCTGTCTCAA GGAAAAAAAA
-3061 AAAAGTTCAA ACCAGCAATG ACATGTTAAG AATAAAGAAT TAAAAATGGA
-3011 TAGAAGAGGA AACTGACAAC TTACTCTAGG AAAATTTCAG GGAAAATTTT
-2961 AGACTATGTA CACATAATAC ATTGTGAGCT AGACTGGGGA GAGTGTTGGG
-2911 CAGAACAATA GGAAAAAGAG CAAGAAAAAG GGGGATGTGC GTATCAAAAG
-2861 GAGGAAAGAA AAGTAGTTTG GACAGACAAA AAACCTAAGA GAGATATTGG
-2811 CGCCTTCTTA TGATATCAGC GGAGGACAGG AAGAATAAAT GGTTTTCAAA
-2761 ATTTTGTGAT ATTGACTTTA AGTGATTTAT TACAAAGGCA TTAGGATCGA
#2572
-2711 AAATTGGAAA TGGAAGGAAA GGTAAAAACT CTTAGGTTAC TGATTCACAA
#2573←
-2671 GGTCTGTGAG AATCCTATAT ATATTAATAG CTTTTTGTTG CTGTTGTTTA
-2611 ACAAGAATAG ACATAAAATA ACCATTGGTT CAGCAAACAT TTACTGAACT
-2561 CCTATGTGTC AGGCACTATG CAAGTCACTG TCAAAATAAA TTAAAGCCTA
-2511 TAAGCAGGTG GAGGGAACCC TGACAAACAT CTGTGCAGGC TTTTTGATAC
-2461 AGATAAGAAA ACAATCAACT TTGGGTTACT TCGTGAATGA TCCTCTATGA
-2411 GGTAAATTGA TGGCATGAAA AATTATAAAG AAATGCTGTT TAAGAGCTTT
-2361 GAGCCTGAGG ATCCTTTCTT CCAGCAAAAT GCTAAATTTG AAAAGATCCT
-2311 TTAGATTCTG GGCAACACAA AGGTAGCTTA GTTACATCAA ACTGGCTGGG
→#2576
-2261 TATCTTAATA GTATTCATTA AAATGGAGTT CTACCTGGAT TATATAGTGG
#2757←
-2211 AGCTTGTTAA ACAGGAATCT CAGCTAGCAT CCAAATAGGT GCTTCTGTGT
-2161 TTAGGGTGTG TTTTATCTGT TGGAAAGTTA CTGAGGCAAT GAGAACTAAT
-2111 GCCATCAGCT AGGTACACTG CAGCTTTGAA ACTATGGACT ATTGCATTTC
-2061 AATTAAAATG ACATTTCTTG ACTGAATTCT GACATCCTCA GTGATAGTGG
-2011 TGAATGAAGA CTTTTATCAA AGTATAGATT CTATTAAGCT TTTAAAAAAT
-1961 TTTATTAATT TTTTTTGTAG AGATGAGGTC TTGCTATGTT GTCCAGGCTG
-1911 GTCTTGAACT CCTGGCCTCA TGCAATCCTC CCACTGCACA GCCTCCCAAA
→#2587
-1861 GTGCTGGATT ACAGGCGTGA GCTACCCTAC TCGGACCAAT GTAAGCTTTT
#2577←
-1811 TTGAATTAAA AACAGGAACT GTAAATAGCA TATACGTAGG ATTCTTAATA
-1761 TTTTTACTTT AAATTCTAGA ATTTGAAAAA TAAACTAAAA TTGAATACAA
-1711 CGTAATTGAG ACAAATATAT CTGCACTGGA AAATTTAGCT TACAGAGTCC
-1661 CTTCATGCTA TTGCTCAGTC TGTAATTTTA AGTTTAAGAG CAGGTGGAAG

APPENDIX
-1611 CTCTTCAGCG GTGACCGACA GACACCATAA AAGGTAGAAA ACTGAAAAAG
-1561 CCTATTTCCT GTATCTAAAA ATTTTTTGTA AAGAATTCCA GAAGTCACAC
-1511 CAAACCTTTG GCCAATTACT GAATGCTAGA AATCTCATTT GGGAGCTTAC
-1461 TGTAAATGTG TGTGGCAATG CACTGGCTCC ATGTTCAATC CAACGCCAAC
→#2580 #2579←
-1411 ATGTTGAAAT CAGTATTTTT GTGCTGGCCC AAACCTGAAC CAGTAGAAAA
-1361 TCTCCCATAA CAGAAATTCA ATGTTTGTGA AAGCATGATT GCCCTCCCAT
-1311 TTCTTTTTCA CCTTCCTGTG CCTTTCATAA GTTCTTCCAG TTGGTTAATC
-1261 ATTAATTAAT ATTTAACAAG GCTTTTTCCT CGTGCCAAGT CCTCTGCTAG
-1211 TCTAGCCTTT AGGCAATATA TGAACTCCCC AAGTTCTTCC CTTTTAAGAA
-1161 GCCTTGGCAC TCACTACGGA TTAATTTCTC TAAGGAAATT CATAATGGCA
-1111 GATGAAATAG GGGTTCCTTT TCAAGAACAT TCCATTTTAA AGCCTCTCAG
-1061 CATTTTTTCC TGGTACATGT AAAATGCGAC TTAATTGAAC TAATTTTAAA
-1011 TGTTGACAGA ACTTTCCAAG CACACATTTC CTCAACAAAA TGGTTACGAC
#2581←
-961 TGGAACAGGA AAGGGCTTAG ACTTTTTCTT CTACAGCTAT CCCACAAGTC
→#2582 →#3209
-911 AGTCTCTTGA CCTGACCCTG CAAAATCCCT CAAACTCTGG CTCTCTGAGT
→3210 # 3208← → -861 TGATTTTGGA TATACGATGA ACCATAGGTT TGGAATGCAG ATAACCTCCA
Enhancer ← enhancer -811 CGTGTATTAA TGAAAGAGGT CAGCTATGAC GTGGAAGCCA TCTCCTGGGC
#3212← #3212←
-761 AGAGAAGGAG AAGAAATGGC AGTCTGGGGA GTAGTAACAT GTCTCCAAAT
#3211←
-711 TTTCTCTGGT GAAAGGAGAC TGATGAGAAT TGATACCCAT TTCCGGTCAA
-661 AAGAGTGGAA CCAATGTACT TCCAACCACC TCCTCTCAAC CCCTCTCCGC
-611 ATGGACAAAC ATACCAGACA GGTGATGTGG GCTAACAATT TACTTGGCAT
-561 GAGGCCAAAG GCTTGAGGGC CCTGCCCTGC CCATATTCTT CTCCCTTGAC
-511 TTCTTAAGGA AAGGAATGAT TGCTGATGTT TCCCTCTGCA CCCTTTGGCA
-461 CCTGGACTGA TTGTTGCAGA TGTAATTAGG AATGTTCCCC AACATGCCGT
-411 TATTCTTCTC ACGATTCTGG GAGAAACTGT ACCCCTCCCC CATAGACTTA
→#2584 #2583←
-361 TATAGGTGGC ATTCAAATTC TTGTTCCCAA CTTTTTCATC TGTTTATTAA
-311 TCCCACAAGA TTGTGTGAAT GTGTACTCCG AGCCAGGCAC GTTGGACTTC
-261 TAACTTCCTC TTAGCCCAAG TAGGAAGGGG AGACTCAGGC GCTGGGGACC
-211 ATTCTCCTCT CCCTGCAGCA GAGTTGCAGT CCCTATCCCT CCTGGGTGCC
-161 CATCCCCGTG CCTATTTTCC TGGATCCCCA CCCAGTTGAT GTGACAGGCT
-111 CGTGGCCCAA TCCCCTTCCT GGTTCCCAGG CCGACTGCTA GCACCACCCG
→#2520
-61 AGCCAATGGC GGCGGCCGAG GGGCGGAGGG GGCTGGCAGG AGGGGAGGGA
+1 -11 GCGCTGGCTT TAGAGCCACA GCTGCAAAGA TTCCGAGGTG CAGAAGTTGT exon 1/
#2585← 5’UTR
40 CTGAGTGCGT TGGTCGGCGG CAGTCGGGCC AGACCCAGGA CTCTGCGACT
90 TTACGTAAGT GCTTTGTAGG CGCCGGCGGG CACTAGGGGA GCGGGTTTCC intron 1
140 TGGGCGTGGG CAGGAGTGGG TCCCGGGGAG AGCATCTCGG TTAAGCTCAG

APPENDIX
#2521←
190 CAGGAACGTG CGGCGCACCG TGGGGCGGGG GTTGGGGGAG AGGGAGGTCG
240 GAGAAATTTC AGTTGGAGCC CTCGGGCGCC CGGGCGATCG GTCGCAACCG
290 AAATGGGTGT GAGTGACGGG GAGTTTCCCT ACTAGCATCC GCCGCAGACA
340 CGTTTTCTGC ACTTCACTGT ATTAAGTGGT GTTTTCTTAC TAGTTGCTCT
390 TAACTTGTTG CCAGTCTTGG GCTGGAGTCC TAGACGCCAG CCCTTGCCCT
440 GATTCCCCTC CGCGGCTGCG GCCCCGAAGT GGAAAGGGAG CGCACAACTT
490 CCCTCTGTCG TCCTTCTCCA GCTACTGCCA TCCCCTCTTC CCTCCCGCCC
540 GGACTCAGGA AATCCCGGAG CCAGCAGCCT GCTACTCCTC CAGCCCCCAC
590 ACGCCCGCCT CGGGTGACCT GGCTGGCTTA AGCCGACCCT GGGGCTCTGG
640 AGAGGGGGGG CCGTGGCCGA GGGAAGGCAC GAGGTTTGGG TTGCCTGCCT
→#2781
690 TCTGCCTGCT TCCCTCCCTT GTCCTTAGCG AGGGCGTCGC GAACGCACCT
740 AGTCTCCCTA TGAGTAAGCA CTTTTTTTCC TTTCAGTAGG AGAACATCTC
#2780←
790 TGGGCTAGTA GGACAGTACC TTTCCGTTCT CCCCTGGCCC CACACCCCCT
840 GTCCTTTTTT CAGCTCCTTT GACTTTGCGG CCCCGGGCGC GCGGTCGGGG
890 CGGCGGCAGT CCCGGACCTC TCCCGACTCT TGGAGAGAGA GAGGCAAAGG
940 GGCGACGGGA GGGAGGTAAT AGTCTACCCC CCCGCCCTTT CCCCGCACAG
990 CTGCACTTGC CTGTGTTTAC TTTTCTCCAC CCGCAGTACT TAAGCGCTGT
1040 AATGAGAGGC CCGGGGACGC CGACCACCCC CGCCCTGGCT TCTCGCCAGT
1090 CCCAAAGTTG CTGCCGCCGT CGCTGCTCCA GTGTGCTGGC GGTTCCGACC
1140 GCCGGGCTCC GGGACGTAAG ATGATCCCAG CCCGGGAGGT GGAGTGGGGG
1190 TTAATGGCAT CTGACTCTAG CCTTATGCGA TGCTCCTTGC CTCTCACCTG
1240 AGCTGCACGA TATCCCCAGT GGTGCAGAAG GTTGAACTTT TGCAGAAGGT
1290 TGAGCTTGGA GCTAAGTGGG TTGGAGAGCC TCGCCATTTA GCGTCAGACA
1340 GACGGGATGC TGGGGGCGCC CGGCCTGTTA AGAGGGATTG GGAGGAGGGA
→#2783
1390 AGGGAGCCTG GCTAACAGTA GGTAGAAAAT GTAGGGAAAA GTAAAAACCA
1440 TTGAGGGGCA AGCACTTACT CCACTTTGCT GGATGTCACA ATGGACTGGG
#2782←
1490 GAGCCTAAAC TTGATCCTCG AGATGCAGTT CATGGTGAAT TCCAACTAAG
1527 TGGCTGGAGC CCC
1553 ACACATACCA GTTGGAATCA CGTGCCCCAA GTCTCTGATG GTCACATGAC
1603 GTCTTTTTAC TTTAAAGCTG GAATGTAATG GTTGAGGCCC ATATTCCAAA
1653 AACCACCTCT ACGTTTGAAA AAAAAAAGGT GGGGAGGAGT GTGAACTAGC
1703 TTCTAATCAA GGAAGTCTAC TAGGATTTTG GATGAGGGGA CCAGAAAGGG
1753 AATTTGGTGC TCAGCTTTTA TCCAAAACAA AAACAGGAGC TGTTTTTAAA
1803 ATAAGGGATT GAAATATATG TGAGCTGGGA CATGTATCTC CTCTCTTCTT
1853 CAATCTCATG GTTTTTCTAA ATTTAAAAAA CATCTTACTA ATTATTTTCT
1903 AGGGAAGTCA TCCTATTACT CATGCCTCAT TTTGTCCCTG AATACTAGAT
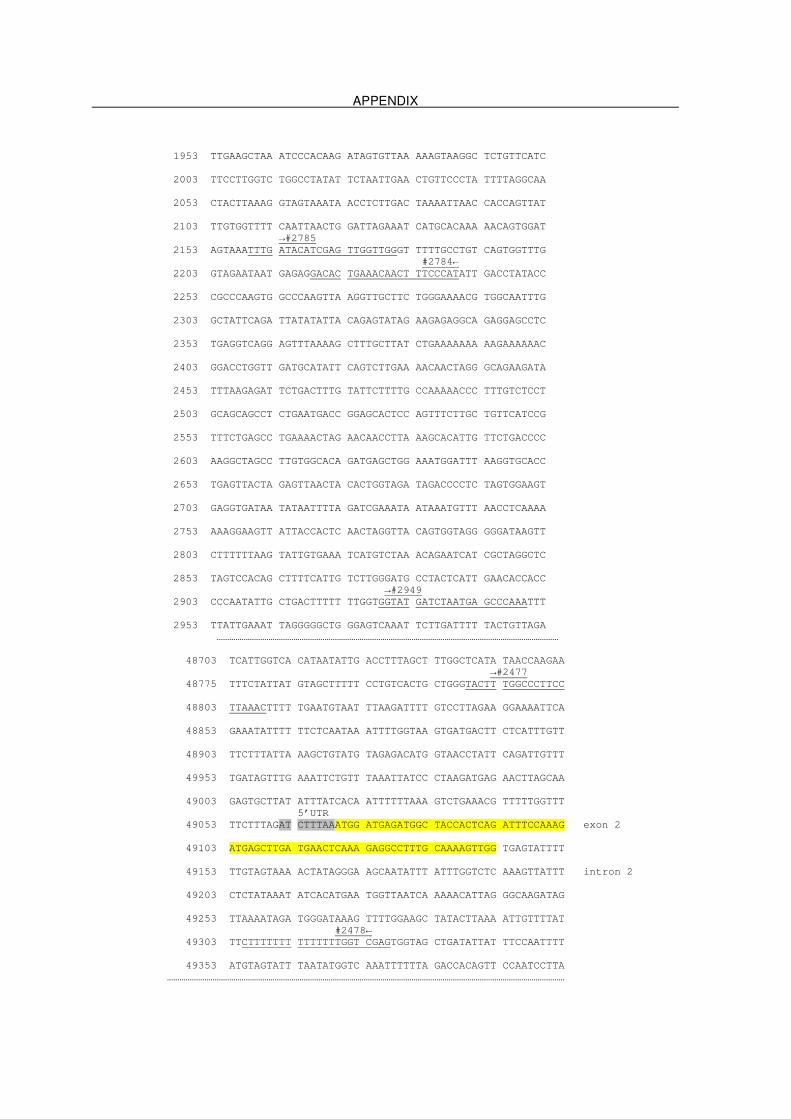
APPENDIX
1953 TTGAAGCTAA ATCCCACAAG ATAGTGTTAA AAAGTAAGGC TCTGTTCATC
2003 TTCCTTGGTC TGGCCTATAT TCTAATTGAA CTGTTCCCTA TTTTAGGCAA
2053 CTACTTAAAG GTAGTAAATA ACCTCTTGAC TAAAATTAAC CACCAGTTAT
2103 TTGTGGTTTT CAATTAACTG GATTAGAAAT CATGCACAAA AACAGTGGAT
→#2785
2153 AGTAAATTTG ATACATCGAG TTGGTTGGGT TTTTGCCTGT CAGTGGTTTG
#2784←
2203 GTAGAATAAT GAGAGGACAC TGAAACAACT TTCCCATATT GACCTATACC
2253 CGCCCAAGTG GCCCAAGTTA AGGTTGCTTC TGGGAAAACG TGGCAATTTG
2303 GCTATTCAGA TTATATATTA CAGAGTATAG AAGAGAGGCA GAGGAGCCTC
2353 TGAGGTCAGG AGTTTAAAAG CTTTGCTTAT CTGAAAAAAA AAGAAAAAAC
2403 GGACCTGGTT GATGCATATT CAGTCTTGAA AACAACTAGG GCAGAAGATA
2453 TTTAAGAGAT TCTGACTTTG TATTCTTTTG CCAAAAACCC TTTGTCTCCT
2503 GCAGCAGCCT CTGAATGACC GGAGCACTCC AGTTTCTTGC TGTTCATCCG
2553 TTTCTGAGCC TGAAAACTAG AACAACCTTA AAGCACATTG TTCTGACCCC
2603 AAGGCTAGCC TTGTGGCACA GATGAGCTGG AAATGGATTT AAGGTGCACC
2653 TGAGTTACTA GAGTTAACTA CACTGGTAGA TAGACCCCTC TAGTGGAAGT
2703 GAGGTGATAA TATAATTTTA GATCGAAATA ATAAATGTTT AACCTCAAAA
2753 AAAGGAAGTT ATTACCACTC AACTAGGTTA CAGTGGTAGG GGGATAAGTT
2803 CTTTTTTAAG TATTGTGAAA TCATGTCTAA ACAGAATCAT CGCTAGGCTC
2853 TAGTCCACAG CTTTTCATTG TCTTGGGATG CCTACTCATT GAACACCACC
→#2949
2903 CCCAATATTG CTGACTTTTT TTGGTGGTAT GATCTAATGA GCCCAAATTT
2953 TTATTGAAAT TAGGGGGCTG GGAGTCAAAT TCTTGATTTT TACTGTTAGA
…………………………………………………………………………………………………………………………………………………
48703 TCATTGGTCA CATAATATTG ACCTTTAGCT TTGGCTCATA TAACCAAGAA
→#2477
48775 TTTCTATTAT GTAGCTTTTT CCTGTCACTG CTGGGTACTT TGGCCCTTCC
48803 TTAAACTTTT TGAATGTAAT TTAAGATTTT GTCCTTAGAA GGAAAATTCA
48853 GAAATATTTT TTCTCAATAA ATTTTGGTAA GTGATGACTT CTCATTTGTT
48903 TTCTTTATTA AAGCTGTATG TAGAGACATG GTAACCTATT CAGATTGTTT
49953 TGATAGTTTG AAATTCTGTT TAAATTATCC CTAAGATGAG AACTTAGCAA
49003 GAGTGCTTAT ATTTATCACA ATTTTTTAAA GTCTGAAACG TTTTTGGTTT
5’UTR
49053 TTCTTTAGAT CTTTAAATGG ATGAGATGGC TACCACTCAG ATTTCCAAAG exon 2
49103 ATGAGCTTGA TGAACTCAAA GAGGCCTTTG CAAAAGTTGG TGAGTATTTT
49153 TTGTAGTAAA ACTATAGGGA AGCAATATTT ATTTGGTCTC AAAGTTATTT intron 2
49203 CTCTATAAAT ATCACATGAA TGGTTAATCA AAAACATTAG GGCAAGATAG
49253 TTAAAATAGA TGGGATAAAG TTTTGGAAGC TATACTTAAA ATTGTTTTAT
#2478←
49303 TTCTTTTTTT TTTTTTTGGT CGAGTGGTAG CTGATATTAT TTCCAATTTT
49353 ATGTAGTATT TAATATGGTC AAATTTTTTA GACCACAGTT CCAATCCTTA
…………………………………………………………………………………………………………………………………………………………………………
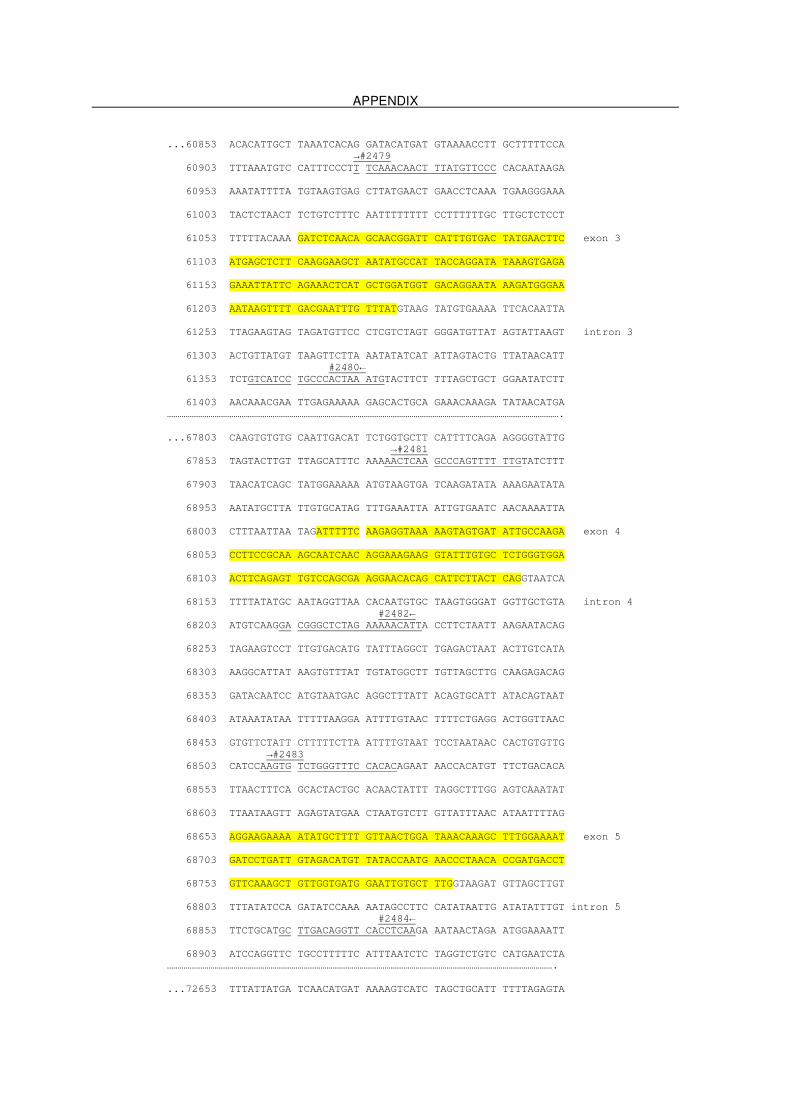
APPENDIX
...60853 ACACATTGCT TAAATCACAG GATACATGAT GTAAAACCTT GCTTTTTCCA
→#2479
60903 TTTAAATGTC CATTTCCCTT TCAAACAACT TTATGTTCCC CACAATAAGA
60953 AAATATTTTA TGTAAGTGAG CTTATGAACT GAACCTCAAA TGAAGGGAAA
61003 TACTCTAACT TCTGTCTTTC AATTTTTTTT CCTTTTTTGC TTGCTCTCCT
61053 TTTTTACAAA GATCTCAACA GCAACGGATT CATTTGTGAC TATGAACTTC exon 3
61103 ATGAGCTCTT CAAGGAAGCT AATATGCCAT TACCAGGATA TAAAGTGAGA
61153 GAAATTATTC AGAAACTCAT GCTGGATGGT GACAGGAATA AAGATGGGAA
61203 AATAAGTTTT GACGAATTTG TTTATGTAAG TATGTGAAAA TTCACAATTA
61253 TTAGAAGTAG TAGATGTTCC CTCGTCTAGT GGGATGTTAT AGTATTAAGT intron 3
61303 ACTGTTATGT TAAGTTCTTA AATATATCAT ATTAGTACTG TTATAACATT
#2480←
61353 TCTGTCATCC TGCCCACTAA ATGTACTTCT TTTAGCTGCT GGAATATCTT
61403 AACAAACGAA TTGAGAAAAA GAGCACTGCA GAAACAAAGA TATAACATGA
……………………………………………………………………………………………………………………………………………………………………….
...67803 CAAGTGTGTG CAATTGACAT TCTGGTGCTT CATTTTCAGA AGGGGTATTG
→#2481
67853 TAGTACTTGT TTAGCATTTC AAAAACTCAA GCCCAGTTTT TTGTATCTTT
67903 TAACATCAGC TATGGAAAAA ATGTAAGTGA TCAAGATATA AAAGAATATA
68953 AATATGCTTA TTGTGCATAG TTTGAAATTA ATTGTGAATC AACAAAATTA
68003 CTTTAATTAA TAGATTTTTC AAGAGGTAAA AAGTAGTGAT ATTGCCAAGA exon 4
68053 CCTTCCGCAA AGCAATCAAC AGGAAAGAAG GTATTTGTGC TCTGGGTGGA
68103 ACTTCAGAGT TGTCCAGCGA AGGAACACAG CATTCTTACT CAGGTAATCA
68153 TTTTATATGC AATAGGTTAA CACAATGTGC TAAGTGGGAT GGTTGCTGTA intron 4
#2482←
68203 ATGTCAAGGA CGGGCTCTAG AAAAACATTA CCTTCTAATT AAGAATACAG
68253 TAGAAGTCCT TTGTGACATG TATTTAGGCT TGAGACTAAT ACTTGTCATA
68303 AAGGCATTAT AAGTGTTTAT TGTATGGCTT TGTTAGCTTG CAAGAGACAG
68353 GATACAATCC ATGTAATGAC AGGCTTTATT ACAGTGCATT ATACAGTAAT
68403 ATAAATATAA TTTTTAAGGA ATTTTGTAAC TTTTCTGAGG ACTGGTTAAC
68453 GTGTTCTATT CTTTTTCTTA ATTTTGTAAT TCCTAATAAC CACTGTGTTG
→#2483
68503 CATCCAAGTG TCTGGGTTTC CACACAGAAT AACCACATGT TTCTGACACA
68553 TTAACTTTCA GCACTACTGC ACAACTATTT TAGGCTTTGG AGTCAAATAT
68603 TTAATAAGTT AGAGTATGAA CTAATGTCTT GTTATTTAAC ATAATTTTAG
68653 AGGAAGAAAA ATATGCTTTT GTTAACTGGA TAAACAAAGC TTTGGAAAAT exon 5
68703 GATCCTGATT GTAGACATGT TATACCAATG AACCCTAACA CCGATGACCT
68753 GTTCAAAGCT GTTGGTGATG GAATTGTGCT TTGGTAAGAT GTTAGCTTGT
68803 TTTATATCCA GATATCCAAA AATAGCCTTC CATATAATTG ATATATTTGT intron 5
#2484←
68853 TTCTGCATGC TTGACAGGTT CACCTCAAGA AATAACTAGA ATGGAAAATT
68903 ATCCAGGTTC TGCCTTTTTC ATTTAATCTC TAGGTCTGTC CATGAATCTA
…………………………………………………………………………………………………………………………………………………………………….
...72653 TTTATTATGA TCAACATGAT AAAAGTCATC TAGCTGCATT TTTTAGAGTA

APPENDIX
→#2485
72703 CATGAAAGAG ATGTTATAGT AAGCTTTAAA ATATTTGTAA ATATTTACAG
72753 CCACTTTATA AAAGGAAATC AGCTCTTTTT TTTTACATCA GCCTTTTTTT
72803 AAATTTTTGT TTCAGTAAAA TGATTAACCT TTCAGTTCCT GATACCATTG exon 6
72853 ATGAAAGAGC AATCAACAAG AAGAAACTTA CACCCTTCAT CATTCAGGTA
72903 TGCATTGTTC TCCCCTCCCT TTAACATGAA ATTACTGTTT GAGGACCTGT intron 6
#2484←
73953 TCTGCAGACT TCAGCCTCTG CACTCTGTAG GCTCCCAATC AATCCTTGTA
73003 AAAACTGTTG AGTGTGGGAT TGTTATCCAG ATTATACAGA CAGAACTGGG
………………………………………………………………………………………………………………………………………………………………………….
...73553 AATTTGTTTT TTGTGACACA TATATGGATG AAATTAATAC AGGGTATTAA
→#2487
73603 TTTCCTCATT GAATGTTATT TTCAGTGAAG GGAGAAAGTA GACTGCTAAA
73653 AAATGGAAAG GTCAAGAAGC AAGTGTGTAA TTTGGCTGTC TTGCAGGAAA exon 7
73703 ACTTGAACTT GGCACTGAAC TCTGCTTCTG CCATTGGGTG TCATGTTGTG
73773 AACATTGGTG CAGAAGATTT GAGGGCTGGG AAACCTCATC TGGTTTTGGG
73803 ACTGCTTTGG CAGATCATTA AGATCGGTTT GTTCGCTGAC ATTGAATTAA
73853 GCAGGAATGA AGGTAATGGA ACACAGTCAT TCTGGCAGTT GTTTATTGGT intron 7
#2488←
73903 TATTTTTTTC TAGTCATGCA GACTTTCGTG CTCTCACTTA ATGGAGGTGA
73953 TTAAATGGTG GTAACTAGAA TGAACATAAG GTAATGCTAT AGAGTTATTC
74003 AGGAAAATAG CCTAATTACA TGACTCTCTT CTTTACTAGT AATTCACATT
………………………………………………………………………………………………………………………………………………………………………
...75503 TTTAGTAGAT TATGAGTATC TTGAAACTAG GAACTATGTC ATAGTAGTTT
→#2489
75553 TTGCACCTCT ATTACTTAAC AGTGTCAAAA GACTGAATGA ACTTGGCATG
75603 ACCATTATTG TGTCATATAA TAACTGTGGG ATTTTTTTTT TTTTCTTCTA
75653 GCCTTGGCTG CTTTACTCCG AGATGGTGAG ACTTTGGAGG AACTTATGAA exon 8
75703 ATTGTCTCCA GAAGAGCTTC TGCTTAGATG GGCAAACTTT CATTTGGAAA
75753 ACTCGGGCTG GCAAAAAATT AACAACTTTA GTGCTGACAT CAAGGTAACT
75803 GTTGAAAGAA TCACAACATT TTGGGGGGAT ATAATAGCTG GAAGATTTCA intron 8
75853 TCCCAGCTTA ACAGAGAGAA AATCCTAACA CTGTATCACC AAGCCTTGTT
#2490←
75903 GTCTCTTGGC CCTGAAGGTA GATTTTAGAA GAGTAATAGA GCCAGATAAG
76953 GTACATTAGC ACCTATGTTT TATTTTGTGG GAAAAGGTAA AAATATTATG
………………………………………………………………………………………………………………………………………………………………….
...79053 TATAAGGCAG ATAGATGGAC TTTTCTGGGG AAAACACCTG TTAAATTAAA
→#2491
79103 AGGCAGAGAT TTGTGCCATT TATTCTCAAA AAATCCAATG CAAATAGCCT
79153 TCCAAACATG GGACAATAGG ATACATTCAT TCCTTGTAAC TGTGATCTCA
79203 CTGACATTTT CAATTCTTTG TAGGATTCCA AAGCCTATTT CCATCTTCTC exon 9
79253 AATCAAATCG CACCAAAAGG ACAAAAGGAA GGTGAACCAC GGATAGATAT
79303 TAACATGTCA GGTTTCAATG TAAGTATAAG TGCTCTTTTG AATTCTACAA intron 9
79353 TCTTGCAAAA TTATTGTCAA TTTCTTATAA GTACAATAAT TTTTATAATC
#2492←
79403 GTATGAAGTA GAGTTGGCAA TTTTAAGCAT TATTTTAAAA TGTATTACTG
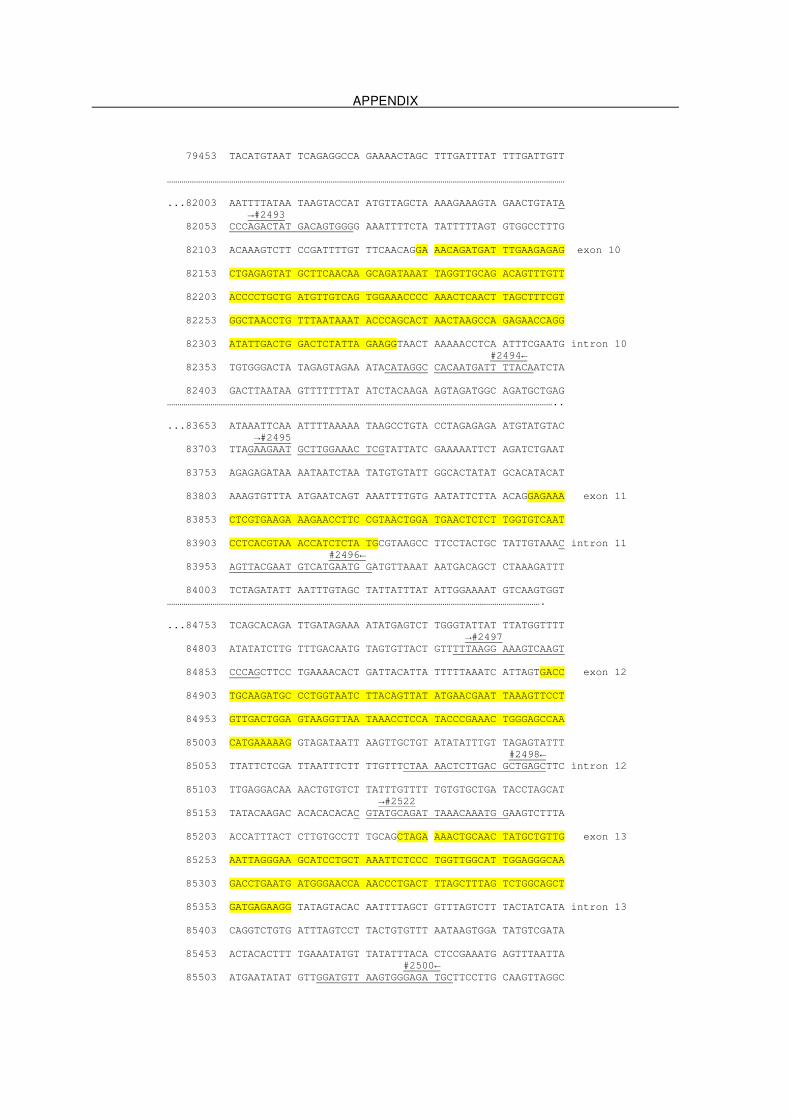
APPENDIX
79453 TACATGTAAT TCAGAGGCCA GAAAACTAGC TTTGATTTAT TTTGATTGTT
…………………………………………………………………………………………………………………………………………………………………………
...82003 AATTTTATAA TAAGTACCAT ATGTTAGCTA AAAGAAAGTA GAACTGTATA
→#2493
82053 CCCAGACTAT GACAGTGGGG AAATTTTCTA TATTTTTAGT GTGGCCTTTG
82103 ACAAAGTCTT CCGATTTTGT TTCAACAGGA AACAGATGAT TTGAAGAGAG exon 10
82153 CTGAGAGTAT GCTTCAACAA GCAGATAAAT TAGGTTGCAG ACAGTTTGTT
82203 ACCCCTGCTG ATGTTGTCAG TGGAAACCCC AAACTCAACT TAGCTTTCGT
82253 GGCTAACCTG TTTAATAAAT ACCCAGCACT AACTAAGCCA GAGAACCAGG
82303 ATATTGACTG GACTCTATTA GAAGGTAACT AAAAACCTCA ATTTCGAATG intron 10
#2494←
82353 TGTGGGACTA TAGAGTAGAA ATACATAGGC CACAATGATT TTACAATCTA
82403 GACTTAATAA GTTTTTTTAT ATCTACAAGA AGTAGATGGC AGATGCTGAG
……………………………………………………………………………………………………………………………………………………………………..
...83653 ATAAATTCAA ATTTTAAAAA TAAGCCTGTA CCTAGAGAGA ATGTATGTAC
→#2495
83703 TTAGAAGAAT GCTTGGAAAC TCGTATTATC GAAAAATTCT AGATCTGAAT
83753 AGAGAGATAA AATAATCTAA TATGTGTATT GGCACTATAT GCACATACAT
83803 AAAGTGTTTA ATGAATCAGT AAATTTTGTG AATATTCTTA ACAGGAGAAA exon 11
83853 CTCGTGAAGA AAGAACCTTC CGTAACTGGA TGAACTCTCT TGGTGTCAAT
83903 CCTCACGTAA ACCATCTCTA TGCGTAAGCC TTCCTACTGC TATTGTAAAC intron 11
#2496←
83953 AGTTACGAAT GTCATGAATG GATGTTAAAT AATGACAGCT CTAAAGATTT
84003 TCTAGATATT AATTTGTAGC TATTATTTAT ATTGGAAAAT GTCAAGTGGT
……………………………………………………………………………………………………………………………………………………………….
...84753 TCAGCACAGA TTGATAGAAA ATATGAGTCT TGGGTATTAT TTATGGTTTT
→#2497
84803 ATATATCTTG TTTGACAATG TAGTGTTACT GTTTTTAAGG AAAGTCAAGT
84853 CCCAGCTTCC TGAAAACACT GATTACATTA TTTTTAAATC ATTAGTGACC exon 12
84903 TGCAAGATGC CCTGGTAATC TTACAGTTAT ATGAACGAAT TAAAGTTCCT
84953 GTTGACTGGA GTAAGGTTAA TAAACCTCCA TACCCGAAAC TGGGAGCCAA
85003 CATGAAAAAG GTAGATAATT AAGTTGCTGT ATATATTTGT TAGAGTATTT
#2498←
85053 TTATTCTCGA TTAATTTCTT TTGTTTCTAA AACTCTTGAC GCTGAGCTTC intron 12
85103 TTGAGGACAA AACTGTGTCT TATTTGTTTT TGTGTGCTGA TACCTAGCAT
→#2522
85153 TATACAAGAC ACACACACAC GTATGCAGAT TAAACAAATG GAAGTCTTTA
85203 ACCATTTACT CTTGTGCCTT TGCAGCTAGA AAACTGCAAC TATGCTGTTG exon 13
85253 AATTAGGGAA GCATCCTGCT AAATTCTCCC TGGTTGGCAT TGGAGGGCAA
85303 GACCTGAATG ATGGGAACCA AACCCTGACT TTAGCTTTAG TCTGGCAGCT
85353 GATGAGAAGG TATAGTACAC AATTTTAGCT GTTTAGTCTT TACTATCATA intron 13
85403 CAGGTCTGTG ATTTAGTCCT TACTGTGTTT AATAAGTGGA TATGTCGATA
85453 ACTACACTTT TGAAATATGT TATATTTACA CTCCGAAATG AGTTTAATTA
#2500←
85503 ATGAATATAT GTTGGATGTT AAGTGGGAGA TGCTTCCTTG CAAGTTAGGC

APPENDIX
85553 AGCAGAACTA TGGTTAGTCC CTTTTTTAAA AAATAGGAAG CCTGACACAC
85603 AGATTTCGGC CTCGTTTAGT GTCAGTGAAT TAAAAAATTG TCAGAACAAA
85653 ATTATGAACA TCTTCATGCT CATTTGAAAA TAAAGATCTC TCTCTGTAAT
85703 GCTGATGAAG ATCACTATAA TGCTGAAAAG CATTCATTAT GACTGGGCAC
85753 CAGCCAAAGC ACAGCTTATT TTATGCCATT ACCGCTATTG GAATAGTACA
85803 AAATGTGCCT ACAGTGGGCT GTTGGACCTG CTCATTAAAG CACTGTCAAT
85853 CTGCTCCTCT CTCACCACTA CAAAGAGTAG ATCAGTAGCA AGCCACTACT
86903 GCTTGAAATA TTTTTTTCAC ATAGTGTGAA TCTCTTTCCA TGAAATCTTT
86953 AGTCCTTGAA ATTTAAGGAA TATAGGGGCC AGGAGTGGTG GCTCACGCCT
86003 GTAATACCAG CACTTTGGGA GGCCAAGGAG GGTGGATCAC GAGGTCAGGA
86053 GATCAAGACC ATCCTGGCTA CACGGTGAAA CCCTGTCCCT ACTAAAAATA
86103 TAAAAAATTA GCTGGGCGTG GTGGTGGGCA CCTGTAGTCC CAGCTACTCA
86153 GGAAGCTGAG GCAGGAGAAT GGTGTGAACC CGGGAGGCGG AGCTTGCAGT
86203 AGCAGGAGA TTGCGCCACT GCACTCCAGC CTGGGCGACA GAGCGAGACT
86253 CCGTCTCAAA AAAAAGAAGA AAAATTTAAG AAATATAAAA AGTGGAAGAT
→#2501
86303 AAAGCATCTT TCTGATGTTT GCATTTTTCC TCATAAAGTA GATGGTGACG
86353 TTTTCTTCTG CTGCCTCTCT TAGATATACC CTCAATGTCC TGGAAGATCT exon 14
86403 TGGAGATGGT CAGAAAGCCA ATGACGACAT CATTGTGAAC TGGGTGAACA
86453 GAACGTTGAG TGAAGCTGGA AAATCAACTT CCATTCAGAG TTTTAAGGTC
86503 AGAATCCATA TTTGACTATT AAATATTATG TTTGCTGGAT AACATCTATC
86553 ATTTGGGAAG GCAACTTTTG GCTTCTTTGT GAGTGAGAAT TAGTGTTGGG intron 14
#2502← →#2523
86603 CTAATGGCAC AATTCTTTAC GAATTCACTG GGCTTTGTTT TTGGCACTTG
86653 ATATAAGTAA GCACATGTTA ATTTGTATGT ATCAAAATTC TCAGATTTGT
86703 TCTCCTTTCA CACTAGGACA AGACGATCAG CTCCAGTTTG GCAGTTGTGG exon 15
86753 ATTTAATTGA TGCCATCCAG CCAGGCTGTA TAAACTATGA CCTTGTGAAG
86803 AGTGGCAATC TAACAGAAGA TGACAAGCAC AATAATGCCA AGTAAGGGAG
#2524←
86853 ACTGCTAATA GTATGAAAAG AACGCAGCTT TGTAGCTGGA CAGATCTGAA intron 15
87903 TTCTAATTCA GGTTCTGCCA TTTAAGAGTG GTGTCACCTT GGGAGAAACC
………………………………………………………………………………………………………………………………………………………………………….
...88053 GAGCTTAAAA ACCTACTGTA ACTTCAAAGT GAAATCAAAA CCCAAATCAA
88103 AAGAAAACAA AAAGCAAAAC TGTTCTAATT GGAACTATCA ATATGGAATT
88153 TTTGCATCCC AGCATAATAA TTATATATGA GGAAATAGAT GTCTTACGTG
→#2525
88203 GTGTCCTTAA CTGACAAGAA TTTCATCCTG ATTTTGTTTC CCCCTAAAAT
88253 AGGTATGCAG TGTCAATGGC TAGAAGAATC GGAGCCAGAG TGTATGCTCT exon 16
88303 CCCTGAAGAC CTTGTGGAAG TAAAGCCCAA GATGGTCATG ACTGTGTTTG
→#2657
88353 CATGTTTGAT GGGCAGGGGA ATGAAGAGAG TGTAAAATAA CCAATCTGAA
#2526←
88403 TAAAACAGCC ATGCTCCCAG GTGCATGATT CGCAGGTCAG CTATTTCCAG 3’UTR

APPENDIX
88453 GTGAAGTGCT TATGGCTTAA GGAACTCTTG GCCATTCAAA GGACTTTTCA
88503 TTTTGATTAA CAGGACTAGC TTATCATGAG AGCCCTCAGG GGAAAGGGTT
88535 TAAGAAAAAC AACTCCTCTT TCCCATAGTC AGAGTTGAAT TTGTCAGGCA
88603 CGCCTGAAAT GTGCTCATAG CCAAAACATT TTACTCTCTC CTCCTAGAAT
→#2659
88653 GCTGCCCTTG ACATTTCCCA TTGCTGTATG TTATTTCTTG CTCTGTTATC
#2658←
88703 TTTTGCCCTC TTAGAATGTC CCTCTCTTGG GACTTGCTTA GATGATGGGA
88753 TATGAATATT ATTAGACAGT AATTTTGCTT TCCATCCAGT ATGCTAGTTC
88803 TTATTCGAGA ACTATGGTCA GAGCGTATTT GGATATGAGT ATCCTTTGCT
88853 TATCTTTGTA GTACTGAAAA TTTGCCGAAG TAACTGGCTG TGCAGAATGT
88903 AATAGAAGCT TTTCTTATTC TTTTATTCTT AAGATCAGTA TCTTTTTACA
89953 GTATTCTTTC TACATGATCC TTTTTTGTAC ATTTAAGAAT ATTTTGATTA
89003 TATTAAACAA GACTGCTGAT TTTGCTACTT TTTTTAAGGG GTCTTCAAGT
→#2661
89053 AAGTAAAACA TACATCGTAG CTAGAAGAAA AATGTACCTT AAATTTGCAT
#2660←
89103 CTTCCCTCTC ATACCCAAGC TGTAAACAAT TGAAATATTT TGTCTTAAAT
89153 CACTTGGTTC AATACATGCT TATTTGTTTT AAAACCTGTA TCATCAAACT
89203 CTCTCTCTAA ATTTAAAATG CTGTTGAATA TGATACTTTT GAGGAGAGAG
89253 TGTGCTCAGA ACTTAGACGG GATTTGGTAG GCCAAGTATG CTAAGTGTAC
89303 AATATATTTT TTAATTTTAC ACCTGAAACA AAGAAATGTG GTCACTAAAA
#2662←
89353 ATAAAAGTAT ATATGTAGGA ATTAATGTAC TCTTGCTTTG TCAAGCTGTT
89403 TGCTATAGTT TCCAAGGTAT TATGTTACTC TAACTCTGAA AAGTGATGTA
89453 ATCTGGTAGC AATGTAGTAG TTCAAATAAA GGCATTTACA TAATAATTAG
89503 TCTGTTCTTC ATGCTTTTGT C

APPENDIX
V. Fig. F5 T-plastin promoter-1st exon- 1st intron (1 kb) region after bisulfite treatment
t: original T nucleotide; T: original C nucleotide (C converts to T after bisulfite treatment); CG: potential CpG sites for DNA methylation. Each CpG is numbered with the nucleotide position in the T-plastin genomic region; #: primer number used in pyrosequencing (all primers are underlined); →: forward orientation; ←: reverse orientation, +1: transcription initiation start site
→ #2820
-321 tTTTaTaaga ttgtgtgaat gtgtaTtTCG agTTaggTaT gttggaTttT
→ #2899/#2765
-271 taaTttTTtT ttagTTTaag taggaagggg agaTtTaggT gTtggggaTT
-221 attTtTTtTt TTTtgTagTa gagttgTagt TTTtatTTTt TTtgggtgTT
-155
-161 TatTTTCGtg TTtattttTT tggatTTTTa TTTagttgat gtgaTaggTt
-111 -80 -63
-111 CGtggTTTaa tTTTTttTTt ggttTTTagg TCGaTtgTta gTaTTaTTCG
-52 -49 -45 -37 → #2767
-61 agTTaatggC GgCGgTCGag gggCGgaggg ggTtggTagg aggggaggga
-10 +1 +23 → #2967/#2822
-11 gCGTtggTtt tagagTTaTa gTtgTaaaga ttTCGaggtg Tagaagttgt
#2766/#2900 ← +47 +54 +57 +64 → #2824 #2821 ← +85
+40 TtgagtgCGt tggtCGgCGg TagtCGggTT agaTTTagga TtTtgCGaTt
+93 +110 +113 +116 +131
+90 ttaCGtaagt gTtttgtagg CGTCGgCGgg TaTtagggga gCGggtttTT
+144 → #2902/#2769 +163 +177
+140 tgggCGtggg Taggagtggg tTTCGgggag agTatTtCGg ttaagTtTag
+196 +200+203 +208 +215 #2769/#2901 ← +238
+190 TaggaaCGtg CGgCGTaTCG tggggCGggg gttgggggag agggaggtCG
→ #2826 #2823 ← +262 +266 +270 +274 +278 +282 +288
+240 gagaaatttT agttggagTT TtCGggCGTT CGggCGatCG gtCGTaaTCG
+306 → #2903/#2771 +329 +332
+290 aaatgggtgt gagtgaCGgg gagtttTTTt aTtagTatTC GTCGTagaTa
+340 #2770/#2968 ←
+340 CGttttTtgT aTttTaTtgt attaagtggt gttttTttaT tagttgTtTt

APPENDIX
#2825 ← +424
+390 taaTttgttg TTagtTttgg gTtggagtTT tagaCGTTag TTTttgTTTt
+450+453 +458 +464 +480
+440 gattTTTTtT CGCGgTtgCG gTTTCGaagt ggaaagggag CGTaTaaTtt
+498 +535 +539
+490 TTTtTtgtCG tTTttTtTTa gTtaTtgTTa tTTTTtTttT TTtTTCGTTC
→ #2915 +555 → #2905/#2773 #2827/#2904 ←
+540 GgaTtTagga aatTTCGgag TTagTagTTt gTtaTtTTtT TagTTTTTaT
+591 +595 +600 #2772 ← +623
+590 aCGTTCGTTt CGggtgaTTt ggTtggTtta agTCGaTTTt ggggTtTtgg
+651 +657 +699
+640 agaggggggg TCGtggTCGa gggaaggTaC Gaggtttggg ttgTTtgTTt
+718 +724+727+729 +733
+690 tTtgTTtgTt tTTTtTTTtt gtTTttagCG agggCGtCGC GaaCGTaTTt
→ #2197 → #2909/#2908
+740 agtTtTTTta tgagtaagTa TtttttttTT tttTagtagg agaaTatTtT
#2906/#2907 ← →#3119/#2916 ← +814
+790 tgggTtagta ggaTagtaTT tttTCGttTt TTTTtggTTT TaTaTTTTTt
+867 +873 +877+879+881 +855
+840 gtTTtttttt TagTtTTttt gaTtttgCGg TTTCGggCGC GCGgtCGggg
+890 +893 +902 → #3123/#3121
+890 CGgCGgTagt TTCGgaTTtT tTTCGaTtTt tggagagaga gaggTaaagg
+942 +945 #2910/#2969 ← +972 +983
+940 ggCGaCGgga gggaggtaat agtTtaTTTT TTCGTTTttt TTTCGTaTag
#2918 ← +1021 +1034
+990 TtgTaTttgT TtgtgtttaT ttttTtTTaT TCGTagtaTt taagCGTtgt
+1051 +1057 +1060 +1070 +1083
+1040 aatgagaggT TCGgggaCGT CGaTTaTTTT CGTTTtggTt tTtCGTTagt
1104 +1107 +1110 +1129 +1135 +1139
+1090 TTTaaagttg TtgTCGTCGt CGTtgTtTTa gtgtgTtggC GgttTCGaTC
+1142 +1149 +1154 +1172
+1140 GTCGggTtTC GggaCGtaag atgatTTTag TTCGggaggt ggagtggggg

APPENDIX
+1207
+1190 ttaatggTat TtgaTtTtag TTttatgCGa tgTtTTttgT TtTtTaTTtg
+1247 #3122/#3124 ← 3120 ←
+1240 agTtgTaCGa tatTTTTagt ggtgTagaag gttgaaTttt tgTagaaggt
1 2 3 4 5 6 7 8 9 10 11 12 13 14 15 16 17 18 19 20 21 22 23 24 25 26 L
27 28 29 30 31 32 33 34 35 36 37 38 39 40 41 42 43 44 45 46 47 48 49 50 51 52 L
53 54 55 56 57 58 59 60 61 62 63 64 65 66 67 68 69 70 71 72 73 74 75 76 77 78 79
VI. Fig. 6 T-plastin expression analysis by RT-PCR in 79 SMA patients
The current number (1 from 79) corresponds to the EBV cell culture shown in Table T1 from appendix.HPRT gene was used as internal control. The samples where no HPRT transcript was amplified (1, 13, 28, 33, 68 and 70) were repeated independently. L: 100 bp DNA ladder
T-plastinHPRT
T-plastinHPRT
T-plastinHPRT
1 2 3 4 5 6 7 8 9 10 11 12 13 14 15 16 17 18 19 20 21 22 23 24 25 26 L
27 28 29 30 31 32 33 34 35 36 37 38 39 40 41 42 43 44 45 46 47 48 49 50 51 52 L
53 54 55 56 57 58 59 60 61 62 63 64 65 66 67 68 69 70 71 72 73 74 75 76 77 78 79
1 2 3 4 5 6 7 8 9 10 11 12 13 14 15 16 17 18 19 20 21 22 23 24 25 26 L
27 28 29 30 31 32 33 34 35 36 37 38 39 40 41 42 43 44 45 46 47 48 49 50 51 52 L
53 54 55 56 57 58 59 60 61 62 63 64 65 66 67 68 69 70 71 72 73 74 75 76 77 78 79
VI. Fig. 6 T-plastin expression analysis by RT-PCR in 79 SMA patients
The current number (1 from 79) corresponds to the EBV cell culture shown in Table T1 from appendix.HPRT gene was used as internal control. The samples where no HPRT transcript was amplified (1, 13, 28, 33, 68 and 70) were repeated independently. L: 100 bp DNA ladder
T-plastinHPRT
T-plastinHPRT
T-plastinHPRT

APPENDIX

APPENDIX

APPENDIX

APPENDIX

APPENDIX
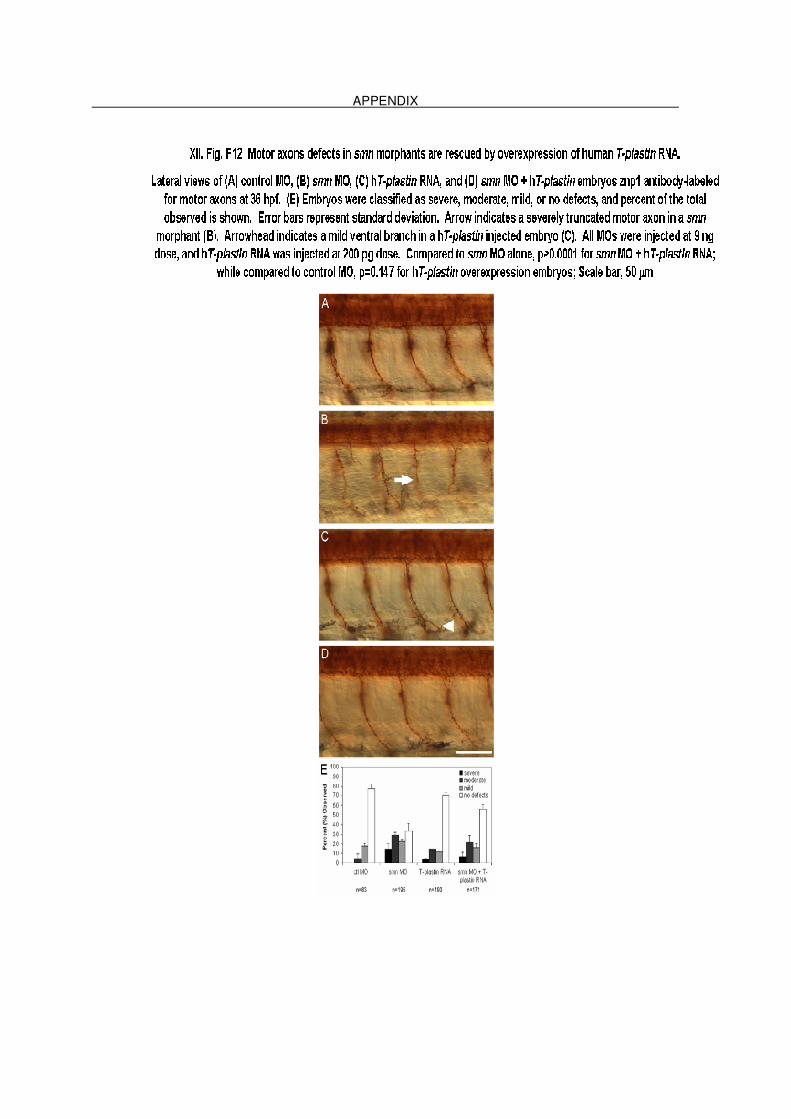
APPENDIX

APPENDIX
Tables:
I. T1 Classical SMA patients checked for T-plastin expression
II. T2 Phenotypic and genotypic description of SMA discordant families used for genome-wide scan
III. *T3 Up-regulated transcripts detected by microarray analysis in SMA discordant families
IV. *T4 Down-regulated transcripts detected by microarray analysis in SMA discordant families
V. *T5 Up-regulated transcripts detected by microarray analysis in classical SMA patients
VI. *T6 Down-regulated transcripts detected by microarray analysis in classical SMA patients
VII. *T7 Susceptibility regions detected by the genome-wide scan analysis in SMA discordant families
VIII. *T8 Raw data for each chromosomal region detected by the genome-wide scan analysis
IX. *T9 Raw data for methylation analysis of T-plastin CpG island in two control populations
X. *T10 Raw data for methylation analysis of T-plastin CpG island in SMA discordant families
XI. *T11 Raw data for T-plastin haplotype blocks analysis
*: The tables are contained in the attached CD-ROM

APPENDIX
Table T1 Classical SMA patients checked for T-plastin expression
Cr. No.
EBV no.
DNA no.
Gender SMA type
Plastin (Multiplex-PCR) Expression
Genotype SMN1 copy No
SMN2 copy no.
17 BW 84 353 f l - del/del 0 n.d.
1 T 21/91 55 f l - del/del 0 2
26 BW 187 969 f l - del/del 0 2
28 BW 191 997 f l - del/del 0 2
32 BW 2263 1125 f l - del/del 0 2
36 BW 246 1271 f l - del/del 0 3
5 BW 1 177 f l + del/del 0 2
40 BW 258 1722 f l + del/del 0 2
12 BW 38a 2561 f l ++ del/del 0 2
10 BW 27 219 f ll - del/del 0 3
24 BW 176 756 f ll - del/del 0 3
25 BW 178 851 f ll - del/del 0 n.d.
29 BW 208 1075 f ll - del/del 0 n.d.
19 BW 126a4 484 f ll - del/del 0 n.d.
39 BW 251 1312 f ll + del/del 0 2
2 T 40/91 72 f ll + del/del 0 3
48 BW 325 2481 f ll + del/del 0 n.d.
4 T 84/91 1191 f ll ++ del/del 0 2
31 BW 2172 10971 f ll +++ del/del 0 n.d.
42 BW 299 2321 f lll - del/del 0 4
21 BW 164 7081 f llla + del/del 0 2
8 BW 21 202 f lllb - del/del 0 4
59 BW 402 3984 f lllb - del/del 0 4
37 BW 2484 1275 m I - del/del 0 2
22 BW 1682 699 m l - del/del 0 2
14 BW 614 306 m l - del/del 0 2
18 BW 854 357 m l - del/del 0 3
11 BW 294 227 m l - del/del 0 3
13 BW 52 292 m l - del/del 0 2
34 BW 238a4 1196 m l - del/del 0 n.d.
3 T67/914 97 m l ++ del/del 0 3
9 BW 264 215 m ll - del/del 0 3
16 BW 73 331 m ll - del/del 0 3
44 BW 3154 2418 m ll - del/del 0 n.d.
47 BW 3214 2439 m ll - del/del 0 3
69 LN 472 5392 m ll - del/del 0 3

APPENDIX
71 LN 4804 5815 m ll - del/del 0 3
6 BW 2 174 m ll - del/del 0 3
30 BW 210 1079 m ll - del/del 0 3
41 BW 2744 866 m ll + del/del 0 3
27 BW 1904 9941 m ll + del/del 0 3
45 BW 3174 2429 m lll + del/del 0 n.d.
23 BW 1742,4 798 m llla - del/del 0 4
65 LN 443 4691 m llla - del/del 0 3
43 BW 3024 2345 m llla - del/del 0 3
33 BW 232 1141 m lllb - del/del 0 4
15 BW 704 3261 m lllb ++ del/del 0 3
20 BW 1452,4 5301 m lllb +++ del/del 0 4
3 BW 250 1307 f l - del/M 1 2
61 BW 420 3952 f l - del/M 1 2
70 LN 476 5762 f l - del/M 1 2
79 LN 525a 6536 f l - del/M 1 2
63 LN 434 2833 f ll - del/M 1 2
78 LN 507 2648 f ll - del/M 1 2
77 LN 497 6124 f lllb - del/M 1 3
35 BW 243 431 f ll +++ del/M 1 2
72 LN 481 4548 m l - del/M 1 3
67 LN 462 4983 m l - del/M 1 2
59 BW 405 3919 m l - del/M 1 3
77 LN 499 6279 m l - del/M 1 2
7 BW 20a 201 m ll - del/M 1 2
62 LN 429 4133 m ll - del/M 1 3
74 LN 495 5975 m lll - del/M 1 1
75 LN 496 6047 m lll - del/M 1 3
73 LN 489 5914 m lllb - del/M 1 1
50 BW 3394 1927 m llla ++ del/M 1 3
53 BW 376a 9351 m lllb +++ del/M 1 1
68 LN 470 4346 f lll - W/W 2 2
54 BW 377 3612 m I - W/W 2 0
52 BW 3614 2272 m lll - W/W 2 1
57 BW 394 3488 m lll - W/W 2 2
46 BW 3194 2436 m llla - W/W 2 1
49 BW 3364 2245 m lllb - W/W 2 1
60 BW 4093 42011 m l +++ W/W 2 2

APPENDIX
55 BW 380 3083 f ll - present n.d. n.d.
56 BW 392 3492 f lll - present n.d. n.d.
51 BW 346 2646 f lllb - present n.d.
66 LN 449 3680 m lll - present n.d.
64 LN 437 2128 f lll - del/? 1 0
• 1: DNA samples used for haplotype analysis • 2: EBV-transformed lymphoblastoid cell lines used for in vivo footprinting experiment • 3: EBV-transformed lymphoblastoid cell lines used for microarray anlysis. Additional two cell lines
(BW 12 and BW 390) belonging to type III SMA patients were analyzed by this method. • 4: EBV-transformed lymphoblastoid cell lines used for T-plastin CpG island methylation analysis • The amount of T-plastin transcript was scored relative to the HPRT intensity band with “–“ for no
expression; “+“ for a very weak expression, “++” for middle expression and “+++” for a strong expression.

APPENDIX
II. Table T2 Phenotypic and genotypic description of SMA discordant families used for genome-wide scan analysis A: age of onset; C: country; DR degree of relationship; G: genotype; MM: motor milestones; P: phenotype; S: sex.
Fam no.
DNA-No (old)
DNA no. new
S DR P A MM G C
1 92-808 ET1 M father unaffected - - - Spain 92-809 ET2 F mother unaffected - - - Spain 92-810 ET3 M child 1 SMA IIIa 2y Wheelch.17y del/del Spain 92-812 ET4 F child 2 SMA III b - Only cramps
since adolescence
del/del Spain
2 95-331 ET5 M child 1 SMA - 58y still walking del/del Spain 95-599 ET6 M child 2 SMA - Wheelch.12y del/del Spain 3 96-850 ET7 F mother unaffected - - - Spain 96-852 ET8 F child 1 SMA IIIb 18y 32y still walking - Spain 96-853 ET9 M child 2 SMA IIIa 2y Wheelch.12y- del/del Spain 4 99-
1847 ET10 M father unaffected - - - Spain
99-1848
ET11 F mother unaffected - - - Spain
96-1244
ET12 F child 1 SMA IIIa 1y type II-never walked
del/del Spain
99-1849
ET13 M child 2 SMA IIIb 12y wheelch.20y del/del Spain
5 91-375 ET14 M father unaffected - - - Spain 91-374 ET15 F mother unaffected - - - Spain 91-369 ET16 F child 1 SMA IIIb 30y min manif 40y
still walking SM Spain
91-376 ET17 F child 2 SMA IIIa 2y Wheelch 8y SM Spain 91-370 ET18 F child 3 SMA IIIa 1.5y Wheelch 14y SM Spain 91-372 ET19 F child 4 SMA IIIa 1.5y Wheelch 8y SM Spain
63 98-224 ET20 M child 1 SMA IIIb 30y still walking at 65l
SM/del Spain
00-1821
ET21 F child 2 SMA IIIa 1.5y Wheelch 14y SM/del Spain
00-1854
ET22 F child 3 unaffected - - SM/del Spain
7 193 JM1 M father unaffected - - - France 194 JM2 F mother unaffected - - - France 144 JM3 F child 1 SMA III - walk unaided
until ~ 6 y of age
- France
192 JM4 M child 2 SMA II - never walk - France 8 197 JM5 M father unaffected - - - France 198 JM6 F mother unaffected - - - France 196 JM7 M child 1 SMA II - never walk - France 199 JM8 F child 2 SMA III - walk unaided
until ~ 10 y - France
9 67695 JM9 M father unaffected - - - France 67694 JM10 F mother unaffected - - - France 67690 JM11 M child 1 SMA II - never walk - France 67691 JM12 F child 2 SMA III - walk at 16
months until 5 y - France

APPENDIX
67693 JM13 F child 3 SMA III - walk at 18 months (with aid) until 4 y
- France
10 49830 KS1 M father unaffected - - - USA 49831 KS2 F mother unaffected - - - USA 49832 KS3 F child 1 SMA III - - - USA 49833 KS4 F child 2 SMA II - - - USA
11 65088 KS5 M father unaffected - - - USA 65092 KS6 F mother unaffected - - - USA 65089 KS7 F child 1 SMA III - - - USA 65090 KS8 M child 2 SMA II - - - USA
12 50485 KS9 M father unaffected - - - USA 50486 KS10 F mother unaffected - - - USA 50487 KS11 F child 1 SMA III - - - USA 50488 KS12 M child 2 SMA II - - - USA
13 52828 KS13 F mother unaffected - - - USA 41306 KS14 F child 1 SMA IIIb - - - USA 41307 KS15 M child 2 SMA IIIa - - - USA
14 CB1F CB1 M father unaffected - - - Italy CB1M CB2 F mother unaffected - - - Italy CB1C1 CB3 F child 1 SMA III - - - Italy CB2C2 CB4 M child 2 SMA III
more severe
- - - Italy
15 CB2M CB5 F mother unaffected - - - Italy CB2C1 CB6 F child 1 SMA III,
more severe
- - - Italy
CB2C2 CB7 M child 2 SMA III - - - Italy 16 CB3F CB8 M father unaffected - - - Italy
CB3M CB9 F mother unaffected - - - Italy CB3C1 CB10 F child 1 SMA III - - - Italy CB3C2 CB11 F child 2 SMA II - - - Italy
17 CB4F CB12 M father unaffected - - - Italy CB4M CB13 F mother unaffected - - - Italy CB4C1 CB14 M child 1 SMA II - at 10 he was
wheel-chair bounded
- Italy
CB4C2 CB15 F child 2 SMA III 7 y - - Italy 18 CB5F CB16 M father unaffected - - - Italy
CB5M CB17 F mother unaffected - - - Italy CB5C1 CB18 M child 1 SMA III - - - Italy CB5C2 CB19 M child 2 SMA IV - is almost
asymptomatic at the age of 18
- Italy
19 CB6F CB20 M father unaffected - - - Italy CB6M CB21 F mother unaffected - - - Italy CB6C1 CB22 M child 1 SMA II - - - Italy CB6C2 CB23 F child 2 SMA III - - - Italy
203 217-2 LH1 F child 1 unaffected - - del/del Netherland 217-7 LH2 F child 2 unaffected - - del/del Netherland 217-8 LH3 M child 3 SMA IIIb 8 y - del/del Netherland 217-9 LH4 M child 4 unaffected - - del/del Netherland 217-11 LH5 M child 5 SMA IIIb 12 y - del/del Netherland
213 25-2. LH6 M child 1 unaffected - - del/del Netherland 25-4. LH7 M child 2 SMA IIIa 1 y - del/del Netherland 25-6. LH8 F child 3 unaffected - - - Netherland

APPENDIX
25-7. LH9 F child 4 SMA IIIa 1 y - del/del Netherland 25-8. LH10 M child 5 unaffected - - - Netherland
22 48 AB1 M father unaffected - - - USA 47 AB2 F mother unaffected - - - USA 50 AB3 F child 1 SMA II 1 y wheelchair del/del USA 51 AB4 M child 2 SMA IV ~20 y walker del/del USA
23 110 AB5 M father unaffected - - - USA 111 AB6 F mother unaffected - - - USA 112 AB7 F child 1 SMA II 17mo wheelchiar del/del USA 113 AB8 F child 2 SMA IV 13 y walker del/del USA
24 120 AB9 M father unaffected USA 121 AB10 F mother unaffected USA 123 AB11 F child1 type IV 19y USA 124 AB12 F child2 type III USA
251,2,3,4,5 151 OG1 M father unaffected - - - Germany 152 OG2 F mother unaffected - - - Germany 153 OG3 F child 1 unaffected - normal del/del Germany 155 OG4 F child 2 unaffected - normal del/del Germany 157 OG5 F child 3 SMA IIIa 2y - del/del Germany
261,2,3,4,5 675 OG6 M father unaffected - - - Germany 676 OG7 F mother unaffected - - - Germany 677 OG8 M child 1 SMA IIIa 2.5 y 2.5y climb stairs
+ rise = walking del/del Germany
678 OG9 F child 2 unaffected - - del/del Germany 271,2,3,5 4173 OG10 M father unaffected - - - Germany
4175 OG11 F mother unaffected - - - Germany 3956 OG12 M child 1 SMA III - - del/del Germany 4174 OG13 F child 2 unaffected - - del/del Germany
281,2,3,4,5 1219 OG14 M father unaffected - - - Germany 1220 OG15 F mother unaffected - - - Germany 1221 OG16 M child 1 unaffected - - del/del Germany 1222 OG17 M child 2 SMA IIIa 6
mos - del/del Germany
291,2,5 3129 OG18 M father unaffected - - - Germany 3130 OG19 F mother unaffected - - - Germany 2549 OG20 M child 1 SMA IIIb 3.5 y wheelchair (16
y) del/del Germany
2593 OG21 M child 2 SMA IIIa 16 mos
wheelchair (5 y) del/del Germany
301,5 7125 OG22 M father unaffected - - - Germany 7126 OG23 F mother unaffected - - het. tel
SMN Germany
7131 OG24 F child 1 SMA IIIb 17-18 y
- del/del Germany
7133 OG25 M child 2 SMA IIIa 2.5 y - del/del Germany 311,3,4,5 3023 OG26 M father unaffected - - - Germany
3024 OG27 F mother unaffected - - - Germany 3025 OG28 M child 1 SMA III - - del/del Germany 3026 OG29 F child 2 unaffected - - del/del Germany
321,3,5 2400 OG30 F mother unaffected - - - Germany 2401 OG31 F child 1 SMA II 1 y never walk del/del Germany 2402 OG32 M child 2 SMA II 1 y never walk del/del Germany 2404 OG33 F child 3 unaffected - - del/del Germany
331,5 1027 OG34 M father unaffected - - - Germany 1028 OG35 F mother unaffected - - - Germany 1019 OG36 M child 1 SMA IIIb 16 y still walking del/del Germany 1029 OG37 M child 2 SMA IIIa 2.5 y wheelchair (26y) del/del Germany

APPENDIX
1030 OG38 M child 3 SMA IIIb 5 y still walking del/del Germany 341,2,3,4,5 2021 OG39 M father unaffected - - - Germany
2022 OG40 F mother unaffected - - - Germany 2023 OG41 F child 1 unaffected - normal del/del Germany 2024 OG42 F child 2 unaffected - normal del/del Germany 2026 OG43 M child 3 SMA IIIb 18 y still walking del/del Germany 2027 OG44 M child 4 SMA IIIb 13 y still walking del/del Germany
351,5 4312 OG45 M father unaffected - - - Germany 4313 OG46 F mother unaffected - - - Germany 4321 OG47 F child 1 SMA IIIa 12
mos walk with 12 mo del/del Germany
4322 OG48 M child 2 SMA II 7 mos
sit 6 mo, never walk
del/del Germany
361,5 195 OG49 M father unaffected - - - Germany 196 OG50 F mother unaffected - - - Germany 197 OG51 M child 1 SMA IIIa 15
mos wheelchair (7y) del/del Germany
198 OG52 F child 2 SMA II 13 mos
33y, sit no longer
del/del Germany
200 OG53 M child 3 SMA IIIa 17 mos
wheechair (18y) del/del Germany
37 2 PM1 M father unaffected - - - Poland 1 PM2 F mother unaffected - - - Poland 3 PM3 M child 1 SMA II 1 y wheelchair del/del Poland 4 PM4 M child 2 SMA IIIa 3y wheelchair del/del Poland
38 5 PM5 F mother unaffected - - - Poland 6 PM6 F child 1 SMA IIIa 10
mo wheelchair del/del Poland
7 PM7 F child 2 SMA IIIb 9 y walker del/del Poland 39 8 PM8 F child 1 SMA IV 34 y walker del/del Poland
9 PM9 F child 2 SMA IIIb 6 y walker del/del Poland 40 10 PM10 F child 1 SMA IIIb 6 y walker del/del Poland
11 PM11 M child 2 SMA IIIa 10 mo
wheelchair del/del Poland
413 13 PM12 M father unaffected - - - Poland 12 PM13 F mother unaffected - - - Poland 14 PM14 M child 1 SMA IIIa 18
mo wheelchair del/del Poland
15 PM15 M child 2 SMA IIIb 5 y walker del/del Poland 16 PM16 F child 3 unaffected - normal del/del Poland • Del: deletion of SMN1 gene, SM: Spanish mutation (430del4) • 1: DNA samples analyzed for ZNF265 gene • 2: DNA samples tested for HDAC6 and hnRNP-R SNPs association • 3: DNA samples analyzed for T-plastin haplotype blocks • 4: DNA samples used for in vivo footprinting analysis of T-plastin enhancer and methylation
analysis
• 5: DNA samples screened for mutations/polymorphism within T-plastin genomic region
ERKLÄRUNG
Ich verischere, dass ish die von mir vorgelegte Dissertation selbständig, die benutzten Quellen and
Hilfsmittel vollständig angegeben und die Stellen der Arbeit – einschließlich Tablellen, Karten und
Abbildungen-, die anderen Werken im Wortlaut oder dem Sinn nach entnommen sind, in jedem Einzelfall
als Entlehnung kenntlich gemacht habe; dass diese Dissertation noch keiner anderen Fakultät oder
Universität zur Prüfung vorgelegen hat; dass sie – abgesehen von unten angegebenen Teilpublikationen
– noch nicht veröffentlich worden ist sowie, dass ich eine solche Veröffentlichung vor Abschluss des
Promotionsverfahrens nicht vornehmen werde. Die Bestimmungen der Promotionsordung sind mir
bekannt. Die von mir vorgelegte Dissertation ist von Frau Professor Brunhilde Wirth betreut worden.
Nachfolgend gennante Teilpublikationen liegen vor:
Helmken C., Hofmann Y., Schoenen F., Oprea G., Raschke H., Rudnik-Schoneborn S., Zerres K., Wirth
B. (2003) „Evidence for a modifying pathway in SMA discordant families: reduced SMN level decreases
the amount of its interacting partners and Htra2-beta1“. Hum Gen.114:11-21
Köln, 15. März 2007 Gabriela-Elena Oprea

CURRICULUM VITAE
NAME Oprea geb. Bordeianu
VORNAME Gabriela-Elena
GEBURTSDATUM 7. Oktober 1977
GEBURTSORT Bukarest, Rumänien
NATIONALITÄT rumänisch
FAMILIENSTAND verheiratet
FACHAUSBILDUNG
2000-2002 Master in Genetik, Universität in Bukarest, Rumänien
Masterarbeit "Human Chronic Leukemias- Genetic Study"
2002 Abschluss: Magisterdiplom, Prädikat „sehr gut“ (10)
1996-2000 Studium in Biologie, Biologiefakultät, Universität Bukarest,
Rumänien
Spezialität: Zellbiologie und Genetik
Diplomarbeit: "Investigation of Human Genome in Chronic Leukemias"
2000 Abschluss: Diplom-Biologie, Prädikat „sehr gut“ (10)
BERUFSERFAHRUNG
1. Januar 2004 – März 2007, Wissenschaftliche Angestellte (BAT IIa/
halbe) und Doktorandin am Institut für Humangenetik, Universitätsklinikum
zu Köln (Prof. Dr. Brunhilde Wirth)
Anfertigung einer Dissertation mit dem tema: „Identification of T-plastin as
potential modifier gene in SMA discordant families“
1. September 2002 - 31. Dezember 2003, Wissenschaftliche Angestellte
(BAT IIa/ halbe) und Doktorandin am Institut für Humangenetik,
Universität Bonn (Prof. Dr. Brunhilde Wirth)
1. Mai 2001 - 30. August 2002 Wissenschaftliche Mitarbeiterin, Institut für
Genetik, Bukarest, Rumänien (Prof. Dr. Lucian Gavrila)
Molekularbiologische Arbeiten an „Cytogenetic and molecular studies of
human genome in chronic leukemias before and after radio- and
chemotherapy“ und „Molecular diagnosis of the rheumatoid artritis“.