t2ib03091hudaco ppt bk
TRANSCRIPT
PAGE 1
Interim resultsFor the six months ended 31 May 2011
Introduction
Results summary
Segment information
Financial statements
Outlook and conclusion
2
Agenda

PAGE 2
Trading conditions still tough – country is not able to take advantage of attractive commodity prices
Rand 6% stronger than last year – for an importing business this means lower prices
In management’s presentation you will hear how:
Cash has been deployed successfully into new businesses
But two existing businesses have disappointed in H1
Some uncertainties ahead
Nationalisation debate
Far reaching tax changes
3
General business environment
Results summary

PAGE 3
Turnover 26% to R 1 406m
Operating profit 24% to R 149m
Headline earnings 11% to R 119m
HEPS 11% to 377 cps
Dividends per share 13% to 130 cps
Cash balance to R101m
5
Results summary
Trading conditions remain difficultVolume sales flat overall but mixed Acquisitions add R48m to operating profitTwo existing businesses well down on last year – both expected to pick up in H2Prices down about 6% (our basket) on H1 2010Gross margins down 1% - new businessesExpenses to sales 1% better at 28%Operating profit to sales unchanged at 11%Return on equity - 18%
6
Operating background to the results

PAGE 4
Segment information
7
Largest segment imports and distributes branded engineering consumables generally used in the repair and maintenance of machines
About one third of our business is distribution of consumer related products generally sold to installers
Concept of “value added distribution” is core to our business model
8
Operating segments
PAGE 5
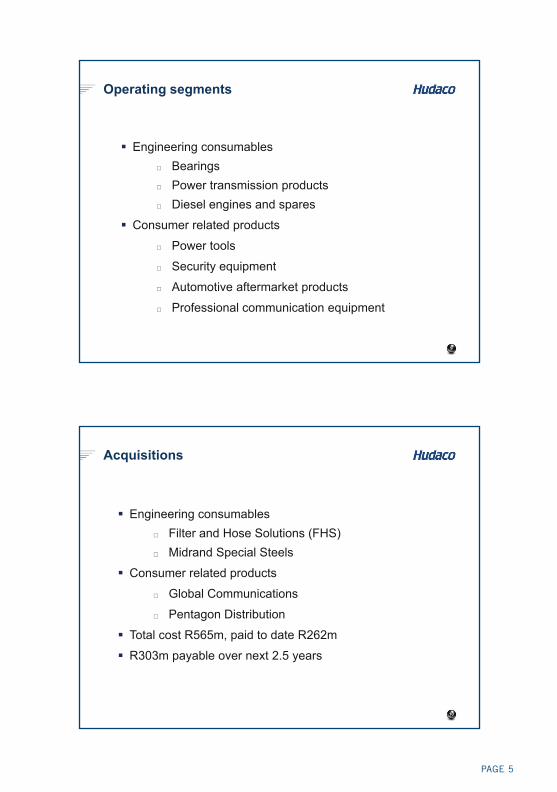
Engineering consumablesBearings Power transmission productsDiesel engines and spares
Consumer related products
Power tools
Security equipment
Automotive aftermarket products
Professional communication equipment
9
Operating segments
Engineering consumablesFilter and Hose Solutions (FHS)Midrand Special Steels
Consumer related products
Global Communications
Pentagon Distribution
Total cost R565m, paid to date R262m
R303m payable over next 2.5 years
10
Acquisitions

PAGE 6
Distribution of filters for earth-moving equipment and industrial hose
Brands: Donaldson, Malcorp
IFRS acquisition date –September 2010
2010 turnover - R229m
Expected price – R306m
Earn out period – 3 years
Stand alone business
11
Filter and Hose Solutions
Distributor of professional mobile radio communication equipment and radio systems integrator
Brands: Kenwood, JVC
IFRS acquisition date – February 2011
2010 turnover – R185m
Expected price – R176m
Earn out period – 2-3 years
Stand alone business
12
Global Communications

PAGE 7
Distribution of electronic security products, specialising in video IP
Brands: Bosch, Arecont, Dell
IFRS acquisition date –March 2011
2010 turnover – R57m
Expected price – R59m
Earn-out period – 3 years
“Bolt-on” to Elvey
13
Pentagon Distribution
Distribution of special round and hexagonal steel
IFRS acquisition date –December 2010
Expected price – R24m
Earn out period – 3 years
“Bolt-on” to Ambro
14
Midrand Special Steels

PAGE 8
Bearings InternationalDistributor of bearings and power transmission productsMoved to new central warehouse in Q2Resulted in unplanned lost sales and lower gross marginsImprovement evident in June month
BosworthDrive pulley manufacturerDelays in obtaining customer sign-offs led to low salesBack to normal in H2
15
Underperformers in H1
Engineering consumables
3
4
4
5
7
10
0
33
34
Consumer related products
1
1
7
8
18
21
33
4
7
(%)
72
67
Manufacturing
Mining
Security
Wholesale/retail
Automotive
Construction
Exports
Agriculture
Other
16
2010 segment sales by market sector

PAGE 9
Contribution to operating profit (before shared services and head office)
17
Segment contributions
Turnover Op Margin(%) Operating Profit
Rm2011 % ch 2010 2011 2010 2011 % ch 2010
Engineering consumables 977 24% 785 10.0% 10.3% 98 21% 81
Consumer related products 432 29% 335 15.0% 14.3% 65 35% 48
Head office, shared services & eliminations
-3 -4 -14 -9
Total Group 1 406 26% 1 116 10.6% 10.7% 149 24% 120
18
Segment results

PAGE 10
Rm 2011 % Ch 2010
Turnover 1 406 26 1 116- Existing businesses 1 166 4 1 116- New businesses 240Gross profit 549 23 447Operating expenses (400) 22 (327)Operating profit 149 24 120- Existing businesses 101 -16 120- New businesses 48
19
Margin (%)Turnover 100.0 100.0 Gross profit 39.0 40.0 Operating expenses 28.4 29.3 Operating profit 10.6 10.7
Profit for H1
Financial statements: Income, financial position and cash flow
20

PAGE 11
Rm 2011 % Ch 2010Operating profit 149 24% 120Net interest on working capital 3 9Interest paid to vendors (imputed) (7)Interest paid on sub. debentures (116) (115)Preference dividend received 100 99Profit before taxation 129 14% 113Taxation (Rate ’11:7% ’10:6%) (9) (7)Profit after taxation 120 13% 106Non-controlling interest (1) 1Attributable and headline earnings 119 11% 107
21
Profit for H1
2011 % Ch 2010
Earnings per share
Basic EPS 377c 11% 341cHeadline earnings per share 377c 11% 341c
Dividends per shareInterim 130c 13% 115cFinal 235c
Total 350c
22
Dividend policy: annual dividends = approximately 40% of heps
Earnings per share and dividends

PAGE 12
Rm May 11 Oper Div Acq Nov 10Working capital 786 84 36 666Property plant equipment 173 32 10 131Goodwill and intangibles 570 (6) 211 365Tax 17 11 (11) 17Net operating assets 1 546 121 246 1 179Cash 101 (74) (87) 262Investment in pref shares 2 181 2 181Net assets 3 828 121 (74) 159 3 622
Equity 1 354 121 (74) (7) 1 314Subordinated debenture 2 181 2 181Due to vendors 293 166 127Total capital employed 3 828 121 (74) 159 3 622
23
Statement of financial position
0.00.51.01.52.02.53.03.54.04.5
H1 07 H2 07 H1 08 H2 08 H1 09 H2 09 H1 10 H2 10 H1 11
In m
onth
s o
f sa
les
One month of sales: H1 2011 = R 241m; H1 2010 = R 186m (assumes all acquisitions in for full 6 months)
Working capital traditionally peaks end of H1 to cope with anticipated increased seasonal demand in H2 - sales are generally split 45:55 between H1 and H2 (2010 45:55)Target working at capital at end H2 - range of 2.4 to 2.7 months of sales 24
Working capital – back to normal levels

PAGE 13
Rm May 11 May 10Cash from trading 171 134(Increase) decrease in working capital (79) 2Cash from operating activities 92 136Net finance costs (13) (7)Tax paid (20) (24)Cash flow from operations 59 105Dividends paid (90) (79)Invested in new businesses and property, plant and equipment
(132) (6)
Shares issued 2 8Net movement (161) 28Opening cash 262 335Closing cash 101 363
25Cash flow – for the six months
25
Before parliament for commentPreference dividends taxable if:
Redeemable within 10 years – Hudaco’s a little longeror
Third party backed – yes: through puts and callsMarket expects unintended consequences will force SARS to modifyHudaco has right to call for gross-up
Various possible outcomesCould trigger unwindNo penalty payable
26
Taxation Laws Amendment Bill

PAGE 14
Outlook & conclusion
Hudaco sales are predominantly driven by GDP activityGDFI adds cream (and adds capacity for future GDP activity)Rand exchange rate has a big impact on pricingHudaco has immediate balance sheet investment capacity of about R400m
28
Reminders

PAGE 15
Engineering consumablesSigns that mining investment in neighbouring countries is picking up in response to higher commodity pricesBut shortage of electricity and rail capacity in South Africa constrains expansionManufacturing activity follows mining activity, particularly in the space in which Hudaco playsConstruction activity to remain muted in 2011 but power station building and public works programme point to a better 2012
29
Key markets - outlook
Consumer related productsIndustrial power tool market remains strong – Makita gaining market shareAutomotive parts aftermarket expected to grow following increases in new and used car sales Security equipment market to remain under pressure waiting a pick up in employment levels and spending on new (and upgrades to) houses & light industrial buildings
30
Key markets - outlook
PAGE 16
Weak economic recovery to continue
Will only gain momentum across a broad front once employment picks up and the mines are able expand
Underperforming businesses confident of recovery in H2
Internal funding still available for acquisitions
We are confident about EPS growth in FY 2011
31
Business outlook in short term
Clifford AmoilsGroup Financial Director+27 (11) 657 [email protected]
Stephen ConnellyGroup Chief Executive+27 (11) 657 [email protected]
www.hudaco.co.za
32
Contact details

PAGE 17
The preceding presentation contains forward looking statements about the Hudaco Group’s operations and financial condition. They are prepared in good faith and are based on Hudaco’s best estimates and information at the time of preparing the presentation. They are nonetheless subject to significant uncertainties and contingencies many of which are understandably beyond Hudaco’s control. Unanticipated events will occur and actual future events may differ materially from current expectations for many reasons including new business opportunities, changes in priorities by Hudaco as well as many other internal and external factors. Any of these factors may materially affect Hudaco's future business activities and financial results. None of the forward looking statements has been reported on by Hudaco’s auditors.
Disclaimer
33
Notes