t3. annual program report (apr) - ju.edu.sa
TRANSCRIPT

يمیداكلأا دامتعلااو میوقتلل ينطولا زكرملا
National Center for Academic Accreditation and Evaluation
ATTACHMENT 4.
T3. ANNUAL PROGRAM REPORT (APR)
Program Eligibility: The program is to submit the two most recent APRs as part of the requirements for program eligibility using the NCAAA Template. Post Accreditation: The program is required to annually complete an APR. The APR is to document a complete academic year. APR’s are prepared by the program coordinator in consultation with faculty teaching in the program. The reports are submitted to the head of department or college and used as the basis for any modifications or changes in the program. The APR information is used to provide a record of improvements in the program and is used in the Self Study Report for Programs (SSRP) and by external reviews for accreditation.

Annual Program Report, Ramadan 1438H, June 2017. Page2
Annual Program Report
1. Institution: Jouf University Date: 17-05-2018 2. College/ Department: Engineering / Electrical 3. Dean: Dr Mohammednoor Naher Almaghrabi 4. List All Campus Branch/Locations (approved by Ministry of Higher Education or Higher Council of Education).
Campus Branch/Location Approval By Date Main Campus: College of Engineering, Sakaka
Ministry of Higher Education
1: 2: 3: 4:
A. Program Identification and General Information Program title: Electrical Engineering Code: EE Name and position of person completing the APR: Dr Tarek Kandil Chairman of Electrical Engineering Department Academic year to which this report applies. 2017-2018 / 1438-39
B Statistical Information
1. Number of students who started the program in the year concerned: 2. (a) Number of students who completed the program in the year concerned: Completed the final year of the program: Completed major tracks within the program (if applicable) Title………………………………………………………No Title………………………………………………………No Title………………………………………………………No Title…………………………………………………… .No 2. (b) Completed an intermediate award specified as an early exit point (if any) 3. Apparent completion rate.
63
NA
38
NA
NA
NA
NA

Annual Program Report, Ramadan 1438H, June 2017. Page3
(a) Percentage of students who completed the program, (Number shown in 2 (a) as a percentage of the number that started the program in that student intake.) (b) Percentage of students who completed an intermediate award (if any) (e.g. Associate degree within a bachelor degree program) (Number shown in 2 (b) as a percentage of the number that started the program leading to that award in that student intake). Comment on any special or unusual factors that might have affected the apparent completion rates (e.g. Transfers between intermediate and full program, transfers to or from other programs). 4. Enrollment Management and Cohort Analysis (Table 1) Cohort Analysis refers to tracking a specific group of students who begin a given year in a program and following them until they graduate (How many students actually start a program and stay in the program until completion). A cohort here refers to the total number of students enrolled in the program at the beginning of each academic year, immediately after the preparatory year. No new students may be added or transfer into a given cohort. Any students that withdraw from a cohort may not return or be added again to the cohort. Cohort Analysis (Illustration): Table 1 provides complete tracking information for the most recent cohort to complete the program, beginning with their first year and tracking them until graduation (students that withdraw are subtracted and no new students are added). The report is to cover the past four years. Update the years as needed.
Enrollment Management and Cohort Analysis Table 1.
Years
Student Categories *PYP
4 Years Ago
3 Years Ago
2 Years Ago
1 Year Ago
Current Year
1. Total cohort enrollment *PYP 95 80 80 80 76 2. Retained till year end 80 80 80 76 75 3. Withdrawn 15 - - 4 1 4. Cohort graduated successfully - - - - 38 5.Total graduated successfully 54 59 70 54 63 Provide a summary cohort analysis for each of the above cohorts by listing strengths and recommendations for improvement. * PYP - Preparatory Year
7. Destination of graduates as shown in survey of graduating students (Include this information in years in which a survey of employment outcomes for graduating students is conducted).
40%
NA

Annual Program Report, Ramadan 1438H, June 2017. Page4
Date of Survey Number Surveyed Number Responded Response Rate %
Destination Not Available for
Employment Available for Employment
Further Study Other Reasons Employed in
Subject Field Other
Employment Unemployed
Number NA
Percent of Respondents
Analysis: List the strengths and recommendations.
C. Program Context
1. Significant changes within the institution affecting the program (if any) during the past year. • In accordance with Jouf University plans for accreditations, the Electrical Engineering Department
has initiated its own plan for acquiring the accreditation. • Participation of all program’s staff in quality process. Implications for the program • The quality committee in the electrical engineering program started a series of actions in order to
meet the national and international requirements. To name some: Ø Updating all courses’ files with the latest NCAAA forms. Ø Workshops on assessment methods specially on improving the quality of major exams
and associating the learning outcomes. Ø Course Evaluation by another instructor.
• Starting from the first semester, all students were asked to use Web-Based Questionnaire for evaluating each course that was offered.
• Five workshops were conducted to all electrical engineering department staff for revising the Course Learning Outcomes (CLOs) for all the courses, identifying rubrics, course evaluation, KPI selection and finally course report writing.
2. Significant changes external to the institution affecting the program (if any) during the past year.
None
D. Course Reports Information Summary
NA NA NA

Annual Program Report, Ramadan 1438H, June 2017. Page5
95
80 80 80 7680 80 80 76 75
4 Years Ago 3 Years Ago 2 Years Ago 1 Year Ago CurrentYear
Completion Rate Analysis
Total cohort enrollment Retained till year end
1. Course Reports Results. Describe and analyze how the individual NCAAA course reports are utilized to assess the program and to ensure ongoing quality assurance (eg. Analysis of course completion rates, grade distributions, and trend studies.) (a.) Describe how the individual course reports are used to evaluate the program. The Undergraduate Program Committee (UPC) provided the program with full report about the course reports contents that contained recommendations and action plans written by instructors. The UPC analyzed the feedback from course reports and determined the responsible committees and administrative person to achieve those recommendations. � The electrical engineering department has established the Assessment and Evaluation Committee (AEC). The main task of this committee is to provide feedback based on collected and analyzed data to improve the effectiveness of the EE program. At the end of each semester, the AEC collects a course scores summary that includes the following: �
• Number of registered, banned and withdrawn students. • Percentage of passed and failed students.� • Average, maximum and minimum mark. �
The committee also performs analysis of exam results by measuring the difficulty level, discrimination and quality of test for each course. Difficulty level is a measure of a proportion of examinees who answered the question correctly. � The Strategic planning and Steering committee is established to analyze all reports received from different committees to check the recommendations and to analyze report to put the action plan and responsibilities. � (b.) Analyze the completion rates, grade distributions, and trends to determine strengths and recommendations for improvement.
i. Completion rate analysis:

Annual Program Report, Ramadan 1438H, June 2017. Page6
ii. Grade distribution analysis:
Average Marks:
Average Marks
Range No.of Courses No.of Courses
Spring 2018 Fall 2017 0 - 4.99 0 0 5 - 9.99 0 0
10 - 14.99 0 0
15 - 19.99 0 0
20 - 24.99 0 0
25 - 29.99 0 0
30 - 34.99 0 0
35 - 39.99 0 0
40 - 44.99 1 0
45 - 49.99 0 3
50 - 54.99 1 1
55 - 59.99 6 8
60 - 64.99 9 8
65 - 69.99 7 4
70 - 74.99 5 8
75 - 79.99 2 3
80 - 84.99 0 1
85 - 89.99 0 0
90-94.99 0 1
95-100 0 0

Annual Program Report, Ramadan 1438H, June 2017. Page7
1 1
6
9
7
5
2
3
1
8 8
4
8
3
1 1
40 - 44.99
45 - 49.99
50 - 54.99
55 - 59.99
60 - 64.99
65 - 69.99
70 - 74.99
75 - 79.99
80 - 84.99
85 - 89.99
90-94.9995-100
Average MarksFall 2017 vs Spring 2018
Spring 2018 Fall 2017
Annual Program Report, Ramadan 1438H, June 2017. Page8
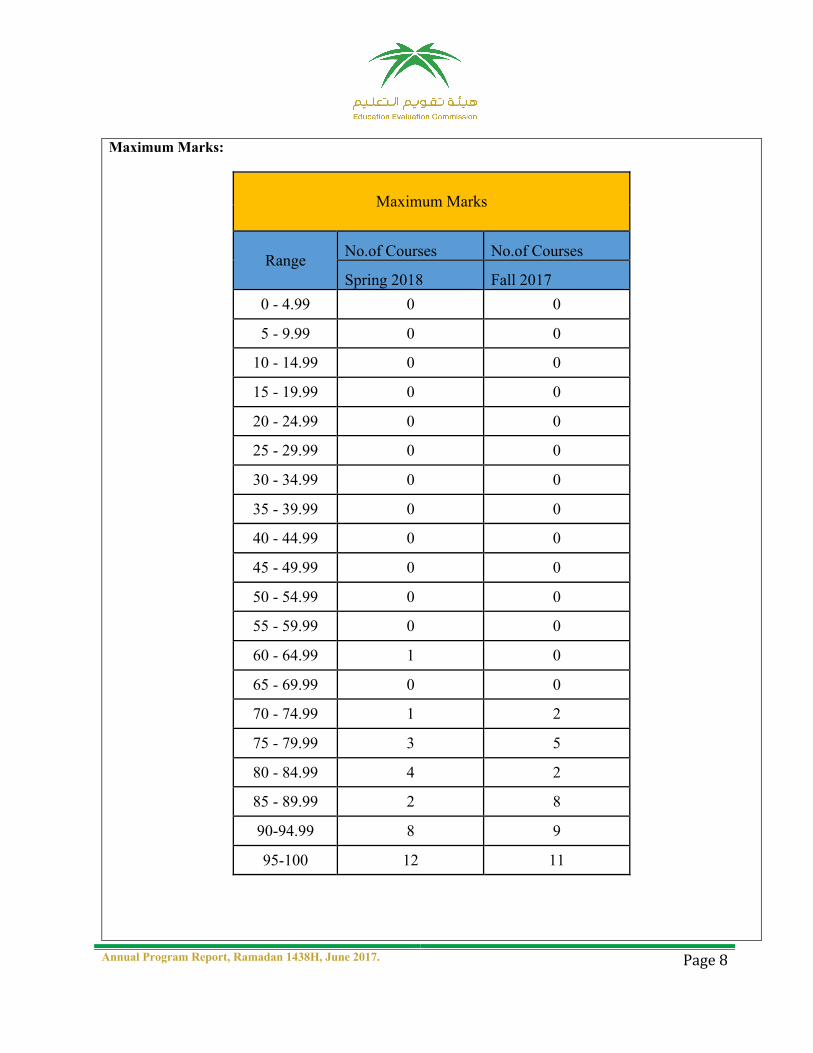
Maximum Marks:
Maximum Marks
Range No.of Courses No.of Courses
Spring 2018 Fall 2017 0 - 4.99 0 0
5 - 9.99 0 0
10 - 14.99 0 0
15 - 19.99 0 0
20 - 24.99 0 0
25 - 29.99 0 0
30 - 34.99 0 0
35 - 39.99 0 0
40 - 44.99 0 0
45 - 49.99 0 0
50 - 54.99 0 0
55 - 59.99 0 0
60 - 64.99 1 0
65 - 69.99 0 0
70 - 74.99 1 2
75 - 79.99 3 5
80 - 84.99 4 2
85 - 89.99 2 8
90-94.99 8 9
95-100 12 11

Annual Program Report, Ramadan 1438H, June 2017. Page9
1 1
3
4
2
8
12
0 0
2
5
2
8
9
11
60 - 64.99
65 - 69.99
70 - 74.99
75 - 79.99
80 - 84.99
85 - 89.99
90-94.9995-100
Maximum MarksFall 2017 vs Spring 2018
Spring 2018 Fall 2017

Annual Program Report, Ramadan 1438H, June 2017. Page10
Failing Rate:
Failing Rate
Range No.of Courses No.of Courses
Spring 2018 Fall 2017 0 - 4.99 8 6
5 - 9.99 2 3
10 - 14.99 5 7
15 - 19.99 2 2
20 - 24.99 4 4
25 - 29.99 6 3
30 - 34.99 4 7
35 - 39.99 0 2
40 - 44.99 1 3
45 - 49.99 0 0
50 - 54.99 0 0
55 - 59.99 0 0
60 - 64.99 0 0
65 - 69.99 0 0
70 - 74.99 0 0
75 - 79.99 0 0
80 - 84.99 0 0
85 - 89.99 0 0
90-94.99 0 0
95-100 0 0

Annual Program Report, Ramadan 1438H, June 2017. Page11
8
2
5
2
4
6
4
1
6
3
7
2
4
3
7
2
3
0 - 4.99
5 - 9.99
10 - 14.99
15 - 19.99
20 - 24.99
25 - 29.99
30 - 34.99
35 - 39.99
40 - 44.99
Failing RateFall 2017 vs Spring 2018
Spring 2018 Fall 2017

Annual Program Report, Ramadan 1438H, June 2017. Page12
iii. Trend analysis (a study of the differences, changes, or developments over time; normally
several years): The Exam Results Analysis Template was used to analyze the data. The analysis results for the average marks, the maximum marks and the failing rate were compared to those of Fall 2017. The results are given in appendix 1. 1. The Average Marks The distribution of the average marks is more clustered around 70% in Spring 2018 which is considered a good improvement in comparison to the Fall 2017. The number of courses with average marks more than 70% is dropped to 7 where it was 13 in Fall 2017. However, there are 8 courses below 60% that needs further discussion and improvements.
2. Maximum marks in courses Generally, most of the courses have maximum marks above 90%. However, there are 9 courses with maximum marks between the range of (75% - 89%) that needs further discussion and improvements. This is considered a drawback as compare to Fall 2017.
3. Passing Rates Number of courses with the passing rate above 95% increase in Spring 2018 as compare to the Fall 2017. However, the number of courses with the passing rate above 85% dropped as compared to the Fall 201
Annual Program Report, Ramadan 1438H, June 2017. Page13
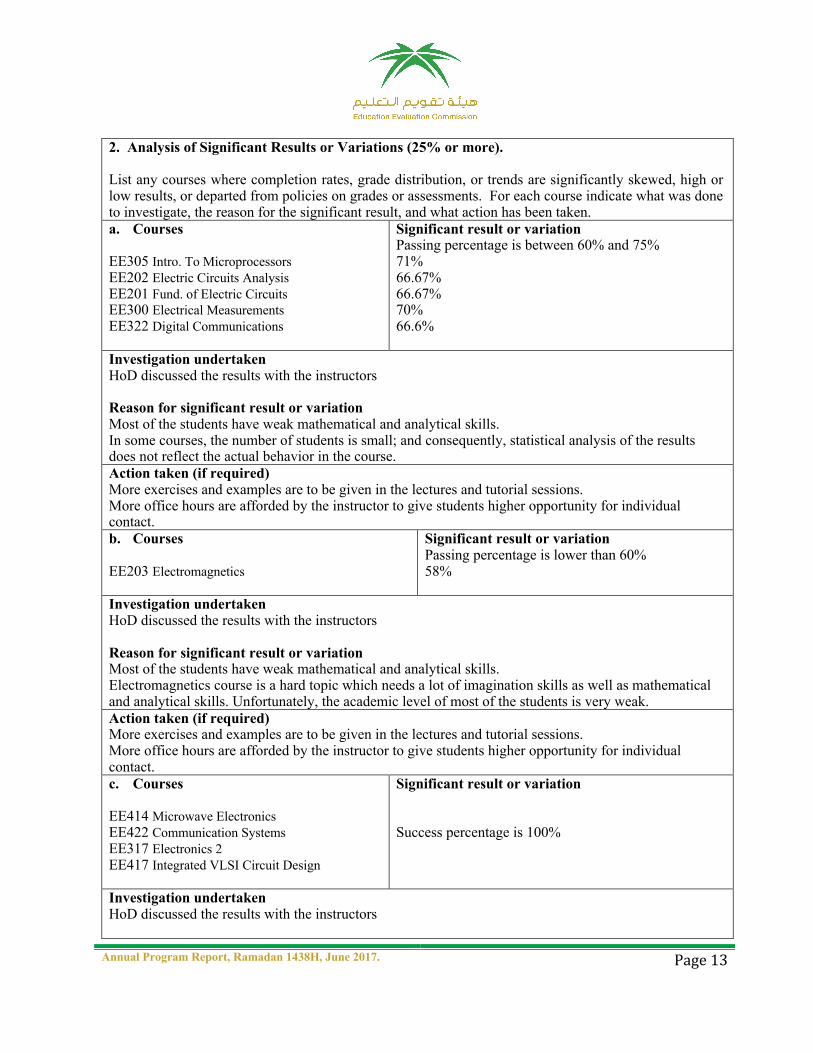
2. Analysis of Significant Results or Variations (25% or more). List any courses where completion rates, grade distribution, or trends are significantly skewed, high or low results, or departed from policies on grades or assessments. For each course indicate what was done to investigate, the reason for the significant result, and what action has been taken. a. Courses EE305 Intro. To Microprocessors EE202 Electric Circuits Analysis EE201 Fund. of Electric Circuits EE300 Electrical Measurements EE322 Digital Communications
Significant result or variation Passing percentage is between 60% and 75% 71% 66.67% 66.67% 70% 66.6%
Investigation undertaken HoD discussed the results with the instructors Reason for significant result or variation Most of the students have weak mathematical and analytical skills. In some courses, the number of students is small; and consequently, statistical analysis of the results does not reflect the actual behavior in the course. Action taken (if required) More exercises and examples are to be given in the lectures and tutorial sessions. More office hours are afforded by the instructor to give students higher opportunity for individual contact. b. Courses
EE203 Electromagnetics
Significant result or variation Passing percentage is lower than 60% 58%
Investigation undertaken HoD discussed the results with the instructors Reason for significant result or variation Most of the students have weak mathematical and analytical skills. Electromagnetics course is a hard topic which needs a lot of imagination skills as well as mathematical and analytical skills. Unfortunately, the academic level of most of the students is very weak. Action taken (if required) More exercises and examples are to be given in the lectures and tutorial sessions. More office hours are afforded by the instructor to give students higher opportunity for individual contact. c. Courses EE414 Microwave Electronics EE422 Communication Systems EE317 Electronics 2 EE417 Integrated VLSI Circuit Design
Significant result or variation Success percentage is 100%
Investigation undertaken HoD discussed the results with the instructors
Annual Program Report, Ramadan 1438H, June 2017. Page14
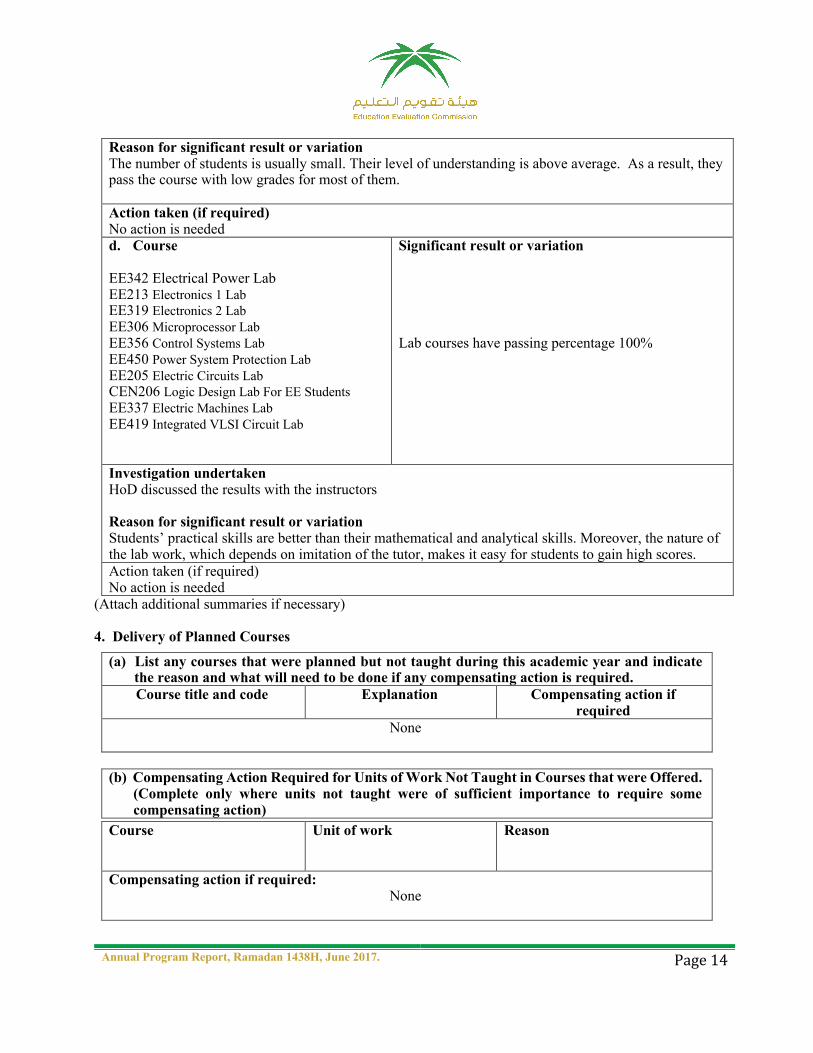
Reason for significant result or variation The number of students is usually small. Their level of understanding is above average. As a result, they pass the course with low grades for most of them. Action taken (if required) No action is needed d. Course EE342 Electrical Power Lab EE213 Electronics 1 Lab EE319 Electronics 2 Lab EE306 Microprocessor Lab EE356 Control Systems Lab EE450 Power System Protection Lab EE205 Electric Circuits Lab CEN206 Logic Design Lab For EE Students EE337 Electric Machines Lab EE419 Integrated VLSI Circuit Lab
Significant result or variation Lab courses have passing percentage 100%
Investigation undertaken HoD discussed the results with the instructors Reason for significant result or variation Students’ practical skills are better than their mathematical and analytical skills. Moreover, the nature of the lab work, which depends on imitation of the tutor, makes it easy for students to gain high scores. Action taken (if required) No action is needed
(Attach additional summaries if necessary) 4. Delivery of Planned Courses
(a) List any courses that were planned but not taught during this academic year and indicate the reason and what will need to be done if any compensating action is required. Course title and code Explanation Compensating action if
required None
(b) Compensating Action Required for Units of Work Not Taught in Courses that were Offered. (Complete only where units not taught were of sufficient importance to require some compensating action)
Course
Unit of work Reason
Compensating action if required: None
Annual Program Report, Ramadan 1438H, June 2017. Page15
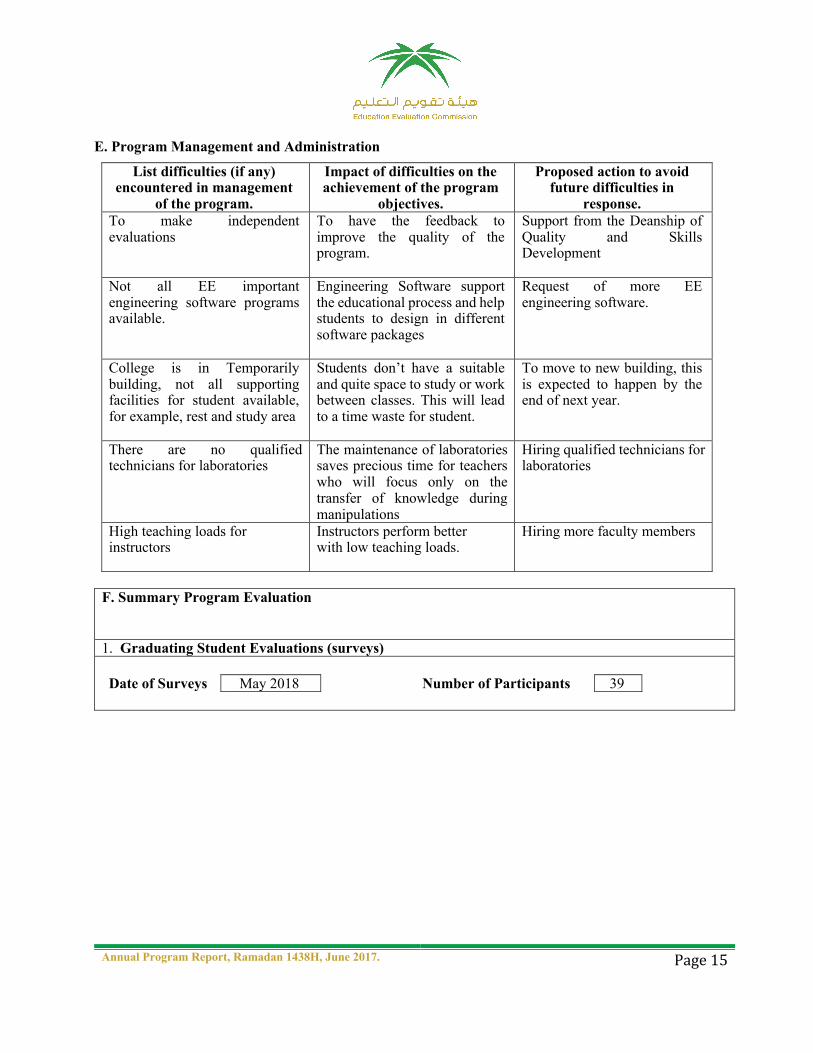
E. Program Management and Administration
List difficulties (if any) encountered in management
of the program.
Impact of difficulties on the achievement of the program
objectives.
Proposed action to avoid future difficulties in
response. To make independent evaluations
To have the feedback to improve the quality of the program.
Support from the Deanship of Quality and Skills Development
Not all EE important engineering software programs available.
Engineering Software support the educational process and help students to design in different software packages
Request of more EE engineering software.
College is in Temporarily building, not all supporting facilities for student available, for example, rest and study area
Students don’t have a suitable and quite space to study or work between classes. This will lead to a time waste for student.
To move to new building, this is expected to happen by the end of next year.
There are no qualified technicians for laboratories
The maintenance of laboratories saves precious time for teachers who will focus only on the transfer of knowledge during manipulations
Hiring qualified technicians for laboratories
High teaching loads for instructors
Instructors perform better with low teaching loads.
Hiring more faculty members
F. Summary Program Evaluation
1. Graduating Student Evaluations (surveys) Date of Surveys May 2018 Number of Participants 39

Annual Program Report, Ramadan 1438H, June 2017. Page16
For the purpose of continuous improvements of department plans, the department graduates were asked to fill the exit survey. This report details the responses from electrical engineering exit surveys that were completed by the department graduates. Students answered questions related to their educational experience. A total of 10 questions were asked. (Appendix 2) Ten questions were answered by the graduates as summarized below. The statistical analysis also is reported with required diagrams.
1 The program enhanced my skills in applying fundamental concepts of electrical engineering, using appropriate learning strategies
7
18
14
Outstanding above average Avergae Below Average Poor

Annual Program Report, Ramadan 1438H, June 2017. Page17
2 Recall and present information, including knowledge of specific facts, knowledge of concepts, principles and theories, and knowledge of procedures
3 The program Enhance my skills in Identifying, formulate, and solve complex engineering problems
by applying principles of engineering, science, and mathematics.
1112
10
4
2
Outstanding above average Avergae Below Average Poor
8
1314
31
Outstanding above average Avergae Below Average Poor

Annual Program Report, Ramadan 1438H, June 2017. Page18
4 The program Enhance my skills in applying engineering design to produce solutions that meet specified needs with consideration of public health, safety, and welfare, as well as global, cultural, social, environmental, and economic factors.
5 The program Enhance my skills in developing and conduct appropriate experimentation, analyze and interpret data, and use engineering judgment to draw conclusions.
3
20
11
3 2
Outstanding above average Avergae Below Average Poor
4
17
11
5
2
Outstanding above average Avergae Below Average Poor
Annual Program Report, Ramadan 1438H, June 2017. Page19
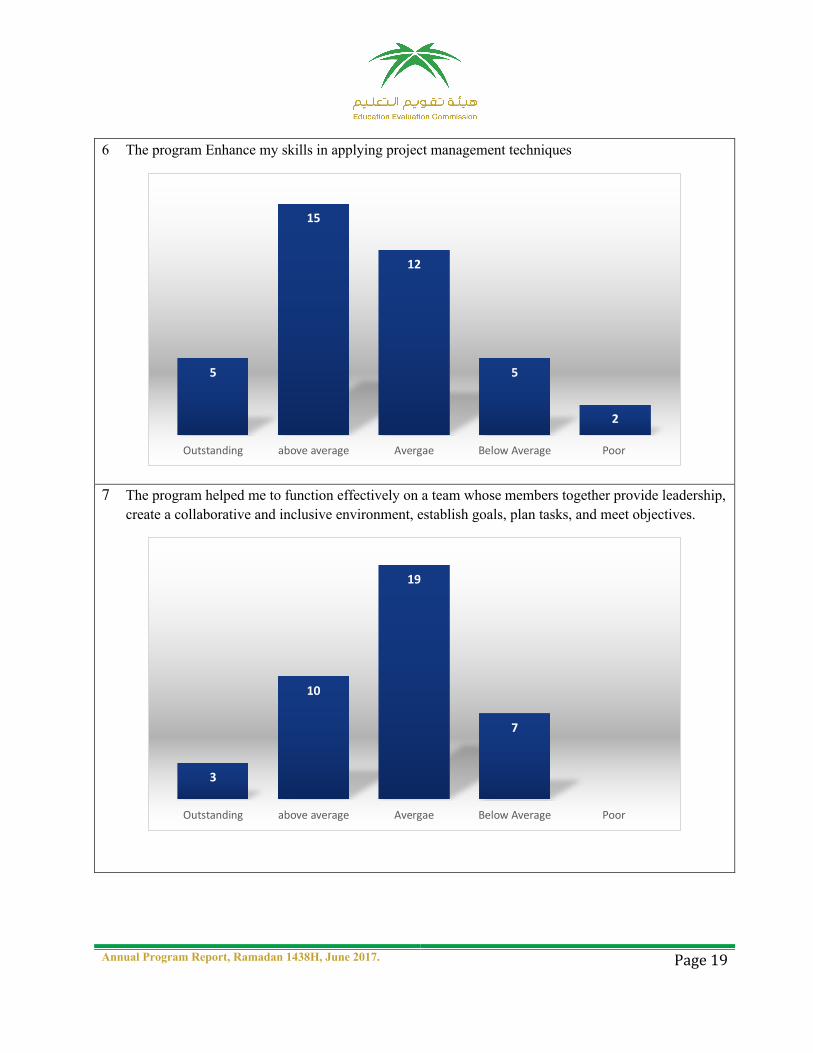
6 The program Enhance my skills in applying project management techniques
7 The program helped me to function effectively on a team whose members together provide leadership, create a collaborative and inclusive environment, establish goals, plan tasks, and meet objectives.
5
15
12
5
2
Outstanding above average Avergae Below Average Poor
3
10
19
7
Outstanding above average Avergae Below Average Poor
Annual Program Report, Ramadan 1438H, June 2017. Page20
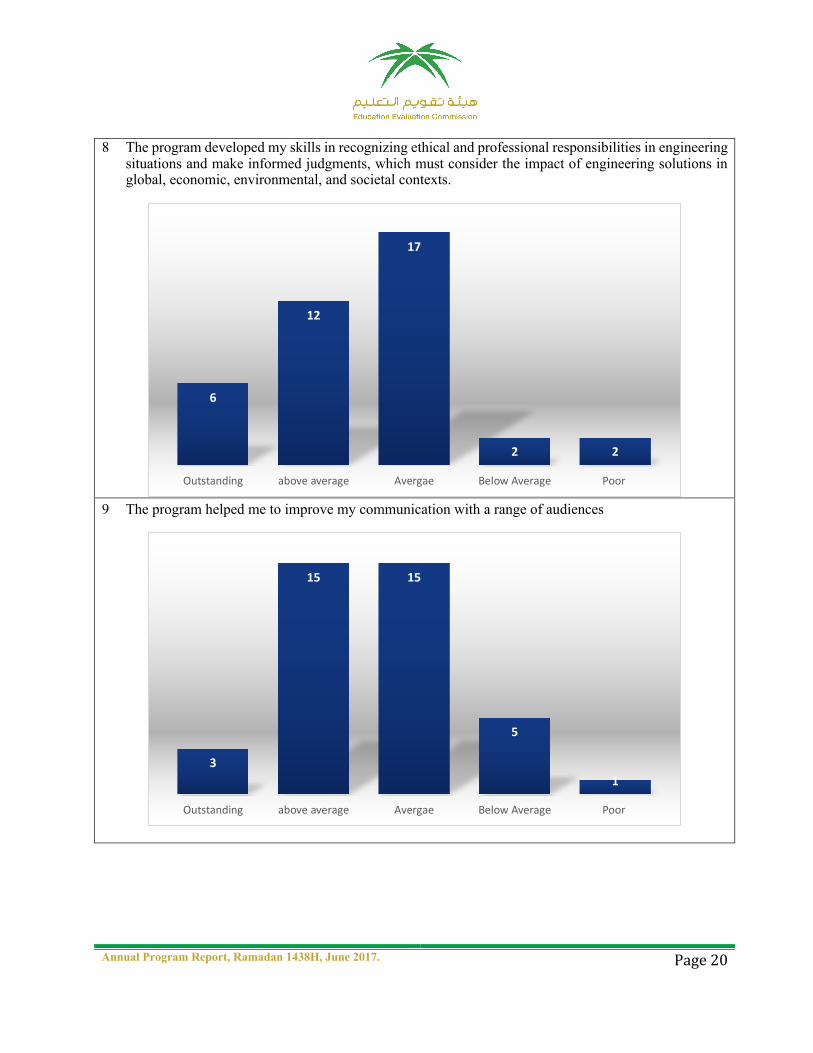
8 The program developed my skills in recognizing ethical and professional responsibilities in engineering situations and make informed judgments, which must consider the impact of engineering solutions in global, economic, environmental, and societal contexts.
9 The program helped me to improve my communication with a range of audiences
6
12
17
2 2
Outstanding above average Avergae Below Average Poor
3
15 15
5
1
Outstanding above average Avergae Below Average Poor

Annual Program Report, Ramadan 1438H, June 2017. Page21
10 The program Enhance my skills in applying knowledge of mathematics, science, engineering and to use the techniques, skills, and modern engineering tools necessary for engineering practice.
Attach survey reports. a. List most important recommendations
for improvement, strengths and suggestions
NONE
Analysis (e.g. Assessment, action already taken, other considerations, strengths and recommendation for improvement.)
NONE
b. Changes proposed in the program (if any) in response to this analysis and feedback.
NONE
2
15 15
6
1
Outstanding above average Avergae Below Average Poor

Annual Program Report, Ramadan 1438H, June 2017. Page22
2. Other Evaluation (e.g. Evaluations by employers or other stakeholders, external review) Describe evaluation process. Attach review/survey report. Appendix 3 a. List most important recommendations for improvement, strengths and suggestions for improvement. Suggestion for Improvement: • The administrative load is dominating
the research activities • Lack of Lab Equipment’s • Number of committees are more than
teaching load • Students are weak in English Strengths: • Qualified PhD Faculty • Research Publications • Good Working Environment • Research Grants
(e.g. Analysis of recommendations for improvement: Are recommendations valid and what action will be taken, action already taken, or other considerations?) • Lab equipment’s order has already been placed. • PY conducted extra classes to improve the English
and more number of English subjects have been added to the new study plan.
• We are in a process of applying for the accreditation, due to that administrative load is increased.
b. Changes proposed in the program (if any) in response to this feedback.
NONE 3. Ratings on Sub-Standards of Standard 4 by program faculty and teaching staff; 4.1 to 4.10.
Standard 4 Sub-Standards. Are the “Best Practices” followed; Yes or No? Provide a revised rating for each sub-standard. Indicate action proposed to improve performance (if any).
Standard 4 Sub-
Standards Be
st P
ract
ices
Fo
llow
ed (Y
/N)
5 St
ar R
atin
g
List priorities for improvement.
4.1 Y ***
Although learning outcomes are consistent with the National Qualifications Framework, an external review for the learning outcomes would be helpful. Graduating student surveys, employment outcome data, employer feedback and subsequent performance of graduates should be used.
4.2 Y *** Planning should include any action necessary to ensure that teaching staff are familiar with and are able to use the strategies included in

Annual Program Report, Ramadan 1438H, June 2017. Page23
the program and course specifications. The academic and/or professional fields for which students are being prepared should be monitored on a continuing basis with necessary adjustments made in programs and in course content and reference materials to ensure continuing relevance and quality
4.3 Y ***
Systems should be established for central recording and analysis of course completion and program progression and completion rates and student course and program evaluations, with summaries and comparative data distributed automatically to departments, colleges, senior administrators and relevant committees at least once each year. Quality indicators for the program are only compared with other programs in the institution and should be compared to other external benchmarks.
4.4 Y ***
Policies and procedures should include action to be taken to deal with situations where standards of student achievement are inadequate or inconsistently assessed. Effective procedures should be used to ensure that work submitted by students is actually done by the students concerned.
4.5 Y ***
Teaching resources should be sufficient to ensure achievement of the intended learning outcomes. The effectiveness of student academic counselling and advice processes should be evaluated through means such as analysis of response times and student evaluations. Particular attention should be given to preparation for the language of instruction, self-directed learning. Action should be taken to ensure that language skills are adequate for instruction in that language when students begin their studies. Feedback on performance by students and results of assessments should be given promptly to students and accompanied by mechanisms for providing assistance
4.6 Y ***
Effective orientation and training programs should be provided within the institution for new, short term and part time teaching staff. Textbooks and reference material should be up to date and incorporate the latest developments in the field of study. Textbooks and other required materials should be available in sufficient quantities before classes commence. Attendance requirements in courses should be made clear to students and compliance with these requirements monitored and enforced.
4.7 Y *** Teaching staff should be encouraged to develop strategies for improvement of their own teaching and maintain a portfolio of evidence of evaluations and strategies for improvement.
4.8 Y ***
All teaching staff should be involved on a continuing basis in scholarly activities that ensure they remain up to date with the latest developments in their field and can involve their students in learning that incorporates those developments.
4.9 Y
*** Intended learning outcomes from the field experience should be clearly specified and effective processes followed to ensure that those learning outcomes, and strategies to develop that learning, are understood by students and supervising staff in the field setting. Supervising staff in field locations should be thoroughly briefed on

Annual Program Report, Ramadan 1438H, June 2017. Page24
G. Program Course Evaluation
1. List all program courses taught during the year. Indicate for each course whether student evaluations were undertaken and/or other evaluations made of quality of teaching. For each course indicate if action is planned to improve teaching.
Course Title/Course Code
Student Evaluations
Other Evaluation
(specify)
Action Planned
Yes No Yes No Fundamentals of Electric Circuits / EE 201
ü
NONE
Logic Design for EE students / CEN 205
ü
Logic Design Lab/ CEN 206 ü Electronics (1)/ EE 212 ü Electronics (1) Lab / EE 213 ü Electric Circuit Analysis / EE 202
ü
Electrical Measurements / EE 300
ü
Electromagnetics (I) / EE 203 ü Electric Circuits Laboratory/ EE 205
ü
Logic Design for EE students/ CEN 205
ü
Logic Design Lab for EE students/ CEN 212
ü
Probabilistic Methods in Electrical Engineering/ EE302
ü
Introduction to Microprocessors/ EE 305
ü
Electronics (I)/ EE 312 ü Electronics (I) Lab/ EE 313 ü
their role and the relationship of the field experience to the program as a whole. Teaching staff from the program should visit the field setting for observations and consultations with students and field supervisors often enough to provide proper oversight and support. Students should be thoroughly prepared for participation in the field experience through briefings and descriptive material. Arrangements should be made through follow up meetings or classes for students to reflect on and generalize from their experience, relate it to studies previously undertaken, applying that experience to situations likely to be faced in later employment. Preparations for the field experience should include a thorough risk assessment for all parties involved, and plans should be made to minimize and deal with those risks.
4.10 N NA NONE Analysis of Sub-standards. List the strengths and recommendations for improvement of the program’s self-evaluation of following best practices.

Annual Program Report, Ramadan 1438H, June 2017. Page25
Fundamental of Power System/ EE 340
ü
Electric Machines (I) / EE 335 ü Principles of Control Systems / EE 355
ü
Electric Machines (II) / EE 336 ü Electric Machines Lab/ EE 337 ü Power Systems Analysis / EE 341
ü
Power Systems Analysis Lab / EE 342
ü
Power Electronics / EE 432 ü High Voltage Engineering / EE 446
ü
Industrial Power System Design /EE 445
ü
Utilization of Electric Energy / EE 442
ü
Power System Operation and Control/ EE 443
ü
Power System Planning / EE 444
ü
Power System Protection / EE 449
ü
Power System Protection Lab / EE 450
ü
Project / EE 499 ü Signals and Systems Analysis / EE 301
ü
Applied Math for Engineers/ MATH 302
ü
Microprocessor Lab/ EE 306 ü Electronics 2/ EE 317 ü Electronics 2 Lab/ EE 319 ü Principles of Communications/ EE 320
ü
Wave Propagation and Antennas/ EE 328
ü
Electric Machines I/ EE 335 ü Principles of Control Systems/ EE 355
ü
Control Systems Lab/ EE 356 ü Fiber Optics Communications/ EE 424
ü
Digital Communications/ EE 322
ü
Communications Lab/ EE 326 ü

Annual Program Report, Ramadan 1438H, June 2017. Page26
Principles of network Engineering/ CEN 306
ü
Microwave Electronics/ EE 414 ü Integrated VLSI Circuit Design/ EE 417
ü
Integrated VLSI Circuit Lab/ EE 419
ü
Communication Systems/EE 422
ü
Wireless communications/ EE 426
ü
Selected Topics in Communications/ EE 429
ü
(Add items or attach list if necessary)
1. List courses taught by this program this year and for this program that are in other programs.
Level Course Code Course Title Number of
Sections Credit Hours
College or Department
Level 1
ENG 101 Writing Skills 2 3 Preparatory Year PHYS 101
General physics (1) 2 3 Preparatory Year
CSC 101 Introduction to Computing & Programming
2 3 College of Computer Engineering
MATH 101
Calculus (1) 2 3 Preparatory Year
CHEM 101
General Chemistry (1) 2 3 Preparatory Year
Level 2
IC101 The entrance to the Islamic Culture
2 3 Preparatory Year
ARAB101 Language Skills 2 3 Preparatory Year MATH 102
Calculus (2) 6 3 Preparatory Year
PHYS102 General physics (2) 2 3 Preparatory Year ENG 102 Introduction to report writing 4 3 Preparatory Year
Level 3
IC102 Islam and the society building
1 3 Preparatory Year
ARAB103 Arab liberation 2 3 Preparatory Year MATH 201
Calculus (3) 2 3 Preparatory Year
MATH 204
Differential Equations 2 3 College of Engineering
EE 201 Fundamentals of Electric Circuits
1 3 College of Engineering
CEN 205 Logic Design for EE students 1 3 College of Engineering
CEN 206 Logic Design Lab 1 2 College of Engineering
IC103 Economic System in Islam 2 3 Preparatory Year

Annual Program Report, Ramadan 1438H, June 2017. Page27
Level 4
EE 212 Electronics (1) 1 3 Preparatory Year EE 213 Electronics (1) Lab 1 2 College of
Engineering EE 202 Electric Circuit Analysis 1 3 College of
Engineering EE 300 Electrical Measurements 1 3 College of
Engineering
Level 5
MATH 302
Applied Math for Engineers 1 3 College of Engineering
EE 203 Electromagnetics (I) 1 3 College of Engineering
EE 205 Electric Circuits Laboratory 1 1 College of Engineering
CEN 205 Logic Design for EE students 1 3 College of Engineering
CEN 212 Logic Design Lab for EE students
1 1 College of Engineering
EE302 Probabilistic Methods in Electrical Engineering
1 3 College of Engineering
EE 305 Introduction to Microprocessors
1 3 College of Engineering
Level 6
EE 312 Electronics (I) 1 3 College of Engineering
EE 313 Electronics (I) Lab 1 1 College of Engineering
EE 340 Fundamental of Power System
1 3 College of Engineering
EE 300 Electrical Measurements 1 3 College of Engineering
EE 335 Electric Machines (I) 1 3 College of Engineering
EE 355 Principles of Control Systems
1 3 College of Engineering
EE 317 Electronics 2 1 3 College of Engineering
EE 319 Electronics 2 Lab 1 1 College of Engineering
EE 320 Principles of Communications
1 3 College of Engineering
EE 328 Wave Propagation and Antennas
1 3 College of Engineering
IC 104 Fund. of Political System in Islam
1 2 College of Engineering
EE 355 Principles of Control Systems
1 3 College of Engineering
EE 356 Control Systems Lab. 1 1 College of Engineering

Annual Program Report, Ramadan 1438H, June 2017. Page28
Level 7
EE 337 Electric Machines Lab 1 1 College of Engineering
EE 341 Power Systems Analysis 1 3 College of Engineering
EE 342 Power Systems Analysis Lab 1 1 College of Engineering
EE 432 Power Electronics 1 3 College of Engineering
EE 446 High Voltage Engineering 1 3 College of Engineering
EE 424 Fiber Optics Communications
1 3 College of Engineering
EE 322 Digital Communications 1 3 College of Engineering
EE 326 Communications Lab 1 1 College of Engineering
EE 499 Graduation Project 1 3 College of Engineering
CEN 306 Principles of network Engineering
1 3 College of Engineering
GE 402 Management of Engineering Projects
1 3 College of Engineering
Level 8
EE 445 Industrial Power System Design
1 3 College of Engineering
EE 442 Utilization of Electric Energy
1 3 College of Engineering
EE 443 Power System Operation and Control
1 3 College of Engineering
EE 444 Power System Planning 1 3 College of Engineering
EE 449 Power System Protection 1 3 College of Engineering
EE 414 Microwave Electronics 1 3 College of Engineering
EE 417 Integrated VLSI Circuit Design
1 3 College of Engineering
EE 419 Integrated VLSI Circuit Lab. 1 1 College of Engineering
EE 422 Communication Systems 1 3 College of Engineering
EE 426 Wireless communications 1 3 College of Engineering
EE 429 Selected Topics in Communications
1 3 College of Engineering
EE 999 Training 0 3. Program Learning Outcomes Assessment. Provide a report on the program learning outcomes assessment plan using an assessment cycle (a four to six-year cycle is recommended). All program

Annual Program Report, Ramadan 1438H, June 2017. Page29
learning outcomes are to be directly assessed at least once during the cycle. By the end of the cycle each program learning outcome will be assessed and recorded using a separate KPI Assessment Table (see below);
KPI #
NQF Learning Domains and Learning Outcomes
Method of Assessment for LOs
Date of Assessment
1.0 Knowledge At the end of the program, the student will be able to:
1.1 Update their knowledge and skills related to electrical engineering issues using appropriate learning strategies
Exams, Assignments, quizzes, discussions and presentations
First and Second Semester
1.2 Demonstrate knowledge of concepts, principles, theories, and procedures in electrical engineering
Exams, Assignments, quizzes, discussions and presentations
First and Second Semester
2.0 Cognitive Skills At the end of the program, the student will be able to:
2.1 Identify, formulate, and solve complex engineering problems by applying principles of engineering, science, and mathematics.
Exams, Assignments, quizzes, discussions and presentations
First and Second Semester
2.2 Apply engineering design to produce solutions that meet specified needs with consideration of public health, safety, and welfare, as well as global, cultural, social, environmental, and economic factors
Exams, Assignments, quizzes, discussions and presentations
First and Second Semester
2.3 Develop and conduct appropriate experimentation, analyze and interpret data, and use engineering judgment to draw conclusions
Exams, Assignments, quizzes, discussions and presentations
First and Second Semester
2.4 Apply project management techniques to electrical power systems.
Exams, Assignments, quizzes, discussions and presentations
First and Second Semester
3.0 Interpersonal Skills & Responsibility At the end of the program, the student will be able to:
3.1 Work effectively on a team whose members together provide leadership, create a collaborative and inclusive environment, establish goals, plan tasks, and meet objectives
Behavior observation, presentations and discussions
First and Second Semester
3.2 Recognize ethical and professional responsibilities in engineering situations and make informed judgments, which must consider the impact of engineering solutions in global, economic, environmental, and societal contexts
Behavior observation, presentations and discussions
First and Second Semester
4.0 Communication, Information Technology, Numerical At the end of the program, the student will be able to:

Annual Program Report, Ramadan 1438H, June 2017. Page30
4.1 Communicate effectively with a range of audiences
Exams, projects, discussions and presentations
First and Second Semester
4.2 Apply knowledge of mathematics, science, engineering and to use the techniques, skills, and modern engineering tools necessary for engineering practice
Exams, projects, discussions and presentations
First and Second Semester
5.0 Psychomotor
5.1 N/A Provide an analysis of the Program Learning Outcome Assessment Cycle (List strengths and recommendations for improvement). Provide “direct assessments” for the current year’s program learning outcomes, according to the dates provided above (G.3). A key performance indicator (KPI) table is provided below. Each learning outcome should utilize a separate KPI table. Over the four (five/six) year cycle, all program learning outcomes are to be assessed and reported in the Annual Program Report(s). Note: Programs are to provide their own KPIs for directly measuring student performance. The KPI Assessment Table is used to document directly assessed program learning outcomes. Each program learning outcome should use a separate table. Direct assessments methods may include: national or international standardized test results, rubrics, exams and learning outcome grade analysis, or learning achievement using an alternative scientific assessment system (copy the KPI Assessment Table and paste to make additional tables as needed).
KPI Assessment Table *For reference please see appendix 4
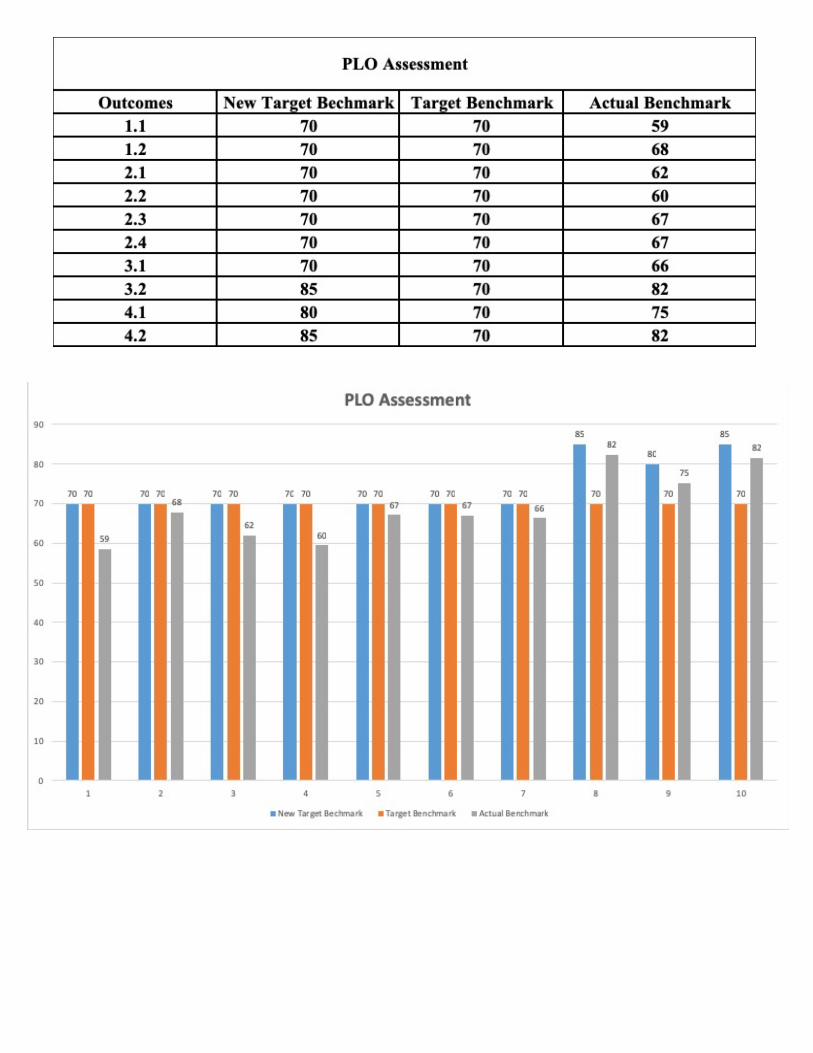
KPI Code # PLO1 Program KPI: Learning and Teaching Assessment Year: 2017/2018 Program Learning Outcome: Update their knowledge and skills related to electrical engineering issues using appropriate learning strategies NQF Learning Domain: Knowledge KPI Target Benchmark: 70% KPI Actual Benchmark: 59% Last year’s Benchmark (Internal Benchmarks): Under Progress New Target Benchmark: 70% Analysis: (List strengths and recommendations) 1. The department should be encouraging students to self-study from the recommended course books and enhances class room-based discussions. 2. More emphasis to improve English language skills KPI Code # PLO2 Program KPI: Learning and Teaching Assessment Year: 2017/2018 Program Learning Outcome: Demonstrate knowledge of concepts, principles, theories, and procedures in electrical engineering

Annual Program Report, Ramadan 1438H, June 2017. Page31
NQF Learning Domain: Knowledge KPI Target Benchmark: 70% KPI Actual Benchmark: 68% Last year’s Benchmark (Internal Benchmarks): Under Progress New Target Benchmark: 70% Analysis: (List strengths and recommendations) 1. The department should be encouraging students to self-study from the recommended course books and enhances class room-based discussions. 2. More emphasis to improve English language skills KPI Code # PLO3 Program KPI: Learning and Teaching
Assessment Year: 2017/2018 Program Learning Outcome: Identify, formulate, and solve complex engineering problems by applying principles of engineering, science, and mathematics NQF Learning Domain: Cognitive Skills KPI Target Benchmark: 70% KPI Actual Benchmark: 62% Last year’s Benchmark (Internal Benchmarks): Under Progress New Target Benchmark: 70% Analysis: (List strengths and recommendations) Students cognitive skills must be enhanced through more interactive learning, solving of course related problems, group discussion and simulations
KPI Code # PLO4 Program KPI: Learning and Teaching
Assessment Year: 2017/2018 Program Learning Outcome: Apply engineering design to produce solutions that meet specified needs with consideration of public health, safety, and welfare, as well as global, cultural, social, environmental, and economic factors NQF Learning Domain: Cognitive Skills KPI Target Benchmark: 70% KPI Actual Benchmark: 62% Last year’s Benchmark (Internal Benchmarks): Under Progress New Target Benchmark: 70% Analysis: (List strengths and recommendations) Students cognitive skills must be enhanced through more interactive learning, solving of course related problems, group discussion and simulations KPI Code # PLO5 Program KPI: Learning and Teaching
Assessment Year: 2017/2018 Program Learning Outcome: Develop and conduct appropriate experimentation, analyze and interpret data, and use engineering judgment to draw conclusions NQF Learning Domain: Cognitive Skills KPI Target Benchmark: 70% KPI Actual Benchmark: 67% Last year’s Benchmark (Internal Benchmarks): Under Progress New Target Benchmark: 70%
Annual Program Report, Ramadan 1438H, June 2017. Page32
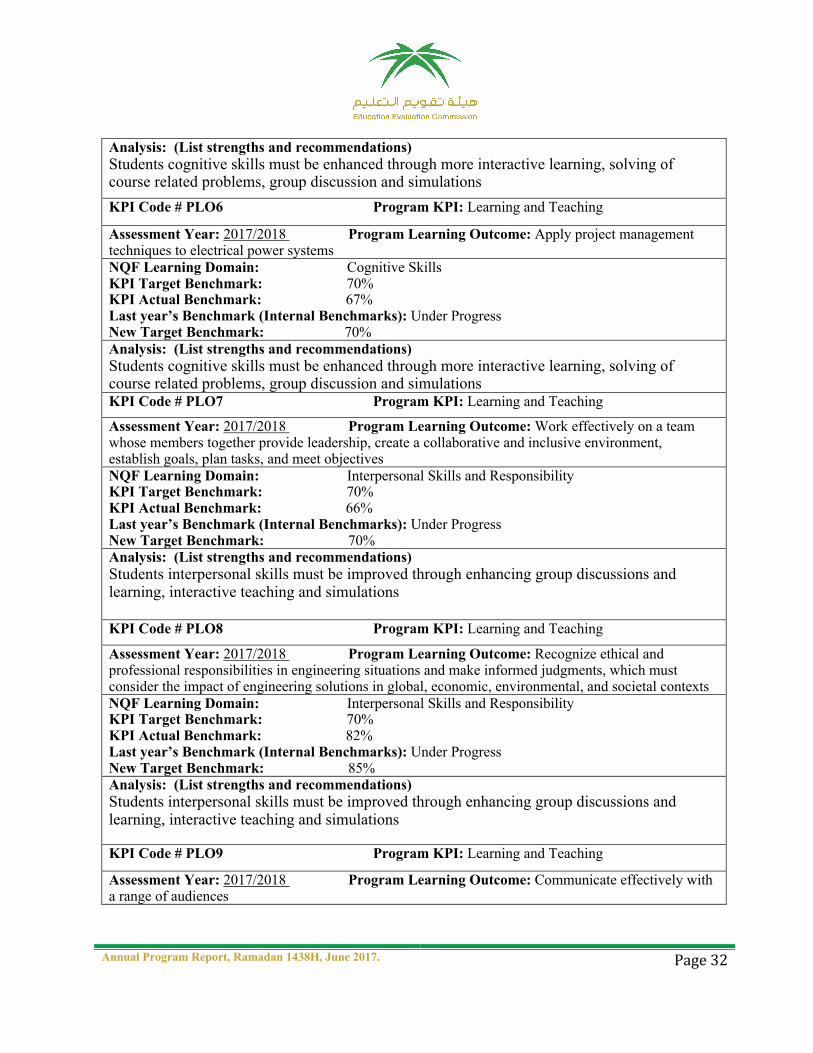
Analysis: (List strengths and recommendations) Students cognitive skills must be enhanced through more interactive learning, solving of course related problems, group discussion and simulations
KPI Code # PLO6 Program KPI: Learning and Teaching
Assessment Year: 2017/2018 Program Learning Outcome: Apply project management techniques to electrical power systems NQF Learning Domain: Cognitive Skills KPI Target Benchmark: 70% KPI Actual Benchmark: 67% Last year’s Benchmark (Internal Benchmarks): Under Progress New Target Benchmark: 70% Analysis: (List strengths and recommendations) Students cognitive skills must be enhanced through more interactive learning, solving of course related problems, group discussion and simulations KPI Code # PLO7 Program KPI: Learning and Teaching
Assessment Year: 2017/2018 Program Learning Outcome: Work effectively on a team whose members together provide leadership, create a collaborative and inclusive environment, establish goals, plan tasks, and meet objectives NQF Learning Domain: Interpersonal Skills and Responsibility KPI Target Benchmark: 70% KPI Actual Benchmark: 66% Last year’s Benchmark (Internal Benchmarks): Under Progress New Target Benchmark: 70% Analysis: (List strengths and recommendations) Students interpersonal skills must be improved through enhancing group discussions and learning, interactive teaching and simulations KPI Code # PLO8 Program KPI: Learning and Teaching
Assessment Year: 2017/2018 Program Learning Outcome: Recognize ethical and professional responsibilities in engineering situations and make informed judgments, which must consider the impact of engineering solutions in global, economic, environmental, and societal contexts NQF Learning Domain: Interpersonal Skills and Responsibility KPI Target Benchmark: 70% KPI Actual Benchmark: 82% Last year’s Benchmark (Internal Benchmarks): Under Progress New Target Benchmark: 85% Analysis: (List strengths and recommendations) Students interpersonal skills must be improved through enhancing group discussions and learning, interactive teaching and simulations KPI Code # PLO9 Program KPI: Learning and Teaching
Assessment Year: 2017/2018 Program Learning Outcome: Communicate effectively with a range of audiences
Annual Program Report, Ramadan 1438H, June 2017. Page33
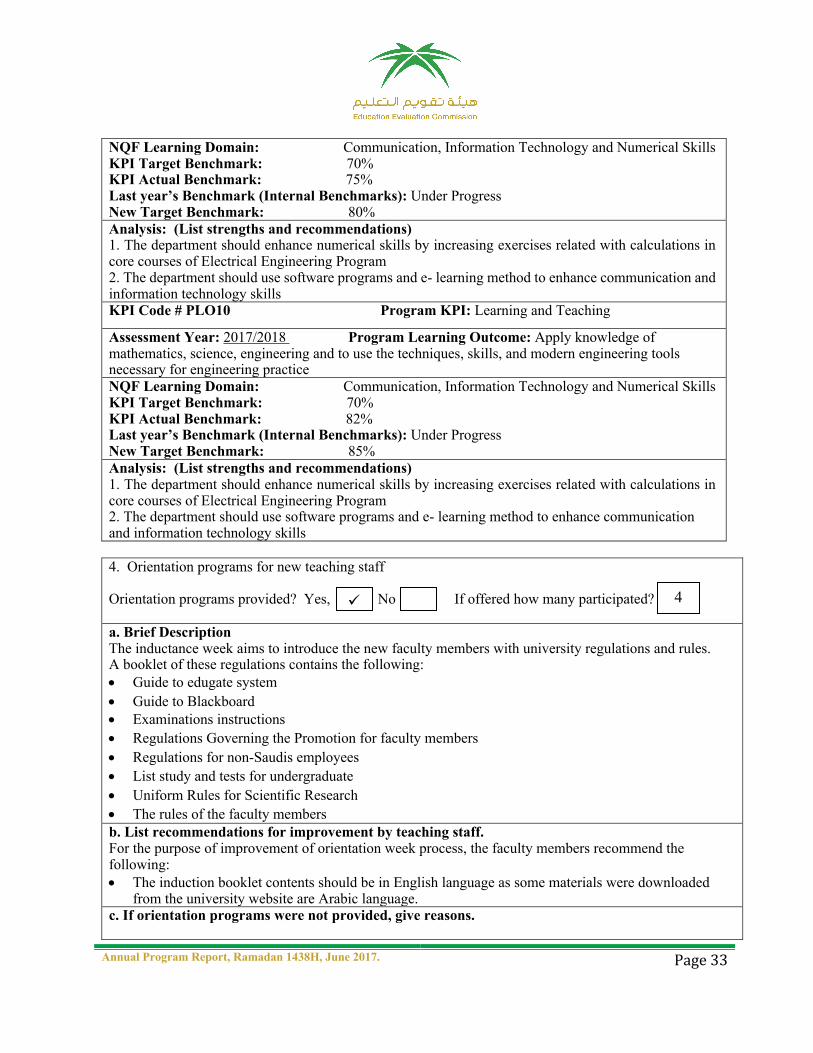
NQF Learning Domain: Communication, Information Technology and Numerical Skills KPI Target Benchmark: 70% KPI Actual Benchmark: 75% Last year’s Benchmark (Internal Benchmarks): Under Progress New Target Benchmark: 80% Analysis: (List strengths and recommendations) 1. The department should enhance numerical skills by increasing exercises related with calculations in core courses of Electrical Engineering Program 2. The department should use software programs and e- learning method to enhance communication and information technology skills KPI Code # PLO10 Program KPI: Learning and Teaching
Assessment Year: 2017/2018 Program Learning Outcome: Apply knowledge of mathematics, science, engineering and to use the techniques, skills, and modern engineering tools necessary for engineering practice NQF Learning Domain: Communication, Information Technology and Numerical Skills KPI Target Benchmark: 70% KPI Actual Benchmark: 82% Last year’s Benchmark (Internal Benchmarks): Under Progress New Target Benchmark: 85% Analysis: (List strengths and recommendations) 1. The department should enhance numerical skills by increasing exercises related with calculations in core courses of Electrical Engineering Program 2. The department should use software programs and e- learning method to enhance communication and information technology skills
4. Orientation programs for new teaching staff Orientation programs provided? Yes, No If offered how many participated? a. Brief Description The inductance week aims to introduce the new faculty members with university regulations and rules. A booklet of these regulations contains the following: • Guide to edugate system � • Guide to Blackboard • Examinations instructions � • Regulations Governing the Promotion for faculty members � • Regulations for non-Saudis employees � • List study and tests for undergraduate � • Uniform Rules for Scientific Research � • The rules of the faculty members � b. List recommendations for improvement by teaching staff. For the purpose of improvement of orientation week process, the faculty members recommend the following: • The induction booklet contents should be in English language as some materials were downloaded
from the university website are Arabic language. c. If orientation programs were not provided, give reasons.
4 ü

Annual Program Report, Ramadan 1438H, June 2017. Page34
H. Independent Opinion on Quality of the Program (e.g. head of another similar department / program offering comment on evidence received and conclusions reached).
1. Matters Raised by Evaluator Giving Opinion
Comments by Program Coordinator
• Main comments of the reviewing process:� 1. Quality awareness and organization we
excellent in the program. Thanks goes to the head of the department and the staff.�
2. Approval process is in place and well done. 3. Course reports are not filled with analyses,
recommendations and action plans.� 4. Archiving and documentation need more
work. 5. Self-evaluation scales need revision.�
• Regarding the course report, we noticed that some courses don’t have proper analysis, recommendation and action plans, but not all courses. And we started to ask all instructors to make presentations about their course reports with their recommendations for course improvements.
• Regarding the archiving, we work on this issue
to improve it.
5. Professional Development Activities for Faculty, Teaching and Other Staff a. Activities Provided
How many Participated
Teaching Staff
Other Staff
Workshop on discussion of exam writing and analysis guidelines 15 -
Assessment and Evaluation of SLO using Software Programs 15 -
Discussion and Proposal for The Development of EE LAB’S 15 -
Research Committee Presentation 15 -
Teaching strategies and their effects on the performances of graduates 15 -
Presentation about NCAAA criteria and their implementation 15 -
NCAAA criteria and Additional requirements 15 -
Indirect Assessment and Course Report for NCAAA Accreditation 15 -
b. Summary analysis on usefulness of activities based on participant’s evaluations or other evaluation methods.
Provided in the Workshop Reports

Annual Program Report, Ramadan 1438H, June 2017. Page35
6. There is a good system of evaluation and assessment process for SLOs.
• According to the feedback of the report, we organized a workshop about updating the CLOs of all courses.
• All other comments will be considered.
2. Implications for Planning for the Program 1. A workshop was conducted by faculty member on course report to show their action and
recommendation regarding students’ feedback and the results of evaluation 2. CLOs evaluation results used in the course report 3. Continuous quality improvement cycle based on the LO’s result 4. A workshop was conducted by faculty member on designing rubrics and feedback to the students on
their results ���

Program KPI and Assessment Table
KPI #
KPI
KPI
Target Benchmark
KPI
Actual Benchmark
KPI
Internal Benchmarks
KPI
External Benchmarks
KPI
Analysis
KPI New
Target Benchmark
1.1 Stakeholders' awareness ratings of the Mission
Statement and Objectives (Average rating on how well the mission is known to teaching staff, and undergraduate and graduate students, respectively, on a five- point scale in an annual survey).
3.8
4.0 3.72 4.8(PSU) 4.5
2.1 Stakeholder evaluation of the Policy Handbook, including administrative flow chart and job responsibilities (Average rating on the adequacy of the Policy Handbook on a five- point scale in an annual survey of teaching staff and final year students)
4.0 3.95 - - 4.2
3.1 Students' overall evaluation on the quality of their learning experiences. (Average rating of the overall quality on a five-point scale in an annual survey of final year students.)
2.5 3.15 3.57 3.5(PSU) 3.68(MU) 3.3
3.2 Proportion of courses in which student evaluations were conducted during the year.
100% 100% 100% 80%(PSU) 85.6%(MU) 100%
3.3 Proportion of programs in which there was an independent verification, within the institution, of standards of student achievement during the year.
100% 100% 100% 100%

Annual Program Report, Ramadan 1438H, June 2017. Page37
3.4 Proportion of programs in which there was an independent verification of standards of student achievement by people (evaluators) external to the institution during the year.
- - - -
4.1 Ratio of students to teaching staff. (Based on full time equivalents)
20:1 18:1 12:1 18:1(PSU) 10:1(MU) 15:1
4.2 Students overall rating on the quality of their courses. (Average rating of students on a five-point scale on overall evaluation of courses.)
4
4.31 3.87 4.32(PSU) 4.4
4.3 Proportion of teaching staff with verified doctoral qualifications
50% 50% 91.7% 100%(PSU) 63.16%(MU) 60%
4.4 percentage of students entering programs who successfully complete first year
70% 40 % 61.5 % 45%
4.5 Proportion of students entering undergraduate programs who complete those programs in minimum time.
70% 63.2% 61.5% 70%
4.6 Proportion of students entering post graduate programs who complete those programs in specified time.
NA NA NA NA
4.7 Proportion of graduates from undergraduate programs who within six months of graduation are: (a) employed (b) enrolled in further study (c) Not seeking employment or further study.
- - - - -
5.1 Ratio of students to administrative staff 60:1 50:1 24:1 50:1 (PSU) 45:1
Annual Program Report, Ramadan 1438H, June 2017. Page38
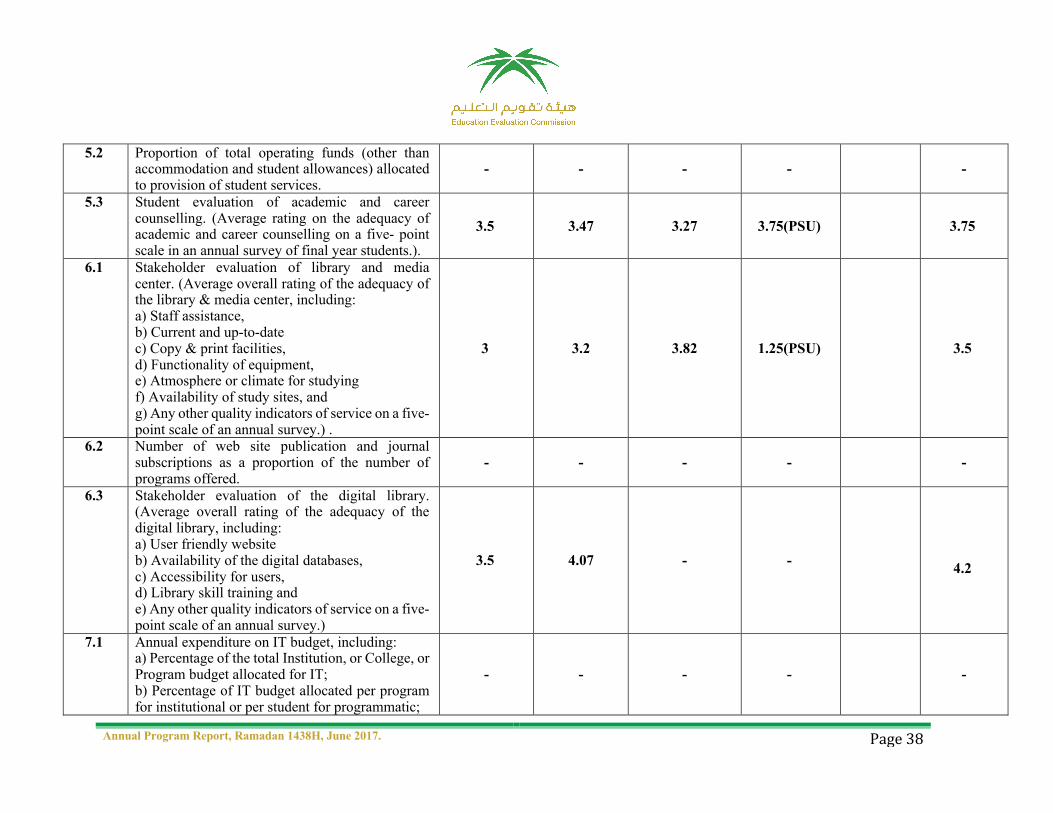
5.2 Proportion of total operating funds (other than accommodation and student allowances) allocated to provision of student services.
- - - - -
5.3 Student evaluation of academic and career counselling. (Average rating on the adequacy of academic and career counselling on a five- point scale in an annual survey of final year students.).
3.5 3.47 3.27 3.75(PSU)
3.75
6.1 Stakeholder evaluation of library and media center. (Average overall rating of the adequacy of the library & media center, including: a) Staff assistance, b) Current and up-to-date c) Copy & print facilities, d) Functionality of equipment, e) Atmosphere or climate for studying f) Availability of study sites, and g) Any other quality indicators of service on a five- point scale of an annual survey.) .
3 3.2 3.82 1.25(PSU) 3.5
6.2 Number of web site publication and journal subscriptions as a proportion of the number of programs offered.
- - - -
-
6.3 Stakeholder evaluation of the digital library. (Average overall rating of the adequacy of the digital library, including: a) User friendly website b) Availability of the digital databases, c) Accessibility for users, d) Library skill training and e) Any other quality indicators of service on a five- point scale of an annual survey.)
3.5 4.07 - - 4.2
7.1 Annual expenditure on IT budget, including: a) Percentage of the total Institution, or College, or Program budget allocated for IT; b) Percentage of IT budget allocated per program for institutional or per student for programmatic;
- - - - -

Annual Program Report, Ramadan 1438H, June 2017. Page39
c) Percentage of IT budget allocated for software licenses; d) Percentage of IT budget allocated for IT security; e) Percentage of IT budge allocated for IT maintenance
7.2 Stakeholder evaluation of the IT services (Average overall rating of the adequacy of on a five- point scale of an annual survey). a) IT availability, b) Website, c) e-learning services d) IT Security, e) Maintenance (hardware & software), f) Accessibility g) Support systems, h) Hardware, software & up-dates, and Web-based electronic data management system or electronic resources (for example: institutional website providing resource sharing, networking & relevant information, including e- learning, interactive learning & teaching between students & faculty)
3 2.8 2.31 1(PSU) 3
7.3 Stakeholder evaluation of facilities & equipment: a) Classrooms, b) Laboratories, c) Bathrooms (cleanliness & maintenance), d) Campus security, e) Parking & access, f) Safety (first aide, fire extinguishers & alarm systems, secure chemicals) g) Access for those with disabilities or handicaps (ramps, lifts, bathroom furnishings),
3
2.80 1.84 1.5(PSU) 3.2

Annual Program Report, Ramadan 1438H, June 2017. Page40
h) Sporting facilities & equipment. 8.1 Total operating expenditure (other than
accommodation and student allowances) per student
300000SR 18672SR 28588SR 31000(IAU) 25000SR
9.1 Proportion of teaching staff leaving the institution in the past year for reasons other than age retirement.
5% 6.67% 9.1% 5%
9.2 Proportion of teaching staff participating in professional development activities during the past year.
30% 35.7% 35.4% 65%(PSU) 38%
10.1 Number of refereed publications in the previous year per full time equivalent teaching staff. (Publications based on the formula in the Higher Council Bylaw excluding conference presentations)
0.6 0.53 0.54 0.6
10.2 Number of citations in refereed journals in the previous year per full time equivalent faculty members
15 17.64 - - 18
10.3 Proportion of full time member of teaching staff with at least one refereed publication during the previous year.
60% 71% 45% 50%(PSU) 75%
10.4 Number of papers or reports presented at academic conferences during the past year per full time equivalent faculty members.
0.7:1 0.5:1 0 1.16:1(PSU) 0.7:1
11.1 Proportion of full time teaching and other staff actively engaged in community service activities 20% 21.4% 2:11 - 30%
11.2 Number of community education programs provided as a proportion of the number of departments.
- - - --
NOTE The following definitions are provided to guide the completion of the above table for Program KPI and Assessment.
KPI refers to the key performance indicators the program used in its SSRP. This includes both the NCAAA suggested KPIs chosen and all additional KPIs determined by the program (including 50% of the NCAAA suggested KPIs and all others). Target Benchmark refers to the anticipated or desired outcome (goal or aim) for each KPI.

Annual Program Report, Ramadan 1438H, June 2017. Page41
Actual Benchmark refers to the actual outcome determined when the KPI is measured or calculated. Internal Benchmarks refer to comparable benchmarks (actual findings) from inside the program (like data results from previous years or data results from other departments within the same college). External Benchmarks refer to comparable benchmarks (actual findings) from similar programs that are outside the program (like from similar programs that are national or international). KPI Analysis refers to a comparison and contrast of the benchmarks to determine strengths and recommendations for improvement. New Target Benchmark refers to the establishment of a new anticipated or desired outcome for the KPI that is based on the KPI analysis.
Program Action Plan Table
Directions: Based on the “Analysis of KPIs and Benchmarks” provided in the above Program KPI and Assessment Table, list the recommendations identified and proceed to establish a continuous improvement action plan.
No. Recommendations Actions Assessment Mechanism or Criteria
Responsible Person
Start Date
Completion Date
1.
Recommendations suggested in the improvement plan for all the stakeholder’s surveys.
Action plan for the Recommendations suggested in the improvement plan
Action Plan Quality
Committee in the EE Program
September 2018
May 2019
2.
Organizing workshop about measuring learning outcomes; assessment methods and course portfolio
Number of teaching staff in the program participated in the university workshops
Increasing the number of faculty members
participated in university workshops
Quality Committee in the
EE Program
September 2018
October 2018
3. ISI Conferences and Journals
Offering the updated ISI conferences and journals in the kingdom and in the other gulf countries for 2017-2018
Increase the participation in ISI conferences and journals
Scientific Research
Committee in the program
September 2018 May 2019
4. Improving the teaching strategies in the program
Workshop: Improving the teaching strategies
Workshop
Quality Committee in the
EE Program September 2018
Annual Program Report, Ramadan 1438H, June 2017. Page42
(Chairman of the EE Program)
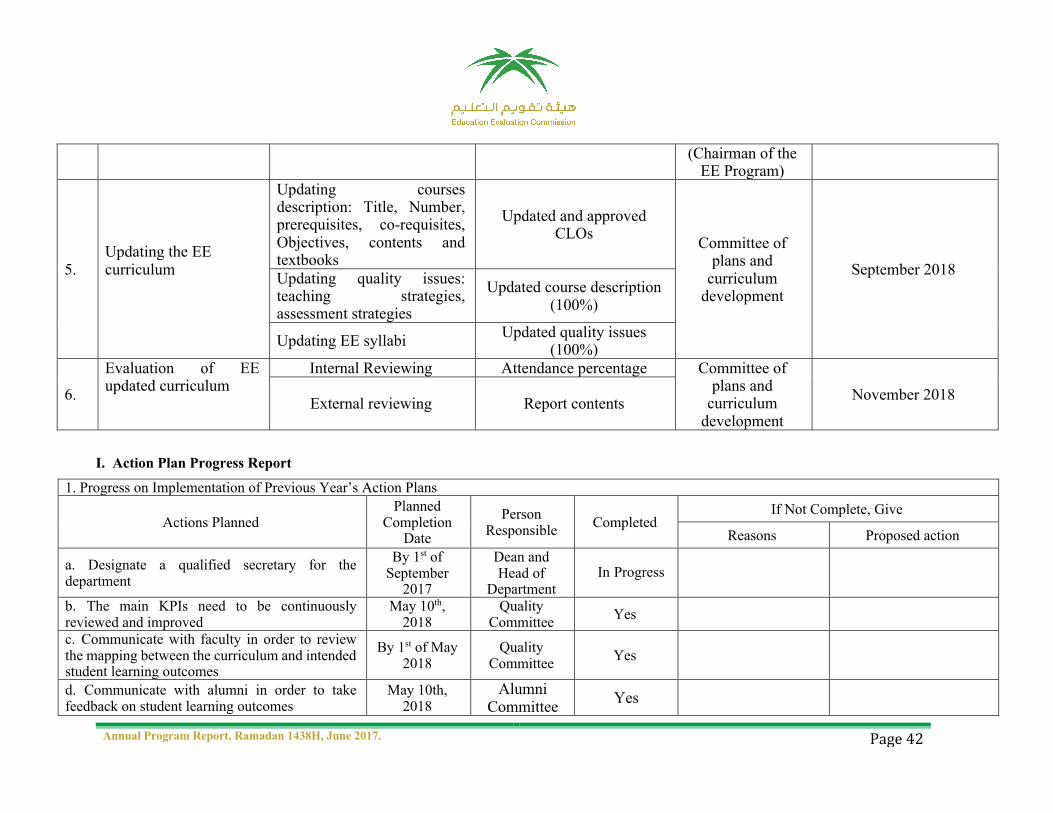
5. Updating the EE curriculum
Updating courses description: Title, Number, prerequisites, co-requisites, Objectives, contents and textbooks
Updated and approved CLOs
Committee of plans and
curriculum development
September 2018 Updating quality issues: teaching strategies, assessment strategies
Updated course description (100%)
Updating EE syllabi Updated quality issues (100%)
6.
Evaluation of EE updated curriculum
Internal Reviewing Attendance percentage Committee of plans and
curriculum development
November 2018 External reviewing Report contents
I. Action Plan Progress Report
1. Progress on Implementation of Previous Year’s Action Plans
Actions Planned Planned
Completion Date
Person Responsible Completed
If Not Complete, Give
Reasons Proposed action
a. Designate a qualified secretary for the department
By 1st of September
2017
Dean and Head of
Department
b. The main KPIs need to be continuously reviewed and improved
May 10th, 2018
Quality Committee Yes
c. Communicate with faculty in order to review the mapping between the curriculum and intended student learning outcomes
By 1st of May 2018
Quality Committee Yes
d. Communicate with alumni in order to take feedback on student learning outcomes
May 10th, 2018
Alumni Committee
Yes
In Progress

Annual Program Report, Ramadan 1438H, June 2017. Page43
e. External review of program specification, program report, course specification, and course report
By 1st of January 2018
Head of the Department & Quality Committee
No
In Progress and we are in waiting fast response from
university
The department is in the process of external
revision for the program once the university
communicates with the committee
f. Hiring new teaching staff in communication field March, 2018
Vice Dean and Head of department
In Progress
The department is in the process of
attracting new faculty with relevant qualifications
g. Organize workshop/seminars Ongoing Process
Seminar Committee
Ongoing
h. Get accreditation from national and international bodies In-Process
Accreditation Committee In-Process
2. Proposals for Program Development a. Increase cooperation between intra university faculties, Inter University Faculties, with Society and Community. b. Encouraging the Students to take more real-life projects and make use of their skills for the community. c. Organizing seminars for students on different Electrical Engineering topics involving subject experts from other universities and
industrial companies. d. Encourage the faculty members to prepare study materials for each course as per syllabus. e. Increase in frequency of Training / Orientation Program for Students as well as staff. f. Infrastructure Development. a. Proposals for Changes to Program Structure (units/credit-hours, compulsory or optional courses, other) After the feedback from the faculty, students, other departments and market conditions, the curriculum at electrical department is regularly updated. So far, the program curriculum has been subject to two major revisions related to pre-requisites and program credit hours. b. Proposals for Changes to Courses, (deletions and additions of units or topics, changes in teaching or assessment procedures
etc.) New learning outputs and advanced assessment methods approved by the department's board have been redesigned as part of the electric engineering program's pursuit of academic accreditation c. Development Activities for Faculty and Teaching Staff

Annual Program Report, Ramadan 1438H, June 2017. Page44
The Electrical Engineering Department has made substantial contributions to improving the quality of its workforce. Such improvements have been made through providing professional staff training through workshops that have been offered on a regular basis by the Deanship of Quality and Academic Accreditation (http:// http://www.ju.edu.sa/en/administrations-portal/deanships/deanship-of-quality-academic-accreditation). In addition, faculty members are encouraged to attend international conferences and professional training courses. These result in continuous improvement across the different activities of the Electrical Engineering Department, which include teaching, research activities, and community service. It is important to highlight that Jouf University has progressed effectively in rewarding excellent academic and administrative performance.
3. New Action Plan for Academic Year 1439-1440 H (2018-2019)
Actions Required Completion Date Person Responsible 1. Hiring New Faculty Members In-Progress The Department Chairman 2. Organize Workshop/Seminars On going Quality Committee in the Program 3. Get Accreditation from National and International Bodies In-Progress Accreditation Committee
Program Chair/ Coordinator Name: Dr. Tarek Kandil Signature: __________________________ Date Report Completed: 17-05-2018 Received by: ________________________ Dean/Department Head: Dr. Tarek Kandil Signature: __________________________ Date: 17-05-2018

Annual Program Report, Ramadan 1438H, June 2017. Page 47
APPENDIX-1

Prepared by: Dr. Ammar Armghan Page 1 of 26
College of Engineering
Department of Electrical Engineering
Result Analysis
Fall 2017(First Semester-1438/39)-Spring 2018(Second
Semester-1438/39)
The data for all the courses and labs in the department have been collected for the analysis. The
data was tabulated as shown in appendix 1. As a general remark it was noticeable the low passing
rate of four courses and extremely high passing rate (100%) of 12 courses. Those courses need
further discussion to know the reasons behind the extreme rates and set the action required. The
courses are tabulated below.
Criteria for analysis: -
The analysis is based on the average marks of the courses, the passing rates and the maximum
marks obtained
1. The average marks
The average marks distribution is based on the normal Gaussian distribution with the
center of the marks at 70%. Marks between 60 and 65 are considered normal otherwise some
special cases can be acceptable based on criteria such as the number of students in the course,
the level of the course and difficulty level of the course.
2. Maximum marks
Marks of student should be distributed normally with average centered around 70%. It
is considered acceptable for courses to have student with failing marks (below 60%) and student
with excellent marks above 90%. Courses with students obtaining 100% maximum marks, or no
excellent student (non-above 90%) and or no failing student (non-below 60%) need further
discussion or explanations.
3. Passing rate
Passing Rate varies among the different year level and the difficulty level of the
courses. Courses with 100% passing rates or below 60% passing rate need further discussion or
explanations.
4. The Lab marks
The Lab marks are excluded from the general analysis since it usually has different of
marks distribution.

Prepared by: Dr. Ammar Armghan Page 2 of 26
Noticeable points: -
A. Courses with low passing rates
Fall 2107
Sr.No Course Name
Cou
rse Co
de
Sectio
n N
um
ber
Number of Students Result Analysis
Reg
istered
Ab
sent
Den
ied
With
dra
wn
Atten
ded
Passed Failed
Ma
x M
ark
s
Min
Ma
rks
Avg
Mark
s
No %
No %
1 Principles of Network Engineering CEN306 466 7 0 0 0 7 4 57 3 43 99 60 72
2 Communication Principles EE320 405 7 0 0 0 7 4 57 3 43 75 22 48
3 Calculus MATH 102 1951 11 2 1 1 7 4 57 3 43 90 30 58
Spring 2018
Sr.No Course Name
Cou
rse Co
de
Sectio
n N
um
ber
Number of Students Result Analysis R
egistered
Ab
sent
Den
ied
With
dra
wn
Atten
ded
Passed Failed Ma
x M
ark
s
Min
Ma
rks
Avg
Mark
s
No %
No %

Prepared by: Dr. Ammar Armghan Page 3 of 26
1 Electromagnetics EE203 363 26 1 0 1 24 14 58 10 42 92 8 58
B. Courses with very high Passing rates
Fall 2017
Sr.No Course Name
Cou
rse Co
de
Sectio
n N
um
ber
Number of Students Result Analysis
Reg
istered
Ab
sent
Den
ied
With
dra
wn
Atten
ded
Passed Failed
Ma
x M
ark
s
Min
Ma
rks
Avg
Mark
s
No %
No %
1 Electrical Measurements EE300 343 20 0 0 1 19 19 100 0 0 98 60 80
2 Microwave Electronics EE414 568 4 0 0 0 4 4 100 0 0 86 63 74
3 VLSI Integrated Circuits EE417 570 3 0 0 0 3 3 100 0 0 85 65 72
4 High voltage Engineering EE446 410 26 0 0 0 26 26 100 0 0 99 60 77
5 Numerical Methods Math
254 1935 8 0 0 0 8 8 100 0 0 95 60 72

Prepared by: Dr. Ammar Armghan Page 4 of 26
Spring 2018
Sr.No Course Name
Cou
rse Co
de
Sectio
n N
um
ber
Number of Students Result Analysis
Reg
istered
Ab
sent
Den
ied
With
dra
wn
Atten
ded
Passed Failed
Ma
x M
ark
s
Min
Ma
rks
Avg
Mark
s
No %
No %
1 Principles of Network Engineering CEN306 466 3 0 0 0 3 3 100 0 0 71 60 64
2 Electronics II EE317 403 10 0 1 0 9 9 100 0 0 83 60 64
3 Microwave Electronics EE414 568 7 0 0 1 6 6 100 0 0 95 60 73
4 Integrated VLSI Circuit Design EE417 570 10 0 0 0 10 10 100 0 0 80 61 65
5 Communication Systems EE422 558 8 0 0 0 8 8 100 0 0 95 60 73
6 Fiber Optics Communications EE424 462 2 0 0 0 2 2 100 0 0 70 65 68
7 Wireless communications EE426 562 6 0 0 0 6 6 100 0 0 95 60 72
Prepared by: Dr. Ammar Armghan Page 5 of 26
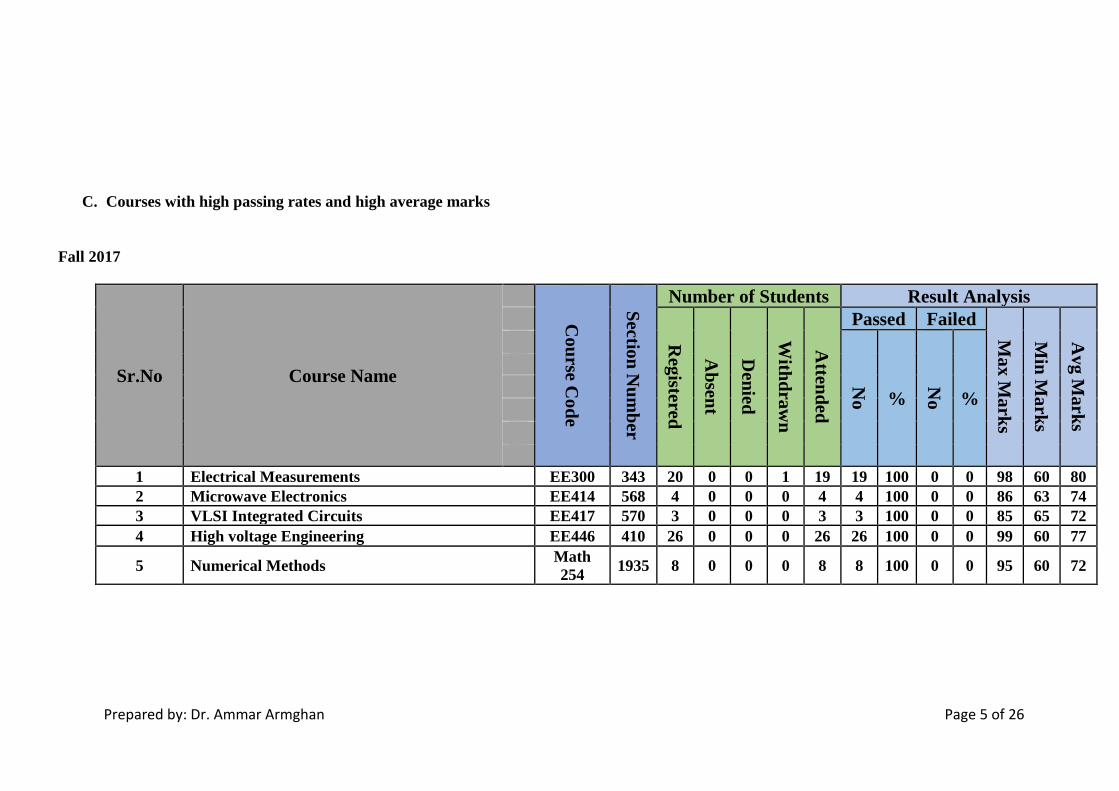
C. Courses with high passing rates and high average marks
Fall 2017
Sr.No Course Name
Cou
rse Co
de
Sectio
n N
um
ber
Number of Students Result Analysis
Reg
istered
Ab
sent
Den
ied
With
dra
wn
Atten
ded
Passed Failed
Ma
x M
ark
s
Min
Ma
rks
Avg
Mark
s
No %
No %
1 Electrical Measurements EE300 343 20 0 0 1 19 19 100 0 0 98 60 80
2 Microwave Electronics EE414 568 4 0 0 0 4 4 100 0 0 86 63 74
3 VLSI Integrated Circuits EE417 570 3 0 0 0 3 3 100 0 0 85 65 72
4 High voltage Engineering EE446 410 26 0 0 0 26 26 100 0 0 99 60 77
5 Numerical Methods Math
254 1935 8 0 0 0 8 8 100 0 0 95 60 72

Prepared by: Dr. Ammar Armghan Page 6 of 26
Spring 2018
Sr.No Course Name
Cou
rse Co
de
Sectio
n N
um
ber
Number of Students Result Analysis
Reg
istered
Ab
sent
Den
ied
With
dra
wn
Atten
ded
Passed Failed M
ax
Ma
rks
Min
Ma
rks
Avg
Mark
s
No %
No %
1 Microwave Electronics EE414 568 7 0 0 1 6 6 100 0 0 95 60 73
2 Communication Systems EE422 558 8 0 0 0 8 8 100 0 0 95 60 73
3 Wireless communications EE426 562 6 0 0 0 6 6 100 0 0 95 60 72
General Analysis: The Exam Results Analysis Template was used to analyze the data. The analysis results for the average marks, the maximum marks and the failing
rate were compared to those of Fall 2017 and Spring 2018. The results are given in appendix two. It is clear that that there is a considerable
improvement of the results in Spring 2018 in comparison to those of Fall 2017.

Prepared by: Dr. Ammar Armghan Page 7 of 26
Appendix 1 Courses Core Summary
Fall 2017
Sr.No Course Name
Cou
rse Co
de
Sectio
n N
um
ber
Number of Students Result Analysis
Reg
istered
Ab
sent
Den
ied
With
dra
wn
Atten
ded
Passed Failed
Ma
x M
ark
s
Min
Ma
rks
Avg
Mark
s
N
o %
No %
1 Logic Design for EE students CEN205 333 33 1 0 2 30 25 83 5 17 95 27 62
2 Principles of Network Engineering CEN306 466 7 0 0 0 7 4 57 3 43 99 60 72
3 Electrical Power Plants EE 321 385 21 0 0 3 18 13 72 5 28 83 15 50
4 Electric Machines (1) EE 335 387 21 0 2 1 18 12 67 6 33 98 10 47
5 Optical Communications EE 424 462 13 0 0 0 13 12 92 1 8 98 42 72
6 Fundamental of Electrical Circuits EE201 335 32 1 2 3 26 20 77 6 23 91 36 58
7 Electrical Circuit Analysis
EE202 349 8 0 1 0 7 6 86 1 14 83 29 64
351 17 0 1 1 15 10 67 5 33 77 16 45
8 Electromagnetics EE203 575 26 1 1 1 23 16 70 7 30 97 0 70
9 Electrical Measurements EE300 343 20 0 0 1 19 19 100 0 0 98 60 80
10 Probabilistic Methods in Electrical
Engineering EE302 367 33 0 0 2 31 27 87 4 13 92 17 57

Prepared by: Dr. Ammar Armghan Page 8 of 26
11 Introduction to microprocessors EE305 369 18 0 0 0 18 13 72 5 28 91 30 69
12 Electronics (I) EE312 353 8 0 1 1 6 4 67 2 33 76 30 57
355 9 0 1 0 8 5 63 3 38 85 44 63
13 Electronics (II) EE317 403 7 2 0 0 5 4 80 1 20 70 46 64
14 Electrics and Electronic Circuits EE318 839 21 1 0 3 17 11 65 6 35 87 8 62
15 Communication Principles EE320 405 7 0 0 0 7 4 57 3 43 75 22 48
16 Digital Communications EE322 459 8 0 0 0 8 7 88 1 13 90 49 65
18 Electrical Mechanics II EE336 414 34 1 0 3 30 26 87 4 13 87 36 73
19 Fundamentals of Power Systems EE340 381 23 0 0 2 21 16 76 5 24 76 18 59
20 Power System analysis EE341 412 34 0 1 3 30 26 87 4 13 100 60 75
21 Microwave Electronics EE414 568 4 0 0 0 4 4 100 0 0 86 63 74
22 VLSI Integrated Circuits EE417 570 3 0 0 0 3 3 100 0 0 85 65 72
23 Wireless communications EE426 562 11 0 0 0 11 10 91 1 9 85 46 63
24 Power Electronics EE432 408 35 0 0 3 32 24 75 8 25 90 18 60
204 3 0 0 0 3 2 67 1 33 70 45 60
25 Power System Operation and Control EE443 525 27 0 0 3 24 21 88 3 13 93 32 69
26 Power System Planning EE444 528 14 1 0 1 12 11 92 1 8 85 33 67
27 Industrial Power System Design EE445 522 13 0 0 1 12 10 83 2 17 98 38 74
28 High voltage Engineering EE446 410 26 0 0 0 26 26 100 0 0 99 60 77
29 Power System Protection EE449 518 15 0 0 1 14 12 86 2 14 89 17 75
30 Calculus MATH
102 1951 11 2 1 1 7 4 57 3 43 90 30 58
31 Numerical Methods Math 254 1935 8 0 0 0 8 8 100 0 0 95 60 72
32 Applied Mathematics for Engineers MATH302 1937 18 2 0 1 15 10 67 5 33 90 26 55
33 Probability and Engineering Statistics STAT325 1941 22 0 1 1 20 14 70 6 30 95 34 59
1939 5 0 0 0 5 4 80 1 20 77 28 57
LABS
1 Logic Lab for EE Students CEN206 337 12 0 0 0 12 11 92 1 8 97 44 86

Prepared by: Dr. Ammar Armghan Page 9 of 26
338 25 0 1 1 23 23 100 0 0 99 60 85
2 Electric Circuits Lab EE205 359 8 0 1 1 6 6 100 0 0 87 60 70
3 Electric Circuits Lab EE205 360 4 0 0 2 2 2 100 0 0 90 68 79
4 Electrontics I Lab EE213 357 9 0 1 1 7 7 100 0 0 95 61 66
358 12 0 0 1 11 11 100 0 0 96 61 79
5 Microprocessor Lab EE306 371 25 0 2 0 23 18 78 5 22 90 39 66
6 Electrontics II Lab EE319 407 4 0 0 0 4 4 100 0 0 82 70 75
7 Electrical Machines Lab EE337 416 11 0 0 3 8 8 100 0 0 88 60 72
417 21 0 0 1 20 20 100 0 0 97 60 75
8 Power Systems Analysis Lab EE342 577 23 0 0 0 23 23 100 0 0 99 75 79
578 2 0 0 0 2 2 100 0 0 98 90 94
9 Control systems Lab EE356 389 14 0 1 3 10 10 100 0 0 97 60 84
390 9 0 0 0 9 9 100 0 0 95 60 81
10 Communications Laboratory EE418 572 9 0 1 0 8 8 100 0 0 98 82 87
11 Power System Protection Lab EE450 532 12 0 1 1 10 9 90 1 0 97 61 67
533 5 1 0 1 3 3 100 0 0 85 70 77

Prepared by: Dr. Ammar Armghan Page 10 of 26
Spring 2018
Sr.No Course Name
Cou
rse Co
de
Sectio
n N
um
ber
Number of Students Result Analysis
Reg
istered
Ab
sent
Den
ied
With
dra
wn
Atten
ded
Passed Failed
Ma
x M
ark
s
Min
Ma
rks
Avg
No %
No %
1 Logic Design for EE Students CEN205 333 17 1 0 1 15 14 93 1 7 95 11 66
2 Principles of Network Engineering CEN306 466 3 0 0 0 3 3 100 0 0 71 60 64
3 Fundamentals of Electric Circuits EE201 341 21 1 1 4 15 10 67 5 33 75 35 42
4 Electric Circuit Analysis EE202 351 31 0 1 3 27 18 67 9 33 81 29 53
5 Electromagnetics EE203 363 26 1 0 1 24 14 58 10 42 92 8 58
6 Electronics I EE212 353 33 0 2 3 28 21 75 7 25.0 90 37 64
7 Electrical Measurements EE300 343 26 0 0 2 24 17 71 7 29 90 23 59
8 Probabilistic methods in EE EE302 367 36 0 1 3 36 27 75 5 14 90 4 67
9 Introduction to Microprocessors EE305 369 27 0 1 5 21 15 71 6 29 76 31 60

Prepared by: Dr. Ammar Armghan Page 11 of 26
10 Electronics II EE317 403 10 0 1 0 9 9 100 0 0.0 83 60 64
11 Principles of Communications EE320 405 10 0 0 0 10 8 80 2 20 90 18 68
12 Electric Power Plants EE321 385 30 0 1 1 28 24 86 4 14 80 24 59
13 Digital Communications EE322 459 3 0 0 0 3 2 67 1 33 63 60 58
14 Wave Propagation and Antennas EE328 401 8 0 0 0 8 6 75 2 25 75 49 62
15 Electric Machines 1 EE335 387 37 0 1 4 32 21 66 11 34.4 93 8 65
16 Electrical Machines II EE336 414 22 0 0 2 20 16 80 4 20 85 32 58
17 Fundamentals of Electric Power systems EE340 381 25 0 0 1 24 18 75 6 25.0 98 23 70
18 Power System Analysis EE341 412 15 0 0 1 14 11 79 3 21 96 32 61
19 Principles of Control Systems EE355 383 28 0 0 0 28 25 89 3 11 93 7 67
20 Microwave Electronics EE414 568 7 0 0 1 6 6 100 0 0 95 60 73
21 Integrated VLSI Circuit Design EE417 570 10 0 0 0 10 10 100 0 0 80 61 65
22 Communication Systems EE422 558 8 0 0 0 8 8 100 0 0 95 60 73
24 Wireless communications EE426 562 6 0 0 0 6 6 100 0 0 95 60 72
25 Power Electronics EE432 408 17 0 0 1 16 12 75 4 25 85 11 55
26 Utilization of Electric Energy EE442 515 29 0 0 2 27 24 89 3 11 95 17 61
27 Power System Operation and Control EE443 525 31 0 1 2 28 27 96 1 4 95 11 67
28 Power System Planning EE444 528 34 0 0 0 34 33 97 1 3 97 26 77
29 Industrial Power System Design EE445 522 32 0 0 2 30 24 80 6 20 96 21 60
30 High Voltage Engineering EE446 410 13 0 0 0 13 11 85 2 15 92 45 75
31 Power System Protection EE449 518 35 0 0 0 35 32 91 3 9 96 39 73
32 Applied Math for Engineers MATH302 1937 24 1 2 1 20 18 90 2 10 96 48 60
LABS
1 Logic Design Lab for EE Students CEN206 338 11 0 0 1 10 10 100 0 0 90 65 75
2 Electric Circuit Lab EE205 3366 10 0 0 0 10 10 100 0 0 92 63 76

Prepared by: Dr. Ammar Armghan Page 12 of 26
3 Electronics I Lab
EE213 357 23 0 1 3 19 19 100 0 0 99 60 78
358 8 0 0 1 7 7 100 0 0 82 60 68
4 Microprocessor Lab EE306 371 19 0 2 3 14 14 100 0 0 80 61 66
5 Electronics II Lab EE319 407 7 0 0 0 7 7 100 0 0 90 61 77
6 Electrical Machines Lab EE337 417 16 0 2 0 14 14 100 0 0 75 61 47
7 Power System Lab EE342 577/578 14 0 0 0 14 14 100 0 0 95 65 71
8 Control systems Lab EE356 389 17 0 0 1 16 16 100 0 0 98 62 77
9 Integrated VLSI circuit Lab EE419 572 8 0 0 0 8 8 100 0 0 95 66 81
10 Power Protection Lab EE450 533 7 0 0 2 5 5 100 0 0 97 66 59
Notes:
Passed (%) =(passed/attended)
Failed (%)= (Failed/attended) or Failed (%)=100%-(Passed (%))
Average= (Sum of final all marks of attended exam students/number of attended student)
Graphs: Horizontal axis = Percentage Bars are labeled with the number of courses
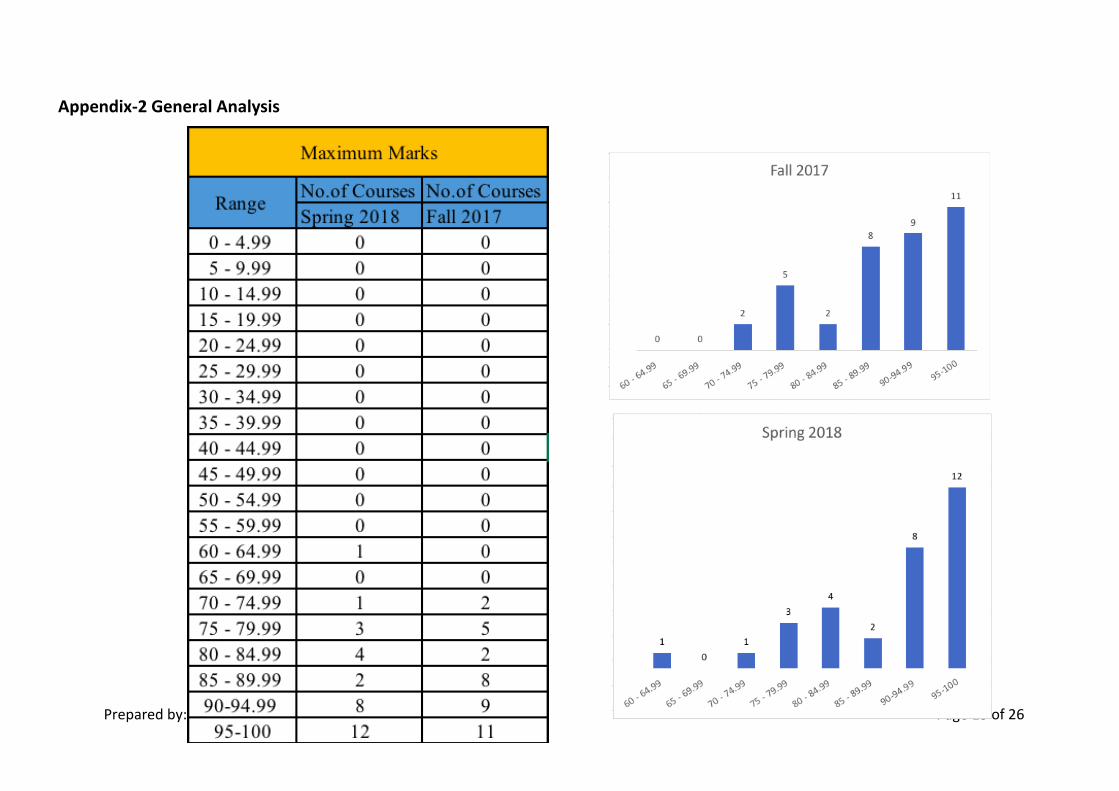
Prepared by: Dr. Ammar Armghan Page 13 of 26
Appendix-2 General Analysis
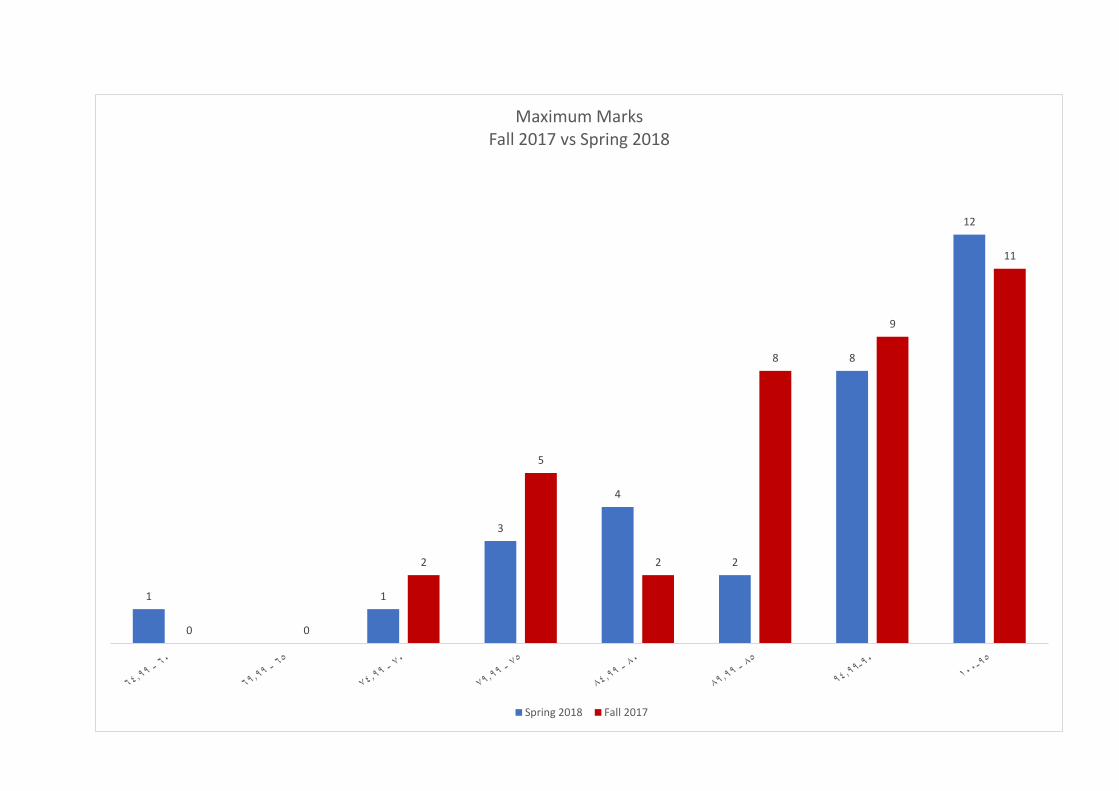
Prepared by: Dr. Ammar Armghan Page 14 of 26
1 1
3
4
2
8
12
0 0
2
5
2
8
9
11
Maximum MarksFall 2017 vs Spring 2018
Spring 2018 Fall 2017

Prepared by: Dr. Ammar Armghan Page 15 of 26
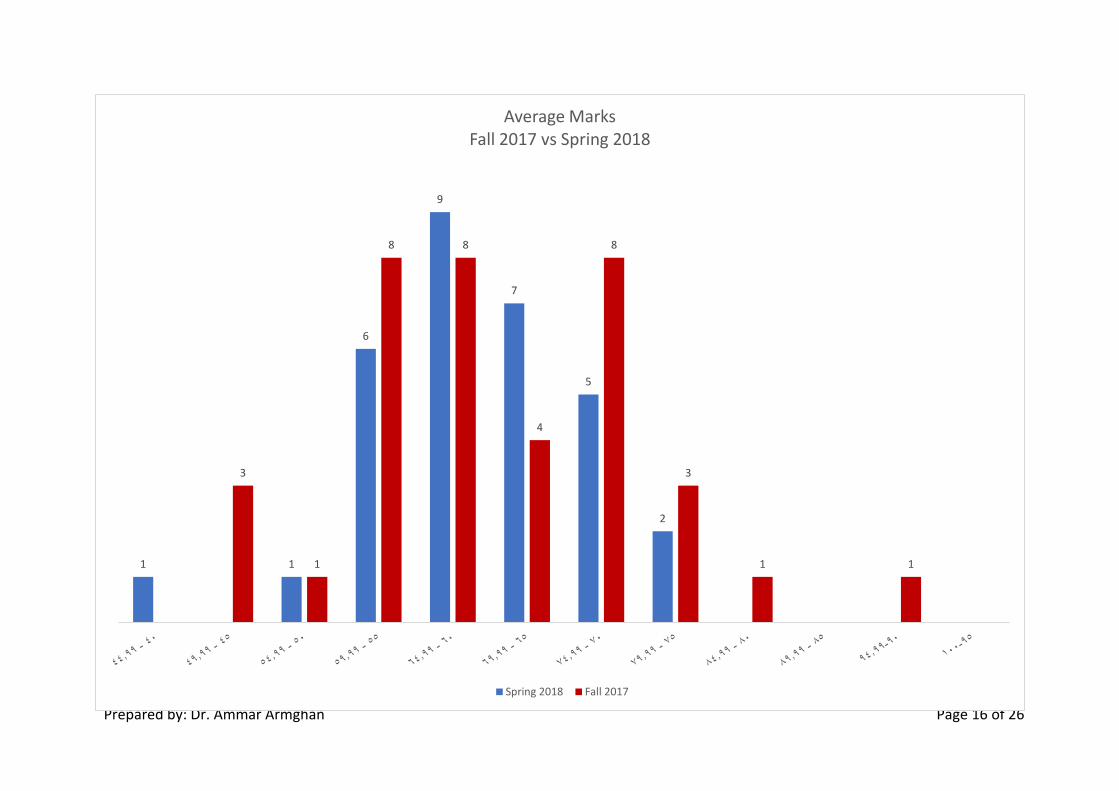
Prepared by: Dr. Ammar Armghan Page 16 of 26
1 1
6
9
7
5
2
3
1
8 8
4
8
3
1 1
Average MarksFall 2017 vs Spring 2018
Spring 2018 Fall 2017
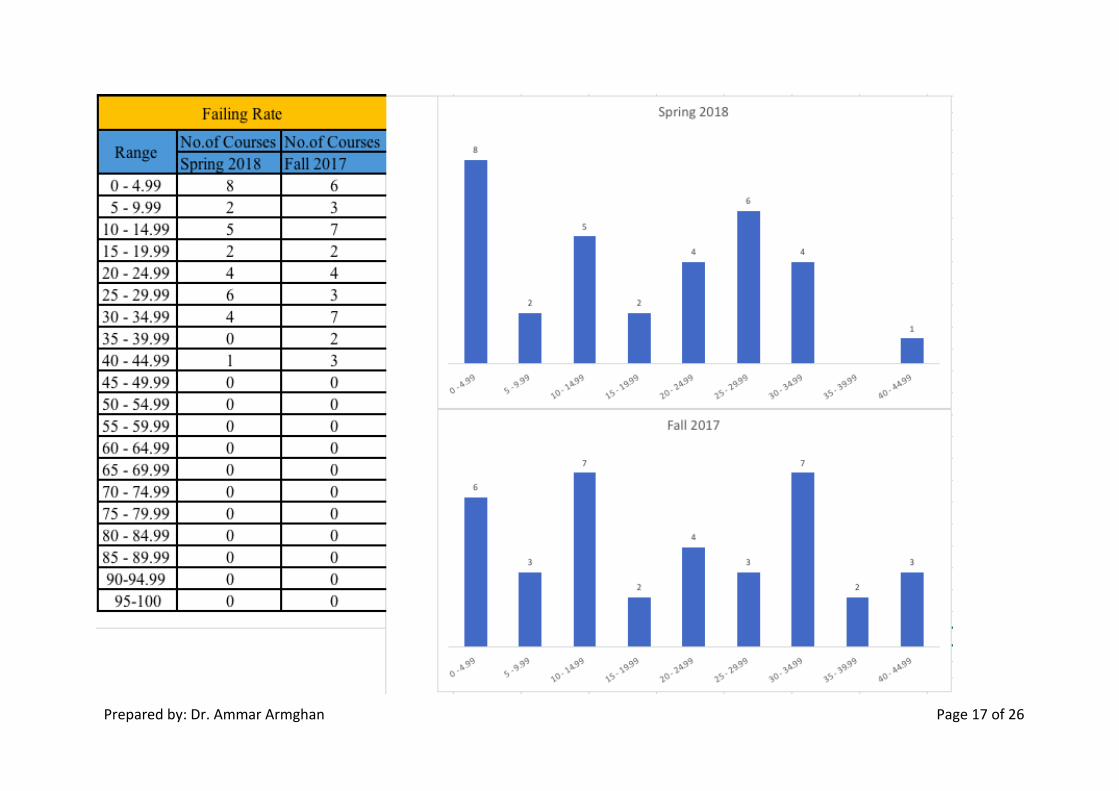
Prepared by: Dr. Ammar Armghan Page 17 of 26

Prepared by: Dr. Ammar Armghan Page 18 of 26
8
2
5
2
4
6
4
1
6
3
7
2
4
3
7
2
3
Failing RateFall 2017 vs Spring 2018
Spring 2018 Fall 2017

Prepared by: Dr. Ammar Armghan Page 19 of 26
Grades Analysis:
Fall 2017
Sr.No Course Name
Cou
rse Co
de
Sectio
n N
um
ber
Result Grades
A+
A
B+
B
C+
C
D+
D
F
1 Logic Design for EE students CEN205 333 1 2 3 3 3 5 2 6 5
2 Principles of Network Engineering CEN306 466
1 0 0 1 1 3 2 2 0 2835
3 Fundamental of Electrical Circuits EE201 335 0 1 0 0 4 6 1 8 6
4 Electrical Circuit Analysis EE202 349 0 0 0 1 1 1 2 1 1
351 0 0 0 1 3 2 0 4 5
5 Electromagnetics EE203 575 1 1 0 0 4 1 3 6 7
6 Electrical Measurements EE300 343 1 2 3 5 1 1 0 6 0
7 Probabilistic Methods in Electrical Engineering EE302 367 0 2 2 2 8 5 4 6 4
8 Introduction to microprocessors EE305 369 0 1 2 2 1 1 3 3 5
9 Electronics (I) EE212 353 0 0 0 0 1 0 0 3 2
355 0 0 1 0 2 0 0 2 3
10 Electronics (II) EE317 403 0 0 0 0 0 2 2 0 1

Prepared by: Dr. Ammar Armghan Page 20 of 26
11 Electricsl and Electronic Circuits EE318 839 0 0 1 2 1 2 1 4 6
12 Communication Principles EE320 405 0 0 0 0 1 1 0 2 3
13 Electrical Power Plants EE321 385
14 Digital Communications EE322 459 0 1 0 0 0 2 0 3 1
15 Antenna and Wave Propagation EE328 401 0 0 1 0 1 0 0 0 0
16 Electric Machines (1) EE335 387 1 0 0 1 0 0 1 9 6
17 Electrical Mechanics II
EE336 414 0 0 1 3 6 3 5 8 5
426 0 0 0 0 0 0 0 0 1
18 Fundamentals of Power Systems EE340 381 0 0 0 0 4 3 1 8 5
19 Power System analysis
EE341 412
6 1 0 4 6 4 5 4 4 424
20 Microwave Electronics EE414 568 0 0 2 1 0 0 0 1 0
21 VLSI Integrated Circuits EE417 570 0 0 1 0 0 0 2 0 0
22 Optical Communications EE424 462 3 0 0 1 2 1 2 3 1
23 Wireless communications EE426 562 0 0 1 0 2 1 1 5 1
24 Power Electronics
EE432 408 0 0 0 0 0 0 1 0 0
204 0 2 2 0 1 4 1 14 8
25 Power System Operation and Control EE443 525 0 2 4 2 3 0 3 7 3
26 Power System Planning EE444 528 0 0 1 1 4 2 1 2 2
27 Industrial Power System Design EE445 522 4 0 1 2 1 0 1 1 1
28 High voltage Engineering EE446 410 2 1 6 2 3 6 4 1 0
29 Power System Protection
EE449 518 0 0 1 1 3 2 2 2 2
2791 0 0 0 0 1 0 0 1 0
30 Calculus MATH
102 1951 0 1 0 0 1 1 0 1 3

Prepared by: Dr. Ammar Armghan Page 21 of 26
32 Applied Mathematics for Engineers MATH302 1937 0 1 0 0 1 2 1 5 5
LABS
1 Logic Lab for EE Students
CEN206 337 3 2 0 1 1 1 1 2 1
338 7 5 1 3 2 1 2 2 0
2 Electric Circuits Lab EE205 359 0 1 0 0 0 0 1 0 0
3 Electric Circuits Lab EE205 360 0 0 1 0 1 0 1 3 0
4 Electronics I Lab
EE213 357 1 0 1 1 0 1 2 1 0
358 2 0 3 1 0 3 1 1 0
5 Microprocessor Lab EE306 371 0 1 1 2 3 4 2 5 5
6 Electronics II Lab EE319 407 0 0 0 1 0 3 0 0 0
7 Electrical Machines Lab
EE337 416 0 0 1 1 2 0 1 3 0
417 1 0 2 2 5 4 5 1 0
8 Power Systems Analysis Lab
EE342 577 1 1 0 0 0 0 0 0 0
578 4 4 4 5 6 0 0 0 0
9 Control systems Lab
EE356 389 3 1 3 1 0 0 0 2 0
390 2 1 1 1 1 2 0 1 0
10 Communications Laboratory EE418 572 4 0 1 3 0 0 0 0 0
11 Power System Protection Lab
EE450 532 2 0 1 0 0 2 0 4 1
533 0 0 1 0 1 1 0 0 0

Prepared by: Dr. Ammar Armghan Page 22 of 26
Spring 2018
Sr.No Course Name
Cou
rse Co
de
Sectio
n N
um
ber
Result Grades
A+
A
B+
B
C+
C
D+
D
F
1 Logic Design for EE Students CEN205 333 1 1 3 1 1 2 2 3 1
2 Principles of Network Engineering CEN306 466 0 0 0 0 0 1 1 1 0
3 Fundamentals of Electric Circuits EE201 341 0 0 0 0 3 1 0 6 5
4 Electric Circuit Analysis EE202 351 0 0 0 2 1 6 2 7 9
5 Electromagnetics EE203 363 0 1 0 1 3 1 4 4 10
6 Electronics I EE212 353 0 1 1 1 5 5 5 3 7
7 Electrical Measurements EE300 343 0 1 0 1 2 5 1 7 7
8 Probabilistic methods in EE EE302 367 0 1 3 7 3 2 5 6 5
9 Introduction to Microprocessors EE305 369 0 0 0 0 6 3 2 4 6
10 Electronics II EE317 403 0 0 0 1 0 0 3 5 0
11 Principles of Communications EE320 405 0 2 0 2 3 0 0 1 2
12 Electric Power Plants EE321 385 0 0 0 1 4 5 5 9 4
13 Digital Communications EE322 459 0 0 0 0 0 0 0 2 1
14 Wave Propagation and Antennas EE328 401 0 0 0 0 2 0 1 3 2
15 Electric Machines 1 EE335 387 1 0 0 1 3 5 3 8 11

Prepared by: Dr. Ammar Armghan Page 23 of 26
16 Electrical Machines II EE336 414 0 0 1 1 3 4 5 2 4
17 Fundamentals of Electric Power systems EE340 381 2 1 1 2 4 2 3 3 6
18 Power System Analysis EE341 412 2 2 1 0 0 0 1 5 3
19 Principles of Control Systems EE355 383 0 1 1 3 3 7 4 6 3
20 Microwave Electronics EE414 568 1 0 0 1 1 0 2 1 0
21 Integrated VLSI Circuit Design EE417 570 0 0 0 2 1 3 1 3 0
22 Communication Systems EE422 558 1 1 1 0 0 0 2 3 0
23 Fiber Optics Communications EE424 462 0 0 0 0 0 1 1 0 0
24 Wireless communications EE426 562 1 0 0 1 0 1 0 3 0
25 Power Electronics EE432 408 0 0 1 0 2 3 1 5 4
26 Utilization of Electric Energy EE442 515 1 2 3 3 3 3 3 6 3
27 Power System Operation and Control EE443 525 1 2 6 3 6 1 2 6 1
28 Power System Planning EE444 528 5 2 3 8 5 3 2 5 1
29 Industrial Power System Design EE445 522 1 1 0 2 4 4 5 7 6
30 High Voltage Engineering EE446 410 1 3 0 1 2 3 0 1 2
31 Power System Protection EE449 518 1 4 3 5 7 3 2 7 3
32 Applied Math for Engineers MATH302 1937 1 3 1 1 3 3 1 5 2
LABS
1 Logic Design Lab for EE Students CEN206 338 1 2 1 0 0 4 1 1 0
2 Electric Circuit Lab EE205 3366 2 1 0 2 0 3 1 1 0
3 Electronics I Lab EE213 357 3 2 3 2 1 3 2 3 0
358 0 0 0 1 0 3 0 3 0
4 Microprocessor Lab EE306 371 0 0 0 1 1 5 5 2 0
5 Electronics II Lab EE319 407 0 1 1 1 1 1 1 1 0
6 Electrical Machines Lab EE337 417 11 2 1 0 0 0 0 0 0

Prepared by: Dr. Ammar Armghan Page 24 of 26
7 Power System Lab EE342 577/578 7 7 0 0 0 0 0 0 0
8 Control systems Lab EE356 389 1 2 3 1 2 4 2 1 0
9 integrated VLSI circuit Lab EE419 572 2 1 0 0 3 0 2 0 0
10 Power Protection Lab EE450 533 2 0 0 1 0 1 1 0 0
Grades
Sprin
g 20
18
Spring 2018 Percentage
Fall 20
17
Fall 2017 Percentage
A+ 48 7% 50 7%
A 46 6% 34 5%
B+ 35 5% 54 8%
B 52 7% 57 8%
C+ 82 11% 92 13%
C 92 13% 83 12%
D+ 74 10% 67 9%
D 134 18% 153 22%
F 92 13% 103 15%

Prepared by: Dr. Ammar Armghan Page 25 of 26
49 47
38
60
88
101
84
149
108
50
34
5457
92
83
67
153
103
A+ A B+ B C+ C D+ D F
Grade DistributionFall 2017 vs Spring 2018
Spring 2018 Fall 2017
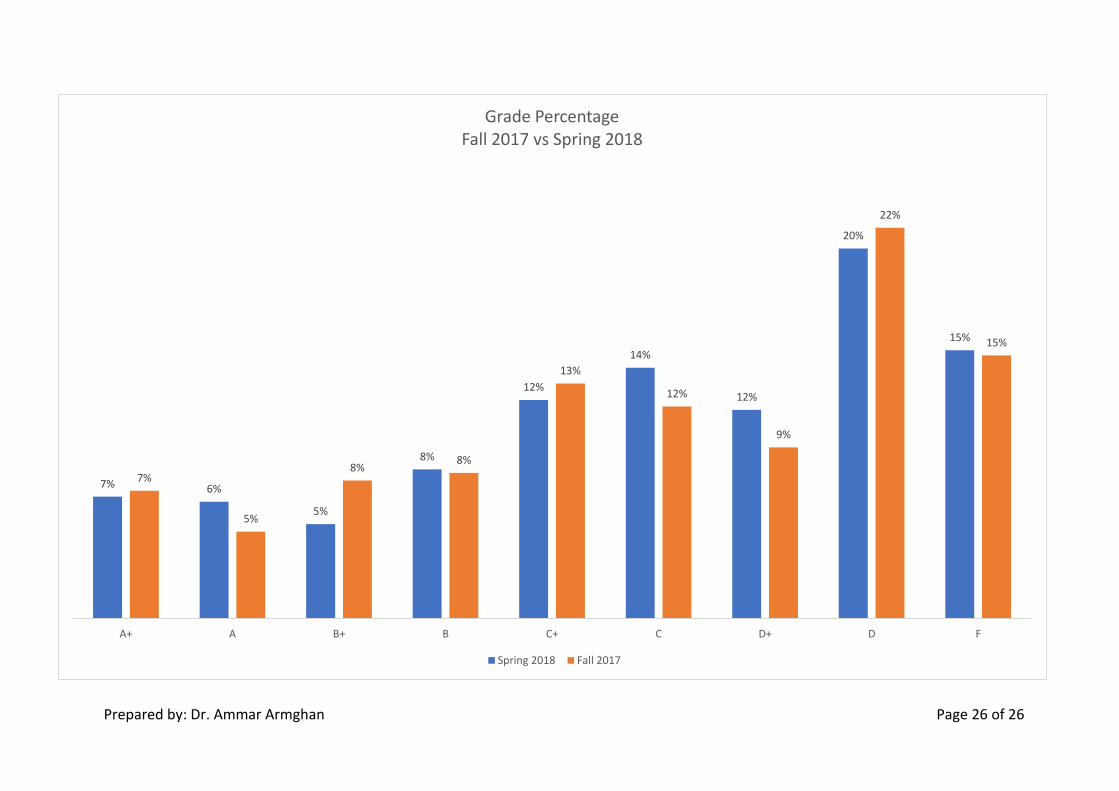
Prepared by: Dr. Ammar Armghan Page 26 of 26
7% 6%
5%
8%
12%
14%
12%
20%
15%
7%
5%
8%8%
13%
12%
9%
22%
15%
A+ A B+ B C+ C D+ D F
Grade PercentageFall 2017 vs Spring 2018
Spring 2018 Fall 2017

Annual Program Report, Ramadan 1438H, June 2017. Page 48
APPENDIX-2
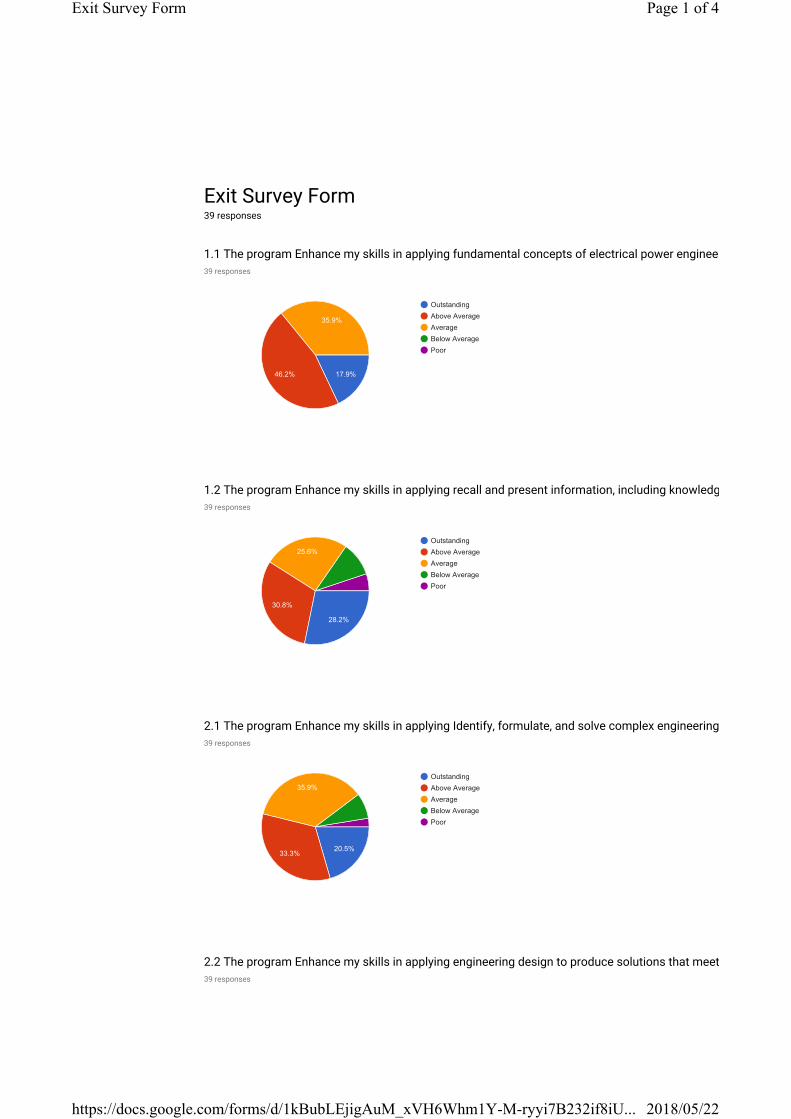
Exit Survey Form39 responses
1.1 The program Enhance my skills in applying fundamental concepts of electrical power engineering, using appropriate learning strategies39 responses
1.2 The program Enhance my skills in applying recall and present information, including knowledge of specific facts, knowledge of concepts, principles and theories, and knowledge of procedures.39 responses
2.1 The program Enhance my skills in applying Identify, formulate, and solve complex engineering problems by applying principles of engineering, science, and mathematics.39 responses
2.2 The program Enhance my skills in applying engineering design to produce solutions that meet specified needs with consideration of public health, safety, and welfare, as well as global, cultural, social, environmental, and economic factors.39 responses
Outstanding
Above Average
Average
Below Average
Poor
17.9%
35.9%
46.2%
Outstanding
Above Average
Average
Below Average
Poor
25.6%
30.8%
28.2%
Outstanding
Above Average
Average
Below Average
Poor
20.5%
35.9%
33.3%
Page 1 of 4Exit Survey Form
22/05/2018https://docs.google.com/forms/d/1kBubLEjigAuM_xVH6Whm1Y-M-ryyi7B232if8iU...
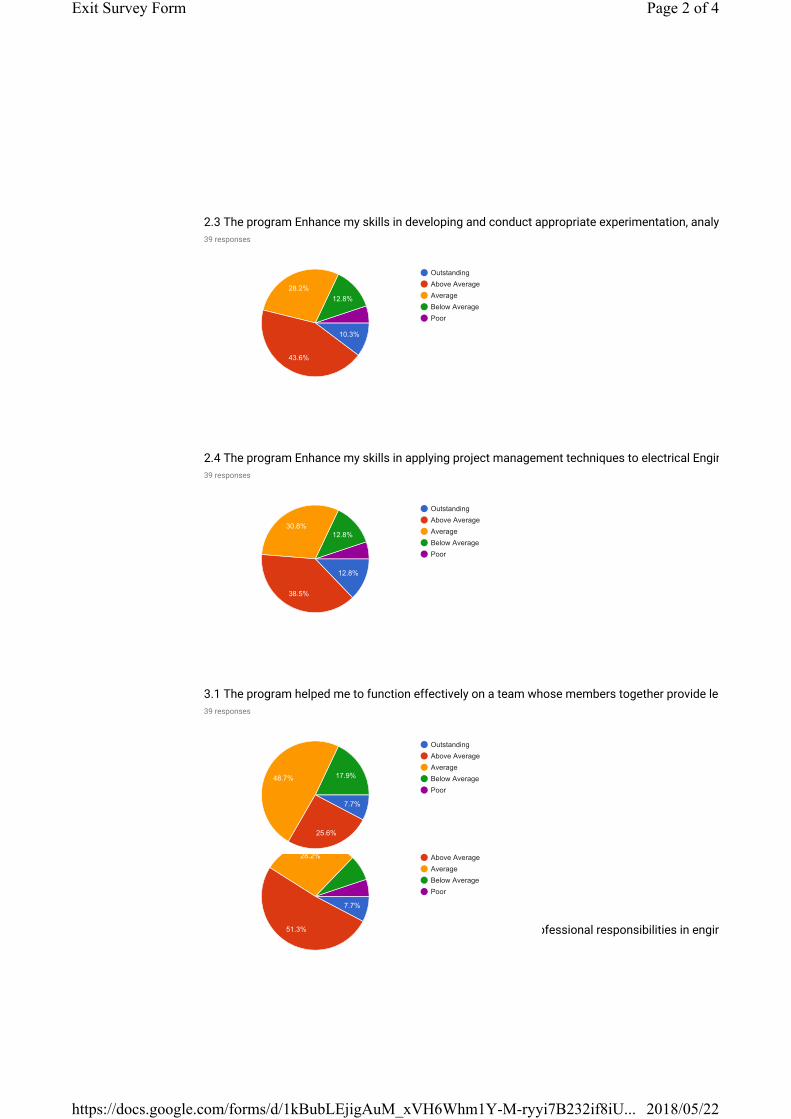
2.3 The program Enhance my skills in developing and conduct appropriate experimentation, analyze and interpret data, and use engineering judgment to draw conclusions.39 responses
2.4 The program Enhance my skills in applying project management techniques to electrical Engineering systems.39 responses
3.1 The program helped me to function effectively on a team whose members together provide leadership, create a collaborative and inclusive environment, establish goals, plan tasks, and meet objectives.39 responses
3.2 The program develop my skills in recognizing ethical and professional responsibilities in engineering situations and make informed judgments, which must consider the impact of engineering solutions in global, economic, environmental, and societal contexts.39 responses
Outstanding
Above Average
Average
Below Average
Poor
7.7%
28.2%
51.3%
Outstanding
Above Average
Average
Below Average
Poor
10.3%
12.8%
28.2%
43.6%
Outstanding
Above Average
Average
Below Average
Poor
12.8%
12.8%30.8%
38.5%
Outstanding
Above Average
Average
Below Average
Poor
7.7%
17.9%48.7%
25.6%
Page 2 of 4Exit Survey Form
22/05/2018https://docs.google.com/forms/d/1kBubLEjigAuM_xVH6Whm1Y-M-ryyi7B232if8iU...

4.1 The program helped me to improve my communication with a range of audiences.39 responses
4.2 The program Enhance my skills in applying knowledge of mathematics, science, engineering and to use the techniques, skills, and modern engineering tools necessary for engineering practice.39 responses
This content is neither created nor endorsed by Google. Report Abuse - Terms of Service - Additional Terms
Outstanding
Above Average
Average
Below Average
Poor
7.7%
12.8%
38.5%
38.5%
Outstanding
Above Average
Average
Below Average
Poor
15.4%38.5%
38.5%
Forms
Page 3 of 4Exit Survey Form
22/05/2018https://docs.google.com/forms/d/1kBubLEjigAuM_xVH6Whm1Y-M-ryyi7B232if8iU...
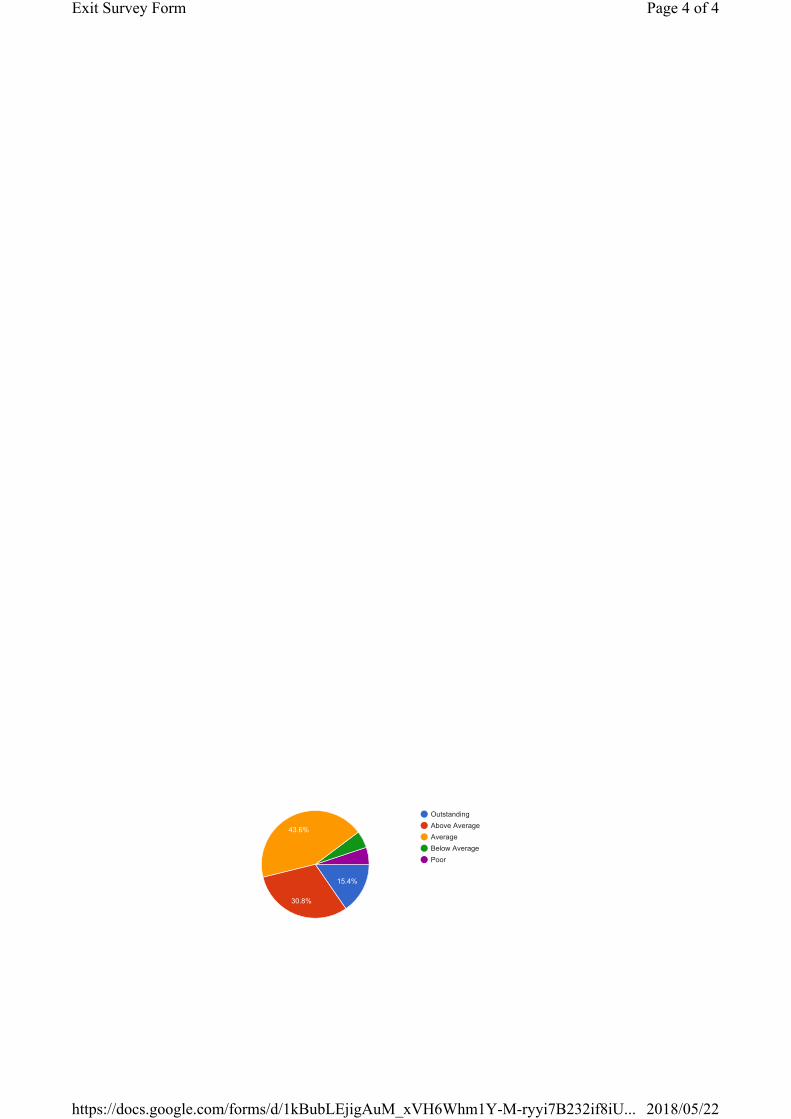
Outstanding
Above Average
Average
Below Average
Poor
15.4%
43.6%
30.8%
Page 4 of 4Exit Survey Form
22/05/2018https://docs.google.com/forms/d/1kBubLEjigAuM_xVH6Whm1Y-M-ryyi7B232if8iU...

Annual Program Report, Ramadan 1438H, June 2017. Page 49
APPENDIX-3

Faculty Survey Form16 responses
College of Engineering
Program: Electrical Engineering
Dear Faculty members
Name (Optional)
Academic Rank (Optional)16 responses

Overall Work Experience (Optional)16 responses
Professor
Associate Professor
Assistant Professor
Lecturer
Teaching Assistant
12.5%
81.3%
Less than a year
1 5 Years
5 10 Years
More Than 10 Years
31.3%
25%
37.5%

Age(Optional)16 responses
Satisfaction
Medical Services16 responses
Less than 25 years
2530 years
3040 years
4050 years
More than 50 years
43.8%
50%

O�ce space16 responses
Availability of nearby parking16 responses
Very satisfied
Somewhat satisfied
Neither satisfied nor
dissatisfied12 5%
18.8%
Very satisfied
Somewhat satisfied
Neither satisfied nor
dissatisfied
Somewhat dissatisfied
Very dissatisfied
Not applicable
12.5%
43.8%
31.3%
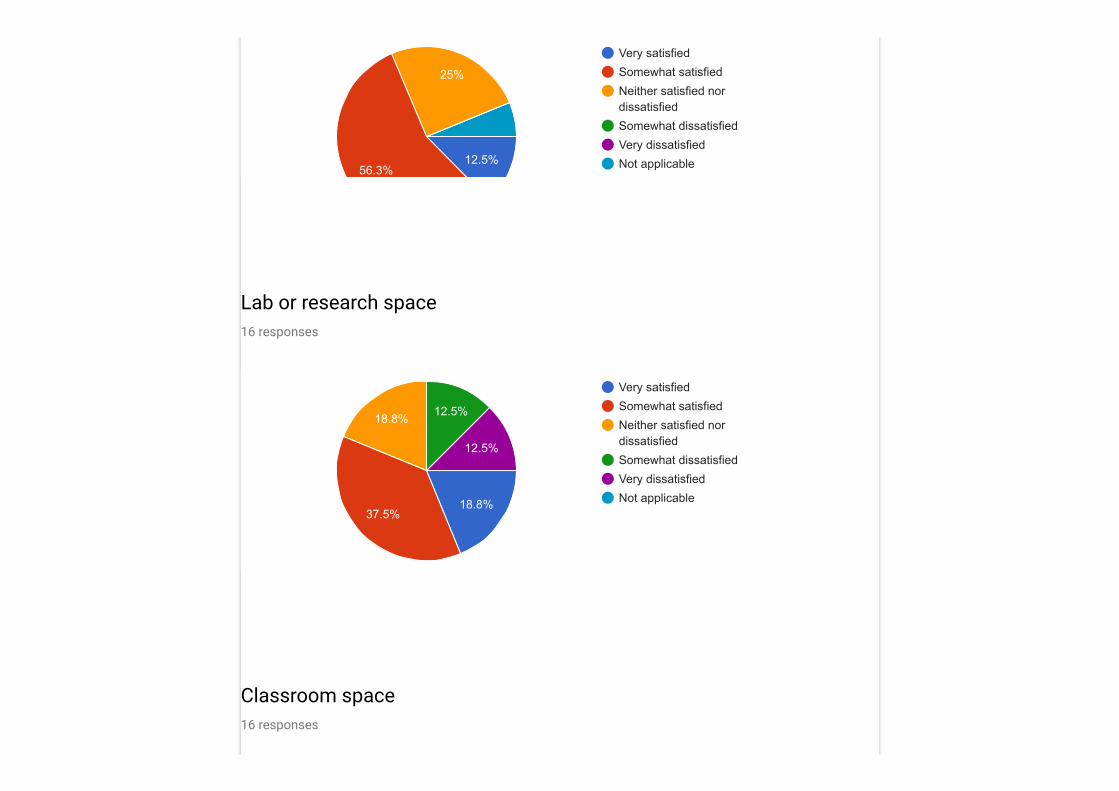
Lab or research space16 responses
Classroom space16 responses
Very satisfied
Somewhat satisfied
Neither satisfied nor
dissatisfied
Somewhat dissatisfied
Very dissatisfied
Not applicable12.5%
25%
56.3%
Very satisfied
Somewhat satisfied
Neither satisfied nor
dissatisfied
Somewhat dissatisfied
Very dissatisfied
Not applicable18.8%
12.5%
12.5%18.8%
37.5%
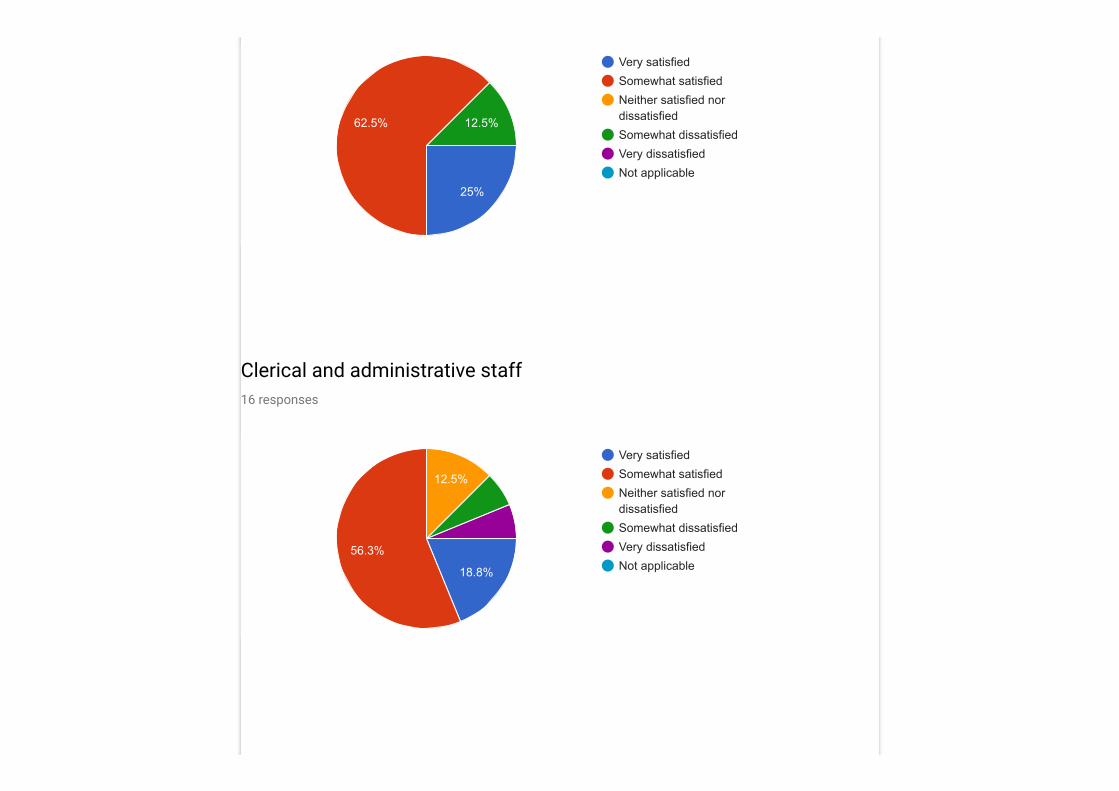
Clerical and administrative staff16 responses
Very satisfied
Somewhat satisfied
Neither satisfied nor
dissatisfied
Somewhat dissatisfied
Very dissatisfied
Not applicable
12.5%62.5%
25%
Very satisfied
Somewhat satisfied
Neither satisfied nor
dissatisfied
Somewhat dissatisfied
Very dissatisfied
Not applicable18.8%
12.5%
56.3%

Library resources16 responses
Computer resources16 responses
Very satisfied
Somewhat satisfied
Neither satisfied nor
dissatisfied
Somewhat dissatisfied
Very dissatisfied
Not applicable12.5%
12.5%
25%
50%
Very satisfied
Somewhat satisfied
Neither satisfied nor
dissatisfied
Somewhat dissatisfied
Very dissatisfied
Not applicable12.5%
18.8%
12.5%
50%
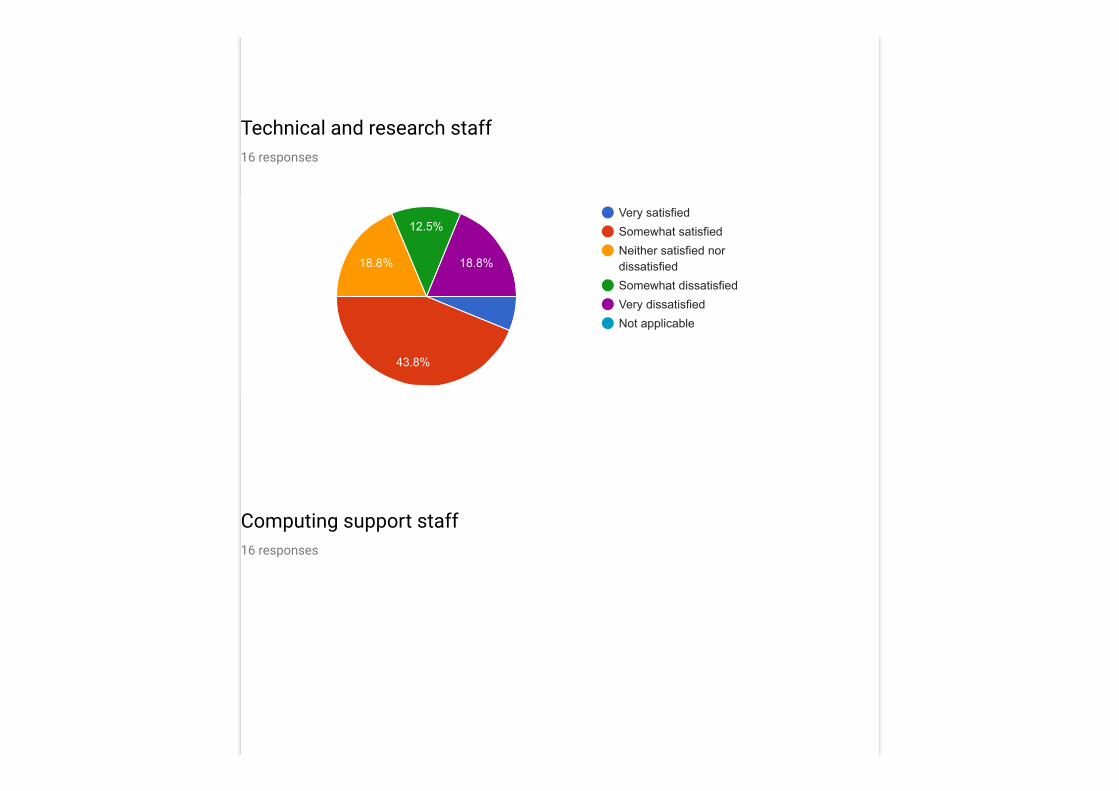
Technical and research staff16 responses
Computing support staff16 responses
Very satisfied
Somewhat satisfied
Neither satisfied nor
dissatisfied
Somewhat dissatisfied
Very dissatisfied
Not applicable
18.8%
12.5%
18.8%
43.8%

Support for securing grants16 responses
Other resources to support research16 responses
Very satisfied
Somewhat satisfied
Very satisfied
Somewhat satisfied
Neither satisfied nor
dissatisfied
Somewhat dissatisfied
Very dissatisfied
Not applicable
25%
56.3%

Health and medical on-campus resources16 responses
Teaching responsibilities16 responses
Very satisfied
Somewhat satisfied
Neither satisfied nor
dissatisfied
Somewhat dissatisfied
31.3%
18.8%
Very satisfied
Somewhat satisfied
Neither satisfied nor
dissatisfied
Somewhat dissatisfied
Very dissatisfied
Not applicable
12.5%
12.5%
37.5%
31.3%

Medical insurance options16 responses
Access to teaching assistants
Very satisfied
Somewhat satisfied
Neither satisfied nor
dissatisfied
Somewhat dissatisfied
Very dissatisfied
Not applicable18.8%
18.8%
12.5%
50%
Very satisfied
Somewhat satisfied
Neither satisfied nor
dissatisfied
Somewhat dissatisfied
Very dissatisfied
Not applicable18.8%
12.5%
12.5%
43.8%

16 responses
Advising responsibilities16 responses
Very satisfied
Somewhat satisfied
Neither satisfied nor
dissatisfied
Somewhat dissatisfied
Very dissatisfied
Not applicable
25%
31.3%
31.3%
Very satisfied
Somewhat satisfied
Neither satisfied nor
dissatisfied
Somewhat dissatisfied
Very dissatisfied
Not applicable12.5%
12.5%
68.8%

Quality of undergraduate students
16 responses
Time available for scholarly work16 responses
Very satisfied
Somewhat satisfied
Neither satisfied nor
dissatisfied
Somewhat dissatisfied
Very dissatisfied
Not applicable
12.5%
31.3%
25%
25%
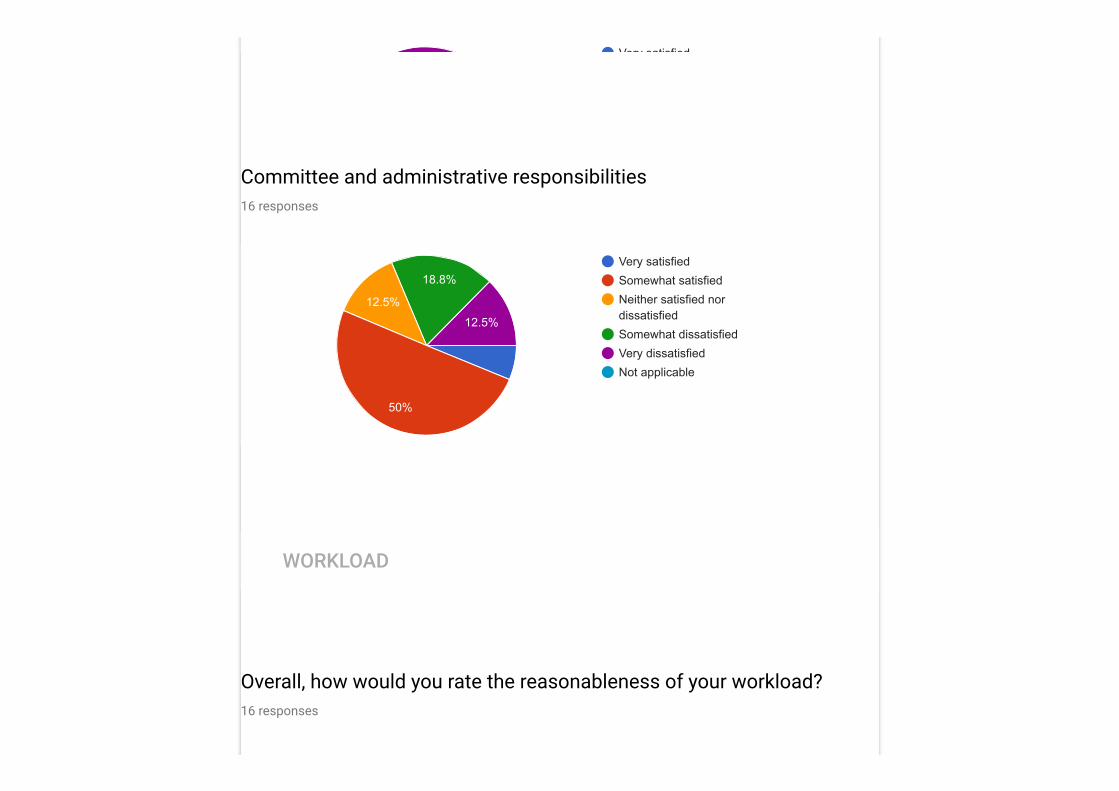
Committee and administrative responsibilities16 responses
WORKLOAD
Overall, how would you rate the reasonableness of your workload?16 responses
Very satisfied
Very satisfied
Somewhat satisfied
Neither satisfied nor
dissatisfied
Somewhat dissatisfied
Very dissatisfied
Not applicable
12.5%
18.8%
12.5%
50%

How many classes (excluding independent studies) did you teachduring the Spring semester of 2018 calendar year?16 responses
Too light
About right
Too heavy31.3%
62.5%
1
2
3
4
5
6
More Than 612.5%
18.8%12.5%
18.8%
31.3%

How many students, total, did you teach in these classes?
16 responses
How many of these classes were close to your research interests?16 responses
20 25 30 40 45 50 60 70 73 75 79
0
1
2
3
4
5
1 (6.3%)1 (6.3%)1 (6.3%)1 (6.3%)
2 (12.5%)2 (12.5%)2 (12.5%)2 (12.5%)
1 (6.3%)1 (6.3%)1 (6.3%)1 (6.3%)1 (6.3%)1 (6.3%)
4 (25%)4 (25%)
1 (6.3%)1 (6.3%)1 (6.3%)1 (6.3%)1 (6.3%)1 (6.3%)

Number of Departmental committees16 responses
Number of Other University-level committees16 responses
1
2
3
More than 3
62.5%
31.3%

Chair of department16 responses
Director of a center, program, or institute16 responses
1
2
3
More than 3
25%
12.5%
Yes
No
12.5%
87.5%

Other administrative capacity (please specify below)16 responses
Yes
No
3 (18.8%)3 (18.8%)
13 (81.3%)13 (81.3%)
0.0 2.5 5.0 7.5 10.0 12.5
Yes
No
5 (31.3%)5 (31.3%)
11 (68.8%)11 (68.8%)

What other administrative position(s) have you been involved in?
6 responses
2.1 In the Spring semester of 2018 academic year, how many of each of thefollowing did you submit?
Papers for publication in peer-reviewed journals16 responses
2 NA none
0
1
2
33 (50%)
1 (16.7%)
2 (33.3%)

Papers for presentation at conferences16 responses
Books: authored16 responses
0
1
2
3
4
5
6
12.5%
12.5%
18.8%
0
1
2
3
4
5
6
7
1/2
18.8%18.8%
56.3%

Books: Edited16 responses
0
1
2
3
4
5
6
7
1/2
93.8%
0
1
2
3
4
5
6
7
1/2
100%

Chapters in books16 responses
Other scholarly or creative works (please specify)2 responses
none
no
Grant proposals16 responses
0
1
2
3
4
5
6
7
1/2
100%
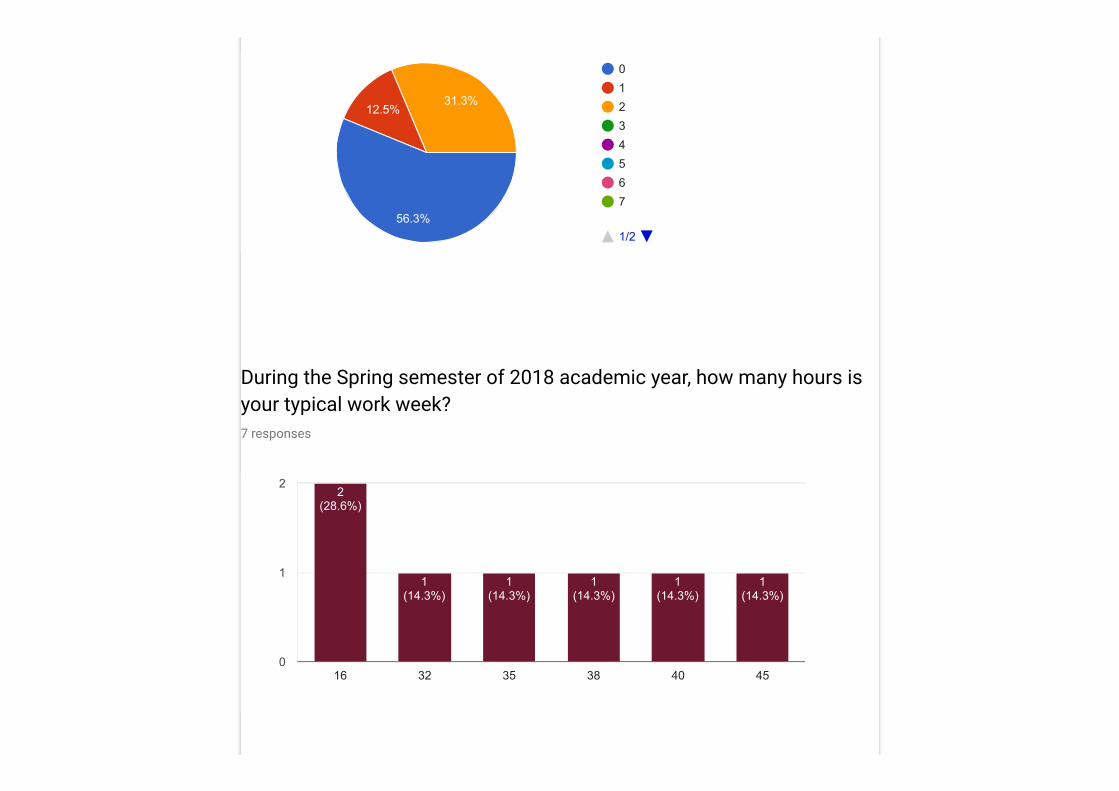
During the Spring semester of 2018 academic year, how many hours isyour typical work week?7 responses
0
1
2
3
4
5
6
7
1/2
31.3%12.5%
56.3%
16 32 35 38 40 45
0
1
22
(28.6%)
1
(14.3%)
1
(14.3%)
1
(14.3%)
1
(14.3%)
1
(14.3%)

2.2 Division of Time: As you think about how you spend your time in the Springsemester of 2018 academic year, how many hours do you spend on each of thefollowing work-related activities in a typical week?
Teaching (including preparing materials for class, lecturing, etc. )16 responses
Meeting or communicating with students outside of class (o�ce hours,advising, supervising research, writing letters of recommendation, etc.)16 responses
less than 6 Hours
69
912
1215
More than 15 Hours
50%
18.8% 18.8%

Scholarship or conducting research (including writing, attendingprofessional meetings, etc.)16 responses
less than 6 Hours
69
912
1215
More than 15 Hours
12.5%50%
31.3%
less than 6 Hours
69
912
1215
More than 15 Hours
18.8%
68.8%
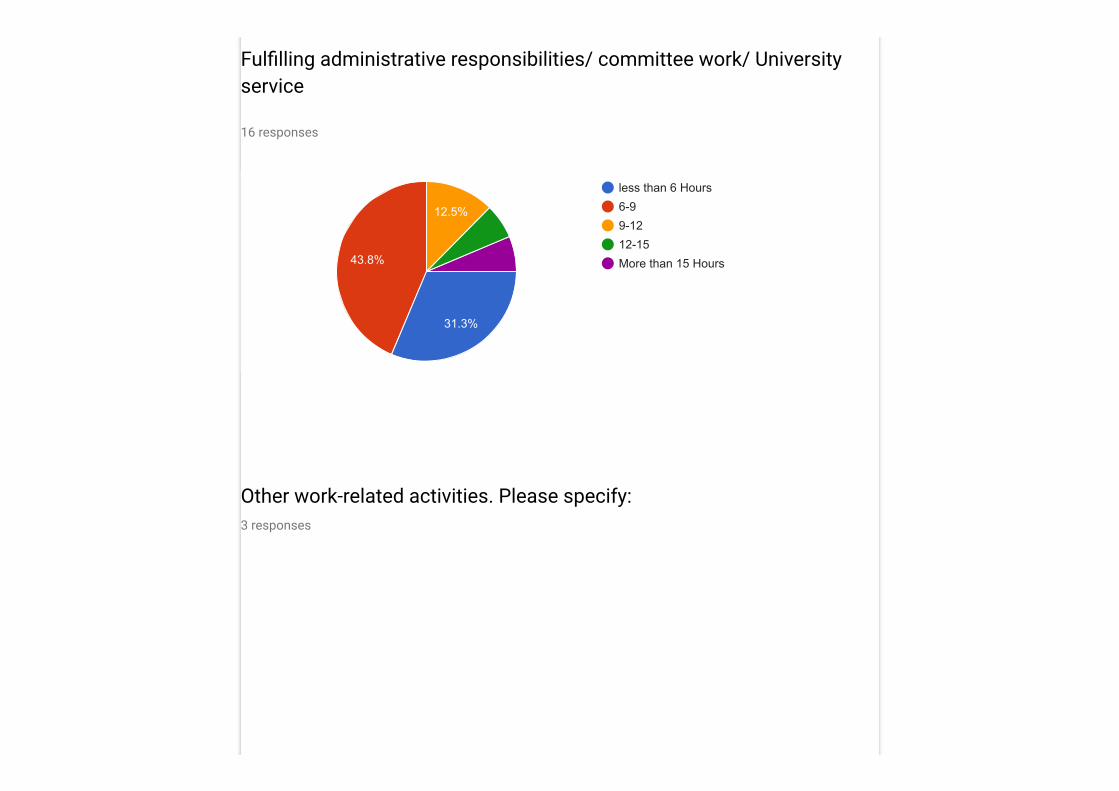
Ful�lling administrative responsibilities/ committee work/ Universityservice
16 responses
Other work-related activities. Please specify:3 responses
less than 6 Hours
69
912
1215
More than 15 Hours
12.5%
43.8%
31.3%
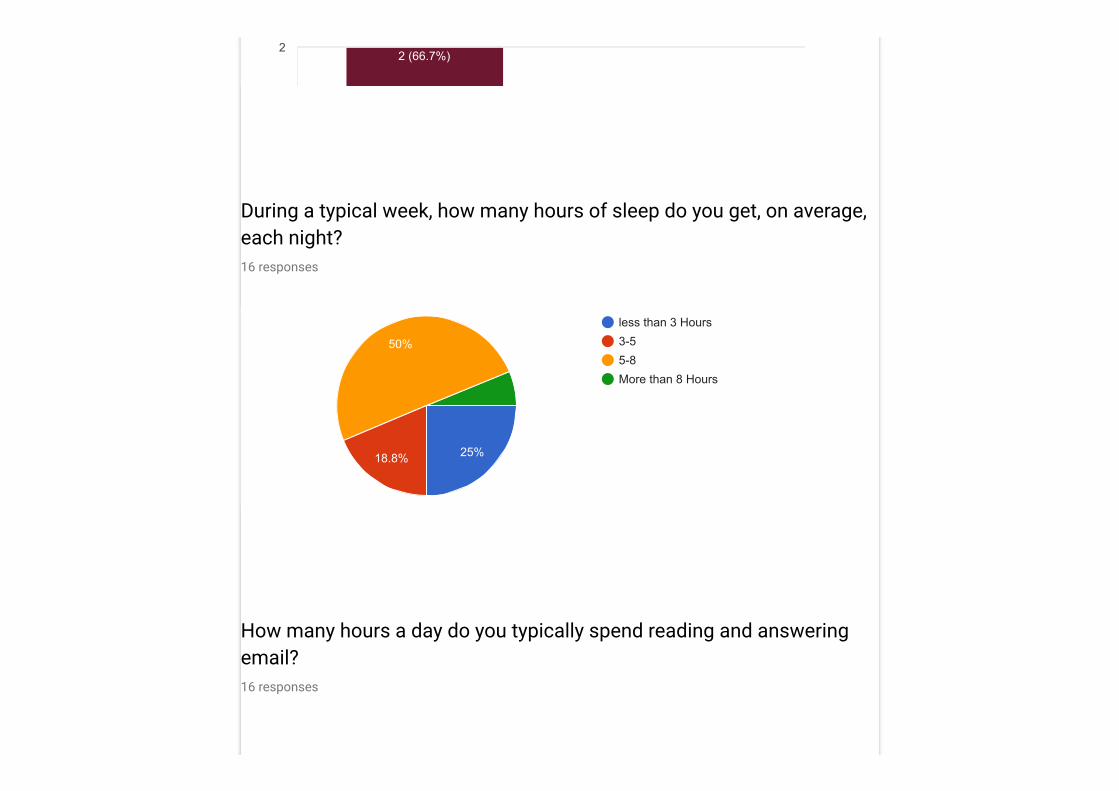
During a typical week, how many hours of sleep do you get, on average,each night?16 responses
How many hours a day do you typically spend reading and answeringemail?16 responses
22 (66.7%)
less than 3 Hours
35
58
More than 8 Hours
50%
18.8%25%

Teaching and Teaching Support
Lecture16 responses
less than 1 Hours
13
35
More than 5 Hours
50%
50%

Discussion16 responses
20% (6)
20 (6)
30 (3)
10%
In-class problems, exercises, writing, etc.16 responses
30 (4)
20% (3)
30% (2)
20 (2)
10% (2)
10
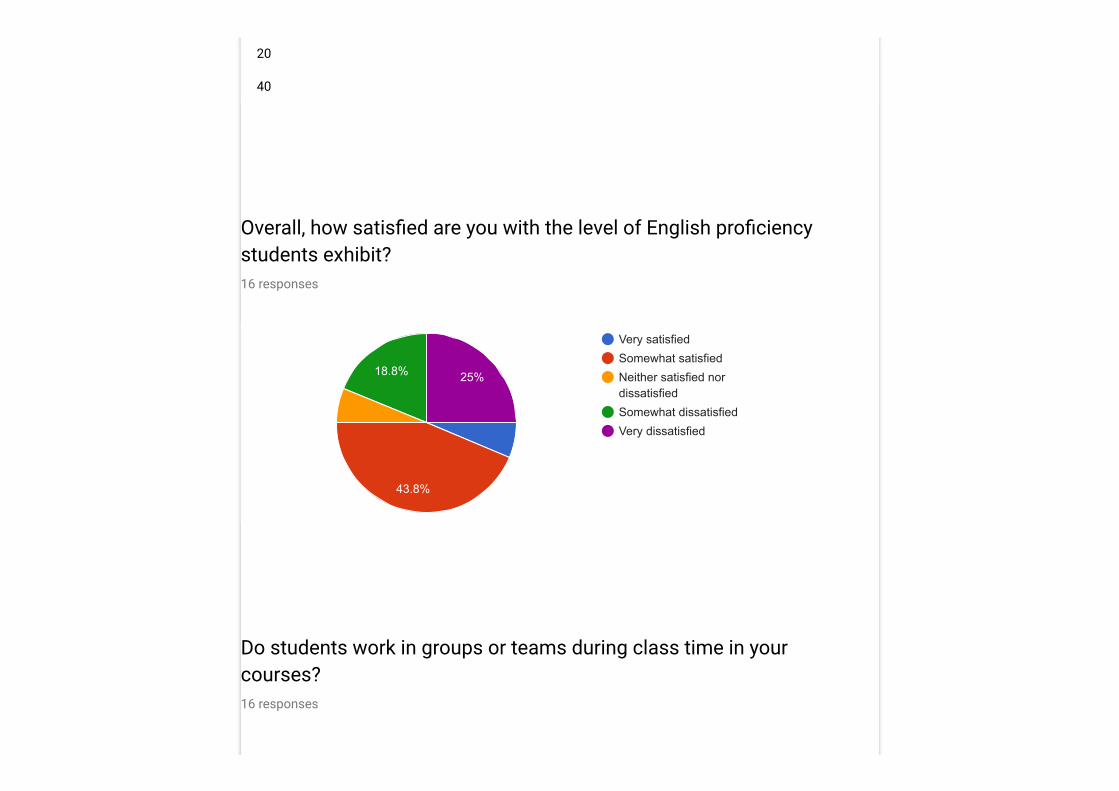
20
40
Overall, how satis�ed are you with the level of English pro�ciencystudents exhibit?16 responses
Do students work in groups or teams during class time in yourcourses?16 responses
Very satisfied
Somewhat satisfied
Neither satisfied nor
dissatisfied
Somewhat dissatisfied
Very dissatisfied
25%18.8%
43.8%

Do you keep up to date with developments in teaching and learning inyour �eld?16 responses
Yes
No37.5%
62.5%
Yes
No
12.5%
87.5%

3.1 Rate your satisfaction with the services provided by the followingdepartments within JU:
E-Learning and Distance Learning16 responses
Admission and Registration16 responses
Very satisfied
Somewhat satisfied
Neither satisfied nor
dissatisfied
Somewhat dissatisfied
Very dissatisfied
Not applicable18.8%
37.5%
31.3%
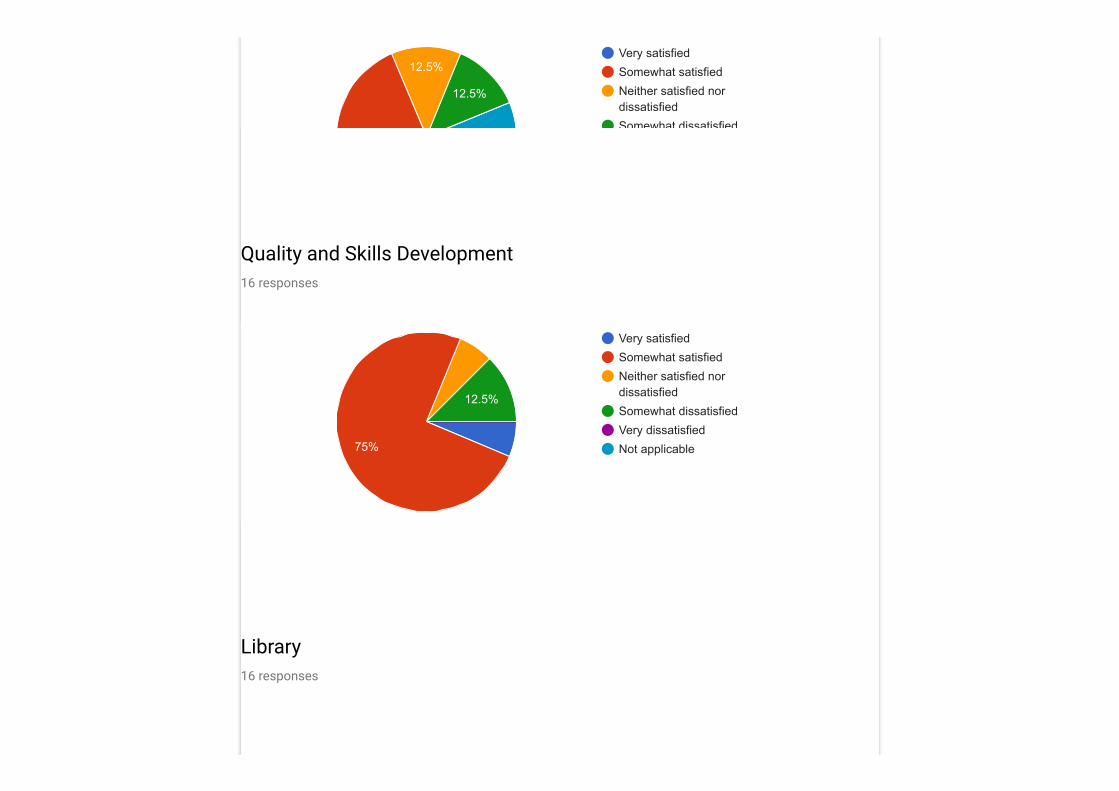
Quality and Skills Development16 responses
Library16 responses
Very satisfied
Somewhat satisfied
Neither satisfied nor
dissatisfied
Somewhat dissatisfied
12.5%
12.5%
Very satisfied
Somewhat satisfied
Neither satisfied nor
dissatisfied
Somewhat dissatisfied
Very dissatisfied
Not applicable
12.5%
75%

Comments:0 responses
No responses yet for this question.
OVERALL ASSESSMENT
Overall, how satis�ed are you being a faculty member at JU?16 responses
Very satisfied
Somewhat satisfied
Neither satisfied nor
dissatisfied
Somewhat dissatisfied
Very dissatisfied
Not applicable
12.5%
12.5%
62.5%

Use a few words to describe the two most important positive aspectsof the current JU environment for you.2 responses
none
good infrastructure/ better weather
Use a few words to describe the two most important negative aspectsof the current JU environment for you.3 responses
no time for conducting research
Very satisfied
Somewhat satisfied
Neither satisfied nor
dissatisfied
Somewhat dissatisfied
Very dissatisfied
Not applicable12.5%
81.3%

The administrative load is dominating the research activities.
stormy sands/ far from the town
If you would like to see improvement in the atmosphere/climate of youracademic unit or more generally at JU, what remedies or strategieswould you suggest?2 responses
none
no
This content is neither created nor endorsed by Google. Report Abuse - Terms of Service - Additional Terms
Forms
Annual Program Report, Ramadan 1438H, June 2017. Page 50
APPENDIX-4

College of Engineering Department of Electrical Engineering
Prepared by: Dr. Ammar Armghan/Dr Omar Mubarak Page 1 of 3
PLO
CEN
20
5
CEN
20
6
CEN
30
6
EE20
1
EE20
2
EE20
3
EE20
5
EE21
3 (Se
c: 35
7)
EE21
3 (Se
c: 35
8)
EE30
0
EE30
1
EE30
2
EE30
5
EE30
6
EE31
2
EE31
7
EE31
9
EE32
0
EE32
1
EE32
2
EE32
6
EE32
8
EE33
5
EE33
6
EE33
7
EE34
0
EE34
1
1.1 43 56 62 71 46 69 60 51 53 49 60 55 59 51
1.2 68 61 67 79 94 71 60 64 69 69 76 56 69 73 60 54
2.1 64 54 72 47 51 57 47 62 43 42 79
2.2 38 33 41 51 60 62 62 63 85 64 44 70 59 57 62 61
2.3 73 55 81 40 68 72 55 69 81 62 49 68
2.4
3.1 38 47 50 50 70 57 100 58 84 58 56 49
3.2 55 75 95 91 100 84
4.1 100 72 79 75 100 61 100 82 69 63 57 53 61 63 60
4.2 77 58 36 70 50 85 100 100 100

College of Engineering Department of Electrical Engineering
Prepared by: Dr. Ammar Armghan/Dr Omar Mubarak Page 2 of 3
PLO
EE34
2
EE35
5
EE35
6
EE40
2
EE41
4
EE41
7
EE41
9
EE42
2
EE42
6
EE42
9
EE43
2
EE44
2
EE44
3
EE44
4
EE44
5
EE44
6
EE44
9
EE45
0
MA
TH
30
2
Average
1.1 84 58 54 66 63 68 75 34 59 59
1.2 46 74 57 73 79 72 53 60 89 69 68
2.1 79 80 66 68 68 77 62 59 62
2.2 80 54 84 35 69 67 71 56 60
2.3 74 57 80 66 80 71 71 79 70 57 67
2.4 72 62 67
3.1 76 100 100 51 74 82 49 77 66
3.2 77 82
4.1 67 85 77 71 82 74 92 97 66 75
4.2 100 100 95 83 88 82