ta–1234: strategy for liaoning north yellow sea regional
TRANSCRIPT

ADB Project Document
TA–1234: Strategy for Liaoning North Yellow Sea Regional Cooperation and Development Technical Report G: Infrastructure Investment Problems and Alternative Financing December L2GM
This report was prepared by Jean Francois Gautrin, under the direction of Ying Qian and Philip Chang. We are grateful to Wang Jin and Zhang Bingnan for implementation support. Special thanks to Edith Joan Nacpil and Zhuang Jian, for comments and insights. Zhifeng Wang provided indispensable research assistance.
Asian Development Bank 4 ADB Avenue, Mandaluyong City GXX2 Metro Manila, Philippines www.adb.org © L2GX by Asian Development Bank April L2GX ISSN L3G3-4X3M (Print), L3G3-4X]X (e-ISSN) Publication Stock No. WPSXXXXXX-X

The views expressed in this paper are those of the authors and do not necessarily reflect the views and policies of the Asian Development Bank (ADB) or its Board of Governors or the governments they represent. ADB does not guarantee the accuracy of the data included in this publication and accepts no responsibility for any consequence of their use. By making any designation of or reference to a particular territory or geographic area, or by using the term “country” in this document, ADB does not intend to make any judgments as to the legal or other status of any territory or area. Note: In this publication, the symbol “$” refers to US dollars. Printed on recycled paper
i
Contents ExecutiveSummary..........................................................................................................iv
I. Introduction...............................................................................................................1
II. Liaoning’sEconomyOverview....................................................................................1A. MacroeconomicPerspective..............................................................................................1B. TheTransportSector..........................................................................................................5C. TheOverviewanditsRelevance.......................................................................................12
III. ThePublic-Private-Partnership(PPP)Model............................................................14A. WhyweneedPPPs...........................................................................................................14B. DefinitionofPPP..............................................................................................................14C. TypesofPPPSchemes......................................................................................................16D. PPPProjects:StagesandProcess......................................................................................21
IV. PPPProjects:GrowthandTrends.............................................................................25A. TheWorldBankPPPDataBank........................................................................................25B. PPPProjectsinChina(CPPPC)..........................................................................................28
V. LiteratureReviewandCaseStudies.........................................................................35A. Introduction.....................................................................................................................35B. LiteratureCommentsonChinesePPPs.............................................................................35C. CaseStudies.....................................................................................................................37
1. General................................................................................................................................372. APPPtollroadinIndonesia................................................................................................383. BridgeBOTinVietnam........................................................................................................404. PPProadprojectinMalaysia..............................................................................................415. PPPPortprojectinColombo(SriLanka).............................................................................436. Autoroute30(Quebec,Canada).........................................................................................447. TheLaibinBOTPowerProject(China)................................................................................458. OtherrelevantexamplesofinfrastructurePPPprojects....................................................48
D. SummaryofaConferenceProceeding..............................................................................50E. Summary.........................................................................................................................55
VI. LessonslearntwhenimplementingPPPprojects......................................................56A. IssuesandBestPractice...................................................................................................56B. ConclusionsforPPPProjectsinLiaoning...........................................................................68
VII. REFERENCES.............................................................................................................71
Figures and Tables
Figure1PublicPrivatePartnershipSpectrum..............................................................17Figure2SchematicofAlternativeRevenueSchemes...................................................68
Table1LiaoningProvinceBasicStatistics(macroeconomics).........................................3Table2LiaoningProvinceBasicStatistics(Transport)...................................................6Table3Ports.....................................................................................................................9Table4GlossaryofPPPTerms......................................................................................15Table5PPPschemesandresponsibilities.....................................................................19

ii
Table6Infrascope2014EIUPPPIndex.........................................................................20Table7ProcessStepsforPPPImplementation............................................................23Table8PPPInvestmentsbysector...............................................................................26Table9PPIInvestmentsbycountry(1993-2016)andfor2015...................................27Table10Public&PrivateInfrastructureInvestments(2010-2014).............................27Table11PPPsinChinabymajorsectors(WorldBank)................................................28Table12PPPprojectsinChina(CPPPC)........................................................................29Table13LiaoningTransportPPPsfromCPPPC.............................................................32Table14DetailsonTransportDemonstrationProjects-Liaoning................................33Table15VFMundertheA-30PSC.................................................................................45Table16PPPProjectRiskAllocationMatrix.................................................................62

iii
Abbreviations ADB–AsianDevelopmentBankASEAN–AssociationofSoutheastAsianNationsCV–CurriculumVitaeDOF–DepartmentofFinanceEA–ExecutingAgencyGHG–greenhousegasIA–ImplementingAgencyICT–informationandcommunicationtechnologyICTI–InternetContent,Technology,andInfrastructureJMEPA-Japan–MongoliaEconomicPartnershipAgreementLCEBDP-LiaoningCoastalEconomicBeltDevelopmentPlanLPDF–LiaoningProvinceDepartmentofFinanceMDGs–MillenniumDevelopmentGoalsMOC-MinistryofCommerceMOFA-MinistryofForeignAffairsNDRC-NationalDevelopmentandReformCommissionNEA–NortheastAsiaNSCP–North-SouthCorridorPlanNSR–NewSilkRoadOBOR–OneBeltOneRoadPFRIL-ProvincialFinancialResearchInstituteinLiaoningPRC–People’sRepublicofChinaRCI–RegionalCooperationandIntegrationSDGS–SustainableDevelopmentGoalsSME–smallandmedium-sizedenterpriseSOE–StateOwnedEnterpriseTA–TechnicalAssistancePlanTIRC-TransportsInternationauxRoutiersConventionWTO–WorldTradeOrganization

iv
Executive Summary
Technical Study 1 is part of a series of technical studies in TA 9036-PRC. Its objective was, as part of the revitalization strategy, to recommend alternative ways of managing and financing infrastructure investments in Liaoning Province to better respond to the prevailing economic situation. This has meant promoting a better use of Public Private Partnership (PPP) financing options. Navigating through available indicators, a picture of the Liaoning economy did emerge. Liaoning’s economy has slowed down but the province does not display signs of being a “rust belt” case. However, a “malaise” persists and, with accumulated public debts, government’s capacity to finance new infrastructures is very limited. Hence there is a need to rely on PPP schemes. The study went through an extensive review of the best international practices of PPP financing. It did highlight all available options and also outline the possible pitfalls, one of them being a wrong allocation of risks when designing the project. Going through available data, a dramatic increase of PPP projects in China was noted as illustrated by the World Bank and the CPPPC databases. Despite this growth, PPP investments constituted only small proportions of fixed investments. Transport projects accounted for approximately 15% of total investments. All transport projects in Liaoning (BOT roads) implied a transfer of a public debt (government) to public enterprises (SOEs) with often government payments or subsidies. An important element of the study consisted in bringing qualitative evidence of international PPP practice. There were three types of qualitative evidence considered. Specific comments by renowned authors on PPP practice in China was first presented. Then, a large part of the section consisted in analyzing case studies across the globe, highlighting successes and problems. Finally, the last part of the section reviewed findings from a recent conference held in Singapore on the 24 to 26th of July 2017, entitled “The 3rd Annual Infrastructure Project Financing” with the emphasis being on innovative financing schemes. The literature review stressed that proper risk allocation was one of the main factor in PPP between success and failure. The analysis of case studies showed the importance of adequate government support throughout all phases of PPP project. This, for instance, was one of the main reason for the success of the Laibin Project in China. The last section of the study provided a detailed guideline of steps and measures to follow for implementing successful PPP projects in Liaoning: a) only implement good and needed projects supported by strong and reliable feasibility studies; b) provide efficient and effective government support; c) be innovative in financing considering alternatives like project bonds and value capture; d) seek guarantee schemes and insurances to minimize risks; e) draft contract agreement covering all aspect of project realization and providing fair risk allocation; f) payment structure should allow for agreed compensation if concessionaire revenues fell below expectations; g) include in contract monitoring performance indicators (KPI).

1
I. Introduction
1. Technical Study 1 is part of a series of technical studies in TA 9036-PRC. Though the technical study stands by itself, it also contributes to the drafting of the ADB RCI for Liaoning. The scope of work of this Technical study has been revised following comments from participants at the workshop on the 31st of May. The main objective of the Technical Study is, as part of the revitalization strategy, to recommend alternative ways of managing and financing infrastructure investments to better respond to the prevailing economic situation. While reviewing financing alternatives, the emphasis is on how to promote the public-private-partnership model (PPP) and, on that account, the study makes a special effort in analyzing the current international best practices. Infrastructures could be of different types; however, the focus here is on transport infrastructures.
II. Liaoning’s Economy Overview
2. The economic situation in Liaoning is complex. It is going through a long-term process of structural adjustment. The section here is a humble attempt to present the highlights of the Liaoning’ economy as they form a background to the core of the present study. Sets of reliable data should usually be required to provide Base Case/Due Diligence analyses. The short review below is based on available official data plus information obtained through the consultant field visit. However, with the past record of official inflated numbers1, some caution is needed while interpreting the numbers. There are three parts in this review: a macroeconomic perspective, a highlight on the transport sector and a conclusion.
A. Macroeconomic Perspective
3. A comprehensive analysis of the Liaoning macroeconomy goes far beyond the objective of this section; therefore, the analysis focuses only on a few key points which help putting the core of the report in perspective.
4. Liaoning Province is the gateway to the Northeast, providing a natural corridor to Jilin, Heilongjiang and part of Inner Mongolia. Northeast China has a long and rich history. Liaoning with the Manchu conquest was the “cradle” of the Qing dynasty. Over the years, Northeast China and Liaoning have been subjected to a series of foreign invasions from Korea, Russia and Japan. Liaoning was one of the first provinces in China to industrialize through Japanese investments almost 100 years ago. After China liberation, industrialization accelerated in the 50’s and in the 60’s. The development of heavy industries in Liaoning was facilitated
1Annualcomparisonshavetobetakenwithcautionasfiguresfrom2011-2014forkeyindicatorshavebeenrecognizedtobeinflatedbyapproximately20%(#TheEconomist)
2
by the presence of large coal, iron and oil deposits in the province. Mega industrial complexes as “state own enterprises” (SOEs) were developed and up until the end of the 70’ Liaoning could account for 70% of the China iron and steel production ranking first among all the provincial economies. These large industrial complexes still flourish throughout the province. The city of Anshan, for instance, has one of the biggest iron and steel complex in China and in the world. The origin of Anshan Steel goes back to 1916 under the Japanese rule. However, the economic dependence on the fortune of mega industrial SOEs, at the turn of the century, became a liability for the development of the Liaoning province.
5. Acknowledging the difficulties faced by provinces depending of the heritage of large heavy industries, the Central Government launched the Northeast China Revitalization Plan in 2004. Later, and after noting some progress, a revised plan was introduced in the 11th 5yr Plan (2006-2010). There is a perception that the situation has deteriorated. In that respect, within the 13th 5-Year Plan, the State Council has approved a strong programme of revitalization of the Northeast pledging investments of 1.6 trillion Yuan on 130 projects.
6. Liaoning Province is greater than South Korea and approximately the size of Cambodia with a population of 44 million and a GDP of approximately RMB 2.9 trillion. The GDP/capita at roughly $ 11,500 is similar to Malaysia and has traditionally been above the China national average of $ 8,500 in 2015. A few available macro indicators are displayed in the table below. Unfortunately, the most recent complete information is from 2015 with figures from 2016 available only for a few indicators.

3
Table1LiaoningProvinceBasicStatistics(macroeconomics)
Item 2005 2010 2014 2015 2016GDP(100millionYuan) 8047 18457 28626 28669 22038CAGR(%) 18.1 11.6 0.2 -20GDP/capita(Yuan) 19064 42187 65192 67955 CAGR(%) 17.2 11.5 4.2 Population(10,000) 4221 4375 4391 4302 CAGR(%) 0.7 0.1 -2 UrbanPopulation 2478 2717 2944 2951.5 Ruralpopulation 1743 1658 1447 1430.9 GovernmentRevenues(RMBMi) 455470 305560 GovernmentExpenditures(RMMi) 319582 448161 Surplus(RMBMi) 135888 -142601 Numberofforeignenterprises 16542 18377 17091 17745 CAGR(%) 2.1 -2 3.8
Fixedassetinvestment(RMBBi) 1,604 2,473 1,917637 .2(a)
CAGR(%) -23 -63.6totalFDI(RMB100million) 128 441 181 97 CAGR(%) -46 InfrastructureInvestment(RMBMi) 383900 339806 CAGR(%) -2.4 Housingstarts(millionm2) 268 212 121 CAGR(%) -15% -43% EmployeesUrbanunits(10,000) 518 665 689.4 Employeesprivatemanufacturing 75 87 95 119.7 Wagebillindex(100previousyear) 113 115 101.6 101.4 RetailSales(RMBBillion) 1,277 1,226CAGR(%) 8.3 -4.0Unemploymentrate(%) 5.6 3.6 3.4 3.4 7.0Unemployed(100,000) 38.9 40.96 46.15 Totalexport($million) 43098 58745 50710 39500(a)CAGR(%) 6.4 -14 -14.4Totalimport($million) 37613 55253 42236 38600CAGR(%) 8 -24 -5.8Note: (a) 3Q of 2016, compared to 3Q(2015): -2.2%; CAGR: compound annual growthrateSource: National Data, China National Bureau of Statistics(website)
LiaoningProvinceandHongKongTradeDevelopmentCouncil(Feb2017);WSJ

4
7. Looking at the indicators above, first, conveys conflicting messages. On the positive side, GDP/capita and retail sales (proxy for consumer demand) do not seem to be affected. Employment is also growing and even surging in private manufacturing enterprises; the wage bill index and the number of foreign enterprises are quite stable. But, there are a few disturbing factors. GDP seems for the first time to have recorded negative growth in 2016 and was only growing at 0.2% in 2015 with preliminary results even more alarming (-17% drop in GDP from 3Q2016 to 3Q2017). Exports and imports have been on a declining trend. The number of unemployed has been rising. There has been a dramatic reduction in the volume of housing starts. Fixed asset investment growth has recently been on a severe decline, affecting more the private sector than the SOEs. There are also confusing reports on FDI with claims that it has dropped than more than 40%. Perhaps one of the most disturbing factors is the volume of outmigration from the rural population estimated to be between 1.6 to 2 million per year in the last few years.
8. Field visits (Shenyang, Anshan, Yingkou and Dandong) as well as private discussions with national consultants, officials and managers of private enterprises in Yingkou have shed some light on the apparent contradictions conveyed by the set of indicators above.
9. Liaoning’s economy has slowed down but the province does not display signs of being a “rust belt” case. In cities visited there were clear signs of wealth with interviewees expressing optimism about the future. The BMW plant in Shenyang is going to a major expansion. And some of the negative figures in 2015 and 2016 may have been due to statistical corrections. This being said, there is no doubt that the Liaoning economy is suffering from a malaise as some facts are quite revealing.
10. There is overcapacity in the steel industry and the shipping industry, just to give a few examples, is running at 50% capacity. The medium size companies more than the large SOEs have been affected with quite a few going bankrupt. The number of registered business dropped in Liaoning from 25,000 to 15,000. Wages are high and many SMEs could not compete and had to close. There is a mismatch between demand and supply in the housing market illustrated by the numerous apartment buildings uncompleted or apparently left as shells in all major cities in the province. The volume of outmigration and the implied brain drain would have severe consequences in the future. It is not easy to understand the sort of “malaise” of the Liaoning’s economy: cultural attitude coming from the legacy of soviet type management? dominant influence of the mega SOEs resisting to adapt to changes in the global market? managing the economy through overcapacity? or a too slow restructuring of the existing industrial structure?

5
11. Margot Schueller (1997) wrote 20 years ago a chapter entitled “Liaoning with the burden of the past” in China’s Provinces in Reform edited by David Goodman. Excerpts of her conclusion are worth quoting as they may still have relevance: “Liaoning’s struggle with the burdens of the past seems to be typical for provinces dominated by a planned economy and state-owned enterprises…Liaoning’s difficulties in adapting to the agenda of economic reform were also due to the centre’s opening policy and the provincial government’s inward-looking strategy, resulting in its rather slow integration into the world market…Liaoning needed a diversification of its industrial structure and a change in the way enterprises were run…the decentralisation of economic decision-making power to lower administrative levels and the competition between localities turned out to play a crucial role for localities’ determination in developing their economies.”
B. The Transport Sector
12. Putting in place high quality transport infrastructures has and is still a key component of the Chinese growth model. And this applies truly to Liaoning. Liaoning is proud to say that the first expressway in China was built between Shenyang and Dalian and to claim that overall, they have the best transport infrastructures. There is currently 4,200 km of expressways in the province with 1/3 of the network being with 6 or 8 lanes. The last expressway was built in 2014 between Dandong and Dalian. Below some broad indicators describing the transport sector are providing below.

6
Table2LiaoningProvinceBasicStatistics(Transport)
Item 2005 2010 2014 2015 2016InfrastructureInvestment(RMBMi) 383900 339806 TransportInvestment(RMBMi) 87778 92032 -FinancedbyCentralGvt(RMBMi) 4058 8660 TotalRailwaynetwork(1,000km) 43 51 58 TotalHighwaynetwork(1,000km) 102 115 120 Expresswaynetwork(1,000km) 3.1 4.2 4.2 Highway1stclass(1,000km) 2.9 3.5 3.6 Totalportthroughput(MT) 679 1048Throughputdomestic(MT) 463 809Throughputinternational(MT) 216 239Totalcontainer(MTEUs) 9.68 18.79TransportedFreight(10,000T) 95558 158484 222138 208562.7 CAGR(%) 10.6 8.8 -6 NationalRailwayFreight(10,000T) 15029 18628 16520 14540.7 CAGR(%) 4.4 -3 -12 HighwayFreight(10,000T) 74799 127361 189174 172000 177000CAGR(%) 11.2 10.4 -9 3Railwayt-km(100millionTKm) 1195 1403 1177 893.6 CAGR(%) 3.3 -4.3 -2.4 Highwayt-km(100millionTkm) 416 1930 3074 2850.7 2936.8CAGR(%) 36 12.3 -7 3NewTruckRegistration(10,000) 3.55 10.3 5.87 4.52 NewcarRegistration(10,000) 14.06 50.2 44.12 62.6 Passengers(10,000) 60400 101525 94172 75039 CAGR(%) 11.1 -2 -20 Passengersrailway(10,000) 9533 13336 12841 12911.8 CAGR(%) 6.9 -1 0.6 Passengershighway(10,000) 49917 87699 80789 60000 59000CAGR(%) 11.9 -2 -26 -1.7Touristarrivals(million) 1.3 3.6 2.6 2.64 CAGR(%) 22.6 -8 0 Tourismrevenues($million) 738 2259 1618 1683 CAGR(%) 25 -8 4 Note:CAGR:compoundannualgrowthrate Source:ChinaNationalBureauofStatistics(website),LiaoningStatisticalBureau LiaoningProvinceandHongKongTradeDevelopmentCouncil(Feb2017)

7
13. Surprisingly total infrastructure investments were lower in 2015 than in 2010 but this was not the case for transport infrastructure investments accounting for approximately 30% of the total. And the vast majority of the transport investments were locally financed with central government only contributing 10% of the total.
14. The railway network has been expanding since 2010. Liaoning has 5 High Speed lines with dedicated passenger tracks: Beijing-Shenyang (808 km), Shenyang – Dalian (377-400 km), Shenyang – Dandong (149 – 208 km) and Shenyang – Fushun (45 – 65 km) and Shenyang – Changchun (300 km). The Shenyang- Dandong line was completed in 2015. The Shenyang – Dalian was completed in 2012 at a cost of RMB 92 300 million ($ 13 billion). There is, in addition, new Super High-Speed Train rail line under construction between Beijing and Shenyang, avoiding Tianjin and costing RMB 124.5 billion expected to be completed in 2019. Despite all these investments passenger traffic has not increased since 2010. Most of the rail traffic is busy moving the 145 million tonnes recorded in 2015 (mostly minerals) but in reality, rail freight volumes have been decreasing since 2010 at an average of 8.5% per year when weighted by distance. The rail traffic in 2015 is less than what it was in 2005.
15. More freight is moving by road instead of rail accounting for 82.5% of the total. Highway freight has been growing at 6 to 7% per year, roughly along national GDP growth rates. Ownership of private vehicles has increased drastically since 2010 and the road network has been expanding. But, somewhat as a contradiction, passenger traffic has been declining, being now 23% lower than in 2010.
16. Port activities have been growing on average at 7.5% per year from 2010 to 2015. Growth has been largely due to the container traffic which has been growing at 11.7% per year and come more from the domestic side than the international. In fact, the growth of international traffic has been a bit sluggish with throughput growing at only 1.7% per year. The table below provide details information on the four key sea ports: Dalian, Yingkou, Dandong and Jinzhou. These 4 ports alone account for 94% of the total provincial port throughput.
17. Dalian Port history goes back to 1898. It has traditionally been the regional hub and the gateway for exports and imports to the whole of Northeast China. There is strong competition to Dalian from Yingkou Port and Dandong port, though Yingkou Port traffic is clearly more domestic. There is a lot of expansion projects and ambition development for Dandong Port. Its geographic location, it is claimed, makes it the most favourable port for Shenyang and the Jilin Province when trading with Japan and the Korean Peninsula.

8
18. Dalian Port and Jinzhou Port are listed companies while Yingkou Port belongs to the municipal government. Dalian Port more than the others has been affected by the recent slow-down in the economy. Nevertheless, port mangers are all optimistic for the future and all have big expansion programmes that they already have started to implement.

9
Table3Ports DalianPort YingkouPort PortofDandong JinzhouPortLocation AttheentranceofBohaiBay OnthewestsideofLiaodong
Bay,210kmfromShenyang,
180kmfromDalian
AtthemouthofYalu
River,facingHuanghai
Sea,includingthreeports:
DandongPort,Langtou
PortandHaiyanghong
Port.
Ontheeastsideof
LiaodongBay,240km
fromShenyang
Rank 7thinChina(tonnageandTEUs),9
th
intheworldfortonnage,14thfor
TEUs
10thlargestinChinaforTEUs,
8thfortotaltonnage
Ownership
Status
PDAisalistedcompanyestablished
in2005withforeignshareholders:
ChinaMerchantsHolding(HKKG)
27%(2016),
YingkouPortCompanyltd
(2003)isownedbyYingkou
MunicipalGovernment;
COSCOhassharesinterminal
Sino-foreignjointventure isalistedcompany
establishedin1998and
1999withdomestic
shareholders:Dalian
PortGroup27%(2017)
Numberof
berths
80 78 42 24
Terminals 2containerterminals,crudeoil
terminal,oreterminal,automobile
terminal,Ro/Roterminalfor
passengersandvehicles,cruise
terminal
9dedicatedterminals:
container,steel,ores,crude-
refinedoil,grain,coal,
vehicles;
containerterminals,
crudeoilterminal,ore
terminal,coalterminal
andgrainterminal
containerterminals,
crudeoilterminal,coal
terminalandgrain
terminal
Shippinglines
connections
88shippingroutes,13direct,
linkedwith160countriesand300
ports
Linkedto140portsand40
countries;4directlines
(Japan,ROK),4feeders:
Tianjin,Dalian,Ningbo,
Shanghai
linkedwithJapan,Korea
andmostdomestic
ports
Itsshippingroutes
connecttoalldomestic
portsandmorethan
100countriesoverAsia,
Europe,Africa,America
andAustralia.

10
MainFunction Majorportservingthewholeof
NortheastChina,70%ofimported
crudeoil,100%ofimported
vehiclesand90%ofinternational
trade
Sea-railconnectionswithdry
ports:Changchun,Jilin,
Harbin;bondedlogisticcentre
(650,000m2)
ExcellentSea-rail
connectionstolink
Mongolia,Koreaand
Japan
ItIstheeasiestaccess
toseaforNortheast
China,Mongoliaand
SiberiaregionofRussia.
Landtransport
connections
80%ofgoodsaremovedbyrailway
(513,000wagonsin2015)
Roadandrailconnections
(Shenyang,Dalian,Harbin)
Expresswayandrail
connections(Shenyang,
Dalian,Harbin,Changchun
andcitiesofInner-
Mongolia)
Goodrailandroad
connectionto
Shenyang,Fuxin,Inner
Mongolia,Tianjinand
Beijing
Total
Throughput
350MTbutwithothersmallports
inarea:430MT
338MT 200MT 100MT
Detailed
Throughput
10MTEUs(200MT)
Auto:480,000(1MT)
GeneralCargo:30MT
Ore:15.5MT
Grain:4MT
Ro/Roveh:10MT
Oilrelated:52.5MT
5.9MTEU(100MT) Grain:10MT
Coal:23MT
TotalRevenues 8.9BillionRMB(7.9in2014) 2.9BillionRMB(2011) 0.6BillionRMB(2016)
Detailed
Revenues
- TEUs: 1.7 Billion - Auto: 1.9 Billion - General Cargo: 374 Mi - Ore: 349 Mi - Grain: 1.36 Bi - Ro/Ro: 129 Mi
Anchored3.97%
Storage5.06%
Loadandunload84.29%
Others6.68%
Ro/ROactivities 3.5millionpassengersand1.07
millionofvehiclesthroughRo/Ro
operations
Ro/RowithBusan
Pastgrowth From2014throughputfell: From2014,throughputrises

11
6%(TEU),12%(ore),8%(general
cargo),34%(grain),5%Ro/Ro;
railwaymovementsdownby18%;
onlyimportofvehicles&crudeoil
increasing
by2.3%,TEUsby5.5%;
YETDZ(1992)has24km2and
150,000ofpopulation.
Prospects PortexpansionofDalian
Taipingwanwithacapacityof300
MTtobecomearegionalhub;
ChinaMerchantHoldingfromHK
KGbecameshareholderin2016;
MOUbetweenYingkouPort
GroupCorporationandOJSC
(RussiaRZD)whereYingkou
takes29%shareinBelyRast
TradeLogisticsCentrein
Moscow
Theberthswillreach102,
andthetotalthroughput
willreach400MTinthe
futureof3-5years,being
theLogisticshubofthe
NortheastAsia.

12
C. The Overview and its Relevance
19. What can be learnt from the brief review of the Liaoning macroeconomics and transport sector review and how it could impact on the scope of the technical study?
20. Navigating through the indicators available and accounting for revisions in some statistic series, a certain picture of the Liaoning economy is emerging. The economy seems to have slow-down in the last two years and went to a significant negative growth in 2016 continuing in 2017. Exports and imports are declining. There have been outflows of population close to 2 million in 2016. This outmigration came largely from rural areas and not so much from the big cities. Housing starts are on a declining trend but this could be correction for the past mismatch between demand and supply. There is conflicting view of FDIs but generally investment growth (mostly in private investments) has been sluggish. There is acknowledged overcapacity in many industries (steel, cement and shipyards). The Provincial government is running a 45% deficit of RMB 143 billion.
21. But, there are also some positive factors. Retail sales are still relatively strong and private vehicle ownership has been growing fast. Container traffic is up (largely from domestic demand) and freight traffic by road is strong. Despite a sluggishness in the total investment figure, transport infrastructure investments display positive growth. As the industrial restructuring is continuing, the economy is slowly moving away from its heavy industry dominance toward more processed manufacturing products. Hence mining production has slow-down reducing rail freight traffic. It is not clear why export growth has been affected. Is it due to a structural problem (competitiveness) or to external factors?
22. Many of the large industrial SOEs are slow to reform and are losing their competitive edge. Liaoning has been somewhat blindly following the economic model of development favoring economic growth (GDP) at all costs. This has led to an overcapacity syndrome which is prevalent in the industrial sector but also in the infrastructure sector including the transport sector. However, picturing a gloomy picture would be wrong. There are many positive factors and investors remain optimistic. The automobile and the defense industries are booming. Liaoning has a unique location in the Bo Hai Bay and the Huang Hai Korean Bay and dispose of a series of large, well equipped modern ports trading with the Korean Peninsula and Japan. The province is the gateway of Northeast China and a natural transit place for Mongolia exports and goods to Europe through the Russian rail connection. And, the location advantage has probably not been exploited fully.

13
In the future twothingsareclear.Firstly,provincialandprobably localgovernmentshaveaccumulatedrunningdeficitsandpublicdebtbyfartoolong.Theircapacitytofinancenewtransport infrastructure investments are very limited and they therefore need thecontribution of the private sector through a series of different possible PPP schemes.SecondlyLiaoninghasalwaysadheredtomodelofdevelopmentwhichwas investmentledwith economic growth supported by infrastructure investments in general and transportinfrastructureinvestmentsinparticular.ThisismaychangeovertimeunderthenewvisionexpressedbyPresidentXiJiPin.However,despitethepresenteconomicsituation,therearemany ongoing or planned transport projects. Fears of public debt getting out of controlmightbe a limiting factor toexpansionprojects in allmodesof transport and this iswhyinnovativefinancingschemesneedtobedevelopedtorespondtoapersistingdemandandat the same time limit the financial exposure of governments. These two above pointsthereforeconstitutethekeyelementsbehindtherationaleofthestudy.

14
III. The Public-Private-Partnership (PPP) Model
A. Why we need PPPs
23. According to the ADB (2017) study on Infrastructure Needs, in Asia, 90% of the infrastructure investments come under public funding. In the ADB study SOEs investments come under public funding. On average SOEs account for 25% of total infrastructure investments being far higher in PRC (50%). Private sector is hesitant to invest in infrastructures as these investments are perceived as bringing low returns.
24. Traditionally public infrastructures were provided directly by government or through affiliated agencies with funding coming generally from annual budgets. With increases pressures on budget and mounting public debts, the provision of public infrastructures through the “conventional method of delivery” has become more and more problematic. Alternative ways of financing and delivery are then needed to be put in place through increased participation of the private sector. This is why Public-Private-Partnership (PPP) models were invented and tested in many countries including China. Adaptive PPP models could then convince the private sector to finance more infrastructures.
B. Definition of PPP
25. There is not a universally accepted definition of PPP and many have been proposed. They all imply a contractual arrangement between public entities and private organizations with the ultimate objective being the provision of services to consumers. A rather comprehensive definition is given by the ADB report on PPP operation guidelines2: “A PPP refers to a contractual arrangement between public (national, state, provincial, or local) and private entities through which the skills, assets, and/or financial resources of each of the public and private sectors are allocated in a complementary manner, thereby sharing the risks and rewards, to seek to provide optimal service delivery and good value to citizens.” Along the same vein, and widely quoted is the World Bank definition3: “PPP refers to a long-term contract between a private party and a government entity for providing a public asset and/or a service in which the private party bears significant risk and management responsibility and remuneration is linked to performance”.
26. There is a vast nomenclature of terms commonly used in any PPP analysis and for sake of clarification they are summarized in the table below.
2“Public–Private PartnershipOperational Plan2012–2020”,ADB2012;3WBPPIAF(2017)providesthatdefinitionaswellasWB(2017)PPPReferenceGuideVersion3.

15
Table4GlossaryofPPPTermsPPPTerm Definition
Affermage Anaffermagecontractissimilartoaconcession,butwithGovernmentresponsibleforcapitalexpenditures;
BondFinancing FinancingofprojectthroughthebondmarketwithProjectSponsor(Investor)issuingbonds;
BOT Build-Operate-Transfer;manyvariants:Build-Own-Operate(BOO)orBOOTandDBOTwithdesignincluded;
BrownfieldProject Refertoprojectonexistingasset;CA ConcessionAgreementConcession Thetermisusedfordifferentpurposesbutbasicallyitmeansthe
grantbyGovernmentofarighttoprovideaserviceortouseanasset;
ConventionalDelivery Referstotraditionalprovisionofinfrastructuresthroughpublicexpenditures
CPPPC ChinaPublicPrivatePartnershipCentreDBOT DesignBuildOperateTransferDebtFinancing Financingthroughborrowingfrombanksinaformofloans;Divestiture Transferorsaletoprivatesectorofapublicasset;EquityFinancing ProjectfinancingthroughissuanceofsharesbyProjectSponsorFee PaymentbyGovernmenttoProjectCompanyforservicesFinancialClosure DatewhenprojectcontractissignedandfinancingisguaranteedFranchise Franchiseisusedtodescribeanarrangementsimilartoeithera
concessionoraleaseoraffermagecontract;GA GuaranteedAgreementGovernmentAvailabilityPayment
GovernmentpaymentforserviceprovidedbyprivatesectorusuallyunderPBC;equivalentto“feepayment”;
Grantor PublicentityInitiatoroftheProject,generallyGovernmentGreenfieldProject NewProjectorNewAssetKPI KeyPerformanceIndicatorsLCYBond LocalCurrencyBondLeaseContract PublicEntity(orGovernment)leasesassettoprivateentityto
allowprovisionofservices;ManagementContract Contractbetweenpublicandprivateentitiestooperatethe
existingasset,usuallyunderPBC;MDB MultiNationalDevelopmentBankMezzanineFinancing HybridofdebtandequityfinancingO&M OperationandManagementContractPBC PerformanceBasedContractPDF ProjectDevelopmentFund(Facility)PFI ProjectFacilityInitiative
PPI PublicPrivateInfrastructurereferstoWorldBankDataBasePPP PublicPrivatePartnershipPPIAF WorldBankPublicPrivateInfrastructureAdvisoryFacility

16
PSC PublicServiceComparatorPSO PublicServiceObligationProjectCompany PrivatesectorentityinchargeoftheprojectProjectSponsor PrivatesectorinvestorontheprojectRiskAllocation MethodofallocationofrisksamongcontractualpartiesROT Rehabilitationofexistingasset/facility(brownfield)-Operate-
TransferShadowBanking Financingoperationsusingnon-bankinstitutions(Insurance,
Trusts,PensionFunds…);SOE StateOwnEnterpriseSPV SpecialProjectVehicleliketheprojectcompanyTOD TransitOrientedDevelopmentTransactionAdvisory Advicesprovidedtosingleorbothpartiesatthetimeof
contractualnegotiationsbyspecializedorganization;UserPay PaymentsbycustomerswhenusingprovidedinfrastructureserviceVFM ValueForMoney;VFManalysisrequiredbeforeproceedingViabilityGapFinancing(VGF)
FormofsubsidyorcompensationpaymentbyGovernmenttoProjectSponsorwhenuserpayrevenueswouldnotcovercosts;
WLCC WholeLifeCycleCosting
C. Types of PPP Schemes
27. Originally PPP schemes were implemented because governments under severe budget constraints were incapable of coping with increasing demands in infrastructures. But the idea of partnership in the provision of infrastructure services goes beyond the simple question of financing. It does introduce new methods of risk sharing between public and private entities. It does also introduce new mechanisms for the delivery of services bringing efficiency gains and in general greater economic benefits to society than delivery under simple private or public responsibility.
28. There is, in fact, a whole variety of possible PPP schemes but by and large the different schemes differ according to the level of private sector participation and whether the asset is publicly or privately owned. Therefore, contractual arrangements between public entities and private sector organizations belong to the main three classes: a) Management and service contracts, b) Lease contracts or Affermage and c) Concession contracts. Private sector participation increases along the above sequence and asset ownership is gradually transferred (temporally or not) from the public entity to the private sector.
29. In the above, only 3 types of PPP schemes were considered, though they all have variants. The first type “Management and Service Contract” refers to the case where a private organization is providing services for a public entity under a

17
performance based contract using an infrastructure owned by the public entity and built under a separate arrangement. The second type, “Lease contract” covers all schemes of “design-build (or not)-operate” where the facility remains in the hands of the public entity but is leased to private operator. The third one under “Concession” 4 name covers all forms of “design-build-operate-transfer” variants where the built facility is temporally owned by the private sector under self-financing or co-financing agreements and is generally transferred back to the public entity at the end of the concession period. The degree of “partnership” and risk sharing varies among and within the three schemes.
30. The different types5of PPPs are presented in the figure below quoted from the ADB PPP Operation Plan 2012-2020. Starting from the lower left of the Figure and going to the upper right shows the PPP types ordered in terms of increased private sector participation in risk allocation and asset ownership and capital investment.
Figure1PublicPrivatePartnershipSpectrum
31. In the three first types (service, management and lease contracts) private sector risk concerns only the operation aspects of the public service; the public entity finances and builds or refurbishes the asset. In a concession, the private-sector party gets the responsibility and the associated risk for constructing and financing a new asset, or modernizing an existing facility. The concessionaire is given the right to operate the facility for a specified period with the public-sector entity regaining ownership at the end of the concession period. A typical concession is a long-term contract with duration ranging from 25 to 30 years and up over 60 years. Under the “concession” typology they are many options, though they all
4Theterm“concession”isherereservedforallthevariantsaroundtheBOTconcept.5ThefiguredistinguishesbetweenServiceandManagementContract,thoughtheyhavethesamecharacteristicsexceptthatservicecontractscouldbeofmuchshorterduration.

18
assume infrastructure construction, financing and temporary asset ownership: Build-operating-Transfer (BOT), Design–Build–Operate-Transfer (DBOT), Build-Own-Operate (BOO).
32. The table below analyzes these key elements for the different broad categories of PPPs highlighting the different responsibilities between the public and private entities.

19
Table5PPPschemesandresponsibilities ManagementContract LeaseContract Concessioncontract Public Private Public Private Public PrivateBuildingofnewasset
N/A N/A Builtbypublicentityunderseparatecontract
Couldbuildassetunderseparatecontract
Noimplication Design&buildassetaspartofconcessioncontract
Provisionofservice
Principal,regulatorandqualitycontrollerthroughKPI
ProvisionthroughPerformancebasedcontract(PBC)
Principal,regulatorandqualitycontrollerthroughannualcontractreview
Fullresponsibilityforprovisionofservice
Regulatorandatintervalsauditingofoutputquality
Fullresponsibilityforprovisionofserviceandassetconstruction
AssetOwnership
Fullyunderpublicentity
Noownership Ownershipremainsunderpublicentity
Assetleasedtocontractorwhoisresponsibleformaintenance
Assetownershiptransferredtopublicentityattheendofconcessionperiod
Temporallyownsassetduringconcessionperiod
Duration 5to10years 10to30years 15to50years
Financing Ifnewasset,internallyfinanced
Noimplicationinassetfinancing
Ifnewasset,internallyfinanced
Noimplicationinoriginalfinancing;paymentofrentalfeeforasset
Rangeofoptions:- Noparticipation;- Participationlimitedto
facilitation;- Co-sharing(equities,
grant,guarantees…)
Rangeofoptions:- Fullyresponsible(bank
loans,bonds,stockequityissuance…);
- Co-sharing
Paymentofservices
ControlpaymentofserviceswithKPIofPBC
FeesreceivedthroughPerformanceBasedcontract
N/A Netrevenuesfromuserfeesafterpaymentofrentalfee
N/A Netrevenuesfromuserfeesafterdeductionofassetmaintenancecosts
Risksharing Contractornotperforming
Contractfeestoolowforprovisionofservices
Serviceinadequate;Ifleaserlosingmoney,mayhavetocompensateorreplacecontractor
Collecteduserfeesnotcoveringnetcosts
Serviceinadequate;financingriskifco-sharingwithprivateorganizations
Collecteduserfeesnotcoveringnetcostsincludingprovisionforreturnoninvestment
Source:Consultant
20
33. PPPs may apply to new infrastructure projects (green field projects) or to existing infrastructure projects (brown field projects) with contracts signed between public and private entities. Public entities would either be: central/national, provincial or local/municipal entities with private entities being usually for-profit organizations with on occasional cases non-profit organizations. Public–private partnerships are generally characterized by six key elements: (i) duration; (ii) asset financing, (iii) life-cycle responsibility and ownership (temporary or permanent); (iii) performance-based returns and user fees; (iv) output and quality of service specification; and (v) risk allocation between public and private sector.
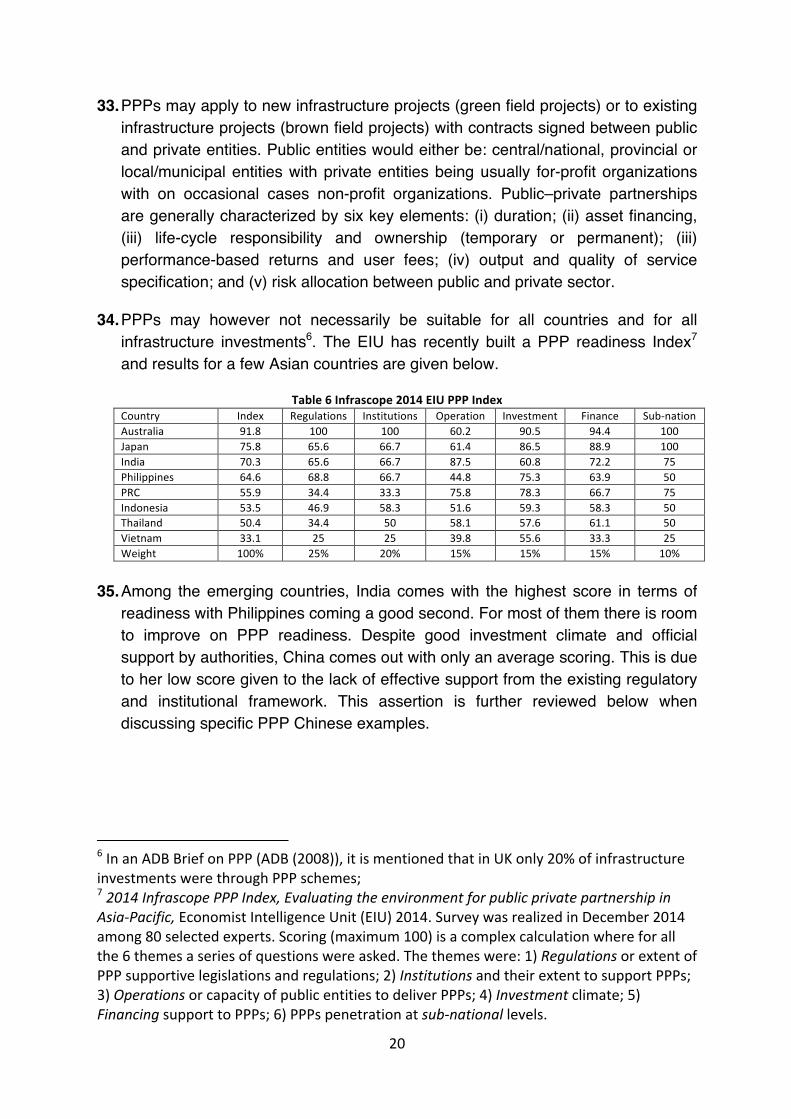
34. PPPs may however not necessarily be suitable for all countries and for all infrastructure investments6. The EIU has recently built a PPP readiness Index7 and results for a few Asian countries are given below.
Table6Infrascope2014EIUPPPIndexCountry Index Regulations Institutions Operation Investment Finance Sub-nationAustralia 91.8 100 100 60.2 90.5 94.4 100Japan 75.8 65.6 66.7 61.4 86.5 88.9 100India 70.3 65.6 66.7 87.5 60.8 72.2 75Philippines 64.6 68.8 66.7 44.8 75.3 63.9 50PRC 55.9 34.4 33.3 75.8 78.3 66.7 75Indonesia 53.5 46.9 58.3 51.6 59.3 58.3 50Thailand 50.4 34.4 50 58.1 57.6 61.1 50Vietnam 33.1 25 25 39.8 55.6 33.3 25Weight 100% 25% 20% 15% 15% 15% 10%
35. Among the emerging countries, India comes with the highest score in terms of
readiness with Philippines coming a good second. For most of them there is room to improve on PPP readiness. Despite good investment climate and official support by authorities, China comes out with only an average scoring. This is due to her low score given to the lack of effective support from the existing regulatory and institutional framework. This assertion is further reviewed below when discussing specific PPP Chinese examples.
6InanADBBriefonPPP(ADB(2008)),itismentionedthatinUKonly20%ofinfrastructureinvestmentswerethroughPPPschemes;72014InfrascopePPPIndex,EvaluatingtheenvironmentforpublicprivatepartnershipinAsia-Pacific,EconomistIntelligenceUnit(EIU)2014.SurveywasrealizedinDecember2014among80selectedexperts.Scoring(maximum100)isacomplexcalculationwhereforallthe6themesaseriesofquestionswereasked.Thethemeswere:1)RegulationsorextentofPPPsupportivelegislationsandregulations;2)InstitutionsandtheirextenttosupportPPPs;3)OperationsorcapacityofpublicentitiestodeliverPPPs;4)Investmentclimate;5)FinancingsupporttoPPPs;6)PPPspenetrationatsub-nationallevels.

21
36. The delivery of public services through PPPs instead of the conventional deliver is expected to bring economic impact benefits and welfare gains if certain conditions are met. A brief list of the conditions to be met is given below:
• Suitable legal and regulatory framework to support PPPs (authorizes the
schemes, ensures good governance in the process, and has capacities to resolve contractual conflicts…);
• Knowledgeable public entities capable of managing PPPs; • Strong financial institutions; • Government willingness to let private investor in PPP contract have a
reasonable return when performance is met; • Sufficient number of experience private sector companies with strong
financial position. 37. Quite a few documents are available for public entities to check on the
justification to go ahead with PPP projects. One of the most often quoted is the “World Bank Check List for Public Private Partnership Projects” (World Bank (2014))8. Another one is the “ADB Public Private Partnership Operation Plan 2012-2020: Realizing the vision for Strategy 2020” (ADB (2012)).
38. Once it has been agreed to follow a PPP approach, the public entity selects the
best option among available PPP schemes. The choice would depend on a series of factors: a) degree of risks that the public entity is prepared to absorb; b) size of the project; c) expected duration of the contract and whether the project is suitable for a “whole life cycle costing” (WLCC); expected profitability of the project; d) sufficient number of companies capable of providing the public service in a satisfactory manner.
D. PPP Projects: Stages and Process
39. PPPs offer many advantages and benefits compared to the conventional way of procuring infrastructures by public entities. The process of delivery of PPPs is however more complex and required more steps. There are many references9 outlining and discussing the various steps of the process of implementation of PPPs. The most complete reference is the World Bank PPP Reference Guide –version 3 (World Bank (2017)).
8Thechecklistlooksat4majorthemes:Politics,Law&Institutions,Economics&Finance,andExecution.Andfromtheanalysisof60casesfromIFCprojects,aseriesofquestionsaredrawntocheckifaprojectisajustifiedPPPcandidate.9Interestingotherreferencesare;ConferencePaper:“InfrastructureProjectFinancing,PublicPrivatePartnership–Day3”,PriceWaterhouseCoopersAdvisoryPte(PWC(2017andthe“MalaysiaPPPGuidelines”(Malaysia(2009.)

22
40. Inspired from existing references, details on the PPP implementation process are presented below. The 12 steps are broken down into two parts, the “Pre-PPP Contract Steps” and the “PPP BOT Contractual Arrangements Steps”. For each of the 12 steps activities to be performed by the public entity (grantor), the private sector entity (the sponsor or investor) and the lenders are detailed.

23
Table7ProcessStepsforPPPImplementationPrePPPContractSteps
S-1 S-2 S-3 S-4 S-5 S-6
Activities/Steps Pipelineofpublic
infrastructure
investmentprojects
Prioritizationof
publicinfrastructure
investments
Selectingprojectsas
potentialcandidatesfor
privatesector
Qualifyinginfrastructure
investmentsforPPP
Prequalificationoffirmson
selectedPPPproject
BiddingProcess
Activitiesofpublic
entity
Compilelistof
potentialprojects
withestimatedcosts
bysectors
Screeningofprojects
andprioritization
accordingtocriteria
inconformitywith
longtermplanning
objectives
Afterfiscalsituation
reviewingandanalysisof
projecttypes,preparelist
ofpotentialcandidatesto
bedevelopedbyprivate
sector
First:areconditionsforPPPs
met?then,carrythePublic
Servicecomparator(PSC)
andtheValueForMoney
(VFM)testanddecideon
theoptimalscheme
AdvertiseoutlineofthePPP
projectandcriteriafor
prequalificationforfirms
Establishtheshortlist,issue
thebiddingdocumentand
fixthebiddingconditions
(varyingaccordingtothe
selectedPPPscheme)and
thebiddingdate
Activitiesof
privatesector
entity
Gettingawareof
potentialprojects,
estimatedcostsand
firmcompetition
Followthe
prioritizationprocess
andaskfor
transparencyinthe
process
Governmentmayconsult
privatesectoroninterest
todevelopsometypeof
projects
WiththelistofpossiblePPP
projects(andtheirscheme)
firmssendEOIsanddraw
preliminarybusinessmodels
Prequalificationdocuments
include:preliminaryFS,
businessplan;financialplan
basedondiscussionswith
financeinstitutions
Bidder’scostingisaccording
toWLCCandinclude
expectedrevenueschedule;
bidincludesproposed
business&financialplan
Activitiesof
Lenders
LendersawareofPPP
projectsonthemarket
Meetingswithpotential
biddersonlendingconditions
Conditionalfinancial
agreementswithbidders
PPPBOTContractualArrangementsSteps S-7 S-8 S-9 S-10 S-11 S-12
Activities/Steps Preparationforcontract
bythepresumedbid
winner
ConfirmationofFinancialPlan
forpresumedwinner
ContractualNegotiationand
signingofPPPagreement
Procurement
(constructionor
rehabilitationofasset)
Operation Transfer
Activitiesofpublic
entity
Selectwinnerbasedon
leastcostifconditions
aremet;contract
preparation
MonitorFinancialplanandon
occasionstakeequityorcost
coverage
Contractincludes:cost(WLCC),
performancerequirements,
paymentmechanisms,dispute
&terminationresolution;risk
allocation;financialclosure
Monitorsatisfactory
deliveryofasset
constructionthrough
dedicatedKPIs
MonitorSPVoperation
performance&enforce
contractualobligations
onpaymentmechanisms
Atendofconcession
ofcontractduration,
Grantorgetsbacknewasset
Activitiesof
privatesector
entity
WinnersetupSPVas
projectcompanyandprepareagreements
withsub-contractors
Confirmdetailsoftheplan:
commercialloans?Ownfirm
equity,GVtparticipation,
bonds?
Oncecompletingnegotiations,
SPVsignedcontractwithpublic
entityandwithfinancial
institutions&sub-contractors
SPVthroughsub-
contractorsrealizethe
agreedasset
construction
SPVwithsub-contractors
provideasagreedO&M
andgetpaymentsfrom
Grantor&userpay
Transferofassetto
Grantor&closeaccounting
Activitiesof
Lenders
AlldetailsoftheFinancialplan
tobeironoutwithinstitutions
Financialinstitutionssigned
agreementwithSPV
Monitorloan
withdrawalsand
repayments
Monitorloan
withdrawalsand
repayments
Financialinstitutions
involvedinfinal
accountsclosure

24
41. For the public entity, the most complex steps are S-4, S-6 and S-9. Firstly, in S-4, assuming infrastructure projects submitted are all goods and economically justifiable, government has to decide if it constitutes a valid PPP projects. There are tools available to help the decision like the Public Service Comparator (PSC) and the Value for Money (VFM) calculation. They consist in comparing the cost of construction of the asset and the delivery of services under conventional delivery and under PPP. Of course, calculations are based on broad estimates since contractual arrangements with a future investor are still unknown. When it comes to the bidding process (S-6) government or the public entity have to be able to specify the payment mechanism to the private sector investor and the length of the concession offered. The payment mechanisms are of three types: a government availability payment, a user pay scheme (tolls/fares) or a mixed solution referred as a viability gap financing where government compensates the investor for shortcomings in the user pay scheme. After completing the negotiations, the public entity would sign the concession or BOT agreement with the project company (SPV) which has been specially established by the investor/sponsor. Besides the condition mentioned above, the contract would contain the KPIs used by the public entity to monitor the progress and the performance of the project company and the sub-contractors in the construction and operation phases.
APPPapproachisalsoatransferorareallocationoftherisksfromthepublictotheprivatesector entity. Throughout all the steps (from S-5 to S-12) the investor/sponsor, whilepreparing for thedeliveryof the infrastructureandaccompanyingservices,would takeallthemeasures tomitigate the risks now allocated to him. Themeasureswould be: hiringreliable sub-contractors,monitoring closely any cost escalation in construction andO&M,negotiatewithpublicentitycontractconditionsprotectingagainstmajornegativechangesin demand, negotiate reasonable financing conditions, getting clear understanding onconditionsandscheduleofpaymentfrompublicentity.Laterinthereportwhenanalyzingthe lessons learntfromPPPcasestudiesandexperience,thefocuswouldbeagainonthekey issues which were briefly reviewed here: Justifying PPP approach, Risk Allocation,Financing Options and Mechanisms of payment. The above text has presented anelaborationofhowPPPareexpectedtoworkideally.Itisbelievedthatsuchdescriptionofthe best international practice of PPP would help Liaoning Province in developing moreeffectiveschemes.

25
IV. PPP Projects: Growth and Trends
A. The World Bank PPP Data Bank
42. With sustained growth in infrastructure demands and worldwide common government budget constraints, countries turned to PPPs throughout most of the 1990s. During that time there were massive commitments to the approach. In 1990, the World Bank established the on line “Public Private Infrastructure” (PPI) data base10 to monitor levels of activity in PPP projects. PPPs grew steadily from $7 billion in 1991 to $68 billion in 1997. As a consequence of the Asian financial crisis (1997- 1998), there was a period of contraction with PPP investments reaching a bottom of $18 11 billion in 2002. Sustained growth in the global economy in the mid-2000s brought a renewed growth in PPP investments culminating in 2012 to $154 billion. Interesting enough, the 2008-2009 global financial crisis had no negative impacts as governments invested massively in public infrastructures to soften the impact of the financial crisis. Since 2012, the volume of PPP investment has been on a slow decline reaching $ 70 billion in 2016. However, cumulative PPP investments reached $ 1,432 billion in 2016 for a total of 5,847 projects. Some aggregate numbers from the data base are given below
§ 10Thedatabaserecordscontractualarrangementsforpublicinfrastructureprojectsinlow-andmiddle-incomecountries(asclassifiedbytheWorldBank)thathavereachedfinancialclosure,inwhichprivatepartiesassumeoperating risks (https://ppi.worldbank.org/). The period covered is 1991-2016. Data are provided bygovernment organizations from 139 countries. The sectors covered are: transport (airports, railways, roadsand ports), energy (electricity), ICT andwater and sewage. The data base is interactive on line and allowsmultiplecombinations.11InthePPIdatabase,notallprojectsarePPP.ThefigureshererefertoPPPprojectsexclusively.

26
Table8PPPInvestmentsbysector
3 I 3 I
5 A C .. $) ) ,* $**) , 0 2 I ( $ ( . 8I .-$,0, , * 9I ).)$-00 (0 9 P ( $ 0) .
I , 0$ ). * ),$), *- 0 64 *,$ - ) , - ( *
A I .-$- ( , * ($0 ) 0 I ($ *)$,. - $ *
7I A1 A A C A A IN BI 0 :IN A1 886 I 3 E A
6 A A (00 %) (- 3 I
6 A A ) (-3 I
:A I
43. The energy sector and in particular the electricity has traditionally been the dominant sector in PPP with the transport sector being a strong number two. In the transport sector, PPPs in roads get the larger share. And this distribution seems to have been quite stable over the years, since similar results can be found in 2016 when compared with the cumulative figures of 1993-2016.
44. Cumulative investments can be displayed by country (see table below). Not
surprising, China and India come on the top of the list. However, in India, PPP projects were on average on larger scale than in China ($ 380 million compared to $ 113 million). The large economies of Southeast Asia are well represented, though they have more cancelation than China and India (23% for Malaysia). In the past China’s involvement in PPP projects was limited and not commensurate to the size of its economy. Things are however changing rapidly with China showing a far higher degree of PPP projects in the last years (2015-2016) with 70 new projects for a total investment of $ 11.8 billion.
45. Also, very noticeable, in 2015 Indonesia and the Philippines continue to display strong PPP involvement scoring on the top of the list. As of 2015, Myanmar is slowly getting more involved with PPP projects. Of course, the nature of PPP large projects is such that you should not expect regularity in the yearly sequencing.

27
Table9PPIInvestmentsbycountry(1993-2016)andfor2015
2 -$ * , *$ %0D % % - $ %% ,2 K BN %% * %, %% - , %*7D LL BN % - %- %% -*5 RN %$ * -- % *:D % - % %* %%
B I , % *, $,3 S DN * % $%, , $ $4 K 718 $ %$ ,-$ $ $S B N - -, $ $
0 I K % -*- $ $5R I M - %- $ % $$
:K $$* ,%*%- %$ %, -,
2 BN IB NI K
$%0KP MR
9KPM B KM 772 1 NB
6PI BM KCLMK B N
2 BN IB NI K
BN IB NB B
%-- $%*
6PI BM KCLMK B N
46. From the above table, PPP and private sector investments seem to be a sizable number but, in reality they are small numbers compared to public investments. According to a recent ADB publication (“Meeting Asia’s Infrastructure Needs”, ADB 2017), the public sector provides over 90% of the Asian developing countries overall infrastructure investments. This amounts to 5.1% of GDP, far above the 0.4% of GDP coming from the private sector. Public infrastructure investment rates vary across sub regions and economies (see table below). For instance, in East Asia, public investments in infrastructure account for 6.3% of GDP with private sector investments remaining low at 0.1% of GDP. On the other hand, public sector infrastructure investment is less dominant in South Asia, with the private sector accounting for a significant higher share of investments (2.1% of GDP). In Southeast Asia, the Pacific, and Central Asia, public sector shares in infrastructure investment are definitely smaller than in East Asia.
Table10Public&PrivateInfrastructureInvestments(2010-2014)
6I CB 6 B : 9E :C8EI A :G GB:6: B B %
D :C GB: %8EI A GB: %1:G GB: %3D ED GB: %3D B: % %67 %
8EI , 4 BD GB: G 3D :G I I 5 G 0.
7 BEDE 206

28
47. Except for PRC and to a lesser degree India, total infrastructure investments (public and private) remain a small share of GDP. There are large gaps between the investments needed to sustain the projected economic growth and the observed current levels.
48. The World Bank’s Private Participation in Infrastructure Database (PPI) provides a historical perspective of PPP projects for the period 1990 to 2016. It is however important to remember that the World Bank data base only includes only “signed” infrastructure projects exclusively from the private sector excluding PPP projects implicating SOEs. Therefore, it is not surprising that the total volume of PPP activities in China is grossly underestimated. Of courses many of the PPPs recorded in the 1990-2016 period would either be completed by now or cancelled. Comparisons with the CPPPC data bank, given below, are however severely limited.
49. Cumulative figures for China using PPPI data bank is given below. From 1990 and up to now, close to 1,400 projects were recorded for a total investment of $ 155 billion. Of these numbers 623 projects were in energy (electricity and natural gas) accounting for 37% of the total investment. There were 259 transport projects (airports, ports, roads and railways) accounting for 46% of total PPP investments. During the 1990 to 2016 period, the growth of PPP projects has never been a smooth trend with a continuous series of peaks and drops.
Table11PPPsinChinabymajorsectors(WorldBank)
3 C C & & $ 51: % %, 6 N 4 &$$ $ C I &$ & ,& % ,
7I % $& 8I % $ , % , 8 C P %, && ,,& % ,
9 P B , %& & :I % % % %$$ $
9IN . I 0 E 7775 2 0 E
9 I
6NG IAID
5 GGC CI
7 BIA I
B. PPP Projects in China (CPPPC)
50. As noted, Public-private partnerships (PPPs) have been developing in China since the very late 1980s and the early 1990s, but the first true BOT project was the Laibin-B Power Plant in 1997 (see below). But, Thierot&Dominguez (2015) argues that it was only in 2014 that a landmark in the development of PPP was achieved. In November 2013 the Third Plenum of the 18th Communist Party of

29
China emphasized the decisive role that market forces should play in the Chinese economy and this was confirmed by the Party’s actions in 2014 through a series of circulars, regulations, declarations and debates. And, in 2014, as an outcome of the 21st APEC Finance Ministry, the China Public Private Partnership Center (CPPPC) was established within the Ministry of Finance. CPPPC plays an important role in China in terms of research, consultancy, monitoring and advisory services to local governments.
51. One of the major achievements of CPPC has been the establishment of a comprehensive data bank on PPP projects continuously updated and with reports every quarter. There was (March 2017) 12,300 PPP projects in the data banks for a cumulative value of RMB 14.6 trillion; and projects have been increasing rapidly reaching 14,220 for RMB 17.8 trillion in September 2017. Of the September number 6,778 were recorded in the management database implying that they have met the VFM criteria and among that number 2,388 were “commercially closed”. The table below gives data for the end of December 2016 and end of September 2017.
Table12PPPprojectsinChina(CPPPC)
888 8:2 * ,888 8:2 4 A AI A ,,M IN M 888M IN M 888 A AI A ,* *
8 8M A N ,* * ,8 8M A A AI A * ,5 I IC , * , 5 I IC A AI A * 7 0
5 I IC M IN M 888 7 0 7 0 7 05 I IC 8 8M A N 7 0 7 05 I IC 8 8M A 4 A AI A * 7 0 7 0
7 A. 7 0. I Q A I DA RA N A/ M A N PI AM A AI I; PM A. 28882 LP M AM S MA M N D . RRR" " MC AI 9P M AM S ," D
7P AM B8M A N
4IQAN AI:61 I
7P AM B8M A N
4IQAN AI:61 I
3A A AM * ;A A AM
52. The number of PPP projects in the data base has increased rapidly12. There were 6,997 projects with planned investments of RMB 8.1 trillion in December 2015; but, the numbers were respectively 11,260 and RMB 13.5 trillion in December 2016 before reaching 12,300 and RMB 14.6 trillion in March 2017 and 14,220 with RMB 17.8 trillion in September 2017. Now, of course there is a big difference
12TheCPPPCdatabankincludesallsectors.SectorslikeEducationandHealtharerepresented.

30
between projects listed in the data bank and projects implemented (signed and being implemented). Many of the listed projects never get implemented. For instance, in December 2016, there were 1,375 transport projects and these projects were at the following stages of implementation: 779 at the identification stage, 270 at the preparation stage, 140 at the procurement stage and 186 at the signing stage ready for construction.
53. The CPPPC monitors closely a series of PPP pilot projects serving as demonstration projects for provincial projects. In December 2016, there were 743 pilot projects of which 363 have been signed for a value of RMB 938 billion. In September 2017, 572 projects were implemented for RMB 1.5 trillion. It is not clear how projects are selected to become pilot projects, but their chance of becoming a “commercially close” and constructed project is definitely far higher. PPPs are now proposed from a large variety of sectors but the dominance are in “municipal engineering” and “transport” (accounting for close to 60%). A few provinces in China seem to attract most of the volume of the PPPs (whether they are demonstration projects or not) with the ones toping up the list being Guizou, Shandong, Xinjiang and Inner Mongolia.
54. An important question when studying PPPs in China is to assess the degree of private sector participation as opposed to SOEs. According to Kim & Hong (2017), SOEs accounted for 74% of PPPs in 2016 but this is disputed by Bloomberg (February 2017), quoting a report from Fitch, stating that 55% of the PPP pilot projects were SOEs. CPPC displays that type of information only for demonstration projects. Of the total of projects, 55% were from SOEs while 37% were from the local private sector. However, when it comes to implemented projects, the situation is slightly different with 46% of the projects being from the private sector. The usual perception is that revenues to finance the investment should be generated from “user pay” schemes. In reality this accounts in September 2017 for 20% of the projects and 33% of the investments. The other revenue schemes are either direct government payments (40% of projects and 35% of total investments) or a mixed solution of user pay and subsidy (40% of the projects and 32% of the investments).
55. Of particular importance in the table above are the statistics for Liaoning Province. With 117 PPP projects under implementation, Liaoning accounts for only 4% of the PPPs whether in number or in value. But the representation of the province among demonstration projects is even lower being 3% of the total. And only 8% of the Liaoning projects get implemented compared to an average of 14%. It is in reality the whole Northeast Region of China which is grossly underrepresented. There are 39 transport projects in Liaoning and this includes projects in Dalian.

31
56. The table below provides details on the 39 PPP transport projects listed in the CPPPC data base. Projects have been sorted out according to their degree of implementation. Potential investments are large reaching RMB 85 billion though many may not be implemented. Of the 39 projects, 25 were still at the identification stage (RMB 44.3 billion); 6 were at the preparation stage (RMB 35.1 billion); 2 were at the procurement stage (RMB 2.5 billion) and 6 had reached implementation stage (RMB 3.0 billion). Close to 60% of the projects are roads (urban roads, arterial roads and expressways). There are only 5 rail projects (urban and provincial rail lines) but they account for 40% of the total registered investments. All major cities in Liaoning have transport PPP projects with greater frequencies for Benxi, Shenyang, Liaoyang and Panjin.

32
Table13LiaoningTransportPPPsfromCPPPC
FourthRingExpresswayinShenyang(QipanshanSection) Shenyang 170.66 Identification 5/4/2015 N/A N/A
SupportingFacilitiesandBuildingsonTwoSidesofFaku-TongliaoRailway Shenyang 10000.00 Identification 7/6/2015 BOO 20ShenbeiNewArea-Faku-Kangping(45km)&Diaobingshan-Faku-Zhangwu(39km)ArterialRoad Shenyang 1500.00 Identification 7/6/2015 BOT 15AnshanCityRingRailwayReconstructionProject(35km) Anshan 1600.00 Identification 3/3/2015 N/A N/ANewTerminal,SupportingFacilitiesandAirportRoadforAnshanAirport Anshan 300.00 Identification 3/3/2015 N/A N/ANo.202ArterialRoadReconstructionProject Fushun 500.00 Identification 6/1/2015 N/A N/AXiaoqiaoLineLianzhoulingSectionTertiaryRoad(13km) Benxi 50.00 Identification 12/1/2015 N/A N/A
BenhuanLineSanjialingTunnelandApproachRoadReconstructionProject Benxi 80.00 Identification 12/1/2015 N/A N/AShenhuanLineWolong-ChengjiaSectionReconstructionProject(ArterialRoad) Benxi 220.00 Identification 12/1/2015 N/A N/ABenkuanLineBeidalingTunnelandApproachRoadConstructionProject Benxi 205.00 Identification 12/1/2015 N/A N/AShenbenLineXiangzishan-BinheExtensionProjectPhaseI Benxi 747.00 Identification 7/7/2015 N/A N/AXiangyangshanOverpassandGushanBridgeProject Benxi 150.00 Identification 12/1/2015 N/A N/AXiaobaoOverpassReconstructionProject Benxi 80.00 Identification 12/1/2015 N/A N/A
DanhuoLine(Qianjin-NanfenSection)RoadReconstructionandExtension Benxi 280.00 Identification 12/1/2015 N/A N/ABenxiTrafficandLogisticsCenter Benxi 60.00 Identification 12/1/2015 N/A N/APedestrianOverpass Benxi 2.10 Identification 12/1/2015 N/A N/AShenhuanLineSanjiazi-WolongSectionReconstructionProject(ArterialRoad) Benxi 210.00 Identification 12/1/2015 N/A N/AYingkouEconomicandTechnologicalDevelopmentZoneTrafficCenter(GasStation,OilStation,ParkingLot,LogisticsCenter,etc) Yingkou 600.00 Identification 11/2/2015 N/A N/AFuxinShitongLogisticsCenter Fuxin 467.00 Identification 7/14/2015 N/A N/APanyingLineExtensionProject(43.89km) Panjin 1200.00 Identification 5/26/2015 TOT 10PanjinUrbanRailTransitSystemProject(61.1km) Panjin 11000.00 Identification 7/3/2015 TOT 10PanyingRailwayProject(89.5km) Panjin 12600.00 Identification 7/14/2015 TOT 10KaiyuanBinshuiNewCityDaqingRiverBridgeConstructionProject(Length:640m,Width:52m) Tieling 300.00 Identification 8/28/2013 N/A N/AHuludaoPortRailwayProject(16.5km) Huludao 1400.00 Identification 1/1/2016 N/A N/AHuludaoSixthLineInnercityReconstructionProject(SecondaryRoad,4.305km) Huludao 75.00 Identification 1/1/2016 N/A N/AHaihangRoad(ExpressWay)ConstructionProject Huludao 484.00 Identification 1/1/2016 N/A N/ASubTotal 44280.76ModernTramcarProjectinHunnanNewArea(ShenyangSouthRailwayStationExtensionSection) Shenyang 191.00 Implementation 3/1/2015 BOT 10ShenbenLineXiangzishan-BinheExtensionProjectPhaseII(ArterialRoad,17.7km) Benxi 688.53 Implementation 12/1/2015 BOT 12JibenLine,XiaoqiaoLineandBenkuanLineConstructionandExtensionProject Benxi 319.15 Implementation 1/1/2016 BOT 12ShenyingLineDongjingling-JingertunSectionProject(CityRingRoadNorthSection,ArterialRoad,5.367km) Liaoyang 538.04 Implementation 12/1/2015 BOT 12LiaoyangPublicTransitHub(Northsideoftrainstation) Liaoyang 959.11 Implementation 5/31/2015 BOT 15DiaobingshanHighwayConnectionProject(SecondaryRoad,11.2km) Diaobingshan256.63 Implementation 3/27/2015 BOT 12SubTotal 2952.46EcologicalCorridorConstructionProjectinFakuCounty Shenyang 689.69 Preparation 1/1/2016 BOT 10ShenyingLineQingyangdaokou-GuyushuSectionProject(CityRingRoadEastSection,ArterialRoad,7.4km) Liaoyang 361.93 Preparation 1/4/2016 BOT 12ShenyingLineBeiwangjia-GuyushuSectionProject(CityRingRoadSouthSection,ArterialRoad,14.6km) Liaoyang 2416.00 Preparation 1/4/2016 BOT 12ImprovementandIntegrationofPublicTransitSystem Panjin 430.00 Preparation 5/13/2015 Others 26ZhonghuaRoad Panjin 1505.18 Preparation 5/28/2015 TOT 10DalianBaySeaCrossingExpressWay(Bridge+ArtificialIsland+Tunnel,25.05km) Dalian 29669.31 Preparation 6/29/2016 BOT 30SubTotal 35072.11ShenbeiNewAreaGeneralAirport Shenyang 230.00 Procurement 3/2/2015 BOT 10RoadNetworkatWestofCity(RingRoadWestSectionandOtherRoads) Liaoyang 2244.90 Procurement 1/4/2016 Others 12SubTotal 2474.90GrandTotal 79377.43
OperationMode
TermofContract(Yr)
Name Location Investment(MillionRMB)
DegreeofProcessing
ReleaseDate

33
57. The table below gives further information on the 6 PPP transport projects in Liaoning Province which are under implementation. A total of 4 out of 6 of the projects consist in constructing and maintaining for a relatively short duration (10-12 years) arterial roads. In each case the local government (grantor) signed a BOT agreement with a project company where the majority shareholder is a highway construction SOE. In four of the BOT cases, a city government transport operation is a shareholder of the Project Company and therefore share with the SOE the construction and operating risk. The roads BOTs do not get user payments and instead they receive annual payments from the local governments. The payments would have been negotiated at the time of the contract agreement but no details are available. Their values are of course key elements in terms of understanding the risk allocation between the parties.
58. The two other BOTs are quite different, being a tramway project in Shenyang and a transit hub in Liaoyang. In both cases they would get payments from user charges. But this type of payment would not be sufficient and local governments would add subsidies to the user charge revenues. Like above it is a typical debt transfer with the amount of subsidy being the key element in the risk allocation.
Table14DetailsonTransportDemonstrationProjects-LiaoningName Cost
RMBMill.
CompositionofProjectCompany(RMBSocialCapital)
LoanRMBMill.
Mode PaymentMechanism
ModernTramcarProjectinHunnanNewArea(Shenyang)
190 ShenyangHunnanModern*TransportationCoLtd(15Mil.)NorthCarConstructionandEngineeringCoLtd:SOE(60Mil)
114i:5.6%
BOT10yrs
Tramfares,otherrevenueSubsidy:40.5/yrFIRR:2.8%
ShenbenXiangzishan-BinheExtension(17kmRdinBenxi)
688.5 LiaoningWuzhouHighwayEngineeringCoLtd:SOE(150Mil)
538.5i:5.5%
BOT12yrs
BenxiGvtpays105Mil/yrProfit:7.8%
Jiben,XiaoqiaoandBenkuanExtension(17.7kmBenxi)
319.1 LiaoningWuzhouHighwayEngineeringCoLtd:SOE(70Mil)
249.1i:5.5%
BOT12yrs
BenxiGvtpays48.7Mil/yrProfit:7.7%
ShenyingDongjinglingJingertunRingRoad(5.367kmLiaoyang)
538 BureauofTransportationofLiaoyang*(32.3Mil)LiaoningWuzhouHighwayEngineeringCoLtd:SOE(75.3Mil)
430.4i:7%
BOT12yrs
LiaoyangGvtmakeyearlypayments(nodetails)
LiaoyangPublicTransitHub(Northsideoftrainstation)
959.1 LiaoyangCityBusCoLtd*(100Mil)ChinaThirdMetallurgicalGroup&ZhongyeJianxininvestment&fundmanagement(Beijing)(187.7Mil)
671.4i:7%
BOT15yrs
Usercharges,Subsidy;non-profit,lowrevenue
DiaobingshanHighwayConnectionroad(11.2km)
256.6 ShenyangHunnanModernTransportationCoLtd*(30Mil)DiaobingshanJiaxinRoadConstructionandManagementCoLtd:SOE(36Mil)
190.6 BOT10yrs
TransportBur.ofDiaobingshanPay301.5Mil10yrsoperationFIRR:8%
Note:*governmentcorporationorbureauSource:CPPPCWebsite

34
Insummary,itshouldbenotedthattherehasbeenadramaticincreaseofPPPprojectsin China as illustrated by theWorld Bank and the CPPPC databases. The CPPC, as amonitoringbodyoftheMinistryofFinance,wasestablishedin2014andthenumberofprojectshasacceleratedevenmoresince,showingexponentialgrowthinthelastyears(200%increasefrom2016-9to2017-9).Despitethisgrowth,PPPinvestmentsconstituteasmallproportionofthetotalfixedinvestments(4to5%)andtherearelargeprovincialdisparities with a few provinces taking the “lion share” and others like from theNortheast China lagging behind. There is private sector participation in projects but,governmenthasadominantpresence.Themajorityoftheprojectsbenefit indifferentways fromgovernment payments and financingwith user payprojects accounting foronly30%.SOEsandStateholdingsaccount for60%of theprojects.Transportprojectsaccountforapproximately15%with30%ofthetotalinvestments.AlltransportprojectsinLiaoning(mostlyBOTroads)implyatransferofapublicdebt(government)topublicenterprises (SOEs) with often government payments or subsidies. Incurred debt wassubstantialasloansrepresentbetween75to80%ofthetotal investmentcostwithnoattractiveinterestcharges.Thecontractdurationof10to15yearsseemstobeonthelowsideforthattypeofoperation.

35
V. Literature Review and Case Studies
A. Introduction
59. The objective of this section is to bring qualitative evidence of PPP practice in order to help a more effective development and management of PPP projects in Liaoning Province. There are three types of qualitative evidence considered. Specific comments of PPPs in China are presented first. Then, a large part of the section consists in analyzing case studies across the globe, highlighting successes and problems. Finally, the last part of the section reviews the messages and findings from a recent conference held in Singapore on the 24 to 26th of July 2017, entitled “The 3rd Annual Infrastructure Project Financing”.
B. Literature Comments on Chinese PPPs
60. There is a strong consensus on the main characteristics, problems and issues faced by PPPs. It is clear that in China, the two drivers of PPP projects have been the high level of debt among local governments and the growing demand of infrastructure development. Thierot & Dominguez (2015) have argued that the control measures imposed by the central government forced the local governments to consider PPP solutions. Since 1994, local governments have been forbidden to borrow money directly. They therefore opted for financial vehicles in order to skirt this restriction to raise funds for infrastructure and public service projects. However, these “shadow banking” activities generated growing volumes of debts not accounted in the local government balance sheets (CNY 18 Trillion or 1/3 of GDP in 2013). In this context, the National Budget Law was amended in August 2014 authorizing local governments to raise debt and issue bonds and banning borrowing through local government financial vehicles and capping the amount of debt local governments can take on. Debt could be raised only for non- profit public project investments. For other infrastructure projects with potential cash returns, such as public utilities and transportation, the use of PPPs was encouraged.
61. Kim & Hong (2017) noted that the bulk of PPP funding in China comes from government entities since government entities include all the SOEs. The authors conclude that the dependency on government entities means that the market may be underestimating the government’s debt level and inflation risk. They also remind that local governments aren’t allowed to spend more than 10 percent of their annual general budget on PPPs.
62. According to Fitch (2017) argues that PPPs will be the main financing model used by local governments for infrastructure investments up to 2020, with SOEs playing a leading role. The use of the PPP model could help to smooth out local

36
government budgets as projects using the model tend to have much longer life cycles than those using the traditional build-transfer model It noted however that in China the PPP model is still in its early stages of development with SOEs emerging as the main partners to local governments, rather than private investors, because returns on most PPP projects, typically 5 to 8 percent, are not appealing to private investors, but are acceptable for SOEs, which enjoy lower financing costs.
63. Despite the rapid growth in PPP projects, Chinese authorities are quite aware that major challenges remain to make them successful as stated by Premier Li Keqiang and reported by Xinhua (2016). He said that while the country has seen much progress in promoting PPP in the past two years, a variety of institutional barriers still hinder PPP development and China needs to address problems in overlapping government functions, inadequate policies and legislations. Taxation policy should be tailored to better suit the financing system of PPP and solid research and preparations are required prior to the implementation of PPP projects. Another major issue with PPP in China he noted is the potential imbalance in market access by SOEs and private investors. Though the doors of PPP participation are open to both, local governments prefer to work with SOEs rather than private firms. There is apparently no regulation or legislation that could address all the major issues with PPP projects in China. In June 2016, MOF announced that draft legislation on PPP has been circulated within related departments for consultation.
64. Sugden (ADB 2016) argues in a Working Paper for the establishment in PRC of a Project Development Fund (PDF) to assist the rapid expansion of PPP projects in China. Based on the experience of PDF in other Asian countries, the author proposes a PDF model for PRC. PDF is much more than managing a fund with withdrawal rules; it is the provision of services to PPPs through all the necessary phases required before they get implemented by the successful bidders. The use of a dedicated PDF instead of conventional preparation mechanisms can be justified for two reasons: a) PPPs involved many more steps and is more costly than conventional financing; b) preparation for PPPs required a vast array of expertise which is often not available in government implementing agencies (IA). The recent approach to PPPs being applied in the PRC is new to most local government agencies. These agencies face capacity constraints that will make it difficult to develop sound PPPs. The model PDF proposed by the author was designed to engage, guide, and pay for the advisors needed by PPPs. PDF is a “professional facilitator” to the IA and would support 6 stages of project development: verification of project readiness, preparation of a prefeasibility study and the preliminary implementation plan, preparation of a feasibility study and implementation plan, preparation for procurement inclusive of the drafting of

37
PPP agreements, conduct of prequalification and bidding including evaluation, and the negotiation and completion of agreements. Financial projections of the Chinese “market” concluded that a $20 million PDF could complete around 35 projects over its first 6 years of operation that generate as much as $6 billion in investment.
C. Case Studies
1. General
65. Liaoning Province has a limited experience with the implementation of PPP projects. Analyzing successful and not so successful PPP projects, preferably in transport, could provide a source of valuable experience to be used in future planning and development of infrastructure projects in the province.
66. The analysis should however proceed in theory from an in-depth evaluation of typical selected PPP projects. The objective of the evaluation would be to give a fair assessment of the PPP project. And this means to record and analyze all the steps taken to implement a PPP project and they are schematized below in a time sequential order:
• How the project was first identified? • What was the process followed to get government/public entity agreement
to proceed with a PPP scheme? • What have been the public organizations involved in the process of
authorization? • What are the supporting legislations, regulations and policies to implement
PPP projects? • What was the process followed to hire consultants to carry out feasibility
studies? • If feasibility studies were conducted, do they give a clear recommendation
to proceed with PPP schemes? • How? And who gave the authorization in the government/public entity to
go ahead with PPP and to decide on which type of PPP models? • To choose the contractor, did a fair and transparent bidding took place? • What are the details of the contractual agreement between the public
organization and the private entity? • What are the financing components of the PPP projects? Is the public
entity participating in the financing? • What is the allocation of risks and responsibilities between the public and
the private entities?
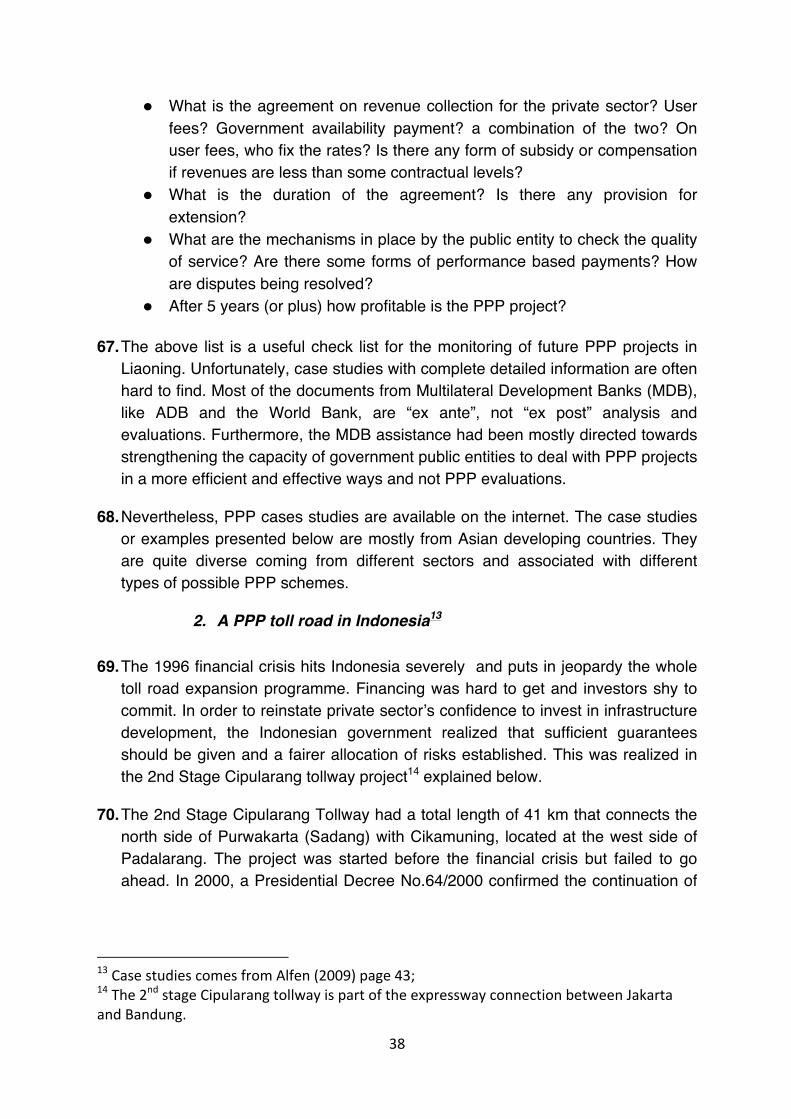
38
• What is the agreement on revenue collection for the private sector? User fees? Government availability payment? a combination of the two? On user fees, who fix the rates? Is there any form of subsidy or compensation if revenues are less than some contractual levels?
• What is the duration of the agreement? Is there any provision for extension?
• What are the mechanisms in place by the public entity to check the quality of service? Are there some forms of performance based payments? How are disputes being resolved?
• After 5 years (or plus) how profitable is the PPP project?
67. The above list is a useful check list for the monitoring of future PPP projects in Liaoning. Unfortunately, case studies with complete detailed information are often hard to find. Most of the documents from Multilateral Development Banks (MDB), like ADB and the World Bank, are “ex ante”, not “ex post” analysis and evaluations. Furthermore, the MDB assistance had been mostly directed towards strengthening the capacity of government public entities to deal with PPP projects in a more efficient and effective ways and not PPP evaluations.
68. Nevertheless, PPP cases studies are available on the internet. The case studies or examples presented below are mostly from Asian developing countries. They are quite diverse coming from different sectors and associated with different types of possible PPP schemes.
2. A PPP toll road in Indonesia13 69. The 1996 financial crisis hits Indonesia severely and puts in jeopardy the whole
toll road expansion programme. Financing was hard to get and investors shy to commit. In order to reinstate private sector’s confidence to invest in infrastructure development, the Indonesian government realized that sufficient guarantees should be given and a fairer allocation of risks established. This was realized in the 2nd Stage Cipularang tollway project14 explained below.
70. The 2nd Stage Cipularang Tollway had a total length of 41 km that connects the north side of Purwakarta (Sadang) with Cikamuning, located at the west side of Padalarang. The project was started before the financial crisis but failed to go ahead. In 2000, a Presidential Decree No.64/2000 confirmed the continuation of
13CasestudiescomesfromAlfen(2009)page43;14The2ndstageCipularangtollwayispartoftheexpresswayconnectionbetweenJakartaandBandung.

39
this project by appointing PT. Jasa Marga15 as the main developer for a built cost of $ 184 million. PT. Jasa Marga developed a new financial strategy ensuring financial security for the project as well as maintaining the company’s cash flow. This was the Contractor’s Pre-Finance (CPF) system. In this system, several local banks agreed with PT. Jasa Marga to finance the project by providing loans to contractors and applying a fixed interest rate for the whole loan and payback period. The agreement was then formulated in the form of a Letter of Comfort which was then used by contractors to request loans from these banks.
71. Risk allocation was however different for P.T. Jasa Marga and contractors. With respect to the government and P.T. Jasa Marga, major risks were limited capital and unpredicted project site condition. The capital risk was adequately covered through the innovative CPF financing method. As for the latter, the highly unpredicted geological site condition resulted in improper design.
72. As for the private sector, risk concerns were: government’s lack of support and inaccurate information, design modification, land acquisition, late decision making, and competence of supervision staff and likelihood of low profit. Government’s lack of support was the insufficient warranty given to contractors when negotiating loans with financial institutions. The Letter of Comfort stated that mentioned contractors have been appointed to construct the project and that Jasa Marga would return the loans after being handed the project at the agreed fixed interest rate (11%). However, the letter did not guarantee that loans to contractors would be at the same rate than Jasa Marga. When such situation occurred, the government would only acknowledge the 11% interest rate while the exceeded amount of interest rate had to be supported by contractors. Inaccurate soil investigations render the original design inadequate causing delays and extra costs to contractors since new land areas had to be acquired by government. Although contractors had submitted their claim on cost increases to PT. Jasa Marga, there was no guarantee of full acknowledgement resulting in likely decrease of the contractor’s profit.
73. In 2015, income from Cipularang Toll Road has reached Rp1.2 billion (around $100,000) per day for Jasa Marga, a 100% increase compared to the income during the toll road’s first operation in 200516. The present toll road project described here was not a typical private sector BOT. The owner/investor was a state-owned enterprise (government has 70% of the share) and the risk allocation was not fair. Jasa Marga had a blank responsibility of developing toll highways in
15P.T.JasaMargaisaSOEwithexclusivegovernmentrightstodeveloptollroadsinIndonesia.16Ray(2016)page111

40
Indonesia but there were not contractual arrangements between government and Jasa Marga as is normally the case for PPP projects.
3. Bridge BOT in Vietnam17 74. The PPP project concerns the Yen Lenh Bridge BOT. This 2.23 km bridge is
located in the northern part of Vietnam across the Hong (Red) River connecting the Hung Yen province with Ha Nam province. This is a case of a not successful PPP project.
75. The construction took approximately 23 months being 10 months ahead of schedule. Although the project was developed under a BOT scheme, ½ of the cost was funded by the State and the local governments (+ US$11 million), while Thang Long Construction Corporation and the Civil Engineering Construction Corporation No.4, forming the concession, covered the remaining cost. The company was granted a 17 years of concession period. The Vietnam Development and Investment Bank provided investment fund and financial guarantee towards the concessionaire and the Vietnam Insurance Company provided insurance premium to guarantee the construction. The Yen Lenh BOT Company was established by the concessionaire in 2003 to operate the project.
76. Toll revenues are very sensitive to accurate traffic forecast. The bridge was supposed to attract, as an alternative route, heavy vehicle traffic between Haiphong Port and Hanoi as well as traffic from Haiphong Port to Central Vietnam provinces. The bridge did not reduce the congestion in the Hanoi area and traffic from Haiphong Port did not materialize because Central Vietnam provinces have their own ports. Therefore, traffic forecast was overestimated and the project was not able to reach its predicted revenue stated in its feasibility study and serving its intended purpose. Since there was significant difference between estimated and actual traffic flow, the concessionaire suffered cash flow losses of 3,657 million VND, equal to 20% revenue loss in 2005. This revenue shortfall affected the company debt servicing and resulting in shortage of fund for the operation and maintenance of the facility. Even though the feasibility study in this project was carried out by the concession company, it was heavily controlled and influenced by officials of the Ministry of Transport. To ensure easy approval
17Theanalysisisextractedfrom“GovernanceissuesintheYenLenhBridgeBotproject”byProf.Dr.StephenOgunlanaandMartinusP.Abednego,AsianInstituteofTechnology,fromAlfen(2009)page63.

41
by the superiors, optimistic figures were systematically used resulting in inaccurate planning and design.
77. Besides wrong forecasting many other factors contributed to the failure of the project. Inflation during the construction period was far above what has been anticipated. A 5% inflation rate was determined for this project but in 2004 and 2005 inflation was running at 9.5% and 8.3% respectively. The duration of the concession at 17 years calculated with a discount rate of 6% was too short to be beneficial to the concessionaire. The selected discount rate was below the inflation rate. Also, like it is common in Vietnam, tolls were selected and fixed without any studies on price elasticity of demand providing no flexibility to attract more traffic by accommodating the tolls. Poor management of the concessionaire was another cause of cost overrun.
78. Due to accumulated problems and losses, the consortium holding the concession then had no choice but to request government to convert this previously BOT project into Build-Transfer (BT) type project. The project failed but this could have been avoided with a more thorough feasibility study, a better demand analysis, more effective planning, coordination and good governance between the concessionaire and public authorities.
4. PPP road project in Malaysia 79. Reviewing the experience of Malaysia in PPP toll highways is interesting for quite
a few reasons. Since 1990, all new highways have been tolled and constructed under PPP schemes. There are now approximately 20 PPP toll roads operating in Malaysia. A second reason is that analyzing PPP road projects has been the subject of extensive number of papers in learned journals. Thirdly the PPP arrangement in Malaysia has quite unique features.
80. Malaysia embarked on highway privatization back in 1985 selecting the Build-Operate-Transfer (BOT) method where government delegates to the private sector the role of developing highways giving them toll charging rights. Based on this method, Malaysia succeeded in building 30 highways forming complete network of 1600 kilometres.
81. The analysis below concerns the North-South Expressway (NSE). It was the first PPP project; it remains the most ambitious project and had unique features. Most of the information comes from Karim (2012).
82. Back in 1977, government had decided to build an expressway from the North Border of Malaysia to the South Border to accommodate growing traffic volume facing increasing congestion on the Federal Route number 1. Between 1980 and

42
1985, the Malaysian Highway Authority (MHA) managed to build 366 km or 41% out of the proposed 823 km of the expressway for a RM 3.2 billion cost. After the 1985 recession, government felt that they could not continue the construction under direct public funding but needed to privatize its completion. The call for tender in February 1986 included construction of the unfinished portion and operating the whole highway including the finished section. Three proposals were received: from Pilecon Engineering Berhad, Pembinaan Hashbudin and United Engineers Malaysia Sdn Bhd (UEM).
83. It has been widely accepted that the project was allocated to UEM for political reasons. UEM had no construction experience; the company was established for the purpose of the bidding and their bid was the highest and the most financially demanding from government support. The concession awarded to UEM was for a period of 30 years and included the right to operate and charge toll from the users of the highway portion already completed before and the obligation to complete the expressway in 7 years. UEM set up a separate company, PLUS which became the concessionaire. Financing of the project was the following: RM 2.086 billion of commercial loans from 45 local banks, RM 500 million of equity and RM 1.65 billion loan from government. There was a recognized lack of transparency in the bidding process and in the financing scheme.
84. In a typical PPP project most of the risks are transferred to the private sector. In the case of the NSE, almost all risks were mitigated in favour of the concessionaire often through government interventions. Risks from contractor performance were almost all taken care of since it was decided to split the construction contract into 44 packages and since contractors were given the option to receive payments in a form of equity participation or stock shares of PLUS which was listed on the Stock Exchange. There was also a government guarantee against sudden increases of the loan interest rates. But the most obvious and quite unique risk mitigation in favour of the concessionaire concerned the protection of toll revenues. Firstly, toll rates were tied up with a price index to cushion inflation pressures and secondly toll revenues were guaranteed with compensation paid by government if traffic would be lower than an agreed forecasted figure18. Despite all the above the project had a 70% cost overrun.
85. The politically linked concessionaire managed to win the tender for the NSE without construction experience and with a bid higher than the two other bidders. The whole process of concessionaire selection, financing plan and contractual obligation of the private sector was not transparent. All measures were put in place to mitigate the risks faced by the concessionaire. The construction cost/km
18Thisappliedforthefirst17yearsoftheconcessionperiod.

43
by the PPP on its portion constructed was higher than the cost/km originally built by the public entity. On balance, it is hard to believe that the NSE PPP was a frank economic success. However, once completed, the NSE was considered by most to be a success; traffic was growing fast and the expressway has become a major transport and economic corridor. Furthermore, Ervina Alfan (2010) conducted a study of toll highways in Malaysia and concluded that: “private financing in the provision of infrastructure projects is costlier as opposed to public financing and a substantial amount of financial support from the government is required in implementing the PPP projects “.
5. PPP Port project in Colombo (Sri Lanka)19
86. This PPP analysis of the QEQ container terminal in Colombo Port has some interesting features. It was the first major infrastructure PPP project in Sri Lanka. It was a definite success to the extent that the current planned expansion of Colombo Port would also follow a PPP scheme with similar characteristics that the one described below.
87. Colombo Port, the major port in Sri Lanka, is a natural transhipment hub for the entire South Asian Region. It has been operative under the Ports Authority of Sri Lanka (SLPA), a statuary body functioning under the Ministry of Ports and Highways. In the late 90’s, the port had four terminals, namely, Jaya Container Terminal (JCT), Unity Container Terminal, Bandaranaike Quay, and Queen Elizabeth Quay (QEQ) and there were reaching capacity. Colombo Port was slowly losing its competitive edge and therefore the government decided in 1999 to create a public-private partnership (PPP), the South Asia Gateway Terminals (SAGT) with the mandate to improve, expand, operate and manage the QEQ terminal through a 30-year BOT concession.
88. The share composition of SAGT was quite unique, being composed of 7 different types of partners: i) SLPA 15%, ii) Sri Lanka investment group 26.25%, iii) ADB 7.5%, iv) IFC 7.5%, v) CDC 7.5%, vi) foreign shipping company 10%, vii) foreign port management companies 26.25%. This distribution provided a good balance between Sri Lanka operators and investors, foreign operators and international developing banks. Total cost of the project was estimated at $ 240 million but ended under budget at $227.4 million. The project was financed based on a debt-to- equity ratio of 60:40. Loans came from World Bank, ADB and CDC; all MDB took equity as well as members of SAGT.
19MostofthematerialforthisPPPcomesfrom“ColomboSriLanka,CaseStudyofportexpansion”,SpecialUnitforSouth-SouthCooperation,UNDPNovember2012.

44
89. The loans were held and paid by the SAGT partnership. Investments in the SAGT partnership for the different types of partners ranged from $3.6 million to $25.2 million. Of the $92.4 million in equity, the public sector provided $32.4 million and the private sector, $60 million.
90. There were originally three objectives in setting up the PPP in the Port of Colombo. The first one was to increase capacity in the container terminal from 250,000 TEUs to 1.1 million TEUs. The second one was to increase port efficiency with specific improvements in gantry moves/hour and average waiting time at berth. The third one was a demonstration effect showing that PPP was working in Sri Lanka and that, after the civil war, the port of Colombo was ready to take challenges and expand. Construction for the expansion of QEQ was completed in August of 2003. With the expansion of quay length, throughput was expected to increase by an average of 50 % a year until 2005 to reach 1.1 million TEUs per year. Actual throughput grew steadily from 200,186 TEUs in 2000 to 899,720 TEUs in 2004, an increase of 350 per cent and 1.25 million TEUs in 2006. Gross gantry moves/hour rose from 12 in 1998 to 30 in 2003 with waiting time at berth being reduced from 6.9 hours in 1997 to 0.9 in 2003. The contract required the SAGT partnership to offer employment to all 500 workers at QEQ. If those workers chose not to join the SAGT partnership, the Port Authority was required to employ them. SAGT created jobs to offset the workers who chose to remain with SLPA. The company did retain the number of 500 employees as before the PPP; however even if the TEU traffic increased by 350 per cent.
91. As said before the PPP scheme was quite unique with the public entity (SLPA) being both the contractor and one of the shareholder of the concessionaire. This could have caused governance issues which apparently did not occur. On the other hand, one clear advantage of this situation was that many of the traditional risks that could happen during construction or through project financing were avoided as well as contractual disputes. There is no doubt that on many accounts the PPP was a success. Further faith in PPPs in Sri Lanka has been shown with the proposed South Harbour project at Colombo Port. The project under a new PPP scheme involves the building of a new container terminal with three berths and a new breakwater at an estimated cost of $500 million. In 2007, ADB approved the Colombo Port Expansion Project to upgrade the port through public-private partnership.
6. Autoroute 30 (Quebec, Canada)
92. This case study is interesting as it shows an example of “public service comparator” (PSC) for the realization of an expressway in Canada based on KPMG (2008) short analysis. KPMG, the auditor for the Ministry of Transport

45
(MOT), in September 2008, completed a Value-for-Money (VFM) analysis for completing the Autoroute 30 (A-30) highway project as a public-private partnership compared to completing the project through traditional procurement by government.
93. The project consisted in extending for 42 km the existing A-30 from Chateauguay to Vaudreuil-Dorion providing a bypass of the island of Montreal in Quebec; 35 km of feeder roads were added to the project. The project was a typical PPP under the DBOT mode including financing with a 35 years concession period. KPMG audited the whole PPP procurement process, noted the conclusions of the feasibility study and outlined the VFM analysis summarized in the table below
Table15VFMundertheA-30PSCGovernmentcostunderpublicsectorprocurement(CDN$million)
GovernmentcostunderPPPprocurement(CDN$million)
Item Cost Item CostProjectprocuredcostover35yrsTollrevenueRisks:-Design&Build-InflationduringO&MCompensationtonotselectedbiddersRealizationCostResidualValue
1,647.5(20.8)
435.4116.9
6.0
2,424.4(134.6)
Paymenttoprivatepartnerover35yrsRisksretainedbyMOT:InflationforpaymentsotherthanconstructionMonitoringcostforGVTCompensationtonotselectedbiddersRealizationCostResidualValue
1,523
133.7
24.8
4.01,685.5(134.6)
NetProjectCost 2,289.8 NetProjectCost 1,538.7Note:AllcostareinpresentvalueofJuly2008witha6.5%discountrate
94. The PPP option gave a saving for government of $ 751 million because building
and O&M cost for private partner is cheaper than under government procurement and in addition some risks are in fact transferred to the private partner under PPP. Under the PPP the construction would also take less time (2 years less) bring an additional saving of $ 214 million.
95. One of the originality of this case study is the fact that risks were quantitatively estimated for the calculation of PSC and VFM and were therefore a key factor in getting the project implemented.
7. The Laibin BOT Power Project (China)
96. This PPP project is interesting on many accounts. This was the first acknowledged PPP project in China and has served as a model afterward.

46
Secondly the analysis conducted by Shouqing Wang & Yonjian Ke (2009) was thorough and has inspired much of text below.
97. Since late 1996 several state-approved pilot build-operate-transfer (BOT) projects were awarded in order to introduce BOT on a larger scale in China. Pilot BOT projects were the Laibin B power project, Dachang water project and Changsha power project. Laibin B is however considered as the first state-approved BOT project. The project comprised investment financing, design, construction, operation and maintenance and transfer of a 2x360 MW coal-fired power plant with an estimated cost of US$600 million. It was located in the Laibin County of the Guangxi Zhuang Autonomous Region.
98. In February 1995, the Guangxi Government entrusted the SOE “Bridge of Trust” with the task of inviting foreign investors to implement Laibin B on a BOT basis. A prefeasibility, in accordance with international practice, was conducted and prequalification documents were prepared in August 1995. After reviewing applications and shortlisting companies bidding documents were issued in December 1995; and by May 1996, 6 companies decided to tender. After analysis of the tenders, The “Consortium” was selected and a concession agreement with the Guangxi government was signed in Beijing in November 1996. The Consortium was formed of Electricite de France (EDF 60%) and GEC Alstom (40%). The strong point of their tender was the attractive tariff rate ($ 0.05/KWH) which would give a 17.5% return on investment to the company.
99. Under the concession agreement (CA), The Consortium was granted the exclusive right to design, construct, test, operate and maintain Laibin B, to use the land provided by Guangxi Government, to sell the electrical output to Guangxi Government during the concession period and to transfer to government, free of charge, the power plant at the end of the concession period fixed at 18 years. The sale of electricity was regulated under the power purchase agreement (PPPA) with the Guangxi Power Industry Bureau (GPIB) with a guarantee to purchase the minimum net electrical output of 3,500 million kWh each operating year. Also, Government guaranteed to supply, through “Guangxi Construction & Fuel Corporation”, fuel (coal and/or oil) required and paid for by the Consortium according to a FSTA (Fuel Supply and Transportation Agreement).
100. The State Planning Commission (SPC) support letter stated that the CA, PPA
and FSTA complied with current laws and regulations and that Guangxi Government had the capacity to sign the CA. It was such support that enabled COFACE to provide strong insurance cover for the Loan. Finally, if termination resulted from a Guangxi Government decision, the Lenders were going to be repaid and Sponsors compensated for equity invested and loss of profit.

47
101. Total investment in the project amounted to US$0.616 billion with 25% coming as equity from the project company (60% by EDFI, and 40% by GEC Alstom). The remaining 75% came from a bank consortium including 19 commercial banks headed by Credit Agricole Indosuez (France), HSBC Investment Bank and Barclays Capital (UK). In addition, France’s export-credit agency COFACE provided export credit insurance for about $0.312 billion of the incurred debt. Under the financing structure the concession period was 18 years with a construction period of 33 months and 15 years of operation. The Consortium estimated investment return was 17.5% with a $ 0.05/KWh20. In Laibin B’s CA, the original schedule for financial closing was sixty days, but the actual financing closing was extended to 270 days. This was a risk that the Consortium took.
102. The Laibin B BOT power project was possible because China had before passed a series of laws and regulations forming the necessary umbrella to the award of BOT projects to foreign companies. In March 1994, the power ministry (MOP) had promulgated Interim Regulations for the Use of Foreign Investment for Power Project Construction which set out guidelines to investment by foreign organizations in electric power projects in China. Under the new legislation, foreign investors were able to apply to SPC for approval to establish wholly foreign-owned and operated power plants stating limits on cooperation to 20 years for thermal power plants and 30 years for hydroelectric power plants. The government has streamlined the evaluation process and has adhered to international practice in contract allocation. Should Chinese laws be changed and affect positively or negatively the concession agreement, adjustments would be made to leave the conditions of the CA unchanged.
103. In addition to the general policies for foreign investors in BOT, central and
provincial governments provided special measures to the Laibin B BOT project. Guangxi Government promised to use its best efforts to give to the Consortium tax incentives according to laws and regulations: (a) exemption of the 3% local income tax; (b) exemptions of national income tax for the first 2 years, increasing to 15% rate and then 30% rate; (c) exemption of withholding tax on dividends. The Consortium was granted exclusive BOT rights on Laibin B. So long as the Consortium was not in default of its obligations under the CA. Under the provided guarantee, either party shall be entitled to suspend performance of its obligations under the CA to the extent that such performance is impeded by Force Majeure. In the event of a termination due to Force Majeure Guangxi Government would compensate the Consortium and upon payment of such compensation, the Consortium would transfer Laibin B to the government.
20Thereturnestimatewasquestionedsince,inthefeasibilitystudy,acceptablereturnscouldonlybeobtainedwithtariffof$0.077or$0.08.

48
104. Payments to the project company that needed to be converted in US $ would follow variations of the exchange rate according to People’s Bank of China. There were no limitations on currency conversions and on transfer of funds from China to foreign countries. Exchange rate fluctuation risk was mitigated by Project Company’s right to adjust the floating portion of the tariff (indexed to US$ but payable in RMB) on a monthly basis to reflect RMB/US dollar exchange rate changes.
105. If completion of the construction work was delayed or the cost of construction or financing was increased due to an act or omission of Guangxi Government in contravention of its obligations, concession period could be extended or tariffs adjusted. All imported goods and equipment needed for construction and O&M came free of charges.
106. The PPA and the included tariff structure were approved by the SPC. The SPC’s support letter clearly stated that the obligation to pay the agreed tariff and adjustments removing the risk of non-payments. Risk should be allocated to the partner most capable of controlling and influencing it, and expected returns should match the risk borne. According to these principles, the construction, operating, technical and finance risks were mainly borne by the Consortium, the political and legal risks by Guangxi Government with the Force Majeure risks being shared by both. The detailed analysis of the PPP-BOT agreements clearly points to a careful balance of the risk allocation between the private and the public entities. It also highlighted the strong support given by the Central and Provincial governments to ensure the success of the BOT.
8. Other relevant examples of infrastructure PPP projects
107. The few examples below were financed by multilateral developing banks (MDB) like World Bank and ADB. They are given for illustrative purposes to show the diversity in PPP projects.
108. The examples below concern performance based contracts (PBC) for shipping activities in the Pacific. PBCs are a simple form of a PPP scheme. The Pacific Private Sector Development Initiative is a regional technical assistance facility (TA) co-financed by ADB, the Government of Australia, and the Government of New Zealand. The TA consisted of a survey of the performance of PBC in shipping services in PNG and Solomon Islands, which ran the largest franchise shipping schemes.
109. In PNG, PBCs worked in the following way. Contractors bid on the routes, and indicate the level of subsidy that they require to provide the service. The subsidy is the difference between the cost of providing the service (as specified in each

49
bid) and the revenue raised through passenger and/or freight charges. Revenues are self-reported by the contractors. Spot audits of the voyages and vessels help ensure the operators’ compliance with contract terms, as well as safety and quality standards. In the PBC model, contracts specify the routes, frequency of service, capacity of vessel, safety standards, and passenger fares or freight rates. While this contract structure allocates 100% of the demand risk to the government, contractors have an incentive to perform efficiently, as their operating costs for the service form the basis of their bidding for government subsidies. They would also aim at attracting as many passengers as possible on their routes, as any revenue above breakeven is theirs to keep. Demand forecasting being difficult, subsidy requirements are often calculated on an assumed average vessel load factor.
110. Despite problems, the program has yielded benefits to PNG communities. Regular shipping services provide critical access to markets as well as to health, education, and other government services. Analysis carried out by ADB indicated that the cost per traffic unit of the franchise contract was far lower than that of government-provided services, being only 21% of the cost of operating the government trawler fleet, and only 13% of the cost of operating Border Development Authority services. In addition, the government has also developed contracting and monitoring capacity implying reduction in program administration cost and sustainability.
111. The Franchise Shipping Scheme started in Solomon Islands in 2010. By the end of 2014, it had conducted 271 voyages on eight separate routes, transporting 48,717 passengers and 26,463 cubic meters of cargo. These routes had not been previously covered by regular services, so the franchises were designed to stimulate economic activity. This resulted in increased passenger and cargo demand, eventually reducing the subsidy requirement. Most importantly, the regular services facilitated trade, allowing farmers and other small businesses owners to transport their goods to buyers on a regular basis. As was the case in PNG, the franchise shipping subsidy in Solomon Islands allowed the government to provide a service at less than half the cost of running its own shipping fleet.
112. Having sold its shipping fleet in 1996, the Government of Solomon Islands turned to the private sector via PBCs. Routes were competitively tendered, with bidders defining their operating costs for the required service quality and frequency. The government set the tariff based on market rates, and assumed all of the demand risk. Operators were paid a monthly subsidy to cover the difference between actual revenues collected and the costs specified in their contracts, with no cap on the subsidy. As was the case in PNG, the tendering process was challenging, and some contracts were terminated well before their standard 2-year period. Factors such as operator non-performance, accident or

50
weather damage to vessels, and changes in the ownership of vessels at the middle of the contract period were the major causes. In some cases, tenders attracted no acceptable bids, or no bids at all, and the tendering process had to be repeated, delaying the operation of the services.
113. The experience with contracted shipping services in the Pacific has demonstrated the value of introducing scheduled shipping services at affordable rates, replacing infrequent and unpredictable services offered at higher rates by ad hoc charter services. In PNG, the experience also illustrates the value of investing in supporting infrastructure, such as small jetties and ramps.
114. In PNG and Solomon Islands, franchise shipping has positively contributed to the ability of people to plan projects, open markets, increase local production, and raise their standards of living with better access to imported goods, materials, and services. Contracting the services to private operators, rather than running them through a state-owned enterprise or department, has been a cost-effective decision.
D. Summary of a Conference Proceeding
115. The 3rd ANNUAL INFRASTRUCTURE PROJECT FINANCING Conference organized by Marcus Evans event was held in Singapore on the 24th – 26th July 2017. The two themes were: “Engage and Collaborate with Multilaterals, Banks and Financing Institutions” and “Benchmark with Innovative Concepts from Governments, Specialized Agencies and Leading Operators”. Most of the presentations had relevance to the present study and are briefly summarized below.
116. Dr Jacob Kam of Hong Kong MTR (Kam (2017) presented the “Financing Models for Railway Infrastructure: Practical Insights from Hong Kong and Mainland China”. He argued that MTR is very efficient with a ridership of 5.6 million/day on a 231-km network and with 99.9% train punctuality. MTR generates large eternal economic benefits but is not an attractive investment with return on asset (ROA) varying between 1 and 2% per year. ROA could go up to 4.5% if revenues from other business and property development are added. There are 3 types of financing models for the railway network in Hong Kong: a) government subsidize construction cost used for Disneyland resort Line and Island West Extension; b) Operating service concession used for LRT and 3 MTR lines; c) rail and property model used on most of MTR lines. In PRC, metro lines are financed through a PPP model where government share construction cost and risk. Sustainability requires a good business model and agreed fare adjustment formula.

51
117. Pablo Romero of RATP-TRANSDEV JV (Romero (2017) gave details on the development of the Seoul Metro Line 9 and how it runs more efficiently than the other Seoul lines. More importantly are the pointed conclusions contained in his presentation: “Public Transport cannot be ruled only by market-law: [it is] is strongly tied with urban development and city government decisions; ridership is largely influenced by external factors (parking policy, congestion level, oil price, land developments); fares are very much impacted by political decisions”. He argued that few projects in the world covers its costs of construction, financing, operation and maintenance through fare revenues only with only a handful managing to cover O&M costs. Korean public transport services are running a 30 to 55% deficit. PPP can provide efficiencies, but it does not change fundamentally the economic imperatives of a project. The private sector may arrange up-front financing but it itself does not provide funds. PPP contract should focus on operational success rather than construction and long term rather than short term. Putting full commercial risk on the private party denies the reality, traffic depends mostly on public sector decisions (fares, competition of other lines / modes, urban development, parking policy, fuel price etc). Ridership is by nature a shared risk. And he finally concluded: “There is no miracle; MRT is never 100% self-sustainable, some form of government support is inevitable.
118. Ari Firmandi (Firmandi (2017) of the Indonesia Infrastructure Guarantee Fund (IIGF) provided information on how IIGF could assist PPP projects. IIGF was established on 30 December 2009 as a “Single Window” in providing government guarantee provision for infrastructure projects. IIGF is also valued for its state budget’s ring fencing function. It has already provided the equivalent of $ 2.1 billion of guarantee to 13 projects with total value of $ 8.9 billion. Of the 13, 8 were toll road projects. The Guarantee Agreement (GA) is signed at the same time than the PPP Agreement. Example of GA value is given for the Manado-Bitung Toll Road (39 km at cost of Rp. 5.1 Tn) for a 15 years guarantee period: a) Land acquisition advance fee (Rp 816 Bn); b) Land Acquisition (Rp 80 Bn); c) Limited Liquidity Fund (Rp 375 Bn); d) Toll fee adjustment (Rp 200 Bn); e) Termination (Rp 3.2 Tn). The guarantee provided is against political risks while insurance provide protection against property loss. Also, Ari Firmandi provides some general review and recommendations for PPP project structuring noted for instance that: “allocating risks to the party best able to mitigate it, anticipates its occurrence, and responds in a way that minimizes damage”. And finally the author recalled the 10 steps for a successful PPP: 1.Project needs—demand analysis; 2.Supply analysis—provision of infrastructure projects; 3.Basic design—technical analysis; 4.Capex and Opex—identifying costs; 5.Financial modelling—financial feasibility; 6.Project structuring—achieve optimum solutions; 7.Risk analysis—risks allocated to the right parties; 8.Contract Agreements—all risks have been properly mitigated; 9.Procurement strategy—attract and select the
52
right candidates; 10.Monitoring and evaluation—assuring performance and commitments.
119. Kiyoshi Nishimura (Nishimura (2017) presented the role of the Credit Guarantee & Investment Facility (CGIF). This organization is both a trust fund to be used by ADB and a service provider in financing options for PPP. CGIF was established in November 2010 and has a paid capital of $ 700 million to serve ASEAN +3 countries. The project bond market has been growing globally accounting for 15% of infrastructure financing though in Southeast Asia it is low accounting for only 2%. The author argues that, in Asia, there is a lot of potential to use LCY project bonds to finance PPPs though such option in South East Asia is only being used by Malaysia. Bond investors may be hesitant in investing in project bonds but CGIF could act as an intermediary, a guarantor as well as providing rating and project monitoring. The author gave the example of how ADB and CGIF have been assisting the expansion of the Tiwi-Makban geothermal power plants in the Philippines. Project cost of PHP 12.5B was financed by PHP 10.7B partially guaranteed climate non-rated project bonds and PHP 1.8B term loan from ADB. ADB was the guarantor and CGIF risk shared the rights and obligations of the fronting guarantor (ADB) on a first loss basis up to CGIF’s guaranteed exposure of PHP4.7 B($ 100 million ).
120. Sudath Amaratunga (Amaratunga (2017) made a short review of the traffic congestion problems in Australian cities. However, his interesting contribution to the present study is his analysis of alternative funding mechanism to support the development of transport infrastructures. Value Capture, as a percentage of land value or property value increase could be levied as contribution to infrastructure development. This is used in USA (Kansas City) and Brazil. In Kansas City 75% of a recent transport infrastructure development was financed through a value capture and sales tax. There have been variants of the value capture concept. One of them is the Joint Infrastructure and Property Development. Government joint venturing with infrastructure developer recoup value capture through own property development and use it to finance infrastructure. In Hong Kong, in 2012, rental of commercial stations provided 16% of MTR revenues. Also, the MTR portfolio contains 13 shopping malls and 18 office floors in International Finance tower generating HK$ 3.2 billion/year. Another variant is the Transit Oriented Development (TOD). TODs are increasingly popular commercial, residential and retail spaces located at or within walking distance of transport hubs that are used to generate revenue to fund or support transport investments whilst stimulating urban growth. For instance, Air rights to construct a TOD above a station can be sold to property developers as a means to fund a transport development or, alternatively, the transport operator develops and manages a TOD to provide ongoing funding for the transport system. This concept is being used in the San

53
Francisco Bay Area Rapid Transit District (BART) with the development of 18 TODs.
121. Vivek Sharma (Sharma (2017)) provided info on his company CRISIL which is a World’s foremost provider of independent credit ratings, indices, risk evaluation, investment research, data and valuations. Most infrastructure projects have a credit rating lesser than AA, typically being rated BBB/BB and current regulations limit insurance companies and pension funds from investing in debt securities rated below AA. A credit guarantee scheme is a de facto credit enhancement where the borrowers’ debt obligations are partially or completely guaranteed by a third party. This third party, or guarantor, is liable to repay on default. CGIF (ADB), IIGF (Indonesia) or BGFI (India) work as credit enhancement mechanisms, giving full/partial guarantees to long-term bond issuances of issuers with credit rating less than AA. Through this credit enhancement, bond issues would then achieve a rating of AA or above and be able to attract bond market investors (Pension Funds, Insurance Companies, Mutual Funds). IDFs are investment vehicles which can be sponsored by commercial banks and NBFCs in India in which domestic/offshore institutional investors, specially insurance and pension funds can invest through units and bonds issued by the IDFs. Investment Debt Funds (IDFs) act as vehicles for refinancing existing debt of infrastructure companies by taking loans for PPP projects, thereby creating fresh headroom for banks to lend to new infrastructure projects.
122. Shobana Venkataraman (Venkataraman (2017)) provided a quick review of IFC (World Bank) and highlighted the challenges and the recipe for success of PPPs in emerging markets. He also provided details of the assistance given by IFC and ADB in a power generation project in Myanmar. The presentation of PPP recipe for success is good though there is nothing new except for the message that preparation is of vital importance. The Myingyan was the first IPP open for competitive bidding to the private sector. Myanmar had no PPP legislation and no government framework to offer guarantees to PPP projects. IFC was appointed “Transaction Adviser” by the Government of Myanmar in 2014. IFC developed a PPP agreement with bankable risk allocation that could be used on other PPP projects. The Investment was $ 300 million. ADB was the lender and did provide guarantee against political risk.
123. Kalpesh Pathak (Pathak (2017) Brescon (India) presentation was called: “Financial Engineering to revive struggling infrastructure projects [in India]”. The situation in India is serious with $ 120 billion of “stressed project” and another $ 100 billion of imminent stress according to RBI. In the last 6 years, the number of bad loans has increased 5 times. Transport and power sector are respectively responsible for 16% and 15% of stressed loans. In road sector stressed situation is usually due to the following causes: land acquisition, delays in dispute

54
resolutions, less than expected traffic forecast, low bids due to high competition, and delays in financial closure due to bank hesitations to proceed. Lack of proper risk allocation in PPPs creates chaos. Brescon assistance to struggling and indebted companies involves financial engineering through a combination of divestment, merger & acquisition, restructuring and recapitalization.
124. Danny Samuel (Samuel (2017) was from the Infrastructure Transport Network Limited (ITNL) fully owned by IL&FS of India. ITNL works in 23 countries, manages 32 BOT road projects generating 3.5 million/day of road users paying $ 1.2 million/day of tolls. ITNL was asked recently to take over a road project on NR 1F in Laos (from Mahaxay to Muong Phin) after the consortium awarded the project in 2016 could not secure financing. ITNL proposed a financing structure with the key points of mitigating risks being: Non-Payment risks mitigated through insurance; Currency risk reduced by having part of the loan in local currency; Lender servicing protected through the following: Credit risk insurance, DSRA, Escrowing Project Cash flows, Sponsor support for shortfall; Sponsor risks covered through: insurance cover, back to back performance obligations on subcontractors, retention money from subcontractors.
125. Rajiv Vishwanathan (2017) in his presentation dealt with the subject of “gaining investor’s confidence in infrastructure financing”. To illustrate the gap in financing infrastructure projects, he used two reports: the Mc Kinsey Bridging Infrastructure Gaps (2016) and the ADB Meeting Asia’s Infrastructure Needs (2016). According to ADB the financing gap for 2016-2030 is annually $ 1.74 trillion ($ 550 billion for transport only) or 50% above the current projected spending. Large gaps exist but these numbers are highly questionable. Nevertheless, there is ample liquidity world-wide estimated at $ 120 trillion (Banks 40t, investment funds 29t, insurance and pension funds 38 t, sovereign wealth funds 6t, developers 3t). The key factors to gain investor confidence are the following: a) a robust project preparation (comprehensive feasibility study, checking on funding availability and government support and will), b) a detailed and agreed risk allocation, c) Encouraging Sustainable Investment through Market Development.
126. Ezwan Hazli Abdul Malek (Malek (2017)) of Prasarana presentation was on “designing and financing strategies to bridge funding gap in rail development. Prasarana was established in 1998 as a SOE of Malaysian MOF Inc. Over the years, it has taken control of the separate urban rail development as well as the integrated urban bus system. The financing of the different urban rail systems has changed over the years: the Kelana Jaya & Ampang line of RM 5.7 b was financed conventionally (loans) + Islamic bonds; line extension of RM 7 b entirely by Islamic bonds; but the LRT3 would be financed through TODs + Islamic bonds for a value RM 9b. In fact, KL Sentral was the first Transit Oriented Development

55
(TOD) in Malaysia. At 11 stations of LRT3, Prasarana is the major retail/office/residential developer at the station for a total gross development value of RM 10.7 b. TOD revenues therefore would significantly reduce the debt impact of the new LRT3 urban rail development.
127. Gavin Munro (2017) from the Societe Generale presented the landscape of the main funding sources in infrastructure PPPs. The total number of global infrastructure finance transactions fell last year compared to 2015 (1,364 compared to 1,537), but the total value of those transactions rose as a result of a number of big tickets transactions ($ 795 billion compared to $ 748 billion). The Global top 10 infrastructure finance transactions were dominated by activity in the Oil & Gas and Power sectors. The funding sources are of 4 types: Development Finance institutions (DFI) loans, Bank loans, Bonds and Equity. The Institution investors have shown a greater interest in PPP financing with an increase of 113% from 2013 to 2017. The fund distribution among sources shows a sharp increase from the Bond market from 2011 to 2016. The percentage distribution is the following with first number referring to 2011 and second one to 2016: DFI (14% and 6%), Bank loans (45%, 41%), Bonds (4%, 18%) and Equity (37%, 35%).
E. Summary
Thethreesub-sectionsabove,fordifferentreasons,shouldallbeofinterestfortheplanningand development of PPPs in Liaoning. The first part was a short review of analyses andcommentsfromaseriesofauthorsonChinesePPPs.Thesecondpartpresentedafewcasesstudieswhich, inpurpose,were selectedamong verydiverse countries. The text stressedthat proper risk allocation was the key factor in PPP between success and failure (ref:Colombo Port versus Bridge Project in Vietnam or Road BOT Project in Indonesia). TheanalysisofthedifferentcasestudiesalsoshowedtheimportanceofadequategovernmentsupportthroughoutallphasesofPPPproject.This,forinstance,wasoneofthemainreasonfor the success of the Laibin Project in China. The third part main contribution was toillustrate the availability of alternative financing methods and institutional guaranteeschemeswhichcameasinterestingadditionstothesimplerelianceonbanklending.Inthesamevein,thesectionbelowgoesfurtheranddetailed,inaformofguidelines,thelessonsthatcouldbelearntandtheconclusionsthatcouldbedrawn.

56
VI. Lessons learnt when implementing PPP projects
A. Issues and Best Practice
128. Infrastructure PPP projects have seen a tremendous world-wide growth since the 1990’s. But not all PPP projects were successful. Most PPP failures were due to a combination of factors. The two dominant factors were, firstly the processing of “not sufficiently good projects” supported by weak feasibility studies and secondly the lack of adequate preparation during the transaction period before contract signing. Mistakes can be avoided.
129. Building from the above with, “the understanding of PPP content and process”, the “literature review” and the “lessons from the case studies”, this section recaps the key issues and the best practices recommended for successful implementation of PPP projects.
130. The key issues for best practices recommendations could be organized along the following:
1. Selecting good potential PPP projects; 2. Enabling government support; 3. Prepare adequately project and make use of available capacity building
assistance; 4. Realize optimal risk allocation among partners; 5. Make use of available project financing alternatives; 6. Ensure adequate generation of project revenues;
131. Only viable infrastructure projects likely to bring significant economic benefits and supported by comprehensive and realistic feasibility studies should be considered as potential PPP projects.
132. Referring to PPPs in Indonesia, A. Wibisono & others (2011) wrote: “But projects were often awarded based on patronage, and government support was provided in an ad hoc manner”. One of the main reasons for PPP failures is that the feasibility study – when it exists – is carried in a superficial way with too often over optimistic forecasts. This, for instance, was noted in the PPP bridge project in Vietnam above when reviewing some case studies. The reference to problems in feasibility studies has been mentioned by many reviewers of PPP performance. “According to financial experts, most PPP failures can be attributed to inadequate or non-existent feasibility studies, including unrealistic forecasts and undefined public contribution of funds” (R. Apanaviciene (2010)). Also, the correct sequence of project identification, project pre-feasibility study and feasibility study and detailed design is often shortened in order to accelerate implementation.

57
133. In Asia, 60% of the future PPP projects (Ryuichi (2017)) are originally initiated by the sponsors21. This is not optimal as infrastructure projects are aimed at providing public services which should be part of the priorities and long-term planning of governments. Also, from the long list of projects in the pipeline, governments should have designed clear criteria to screen and prioritize infrastructure projects.
134. On many grounds the success of a PPP project would depend of government playing an active and supportive role at almost all the stages of the PPP cycle and providing to the private sector unwavering commitment to project realization.
135. Firstly, governments (central governments) should enable the establishment of a strong legal framework conducive to the development of PPP projects. According to a survey conducted in Malaysia in 2011 by Ismail and other (2011), among 18 critical success factors, the 3 top ones were: good governance, availability of market finance and favorable legal framework. Some countries enact specific PPP laws to adapt PPP requirements to the existing legal framework. Instead of creating a PPP Law, some countries decided to change existing laws to accommodate PPPs. A PPP specific law can demonstrate political commitment to a PPP program and The World Bank PPP Reference Guide (World Bank (2017)) gives examples of PPP laws world-wide. In Indonesia, to strengthen the PPP program, infrastructure laws were adjusted and presidential decrees issued to accommodate the need of PPPs. These changes among others allow the private sector to invest in the development and operation of viable infrastructures without signing joint ventures with SOEs (A. Wibisono & others (2011). In China, MOF has drafted PPP legislation and is currently receiving opinions and comments from concerned organizations before implementing the law.
136. A PPP law is a general framework legislation; in addition, PPP projects need to follow a whole set of regulations and get numerous permits and authorization issued by many different ministries. It is therefore the responsibility of the public entity in the partnership to assist the private sector in that domain.
137. To foster development of successful public-private-partnerships, it is important that all involved government levels (central, provincial and municipal) adopt with sincerity a pro-business attitude. This implies, among other things, a willingness by governments to let investors having profitable returns on investment. In China, this means developing more PPP projects with true private sector interests instead of favoring dealing with SOEs in preference.
21OnlyinIndiaitisdifferentwhere90%areinitiatedbygovernment.

58
138. The supportive role of government or public entity in questions of project financing or risk allocation is outlined below.
139. It should not be stressed enough that one of the key factor to successful PPP project implementation is through an adequate preparation by government concerned authorities making use of available assistance provided by MDBs or their own domestic institutions.
140. “Among all EMDE countries, one of the biggest constraints to bringing PPP projects to the market has been the lack of planning and capacity to properly prepare projects” (World Bank 2016). PPP project procurement is more complex and takes more time that the traditional public-sector delivery of infrastructure services. “PPPs often require the application of best practice and international standards, which, in concert with local standards, may provide the government with better-quality services and prepare the government for additional foreign investment as it addresses potential gaps between local and international standards” (ADB 2012). The government or public entity needs to be involved through the whole project cycle which could vary between 15 to 30 years or more. At the beginning of the project and up to contract signing and financial closure, this would involve quite a series of tasks. In the operation phase it would essentially consist of monitoring and payment activities.
141. The first task is to decide whether a project qualify to be procured under a PPP mode. This is achieved through the use of a value-for-money (VFM) analysis through the filter of public sector comparators (PSCs). The VFM analysis is simply an extended Cost-Benefit analysis where considerations on social and environmental sustainability are included. The use of the PSC is to ensure that PPP mode brings sufficient savings to government compared to the traditional delivery method. Of course, this quantification exercise always contains a risk element22. After a positive answer to the VFM testing, the choice of a typical PPP scheme needs to be confirmed. This implies choosing among the following: Management Contract, Lease Contract, BOT and concession. The choice is often dictated by the type infrastructure and sector considered. Then, the procurement process per se starts (prequalification of bidders, preparation of bidding documents, bid evaluation and contract negotiations). In developing countries, government officials would by and large lack the skill to deal with the complexities of the process. External advisors, called transaction advisors, need to be hired through special funding mechanisms like “Project Development Fund/Facility” (PDF). For instance, India has established an Infrastructure Project
22Certaincountriesprefertoadoptaqualitativeapproachinsteadofriskingestimatingwronglycomponentsoftheanalysis.ForacomprehensivestudyofVFM,seetheWorldBankValueformoneyAnalysis–PracticesandChallenges(WB2013).
59
Development Fund (IIPDF) with a revolving capital of Rs 1 billion. “Lack of adequate preparation of public–private partnership (PPP) projects is one of the most critical impediments affecting infrastructure development in Indonesia” (ADB 2012). Therefore, Indonesia decided to put in place a PDF which is supported by ADB and managed by BAPPENAS. IFC offers also the service of transaction advisers on a cost recovery basis. Generally, transaction adviser costs are recovered from the successful bidder. Sugden (ADB 2016) argued that PRC should seriously consider the establishment of a PDF to be managed by the CPPPPC.
142. There are now extensive knowledge, assistance and guidelines23 available for countries interested to improve their PPP procurement processing. ADB established the Office of Public-Private Partnership (OPPP) in September 2014. The Office provides transaction advisory services and manages the $ 76 million Asia Pacific Project Preparation Facility (AP3F), a multi-donor facility (Sugden ADB 2015). ADB has recently approved a loan to Pakistan for Government of Sindh with financing of a PPP Support facility (PPPSF), a PDF and a Government viability gap fund (VGF). But probably the most noticeable efforts and assistance of MDBs came from the World Bank group. The PPP Infrastructure Resource Centre (PPPIRC) provides a series of tool kits for best practice in PPP in energy and transport. The PPP Infrastructure Advisory Facility (PPIAF) provides services on a cost recovery basis, issue guidelines and maintains a comprehensive PPP data bank. PPPIRC and PPIAF are both part of the PPP Knowledge Lab, an organization managed by the World Bank but with the collaboration of ADB, EBRD, Global Infrastructure Hub, IDB, OECD, UNECE and ESCAP.
143. There are many tasks and aspects covered under project preparation for the public entity. Some merit special attention; they are the questions of “project risk allocation” and “government payments to the private sector in the partnership”.
144. Project risks should be allocated to the contractual party best likely to be able to mitigate it and the agreed risk allocation should be enforced throughout the duration of the contract.
145. The party which has been allocated the risk should be able to most likely carry out the three following activities: a) control the occurrence of the risk, b) control the impact of the risk on the project, and c) absorbs the risk with the least cost.
23ADBguidelines:“PublicPrivatePartnershipOperationPlan2012-2020”(ADB2012);WorldBank:a)“GoodGovernanceinPPP,areviewguideforpractitioners(WBandDFID2009);b)“ValuesforMoneyAnalysis,PracticesandChallenges”(WB2013);c)“PPPReferenceGuideVersion3”(WB2017).

60
There are three main categories of risks: design and construction risks, market related risks and political risks. There could be however many variants and elaborations from these three main categories24.
146. In the traditional delivery of public infrastructure, government or the public entity absorbs all (or almost all) the risks. In a PPP procurement scheme, risks are being transferred to the private sector. In the case of PPP project, there is no up-front disbursement by the public entity and therefore no immediate public debt increase impact. But, later the project brings a series of potential fiscal implications in the form of government payments, subsidies and guarantees given to the project company.
147. In PPP, not all risks can be transferred from the public sector to the private sector. This is why it is important to have a good risk management system and a clear allocation of risks as defined in the contract; otherwise it could bring a chaotic situation. For instance, the occurrence of a highly damageable risk which does not fall automatically to the project company may have been omitted in the PPP contract and, in such a case, the implied cost may cause termination of the project or the need for a major contract re-negotiation25.
148. Risk management requires first that risks and their possible impact be identified in what is referred as Risk Register; then a Risk Allocation Matrix should be stablished. In some PPP projects probabilities of risk occurrence are estimated and specific implied cost are added to the contract (see the case of financial audit of Autoroute 30 in Quebec, Canada).
149. Not all risks are of the same importance and most of them could be mitigated at a cost. Insurance programs, for instance, are now available to cover political risks. However, a BOT project depending for repayment on user pay payment would always be at risk because most of the time demand forecasts in the feasibility study were too optimistic. The demand risk is probably the most serious risk for the concessionaire. Mitigation exists but would depend on the willingness of the grantor (public entity/government) to compensate the concessionaire26. A
24ThePPPIRCoftheWorldBank(WB2009)hasagenericriskallocationtablefortollroadswith21typesofrisks;EvaluatingrisksonthePortugueseroadsector(Fernandes2016)has9types;thePPPWorldBankGuidelines(2017)has10classes;TheADBPPPOperatingPlan2012-2020(ADB2012)workswith6typesonly.25Atotalof75%ofmajorinfrastructurePPPcontractsarerenegotiatedduringtheconcessionduration.26Forinstance,inMalaysia,iftollrevenuesonexpresswayscomelowerthanagreedinthePPPcontract,governmentcompensatestheconcessionaireifincreasesintollratesareinsufficient.

61
typical risk allocation matrix for PPP transport infrastructure projects is presented below.

62
Table16PPPProjectRiskAllocationMatrixType Description/cause Impact of risk on Outcome Mitigation Allocation
Site Land acquisition & resettlement problem; faulty soil investigations; unforeseen environmental problems
Delayed acquisition of the right-of-way could significantly delay project implementation
Should have been resolved before contract signing; if occurred after adjustments to contract
Grantor
Design Failing to complete the design process; possibility of changes in technical standards;
Change in design affects project costs & delivery schedule & demand
Joint technical inspection by both parties; independent expert review
Concession; if BOT, Grantor
Construction Cost overruns due to: inflation in labour and material inputs, inefficient construction practices, unforeseen in geo physical conditions; delays in delivery
Increase in final infrastructure project cost; delays in delivery may imply penalties and fines paid by project company
Efficient construction management practices; provision of contract contingencies; contract adjustments
Concession
Operation increases in costs of maintenance and
operation (inflation, heavier demand than expected leading to faster deterioration)
Impact profitability and concession revenues
For roads, install weight scale stations & consider revision of tolls
Concession
Demand Demand for service falls short from the expected forecasted level because of affordability or competition problems
Lower-than-expected revenues during the concession period with negative impact on return on equity
Market research; affordability analysis; if conditions not fully under concession, “Viability Gap Financing”
Concession
Financial Interest and exchange rate fluctuations, capital controls restricting convertibility and transferability of profits
Loan repayment more than expected, imported goods expensive and capital control all
Credit Guarantee Facilities; Hedging instrument; contract re negotiation
Concession except case of capital control:

63
affecting profitability Grantor
Political Change of law leading to (i) unforeseeable conduct by government against contract modalities; (ii) expropriation of the assets of the Concessionaire.
Affects the expected return on Equity & debt service in (i) and leads to termination of concession in (ii)
Insurance against political risk Compensation and contract re-negotiation in (i); termination clause in (ii)
Grantor
Regulatory Unexpected changes in tax legislation, tariff-setting rules, and contractual obligations; possibility that consents required from other government authorities may not be obtained or, if obtained, at greater cost
Changes in regulations would make project costlier and delayed and will affect profitability
Due diligence by concessionaire before signing; Grantor to assist concessionaire in getting authorisation/permits from all government agencies
Shared responsibility
Force Majeure
The possibility of occurrence of unexpected events that are beyond the control of the Parties (natural disasters, civil riots)
May cause major disturbances in construction and operation schedule
Insurance & Indemnity of the Concessionaire from liability for duration of Force Majeure
Shared responsibility
Asset Ownership
Risk that asset deteriorated at transfer Implied cost to restore condition of asset as expected in contract
Grantor monitoring avoid this; cost of restoration to concessionaire
concessionaire
Source: Consultant; World Bank PPPIAF

64
64
150. PPP projects do not need to be only financed through bank loans. Many alternative financing instruments are now available and merit to be used.
151. Traditionally debt was the way to finance PPP projects. Debt financing meant loans from commercial banks made available to the project investor. Presentations at the recent 3rd Annual Infrastructure Project Financing Conference in Singapore have challenged that perception arguing that many more alternatives should be considered. Of interest is also the workshop which was organized in 2015 in Beijing by ADB on the problem of PPP financing and risk management27.
152. Munro (2017) noted that “non-banking institutions” like pension funds, insurance, trust funds are showing greater interest in infrastructure financing (a 113% increase from 2013 to 2017). The institution investors are active on the bond market and on the equity market. Despite emerging new financing schemes, debt financing (loans) still dominate on a world-wide perspective, but, the fund distribution among sources shows a sharp increase from the bond market from 2011 to 2016. Development Financial Institutions (EIB, EBRD, JBIC…) have seen their share decreasing between 2011 and 2016. The percentage distribution is the following with first number referring to 2011 and second one to 2016: DFI (14% and 6%), Bank loans (45%, 41%), Bonds (4%, 18%) and Equity (37%, 35%).
153. Following the last global financial crisis, commercial banks have adopted a more conservative attitude hesitating in financing large infrastructure projects. Banks also prefer short term lending and may not feel comfortable with the long-life cycle of PPP projects. Bonds on the other hand are comfortable with long term maturity but their markets are still undeveloped among developing countries. In Southeast Asia, only Malaysia has been actively using the bond market (Islamic bonds) to finance infrastructure projects. Project bonds issued by the sponsor/investor are still a new idea in Asia though it offers a lot of potential. Malek (2017) in his presentation noted how Prasarana, the SOE under MOF manged to finance the different urban rail lines in Kuala Lumpur: for instance, the Kelana Jaya & Ampang lines of RM 5.7 billion were financed conventionally
27“PRC-TA8869-InternationalWorkshop:PPPFinancingandRiskManagement”,ADB,12thofJune2015Beijing.

65
65
(loans) + Islamic bonds, but, the line extension of RM 7 billion entirely by Islamic bonds.
154. Sharma (2017) pointed out that most infrastructure projects have a credit rating lesser than AA, being rated BBB/BB and current regulations limit insurance companies and pension funds from investing in debt securities rated below AA. A credit guarantee is a de facto credit enhancement where the borrowers’ debt obligations are partially or completely guaranteed by a third party – This third party, or guarantor, is liable to repay on default. Countries and MDBs have put in place credit guarantee facilities to help the financing of infrastructure projects. Indonesia Infrastructure Guarantee Fund (IIGF) providing risk guarantees for infrastructure projects in Indonesia. Credit Guarantee and Investment Facility (CGIF) owned by ASEAN+3 countries provide credit guarantees to entities in the ASEAN+3 regions. Nishimura (2017) gave the example of how ADB and CGIF have assisted the expansion of a geothermal power plant in the Philippines. Project cost was financed by partially guaranteed project bonds and a loan from ADB. ADB was the guarantor and CGIF risk shared the rights and obligations of the guarantor on a first loss basis up to CGIF’s guaranteed exposure. Nishimura also pointed out the large potential of project bonds if they were issued in local currency instead of foreign currency.
155. Perhaps the most innovative financing scheme is the use of a value capture scheme or Transit Oriented Development (TOD). Infrastructure development brings increases in land value or property value. The idea is to capture some of that increase to contribute to the financing of the project. Amarantuga (2017) gave a few examples of “value capture” or TOD initiatives. In Kansas City 75% of a recent transport infrastructure development was financed through a value capture and sales tax. In Hong Kong, in 2012, rental of commercial stations provided 16% of MTR revenues. Also, the MTR portfolio contains 13 shopping malls and 18 office floors in International Finance Tower. At 11 stations of LRT3, Prasarana is the major retail/office/residential developer for a total gross development value of RM 10.7 billion. TOD revenues therefore would significantly reduce the debt impact of the new LRT3 urban rail development (Malek (2017)).
156. Finally, the question of Mezzanine Financing should be mentioned. Mezzanine financing is a hybrid of debt and equity financing that gives the lender the rights to convert to an ownership or equity interest in the company

66
66
in case of default. There are different types of mezzanine financing. A simple case is when the grantor (public entity) directly or through a proxy company decides to take some equity in the PPP project. This has been common in transport Chinese PPP projects. Another case illustrated by Kelly (2015) is when there is a blending of EU fund (in grant form) with debt financing on infrastructure projects in Europe.
157. Payments (revenues) to the investor/sponsor for the provision of infrastructure services would vary according to the type of PPP scheme adopted. Payments should be sufficient to ensure reasonable return on investment and this may, in certain cases, required compensation payments from government/public entity.
158. The revenue schemes for PPP BOT could be classified according to the four following headings: “User Pay”, “Government Pays”, “Viability Gap Payments”, and “Value Capture”. Variants exist but they would all go along the principles behind these four types.
159. The Government Pays scheme has been used and continues to be used in many countries. The public entity owns the infrastructure but delegates to the sponsor/investor the responsibility to build and operate the infrastructure at his own cost. The government/public entity reimburses the concessionaire for the services provided through a “government availability payment” based on monitored performance. No user charges are levied.
160. Under the User Pay scheme, all the costs during the project life cycle (concession duration) are covered entirely by the users of the infrastructure through tolls, tariffs or fares. Costs include the construction and the maintenance of the facility. Under such a scheme, the government/public entity has no obligation to pay the concessionaire for the provision of the services and only keep his role as regulator monitoring the performance of the concessionaire. They are variants of the scheme but the pure case would imply that the concessionaire has full liberty to select the optimum tariff/toll to cover his cost and ensure sufficient profitability.
161. The Viability Gap Payment scheme is a sort of hybrid between the User Pays and the Government Pays scheme. In fact, it has all the characteristics of the “user pays” scheme but it accounts for some shortfall of revenues to the

67
67
concessionaire. Because of demand lower than expected or/and because tariffs/tolls could not be increased (affordability, social reasons), revenues generated by the new infrastructure services may not guarantee financial sustainability to the concessionaire. In that case, both partners agree in the contract that compensation payments (viability gap payments) would be paid to the concessionaire by government. This form of public service subsidy is being used in toll roads in India, Pakistan and Malaysia.
162. The Value Capture scheme is relatively new and offers a lot of potential. It is usually combined with the “user pays” scheme. New transport infrastructures like urban rail projects generate substantial new economic activities (value added). The principle is to capture some of the generated benefits and increases in property value to finance the cost of the newly built infrastructure. There are different ways of doing it. It could be either (or both) through the tax system or simply by PPP partner being an active investor in the generated commercial activities. Then in some accounting procedures the lack of revenues from infrastructure services are largely compensated from generated activities revenues.

68
68
USERPAYSTollroadsandpowerstationswithfullcostrecoverfromusers
GOVERNMENTPAYSUKPublicFinance
Initiative,socialservicesandurbanroadsinAustraliaandCanada
VIABILITYGAPPAYMENTS
ViabilitygapfundsinIndia,Pakistan,
Malaysia
VALUECAPTURESubwaysinHongKong,railstationsintheUS,LRTinMalaysia
PublicEntity
MonitoringReporting
ConcessionaireFaresTariffsServicesTolls
PublicEntity
AvailabilityPaymentServices
Concessionaire
PublicEntity
ViabilityGapPayment
ConcessionaireFaresTariffsServicesTolls
PublicEntity
LandServices
ConcessionaireFaresPublic+TariffsCommercialTolls+ServicesProfits
Figure2SchematicofAlternativeRevenueSchemes28
B. Conclusions for PPP Projects in Liaoning
163. Many PPP infrastructure projects are currently in the pipeline in the Liaoning Province, but only a few have been implemented or are in process of being implemented. This interest in PPP projects is not surprising and reflects the serious mismatch between available government funding and a continuously expanding infrastructure investment demand. With growing public debt and alarming budget deficits, provincial and local governments are less and less
28ThefigureisadaptedfromSugden(2015).
Users Users Users+CommercialActivities

69
69
capable of meeting the demand and therefore public-private-partnership financing are being seen as the best desirable solution.
164. In an effort to articulate the “best practices” guidelines for PPP projects, the study went through a detailed review and analysis of the steps required. From the lessons learnt and the stressing of the prevailing issues, a series of practical recommendations have been outlined in the section above. The recommendations should apply to Liaoning in order to put in place a coherent development of PPP projects.
165. The case studies presented have all illustrated different aspects and problems often encountered in PPP projects. The case of Indonesia stressed the importance of government support to arrange financing as the issuance of a letter of comfort was a guarantee accepted by commercial banks to lend to the project company. The success of the Laibing Power PPP project in China was due to effective government support and a well-balanced risk allocation among partners. Having the public entity/grantor as directly involved in project financing (through equity) proved to be an excellent solution in the Port of Colombo project. PPP projects transfer responsibility and risk to the private sector but it does not mean that subsidies are no more required. As illustrated in the case of Malaysia toll roads, compensation for shortcoming in user pay are sometime required to guarantee the success of a PPP project (Viability Gap payment). Intelligent and efficient subsidy schemes were illustrated above in the case of shipping routes in Pacific island countries.
166. The study has on a few occasions mentioned the active role played by the World Bank and ADB in assisting countries in their development of PPP projects. Project Development Funds (PDF) and transaction advisory services have been established by MDBs to assist developing countries to make greater use of the PPP approach. But countries themselves are putting in place institutions to assist and guide local government or public entities in PPP development. In that regard China has now a very active organization in that domain, the China Public-Private-Partnership Center (CPPPC). Liaoning should seek assistance from MDB dedicated institutions and CPPPC in its implementation of PPP projects.
167. PPP projects in Liaoning are heavily SOE dominated. Efforts should be made to include a greater contribution of the private sector and extend the concession duration above 15 years which is short for transport related projects. Finally,

70
70
repeating what has been said before in the report and, as a general guidelines, the implementation of PPP projects in Liaoning should proceed along the following steps: a) only implement good and needed projects supported by strong and reliable feasibility studies; b) give to the project company efficient and effective government support; c) in financing schemes, be inventive and go beyond the debt-equity option and consider alternative in terms of project bonds, value capture and direct involvement of grantor; d) seek guarantee schemes and insurances to minimize the risk; e) draft a clear contract agreement which covers all aspect of project realization and provide a fair risk allocation among partners; f) payment structure should allow for agreed compensation if concessionaire revenues fell below expectations; g) include in contract monitoring performance indicators (KPI).
71
71
VII. REFERENCES
ADB (2012), Public Private Partnership Operation Plan 2012-2020, Asian Development Bank, Manila 2012;
ADB (2017-a), Meeting Asia Infrastructure Needs, Asian Development Bank, Manila, 2017;
ADB (2017-b), Case Studies in Private Sector Participation: Franchise Shipping, ADB Paper & briefs February 2017, https://www.adb.org/publications/private-sector-participation-franchise-shipping;
Ahmad Ethishan & others (2014), Involving the Private Sector and PPPs in Financing Public Investments: Some opportunities and challenges, LSE, Asia Research Centre Working Paper 67;
Alfan Ervina (2010), The Malaysian Public-Private Partnership (PPP): Financing the Tolled Highway Projects, Asian Journal of Business and Accounting, 3(2), 2010
Alfen Hans Wilhem (2009), PPP Infrastructure Development: Case Studies from Asia and Europe, Bauhaus-Universitat Weimar 2009;
Amaratunga Sudath (2017), Innovative funding and financing for transport Infrastructure, 3rd annual infrastructure project financing, a Marcus Evens Conference 24-26 July 2017 Singapore
Apanaviciene Rasa (2010), Analysis of evaluation methodologies for public-private-partnership (PPP) projects in infrastructure construction, Faculty of Enginnering Vilnius Gidimenias, Technical University, Lithuania;
CPPPC (2017), China Public Private Partnership Center, Quarterly Report, Beijing 2017;
Della Croce, R., Yermo, J., (2013), Institutional investors and infrastructure financing, OECD Working Papers on Finance, Insurance and Private Pensions, No.36, OECD Publishing.
EIU (2014), Infrascope PPP Index, Evaluating the environment for PPP in Asia Pacific, EIU 2014;

72
72
Fernandes Mario Correia (2016), Evaluating Risks in Public-Private Partnerships: The Case of Portuguese Road Sector, Arabian Journal of Business and Management Review, 2016;
Firmandi Ari (2017), Indonesia infrastructure guarantee fund (IIGF), 3rd annual infrastructure project financing, a Marcus Evens Conference 24-26 July 2017 Singapore;
Ismail Suhaiza & S.R. Ajija (2011), Critical Success Factors of PPP Implementation in Malaysia, International Islamic University, Malaysia 2011;
Ji Xinhua (2016), Analysis of Realistic Foundations for Solving PPP Financing Difficulties and Countermeasures, (translated from Chinese), Shanghai Municipal Finance Bureau 05-2016;
Kam Jacob (2017), Financing Models for Railway Infrastructure - Practical Insights from Hong Kong
and Mainland China, 3rd annual infrastructure project financing, a Marcus Evens Conference 24-26 July 2017 Singapore;
Karim Raja Abd (2012), Malaysia’s BOT method implementation for highway development projects, Msc Thesis, Ritsumeikan Asia Pacific University, 2012;
Kim Narae & Hong Carrie (2017), China's Public-Private Projects Pose State Debt Risks, Bloomberg 2017;
KPMG (2008), Value-for-Money analysis of the public-private partnership for the completion of Autoroute 30, KPMG Audit report to Quebec Ministry of Transport, 2008;
Malaysia (2009), Public Private Partnership (PPP) Guideline, Public-Private Partnership Unit
Prime Minister Department PUTRAJAYA, 2009;
Malek Ezwan H.A. (2017) Prasarana, Designing Financing Strategies to Bridge Funding Gap for Rail Projects, 3rd annual infrastructure project financing, a Marcus Evens Conference 24-26 July 2017 Singapore;
Munro Gavin (2017), Societe Generale, Capitalizing on the evolving financial landscape to accelerate infrastructure development, 3rd annual infrastructure project financing, a Marcus Evens Conference 24-26 July 2017 Singapore;

73
73
Nishimura Kiyoshi (2017) CGIF, Unlocking the potential of project bonds and securitization, 3rd annual infrastructure project financing, a Marcus Evens Conference 24-26 July 2017 Singapore;
Pathak Kalpesh (2017), Brescon, Financial Engineering to Revive Struggling Infrastructure Projects, 3rd annual infrastructure project financing, a Marcus Evens Conference 24-26 July 2017 Singapore;
PWC (2017), Price Waters Coopers, Infrastructure Project Financing PPP-Day 3, 3rd annual infrastructure project financing, a Marcus Evens Conference 24-26 July 2017 Singapore;
Romero Paulo (2017), RATPDEVTRANSDEV Asia, Seoul Metro Line 9 Learnings from Korea’s first metro PPP project, 3rd annual infrastructure project financing, a Marcus Evens Conference 24-26 July 2017 Singapore;
Ray Shubhomoy (2015), Infrastructure Finance and Financial Sector Development, ADBI-WP 522, March 2015;
Ryuichi Kaga (2017), Asia faces challenges attracting infrastructure investment, ADB OP-ED/Opinion;
Samuel Danny (2017), ITNL Pte Ltd, Financing for Sub-Sovereign Infrastructure Projects in Underdeveloped Economies, 3rd annual infrastructure project financing, a Marcus Evens Conference 24-26 July 2017 Singapore;
Schueller Margot (1997), Liaoning with the burden of the past, in China’s Provinces in Reform: Class community and political culture, book edited by Peter Goodman, Routledge 1997;
Sharma Vivek (2017), CRISIL, Challenges and Solutions in Infrastructure Finance, 3rd annual infrastructure project financing, a Marcus Evens Conference 24-26 July 2017 Singapore;
Sugden Craig (2016), People’s Republic of China: a model project development fund for
Public–Private Partnership, ADB East Asia Working Paper no2, 2016;
Thieriot Hubert & Dominguez Carlos (2015), IISD, Public-Private Partnerships in China on 2014 as a landmark year, with past and future challenges, 2015;
UNDP (2012), Colombo, Sri Lanka, Case Study of Port Expansion, UNDP Special Unit for South-South Cooperation, November 2012;

74
74
Venkataraman Shobana (2017) IFC, Bankable PPPs in Emerging Markets, 3rd annual infrastructure project financing, a Marcus Evens Conference 24-26 July 2017 Singapore;
Vishwanathan Rajiv (2017), DBS Bank, Gaining Investors’ Confidence in Infrastructure Financing, 3rd annual infrastructure project financing, a Marcus Evens Conference 24-26 July 2017 Singapore;
Wang Shouqing & Ke Yonjiang, Laibin B Power Project –The First State Approved BOT Project in China, chapter in “PPP Infrastructure Development: Case Studies from Asia and Europe”, Bauhaus-Universitat Weimar 2009;
World Bank (2009), Good Governance in Public-Private Partnerships a Resource Guide for Practitioners, World Bank and DFID, 2009;
World Bank (2013), Value-for-Money Analysis—Practices and Challenges: How Governments Choose When to Use PPP to Deliver Public Infrastructure and Services, World Bank Institute (WBI) and
Public-Private Infrastructure Advisory Facility (PPIAF) 2013;
World Bank (2014), Check List for PPP Projects, Washington 2014;
World Bank (2017), Public-Private Partnerships Reference Guide Version 3, Washington 2017;
Wu Hongyuan & Others (2017), The Cat-and-Mouse Game in China’s Fight against Debt Addiction, CAIXIN June 5 2017;
Xinhua (2016), Chinese government to promote PPP to boost private investment, Beijing, Xinhua 07-2016.