table 1.1 age distribution ofthe hbsag positive...
TRANSCRIPT

10/ lRpuCts anti(})iscussion
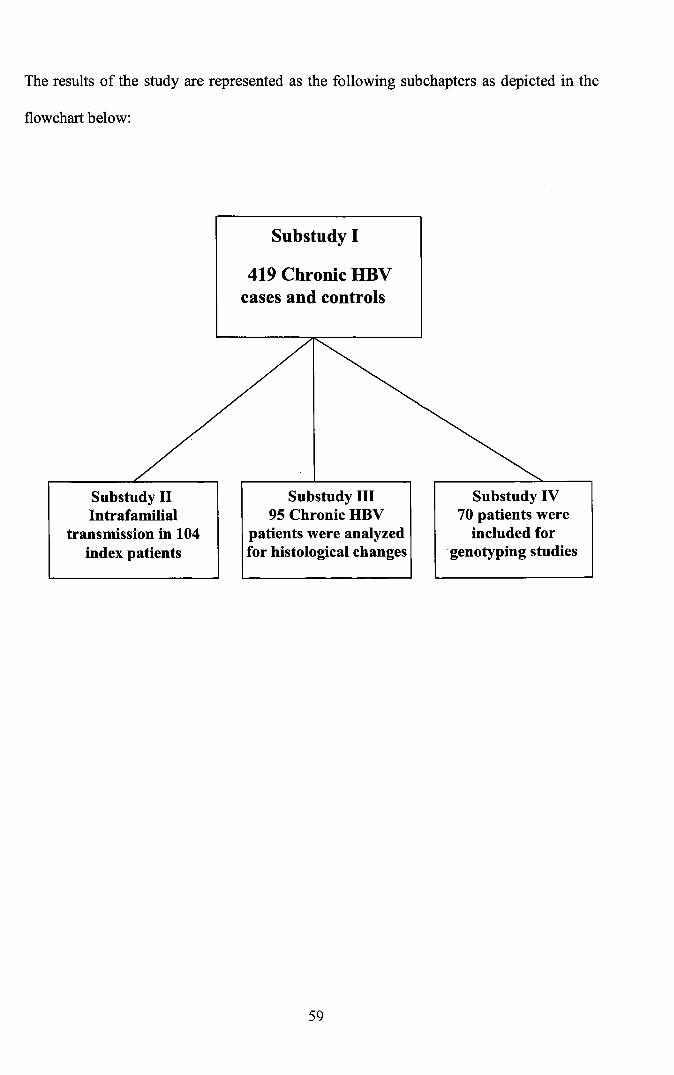
The results of the study are represented as the following subchapters as depicted in the
flowchart below:
Substudy I
419 Chronic HBVcases and controls
Substudy IIIntrafamilial
transmission in 104index patients
Substudy III95 Chronic HBV
patients were analyzedfor histological changes
59
Substudy IV70 patients were
included forgenotyping studies

Sub Study 1: Case Control Study for Risk Factor Analysis
We studied 419 HBsAg positive cases which consisted of303 males and 116 females.
Table 1.1 Age distribution of the HBsAg positive cases
Age groups Male Female Total %
8-13 10 3 13 3.1
14-19 7 6 13 3.1
20-25 55 35 90 21.5
26-31 72 23 95 22.6
32-37 65 15 80 19.1
38-43 50 12 62 14.8
44-49 24 10 34 8.1
50-55 11 7 18 4.3
56-61 8 4 12 2.9
>62 1 1 2 0.5
Total 303 116 419 100
Table 1.2 Baseline characteristics of the HBsAg positive study population
Age (Mean ± SD)
Male N(%)
Female N(%)
HBeAg Positive (%)
Bilirubin
Albumin (Mean ± SD)
Total protein (Mean ± SD)
32.80±10.51
303 (72.3)
116(27.7)
14.2%
1.094 ± 1.266
3.984 ± 0.5268
7.069 ± 0.6306
The mean age of the cases was 32.80 ± 10.51 years. A high proportion of the
patients were between the age of 20 and 43 years. Within this age group 242 (79.87%)
were male and 85(73.28%) were female patients. The association of risk factors for
Hepatitis B infection between HBsAg positive and HBsAg negative individuals is shown
in Table 1.3
60

Table 1.3 Univariate analysis of the putative risk factors for HBV infection in the case control study
Variable Case Control Pearsons Chi square OR(95% CI) P value(Continuity Correction)
Sex (Male/Female) 303/116 210/209 43.47 2.60(1.95-3.46) 0.0001
Age group (~9 / >39) 255/164 317/102 21.17 1.99(1.49-2.69) 0.0001
Marital Status 120/299 54/365 31.59 0.369(0.26-0.53) 0.0001(Unmarried! Married)Income (INR) 335/47 370/20 12.54 2.59(1.51-4.47) 0.0001~OOO / >3000Education (Years of schooling)~o years / >10 years 278/141 300/119 3.07 0.75(0.55-1.02) 0.067
Profession
Manual Labour 50(11.9%) 57(13.6%) 0.52 0.86(0.56-1.32) 0.469Skilled Labour 183(43.68%) 182(43.44%) 1.01 - 1.000Driver 44(10.50%) 15(3.6%) 15.32 3.16(1.67-6.04) 0.0001Medical Personnel 4(1%) 9(2.1%) 1.95 0.44(0.13-1.44) 0.162Housewife 96(22.9%) 150(35.8%) 16.16 0.53(0.39-0.73) .0001
History of contact with HBV subject 129(30.8%) 45(10.74%) 51.18 3.70(2.55-5.37) 0.0001
Household contacts 84(20.0%) 32(7.6%) 26.02 3.03(1.93-4.79) 0.0001
Hemodialysis 4(1%) 5(1.2%) 1.16 0.49(0.13-1.84) 0.281
History of Blood Transfusion 29(6.9%) 22(5.2%) 1.02 1.34(0.76-2.38) 0.3859
History of Injection / IV Infusions 313(74.7%) 97(23.2%) 91.17 4.87(3.49-6.81 ) 0.0001History of Dental treatment 129(30.8%) 120(28.64%) 0.46 1.11(0.82-1.49) 0.490
History of Surgery 85(20.3%) 85(20.3%) 0.01 1.0(0.70-1.42) 0.9315
Tattoo 4(1%) 10(2.4%) 1.82 2.54(0.79-8.15) 0.178
Imprisonment 2(0.5%) 6(1.4%) 0.89 1.86(0.37-9.28) 0.640
61
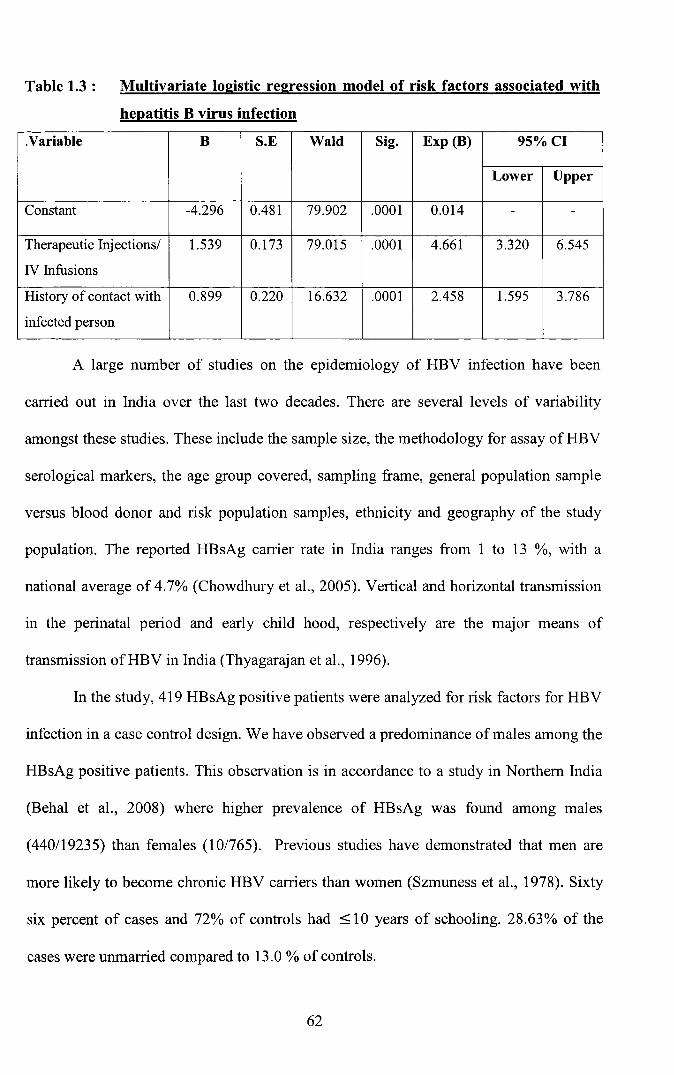
Table 1.3 : Multivariate logistic regression model of risk factors associated with
hepatitis B virus infection
.Variable B S.E Wald Sig. Exp (B) 95%CI
Lower Upper
Constant -4.296 0.481 79.902 .0001 0.014 - -
Therapeutic Injectionsl 1.539 0.173 79.015 .0001 4.661 3.320 6.545
IV Infusions
History of contact with 0.899 0.220 16.632 .0001 2.458 1.595 3.786
infected person
A large number of studies on the epidemiology of HBV infection have been
carried out in India over the last two decades. There are several levels of variability
amongst these studies. These include the sample size, the methodology for assay of HBV
serological markers, the age group covered, sampling frame, general population sample
versus blood donor and risk population samples, ethnicity and geography of the study
population. The reported HBsAg carrier rate in India ranges from 1 to 13 %, with a
national average of 4.7% (Chowdhury et al., 2005). Vertical and horizontal transmission
in the perinatal period and early child hood, respectively are the major means of
transmission ofHBV in India (Thyagarajan et al., 1996).
In the study, 419 HBsAg positive patients were analyzed for risk factors for HBV
infection in a case control design. We have observed a predominance of males among the
HBsAg positive patients. This observation is in accordance to a study in Northern India
(Behal et al., 2008) where higher prevalence of HBsAg was found among males
(440/19235) than females (10/765). Previous studies have demonstrated that men are
more likely to become chronic HBV carriers than women (Szmuness et al., 1978). Sixty
six percent of cases and 72% of controls had < 10 years of schooling. 28.63% of the
cases were unmarried compared to 13.0 % of controls.
62

On univariate analyses; unmarried status, history of contact with an infected
person, household contacts, history of therapeutic injections and intravenous infusions
received in the past were significantly (P<0.05) associated with HBsAg positivity (Table
1.2). Based on profession, skilled labour, drivers and interestingly housewives showed
risk ofHBV infection.
Age group of :::;39 years had significant risk and within this age group males had
greater risk than females (p<0.05). Similarly, in another study in India the age specific
prevalence peaks were detected in males aged 35-45 years and in females aged 25-35
years (Behal et al., 2008). A community based study in the state of Tamil Nadu showed a
high prevalence of hepatitis B infection with the highest prevalence being in the younger
(15-20 years) age group (Kurien et al., 2005).
Many studies have shown that socioeconomic status (in the present study, this
was assessed as a combination of educational level and occupational status) affects
health status, morbidity and mortality (Lantz et al., 1988; Kind et al., 1998). It has been
well documented that HBV infection is more prevalent in low socioeconomic settings in
Indonesia (Akbar et al., 1997), or perhaps a similar setting in Kerala, India. Economic
status and to a certain extent education were found to be significant risk factors (X2 12.54,
P .0001 and X2 3.07, P 0.067 respectively). This is consistent with the report by
Chowdhury et al., (2005) who showed by multivariate analysis that poverty (OR 6; 95%
CI 4.7-7.6) and low level of education (OR 7.8; 95% CI 5.1-12.0), were associated with
heightened transmission ofHBV.
Unmarried individuals had a greater risk (l31.59, p .0001) and within the group
unmarried males had greater risk than married males [OR 1.373(1.20-1.57)]. Drivers
were found to have significant risk of infection (X2 15.32, P .0001). Housewives showed
a protective effect regarding risk of infection as Odds Ratio observed was less than 1,
63
[0.53(0.39-0.73)] even though "l 16.16, p<0.05. History of contact with an infected
person and known family contacts with HBV infection were found to be significant risk
factors (i! 49.97 and X2 26.02 respectively, p<0.05). In a study from Tamil Nadu,
significant independent association (OR 1.4; p=0.006) was detected with family history
of exposure to HBV infection by logistic modeling (Kurien et al., 2005).
Even though in the present study history of dental workup did not show
significant risk (p>0.05), 10% risk was noted among the cases compared to controls
(Table 1.3). Previous reports by Cisneros-Castolo et al., (2001) suggested dental workup
as a significant risk factor for infection. Dental practice by unregistered practitioners is
common in developing countries. These non-medical personnels, besides their technical
incompetence, do not properly sterilize their equipments and thereby transmit blood
borne infections to their patients. Strict enforcement of legislation to ban such illegal
practices may result in substantial reduction in HBV transmission.
Therapeutic injections received during the past five years were significantly
associated with HBsAg status in this study (p<0.05). HBV transmission through
contaminated needles is well established (Kane et al., 1999). It needs to be mentioned
that the rural poor are still dependent upon the untrained paramedics for their treatment
needs (Chu et al., 2002). In neighbouring Pakistan, the proportion of injections per
prescription is one of the highest compared to some other countries (Janjua et al., 2005).
In developing countries, a large proportion of patients preferred injected medicines and
considered them more efficacious than other routes of drug administration (Simonsen et
al., 1999; Janjua et al., 2005). In addition to patient preference for injections, physician's
prescribing practices, their belief in better efficacy of injected drugs, direct observation
of the prescribed therapy, patients demand and financial incentive have been reported as
the reasons for increased frequency of injections in developing countries (Reeler et al.,
64

2000). Therefore, interventions to improve injection safety and reduce injection overuse
would have a substantial impact on the incidence of infection with HBV.
Some limitations of this study need to be considered in interpreting the results.
Recall bias, an inherent limitation of a case-control design, might have been introduced
in measurement of some of the variables, especially when past histories of injections,
drug abuse and sexual activities were explored (Schlesselman et al., 1982). Any bias that
might have occurred must be non-differential, thus yielded conservative estimates of
observed relationships. The lack of association observed with IDU and HBV infection
may have been due to under reporting.
Blood transfusion and hemodialysis was not found to be significant risk factors
(p>0.05) in the present study. Due to the high concentration of circulating HBV and the
virus's ability to remain viable on environmental surfaces for more than a week (Favero
et al., 1974), hemodialysis patients are especially at high risk of acquiring HBV
infection. Multiple blood transfusions and haemodialysis (Morales et al., 1998; Murthy
et al., 2003) for a prolonged period of time are known to be risk factors for developing
hepatitis virus infection especially in centers with poor screening for the viruses prior to
blood transfusion (Kapoor et al., 2000). The Western data are suggestive of a prevalence
of HBV in 5-10% of dialysis subjects, of whom more than 50% remained persistently
infected. Indian data in this regard appear scanty and are complicated by the fact that
there have been enormous variations in the data reports from various centers (Rukamni et
al., 1986; Thomas et al., 1987; Mani et al., 1994). HBsAg prevalence among Indian
studies has ranged from 3.4% to 42% (Saha et al., 2001) and Mani et al. (1994) have
reported the prevalence to be as high as 77%.
In the present study, risk for infection among health care workers was not found
to be significant. In a study among health care workers HBsAg was positive in 5% while
65

amongst the control group seropositivity was 3.5% (Ganju and Goel, 2000). Amongst the
health care workers, laboratory technicians showed highest seropositivity of 40%. A
study from New Delhi in 1997 revealed that while only 2.3% preclinical students were
positive for HBsAg and 18% and 10.4% for anti HBs and anti HBc respectively,
amongst the clinical group who had been exposed to the clinical departments, the
corresponding figures were 1.4%, 69% and 55% respectively; these figures clearly show
how great is the risk of exposure to HBV infection during exposure to clinical
departments (Khurana et a1., 1997).
Only those relevant variables found to be significant in univariate analysis were
included in the multivariate logistic regression mode1. In this model it was observed that
by logistic regression analysis; adjusting for all other risk factors it was found that
history of Injection administration / Intravenous infusions and a history of contact with a
positive person including household contacts were found to be significant risk factors
(p<0.05). Eighty two percent of cases could be predicted by including the above
variables. Hosmer - Lemeshow goodness of fit test showed that the model fits adequately
at p < 0.05.
Educational intervention targeted on healthcare professionals about the
importance of infection control measures may include safe injection practices and proper
sterilization of medical and dental instruments. Education of barbers about the
significance of sterilization of their instruments may help in reducing the burden of
community-acquired infection with HBV and other blood-borne pathogens. Strict
enforcement of legislation to ban un-qualified dental practitioners may further help curb
the HBV spread. Counseling of family members of infected patients about the risk of
transmission and strict vaccination of the family members must be recommended.
66

Sub-Study 2
Intrafamilial transmission of HBV infection in Kerala
House hold contacts of subjects with chronic HBV infection are at high risk of
acquiring infection through multiple modes (Maddrey et al., 2000; Thakur et al., 2002).
Indian subcontinent and Southeast Asia are the most populous regions in the world,
made up of countries with different degrees of prosperity and industrialization resulting
in variable clustering of HBV infection (Kim et al., 1994). Family size and relation to
index case play an important role in the clustering phenomenon (Toukan et al., 1990).
However differing results have been reported (Abdool Karim et al., 1991). Familial
clustering of HBV provides epidemiological evidence for the different modes of spread
of the virus.
Table 2.1Generation of families recruited and screened. Number of families screened1st generation(Mother and Father) 481st and 2nd generation(Mother, Father and Siblings) 441s" 2nd and 3rd generation(Parents, Siblingsand Offsprings) 12
Table 2.2 Demographic distribution of family members of HBsAg Positive index case
Characteristics Male Female TotalAccumulative
Age (year) N % N % N % %0-5 12 7.8 8 4 20 5.7 5.76 -10 19 12.3 11 5.6 30 8.5 14.211-15 26 16.9 20 10.1 46 13.1 27.316-20 9 5.8 14 7.1 23 6.5 33.821-25 14 9.2 24 12.1 38 10.8 44.626-30 11 7.1 17 8.6 28 8 52.631- 35 16 lOA 25 12.6 41 11.6 64.236-40 10 6.6 27 13.6 37 10.5 74.741-45 9 5.8 14 7 23 6.5 81.246-50 7 4.5 13 6.6 20 5.7 86.951- 55 7 4.5 6 3 13 3.7 90.656-60 5 3.2 13 6.6 18 5.1 95.761- 65 5 3.2 2 1 7 2 97.7> 65 4 2.6 4 2 8 2.3 100
Total 154 43.8 198 56.2 352 100
67

Table 2.3 Frequency distribution offamily member participants in the study.Number(%)
HBsAg positiveSex (Male%)
(Female%)Age (mean±SD)Marriage (%)
58(16.48 %)154(43.8 %)198(56.2 %)29.47±17.16203 (57.67 %)
Table 2.4
MotherFatherSisterBrotherDaughterSonHusbandWife
Table 2.5
Frequency distribution of hepatitis B virologic markers in family membersof index cases, n (%)
HBsAg positive (%)
5/44 (11.4)4/23 (17.4)14/44 (31.8)22/43 (51.2)4/61 (6.6)6/66 (9.1)0/16 (0)3/55 (5.4)
Univariate analysis of other risk factors associated with hepatitis B virus(HBV) infection in family members of the index patients.
Risk factor HBV Positive/Total (%) Crude OR(95%Cn p
MarriedYes 44/203 21.67 2.15(1.05-4.37) 0.0216No 14/149 9.4
Blood transfusionYes 1/12 8.33 0.33(0.02-2.36) 0.258No 55/ 16.18
History of Injection/ IN InfusionsYes 36/213 16.90 2.53(1.79-3.57) 0.0001No 20/13 14.39
Dental treatmentYes 12170 17.14 0.68(0.33-1.39) 0.258No 44/282 15.60CI: confidence interval, p<O.05 is significant.
Of the 104 families recruited, a total of 352 individuals were screened, of which
154 were male and 198 were female. The mean family size was 3.40±1.29. The age of
the study population varied from 1 to 73 years, with a mean age of 29.47±17.16. Fifty
two percent of the population consisted of individuals whose age was ~30 years. The
68
study population consisted of 48 families with one generation (Parent), 44 families with
two generations (Parent and Siblings) and 12 families with all three generations (Parent,
siblings and offspring's). The distribution of generations among the study subjects are
shown in Table 1. The family members included 44 mothers, 23 fathers, 44 sisters, 43
brothers, 61 daughters, 66 sons, 16 husbands, and 55 wives were enrolled in the study.
Fifty seven percent of the total family members were married. In the participants, 45.4%
had <8 years of education. The mean age of HBsAg-positive cases was 34.l9±12.7l
years. Overall, 16.48 % of family members were HBsAg positive. It was reported that
relatives of 26 positive HBsAg cases presented an intra-familial prevalence of HBV
infection of 28.8% (Aristegui et al., 1989).
In the present study 48 % of female index patients with HBsAg positive contacts
was significantly higher than male index patients (29.1%) OR [2.25(0.81-6.25)] p<0.05.
A similar observation was seen in a study from North India (Gupta et al., 2008) in which
265 household contacts of91 index patients were screened and HBV serological markers
were found more commonly in contacts of female (68.8%) index patients as compared to
males (p < 0.05). Of the 45 mothers screened, 6(13.33%) showed HBsAg positivity. Of
the 88 siblings, 37(42.4%) were HBV positive (23 of 44 males and 14 of 44 females). 10
(7.8%) of the 128 offspring's were positive (6 of 67 males and 4 of 61 females). Higher
rates of HBsAg marker were detected in the brothers (51.2%) and sisters (31.8%). This is
in accordance to a similar study in North India (Gupta et al., 2008) in which 265
household contacts of 91 index patients were screened and 48.3% of the siblings were.
HBsAg positive. The prevalence of HBsAg-positive cases in sons was 9% compared to
daughters (6%). None of the husbands of HBsAg positive wives were positive. The
infection rate in wives was 5.4%. In the current analysis females were found to have
greater risk (OR 1.29, p <0.05) compared to males (OR 0.77).
69

Thirty eight percent of family members had a previous history of hepatitis.
Though the prevalence of HBsAg was more in married family members the actual risk
for HBV infection was greater among the unmarried members (OR 4.96, p<0.05).
Family members with history of injections showed significant risk for HBV infection
(OR 2.53, p<0.05). It was interesting to note that contacts that were found to have liver
disease, were mostly asymptomatic and were detected only during family screening. It
has been shown that a fair proportion of such subjects have biochemical and histological
evidence of chronic hepatitis B (Kapoor et al., 2001). There is a need to study the clinical
relevance and outcome of such asymptomatic chronic HBV infection in the family
contacts especially with novel mutations. Horizontal transmission plays an important role
in contributing to the high prevalence of HBsAg especially in young children. Hence,
this age group needs to be targeted for primary prevention and effective vaccine.
70
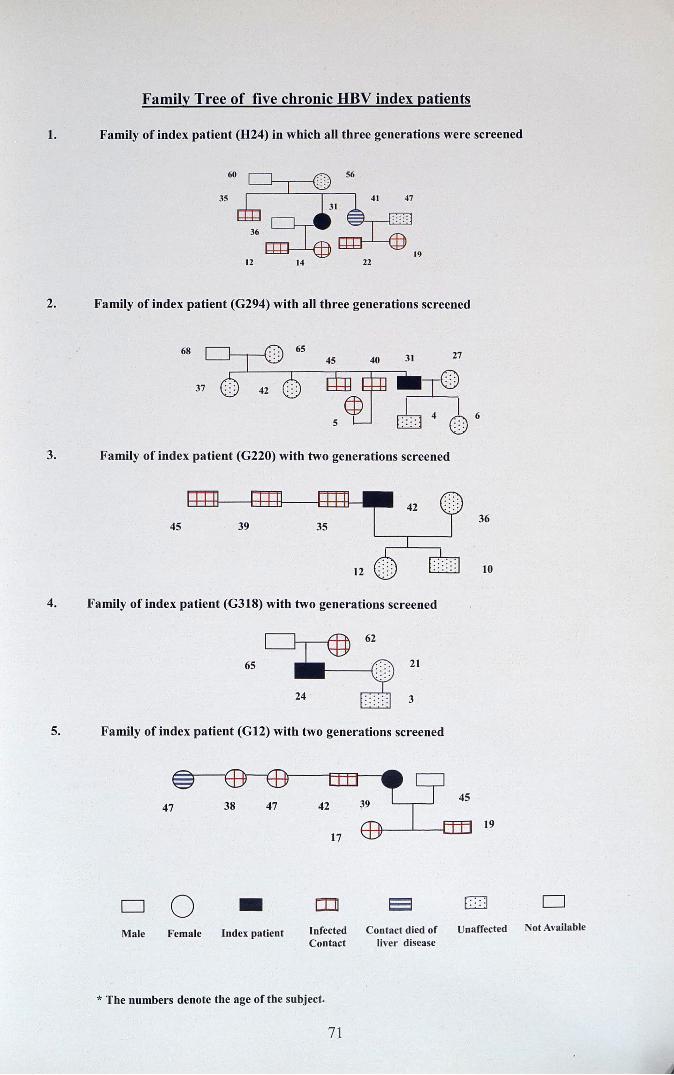
Family Tree of five chronic HBV index patients
1. Family of index patient (824) in which all three generations were screened
~E th:I -: ..35 41 47
31
~:::: :
36
1912 14 22
2. Family of index patient (G294) with all three generations screened
68
3. Family of ind ex patient (G220) with two generations screened
4S36
10
4. Family of index patient (G318) with two generations screened
6S 21
3
5. Family of index patient (G12) with two generations screened
19
D 0 • rn 8 CJ 0. .
Ma le Fema le Ind ex pati ent Infected Contact died of Unaffected Not Available
Co ntact liver disease
* The numbers denot e the age of the subject.
71

Sub-study 3
Steatohepatitis in chronic HBV infection in Kerala
Paralleling the increasing prevalence of obesity, diabetes mellitus, and the
metabolic syndrome in the general population, nonalcoholic fatty liver disease (NAFLD)
has become the most common cause of chronic liver disease worldwide (Browning et aI.,
2004; Bedogni et aI., 2005). Table 3.1 and 3.2 summarizes the clinical, laboratory and
histological findings of the patient population.
Table 3.1 Baseline Clinical and Demographic Characteristics of the patient
population.
Characteristic
Age (Mean ± SD)(Range)
Gender Male / Female
Body mass index Median (Range)
Normal (%)
Overweight (%)
Obese (%)
Hepatitis Be antigen positive(%)
AST (Mean ± SE)
ALT (Mean ± SE)
Total Bilirubin
Albumin
Total Protein
72
N=95
32.28 ± 9.142 (13-60)
88(92.6%) / 7 (7.4%)
23.80 (16.8-30.3)
68.42%
30.26%
1.32%
12.8%
52.46 ± 2.360
75.38 ± 4.360
0.995 ± 0.491
4.170 ± 0.399
7.277 ± 0.490
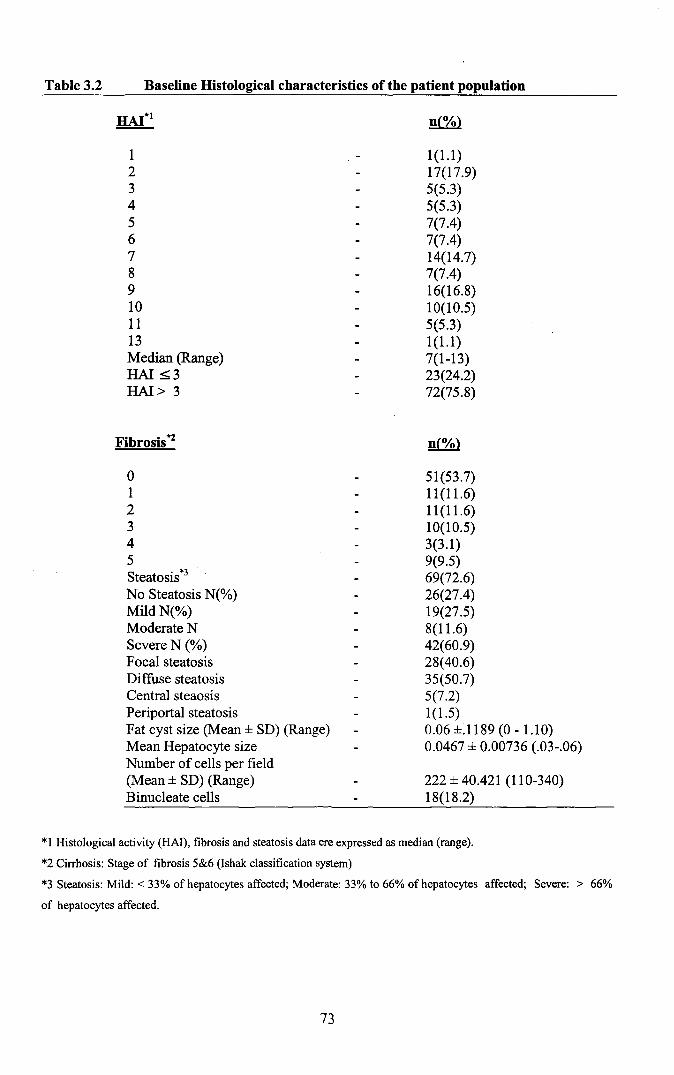
Table 3.2 Baseline Histological characteristics of the patient population
123456789101113Median (Range)HAl ::;;3HAl> 3
Fibrosis*2
o12345Steatosis*3
No Steatosis N(%)Mild N(%)Moderate NSevere N (%)Focal steatosisDiffuse steatosisCentral steaosisPeriportal steatosisFat cyst size (Mean ± SD) (Range)Mean Hepatocyte sizeNumber of cells per field(Mean ± SD) (Range)Binucleate cells
1(1.1)17(17.9)5(5.3)5(5.3)7(7.4)7(7.4)14(14.7)7(7.4)16(16.8)10(10.5)5(5.3)1(1.1)7(1-13)23(24.2)72(75.8)
51(53.7)11(11.6)11(11.6)10(10.5)3(3.1)9(9.5)69(72.6)26(27.4)19(27.5)8(11.6)42(60.9)28(40.6)35(50.7)5(7.2)1(1.5)0.06±.1189(0-1.10)0.0467 ± 0.00736 (.03-.06)
222 ± 40.421 (110-340)18(18.2)
*1 Histological activity (HAl), fibrosis and steatosis data ere expressed as median (range).
*2 Cirrhosis: Stage of fibrosis 5&6 (Ishak classification system)
*3 Steatosis: Mild: < 33% of hepatocytes affected; Moderate: 33% to 66% of hepatocytes affected; Severe: > 66%
of hepatocytes affected.
73
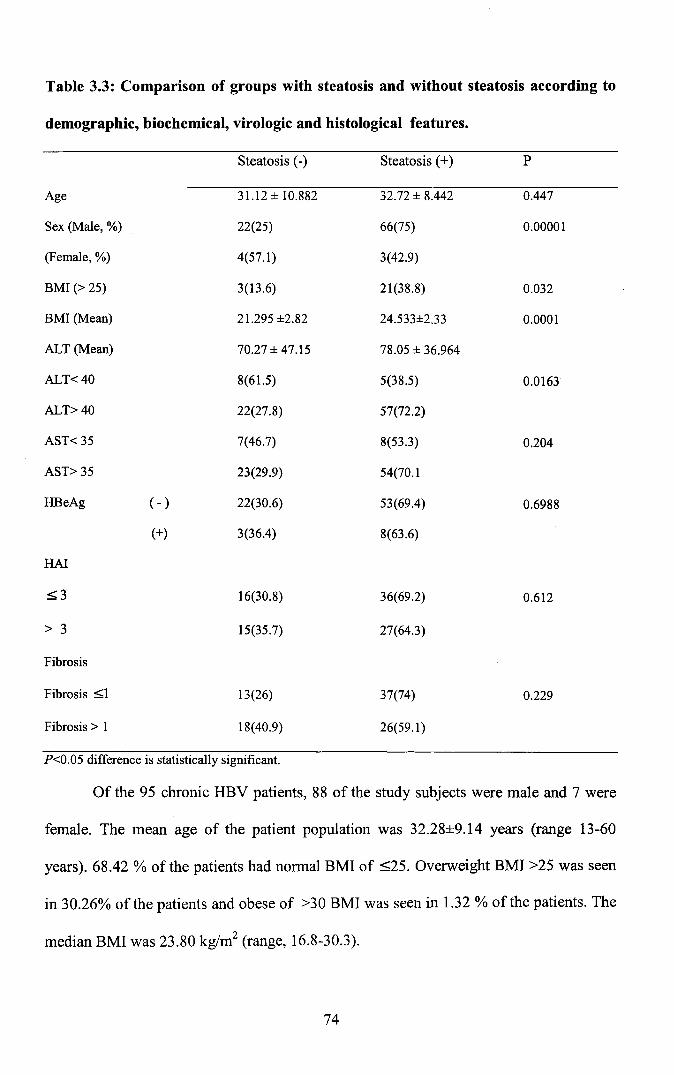
Table 3.3: Comparison of groups with steatosis and without steatosis according to
demographic, biochemical, virologic and histological features.
Steatosis (-) Steatosis (+) P
Age 31.12 ± 10.882 32.72 ± 8.442 0.447
Sex (Male, %) 22(25) 66(75) 0.00001
(Female, %) 4(57.1) 3(42.9)
BMI (> 25) 3(13.6) 21(38.8) 0.032
BMI (Mean) 21.295 ±2.82 24.533±2.33 0.0001
ALT (Mean) 70.27 ± 47.15 78.05 ± 36.964
ALT<40 8(61.5) 5(38.5) 0.0163
ALT>40 22(27.8) 57(72.2)
AST< 35 7(46.7) 8(53.3) 0.204
AST> 35 23(29.9) 54(70.1
HBeAg ( - ) 22(30.6) 53(69.4) 0.6988
(+) 3(36.4) 8(63.6)
HAl
=:;;;3 16(30.8) 36(69.2) 0.612
> 3 15(35.7) 27(64.3)
Fibrosis
Fibrosis =:;;;1 13(26) 37(74) 0.229
Fibrosis> 1 18(40.9) 26(59.1)
P<0.05 difference is statistically significant.
Of the 95 chronic HBV patients, 88 of the study subjects were male and 7 were
female. The mean age of the patient population was 32.28±9.14 years (range 13-60
years). 68.42 % of the patients had normal BMI of ::;;25. Overweight BMI >25 was seen
in 30.26% of the patients and obese of >30 BMI was seen in 1.32 % of the patients. The
median BMI was 23.80 kg/rrr' (range, 16.8-30.3).
74

HBeAg positive serology was seen in 12.8 % of the patient population. Baseline
mean ALT and AST values were 75.38±4.36 and 52.46±2.36 respectively. On baseline
75.8 % of the patients had an HAl >3. Based on stage of hepatic injury (fibrosis) 34.7%
patients had fibrosis score of >1. Patients with advanced fibrosis were older than those
with minimal or no fibrosis. (35.18 ±10.89 versus 30.74 ± 7.71 years, Students '1' test
2.31, P <0.05).
Steatosis was found in 69(72.6%) patients whereas 26(27.4%) patients had no
steatosis. In previous studies, the prevalence of steatosis in CHB patients showed a wide
range from 18 to 71% (Thomopoulos et al., 2006; Gordon et al., 2005; Bondini et al.,
2007). 87.5 % of patients with BMI>25 had steatosis of varying degree. OR=2.85 [95%
CI (0.95-8.59)]. 27.5% and 11.6% of the patients with steatosis had mild and moderate
degree of steatosis respectively. Interestingly 60.9% of the patients had severe degree of
steatosis. This shows a very high prevalence of steatosis compared to a study reported
that chronic hepatitis B has occurred concurrently with steatosis in 27% of patients
(Czaja et al., 1993). In another study, patients with hepatitis C and B in terms of risk
factors were compared, and steatosis was found to occur more frequently in chronic
hepatitis C (Czaja et al., 1998). On the basis of location of fat cysts majority of patients
had diffuse steatosis followed by focal steatosis. Five patients had central steatosis and
periportal steatosis was seen in a single patient.
The 95 chronic hepatitis B patients included in the study were subdivided into
groups with and without steatosis according to the findings of liver biopsy material.
Presence of steatosis was statistically significant among the male patients compared to
those without steatosis (X2: 57.52; p<0.05). Due to the low number of female patients in
the study, a conclusive evidence cannot be reported. It has been reported that steatosis is
75

highly associated with the female gender (Angulo et al., 1999; Caldwell et al., 1999).
Some studies describe equal rates (George et al., 1998).
The mean age in the group with steatosis was not significantly different from the
group without steatosis (P>0.05). The observation that steatosis showed an increase with
advancing age (p<0.05) is in agreement with what was reported in literature (Te1i et al.,
1994).
The mean BMI in the group with steatosis was significantly higher than those in
the group without steatosis (P<0.05). The differences in the mean ALT showed no
statistical significance (P>0.05), but the differences between the mean AST values was
statistically significant (P<0.05). The group of patients without steatosis according to the
degree of fibrosis showed that 12 (46.2%) patients were of stage 0,5 (19.2%) of stage 1,
1 (3.8%) of stage 2,3 (11.5 %) of stage 3 and 5 (19.2%) of stage 5. In the patients with
steatosis, however, 39 (56.5%), 6 (8.7%), 10 (14.5%), 7(10.1%),3 (4.3%) and 4 (5.8%)
of the patients were of stages 0, 1, 2, 3, 4 and 5 respectively. The difference between
them was not statistically significant (X:: 7.880; P >0.05). Examination of the group
without steatosis according to the Histological Activity Index revealed 19 (73.1%)
patients to be of HAl >3 and 7 (26.9%) of HAl ~3. In the group with steatosis, however
the corresponding number was 48 (69.6%) and 21 (30.4%) respectively. No association
was noted with steatosis and HAl score and the median HAl scores did not differ in
those with or without steatosis. The differences between the groups were not statistically
significant (Mann -Whitney p 0.348). Of the 95 patients, 13.3% were found to be HBeAg
(+) and 86.7% were HBeAg (-). Steatosis was found in 7(12.28 %) of those with HBeAg
(+) and in 50 (87.72%) of those with HBeAg (-). The difference between the two groups
was not statistically significant (Chi 0.1496, P>0.05). The findings are summarized in
Table 3.3
76
In the study there was a high prevalence of significant fibrosis in CHB patients
younger than 30 years (58.1 %). Several studies have reported that the prevalence of
significant fibrosis in patients with CHB at the age between the fourth and sixth decades
is 27-68% (Thomopoulos et al., 2006; Hui et al., 2005; Sebastiani et al., 2007). Further
studies with larger numbers of CHB patients in the same age group should be performed
to obtain generalized prognostic information.
Although steatosis without steatohepatitis has been shown to be of little clinical
importance, hepatic steatosis is known to be associated with liver fibrosis and fibrotic
progression in CHC patients (Fartoux et al., 2005; Adinolfi et al., 2001). The
mechanisms responsible for this involve the direct steatogenic effect including the
accumulation of intracellular lipids, enhanced oxidative stress, increased susceptibility to
apoptosis, a dysregulated response to cellular injury, altered hepatocyte regeneration and
other components of the metabolic syndrome such as hyperinsulinaemia and
hyperglycaemia (Sanyal et al., 2002; Powell et al., 2005). In contrast to Chronic
Hepatitis C, the role of hepatic steatosis in CHB has not yet been adequately evaluated.
In the present study HBeAg positivity did not correlate with fibrosis. Out of the
10 HBeAg positive patients in the study, 2(40%) with elevated ALT had a fibrosis stage
>1. A similar observation by Sarin et al showed that of the HBeAg-positive patients with
CHBV infection and persistently normal ALT, 40% had fibrosis stage ~. In a study by
Wang et al., (2005), of 14 HBeAg-positive patients with 2 ALT measurements within
normal limits in the 2 years prior to liver biopsy, 5 (36%) had stage 1 fibrosis and 6
(43%) stage 2 fibrosis. In another study by Nguyen et al (2005) patients with normal
ALT levels had stage 2 or higher fibrosis in 12% to 23% of cases.
In our study an interestingly high proportion, 22(62.8%) of HBeAg negative
CHB patients with normal ALT levels had HAl >3. In contrary to this observation a
77
study by Manoj et a1., 2008, reported that, of HBeAg positive and negative incidentally
detected asymptomatic HBsAg positive patients with persistently normal ALT, 63% and
39.7% respectively had HAl >3; and 39.7% and 13.8% had fibrosis stage ;:£ on
histology, respectively. In a study by Chandra et al (1999), 10 patients who were HBeAg
positive had normal ALT levels. Of these 3 (30%) had HAl>3 on liver biopsy.
Even by using the updated criteria for normal ALT, a fair proportion of the
subjects had significant liver damage. ALT level is commonly used to assess activity of
liver disease and to identify patients for antiviral therapy. The extent of liver cell necrosis
and fibrosis and the degree of elevated ALT levels, however, do not always correlate in
CHBV infection, as also in hepatitis C (Prati et a1., 2002; Puoti et a1., 1997). In addition,
the ALT activity may vary with body mass index, sex, abnormal lipid, and carbohydrate
metabolism as well as the time of the day (Piton et a1., 1998; Kim et a1., 2004. Patients
who have a normal ALT level but who acquire hepatitis B as adults may not necessarily
have the same degree of fibrosis at a similar age because fibrosis represents an
accumulated state of damage, and, in normal ALT level individuals who acquired their
infection perinatally, liver injury might start early in life.
Steatosis in patients with CHB was mainly associated with host metabolic factors
such as fasting glucose, BMI, waist circumference and hyperlipidaemia (Thomopoulos et
a1., 2006; Gordon et a1., 2005; Bondini et a1., 2007). Some studies, demonstrating the
association between steatosis and chronic hepatitis B, described the viruses as
"fibroviruses" in some patients and as "steatoviruses" in others (Phillips et a1., 1992;
Matsumaru et a1., 2003).
In this study, steatosis was found to be associated with obesity. The BMI was the
only factor that was related to the degree of steatosis in a linear fashion. Whereas in
some studies this linear relationship between the BMI and degree of steatosis was
78
mentioned (Angulo et al., 1999), other studies showed the opposite (Matteoni et al.,
1999). On this issue, the distribution of body fat rather than the quantity should be the
determinant (Reid, 2001).
Steatosis in chronic hepatitis C has been postulated to be associated with the
effects of the viruses rather than an immunological response and was a promoting factor
for liver damage in HCY infections (Adinolfi et al., 2001; Hourigan et al., 1999). In our
study, no relationship was established between liver damage and steatosis in chronic
hepatitis B. In conclusion, steatosis in chronic hepatitis B seems to be a result of
metabolic causes attributable to the host rather than the effect of the viruses.
79

200
~
~~
15 0
~~ ~
~~
~
~100 ~ ~
~ ~~
~~~
~ ~
I ~ ~~ ~ ~
50~
~ ~ ~
~~
~ ~ ~
~ ~
I I I I I I I
1 2 3 4 5 6 7 8 9 10 11
HAl
Fig 3.1 Scatterplot of Baseline Knodell HAl Score and ALT
Fig 3.2 Scatterplot of Baseline Fibrosis Score and ALT
80

Table 3.5 HAl grading for necroinflammatory scores.
A. Periportal or periseptal interface hepatitis (piecemeal necrosis) Score Number ofpatients
(%)Absent 0 1(1.1)
Mild (focal, few portal areas) 1 50(52.6)
Mild/Moderate (focal, most portal areas) 2 40(42.1)
Moderate (continuous around <50% of tracts or septa) 3 3(3.2)
Severe (continuous around >50% of tracts or septa) 4 1(1.1)
B. Confluent necrosisAbsent 0 21(22.1)Focal confluent necrosis 1 27(28.4)
Zone 3 necrosis in some areas 2 20(21.1)
Zone 3 necrosis in most areas 3 5(5.3)
Zone 3 necrosis + occasional portal-central (P-C) bridging 4 22(23.2)
Zone 3 necrosis + multiple P-C bridging 5 0
Panacinar or multiacinar necrosis 6 0
C. Focal (spotty) lytic necrosis, apoptosis and focal inflammationAbsent 0 21(22.1)
One focus or less per lOX objective 1 20(21.1)
Two to four foci per lOX objective 2 53(55.8)
Five to ten foci per lOX objective 3 0
More than ten foci per lOX objective 4 1(1.1)
D. Portal inflammationNone 0 2(2.1)
Mild, some or all portal areas 1 39(41.1)
Moderate, some or all portal areas 2 34(35.8)
Moderate/marked, all portal areas 3 17(17.9)
Marked, all portal areas 4 3(3..2)
Maximum possible score for grading 18Modified staging: Architectural Changes, Fibrosis and Cirrhosis
No fibrosis 0 51(53.7)Fibrous expansion of some portal areas, with or 1 11(11.6)without short fibrous septa
Fibrous expansion of most portal areas with 2 11(11.6)or without short fibrous septa
Fibrous expansion of most portal areas with 3 10(10.5)occasional portal to portal (P-P) bridging
Fibrous expansion of portal areas with marked portoportal bridging (P-P) 4 3(3.2)as well as portal-central (P-C)
Marked bridging (P-P and / or P-C) with occasional 5 9(9.5)nodules (incomplete cirrhosis)
Cirrhosis, probable or definite 6 0
Maximum possible score 6 -
81
The different histopathologic features observed in the study
a) Periportal inflammation and necrosis - In this parameter inflammatory cell
infiltration mainly composed of lymphocytes was seen expanding the portal area, but
seen confined where the limiting plate are intact.
b) Interface hepatitis - There is disruption of the limiting plate and destruction of
single or small groups of liver cells in the area with lympho-histiocytic infiltration. This
was previously termed piecemeal necrosis. But now termed interface hepatitis to reflect
the growing evidence that apoptosis and not necrosis occurs at the limiting plate
(Hubscher., 1998). The hepatocytes show degenerative features like swelling, shrinkage
or gradual disintegration by sequential fragmentation of cytoplasm (apoptosis). The
periportal parenchyma is progressively destroyed and replaced by newly formed sheets
of connective tissue. These foci are rich in inflammatory cells 'and curved.
c) Bridging necrosis - Recognized as interface hepatitis extending far into the
parenchyma and along porto- portal bridge or bridging central vein with portal tracts (De
Groote et aI., 1968).
d) Ground glass hepatocytes reflected the presence of HBsAg in the cytoplasm and
this excess protein expands the endoplasmic reticulum which is seen as a homogenous
eosinophilic staining of the cytoplasm (Bauma and Berg., 1981).
e) Ballooning degeneration - Liver cell swelling is a common feature in hepatitis
and results mainly from dilatation of the endoplasmic reticulum. The swollen cells are
pale stained as a result of intracellular oedema (Abe et aI., 1982).
82

In the HBV cases, inflammatory activity was minimal or moderate. The features
noted were periportal inflammation, interface hepatitis, bridging necrosis and portal
inflammation. The prominent hepatocyte changes noted in our study were ground glass
hepatocytes, ballooning degeneration and acidophilic bodies. The hepatocytes show
degenerative features like swelling, shrinkage or gradual disintegration by sequential
fragmentation of the cytoplasm (apoptosis) (Popper., 1982).
Our findings periportal inflammation, interface hepatitis, bridging necrosis,
ground glass hepatocytes, ballooning degeneration, portal inflammation and fibrosis
were similar to those described by Popper et al., (1982). The main feature noted in our
study was ground glass hepatocytes of varying grades similar to those reported by
Bauma and Berg (1981).
Twenty two percent of cases showed a histological grade less than that expected
based on ALT biochemical parameters. In such patients, causes other than hepatitis have
to be excluded and categorized as 'chronic HBV infection with liver disease'.
Interestingly 62% of our cases showed an HAl score higher than that expected from the
biochemical parameters. So, our study has enabled the physician to pick up these patients
for treatment. Hultgren et al., (1986) pointed out in their studies that clinical chemical
tests were diagnostically useful only in later stages of the disease. This explains the
findings in our study.
83

Description of histopathologic findings from liver biopsy tissue of patients
with chronic HBV infection
PLATE 1
1. Normal cords ofhepatocytes with typical polyhedral structure & central spherical nuclei (H&E,x 400).
2. Normal portal tract (Hematoxylin & Eosin, x 400)
3. Normal portal tract with limiting plate (LP) intact (short arrows). Portal triad (PT) (long arrow) (H&E,x
400)
4. Portal tract with dilated portal vein (PV). Hepatic artery (HA) and Bile ducts (BD) and intact limiting
plate (LP) marked by arrows (H&E, x 400).
5. Limiting plate (LP) (Normal) (H&E, x 400).
6. Limiting plate intact (LP) (H&E, x400).
PLATE 2
7. Limiting plate (LP) intact (H&E, x400).
8. Hepatocyte showing ground glass appearance with nucleus. Short arrow shows a Kupffer cell (K). Long
arrow shows nucleolus (NL) (H&E, x 400).
9. Hepatocytes with ballooning degeneration (BD)(arrows). The hepatocyte is swollen and pale, with
indistinct cell membrane and rarified cytoplasm. (H&E, x 1000)
10. Plant cell appearance. Sinusoids (S) are prominent (H&E, x 100)
11. Plant cell appearance (PC) with loss of polyhedral structure and thick cell membrane (TM) (H&E,x
400).
12. Plant cell appearance showing thickened cell membrane (TM) and a binucleate cell (BN) (H&E, x
1000).
PLATE 3
13. Liver cell showing binucleate cell (BN) marked by arrow (H&E, x 400).
14. Large nuclei (Nucleomegaly) (N) (H&E, x 400).
15. Section showing both nucleomegaly and binucleate cells (H&E, x 100).
16. Nuclear vacuolation (H&E, x400).
17. Marked nuclear vacuolation (H&E, x 400).
18. Cytoplasmic vacuolation (CV) (H&E, x400).
PLATE 4
19. Mallory Hyaline (MH) shown by arrow (H&E, x 400)
20. Normal hepatic sinusoids with basolateral surface ofhepatocytes facing the sinusoids (H&E, xl00)
21. Irregular dilated sinusoid (S) (marked by arrow) (H&E, x 400).
22. Eosinophilic infiltrate (E) found in peripotrtal area (H&E x 1000).
23. Eosinophilic infiltrate (E) near necrotic liver cells (H&E x 1000).
24. Marked Triaditis with infiltration by lymphocytes (H&E, x 100).
84

PLATE 5
25. Liver tissue section showing focal fatty change (H&E, x400).
26. Liver tissue section showing Hartroft cysts (figure of8 formation) (H&E x 100).
27. Macrovesicular steatosis showing fat cyst with excentric nucleus (H&E x 1000).
28. Formation ofhartroft cyst (He) with cell wall about to rupture (H&E, x 40).
29. Liver tissue showing extensive fatty change with multiple hartrofts cyst (H&E, x 400).
30. Shows extensive centrilobular fatty change around central vein (CN) (H&E x 100).
PLATE 6
31. Periportal fatty infiltration (H&E x 400).
32. Focal necrosis (FN) (H&E, x 1000).
33. Liver section showing Bridging necrosis (BN) (marked by arrow) (H&E, x 400).
34. Bridiging necrosis (BN) (H&E, x 400).
35. Bridging necrosis (BN) (H&E, x 100).
36. Liver section showing porto-portal bridging necrosis (BN) (H&E xl00).
PLATE 7
37. Stellate necrosis with typical star shaped pattern formed by aggregation oflymphocytes, (H&E, x 100).
38. Fibrosis with pseudolobulation (hyperplastic liver nodule) (H&E, x 100).
39. Bridging necrosis with fibroblastic nodule.
40. Bridging necrosis (High power) with hyperplastic nodule liver (arrows) (H&E 100)
41. Bridging necrosis and hyperplastic nodule with fatty change (H&E x 400).
42. Liver section showing Bridging fibrosis (BF) (marked by arrows) (H&E, x 100).
PLATE 8
43. Liver tissue showing Fibrous septa and hyperplastic nodules of liver tissue (H&E, 40X).
44. Tissue section showing stellate fibrosis around portal tract and hyperplastic liver nodules (H&E, x
100).
45. Section showing fibroblasts in stellate fibrosis (H&E, x400).
46. Hyperplastic nodule (H&E x 100).
47. Pseudolobules (H&E x100).
48. Nodule (H&E, x400) (High power).
PLATE 9
49. Section showing nodule that is not cirrhotic. Sinusoids are present are present (H&E x 400).
50. Kupffer cells (K) (marked by arrows) (H&E x 1000).
51. Kupffer cell hyperplasia (H&E x 1000).
52. Kupffer cell proliferation (H&E x 400).
53. Section showing Focal necrosis (FN) surrounded with kupffer cell hyperplasia (Ke) (H&E x 1000).
54. Condensation of reticulin in the peripheral rim of necrosed liver cells and fibroblastic proliferation
(arrow) (H&E x 1000).
85

PLATE - 1
1
3
5
2
4
6

PLATE - 2
7 8
9 10
11 12

PLATE - 3
13
15
17
16
18

PLATE - 4
19 20
21 22
23 24

PLATE - 5
25
27
29
26
28
30
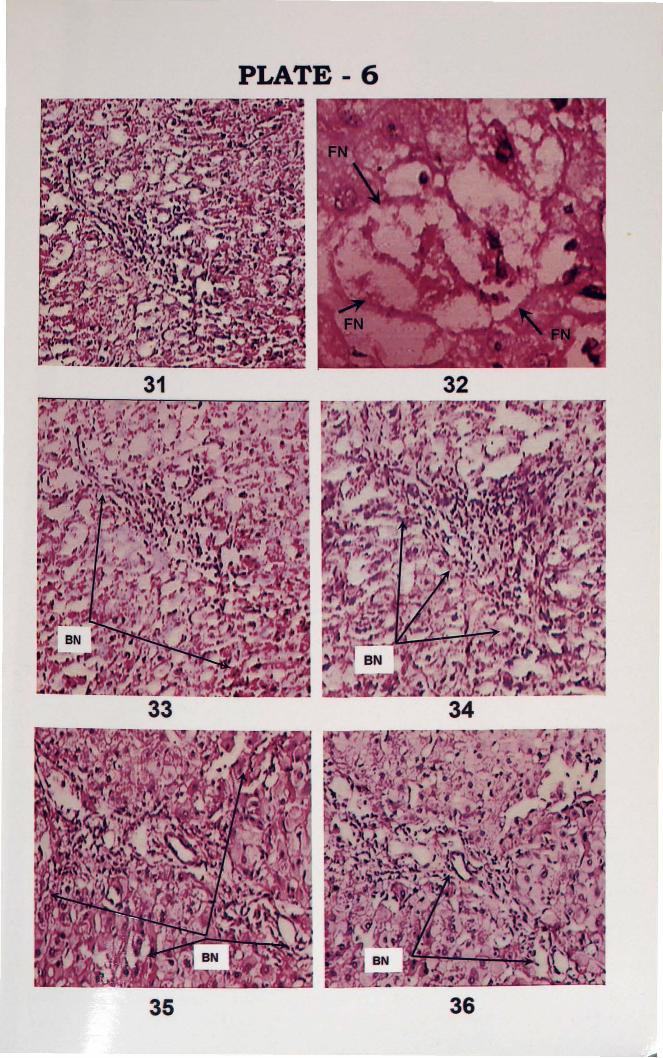
PLATE 6
31 32
33 34
35 36
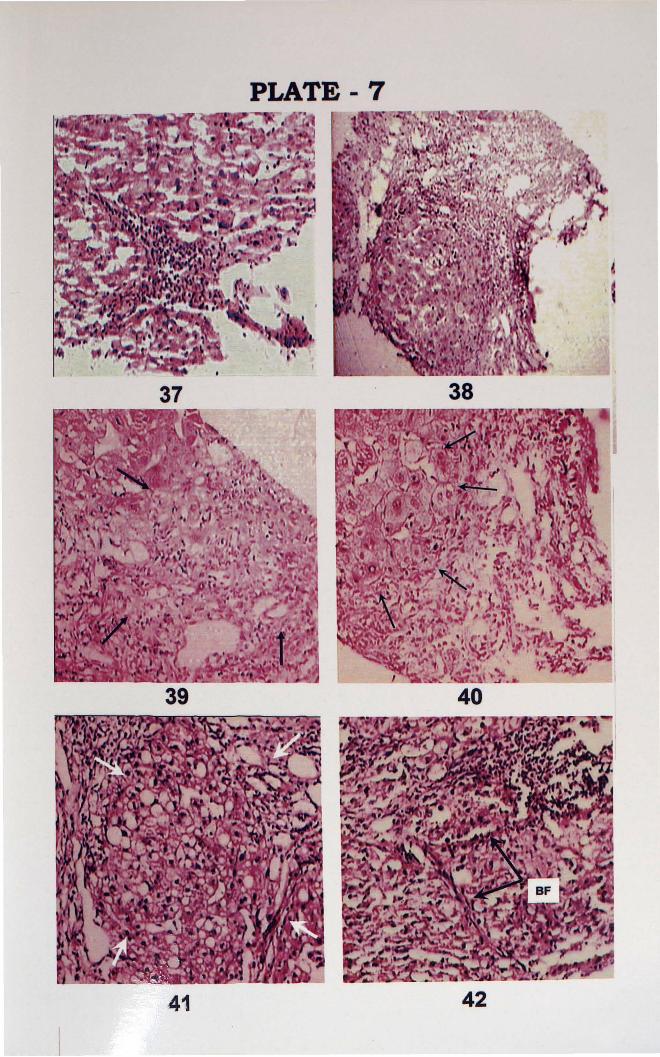
PLATE 7
37
39
38
40
41 42
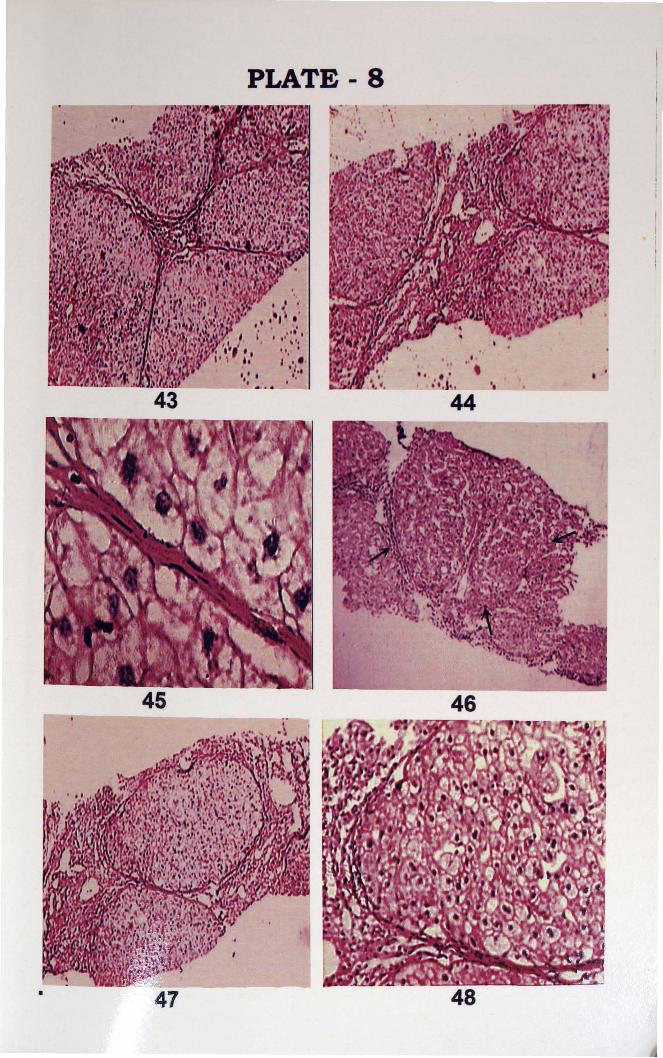
PLATE 8
44
" .,
43" ,t t
",..•..','.1'" .'.. · .i· .
,"
45 46
48

PLATE - 9
49 50
51 52
53 54
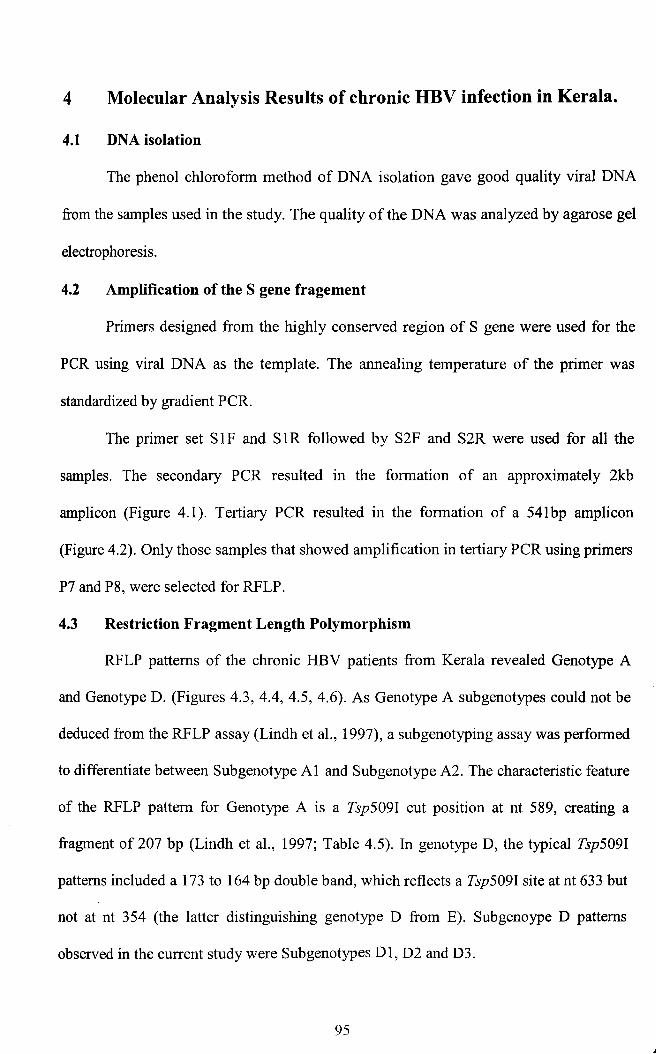
4 Molecular Analysis Results of chronic HBV infection in Kerala.
4.1 DNA isolation
The phenol chloroform method of DNA isolation gave good quality viral DNA
from the samples used in the study. The quality of the DNA was analyzed by agarose gel
electrophoresis.
4.2 Amplification of the S gene fragement
Primers designed from the highly conserved region of S gene were used for the
peR using viral DNA as the template. The annealing temperature of the primer was
standardized by gradient PCR.
The primer set S IF and SIR followed by S2F and S2R were used for all the
samples. The secondary PCR resulted in the formation of an approximately 2kb
amplicon (Figure 4.1). Tertiary PCR resulted in the formation of a 541bp amplicon
(Figure 4.2). Only those samples that showed amplification in tertiary PCR using primers
P7 and P8, were selected for RFLP.
4.3 Restriction Fragment Length Polymorphism
RFLP patterns of the chronic HBV patients from Kerala revealed Genotype A
and Genotype D. (Figures 4.3, 4.4, 4.5, 4.6). As Genotype A subgenotypes could not be
deduced from the RFLP assay (Lindh et aI., 1997), a subgenotyping assay was performed
to differentiate between Subgenotype Al and Subgenotype A2. The characteristic feature
of the RFLP pattern for Genotype A is a Tsp509I cut position at nt 589, creating a
fragment of 207 bp (Lindh et aI., 1997; Table 4.5). In genotype D, the typical Tsp509I
patterns included a 173 to 164 bp double band, which reflects a Tsp509I site at nt 633 but
not at nt 354 (the latter distinguishing genotype D from E). Subgenoype D patterns
observed in the current study were Subgenotypes Dl, D2 and D3.
95

lkb"
Figure 4.1Amplification ofHBV DNA fragment after secondary nested PCR The approximately 2kbproduct represents the PCRl product using the primer (2451F/1280R). Lanel - lkb DNAladder, Lane (2-7): Sample HBV DNA, Lane 8 - Primary PCR negative, Lane 9- Positivecontrol, Lane 10- Secondary PCR Negative.
500bp
Figure 4.2Amplification of the S gene after tertiary nested PCR The ---+ represents the 541 bptertiary PCR product formed by using the primer (256F1796R). Lane 1 - 100bp DNA ladder,Lane (2-14)- Sample HBV DNA, Lane 15- Primary PCR Negative, Lane 16 - Secondary pe RNegative, Lane 17- Positive control.
A
lAl
A
+A
lAl
A
lAl
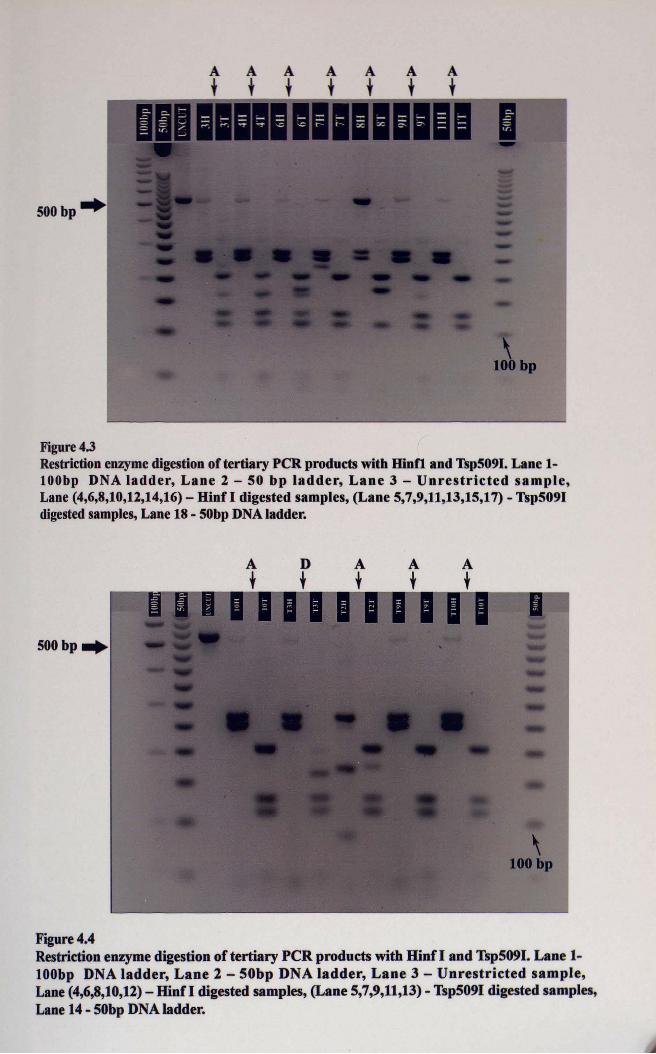
Figure 4.3Restriction enzymedigestionof tertiary peR products with Hinfi and Tsp509I. Lane 1lOObp DNA ladder, Lane 2 - 50 bp ladder, Lane 3 - Unrestricted sample,Lane (4,6,8,10,12,14,16) - Hinf I digested samples, (Lane 5,7,9,11,13,15,17) - Tsp509Idigested samples, Lane 18 - 50bp DNAladder.
A
lDl
A
lA
lA
l
500bp-,
Figure 4.4Restriction enzyme digestion of tertiary peR products with Hinf I and Tsp509I. Lane 1lOObp DNA ladder, Lane 2 - 50bp DNA ladder, Lane 3 - Unrestricted sample,Lane (4,6,8,10,12) - Hinf I digested samples, (Lane 5,7,9,11,13) - Tsp5091 digested samples,Lane 14 - 50bp DNA ladder.

At
Dt
At
At
At
500 bp
Figure 4.5Restriction enzyme digestion of tertiary PCR products with Hinf I and Tsp509I.Lane 1 - 100bp DNA ladder, Lane 2 - 50 bp ladder, Lane 3 - Unrestricted sample,Lane (4,6,8,10,12) - Hinf I digested samples, Lane (5,7,9,11,13)- Tsp5091 digested samples,Lane 18 - 50bp DNA ladder
A
tA
tDt
At
Dt
Dt
Dt
500 bp
Figure 4.6Restriction enzyme digestion of tertiary PCR products with Hinfl and Tsp509I. Lane 1-100bpDNA ladder, Lane 2 - 50 bp ladder, Lane 3 - Unrestricted sample, Lane (4,6,8,10,12,14,16) Hinfl digested samples, Lane (5,7,9,11,13,15,17)- Tsp5091 digested samples, Lane 18-50bp marker.
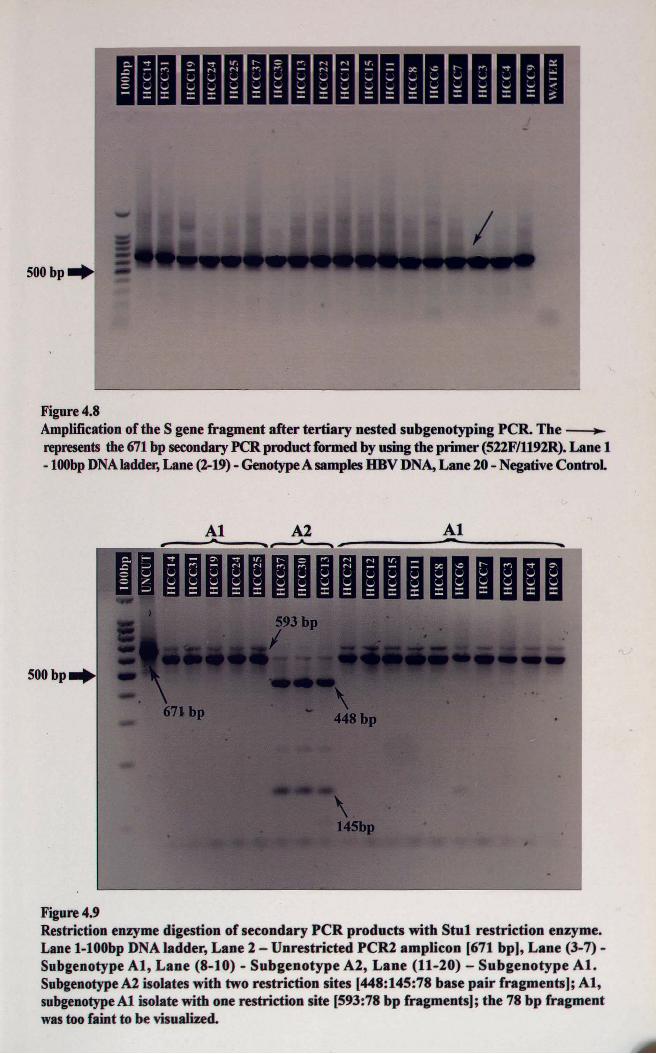
Figure 4.8Amplification of the S gene fragment after tertiary nested subgenotyping PCR. The~represents the 671 bp secondaryPCR product formed by using the primer (522F/1192R). Lane 1-100bpDNAladder,Lane (2-19) - GenotypeA samples HBV DNA,Lane 20 - NegativeControl
500bP.
A2.. At
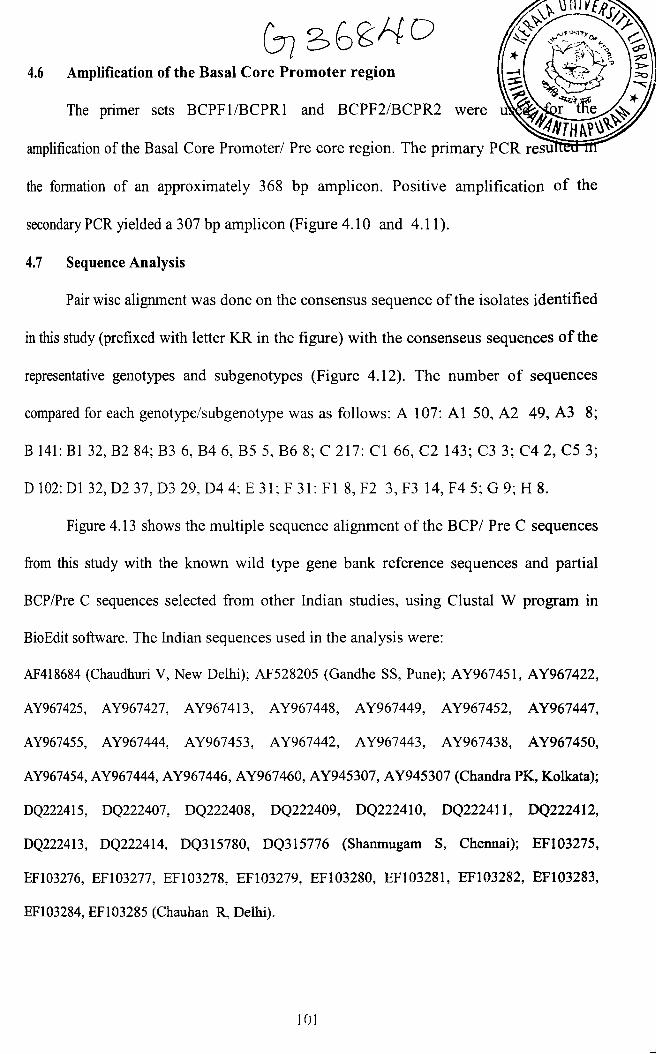
Figure 4.9Restriction enzyme digestion of secondary PCR products with Stul restriction enzyme.Lane 1-100bp DNA ladder, Lane 2 - Unrestricted PCR2 amplicon [671 bp], Lane (3-7)Subgenotype AI, Lane (8-10) - Subgenotype A2, Lane (11-20) - Subgenotype At.SubgenotypeA2 isolates with two restriction sites [448:145:78 base pair fragments]; AI,subgenotypeAl isolate with one restriction site [593:78 bp fragments]; the 78 bp fragmentwastoo faint to be visualized.
4.6 Amplification of the Basal Core Promoter region
The primer sets BCPFI/BCPRI and BCPF2/BCPR2 were
the formation of an approximately 368 bp amplicon. Positive amplification of the
secondary PCR yielded a 307 bp amplicon (Figure 4.10 and 4.11).
4.7 Sequence Analysis
Pair wise alignment was done on the consensus sequence of the isolates identified
in this study (prefixed with letter KR in the figure) with the consenseus sequences of the
representative genotypes and subgenotypes (Figure 4.12). The number of sequences
compared for each genotype/subgenotype was as follows: A 107: AlSO, A2 49, A3 8;
B 141: Bl 32, B2 84; B3 6, B4 6, 85 5, 86 8; C 217: Cl 66, C2 143; C3 3; C4 2, C5 3;
D 102: Dl 32, D2 37, D3 29, D4 4; E 31; F 31: Fl 8, F2 3, F3 14, F4 5; G 9; H 8.
Figure 4.13 shows the multiple sequence alignment of the BCPI Pre C sequences
from this study with the known wild type gene bank reference sequences and partial
BCP/Pre C sequences selected from other Indian studies, using Clustal W program in
BioEdit software. The Indian sequences used in the analysis were:
AF418684 (Chaudhuri V, New Delhi); AF528205 (Gandhe SS, Pune); AY967451, AY967422,
AY967425, AY967427, AY967413, AY967448, AY967449, AY967452, AY967447,
AY967455, AY967444, AY967453, AY967442, AY967443, AY967438, AY967450,
AY967454, AY967444, AY967446, AY967460, AY945307, AY945307 (Chandra PK, Kolkata);
DQ222415, DQ222407, DQ222408, DQ222409, DQ22241O, DQ222411, DQ222412,
DQ222413, DQ222414, DQ315780, DQ315776 (Shanmugam S, Chennai); EF103275,
EF103276, EFI03277, EFI03278, EFI03279, EFI03280, EF103281, EFI03282, EFI03283,
EFI03284, EF103285 (Chauhan R, Delhi).
I fJ I

500bp
Figure4.10Amplification of the BCP I Pre C fragment after secondary nested PCR. The--+represents the 307 bp secondary PCR product formed by using the primers(BCP2FIBCP2R). Lane 1- 100 bp D A ladder, Lane (2-16) - Sample HBV DNA.
500 bp
Figure 4.11Amplification of the BCP I Pre C fragment after secondary nested PeR. The--+represents tbe 307 bp secondary PCR product formed by using the primer(BCPIF/BCP IR). Lane 1-100 bp DNAladder, Lane (2-15)- Sample HBV DNA,Lane(16-17)- Negative Controls.

..... 11.. ..
. . • . .R•. R.
• . • . •R. •'.:.. . . . . R. .R.. . . • •R• .,• .. . . . .R. . R... .. . R.. ..
. . . • •R•• . .
.. ... R ..
.... .R ..
. . . . . R .
• .. •• A.• R.• • . • •R• • . •• . •• •R•• . .
. .. . .'R.. .'.
. . . . • •. R. .
.. .... T...
. R.. .. ....
•K.. .. .. ..
. . . . .W T ;r,. .
. . .. . .. .. T . . . .• .. Tl. ·
. . • • .W.• •T ••• . •. •T,•.
.. .. .W T T..
.. . ..W T T..
.. ... A T T'..
. .. .. .. .. T T..• . • • •A• . •T • •••• . •1,. ... .. .A. .. T .... . Y. Y:..
I• • • •. A• •. T . .• . • . .Ti. ·
..... A T T..
.. .. •A T T..
. • .• .A. . •T . . • •• . .T••
.. .. .. ... T T..
.. ... . .. .T r..••• .. • . . •T . •••.. •T•.,. .. .. . .. .T T... .. .. . .. .T T........ .. .T T... . • .T T '!f• •.... T T T... , ••T•• ••T . ..•• . . ',".... T T ...... T T T... . . . . . . . .T T. .. .• .T• . . .T .1• •
.• •. • • •.•. • •• . • • .Y• •
. . . .. . •R..
.. ... .. G..
.. ..... G..
• ••h • • • 1• • • • • • • • • • • • • • • • • • • • • • • • • • • • • • • • • • • • • • • • •• • • t . , •• , · · · ·· •• ••• • •• • • •• • • • • • • • • • • • • t oO", • • • •
d.' . . . . T....TT,' ~. . .il • • • • ' • • ·
J .Y MIL ,' .
•TTl' . . .. ~ .•TT•. •• .;" .I
.TT.. .. .. .
.TT •. . . '1'"
.TT,. . . . . .•
.;rTi·· ··T·
.TT•. . . . . .1.• I l.'(T '..1'
.TT· ,~ .t' •
. TT·. . .. . '1"I '
•TT·• • • •. '• •I ,
•TT-• ••• •'• •
.;rT ' 11 '
•TT: I..! I
. 'l'T. ... . ~., .
.TT .W..". . C., ' .
.!..,T.... ,... 1. ..
.... .. .. s.
"0 • • • •• • • , • • • •• • •• , ••••• 0 0 • • •
• ••••• • •• • •••• •• I t •• • • t •• • • • ••
.. C ..
.. C ..
.. C ..
.. C .· .Y .
· . C .
· .C .· . C .
.. C ..
.. C ..
· . C .
· .C. . • . . . .
· .Y .· .Y•. • •. • •· . C .
.. C ..
.. C ..
.. C ..
. . Y•. . •. . .
.. C .
.. C .
· . C .
·TIf··.....Tr G• • • •••
..M .
· .Ii R•• •
··I·I A• • •
: : I~II : ::~:: :. .. . .. A•. •• •I.IY• • • • • •
1809 18991753 1762 1764 1802-1803 J. 1812 1817 1858 1862 1888 1896.1.
17'0.j.. 1760 .j.. .j.. 1770 1780 1790 1800 .j.. 1810 .j.. .1. 1820 1830 1840 18'0 .1.1860 .1. 1870 1880 .1.1890 .1. 19001 .... \ .... \ .. .. \ .. .. 1 .. .. 1· .. · 1 .. .. 1.. .. 1 .... 1.. .. 1 .. .. 1.... 1 .... 1.. .. 1 • .. - I .. .. 1 .. .. 1.. .. 1 .... 1.... 1 .. .. \ .... 1 .. · ·1 .. .. ( .... 1· · .. ( • • .. 1.. .. \ .. .. 1.. .. 1 .A GATTAGGTTA AJ;'GRTCTTTG TATTAGGAGG CTGTAGGCAT AAATTGGTCT GC"GCACCAKC ABCATGFAAC TTTTTCACCT CTGCCTAATC ATCTCTTGTA CATGTCCCAC T,IlTTCAAGCC TCCAAGCTGT GCCTTGGNTG GCTTTGGGGC
. ..... . . . . ...... . . . . . .... .. ... . r " • • /f. 'B v , ..ConsensAConsensAlConsensA2ConsensA3ConsensBConsensBlConsensB2ConsensB3ConsensB4ConsensBSConsensB6ConsensCConsensClConsensC2ConsensC3ConsensC4ConsensCSConsensDConsensDlConsensD2ConsensD3ConsensD4ConsensEConsensFConsensFlConsensF2ConsensF3ConsensF4ConsensGConsensHConsens Kerala
Fig 4.12 Multiple Sequence Alignment of the consensus nucleotide sequence of the Basal Core Promoter/ Precore region (1750-1900) from this studycompared with consensus sequences of all genotypes and subgenotypes. [B=G/T/C;H=A1T/C;K=T/G;M=A1C;N=A/G/C/ T; R=G/A; V=G/A/C; W=A/T;Y=C/T). The shaded columns shows the Loci in the Basal Core Promoter and Precore region where mutations were analyzed.

" ~Co s.... 0...0 ~C "" '" ~
C e "'"" ~Co - ........ ~ e... c """~ =...
M
" QC.. .::,. -... ICC r-
~ - ...c:: QC
.i...
e --"
":l.:: " c... .:: c- ...... '" "i:
.. ~s "":l .:: "'"" '" ~'" '"a c ....- e--"""e .= -" e e-
"""u -lo'l - I-E ~
QCQC
= e-'" --'" -; ......= " '""g:: i= -:t -- ~ .=;;- -~ --.!E--'"---• = "'"--- -- -;: =--- '"'" i:'"~ ;;-
~-... ... ..E
e ::---l: ~!'
!'
........ .... .......................... .. ..
:c c.. ..
.. .. .. ........................ .. .. ................ .... .... ................ _ .... - ...... .. .. .. .. .. .. .. .... .. .. .. .. .. .. .... .. .. .. .. .. ..
.......................... .. .. .. .. .... .... .. ........ .... .. .. .. .. .... ...... .. .. ....
...
· c
: ,;
:: :: : : : : :: : : : .. : :~~ : : :: : : : : : : :
II 11II IIlIlI ..II II ..II 11 ..1111 - ..II It II ..II II II ..II II II .-II II II ..
:1 :: :: :: :: : : : : : : : :c : : : : :: ..:: :: :: :1 :: ., : : :c : : : : : : : :II II 11 I I 11 , ., .c: ..II II U I I n ..II II II II II · ..II II II 11 11 .. .. ..11 II II II II .. ..II 11 11 II II " .. ..
c c . c
.... llUII II II II 11 11 II ..
.. •·11 tI II II .. II JIll II ..
:: ?!!:1Ii 11!! Ii !! !! !: ~ :: :: : : : : :: ~ : : : :: : :~ : :: : : : ..•, .·1111 11 11 11 11 11 II II
I
.. _ II II II
.... II II II
.. .. II II P
.. _II II II_ .. II 1111_ .. u II II_ .. II II II.... II U II.... If II II.... II II II
.. - II II II II
.... p II II II
.... II IIl1 II
.. " II 1111 II
.. "II 11 11 II
.. .. II lilt II
.. .. lI II II II
.. _1111 It II
.. " 1111 1111III II II
II II II1111 II1111 II1111 II111111II II IIII II IIII II IIII II IItill II
..
•• c
.... - t :c : : c. ccc : .. :c .. : c :c...
........ , ..- ito' .... Ito ..- !to ..
................... .................. ..
::c: :. , ~ ~ :. ., ., .. :: ., , .. ..• I t I I~ .. t:: - , , , , ., I I ., .. " II II II II II II II
:;-e: rl _ t l IIIlIlII" l llltl ..
- to ••
- Ii-- " •- c .. .. " U " .: -c ..... · to .
- Q;l: ..
·: -u.. -u <:8-u- ~
: ~! ~ :.. .... . . .
· e :Je· u· u
:~·u
• · u:- (00O· U:t:!-u-u
: ~ ..o : ~
· c- u- ~
=: :t::l : -: -
!: ::::::: :: : : : :: : : : : : :::.. 1Jo< .. .. .. .. .. .. .. .. H. !%%: II- r: o " n
: t : : : : : : : : : : : : : : : : : :: : : II
:~~ : :: :: :: :: :: :: :: :: :: :: :: :: :: :: :: :: :: :: :: !!_ - c , II.. 0 00 11- tit -II
.:i : : : : : : : : : :: :: :: : : : : : : : : ::- a.. , ., , .. o' .. " II- ra II.. ... .............. .. .. .. .... ...... .. .... .. II
t --- 11
.t - - - , - , , .. - , , II
:1 : : : :: :: : : : : : : .. :: : : : :: :: : : ::- ~ , - , II
.:~ : ~ ::::: ::::::::: :: ~= : q; :: : : :1- ~ - - II
: ~ : ~ : :: :: :: :: , .: :: ::a .. f:j;< , ' .. II
:--.: , , II_ _~ , II
- .;.. _ ' , - 11.. - , .' .. _ ' , II.. • ~ t.=l.:l ' - ~ • II
- ... .. .:: iC " iC ~ ; - ;. ... .. " iC " ,c: JC C: ~ '; i
··.-
- iIoo ..If ·e ...- ..o:L :::::::::
·~: .. : .. : : .. : : : :
to..I
ItItto-
..
A8056515 G
L------------9=7=-1AF160501 G
AF405706G
'------- ><75656 C3
.------ A8090268 02
12
'------------ AJ344117 03
41 AF411411 C1
.--- ----'3::..;7--1 AV217358 B2
L------AF223960 C2.-- 050521 B1
,----- 000331 83
AV090458 F1
A8036910 F2
AV090454 H
AV090460 H
AB059660 H
22
7
45
48
'------- ><75658 F2
KR306CR
><51970 A2
X701BS A2
KR355CR
KR382CR
42
18
39
1 KR144CR
22:.J------ KR197CR
14 KR227CR
'------- KRHCC17
KR187CR
20 KR241CR
KR151CH
KRHCC20
84 KR320CR
.------ KRHCC19
M57663 A1
.-------- KR294CR
L---------."....,.-r------- KR282CR
8
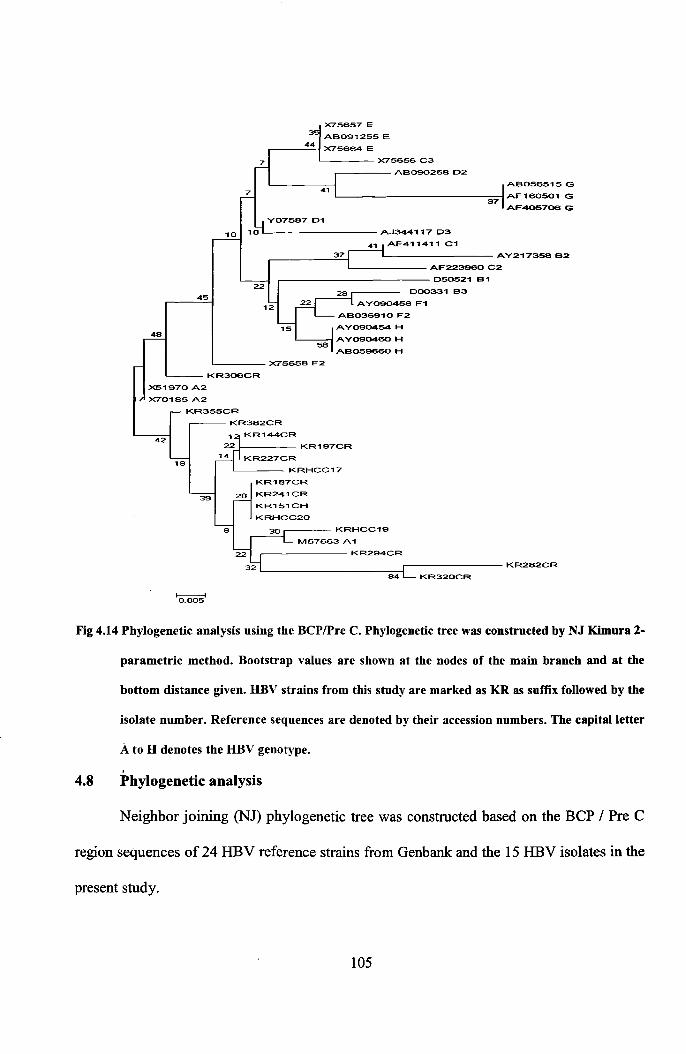
Fig 4.14 Phylogenetic analysis using the BCPlPre C. Phylogenetic tree was constructed by NJ Kimura 2-
parametric method. Bootstrap values are shown at the nodes of the main branch and at the
bottom distance given. DBV strains from this study are marked as KR as suffix followed by the
isolate number. Reference sequences are denoted by their accession numbers. The capital letter
A to D denotes the DBV genotype.
,4.8 Phylogenetic analysis
Neighbor joining (NJ) phylogenetic tree was constructed based on the BCP / Pre C
region sequences of 24 HBV reference strains from Genbank: and the 15 HBV isolates in the
present study.
105

Except KR306CR all the study sequences were found to cluster with Genotype A
and subgenotype AI. Sequencing of the BCP/Pre C region alone is not sufficient in
deducing the genotype. Kramvis et al., (2008) reported that by sequencing two regions of the
HBV genome, namely, the S region (position 155-835) and Basal core promoter/precore
region (1653-1900), HBV strains can be accurately genotyped.
4.9 Distribution of HBV Genotypes
A total of 70 HBsAg positive samples were analyzed out of which 59 samples could
be genotyped. The baseline mean age of the patients was 44.52 ± 13.52 with a male
predominance (Male: Female- 47:12). Two groups of patients were analyzed based on
severity of disease; 37 patients diagnosed with hepatocellular carcinoma and 22 patients
including both chronic HBV and HBV cirrhosis patients (based on their elevated ALT levels
and histology scores). 76.3% (45/59) of the samples were found to be infected by HBV
genotype A and 23.7% (14/59) by genotype D (Table 4.1).
Table 4.1 Distribution of genotypes among different groups of patients
Genotypes HCC(%) Cirrhosis/CHB(%)
Genotype A 30(81.08) 15(68.18)
Genotype D 7(18.92) 7(31.82)
Table 4.2 Mean age distribution of genotypes among different groups of patients
Genotypes HCC Cirrhosis/CHB Students 't' pTest
Genotype A 45.0±9.10 34.67±12.79 2.832 0.008Mean Age±SD
Genotype D 51.83±13.41 39.57±13.l4 1.662 0.125Mean Age±SD
106
In the present study genotype A was found to be the most prevalent genotype among
the HBV patients in Kerala (Table 4.1). This result is in contrast to various studies on HBV
genotype distribution across India. In northern India, HBV/A and HBV/D are present in
almost equal proportion (Kumar et al., 2005; Thakur et aI., 2002). The previous finding by
Thakur et al showed genotypes D and A were detected in 48 and 46% of the patients,
respectively. In contrast to the present study recent reports by (Chattopadhyay et al., 2006)
showed that HBV/D is the predominant genotype, as also in southern (Vivekanandan et al.,
2004) and western India (Gandhe et al., 2003). Similar to our findings, Thippavazulla et al.,
(2006) reported that genotype D (subgenotype Dl) and genotype A (subgenotype AI) were
prevalent in South Indian population. Banerjee et aI., (2006) had reported genotype D
having subgenotypes Dl, D3 and D5 in Eastern India.
The thirty three genotype A isolates that were subjected to subgenotyping PCR
revealed 29 (87.88%) isolates of subgenotype Al and four isolates (12.12%) of subgenotype
A2. The genotype D subgenotypes revealed by Lindh et aI., (1997) pattern, were distributed
as nine isolates of subgenotype D1, three isolates of subgenotype D2 and two isolates of
subgenotype D3.
4.10 Association of HBV genotypes with clinical severity of liver disease
Because of the small number of patients analyzed, the subsequent description of
results is presented as a comparison between genotypes A and D. It was interesting to note
that all the patients belonging to the chronic HBV group were of genotype A whereas 50%
of the cirrhosis group analyzed had genotype D. In the group with HCC, 81.1% (30/37)
patients were of genotype A. The results were not statistically significant to suggest that
Genotype A is associated with severe liver disease in patients from Kerala (p>0.05), but the
higher percentage of Genotype A in the HCC isolates compared to the Chronic/Cirrhosis107
group would suggest a greater risk of genotype A for severe liver disease. A study by Kew
et al., (2005) found that there was a 4.5 fold increased risk among HBV carriers with
genotype A and was entirely attributable to the effect of subgenotype AI.
Contradictory reports are found on the association of HBVID with clinical outcomes
from different parts of India. Reports from northern India reveal that HBV/D is associated
with more severe liver disease (Thakur et al., 2002; Chattopadhyay et al., 2006), even
among young HCC patients (Thakur et al., 2002). However, in another study from the same
region reported that HBVIA is more commonly associated with liver cirrhosis (Kumar et al.,
2005).
In the current analysis the HCC patients infected with genotype A were younger than
those with genotype D (p <0.05). Reports from western India suggest that HBV/D does not
influence the clinical outcome (Gandhe et al., 2003); conversely, HBV/D was detected in a
significantly higher proportion among asymptomatic carriers than among chronic HBV
infected patients in southern India (Vivekanandan et al., 2004).
4.11 Association of HBV genotypes with histological severity of liver disease
Liver histology was available at baseline in 9 patients in the Chronic HBV group.
The median histological activity index (HAl) on the baseline biopsy was not significantly
different between the genotype groups (7 [3-10] genotype A [n = 8] and nine [1-10]
genotype D [n = 1]; P= 0.4). Similarly the median fibrosis stage was also not significantly
different between genotype groups (0.5 [0-6] genotype A, and 1 [0-6] genotype D; P = 0.7).
A low patient number may have contributed to this result.
4.12 Basal Core Promoter and Precore Region Mutations
A relationship between Basal core promoter, precore mutations and genotypesl
subgenotypes had been reported by Kramvis and Kew (2005). Because the basal core108

promoter (Kramvis and Kew, 1999) and precore region (Kramvis and Kew, 1998) are
important in viral replication and gene expression, mutations/variations within these regions
may contribute to differences in disease progression as a result of infection with different
gentoypes/subgenotypes.
TABLE 4.3 The Loci in the Basal Core Promoter and Precore Regions that wereobserved and statistically analyzed
Locus Position Mutant / variant Wild-
Observed Common Raretypes
1 1753 T C A,G,G/T T2 1762-1764 T-A, A-A T-A A-A,A-T, AG
G-A,T-G,T-AiG
3 1802-1803 CG CG CT TT4 1809-1812 TCAT, TCAT ACAC,CCAC, GCAC
TTCT,TTAT, GAAC,GCTC,TCCG GTAC,GTTC,TATT,TCAG,
TCCT, TCNT,TTAT5 1817 CAA TAA CTA CAA6 1858 C,T C None T7 1862 T,G T A,C G
8 1888 A,G A C,T G
9 1896 G A AlG G10 1899 G A C G
Table 4.4 Distribution of Mutations by HBeAg Status
Types of mutations HBeAg Negative HBeAg Positive1753 1 0
1762,1764 5 11802-1803 0 01809-1812 4 0
1817 0 01858 14 01862 9 31888 4 01896 0 01899 0 0
A1762T, G1764A+G1862T 4 0
109

TABLE 4.5 Association between Mutations and Genotype A
Position Mutant/variant Regression coefficient P-value
1753 C 0.077 0.7941762-1764 T-A 0.167 0.341
1862 T 0.319 0.0441888 A 0.234 0.094
HBeAg-negative chronic hepatitis B is prevalent in the Mediterranean countries and
a proportion of such patients harbor changes in the precore region which prevents HBeAg
production (Sarin et aI., 2002). However, mutations in the Precore region have also been
detected in HBeAg-positive patients as a mixed mutant and wild type population (Yuen et
aI., 2002). Mutations in the Pre C region could affect viral replication by blocking viral
assembly with accumulation of unencapsidated replication intermediates in the hepatocyte
which could increase their integration into chromosomal DNA contributing to
hepatocarcinogenesis (Kramvis et aI., 1998; Zhong et aI., 2000; You et aI., 2004). Deletion
mutants in the precore region could also increase the risk of hepatocellular carcinoma.
Upstream to precore region is the core promoter; this region regulates viral
replication. It consists of a basal core promoter (BCP) and upstream regulatory sequences
(URS). The BCP region consists of TA-rich sequences, which serve as both initiator and
TATA box for transcription initiation of Precore mRNA and C mRNA/pregenome,
respectively (Chen et aI., 1995).
Mutations in the BCP decreases the transcription of pregenomic RNA and precore
messenger RNA and leads to low secretion ofHBeAg (Hou et aI., 1999; Lindh et aI., 1999).
Selection of the precore variant is also dependent on HBV genotype; it is most common in
patients with HBV genotype D and rare in genotype A (Li et aI., 1993).
110
The prevalence of mutations in BCP and Pre C region and their correlation with
HBV genotypes and disease severity is still not clear in Indian patients. It has been reported
that 25% of hepatitis B-related chronic liver disease in Asian Indians were due to mutant
HBV viruses where precore variant contributes up to 15% and the surface variants up to
10%ofthe mutant viruses (Guptan et aI., 1996).
4.12.1 Prevalence of Mutations of the Basal Core Promoter (BCP) and Pre-Core (Pc)
Regions
The 10 loci studied and their definitions are depicted in Table 4.3 above.
Amplification and sequencing of the Basal Core Promoter and Precore region showed
missense mutations 1762A-T 1764G
-A and 1762A 1764G
-A mutation. Of the 15 sera analyzed,
it was observed that 8(53.3%) sera had AI762G1764 wild-type virus while 6 (40 %) had
Tl762A1764 mutants and 1 patient showed a rare A1762A1764. This 1762A 1764G-A mutation has
rarely been reported to occur alone in previous studies, whereas the double mutant has been
described in ASCs and patients with chronic hepatitis, fulminant hepatitis and HCC
(Takahashi et aI., 1995).
C1753 mutation was seen in a single patient in whom 1762TI1764A mutation was
also present. It was reported that (nt 1750-1755) rich mutations ofBCP region are associated
with the absence of e antigen in Indian patients Chauhan et aI., (2006). It was documented
that C1753 with T1762/A1764 significantly enhances viral replication and lowers HBeAg
expression (Parekh et aI., 2003; Tanaka et aI., 2006).
In the study all the six samples with T1762/A1764 mutations were of genotype A
within which one patient had HBeAg positive serology and the rest were HBeAg negative.
This is in accordance to a study by Chauhan et aI., (2006) which showed that the double
mutation were higher in negative HBeAg with high ALT. The BCP T1762/A1764 mutations111

were detected in HCC patients from Asia and Africa. A study from China showed that close
to 100% of HCC patients tested had BCP T1762/A1764 mutants in both serum and tumour
tissue (Fang et al., 1998). Another report from Taiwan showed that 71% of HCC patients
had BCP T1762/A1764 mutants (Kao et al., 2003). The prevalence ofBCP T1762/A1764 in
African patients with HCC was 66% compared with only 11 % in asymptomatic carriers
(Baptista et al., 1999). Recently, it was reported that the presence of genetic mutations in the
BCP and Pre C regions in cirrhosis patients was predictive for HCC development (Tong et
al., 2006). Other studies identified the role of BCP mutants with high HBV DNA levels in
hepatocarcinogenesis (Liu et al., 2006).
All the 15 samples sequenced in this study showed C1802 and G1803. Nucleotide
changes at positions 1802-1803 and 1858 represent variants rather than mutations and are
stable traits within the genotypes (Kramvis et al., 2008). It has been documented that 1802-
1803 CG are characteristic of genotypes A, D and E whereas 1802-1803TT are
characteristic of genotypes B, C, and F (Kramvis et al., 2008).
In our study 10 patients with genotype A / subgenotype Al showed the common
mutation TCAT at 1809-1812. Baptista et al., (1999) reported the presence of nucleotide
substitutions within the Kozak sequence, immediately upstream of the initiation codon of the
precore region that were shown subsequently to interfere with the translation of HBeAg
precursor (Ahn et al., 2003). At the level of translation, double nucleotide substitutions at nt
1809 and 1812 immediately upstream of the precore ATG initiation codon, 5'-
1CATCATGC-3' (precore start codon underlined and double substitutions in italics), and
occasional triple nucleotide substitutions with an additional mutation at nt 1811 was
reported by Baptista et aI.,(l999) and Ahn et al., (2003). Previous studies by Dushieko et al.,
(1985) have shown that these mutations are exclusively found in subgenotype Al isolates.112

The presence of 1762T11764A mutations together with tile 1809-1812 mutations reduced
HBeAg expression in an additive manner (Ahn et al., 2003). Mutations at positions 1809 and
1812 have previously been reported to occur only occasionally: in a Philippino man,
(Estacio et aI., 1988) in lout of 29 HBV strains from 14 different countries, and in chronic
hepatitis patients after orthotopic liver transplantation (Kidd-Ljunggren et al., 1995)
All the samples analyzed showed wild type 'C' at position 1817. Prevalence of
codon 15 variants was found to be 6 % for TI858 variant and 94% for C l 858 variant. The
. I . It' h T 1858 fsmg e ISO a e WIt was 0 genotype D on RFLP. Cytosine (C) at position 1858 is
.. I . d . h 1858positrve y associate WIt genotypes A, F, and H, whereas T is associated with genotype
B, D, and E (Kramvis et aI., 2008).
It was very interesting to note that 80% of the samples analyzed from the patients in
Kerala had G 1862T mutation. The mutation at 1862 affects HBeAg expression by
interfering with the maturation of HBeAg at the posttranslational level. This mutation
replaced valine for phenylalanine (VI7F) at aa 17 of the Pre core region and was associated
with HBeAg negativity where 75 % of the 12 HBeAg-negative patients had G1862T (VI7F)
compared to 3 HBeAg positive patients (Table 4.4). This result is in contradiction to the
study by Chauhan et aI., (2006) where this mutation was significantly associated with
HBeAg positivity in which 17 (37%) of 46 HBeAg-positive patients had G1862T (VI7F)
compared to 4 (11%) of 36 HBeAg-negative patients (P<0.05). It is known that G1862T
mutants can affect the replication of HBV (Nassal et aI., 1996), reduce the production of
HBeAg (Hou et al., 2002) and markedly impair genome replication (Guarnieri et al., 2006).
It was concluded by Chauhan et aI., (2006), that Pre core G1862T mutant is Genotype A
specific and is not always associated with e antigen. In our study all the samples that showed
G1862T was of subgenotype A 1. This conforms to previous studies that showed G1862T is113

prevalent in HBV/AI (Tanaka et aI., 2004; Chandra et aI., 2007). Further, positive
correlation was seen in 12 (85.71%) of 14 patients with genotype A with G1862T mutation
which is in accordance with the study by Chauhan et al ., (2006).
In our study four samples of subgenotype Al had G1888 and the remaining ten
subgenotype Al samples had A1888. It was reported that Adenosine at position 1888 was
positively associated with subgenotype Al and can be used to differentiate subgenotype Al
from the other sub genotypes of A. (Kramvis et aI., 2008). The 1888A variation, associated
with subgenotype AI, introduces a start codon upstream from the core open reading frame
and can conceivably affect the expression of core protein leading to decreased viral levels
(Kimbi et aI., 2004).
In our study, G 1862T mutation also presented a specific pattern of tetra mutations;
G1809T, C1812T, and G1888A along with it in 9 (64.3 %) subgenotype Al patients. The
linked loci 1809-1812, 1862, and 1888, found frequently in subgenotype AI, result in
suppression of HBeAg expression by different mechanisms (Kramvis and Kew, 2007).
The nt 1862 and nt 1888 nucleotides are positioned in the 6-nt bulge and upper stem,
respectively, and make essential elements in the pregenome encapsidation signal. The nt
1862 is G in the wild-type HBV and occupies the third position in the 6-nt bulge. The
conversion of G1862 to any of the other three nucleotides can affect the replication of HBV
(Nassal et aI., 1996) and can reduce the production of HBeAg at the post-translation level in
expression studies in vitro (Hou et aI., 2002). At the protein level, substitutions of nt 1809
and 1812 result in double amino acid replacements in the X protein, A 146S and P147S. The
core promoter substitutions at nt 1762 and 1764, which are prevalent in HBV/Aa, also result
in double amino acid changes in the X protein, Kl30M and Vl31 I. As the transactivation
domain of X protein is mapped in the carboxyl-terminal portion (Li et aI., 1999), these114

changes not only may affect the replication of HBV, but also may playa role in HBV
related hepatocarcinogenesis as previously proposed (Kao et al., 2003).
The classical 1,896 stop codon mutation are commonly associated with genotypes B
and D but not with A, C, and E. The emergence G to A mutation at position 1896 leads to
the stabilization of the encapsidation signal because genotype Band D have T at position
1858 (Lok et al., 1994). Nucleotide sequencing of the precore region ofHBV isolates from a
number of countries has shown the 1896 stop codon mutation to be a frequent cause of the
HBeAg negative phenotype (Carman et al., 1989; Okamoto et al., 1990), with other
nonsense or frame-shift mutations accounting for a small proportion (Miyakawa et al.,
1997).
The Pre core stop codon mutation, G1896A (W28Stop), was absent in all of the
study samples sequenced including both HBeAg positive and HBeAg negative serology. All
the patients had wild type G1899 sequence. The low rate of this A1896 mutation is similar
to previous findings from India (Chandra et al., 2007; Banerjee et al., 2005). A study by Li
et al., (1993) showed that the 1,896 mutation is rarely found in genotype A. This is
interesting as far as HBV infection in Kerala is concerned as many recent reports are
available where both TI762/A1764 and A1896 mutations are often found in patients with
advanced liver disease (Bla'ckberg et al., 2003; Kao et al., 2003).
Absence of Pre Core mutation in HBV/A was expected due to the presence ofC1858
instead of T 1858 (Kao et al., 2002), hence no G-T wobble base pairing occurs (Schaefer et
al., 2005). A lower rate ofPreC mutation from eastern (Chandra et al., 2007; Banerjee et al.,
2005) and western India (Gandhe et al., 2003) has already been documented, but a report
from southern India (Vivekanandan et al., 2004) has described a high frequency of Pre C
115
mutation both in blood donors and in chronic liver disease patients. This discrepancy of
prevalence of Pre core mutation is striking but remains unexplained.
These associations and linkages between the mutations within the Basal core
promoter and precore regions have important biological implications. The absence of
HBeAg expression in HBeAg negative carriers with wild type precore region both in this
and other studies (Hawkins et al., 1994; Dienes et al., 1995) cannot be explained by our
observations. The genotypes/subgenotypes of HBV show heterogeneity in their global
distributions (Miyakawa and Mizokami., 2003; Kramvis et al., 2005) and may have
differences in their biological properties. It has become increasingly evident that the
hetero~eneity in the global distribution of HBV genotypes/subgenotypes may account not
only for differences in the prevalence of HBV mutations in the different populations but
may also be responsible for differences in the clinical outcomes of HBV infections and the
response to antiviral treatment.
116