table grape irrigation benchmarking xxx-x-xxxxx-xxx-x (online) ... table grape irrigation...
TRANSCRIPT

Table Grape Irrigation Benchmarking 2002 - 2011
Horticulture Services

Table Grape Irrigation Benchmarking
Seasons 2002 - 2011
Prepared for: Department of Sustainability and Environment
Prepared by: Maxine Schache, Richard Ratna and Linda Pollock
Department of Primary Industries
Telephone 03 5051 4500
Email [email protected],
If you would like to receive this information / publication in an accessible
format (such as print or audio) please call the Customer Service Centre
on 136 186 TTY 1800 122 969, or email [email protected].
Published by the Department of Primary Industries
Horticulture Services, April 2012
© The State of Victoria 2012.
This publication is copyright. No part may be reproduced by any process except in accordance with
the provisions of the Copyright Act 1968.
Authorised by the Department of Primary Industries
1 Spring Street, Melbourne 3000.
ISBN xx-x-xxxxx-xxx-x (print)
ISBN xxx-x-xxxxx-xxx-x (online)
Disclaimer This publication may be of assistance to you but the State of Victoria and its employees do not guarantee that the publication is without flaw of any kind or is wholly appropriate for your particular purposes and therefore disclaims all liability for any error, loss or other consequence which may arise from you relying on any information in this publication.
For more information about DPI go to www.dpi.vic.gov.au or phone the Customer Service Centre on 136 186.

Table Grape Irrigation Benchmarking 2002 - 2011 3
Contents
List of Figures 4
List of Tables 5
Executive summary 7
1 Introduction 8
1.1 Background 8
1.2 Irrigation benchmarking 8
1.3 Report style 8
2 Method 9
2.1 Data collection 9
2.2 Indicators of irrigation performance 9
2.3 Site locations 10
3 Results 11
3.1 Yield and irrigation water applied 11
3.2 Irrigation application efficiency 19
3.3 Crop production per ML of water applied 25
3.4 Gross return per ML of water applied 29
3.5 Cost of water per tonne of fruit 31
3.6 Gross return per dollar water input 32
Conclusions 33
Appendix 34
A. Further reading 34
B. Performance indicator formulas 35
C. Performance indicator tables 36
D. Interpretation of box plots 52

4 Table Grape Irrigation Benchmarking 2002 - 2011
List of Figures
Figure Title Page
1 Site locations included in study 10
2 Box plot of yield between 2003 and 2011 11
3 Box plot of water applied between 2003 and 2011 11
4 Box plot of yield per irrigation system type for 2009, 2010 and 2011 13
5 Box plot of water applied per irrigation system type for 2009, 2010 and 2011 13
6a Yield at sites using drip irrigation grouped by variety and ranked with respect to yield 14
6b Yield at sites using low level irrigation grouped by variety and ranked with respect to yield 15
7a Water applied at sites using drip irrigation grouped by variety and ranked with respect to yield 16
7b Water applied at sites using low level irrigation grouped by variety and ranked with respect to yield 17
8 Box plot of yield per irrigation scheduling method for 2009, 2010 and 2011 19
9 Box plot of water applied per irrigation scheduling method for 2009, 2010 and 2011 19
10 Box plot of irrigation application efficiency between 2003 and 2011 20
11 Box plot of irrigation application efficiency per irrigation system type for 2009, 2010 and 2011 21
12a Application efficiency at sites using drip irrigation grouped by variety 22
12b Application efficiency at sites using low level irrigation grouped by variety 23
13 Box plot of irrigation application efficiency per irrigation scheduling method for 2009, 2010 and 2011 24
14 Box plot of crop production per megalitre of water applied between 2003 and 2011 25
15 Box plot of crop production per megalitre of water applied per irrigation system type for 2009, 2010 and 2011
25
16a Crop production per megalitre of water applied at sites using drip irrigation grouped by variety 26
16b Crop production per megalitre of water applied at sites using low level irrigation grouped by variety 27
17 Box plot of gross return per megalitre of water applied between 2003 and 2011 29
18 Box plot of cost of water per tonne of fruit between 2003 and 2011 31
19 Box plot of gross return per dollar water input between 2003 and 2011 32

Table Grape Irrigation Benchmarking 2002 - 2011 5
List of Tables
Table Title Page
1 Number of participating growers, field sites and total area per season 9
2 Number of sites, average seasonal amount of water applied and yield - Irrigation system type comparison
12
3a Sites using drip irrigation ranked with respect to the highest yield 14
3b Sites using low level irrigation ranked with respect to the highest yield 15
4a Sites using drip irrigation ranked with respect to the lowest water applied 16
4b Sites using low level irrigation ranked with respect to the lowest water applied 17
5 Number of sites, average seasonal amount of water applied and yield - Irrigation scheduling method comparison
18
6 Percentage of sites within, over and under the recommended 85-90% range of application efficiency 20
7 Average application efficiency - Irrigation system type comparison 21
8a Sites using drip irrigation ranked with respect to the highest application efficiency 22
8b Sites using low level irrigation ranked with respect to the highest application efficiency 23
9 Average application efficiency - Irrigation scheduling method comparison 24
10 Average crop production per megalitre of water applied - Irrigation system type comparison 25
11a Sites using drip irrigation ranked with respect to the highest crop production per megalitre of water applied
26
11b Sites using low level irrigation ranked with respect to the highest crop production per megalitre of water applied
27
12 Average crop production per megalitre of water applied - Variety and irrigation system type comparison
28
13 Average gross return per megalitre of water applied ($/ML) - Irrigation system type comparison 29
14 Average gross return per megalitre of water applied ($/ML) - Variety comparison 30
15 Average cost of water per tonne of fruit - Irrigation system type comparison 31
16 Average gross return per dollar water input ($/$) - Irrigation system type comparison 32

6 Table Grape Irrigation Benchmarking 2002 - 2011

Table Grape Irrigation Benchmarking 2002 - 2011 7
The DPI Table Grape Irrigation Benchmarking Project was
initiated during the season 2001/02. It was established
primarily as a tool for identifying “best irrigation management
practices” with the goal of improving irrigators' performance
and efficiency.
This annual report contains nine years of growers' data, from
Victoria and New South Wales, covering seasons 2002/03 to
2010/11. Examples of the main information gathered for
each site were the amount of water used, the variety, the
irrigation system and scheduling method used, the pumping
and water costs, and the crop yield and gross return.
While the number of growers in the study has remained
around 13 to 14 over the years, in season 2010/11 the
number of sites (65) and associated area (132.9 ha) have
increased by 26 and 72.6 ha respectively when compared to
season 2002/03. It should be noted that this is not a
representative sample of growers and care must be adopted
when attempting to extrapolate the results to the broader
irrigation community.
The grape varieties planted at the different sites were
Autumn Royal, Calmeria, Cardinal, Crimson Seedless,
Flame Seedless, Ohanez, Menindee Seedless, Rally
Seedless, Red Emperor, Red Globe, Thompson Seedless
and Zante Currant.
The extreme rainfall events experienced by many table
grape growers in the 2010-2011 irrigation season led to
many sites in this study being water logged or prone to high
disease pressure, both of which led to lower quality and
yields.
The average yield of all varieties for drip irrigated sites in
2011 (5.7 t/ha) was less than half that of 2010, and 21.8 t/ha
lower compared to the average of 2009. In the case of low
level irrigated sites, the average yield in 2011(5.4 t/ha) was
8.6 t/ha and 18.5 t/ha lower than the averages of 2010 and
2009 respectively.
For the first time since 2005 there were more participants using capacitance probes (27) than reported experience (18) as their scheduling method. There was virtually no difference in the average water applied for each of the scheduling methods reported in 2011Irrespective of the irrigation scheduling method used, the seasonal averages in 2011 were among the lowest of the nine seasons studied. The median values for water applied for drip (4.01 Ml/ha) and low level (4.27 Ml/ha) irrigated sites were very similar in the 2011 season. In 2011 75% of the low level sites used 4.57 Ml/ha or less while 4.61 Ml/ha was the median for the drip irrigated sites. The medians for the previous two years for low level irrigated sites were 9.21 Ml/ha in 2010 and 8.31 Ml/Ha in 2009 and 6.59 Ml/ha and 7.39 Ml/ha for drip irrigated sites in the same years.
The season 20010/11 resulted in 13.8% of sites scoring
within the target 85-90% application efficiency range with a
further 33.8% scoring over 90%. This result indicates that
there are still many sites that could improve their timing and
amount of irrigation.
The average application efficiencies for sites with drip
irrigation were more consistent over the nine years and were
also higher than those for low level irrigation. In 2011, the
application efficiency for low level irrigation was 21% less
than the average for drip irrigation, and 1% below its own
nine-year average of 86%. The nine-year averages show
that drip irrigated sites had an application efficiency average
of 86% while the low level irrigated sites only averaged 74%.
The crop production per megalitre results for both drip (0.55
t/Ml) and low level (0.39t/Ml) irrigated sites were the lowest
on record. Despite the drop in water applied for each of the
irrigation systems (see Figure 5) the reduced yields (see
Figure 4) had a greater influence on these results. The
results from previous years ranged from 1.4 t/Ml (2007) to
4.85 t/Ml (2003) for drip irrigated sites and 1.8 t/Ml (2006) to
3.47 t/Ml (2004) for low level irrigated sites. In 2011 the
range was greater for drip irrigated sites (0 to 6.9 t/Ml) than
for the low level irrigated sites (0 to 4.58 t/Ml).
The results for 2011 shows that both drip (1.4 t/Ml) and low
level (1.3t/Ml) irrigated sites average crop production per
Megalitre were the lowest on record. Both were well under
their long term average with drip 1.1 t/Ml less. The different
varieties grown each had an average crop production per
Megalitre of water in 2011 lower than in 2010 and all were
under their longterm average except for low level irrigated
Flame Seedless.
The median value for gross return per megalitre for 2011
($1107/Ml) was lowest on record, with the previous lowest
being $3067/Ml in 2005 compared to the highest of $6753/Ml
in 2009. The range of values in 2011 was very large being
$0/Ml to $21653/Ml which is the second highest value on
record. For only the second time since the start of the
project low level irrigated sites ($3976/Ml) showed a higher
gross return per megalitre than their drip irrigated
counterparts ($3078/Ml). Both the low level (-$560/Ml) and
drip (-$1935/Ml) had lower averages in 2011 than their long
term averages. Drip irrigated sites have a higher long term
average than the low level sites.
The gross return and cost performance indicators should be
treated only as technical information, as they were
determined using a partial system approach. A sound
economic analysis was beyond the scope of the study, since
it would have involved a whole system approach and more
complex analysis, e.g. marginal analysis.
Executive summary

8 Table Grape Irrigation Benchmarking 2002 - 2011
1.1 Background
This irrigation benchmarking study was initiated during the
season 2001/02 in the table grape industry and was
established primarily as a tool for monitoring growers'
irrigation performances. It contributes to the partnership
project “Benchmarking for Irrigated Table Grapes, Dried Vine
Fruit, Almonds, Open Hydroponics and Centre Pivot Irrigated
Potatoes” between the Department of Primary Industries
(DPI), Department of Sustainability (DSE) and the Mallee
Catchment Management Authority (MCMA). This current
annual report contains nine years of data covering seasons
2002/03 to 2010/11.
1.2 Irrigation benchmarking
The DPI Table Grape Irrigation Benchmarking Project aims
to identify “best irrigation management practices” in the table
grape industry with the goal of improving performance and
efficiency. It is an expansion of previous successful
benchmarking studies undertaken in the Mallee for wine
grapes, citrus, potatoes, dried vine fruits and almonds.
The project has evolved as a result of interest shown by
growers, extension officers and policy makers in supporting
improvement of irrigation management and water use
efficiency.
Information collected during the benchmarking study
includes:
• The amount of water used per crop and variety
• Irrigation scheduling methods used
• Irrigation systems used
• Pumping and water costs
• Yields and returns
1.3 Report style
The report style adopted since 2009 ensures a consistent
and effective mode of communication and is compliant with
the Victorian Government Branding Policy and the DPI visual
style guide.
The report uses bar charts to display, in the body of the
report and for each site, the last three years of the most
important performance indicators as identified by the
participants, i.e. crop yield, water applied, irrigation
application efficiency and crop production per megalitre of
water applied. As all other performance indicators are
deemed to be of value, and to allow for trend analysis, all
indices for the nine years are included in Appendix C.
1 Introduction

Table Grape Irrigation Benchmarking 2002 - 2011 9
2.1 Data collection
Table grape growers from Victoria and New South Wales
completed questionnaires on their irrigation practices for the
irrigation seasons 2002/03 to 2010/11. The data collected
included irrigation system and pump details, crop varieties,
vine spacing, area of the site, age of vines, irrigation
scheduling methods used, soil types and yields. The
questions were aimed at developing a better understanding
of each grower’s level of irrigation performance.
Weather data was also entered to match site locations and
water costs were calculated using information provided by
the water authorities.
While the number of growers has remained relatively stable
over the years (Table 1), the number of sites and associated
area in 2010/11 has increased by 26 and 72.6 ha
respectively when compared to 2002/03. It should be noted
this may not be a representative sample of growers and care
must be adopted when attempting to extrapolate the results
to the broader irrigation community.
Table 1: Number of participating growers, field sites and total area per season
Season Number of Number of Area
growers sites (ha)
2002/03 13 39 60.3
2003/04 13 39 60.3
2004/05 13 39 70.4
2005/06 14 51 81.3
2006/07 14 45 84.7
2007/08 14 49 99.5
2008/09 14 61 131.7
2009/10 14 64 131.9
2010/11 13 65 132.9
The irrigation systems used included low-level sprinklers,
overhead sprinklers, drip and furrow irrigation. The grape
varieties planted at the different sites were Autumn Royal,
Calmeria, Cardinal, Crimson Seedless, Fantasy, Flame
Seedless, Ohanez, Menindee Seedless, Midnight Beauty,
Rally Seedless, Red Emperor, Red Globe, Thompson
Seedless and Zante Currant.
2.2 Indicators of irrigation performance
The data collected was analysed using the “Irrigation
Benchmarking Module”, database software developed by the
South Australia Irrigated Crop Management Service, Primary
Industries and Resources South Australia (PIRSA). A data
consistency check of the database and processed data was
performed at the end of each crop season.
Performance indicators were defined using the format from
previous studies (Skewes and Meissner, 1997). The results
from each site were compared and ranked. These allow
growers to compare their own irrigation management
practices with others from season to season.
Yield, which is the traditional measure for vineyard
performance and is represented in tonnes per hectare (t/ha),
and several other performance indicators were used to
compare every site (details of all performance indicators can
be viewed in Appendix C). The main indices used were:
• Yield
• Irrigation water applied
• Irrigation application efficiency
• Crop production per Megalitre of water applied
• Gross return per Megalitre of water applied
• Cost of water per tonne of fruit
• Gross return per dollar of water input
Furthermore, an evaluation study (Pollock, 2009), which had
as its objective to review and improve the usability of the
graphical data and other information in the annual report,
produced the following main recommendations:
• The use of bar charts in the body of the report to
display the last three years' results of the following
performance indicators:
− Yield and irrigation water applied
− Irrigation application efficiency
− Crop production per Megalitre of water applied
• The use of tables and box plots to show performance
indicators in the body of the report
• The display, for each site, of all performance indicators
for all seasons in Appendix C
2 Method

10 Table Grape Irrigation Benchmarking 2002 - 2011
An efficient irrigator is defined in this report as one who
applies the correct amount of water at the right time to meet
the crop water requirement. It is generally recommended to
apply no more than 115% of the root zone soil moisture
deficit, i.e. to use only 10-15% of the irrigation water for
leaching any harmful salts from the root zone.
The present study focuses solely on irrigation management
practices and not on other aspects that could be affecting
crop production. For example, soil water holding capacity,
crop load, canopy size, crop and emitter spacing, fertiliser
and herbicide application practices, soil types and variation
in environmental conditions are not discussed in this report.
Irrigation benchmarking is best viewed over a number of
years to derive more interpretable results and to minimise
inevitable seasonal variation. Such variation can be seen in
cyclical pricing that can influence gross returns in any
particular year. The results should not be interpreted as
being definitive since this report was compiled from data
covering a limited time span and a small sample of industry
growers, who operate in a district of great diversity.
Figure 1: Site locations included in study
2.3 Site locations
Growers were located in Gol Gol, Irymple, Menindee,
Merbein, Mildura, Red Cliffs, Robinvale, Sunnycliffs and
Yelta as indicated on the map depicted in Figure 1.
Australia
Victoria
Menindee
MilduraMerbein
Irymple
Red Cliffs
SunnycliffsGol Gol
Yelta
North-west Victoria
Robinvale
New South Wales

Table Grape Irrigation Benchmarking 2002 - 2011 11
3.1 Yield and irrigation water applied
The yield and irrigation water applied at all sites for each
season are shown as box plots in Figures 2 and 3. The lower
and upper ends of the coloured box indicate the 25th and
75th percentiles respectively while the inside band indicates
the median (50th percentile). In other words, these
percentiles respectively indicate the level below which 25%,
75% and 50% of the sites fall. Conversely, the same
percentiles can also be interpreted as the level above which
75%, 25% and 50% of the sites are located. The ends at the
vertical broken lines indicate the range of observed values
while single dots represent outliers (see Appendix D for an
example of how to interpret box plots).
Figure 2 shows the box plot of yields in 2011 was the lowest
over the period studied. The yields at many sites were
affected by diseases and loss in fruit quality following the
extreme rainfall events experienced at many of the sites in
this study during summer. Only 25% of sites had yields
above 8.6 t/ha in 2011, which is less than half the number of
sites that achieved similar or better yields in the year with the
second lowest box plot, i.e. 2010. The median yield in 2011
was 1.9 t/ha, while the medians in the other years were 12.6
t/ha (2010), 23.2 t/ha (2009), 15.1 t/ha (2008), 18.8 t/ha
(2007), 18.0 t/ha (2006), 22.0 t/ha (2005), 25.0 t/ha (2004)
and 24.8 t/ha (2003).
In terms of water applied (Figure 3), the results at most sites
in 2011 were clearly lower than in the previous years. This
was mainly the result of the above normal rainfall events
during summer in season 2010/11that satisfied a great part
of the peak crop water demand and reduced the need for
supplementary irrigation. In 2011, 75% of the sites applied
less than 4.6 ML/ha. The median water applied in that year
(4.0 ML/ha) was 2.7 ML/ha lower than the median in 2010
(6.7 ML/ha), while the medians in the other years varied
between 6.0 ML/ha (2008) and 8.9 ML/ha (2005).
3.1.3 Yield and water applied per irrigation system type
Table 2 shows the number of sites in the study with drip
irrigation has considerably increased over the years, i.e. up
from 9 in 2002/03 to 57 in 2010/11. Conversely, from 29 sites
with low level irrigation in 2002/03, there were only 8 sites
left in 2010/11. It should also be noted that there were no
longer participants with furrow and overhead irrigation in the
study in 2010/11. The changes over the period studied were
the results of the adoption of more efficient irrigation systems
by many participating sites, and also due to the fact that
most newly included sites in the study were drip irrigated,
especially in season 2010/11.
Figure 2: Box plot of yield between 2003 and 2011
Figure 3: Box plot of water applied between 2003 and 2011
3 Results
2003 2004 2005 2006 2007 2008 2009 2010 2011
01
020
30
40
50
60
Yie
ld (
t/ha)
2003 2004 2005 2006 2007 2008 2009 2010 2011
05
10
15
20
Wate
r a
pplie
d (
ML/h
a)

12 Table Grape Irrigation Benchmarking 2002 - 2011
Table 2: Number of sites, average seasonal amount of water applied and yield - Irrigation system type comparison
Season Drip Furrow Low level Overhead
2002/03 9 29 1
2003/04 9 29 1
Number 2004/05 10 29
of sites 2005/06 14 7 30
2006/07 12 31 2
2007/08 23 26
2008/09 38 23
2009/10 53 11
2010/11 57 8
Total 225 7 216 4
2002/03 6.5 7.6 5.9
Average 2003/04 6.8 8.4 7.6
water 2004/05 7.2 10.0
applied 2005/06 7.5 8.0 10.8
(ML/ha) 2006/07 7.0 9.5 3.9
2007/08 5.2 6.6
2008/09 7.0 9.3
2009/10 6.5 8.7
2010/11 3.8 4.2
Average 5.9 8.0 8.7 5.3
2002/03 27.2 23.1 5.0
Average 2003/04 26.0 27.4 16.2
yield 2004/05 19.7 22.3
(t/ha) 2005/06 13.2 19.7 19.7
2006/07 10.9 20.1 13.4
2007/08 17.3 19.1
2008/09 27.5 23.9
2009/10 13.5 14.0
2010/11 5.7 5.4
Average 15.3 19.7 21.2 12.0
The seasonal averages of water applied by drip irrigated
sites were consistently lower than those of low level irrigated
sites over the nine seasons, i.e. 2.8 ML/ha lower on average.
In the last season, the high rainfall amount resulted in low
average water usage at both drip and low level irrigated
sites, i.e. 3.8 ML/ha and 4.2 ML/ha respectively. These
values represent only 64% and 48% respectively of their
nine-year average.
The average yield for drip (5.7 t/ha) and low level (5.4 t/ha)
irrigation systems in 2010/11 were the lowest results so far,
i.e. only 37% and 25% respectively of their corresponding
nine-year average. The rainy conditions in 2010/11 were
conducive to diseases and crop damage, resulting in inferior
grape quality and marketable yield for both drip and low level
irrigated sites.
The resulting average yield for drip irrigation in 2011(5.7 t/ha) was just over 40% of the previous year’s average (13.5 t/ha) and only 37% of the overall average. In the case of low level irrigated sites, the average yield was 5.4t/ha in 2011, 39% of the previous year and only 25% of the overall average. The overall lower nine-year average of drip irrigation was mostly due to its poor results in 2005/06 and 2006/07, when the average yields were respectively 6.4 t/ha and 9.2 t/ha less than the yields of low level irrigation. The box plots in Figure 4 show the variation of yield at the different sites and irrigation systems in 2009, 2010 and 2011. As can be seen in Figure 4 the medians in 2011 for low level (1.55 t/ha) and drip irrigated sites (1.98t/ha) were the lowest recorded in the nine years of the study. The previous lowest and highest medians recorded for low level irrigated sites were 14.88t/ha in 2010 and 25 t/ha in 2004. The corresponding figures for drip irrigated sites were 9.31t/ha in 2007 and 35.5t/ha in 2003. The yield range for low level irrigated sites in 2011 (0 to 19.91 t/ha) was lower than for the

Table Grape Irrigation Benchmarking 2002 - 2011 13
drip irrigated sites (0 to 27.18 t/ha). The low yields reported were mainly due to high disease pressure brought on by the extreme rainfall events experienced in December 2010 and January and February 2011.
Figures 6a and 6b and Tables 3a and 3b present the
performance of each site, in terms of yield and ranking, for
the years 2011, 2010 and 2009. To improve the quality of the
graphs and tables for the number of sites involved, the
results were grouped by irrigation system type and split into
two pages. The sites were further regrouped by variety and
ranked according to the highest overall yield in each year.
The water applied at different sites is presented in Figures 7a
and 7b and Tables 4a and 4b. The sites were grouped and
listed in the same order as the yields presented in Figures 6a
and 6b and Tables 3a and 3b to facilitate comparison of yield
and water applied. However, the ranks in Tables 4a and 4b
were based on the lowest water applied (ML/ha) in each
year.
Drip irrigation used less water than low level irrigation, as
shown by the number in the top ranked sites in the last three
years.
Figure 5 shows that the median values for water applied for drip (4.01 Ml/ha) and low level (4.27 Ml/ha) irrigated sites were very similar in the 2011 season. In 2011 75% of the low level sites used 4.57 Ml/ha or less while 4.61 Ml/ha was the median for the drip irrigated sites. The medians for the previous two years for low level irrigated sites were 9.21 Ml/ha in 2010 and 8.31 Ml/ha in 2009 and 6.59 Ml/ha and 7.39 Ml/ha for drip irrigated sites in the same years.
The presented results show how the yields at the majority of
sites have been affected in 2011. Three of the low level
irrigated sites and 11 of the drip irrigated sites reported zero
yields in 2011. Eleven of the drip irrigated sites reported
increased yields in 2011 compared to 2010, while 25 sites
reported decreases. There seems to be no correlation
between early and late harvested varieties and yield
decreases. There were eight drip irrigated sites in the top ten
performing properties in 2011 and only two low level irrigated
sites. There seems to be no correlation between variety and
rating in the top ten, although both low level sites were
Flame Seedless. The range for drip irrigated sites was 0 to
27.2 t/ha and 0 to 19.9 t/ha for low level irrigated sites.
All ten of the top ten ranked sites for water applied were drip
irrigated (in fact 16 drip irrigated sites outperformed their low
level counterparts).
It is interesting to note that the yield at site 110BC improved
from 5.0 t/ha (2009) to 9.2 t/ha (2010) while the water
applied changed from 15.6 ML/ha with low level in 2009 to
8.3 ML/ha with drip in 2010. As already pointed out, the
absence of an obvious relationship between water applied
and yield suggests the influence of confounding factors, e.g.
climatic conditions, crop management or water distribution
throughout the season.
Figure 4: Box plot of yield per irrigation system type for 2009, 2010 and 2011
Figure 5: Box plot of water applied per irrigation system type for 2009, 2010 and 2011
DripLow level
20112009 2010
05
10
15
Wate
r a
pplie
d (
ML/h
a)
DripLow level
20112009 2010
010
20
30
40
50
60
Yie
ld (
t/ha)

14 Table Grape Irrigation Benchmarking 2002 - 2011
Site 2011 2010 2009 2011 2010 2009
127AR-AR 4.5 14.6 19.4 26 26 40132AR-AR 0.8 8.2 45 41123AR-AR 10.8 21.1 52 34 37128AR-AR 6.0 51122CA-Cal 13.4 19.5 17.8 10 14 44127CA-Cal 12.6 21.0 32.9 13 12 18126CA-Cal 16.1 24.7 20 29120CR-Cr 25.3 14.8 37.8 2 25 10127CR-Cr 9.0 8.1 11.3 15 42 53119CR-Cr 8.9 17122CR-Cr 7.8 36.0 18 1110BC-Cr 4.3 9.2 27 39131CS-Cr 2.0 4.9 33 56132CR-Cr 1.5 6.9 39 45129CS-Cr 0.9 43109CR-Cr 0.0 50132CP-Cr 14.2 52 27123CS-Cr 5.9 16.4 52 54 46132CJ-Cr 52128CR-Cr 25.0 35.9 6 13102CR-Cr 10.7 6.0 35 58124CS-Cr 32.0 21109ZC-Cu 0.0 17.4 51 45109FA-Fa 0.2 49127FL-Fl 25.1 24.5 44.7 3 7 6129FL-Fl 2.9 20.8 45.3 31 13 5104FS-Fl 1.0 26.9 41 3102FL-Fl 52119ME-Me 19.4 14.9 20.4 7 23 39119MF-Me 13.1 14.9 19.1 12 23 42132MS-Me 11.0 18.6 14 18122MS-Me 8.9 6.0 51.9 16 49 4127ME-Me 5.5 6.0 13.0 21 49 50113MD-Me 5.0 33.4 24 16104MS-Me 1.7 4.6 36 59110CM-Me 1.6 10.0 37 36131ME-Me 1.0 42102M3-Me 0.7 12.7 21.4 46 29 33102M2-Me 0.3 24.3 48 8132MB-Me 52124ME-Me 21.0 38120MB-Mi 13.3 11119MB-Mi 4.6 25102MI-Mi 0.5 47119RG-RG 27.2 12.2 25.4 1 32 28110AR-RG 15.3 7.1 8 44127RG-RG 6.7 7.2 25.6 19 43 26113RG-RG 6.3 4.7 33.4 20 58 17122RG-RG 3.6 6.9 28.7 28 46 24132RG-RG 3.4 23.8 29 9104RG-RG 3.1 19.2 30 15131RG-RG 1.9 4.3 34 60109RG-RG 6.8 21.1 52 47 36111RG-RG 5.1 11.6 52 55 52123RG-RG 2.4 58.8 52 61 1128GR-RG 22.2 34.3 10 14128GS-RG 22.2 34.3 10 14131YG-RG 6.3 48120TC-Th 23.4 12.6 39.2 4 30 8120TA-Th 20.0 12.6 38.5 5 30 9122TS-Th 5.0 4.8 19.3 23 57 41104H5-Th 1.8 29.6 35 2131SS-Th 1.2 25.2 40 5129SO-Th 0.9 9.1 21.1 44 40 35123TS-Th 13.2 31.5 52 28 22111TS-Th 22.7 52 32
Continued on next page
* Based on all sites, i.e. including sites w ith low level irrigation
Yield
Rank*(t/ha)
Drip
irrigatio
n s
yste
ms
Tab
le 3
a: S
ites u
sin
g d
rip irrig
atio
n ra
nked
with
resp
ect to
the h
igh
est y
ield
Fig
ure
6a
: Yie
ld a
t sites u
sing
drip
irrigatio
n g
rou
pe
d b
y v
arie
ty a
nd
ran
ke
d w
ith re
spe
ct to y
ield
AR: Autumn Royal, Cal: Calmeria, Cr: Crimson Seedless, Cu: Currant,
Fa: Fantasy. Fl: Flame Seedless, Mi: Midnight Beauty, Me: Menindee
Seedless, Oh: Ohanez, RG: Red Globe, Th: Thompson Seedless
0 10 20 30 40 50 60
127AR-AR132AR-AR123AR-AR128AR-AR122CA-Cal127CA-Cal126CA-Cal120CR-Cr127CR-Cr119CR-Cr122CR-Cr110BC-Cr131CS-Cr132CR-Cr129CS-Cr109CR-Cr132CP-Cr123CS-Cr132CJ-Cr
128CR-Cr102CR-Cr124CS-Cr109ZC-Cu109FA-Fa127FL-Fl129FL-Fl104FS-Fl102FL-Fl
119ME-Me119MF-Me132MS-Me122MS-Me127ME-Me113MD-Me104MS-Me110CM-Me131ME-Me102M3-Me102M2-Me132MB-Me124ME-Me120MB-Mi119MB-Mi102MI-M i
119RG-RG110AR-RG127RG-RG113RG-RG122RG-RG132RG-RG104RG-RG131RG-RG109RG-RG111RG-RG123RG-RG128GR-RG128GS-RG131YG-RG120TC-Th120TA-Th122TS-Th104H5-Th131SS-Th129SO-Th123TS-Th111TS-Th
Site
and
cultivar ID
Y ield (t/ha)
20112010
2009

Table Grape Irrigation Benchmarking 2002 - 2011 15
Site 2011 2010 2009 2011 2010 2009
133CS-Cr 11.5 52 33
125CM-Cr 18.8 53.1 16 3
125CB-Cr 18.8 25.4 16 27
101CS-Cr 7.1 55
110BC-Cr 5.0 59
134F2-Fl 19.9 6
134F1-Fl 14.0 9
104FS-Fl 32.2 20
134M4-Me 5.4 22
134M1-Me 2.2 32
134M3-Me 1.6 38
133MS-Me 18.5 52 19
134M2-Me 52
125MH-Me 5.9 21.4 52 34
125MP-Me 5.9 12.5 52 51
104MS-Me 36.6 12
101MD-Me 18.8 43
102M2-Me 6.9 56
110CM-Me 6.7 57
125OH-Oh 14.0 49
125GL-RG 9.8 56.2 37 2
125GR-RG 9.8 32.5 37 19
104RG-RG 40.8 7
131RG-RG 30.0 23
110AR-RG 15.8 47
101RG-RG 11.1 54
130SR-Th 25.6 36.7 4 11
125TO-Th 14.9 23.2 21 30
125TS-Th 14.9 23.2 21 30
104H5-Th 26.3 25
101TS-Th 15.0 48
Maximum 27.2 36.0 58.8 52 61 59
Median 2.0 12.6 23.2
Minimum 2.4 5.0
** Based on all sites, i.e. including sites w ith drip irrigation
Low
level irrig
atio
n s
yste
ms
Yield
Rank**(t/ha)
Tab
le 3
b: S
ites u
sin
g lo
w le
vel irrig
atio
n ra
nked
with
resp
ect to
the h
igh
est y
ield
Fig
ure
6b
: Yie
ld a
t sites u
sing lo
w le
ve
l irrigatio
n g
rou
pe
d b
y v
arie
ty a
nd
ran
ke
d w
ith re
spe
ct to y
ield
AR: Autumn Royal, Cal: Calmeria, Cr: Crimson Seedless, Cu: Currant,
Fa: Fantasy. Fl: Flame Seedless, Mi: Midnight Beauty, Me: Menindee
Seedless, Oh: Ohanez, RG: Red Globe, Th: Thompson Seedless
0 10 20 30 40 50 60
133CS-Cr
125CM-Cr
125CB-Cr
101CS-Cr
110BC-Cr
134F2-Fl
134F1-Fl
104FS-Fl
134M4-Me
134M1-Me
134M3-Me
133MS-Me
134M2-Me
125MH-Me
125MP-Me
104MS-Me
101MD-Me
102M2-Me
110CM-Me
125OH-Oh
125GL-RG
125GR-RG
104RG-RG
131RG-RG
110AR-RG
101RG-RG
130SR-Th
125TO-Th
125TS-Th
104H5-Th
101TS-Th
Site
and
cultivar ID
Yield (t/ha)
201
12010
2009

16 Table Grape Irrigation Benchmarking 2002 - 2011
Site 2011 2010 2009 2011 2010 2009
127AR-AR 4.0 4.8 4.9 24 3 3132AR-AR 2.7 6.9 10 34123AR-AR 1.3 7.9 7.6 1 49 30128AR-AR 6.5 6.7 26 15122CA-Cal 4.3 5.6 6.6 39 15 13127CA-Cal 4.0 4.9 4.9 24 4 3126CA-Cal 7.0 6.6 37 14120CR-Cr 4.6 7.6 7.6 45 42 29127CR-Cr 4.0 5.0 4.9 24 7 3119CR-Cr 4.6 49122CR-Cr 4.3 5.6 6.3 40 15 11110BC-Cr 2.2 8.3 7 53131CS-Cr 5.2 5.5 56 13132CR-Cr 2.7 6.6 10 27129CS-Cr 6.2 63109CR-Cr 4.0 30132CP-Cr 2.7 6.7 10 33123CS-Cr 1.3 7.8 7.7 1 47 33132CJ-Cr 2.7 10128CR-Cr 7.0 9.2 36 55102CR-Cr 12.6 15.0 64 58124CS-Cr 6.3 10109ZC-Cu 4.0 5.0 7.4 30 8 24109FA-Fa 4.0 30127FL-Fl 4.0 4.9 4.9 24 6 3129FL-Fl 6.3 6.1 7.8 64 25 35104FS-Fl 3.5 5.9 23 21102FL-Fl 3.4 20119ME-Me 4.6 7.4 7.3 49 39 20119MF-Me 4.6 7.3 7.3 53 38 19132MS-Me 2.7 6.7 10 32122MS-Me 4.2 5.6 7.7 37 17 34127ME-Me 4.0 5.6 4.9 24 14 3113MD-Me 4.6 6.6 6.4 52 29 12104MS-Me 3.5 5.9 21 23110CM-Me 1.8 8.6 5 56131ME-Me 5.2 56102M3-Me 3.1 8.2 10.4 17 52 56102M2-Me 4.2 7.9 37 51132MB-Me 2.7 10124ME-Me 6.1 9120MB-Mi 4.6 45119MB-Mi 4.6 49102MI-Mi 4.2 36119RG-RG 4.7 7.5 7.5 54 40 28110AR-RG 2.2 8.7 8 57127RG-RG 4.0 4.9 4.9 24 5 3113RG-RG 5.6 7.7 7.6 62 44 31122RG-RG 4.3 5.6 8.1 40 17 43132RG-RG 2.7 6.6 10 27104RG-RG 3.5 5.7 21 20131RG-RG 5.2 5.2 56 10109RG-RG 4.0 5.1 7.5 33 9 25111RG-RG 1.9 3.7 2.5 6 1 1123RG-RG 1.3 7.9 8.8 1 49 52128GR-RG 6.6 6.8 30 16128GS-RG 6.6 6.8 30 16131YG-RG 5.3 11120TC-Th 4.6 7.5 7.5 45 41 25120TA-Th 4.6 7.6 7.5 45 43 25122TS-Th 4.3 5.6 7.8 40 17 37104H5-Th 4.8 5.9 55 22131SS-Th 5.2 5.5 56 12129SO-Th 6.3 6.0 7.8 64 24 35123TS-Th 1.3 7.9 8.0 1 48 40111TS-Th 2.3 4.3 2.6 9 2 2
Continued on next page
* Based on all sites, i.e. including sites w ith low level irrigation
Water applied
Rank*(ML/ha)
Drip
irrigatio
n s
yste
ms
Tab
le 4
a: S
ites u
sin
g d
rip irrig
atio
n ra
nked
with
resp
ect to
the lo
west w
ate
r ap
plie
d
Fig
ure
7a
: Wate
r ap
plie
d a
t sites u
sing d
rip irrig
atio
n g
rou
pe
d b
y v
arie
ty a
nd
ran
ke
d w
ith re
spe
ct to y
ield
AR: Autumn Royal, Cal: Calmeria, Cr: Crimson Seedless, Cu: Currant,
Fa: Fantasy. Fl: Flame Seedless, Mi: Midnight Beauty, Me: Menindee
Seedless, Oh: Ohanez, RG: Red Globe, Th: Thompson Seedless
0 4 8 12 16
127AR-AR132AR-AR
123AR-AR
128AR-AR122CA-Cal
127CA-Cal
126CA-Cal120CR-Cr
127CR-Cr
119CR-Cr122CR-Cr
110BC-Cr131CS-Cr
132CR-Cr
129CS-Cr109CR-Cr
132CP-Cr
123CS-Cr132CJ-Cr
128CR-Cr
102CR-Cr124CS-Cr
109ZC-Cu109FA-Fa
127FL-Fl
129FL-Fl104FS-Fl
102FL-Fl
119ME-Me119MF-Me
132MS-Me
122MS-Me127ME-Me
113MD-Me104MS-Me
110CM-Me
131ME-Me102M3-Me
102M2-Me
132MB-Me124ME-Me
120MB-Mi
119MB-Mi102MI-Mi
119RG-RG110AR-RG
127RG-RG
113RG-RG122RG-RG
132RG-RG
104RG-RG131RG-RG
109RG-RG
111RG-RG123RG-RG
128GR-RG128GS-RG
131YG-RG
120TC-Th120TA-Th
122TS-Th
104H5-Th131SS-Th
129SO-Th
123TS-Th111TS-Th
Site
and
cultivar ID
Water applied (ML/ha)
2011
2010
2009

Table Grape Irrigation Benchmarking 2002 - 2011 17
Site 2011 2010 2009 2011 2010 2009
133CS-Cr 3.1 9.7 18 62
125CM-Cr 9.4 8.3 61 46
125CB-Cr 9.2 8.3 58 47
101CS-Cr 7.3 20
110BC-Cr 15.6 60
134F2-Fl 4.4 43
134F1-Fl 4.2 34
104FS-Fl 7.9 38
134M4-Me 4.2 34
134M1-Me 5.2 60
134M3-Me 4.4 43
133MS-Me 3.1 9.7 18 62
134M2-Me 5.2 60
125MH-Me 9.3 8.5 59 48
125MP-Me 9.3 8.6 59 51
104MS-Me 8.1 41
101MD-Me 7.2 18
102M2-Me 13.3 57
110CM-Me 15.2 59
125OH-Oh 8.3 45
125GL-RG 8.4 8.6 54 49
125GR-RG 8.4 8.6 54 49
104RG-RG 7.9 38
131RG-RG 9.1 53
110AR-RG 15.6 60
101RG-RG 7.3 20
130SR-Th 6.9 8.1 35 42
125TO-Th 7.8 8.2 45 44
125TS-Th 7.8 9.1 45 54
104H5-Th 7.6 31
101TS-Th 7.3 20
Maximum 6.3 12.6 15.6 64 64 60
Median 4.0 6.7 7.6
Minimum 1.3 3.7 2.5
** Based on all sites, i.e. including sites w ith drip irrigation
Low
level irrig
atio
n s
yste
ms
Water applied
Rank**(ML/ha)
Tab
le 4
b: S
ites u
sin
g lo
w le
vel irrig
atio
n ra
nked
with
resp
ect to
the lo
west w
ate
r ap
plie
d
Fig
ure
7b
: Wate
r ap
plie
d a
t sites u
sing lo
w le
ve
l irrigatio
n g
rou
pe
d b
y v
arie
ty a
nd
ran
ke
d w
ith re
spe
ct to y
ield
AR: Autumn Royal, Cal: Calmeria, Cr: Crimson Seedless, Cu: Currant,
Fa: Fantasy. Fl: Flame Seedless, Mi: Midnight Beauty, Me: Menindee
Seedless, Oh: Ohanez, RG: Red Globe, Th: Thompson Seedless
0 4 8 12 16
133CS-Cr
125CM-Cr
125CB-Cr
101CS-Cr
110BC-Cr
134F2-Fl
134F1-Fl
104FS-Fl
134M4-Me
134M1-Me
134M3-Me
133MS-Me
134M2-Me
125MH-Me
125MP-Me
104MS-Me
101MD-Me
102M2-Me
110CM-Me
125OH-Oh
125GL-RG
125GR-RG
104RG-RG
131RG-RG
110AR-RG
101RG-RG
130SR-Th
125TO-Th
125TS-Th
104H5-Th
101TS-Th
Site
and
cultivar ID
Water applied (ML/ha)
2011
201
02009

18 Table Grape Irrigation Benchmarking 2002 - 2011
3.1.4 Yield and water applied per irrigation scheduling method
The method used to schedule irrigation can play an
important part in how effectively and efficiently water is
applied. Some of the methods used in the present study
were tensiometer, capacitance probe, experience and dig or
dig-stick.
Table 5 shows that for the first time since 2005 there were more participants using capacitance probes (27) than reported experience (18) as their scheduling method. There was virtually no difference in the average water applied for each of the scheduling methods reported in 2011, with irrigators using capacitance probes averaging 4 Ml/ha, dig stick 3.8 Ml/ha, experience 3.8 Ml/ha and tensiometer 3.6 Ml/ha. These ranged from 2.2 Ml/ha (experience) 0 to 4.7 Ml/ha (dig stick) lower than the previous year and 2.5 Ml/ha
(capacitance probes) to 5.2 Ml/ha (dig stick) than the long term averages.
In 2011sites using dig sticks had a much higher average
yield (16.6 t/ha) than those using capacitance probes (5.8
t/ha), experience (2.8 t/ha) or tensiometers (1.1 t/ha).Except
for those sites using dig sticks, the averages were very much
lower in 2011 than the overall averages (10.6 t/ha for
capacitance probes, 16.1 t/ha for experience and 18.3 t/ha
for tensiometer scheduled sites).
Table 5: Number of sites, average seasonal amount of water applied and yield - Irrigation scheduling method comparison
Season Capacitance Dig Experience Tensiometer
2002/03 10 19 10
2003/04 10 18 11
Number 2004/05 14 5 10 10
of sites 2005/06 13 5 22 11
2006/07 7 4 22 11
2007/08 11 3 17 17
2008/09 16 3 22 19
2009/10 12 3 28 20
2010/11 27 9 18 11
Total 120 32 176 120
2002/03 6.6 7.8 7.0
Average 2003/04 6.6 8.8 8.0
water 2004/05 8.4 10.3 10.1 9.3
applied 2005/06 8.4 9.8 9.8 10.2
(ML/ha) 2006/07 6.3 13.8 9.0 7.6
2007/08 5.2 9.0 6.2 5.7
2008/09 7.7 15.5 6.9 8.0
2009/10 7.1 8.5 6.0 7.8
2010/11 4.0 3.8 3.8 3.6
Average 6.5 9.0 7.5 7.4
2002/03 23.6 23.0 24.7
Average 2003/04 22.8 29.2 26.6
yield 2004/05 18.6 19.4 25.2 23.5
(t/ha) 2005/06 19.6 16.3 18.2 15.9
2006/07 13.2 22.4 18.6 16.9
2007/08 21.7 19.0 15.4 19.3
2008/09 21.1 9.1 28.0 30.4
2009/10 14.9 8.8 12.8 13.6
2010/11 5.8 16.6 2.8 1.1
Average 16.4 16.3 18.9 19.4

Table Grape Irrigation Benchmarking 2002 - 2011 19
Figure 8: Box plot of yield per irrigation scheduling method for 2009, 2010 and 2011
Figure 9: Box plot of water applied per irrigation scheduling method for 2009, 2010 and 2011
Figure 8 shows that in stark contrast to the previous two
years, sites using dig sticks had the highest median yield
recorded in 2011 (19.43t/ha) and were much higher than the
previous two years. All other scheduling methods showed a
marked decline in median yields reported. Four of the
tensiometer scheduled sites recorded no yield in 2011, with
the highest yield recorded being 3t/ha which is approximately
one tenth of the maximum yields of previous years. The
median yield for irrigations scheduled using experience alone
was 1.09t/ha which is an 11.32 t/ha reduction on the next
lowest result (recorded in 2010) and 24.39t/ha lower than the
highest ever value recorded (2009). 75% of the experience
scheduled sites recorded 3t/ha or lower figures in 2011, with
the range from 0 to 13.33 t/ha. The median yield in 2011 for
capacitance probe scheduled sites was 4.26t/ha.This was
the lowest ever recorded figure with 11.7t/ha (2010) being
the next lowest and 23.75 t/ha (2003) being the highest. In
2011 75% of the sites recorded a yield of 8.08t/ha or less.
The maximum yield in 2011 was 25.13 which was the
second lowest recorded.
3.2 Irrigation application efficiency
Application efficiency was calculated (see Equation 6 in
Appendix B) for each site using the grower's irrigation
records and weather data collected for the region where
each property is located. In PIRSA’s benchmarking module,
the drainage calculation is based on the irrigation water
applied in excess of the combined soil moisture deficit and
predicted daily crop water use. Daily crop water use is
based on site specific weather data and a standard set of
crop coefficients. These figures do not cater for differences
between varieties, canopy size, row and vine spacing. The
crop coefficients may change as a result of a combination of
those variables, and therefore may contribute to differences
in the predicted drainage and hence application efficiency
calculations.
The results for application efficiency should not be
interpreted as being definitive due to the large number of
variables that influence its calculation. However, application
efficiency remains a valuable indicator of over or under
irrigation, particularly at sites where crop coefficients are
close to matching the generic standards, and is therefore a
useful guide when comparing sites and properties for the
purpose of irrigation benchmarking.
An application efficiency of 85-90%, as represented by the
horizontal strip in Figure 10, would result in a leaching
fraction of 10 - 15% of the total irrigation water applied and is
considered optimal to prevent a build-up of salts in the root
zone. Conversely, application efficiencies below 85%
indicate an excessive amount of irrigation water is passing
through the root zone. If the application efficiency is greater
than 90%, under-irrigation may be occurring and harmful
salts may not be leached from the root zone.
From Figure 10 it can be seen that despite the drop in
volume of water applied in 2011 (see above), the application
efficiency decreased from a median of 89% in 2010 to 83%
in 2011. This means that despite more water being applied
in 2010 there was more predicted through drainage in 2011.
In 2011 75% of the sites had application efficiencies above
75%. For only the second year (with 2006 being the other
Capacitance TensiometerExperienceDig
01
020
30
40
50
60
Yie
ld (
t/ha)
20112009 2010
Capacitance TensiometerExperienceDig
20112009 2010
05
10
15
Wate
r a
pplie
d (
ML/h
a)

20 Table Grape Irrigation Benchmarking 2002 - 2011
year) there were sites that recorded 100% application
efficiency with 25% of the sites rating 92% or above.
Just over half the application efficiencies in 2011 were below
the target range of 85-90% while approximately one in seven
sites fell within the target range. 2011 had the third highest
number of properties scoring over 90% since the start of the
project in 2002. The majority of irrigators draw their water
from the Murray which has had extremely good water quality,
so the potential build up of salt in the rootzone through lack
of leaching will be minimised, the irrigators of these sites
should be monitoring soil health to ensure a damaging salt
concentration is not reached.
Figure 10: Box plot of irrigation application efficiency
between 2003 and 2011
Table 6 shows the percentage of sites that achieved
application efficiencies within the recommended 85-90%
range and on either side of the 85-90% range over the last
nine seasons.
3.2.1 Application efficiency per irrigation system type
Table 7 shows the average application efficiencies for the
different irrigation system types. For the third consecutive
year drip irrigated sites achieved an average within the
recommended 85-90% range. The seasonal averages for
drip irrigation were more consistent over the nine years and
were also higher than those for low level irrigation each year
In 2011, the application efficiency for low level irrigation was
21% less than the average for drip irrigation, and 1% below
its own nine-year average of 86%. The nine-year averages
show that drip irrigated sites had an application efficiency
average of 86% while the low level irrigated sites only
averaged 74%.
The application efficiency per irrigation system type (Figure
11) shows the medians of sites with drip irrigation were
higher than the medians of sites with low level irrigation. The
box plots also indicate there were many drip irrigated sites
that met the target. The highest low level application
efficiency value was 71% with half of the properties rating
63.5% or above and 25% rating below 61.5%. Application
efficiencies for drip irrigated sites were 81% or better in 75%
of the sites.
The box plots show that the range of application efficiencies
in 2011 was greater for both low level and drip irrigated sites
than in 2010.
Figures 12a and 12b and Tables 8a and 8b compare the last
three years’ application efficiencies of sites, grouped by
irrigation system type and variety. Tables 8a and 8b also
present the rank of each site with respect to the highest
application efficiency values.
Reco
mm
en
ded
ran
ge
2003 2004 2005 2006 2007 2008 2009 2010 2011
30
40
50
60
70
80
90
10
0A
pplic
atio
n e
ffic
iency (
%)
Table 6: Percentage of sites within, over and under the recommended 85-90% range of application efficiency
within 85-90% under 85-90% over 85-90%
2002/03 15.4 56.4 28.2
2003/04 48.7 51.3
2004/05 10.3 82.1 7.7
2005/06 3.9 90.2 5.9
2006/07 17.8 75.6 6.7
2007/08 18.4 55.1 26.5
2008/09 9.8 54.1 36.1
2009/10 15.6 42.2 42.2
2010/11 13.8 52.3 33.8
Percentage of sites with application efficiencySeason

Table Grape Irrigation Benchmarking 2002 - 2011 21
The application efficiency per irrigation system type (Figure
11) shows the medians of sites with drip irrigation were
higher than the medians of sites with low level irrigation.
Figures 12a and 12b and Tables 8a and 8b compare the last
three years’ application efficiencies of sites, grouped by
irrigation system type and variety. Tables 8a and 8b also
present the rank of each site with respect to the highest
overall application efficiency in each year.
The ranking in Tables 8a and 8b indicate that, irrespective of
variety, the sites with the best application efficiencies in 2011
were all using drip irrigation systems. Drip irrigated sites
occupied almost all the top rankings in the previous two
years, i.e. nine and ten sites in the top ten highest application
efficiencies in 2010 and 2009 respectively.
All low level irrigated sites had application efficiencies below
the recommended 85-90% range in 2011. The results of
most of these sites in 2011 were also lower compared to
2010. This is compounded by a drop in median figures from
2009 to 2010.
Figure 11: Box plot of irrigation application efficiency per irrigation system type for 2009, 2010 and 2011
30
40
50
60
70
80
90
10
0A
pplic
atio
n e
ffic
iency (
%)
20112009 2010
DripLow level
Reco
mm
en
ded
ran
ge
Table 7: Average application efficiency - Irrigation system type comparison
Drip Furrow Low level Overhead Average
2002/03 86 82 86 83
2003/04 88 82 82 83
2004/05 83 71 74
2005/06 84 74 65 72
2006/07 79 68 91 72
2007/08 86 81 83
2008/09 85 75 81
2009/10 87 71 85
2010/11 85 64 83
Average 86 74 74 87 80
SeasonAverage application efficiency (%)

22 Table Grape Irrigation Benchmarking 2002 - 2011
Site 2011 2010 2009 2011 2010 2009
123AR-AR 98.4 88.9 94.7 3 33 12132AR-AR 92.0 90.7 11 22127AR-AR 66.4 92.4 97.7 55 10 3128AR-AR 91.8 97.7 15 4122CA-Cal 76.0 82.7 82.7 48 43 33127CA-Cal 66.4 92.5 97.5 55 9 5126CA-Cal 87.8 90.8 36 22123CS-Cr 98.4 89.2 94.1 3 32 16132CR-Cr 92.0 91.7 11 17132CP-Cr 92.0 90.2 11 27132CJ-Cr 92.0 11119CR-Cr 91.4 20120CR-Cr 88.9 80.3 67.5 26 46 51110BC-Cr 88.1 79.3 27 49131CS-Cr 87.1 90.6 31 23109CR-Cr 83.2 35129CS-Cr 83.0 39122CR-Cr 75.4 92.1 84.7 50 11 29127CR-Cr 66.4 91.7 97.5 55 18 5128CR-Cr 90.4 86.1 25 25102CR-Cr 51.9 56.9 64 58124CS-Cr 95.0 11109ZC-Cu 83.2 96.3 85.5 37 4 26109FA-Fa 83.2 35129FL-Fl 82.6 87.8 89.4 42 37 24102FL-Fl 80.5 43104FS-Fl 79.8 90.2 46 26127FL-Fl 66.4 91.5 97.5 55 20 5132MB-Me 92.5 10132MS-Me 92.0 91.3 11 21110CM-Me 91.7 78.3 17 50119ME-Me 91.4 83.8 70.6 20 38 47119MF-Me 91.3 82.9 71.0 22 41 46113MD-Me 89.6 89.4 74.2 23 30 45131ME-Me 87.3 28102M3-Me 83.3 73.7 77.4 34 55 42102M2-Me 83.1 77.6 38 51104MS-Me 79.9 89.7 45 29122MS-Me 76.4 82.8 78.3 47 42 41127ME-Me 66.4 94.6 97.5 55 7 5124ME-Me 91.7 18119MB-Mi 91.7 18120MB-Mi 91.6 19102MI-Mi 82.6 40111RG-RG 100.0 96.4 98.5 1 2 2123RG-RG 98.4 89.3 83.3 3 31 32110AR-RG 93.9 76.1 7 52113RG-RG 92.8 80.2 65.8 8 47 52119RG-RG 92.6 83.1 69.6 9 40 48132RG-RG 92.0 91.8 11 16131RG-RG 87.1 91.8 29 14109RG-RG 83.4 96.3 85.4 33 3 28104RG-RG 80.5 94.0 44 8122RG-RG 75.4 83.4 75.4 50 39 44127RG-RG 66.4 92.0 97.5 55 12 5128GR-RG 95.0 94.4 5 13128GS-RG 95.0 94.4 5 13131YG-RG 89.9 28111TS-Th 100.0 91.7 98.6 1 19 1123TS-Th 98.4 91.9 95.8 3 13 10120TC-Th 89.4 81.2 68.0 24 45 49120TA-Th 89.4 79.9 68.0 24 48 49131SS-Th 87.1 90.6 29 24104H5-Th 84.8 88.6 32 34129SO-Th 82.6 88.5 91.4 41 35 20122TS-Th 75.5 82.3 78.8 49 44 40
Continued on next page
* Based on all sites, i.e. including sites w ith low level irrigation
Application eff iciency
Rank*(%)
Drip
irrigatio
n s
yste
ms
Tab
le 8
a: S
ites u
sin
g d
rip irrig
atio
n ra
nked
with
resp
ect to
the h
igh
est a
pp
licatio
n e
fficie
ncy
Fig
ure
12
a: A
pp
licatio
n e
fficien
cy a
t sites u
sing d
rip irrig
atio
n g
rou
pe
d b
y v
arie
ty
AR: Autumn Royal, Cal: Calmeria, Cr: Crimson Seedless, Cu: Currant,
Fa: Fantasy. Fl: Flame Seedless, Mi: Midnight Beauty, Me: Menindee
Seedless, Oh: Ohanez, RG: Red Globe, Th: Thompson Seedless
Recommended range
40 50 60 70 80 90 100
123AR-AR132AR-AR
127AR-AR
128AR-AR122CA-Cal
127CA-Cal126CA-Cal
123CS-Cr
132CR-Cr132CP-Cr
132CJ-Cr119CR-Cr
120CR-Cr
110BC-Cr131CS-Cr
109CR-Cr
129CS-Cr122CR-Cr
127CR-Cr128CR-Cr
102CR-Cr
124CS-Cr109ZC-Cu
109FA-Fa129FL-Fl
102FL-Fl
104FS-Fl127FL-Fl
132MB-Me132MS-Me
110CM-Me
119ME-Me119MF-Me
113MD-Me131ME-Me
102M3-Me
102M2-Me104MS-Me
122MS-Me127ME-Me
124ME-Me
119MB-Mi120MB-Mi
102MI-Mi111RG-RG
123RG-RG
110AR-RG113RG-RG
119RG-RG
132RG-RG131RG-RG
109RG-RG104RG-RG
122RG-RG
127RG-RG128GR-RG
128GS-RG131YG-RG
111TS-Th
123TS-Th120TC-Th
120TA-Th131SS-Th
104H5-Th
129SO-Th122TS-Th
Site
and
cultivar ID
Application efficiency (%)
2011
2010
2009

Table Grape Irrigation Benchmarking 2002 - 2011 23
Site 2011 2010 2009 2011 2010 2009
133CS-Cr 71.3 59.8 52 62
125CM-Cr 74.4 80.6 53 38
125CB-Cr 71.4 76.7 56 43
101CS-Cr 61.4 55
110BC-Cr 46.2 60
134F1-Fl 62.0 63
134F2-Fl 54.7 65
104FS-Fl 91.4 21
133MS-Me 70.6 59.3 53 63
134M4-Me 66.4 54
134M3-Me 64.4 61
134M1-Me 62.9 62
134M2-Me 60.3 64
125MH-Me 74.1 85.4 54 27
125MP-Me 69.7 82.5 59 34
104MS-Me 91.7 19
102M2-Me 65.8 53
101MD-Me 63.0 54
110CM-Me 48.0 59
125OH-Oh 83.4 31
125GR-RG 71.4 81.5 57 36
125GL-RG 70.9 79.5 58 39
104RG-RG 92.7 17
131RG-RG 81.1 37
101RG-RG 61.4 55
110AR-RG 46.2 60
130SR-Th 97.0 89.4 1 23
125TO-Th 68.9 81.7 60 35
125TS-Th 66.6 83.6 61 30
104H5-Th 94.1 15
101TS-Th 61.4 55
Maximum 100.0 97.0 98.6 65 64 60
Median 83.4 89.0 83.4
Minimum 54.7 51.9 46.2
** Based on all sites, i.e. including sites w ith drip irrigation
Low
level irrig
atio
n s
yste
ms
Application eff iciency
Rank**(%)T
ab
le 8
b: S
ites u
sin
g lo
w le
vel irrig
atio
n ra
nked
with
resp
ect to
the h
igh
est a
pp
licatio
n e
fficie
ncy
Fig
ure
12
b: A
pp
licatio
n e
fficien
cy a
t sites u
sing lo
w le
ve
l irrigatio
n g
rou
pe
d b
y v
arie
ty
AR: Autumn Royal, Cal: Calmeria, Cr: Crimson Seedless, Cu: Currant,
Fa: Fantasy. Fl: Flame Seedless, Mi: Midnight Beauty, Me: Menindee
Seedless, Oh: Ohanez, RG: Red Globe, Th: Thompson Seedless
40 50 60 70 80 90 100
133CS-Cr
125CM-Cr
125CB-Cr
101CS-Cr
110BC-Cr
134F1-Fl
134F2-Fl
104FS-Fl
133MS-Me
134M4-Me
134M3-Me
134M1-Me
134M2-Me
125MH-Me
125MP-Me
104MS-Me
102M2-Me
101MD-Me
110CM-Me
125OH-Oh
125GR-RG
125GL-RG
104RG-RG
131RG-RG
101RG-RG
110AR-RG
130SR-Th
125TO-Th
125TS-Th
104H5-Th
101TS-Th
Site
and
cultivar ID
Application efficiency (%)
201
12010
2009
Recommended range

24 Table Grape Irrigation Benchmarking 2002 - 2011
3.2.2 Application efficiency per irrigation scheduling method
The box plots in Figure 13 show the application efficiencies
achieved with different irrigation scheduling methods during
the last three seasons. Except at sites with capacitance
probes, the other sites had generally higher application
efficiencies in 2011 than in 2010. In 2011, tensiometer sites
where irrigation scheduling was based on dig experience had
application efficiencies closer to the recommended range.
The medians for the different scheduling methods in 2011
were 71% (capacitance), 79% (dig), 92% (experience) and
83% (tensiometer). As pointed out previously, the results for
the dig method come from a small sample (i.e. six sites) and
hence could also be dependent on other factors common to
those sites.
Table 9 presents the average application efficiencies
obtained with the different scheduling methods over the last
nine seasons. In 2011 sites that had their irrigations
scheduled using capacitance probes dropped to their lowest
ever average application efficiency (74%), well below the
overall average of 79%. In most past seasons sites using
capacitance probes have generally outperformed their
counterparts using other scheduling methods. In 2011 the
other three scheduling methods all outscored their ongoing
averages (dig stick + 19%, experience + 9% and tensiometer
+6%).
Figure 13: Box plot of irrigation application efficiency per irrigation scheduling method for 2009, 2010 and 2011
Table 9: Average application efficiency - Irrigation scheduling method comparison
Capacitance Dig Experience Tensiometer
2002/03 84 78 91
2003/04 86 79 88
2004/05 78 68 69 76
2005/06 78 65 71 69
2006/07 81 52 71 76
2007/08 80 83 87 82
2008/09 78 47 84 87
2009/10 85 78 89 79
2010/11 74 91 89 88
Average 79 72 80 82
SeasonAverage application efficiency (%)
Reco
mm
en
ded
ran
ge
Capacitance TensiometerExperienceDig
20112009 2010
30
40
50
60
70
80
90
10
0A
pplic
atio
n e
ffic
iency (
%)

Table Grape Irrigation Benchmarking 2002 - 2011 25
3.3 Crop production per ML of water applied
The crop production per megalitre (see Equation 1 -
Appendix B) in Figure 14 shows a similar trend as the box
plots of yields in Figure 2. This indicates that the crop
production per megalitre was determined to a great extent by
the yield results over the years. The influence of the amount
of water applied can also be seen when comparing year
2010 to years 2005, 2006 and 2007 in Figures 2, 3 and 14.
Although the yield in 2011 was much lower than in the years
mentioned, the higher water applied between years 2005
and 2007 resulted in similar crop production per megalitre.
The median value for 2011 (0.48t/Ml) was the lowest on
record. 75% of the sites had crop production per Megalitre
values of 1.94t/Ml or lower with 25% recorded 0.05% K t/Ml
or lower. For the other years the results were 5.1 t/ML
(2009), 3.9 t/ML (2008), 2.9 t/ML (2007), 2.8 t/ML (2006), 3.3
t/ML (2005), 5.0 t/ML (2004) and 4.8 t/ML (2003).
3.3.1 Crop production per Megalitre of water applied - Irrigation system type comparison
Figure 15 shows the crop production per Megalitre results for
both drip (0.55 t/Ml) and low level (0.39t/Ml) irrigated sites
were the lowest on record. Despite the drop in water applied
for each of the irrigation systems (see Figure 5) the reduced
yields (see Figure 4) had a greater influence on these
results. The results from previous years ranged from 1.4 t/Ml
(2007) to 4.85 t/Ml (2003) for drip irrigated sites and 1.8 t/Ml
(2006) to 3.47 t/Ml (2004) for low level irrigated sites in 2011
was greater (0 to 6.9 t/Ml) than for the low level irrigated sites
(0 to 4.58 t/Ml).
The results for 2011 (Table 10) shows that both drip (1.4
t/Ml) and low level (1.3t/Ml) irrigated sites average crop
production per megalitre were the lowest on record. Both
were well under their long term average with drip 1.1 t/Ml
lower and lowlevel sites 1.4 t/Ml lower.
Figure 14: Box plot of crop production per Megalitre of water applied between 2003 and 2011
Figure 15: Box plot of crop production per Megalitre of water applied per irrigation system type for 2009, 2010 and 2011
Table 10: Average crop production per megalitre of water applied - Irrigation system type comparison
Drip Furrow Low level Overhead Average
2002/03 4.1 3.3 0.8 3.4
2003/04 3.8 3.7 2.1 3.7
2004/05 2.8 2.3 2.4
2005/06 1.8 2.5 2.0 2.0
2006/07 1.5 2.3 3.5 2.1
2007/08 3.3 3.1 3.2
2008/09 4.2 2.8 3.7
2009/10 2.1 1.7 2.1
2010/11 1.4 1.3 1.4
Average 2.5 2.5 2.7 2.5 2.6
SeasonAverage crop production per megalitre (t/ML)
2003 2004 2005 2006 2007 2008 2009 2010 20110
24
68
10
Cro
p p
roduction p
er
me
galit
re (
t/M
L)
DripLow level
20112009 2010
02
46
81
0C
rop
pro
duction p
er
me
galit
re (
t/M
L)

26 Table Grape Irrigation Benchmarking 2002 - 2011
Site 2011 2010 2009 2011 2010 2009
127AR-AR 1.1 3.0 4.0 25 16 23132AR-AR 0.3 1.2 41 40123AR-AR 1.4 2.8 51 37 37128AR-AR 0.9 50127CA-Cal 3.2 4.3 6.7 11 6 4122CA-Cal 3.1 3.5 2.7 12 10 38126CA-Cal 2.3 3.8 18 27120CR-Cr 5.6 1.9 5.0 4 24 17127CR-Cr 2.3 1.6 2.3 15 32 47110BC-Cr 1.9 1.1 17 46119CR-Cr 1.9 18122CR-Cr 1.8 6.4 19 1132CR-Cr 0.6 1.1 32 49131CS-Cr 0.4 0.9 36 51129CS-Cr 0.2 45109CR-Cr 0.0 50132CP-Cr 2.1 51 19123CS-Cr 0.8 2.1 51 57 48132CJ-Cr 51128CR-Cr 3.6 3.9 9 25102CR-Cr 0.9 0.4 52 58124CS-Cr 5.1 14109ZC-Cu 2.3 51 46109FA-Fa 0.1 49127FL-Fl 6.3 5.0 9.1 2 3 1129FL-Fl 0.5 3.4 5.8 34 11 8104FS-Fl 0.3 4.6 40 4102FL-Fl 51119ME-Me 4.2 2.0 2.8 8 22 36132MS-Me 4.1 2.8 9 17119MF-Me 2.8 2.0 2.6 14 21 41122MS-Me 2.1 1.1 6.8 16 48 3127ME-Me 1.4 1.1 2.6 21 47 40113MD-Me 1.1 5.2 27 11110CM-Me 0.9 1.2 29 43104MS-Me 0.5 0.8 33 56102M3-Me 0.2 1.6 2.1 43 33 49131ME-Me 0.2 44102M2-Me 0.1 3.1 48 15132MB-Me 51124ME-Me 3.5 29120MB-Mi 2.9 13119MB-Mi 1.0 28102MI-Mi 0.1 47110AR-RG 6.9 0.8 1 55119RG-RG 5.7 1.6 3.4 3 31 31127RG-RG 1.7 1.5 5.2 20 35 10132RG-RG 1.3 3.6 23 8113RG-RG 1.1 0.6 4.4 26 60 21104RG-RG 0.9 3.4 29 12122RG-RG 0.8 1.2 3.5 31 39 28131RG-RG 0.4 0.8 37 54111RG-RG 1.4 4.6 51 36 18109RG-RG 1.3 2.8 51 38 35123RG-RG 0.3 6.7 51 61 5128GR-RG 3.3 5.1 13 15128GS-RG 3.3 5.1 13 15131YG-RG 1.2 42120TC-Th 5.1 1.7 5.2 5 28 9120TA-Th 4.4 1.7 5.1 7 30 13122TS-Th 1.2 0.9 2.5 24 52 45104H5-Th 0.4 5.0 37 2131SS-Th 0.2 4.6 42 4129SO-Th 0.2 1.5 2.7 45 34 38123TS-Th 1.7 3.9 51 29 24111TS-Th 8.7 51 2
Continued on next page
* Based on all sites, i.e. including sites w ith low level irrigation
Crop production per megalitre
Rank*(t/ML)
Drip
irrigatio
n s
yste
ms
Tab
le 1
1a: S
ites u
sin
g d
rip irrig
atio
n ra
nked
with
resp
ect to
the h
igh
est c
rop
pro
du
ctio
n p
er m
eg
alitre
of w
ate
r ap
plie
d
Fig
ure
16
a: C
rop
pro
du
ction
pe
r me
galitre
of w
ate
r ap
plie
d a
t sites u
sing d
rip irrig
atio
n g
rou
pe
d b
y v
arie
ty
AR: Autumn Royal, Cal: Calmeria, Cr: Crimson Seedless, Cu: Currant,
Fa: Fantasy. Fl: Flame Seedless, Mi: Midnight Beauty, Me: Menindee
Seedless, Oh: Ohanez, RG: Red Globe, Th: Thompson Seedless
0 2 4 6 8 10 12
127AR-AR132AR-AR
123AR-AR
128AR-AR127CA-Cal
122CA-Cal126CA-Cal
120CR-Cr
127CR-Cr110BC-Cr
119CR-Cr122CR-Cr
132CR-Cr131CS-Cr
129CS-Cr
109CR-Cr132CP-Cr
123CS-Cr132CJ-Cr
128CR-Cr
102CR-Cr124CS-Cr
109ZC-Cu109FA-Fa
127FL-Fl
129FL-Fl104FS-Fl
102FL-Fl119ME-Me
132MS-Me
119MF-Me122MS-Me
127ME-Me113MD-Me
110CM-Me104MS-Me
102M3-Me
131ME-Me102M2-Me
132MB-Me124ME-Me
120MB-Mi
119MB-Mi102MI-Mi
110AR-RG119RG-RG
127RG-RG
132RG-RG113RG-RG
104RG-RG122RG-RG
131RG-RG
111RG-RG109RG-RG
123RG-RG128GR-RG
128GS-RG131YG-RG
120TC-Th
120TA-Th122TS-Th
104H5-Th131SS-Th
129SO-Th
123TS-Th111TS-Th
Site
and
cultivar ID
Yield per water applied (t/ML)
2011
2010
2009

Table Grape Irrigation Benchmarking 2002 - 2011 27
Site 2011 2010 2009 2011 2010 2009
133CS-Cr 1.2 51 40
125CB-Cr 2.0 3.1 20 33
125CM-Cr 2.0 6.4 23 7
101CS-Cr 1.0 55
110BC-Cr 0.3 59
134F2-Fl 4.6 6
134F1-Fl 3.4 10
104FS-Fl 4.1 22
134M4-Me 1.3 22
134M1-Me 0.4 35
134M3-Me 0.4 39
133MS-Me 1.9 51 25
134M2-Me 51
125MH-Me 0.6 2.5 58 44
125MP-Me 0.6 1.5 58 53
104MS-Me 4.6 19
101MD-Me 2.6 42
102M2-Me 0.5 56
110CM-Me 0.4 57
125OH-Oh 1.7 51
125GL-RG 1.2 6.6 44 6
125GR-RG 1.2 3.8 44 26
104RG-RG 5.2 12
131RG-RG 3.3 32
101RG-RG 1.5 52
110AR-RG 1.0 54
130SR-Th 3.7 4.6 7 19
125TO-Th 1.9 2.8 25 34
125TS-Th 1.9 2.6 25 43
104H5-Th 3.5 30
101TS-Th 2.0 50
Maximum 6.9 6.4 9.1 51 61 59
Median 0.5 1.6 3.5
Minimum 0.3 0.3
** Based on all sites, i.e. including sites w ith drip irrigation
Low
level irrig
atio
n s
yste
ms
Crop production per megalitre
Rank**(t/ML)T
ab
le 1
1b
: Site
s u
sin
g lo
w le
vel irrig
atio
n ra
nked
with
resp
ect to
the h
igh
est c
rop
pro
du
ctio
n p
er m
eg
alitre
of w
ate
r ap
plie
d
Fig
ure
16
b: C
rop
pro
du
ction
pe
r me
galitre
of w
ate
r ap
plie
d a
t sites u
sing lo
w le
ve
l irrigatio
n g
rou
pe
d b
y v
arie
ty
AR: Autumn Royal, Cal: Calmeria, Cr: Crimson Seedless, Cu: Currant,
Fa: Fantasy. Fl: Flame Seedless, Mi: Midnight Beauty, Me: Menindee
Seedless, Oh: Ohanez, RG: Red Globe, Th: Thompson Seedless
0 2 4 6 8 10 12
133CS-Cr
125CB-Cr
125CM-Cr
101CS-Cr
110BC-Cr
134F2-Fl
134F1-Fl
104FS-Fl
134M4-Me
134M1-Me
134M3-Me
133MS-Me
134M2-Me
125MH-Me
125MP-Me
104MS-Me
101MD-Me
102M2-Me
110CM-Me
125OH-Oh
125GL-RG
125GR-RG
104RG-RG
131RG-RG
101RG-RG
110AR-RG
130SR-Th
125TO-Th
125TS-Th
104H5-Th
101TS-Th
Site
and
cultivar ID
Yield per water applied (t/ML)
201
12010
2009
28 Table Grape Irrigation Benchmarking 2002 - 2011
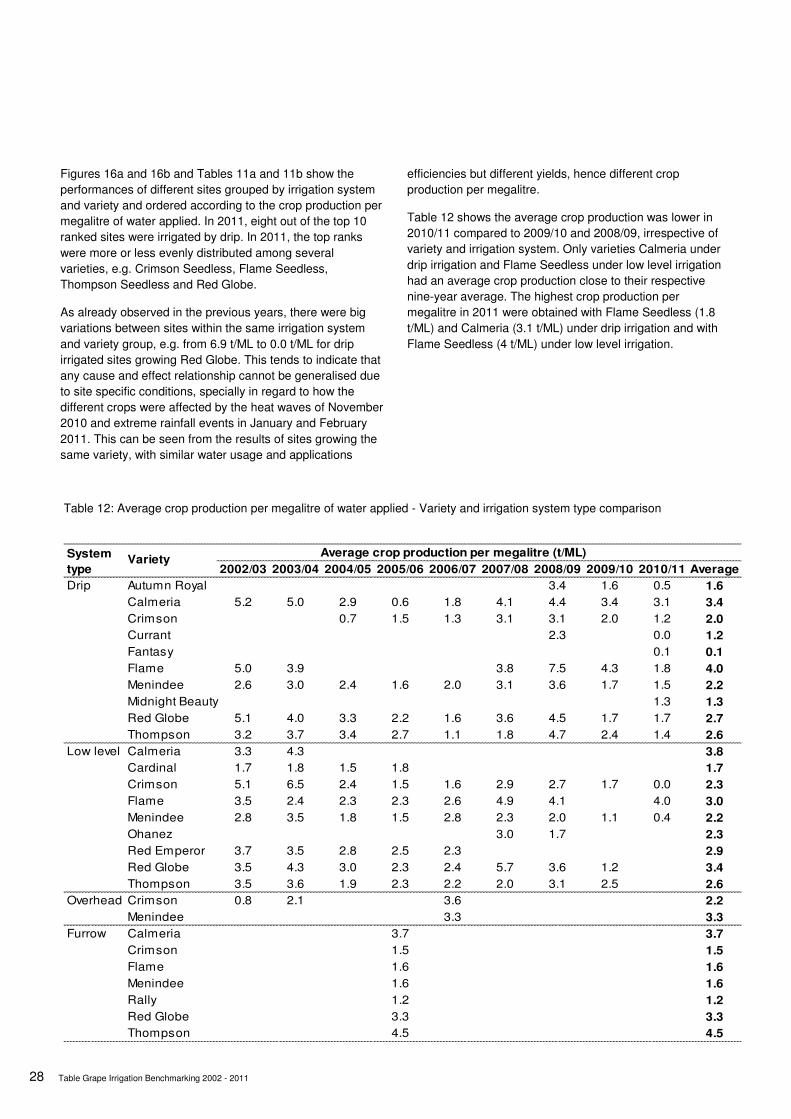
Figures 16a and 16b and Tables 11a and 11b show the
performances of different sites grouped by irrigation system
and variety and ordered according to the crop production per
megalitre of water applied. In 2011, eight out of the top 10
ranked sites were irrigated by drip. In 2011, the top ranks
were more or less evenly distributed among several
varieties, e.g. Crimson Seedless, Flame Seedless,
Thompson Seedless and Red Globe.
As already observed in the previous years, there were big
variations between sites within the same irrigation system
and variety group, e.g. from 6.9 t/ML to 0.0 t/ML for drip
irrigated sites growing Red Globe. This tends to indicate that
any cause and effect relationship cannot be generalised due
to site specific conditions, specially in regard to how the
different crops were affected by the heat waves of November
2010 and extreme rainfall events in January and February
2011. This can be seen from the results of sites growing the
same variety, with similar water usage and applications
efficiencies but different yields, hence different crop
production per megalitre.
Table 12 shows the average crop production was lower in
2010/11 compared to 2009/10 and 2008/09, irrespective of
variety and irrigation system. Only varieties Calmeria under
drip irrigation and Flame Seedless under low level irrigation
had an average crop production close to their respective
nine-year average. The highest crop production per
megalitre in 2011 were obtained with Flame Seedless (1.8
t/ML) and Calmeria (3.1 t/ML) under drip irrigation and with
Flame Seedless (4 t/ML) under low level irrigation.
Table 12: Average crop production per megalitre of water applied - Variety and irrigation system type comparison
2002/03 2003/04 2004/05 2005/06 2006/07 2007/08 2008/09 2009/10 2010/11 Average
Drip Autumn Royal 3.4 1.6 0.5 1.6
Calmeria 5.2 5.0 2.9 0.6 1.8 4.1 4.4 3.4 3.1 3.4
Crimson 0.7 1.5 1.3 3.1 3.1 2.0 1.2 2.0
Currant 2.3 0.0 1.2
Fantasy 0.1 0.1
Flame 5.0 3.9 3.8 7.5 4.3 1.8 4.0
Menindee 2.6 3.0 2.4 1.6 2.0 3.1 3.6 1.7 1.5 2.2
Midnight Beauty 1.3 1.3
Red Globe 5.1 4.0 3.3 2.2 1.6 3.6 4.5 1.7 1.7 2.7
Thompson 3.2 3.7 3.4 2.7 1.1 1.8 4.7 2.4 1.4 2.6
Low level Calmeria 3.3 4.3 3.8
Cardinal 1.7 1.8 1.5 1.8 1.7
Crimson 5.1 6.5 2.4 1.5 1.6 2.9 2.7 1.7 0.0 2.3
Flame 3.5 2.4 2.3 2.3 2.6 4.9 4.1 4.0 3.0
Menindee 2.8 3.5 1.8 1.5 2.8 2.3 2.0 1.1 0.4 2.2
Ohanez 3.0 1.7 2.3
Red Emperor 3.7 3.5 2.8 2.5 2.3 2.9
Red Globe 3.5 4.3 3.0 2.3 2.4 5.7 3.6 1.2 3.4
Thompson 3.5 3.6 1.9 2.3 2.2 2.0 3.1 2.5 2.6
Overhead Crimson 0.8 2.1 3.6 2.2
Menindee 3.3 3.3
Furrow Calmeria 3.7 3.7
Crimson 1.5 1.5
Flame 1.6 1.6
Menindee 1.6 1.6
Rally 1.2 1.2
Red Globe 3.3 3.3
Thompson 4.5 4.5
System
typeVariety
Average crop production per megalitre (t/ML)

Table Grape Irrigation Benchmarking 2002 - 2011 29
3.4 Gross return per ML of water applied
Gross return per megalitre of water applied is the ratio
between the price per hectare ($/ha) received by the growers
for the sale of their produce and the volume of irrigation
water applied (ML/ha) over the season (see Equation 2 -
Appendix B). A number of factors contribute to the
differences in gross return between sites and between
seasons. Such factors include age of the vines, maintenance
and management of irrigation systems, volume of water
applied, crop damage, and the market value of the crop.
Gross return per megalitre of water applied does not
consider input costs and therefore does not give an
indication of growers’ profits.
Figure 17 shows the median value for gross return per
megalitre for 2011 (($1107/Ml) was lowest on record, with
the previous lowest being $3067/Ml in 2005 compared to the
highest of $6753/Ml in 2009. The range of values in 2011
was very large being $0/Ml to $21653/Ml which is the second
highest value on record. For only the second time since the
start of the project low level irrigated sites ($3976/Ml)
showed a higher gross return per megalitre than their drip
irrigated counterparts ($3078/Ml). Both the low level
(-$560/Ml) and drip (-$1935/Ml) had lower averages in 2011
than their long term averages. Drip irrigated sites have a
higher long term average than the low level sites.
3.4.1 Gross return per Megalitre of water applied - irrigation system type comparison
Drip irrigated sites had an average gross return per megalitre
of $816/ML higher than low level irrigated sites in 2010
(Table 13). In fact, the seasonal results for drip irrigation
were higher than those of low level irrigation seven years out
of eight. The results for drip and low level irrigated sites in
the last season were $4412/ML and $1863/ML respectively
below their results in 2008/09 and $1191/ML and $862/ML
respectively below their eight-year averages.
Figure 17: Box plot of gross return per Megalitre of water applied between 2003 and 2011
Table 13: Average gross return per megalitre of water applied ($/ML) - Irrigation system type comparison
Drip Furrow Low level Overhead Average
2002/03 6908 5298 1180 5564
2003/04 5540 5340 3002 5326
2004/05 3706 3167 3305
2005/06 3589 4539 3471 3650
2006/07 2664 3812 7760 3678
2007/08 6713 6164 6402
2008/09 8924 5379 7542
2009/10 4512 3696 4365
2010/11 3078 3976 3188
Average 5013 4539 4536 4926 4773
SeasonAverage gross return per megalitre ($/ML)
2003 2004 2005 2006 2007 2008 2009 2010 2011
05
000
10
000
15
000
Gro
ss r
etu
rn p
er
mega
litre
($/M
L)

30 Table Grape Irrigation Benchmarking 2002 - 2011
3.4.2 Gross return per Megalitre of water applied - variety comparison
The seasonal average gross return achieved by each variety
is presented in Table 14. The results are calculated from the
market value of a particular variety and the volume of water
applied per hectare. If the price for the sale of fruit has not
changed substantially then the difference in gross return per
megalitre between seasons depends largely on the irrigation
applied and the yield.
With an average return of $8585/Ml Flame out performed all
of the other varieties in this study in 2011. Flame has
consistently had the greatest returns since 2001. Autumn
Royal (-$3415/Ml), Crimson (-$2363/Ml), Menindee (-$1790),
Red Globe (-1803) and Thompson (-1492) were all well
below their long term averages.
However all varieties had lower results in 2010/11 compared
to 2009/10 except for Calmeria and Red Globe. It should
again be noted some of these best results should be
interpreted with caution as they were obtained from a small
sample of sites.
Table 14: Average gross return per megalitre of water applied ($/ML) - Variety comparison
2002/03 2003/04 2004/05 2005/06 2006/07 2007/08 2008/09 2009/10 2010/11 Average
Autumn Royal 9633 4732 1244 4659
Calmeria 7119 6406 3690 2504 2362 5875 6963 4429 5941 5215
Cardinal 2697 2925 1173 2211 2252
Crimson 4632 6711 2602 2980 3668 8232 6960 5190 2453 4816
Currant 2107 5 1056
Fantasy 103 103
Flame 6756 5199 3625 3658 5128 10610 16940 9053 8585 7482
Menindee 4558 5167 2793 2848 4828 5444 6072 3765 2390 4180
Midnight Beauty 2892 2892
Ohanez 5907 3373 4640
Rally 2576 2576
Red Emperor 5847 5546 4036 2959 2608 4199
Red Globe 6223 5678 4031 4462 3202 8346 8320 2936 3331 5134
Thompson 5280 4700 3112 4447 2960 3310 6838 4724 2772 4264
Average 5564 5326 3305 3650 3678 6402 7542 4365 3188 4773
Average gross return per megalitre ($/ML)Variety

Table Grape Irrigation Benchmarking 2002 - 2011 31
3.5 Cost of water per tonne of fruit
Cost of water per tonne of fruit is calculated using Equation 3
(Appendix B) and is influenced by many factors within
irrigation systems and seasons. Inputs comprise the cost of
irrigation water, the cost of on/off-peak electricity for
pumping, the total number of irrigation hours and the yield
produced. It should not be interpreted as being definitive due
to the number of variables involved in the calculation.
In 2010, 50% of the sites had a cost of water per tonne of
fruit between $63/t and $206/t. As a comparison, the results
for 50% of the sites were between $43/t and $120/t in 2009
and between $56/t and $223/t in 2008.The majority of values
in the last eight seasons were below $100/t but a few sites
had extremely high values, e.g. above $300/t. The outliers in
most cases were due to a combination of an extremely low
yield combined with a high cost of water.
3.5.1 Cost of water per tonne of fruit - irrigation system type comparison
Table 15 shows the result for drip irrigation in 2010 ($267/t)
was the highest average cost of water per tonne of fruit over
the nine seasons. This result was also more than twice the
seasonal average ($118/t) and five times the 2011 average
of low level irrigated sites ($53/t). The main reason is the
reduced yields experienced by many irrigators due to the
extreme rainfall events experienced in 20011. There were
more drip irrigated sites participating in 2011 that were
impacted by the rainfall reflecting the greater impact on the
average of the drip sites.
Figure 18: Box plot of cost of water per tonne of fruit between 2003 and 2011
Figure 18 shows that in 2011 the median value of the cost of
water per tonne of fruit was the third highest in the nine years
of the project at $107/t in 2011 behind $131/t in 2008 and
$110/t in 2010. The main reason for this high value was not
the cost of water as experienced in 2008 but the low yields
due to the extreme rainfall events during the growing season.
In 2011 the mid range 50% of sites had a cost of water per
tonne of fruit between $40/t and $347/t. As a comparison,
the results for 2010 were between $63/t to $206/t and $43/t
to $120/t for 2009.
Table 15: Average cost of water per tonne of fruit - Irrigation system type comparison
Average cost of water per tonne of fruit ($/t) Season
Drip Furrow Low level Overhead Average
2002/03 26 39 152 39
2003/04 32 39 62 38
2004/05 46 61 57
2005/06 106 41 89 87
2006/07 122 82 24 90
2007/08 138 187 165
2008/09 99 150 119
2009/10 227 98 204
2010/11 267* 53 160*
Average 118 41 89 66 107
* two sites that produced negligible volumes of fruit in 2011 (eg 15 Kg/Ha) were discounted in determining these averages
2003 2004 2005 2006 2007 2008 2009 2010 20110
20
04
00
60
08
00
Co
st of w
ate
r pe
r to
nne o
f fr
uit (
$/t)

32 Table Grape Irrigation Benchmarking 2002 - 2011
3.6 Gross return per dollar water input
This indicator compares dollar returns from the sale of fruit
with the expenditure on water to produce that fruit ($/$). It is
strongly influenced by water costs and the gross return on
crop production. Water costs often differ between growers
according to the supply source and its associated cost
structure.
Figure 19 shows there were large variations between the
different sites within each year.
Table 16 shows a different perspective from the results
presented in Figure 19. The gross returns per dollar water
input in 2011 showed the median value was the lowest of all
years recorded at $9.50. The results of the previous years
ranged from $13.40 in 2008 to $52.30 in 2003. This is
chiefly due to the low yields experienced in 2011. The range
of values for 2011 was the second highest recorded at 0 to
$401.20. In 2011 the drip irrigated sites recorded their
lowest value at $24 which is $19 less than the overall
average. Conversely the low level irrigated sites had their
highest ever average at $98 which is $58 greater than the
overall average. The number of low level sites was only
eight, three of which recorded no yield, so any comparison
between the drip and low level irrigated sites may be
misleading. This demonstrates how different statistics can
provide different level of information. In the present case, the
high results at some sites compensated for the low results at
other sites and therefore influenced the averages.
Figure 19: Box plot of gross return per dollar water input between 2003 and 2011
Table 16: Average gross return per dollar water input ($/$) - Irrigation system type comparison
Drip Furrow Low level Overhead
2002/03 101 58 9
2003/04 65 55 23
2004/05 47 34
2005/06 46 56 39
2006/07 41 41 93
2007/08 40 16
2008/09 52 20
2009/10 45 28
2010/11 24 98
Average 43 56 40 54
SeasonAverage gross return per dollar water input ($/$)
2003 2004 2005 2006 2007 2008 2009 2010 20110
50
10
01
50
20
02
50
Gro
ss r
etu
rn p
er
$ w
ate
r in
put

Table Grape Irrigation Benchmarking 2002 - 2011 33
• Irrigation Benchmarking continues to be a useful tool to
assess and compare growers' performances from season
to season, as well as to identify best irrigation
management practices.
• Although site-specific conditions and the presence of
confounding factors often make comparisons difficult, the
results nevertheless provide important information about
the diversity that exists within the industry and the
potential returns associated with different irrigation
management strategies.
• After the good yield results for season 2008/09, the
heatwave conditions in November 2009 and extreme
rainfall events in 2011 showed how severely the yield at
many sites could be affected by unfavourable climatic
conditions.
• The extreme rainfall events experienced by many table
grape growers in the 2010-2011 season led to many sites
in this study being water logged or prone to high disease
pressure, both of which led to lower quality and yields.
• The average yield of all varieties for drip irrigated sites in
2011 (5.7 t/ha) was less than half that of 2010, and 21.8
t/ha lower compared to the average of 2009. In the case
of low level irrigated sites, the average yield in 2011(5.4
t/ha) was 8.6 t/ha and 18.5 t/ha lower than the averages
of 2010 and 2009 respectively.
• Season 2010/11 resulted in 13.8% of sites scoring within
the target 85-90% application efficiency range with a
further 33.8% scoring over 90%. This result indicates that
there are still many sites that could improve their timing
and amount of irrigation.
• Drip irrigated sites generally achieved application The
average application efficiencies for sites with drip irrigation
were more consistent over the nine years and were also
higher than those for low level irrigation. In 2011, the
application efficiency for low level irrigation was 21% less
than the average for drip irrigation, and 1% below its own
nine-year average of 86%. The nine-year averages show
that drip irrigated sites had an application efficiency
average of 86% while the low level irrigated sites only
averaged 74%.
• The crop production per megalitre results for both drip
(0.55 t/Ml) and low level (0.39t/Ml) irrigated sites were the
lowest on record. Despite the drop in water applied for
each of the irrigation systems (see Figure 5) the reduced
yields (see Figure 4) had a greater influence on these
results. The results from previous years ranged from 1.4
t/Ml (2007) to 4.85 t/Ml (2003) for drip irrigated sites and
1.8 t/Ml (2006) to 3.47 t/Ml (2004) for low level irrigated
sites. In 2011 the range was greater for drip irrigated sites
(0 to 6.9 t/Ml) than for the low level irrigated sites (0 to
4.58 t/Ml).
• The results for 2011 shows that both drip (1.4 t/Ml) and
low level (1.3t/Ml) irrigated sites average crop production
per Megalitre were the lowest on record. Both were well
under their long term average with drip 1.1 t/Ml less. The
different varieties grown each had an average crop
production per Megalitre of water in 2011 lower than in
2010 and all were under their longterm average except for
low level irrigated Flame Seedless.
• The median value for gross return per megalitre for 2011
($1107/Ml) was lowest on record, with the previous lowest
being $3067/Ml in 2005 compared to the highest of
$6753/Ml in 2009. The range of values in 2011 was very
large being $0/Ml to $21653/Ml which is the second
highest value on record. For only the second time since
the start of the project low level irrigated sites ($3976/Ml)
showed a higher gross return per megalitre than their drip
irrigated counterparts ($3078/Ml). Both the low level
(-$560/Ml) and drip (-$1935/Ml) had lower averages in
2011 than their long term averages. Drip irrigated sites
have a higher long term average than the low level sites.
• In terms of irrigation scheduling method, sites that used
capacitance probes or tensiometers achieved higher
application efficiencies than sites using the dig method or
experience only.
• More important than using a particular irrigation system or
scheduling method alone is the effective combination of
different irrigation and management practices used by
growers in achieving good production quality and quantity.
Conclusions

34 Table Grape Irrigation Benchmarking 2002 - 2011
A. Further reading
• Giddings, J., Kelly, S., Chalmers, Y., & Cook, H. (2002).
Winegrape irrigation benchmarking Murray-Darling and
Swan Hill 1998-2002. In Dundon, C., Hamilton, R.,
Johnstone, R., & Partrigde, S. (Eds.), Managing Water,
(pp. 15–18)., Adelaide, SA. Australian Society of
Viticulture and Oenology.
• Pollock, L. (2009). Irrigation benchmarking - Evaluation
study. Technical report, Department of Primary Industries,
Victoria.
• Primary Industries and Resources (2000). Irrigation
Benchmarking Module and Manual. Primary Industries
and Resources, South Australia.
• Ratna, R. D. & Pollock, L. (2010a). Almond irrigation
benchmarking 2002-2009. Technical report, Department
of Primary Industries, Victoria.
• Ratna, R. D. & Pollock, L. (2010b). Dried vine fruit
irrigation benchmarking 2002-2009. Technical report,
Department of Primary Industries, Victoria.
• Ratna, R. D. & Pollock, L. (2010c). Dried vine fruit
irrigation benchmarking 2002-2010. Technical report,
Department of Primary Industries, Victoria
• Ratna, R. D. & Pollock, L. (2010d). Table grape irrigation
benchmarking 2002-2009. Technical report, Department
of Primary Industries, Victoria.
• Skewes, M. & Meissner, T. (1997a). Irrigation benchmarks
and best management practice for citrus. Technical
report, Primary Industries and Resources, South
Australia.
• Skewes, M. & Meissner, T. (1997b). Irrigation benchmarks
and best management practice for winegrapes. Technical
report, Primary Industries and Resources, South
Australia.
• Skewes, M. & Meissner, T. (1998). Irrigation benchmarks
and best management practice for potatoes. Technical
report, Primary Industries and Resources, South
Australia.
• Sommer, K. J. & Pollock, L. (2007a). Almond irrigation
benchmarking 2002-2007. Technical report, Department
of Primary Industries, Victoria.
• Sommer, K. J. & Pollock, L. (2007b). Dried vine fruit
irrigation benchmarking 2002-2007. Technical report,
Department of Primary Industries, Victoria.
• Sommer, K. J. & Pollock, L. (2007c). Table grape
irrigation benchmarking 2002-2007. Technical report,
Department of Primary Industries, Victoria.
• Sommer, K. J. & Pollock, L. (2008a). Almond irrigation
benchmarking 2002-2008. Technical report, Department
of Primary Industries, Victoria.
• Sommer, K. J. & Pollock, L. (2008b). Dried vine fruit
irrigation benchmarking 2002-2008. Technical report,
Department of Primary Industries, Victoria.
• Sommer, K. J. & Pollock, L. (2008c). Table grape
irrigation benchmarking 2002-2008. Technical report,
Department of Primary Industries, Victoria.
• Toll, Z. & Burrows, D. (2006a). Almond irrigation
benchmarking 2002-2006. Technical report, Department
of Primary Industries, Victoria.
• Toll, Z. & Burrows, D. (2006b). Dried vine fruit irrigation
benchmarking 2002-2006. Technical report, Department
of Primary Industries, Victoria.
• Toll, Z. (2006c). Open hydroponics irrigation
benchmarking 2002-2005. Technical report, Department
of Primary Industries, Victoria.
• Toll, Z. (2006d). Open hydroponics irrigation
benchmarking 2002-2006. Technical report, Department
of Primary Industries, Victoria.
• Toll, Z. & Burrows, D. (2006e). Potato centre pivot
irrigation benchmarking 2002-2005. Technical report,
Department of Primary Industries, Victoria.
• Toll, Z. & Burrows, D. (2006f). Table grape irrigation
benchmarking 2002-2006. Technical report, Department
of Primary Industries, Victoria.
• Vargas, J. (2005a). Almond irrigation benchmarking 2002-
2005. Technical report, Department of Primary Industries,
Victoria.
• Vargas, J. (2005b). Dried fruit irrigation benchmarking
2002-2005. Technical report, Department of Primary
Industries, Victoria.
• Vargas, J. (2005c). Table grape irrigation benchmarking
2002-2005. Technical report, Department of Primary
Industries, Victoria
Appendix

Table Grape Irrigation Benchmarking 2002 - 2011 35
B. Performance indicator formulas
(ML/ha) appliedWater
(t/ha) Yield 1. =(t/ML) MLper production Crop
(ML/ha) appliedWater
($/t) valueAssigned (t/ha) Yield 2.
×=($/ML) MLper return Gross
(t/ha) Yield
($/ha) haper applied water ofCost 3. =($/t)fruit of tonneper water ofCost
( ) (ML/ha) applied water ($/ML)cost pumping ($/ML) water ofCost
4.
×+
=($/ha) haper appliedwater ofCost
($/ha) haper applied water ofCost
($/t) valueAssigned (t/ha) Yield 5.
×=inputwater dollar per return Gross
( )
(ML/ha) appliedWater
100 (ML/ha) drainage - (ML/ha) appliedWater 6.
×=(%) efficiency nApplicatio
(ML/ha) drainage Estimated
(t/ha) Yield 7. =(t/ML) drainage of volumeper Yield
(t/ha) Yield
($/ha) haper drainage ofCost 8. =($/t) tonneper drainage ofCost
( ) (ML/ha) drainage estimated ($/ML)cost pumping ($/ML) water ofCost
9.
×+
=($/ha) haper drainage ofCost

36 Table Grape Irrigation Benchmarking 2002 - 2011
C. Performance indicator tables
2003 2004 2005 2006 2007 2008 2009 2010 2011101CS 6 Capacitance Low level Crimson Seedless 3000101MD 18 Capacitance Low level Menindee Seedless 1000 1000 1400 2000 2100 2100 1800101RG 60 Capacitance Low level Red Globe 1000 1000 1400 1700 1400 1750 1800101TS 60 Capacitance Low level Thompson Seedless 1000 200 1200 1600 1800 1800 1600102CR 8 Capacitance Drip Crimson Seedless 3400 3200 3000102FL 1 Capacitance Drip Flame Seedless 0102M2 34 Capacitance Low level Menindee Seedless 3400 3500102M2 36 Capacitance Drip Menindee Seedless 3500 3500102M3 23 Capacitance Drip Menindee Seedless 3400 3500 3250 3500102MI 5 Capacitance Drip Midnight Beauty 4000103CM 12 Tensiometer Drip Calmeria 1750 1190 1289 1666103CN 5 Capacitance Drip Crimson Seedless 1266 1546103FS 9 Tensiometer Drip Flame Seedless 2000 2190103MD 13 Tensiometer Drip Menindee Seedless 2060 1690 1427 2190103RG 13 Other Drip Red Globe 1820 1000 1263 2341103TS 13 Tensiometer Drip Thompson Seedless 1600 1390 1543 1810104FS 32 Tensiometer Low level Flame Seedless 2200 2400104FS 34 Tensiometer Drip Flame Seedless 2200 2200104H5 5 Tensiometer Low level Thompson Seedless 1900 2200104H5 7 Tensiometer Drip Thompson Seedless 2400 3000104MS 5 Tensiometer Low level Menindee Seedless 1700 2000104MS 7 Tensiometer Drip Menindee Seedless 3000 2200104RG 15 Tensiometer Low level Red Globe 1300104RG 17 Tensiometer Drip Red Globe 1800 1300105FL 18 Other Low level Flame Seedless 1600 1600 1500 1700 1600105MD 12 Other Low level Menindee Seedless 1600 1600 1500 1500 1200105RG 9 Other Low level Red Globe 1600 1600 1500 1600 1800105TS 44 Other Low level Thompson Seedless 1600 1600 1500 1600 1600106CM 11 Other Low level Calmeria 1600 1600106CR 11 Other Low level Crimson Seedless 1600 1600106MD 11 Other Low level Menindee Seedless 1600 1600106RG 11 Other Low level Red Globe 1600 1600106TS 52 Other Low level Thompson Seedless 1600 1600107CR 10 Other Low level Crimson Seedless 1400 1550 1400107FL 11 Other Low level Flame Seedless 1600 1600 1500 1500 1600107MD 14 Other Low level Menindee Seedless 1600 1600 1400 1500 1600107RE 17 Other Low level Red Emperor 1600 1600 1450 1200 1150107RG 15 Other Low level Red Globe 1600 1600 1200 1100 1375107TS 12 Other Low level Thompson Seedless 1200 1550 1450108MD 50 Dig Low level Menindee Seedless 1600 1600 1400 1400109CR 2 Other Drip Crimson Seedless 2000109FA 3 Other Drip Fantasy 2000109RG 13 Other Drip Red Globe 2000 500 0109ZC 27 Other Drip Currant 900 1225110AR 18 Dig Low level Red Globe 1600 1600 1200 1789 1300 1385 1700110AR 20 Dig Drip Red Globe 1400 2216110BC 4 Other Overhead Crimson Seedless 1400 1400110BC 9 Dig Low level Crimson Seedless 1200 1684 1750 4500 2050110BC 10 Dig Drip Crimson Seedless 2100 1865110CM 12 Dig Low level Menindee Seedless 1600 1600 1000 1305 1400 1400 1400110CM 14 Dig Drip Menindee Seedless 1400 1400110DC 21 Dig Low level Cardinal 1600 1600 800 1200111RG 15 Capacitance Drip Red Globe 444 1146 1200 1800 1250 1700 1000 0111TS 13 Capacitance Drip Thompson Seedless 560 1794 1200 1600 1500 1100 0112CR Capacitance Low level Crimson Seedless 1400 2777112RG Capacitance Low level Red Globe 1200 2333112TS Capacitance Low level Thompson Seedless 1200 1667113MD 17 Capacitance Drip Menindee Seedless 2200 1600 1400 2200 2200 2700 2777 2000113RG 17 Capacitance Drip Red Globe 2400 1400 1260 2200 2000 2500 2777 2600 2000114MS 15 Capacitance Low level Thompson Seedless 2000 1600 1200 1800114RG 15 Capacitance Low level Red Globe 2400 1400 1400 2000115RG 6 Capacitance Low level Red Globe 1700 600115RG 7 Capacitance Drip Red Globe 1500116FS 19 Tensiometer Low level Flame Seedless 1700 2000 1850 2667 2600116MS 11 Tensiometer Low level Menindee Seedless 2000 1400 1800 2000 1900116NC 4 Tensiometer Low level Crimson Seedless 2444 2200116RG 10 Tensiometer Low level Red Globe 1850 1300 1700 2667 1900116TS 8 Tensiometer Low level Thompson Seedless 1800 1200 2100 2667 2200117RG 12 Tensiometer Low level Red Globe 1600 1600 1200 2000117TS 64 Tensiometer Low level Thompson Seedless 1600 1600 1400 1500118CA 15 Other Furrow Calmeria 1495118CR 4 Other Furrow Crimson Seedless 1750118FS 15 Other Furrow Flame Seedless 1660118MS 15 Other Furrow Menindee Seedless 2100118RG 10 Other Furrow Red Globe 2300
Assigned value ($/t) System
Type
Age
2011Site Variety
Scheduling
Method
Continued on next page

Table Grape Irrigation Benchmarking 2002 - 2011 37
2003 2004 2005 2006 2007 2008 2009 2010 2011118RS 7 Other Furrow Rally Seedless 2100118TS 45 Other Furrow Thompson Seedless 1660119CR 5 Other Drip Crimson Seedless 2200119MB 3 Other Drip Midnight beauty 2100119ME 18 Other Low level Menindee Seedless 1500 2000119ME 21 Dig Drip Menindee Seedless 1800 2500 2200119MF 11 Other Low level Menindee Seedless 1500 2000119MF 14 Dig Drip Menindee Seedless 1800 2500 2200119RG 6 Other Low level Red Globe 1200 1620119RG 9 Dig Drip Red Globe 2000 1600 1785119TS 43 Other Low level Thompson Seedless 1200 1800120CR 7 Other Low level Crimson Seedless 2000 2200120CR 10 Dig Drip Crimson Seedless 1950 2000 2200120MB 5 Other Drip Midnight Beauty 2100120TA 7 Other Low level Thompson Seedless 2000 1800120TA 8 Dig Drip Thompson Seedless 1800 1700 1700120TC 5 Other Low level Thompson Seedless 2000 1800120TC 8 Dig Drip Thompson Seedless 1800 1700 2040121TS 10 Other Low level Thompson Seedless 1145122CA 14 Capacitance Drip Calmeria 1667 1333 1450 1550 1160 1888122CR 12 Capacitance Drip Crimson Seedless 2778 2944 2850 2230 2350122MS 12 Capacitance Drip Menindee Seedless 2222 1789 1218 1950 500 2144122RG 14 Capacitance Drip Red Globe 2111 1367 1682 2250 1600 1961122TS 12 Capacitance Drip Thompson Seedless 2166 1988 280 1800 800 2102123AR 14 Tensiometer Drip Autumn Royal 3100 2900 0123CS 12 Tensiometer Drip Crimson Seedless 2200 2000 2880 2245 0123RG 14 Tensiometer Drip Red Globe 1400 1550 1880 1445 0123TS 31 Tensiometer Drip Thompson Seedless 1100 1900 2000 1600 0124CS 9 Tensiometer Overhead Crimson Seedless 2200124CS 11 Tensiometer Drip Crimson Seedless 1800 2350124ME 3 Tensiometer Overhead Menindee Seedless 2300124ME 5 Tensiometer Drip Menindee Seedless 2500 1700125CB 6 Tensiometer Low level Crimson Seedless 3000 2100 3000125CM 9 Tensiometer Low level Crimson Seedless 3000 2200 3000125GL 21 Tensiometer Low level Red Globe 1600 1800 1700125GR 19 Tensiometer Low level Red Globe 1600 1800 1700 0125MH 15 Tensiometer Low level Menindee Seedless 1700 1800 2250125MP 15 Tensiometer Low level Menindee Seedless 1700 1800 2250125OH 17 Tensiometer Low level Ohanez 2000 2000125TO 17 Tensiometer Low level Thompson Seedless 2000 1800 2100125TS 5 Tensiometer Low level Thompson Seedless 1900 1900 1850 2100126CA 27 Capacitance Drip Calmeria 1430 1678 1850127AR 6 Capacitance Drip Autumn Royal 2700 2667 2666127CA 18 Capacitance Drip Calmeria 1450 1550 1160 1888127CR 8 Capacitance Drip Crimson Seedless 2850 2400 2667 2350127FL 23 Capacitance Drip Flame Seedless 2700 3100 1790 3431127ME 13 Capacitance Drip Menindee Seedless 1218 1950 500 2144127RG 13 Capacitance Drip Red Globe 1682 2700 1600 1961128AR 4 Capacitance Drip Autumn Royal 3069128CR 12 Capacitance Drip Crimson Seedless 2800 3358128GR 12 Capacitance Drip Red Globe 2410 2173128GS 12 Capacitance Drip Red Globe 2410 2173129CS 2 Tensiometer Drip Crimson Seedless 2000129FL 30 Other Drip Flame Seedless 2200 2400 2200129SO 52 Other Drip Thompson Seedless 1800 1600 2000130SR 6 Other Low level Thompson Seedless 2000 2000131CS 4 Other Drip Crimson Seedless 2800 2000131ME 2 Other Drip Menindee Seedless 1500131RG 27 Other Low level Red Globe 1100131RG 29 Other Drip Red Globe 1800 1300131SS 4 Other Drip Thompson Seedless 1800 1700131YG 3 Other Drip Red Globe 1800132AR 4 Other Drip Autumn Royal 3380 2500132CJ 2 Other Drip Crimson Seedless 0132CP 11 Other Drip Crimson Seedless 3000 0132CR 8 Other Drip Crimson Seedless 3150 2185132MB 2 Other Drip Menindee Seedless 0132MS 12 Other Drip Menindee Seedless 2600 2009132RG 9 Other Drip Red Globe 1850 1838133CS 11 Capacitance Low level Crimson Seedless 1800 0133MS 11 Capacitance Low level Menindee Seedless 2150 0134F1 29 Capacitance Low level Flame Seedless 3553134F2 9 Capacitance Low level Flame Seedless 3553134M1 20 Capacitance Low level Menindee Seedless 1755134M2 2 Capacitance Low level Menindee Seedless 0134M3 5 Capacitance Low level Menindee Seedless 1755134M4 7 Capacitance Low level Menindee Seedless 1755
Assigned value ($/t) System
Type
Age
2011Site Variety
Scheduling
Method

38 Table Grape Irrigation Benchmarking 2002 - 2011
2003 2004 2005 2006 2007 2008 2009 2010 2011 2003 2004 2005 2006 2007 2008 2009 2010 2011101CS 7.34 2.84101MD 5.51 4.14 6.76 6.32 6.19 4.85 7.24 0.41 0.25 0.93 1.51 1.83 1.04 2.68101RG 5.51 4.51 6.76 6.32 6.45 5.59 7.34 0.34 0.35 0.93 1.51 1.51 1.34 2.84101TS 5.51 4.46 6.76 6.32 6.24 5.27 7.34 0.37 0.18 0.90 1.41 1.44 1.10 2.84102CR 3.98 14.97 12.61 0.72 6.45 6.06102FL 3.40 0.66102M2 8.78 13.31 3.31 4.56102M2 7.93 4.21 1.78 0.71102M3 3.75 10.39 8.16 3.06 0.91 2.35 2.15 0.51102MI 4.19 0.73103CM 7.37 6.67 8.35 8.46 0.73 0.11 1.50 1.39103CN 8.35 8.46 1.50 1.39103FS 7.37 6.52 0.78 0.10103MD 7.37 7.15 8.35 8.46 0.78 0.33 1.50 1.39103RG 7.37 7.15 8.35 8.46 0.78 0.51 1.50 1.39103TS 7.37 7.15 8.35 8.46 0.78 0.33 1.50 1.39104FS 6.52 7.90 1.92 0.68104FS 5.88 3.48 0.58 0.70104H5 6.52 7.63 1.92 0.45104H5 5.89 4.77 0.67 0.73104MS 6.52 8.05 1.94 0.67104MS 5.92 3.45 0.61 0.69104RG 7.90 0.57104RG 5.66 3.45 0.34 0.67105FL 10.98 13.01 11.87 16.86 11.88 3.27 4.61 4.71 9.63 6.07105MD 10.98 13.01 11.87 16.86 13.15 3.30 4.64 4.77 9.91 7.52105RG 10.98 13.01 11.57 16.86 18.24 3.30 4.70 4.73 9.89 11.52105TS 10.98 12.70 11.87 16.86 17.18 3.27 4.68 4.71 9.73 9.78106CM 11.45 8.73 4.07 1.77106CR 4.91 5.73 0.78 0.37106MD 4.91 5.73 0.78 0.37106RG 5.18 6.00 0.78 0.37106TS 4.91 5.73 0.78 0.37107CR 8.91 9.08 7.85 2.16 1.99 1.02107FL 6.84 7.21 9.07 9.08 7.85 1.24 0.50 2.32 1.93 0.83107MD 6.84 7.21 9.02 9.08 7.85 1.26 0.53 2.32 1.93 0.83107RE 6.84 7.21 8.80 9.08 7.85 1.26 0.53 2.32 1.93 0.83107RG 6.84 7.21 9.07 9.08 7.85 1.24 0.50 2.32 1.93 0.83107TS 8.88 9.08 7.85 2.29 1.99 0.81108MD 5.38 5.38 9.78 9.78 1.30 2.29 3.95 4.27109CR 4.01 0.67109FA 4.01 0.67109RG 7.49 5.06 4.04 1.10 0.19 0.67109ZC 7.43 5.04 4.01 1.08 0.19 0.67110AR 8.90 10.94 11.62 13.35 13.77 8.62 15.62 2.19 3.62 4.16 6.51 6.64 1.14 8.40110AR 8.66 2.21 2.07 0.14110BC 5.93 7.55 0.83 1.36110BC 10.38 12.50 13.77 9.23 15.62 3.23 5.68 6.60 1.63 8.40110BC 8.32 2.20 1.73 0.26110CM 8.90 10.94 9.46 6.73 13.77 9.15 15.15 2.29 3.66 2.40 1.16 6.69 1.78 7.88110CM 8.56 1.79 1.86 0.15110DC 8.90 10.94 10.23 6.73 13.77 2.06 3.40 2.89 1.39 6.57111RG 2.78 5.01 4.05 4.19 4.44 2.49 2.51 3.66 1.87 0.08 0.85 0.05 0.00 0.26 0.15 0.04 0.13 0.00111TS 3.04 5.16 6.58 4.88 6.22 3.19 2.61 4.33 2.31 0.15 1.42 1.09 0.57 1.47 0.24 0.04 0.36 0.00112CR 11.35 10.91 3.89 3.48112RG 8.52 8.06 1.38 0.74112TS 8.69 7.90 1.37 0.59113MD 8.90 8.43 5.77 7.86 6.55 6.30 6.43 6.63 4.62 2.83 1.76 0.85 1.52 0.65 1.44 1.66 0.70 0.48113RG 7.23 8.13 7.24 8.93 7.68 7.57 7.63 7.72 5.56 2.19 1.88 1.65 1.93 1.48 2.59 2.61 1.53 0.40114MS 8.48 8.02 15.47 15.32 1.76 0.55 7.88 8.19114RG 8.55 8.48 14.50 14.36 1.76 0.83 6.94 7.25115RG 10.64 9.83 2.75 1.82115RG 6.98 1.66116FS 7.04 8.49 11.68 12.69 7.05 0.38 1.70 4.62 5.15 2.45116MS 7.62 10.83 11.57 12.69 7.05 0.37 2.71 4.59 5.30 2.45116NC 12.45 10.77 5.98 3.86116RG 7.66 12.93 11.43 12.60 9.82 0.46 4.55 4.29 5.03 3.13116TS 7.69 11.27 11.75 12.69 9.45 1.05 3.31 4.66 5.15 2.85117RG 5.39 5.13 6.53 7.62 0.42 0.15 0.28 1.09117TS 5.37 5.08 6.53 7.50 0.47 0.21 0.28 3.87118CA 7.90 1.33118CR 8.30 2.15118FS 8.50 2.58118MS 8.50 2.56118RG 8.00 1.40
SiteWater applied (ML/ha) Estimated drainage (ML/ha)
Continued on next page

Table Grape Irrigation Benchmarking 2002 - 2011 39
2003 2004 2005 2006 2007 2008 2009 2010 2011 2003 2004 2005 2006 2007 2008 2009 2010 2011118RS 7.50 2.10118TS 7.40 2.21119CR 4.61 0.40119MB 4.61 0.38119ME 7.07 6.82 2.34 0.49119ME 7.34 7.36 4.61 2.16 1.19 0.40119MF 7.07 6.82 2.34 0.49119MF 7.25 7.33 4.64 2.10 1.25 0.40119RG 8.79 7.32 1.87 0.49119RG 7.51 7.46 4.73 2.28 1.26 0.35119TS 7.11 6.82 1.84 0.49120CR 10.35 8.20 3.39 1.26120CR 7.60 7.60 4.55 2.47 1.50 0.51120MB 4.55 0.38120TA 8.77 6.58 3.25 0.76120TA 7.49 7.63 4.55 2.40 1.53 0.48120TC 8.84 6.58 3.61 0.76120TC 7.49 7.51 4.55 2.40 1.41 0.48121TS 6.47 1.10122CA 7.04 5.43 5.51 6.57 5.61 4.27 1.24 1.40 0.95 1.13 0.97 1.03122CR 7.04 5.43 4.83 6.34 5.61 4.31 1.24 1.40 0.73 0.97 0.44 1.06122MS 7.04 6.05 6.16 7.68 5.62 4.21 1.24 1.57 1.38 1.67 0.97 0.99122RG 8.64 8.44 5.51 8.11 5.62 4.31 2.15 2.59 0.95 2.00 0.93 1.06122TS 7.41 7.20 6.11 7.80 5.62 4.31 1.17 1.50 1.34 1.65 0.99 1.06123AR 7.61 7.90 1.30 0.40 0.88 0.02123CS 8.82 7.72 7.67 7.81 1.30 2.09 0.56 0.45 0.84 0.02123RG 8.82 7.72 8.79 7.90 1.30 2.04 0.56 1.47 0.84 0.02123TS 8.82 7.72 7.99 7.87 1.30 1.75 0.40 0.33 0.64 0.02124CS 4.30 0.26124CS 1.85 6.28 0.08 0.32124ME 3.44 0.41124ME 1.03 6.06 0.08 0.50125CB 6.00 8.34 9.21 1.31 1.94 2.64125CM 5.29 8.31 9.43 1.04 1.62 2.42125GL 5.29 8.55 8.44 1.04 1.75 2.46125GR 5.29 8.55 8.44 0.99 1.58 2.42125MH 5.29 8.51 9.34 1.04 1.24 2.42125MP 5.29 8.61 9.34 1.04 1.51 2.83125OH 6.00 8.27 1.31 1.37125TO 6.00 8.23 7.76 1.31 1.51 2.42125TS 4.93 6.00 9.09 7.76 0.69 1.31 1.49 2.59126CA 5.27 6.59 7.03 0.30 0.61 0.86127AR 5.39 4.90 4.82 3.98 0.75 0.11 0.37 1.34127CA 5.39 4.90 4.85 3.98 0.75 0.12 0.37 1.34127CR 5.39 4.90 4.96 3.98 0.75 0.12 0.41 1.34127FL 6.52 4.90 4.91 3.98 0.43 0.12 0.42 1.34127ME 5.39 4.90 5.56 3.98 0.74 0.12 0.30 1.34127RG 5.39 4.90 4.86 3.98 0.75 0.12 0.39 1.34128AR 6.67 6.47 0.16 0.53128CR 9.21 6.98 1.28 0.67128GR 6.79 6.64 0.38 0.33128GS 6.79 6.64 0.38 0.33129CS 6.22 1.06129FL 7.79 6.10 6.25 0.82 0.75 1.09129SO 7.79 6.03 6.25 0.67 0.70 1.09130SR 8.06 6.87 0.85 0.20131CS 5.53 5.15 0.52 0.67131ME 5.15 0.65131RG 9.07 1.71131RG 5.16 5.15 0.42 0.66131SS 5.51 5.15 0.52 0.66131YG 5.34 0.54132AR 6.85 2.67 0.64 0.22132CJ 2.67 0.22132CP 6.74 2.67 0.66 0.22132CR 6.59 2.67 0.55 0.22132MB 2.67 0.20132MS 6.68 2.67 0.58 0.22132RG 6.59 2.67 0.54 0.22133CS 9.65 3.11 3.88 0.89133MS 9.65 3.11 3.93 0.92134F1 4.18 1.59134F2 4.35 1.97134M1 5.21 1.93134M2 5.21 2.07134M3 4.35 1.55134M4 4.18 1.41
Water applied (ML/ha) Estimated drainage (ML/ha) Site

40 Table Grape Irrigation Benchmarking 2002 - 2011
2003 2004 2005 2006 2007 2008 2009 2010 2011 2003 2004 2005 2006 2007 2008 2009 2010 2011101CS 789 7.1101MD 73 45 171 284 344 1480 1190 16.0 18.0 9.7 18.9 29.1 19.0 18.8101RG 40 49 861 176 176 1065 789 25.0 20.0 18.5 12.6 12.9 36.6 11.1101TS 297 153 746 1192 1216 6543 5622 25.0 25.0 18.5 25.3 1.1 12.2 15.0102CR 239 1713 1620 6.5 6.0 10.7102FL 315 0.0102M2 1278 1812 8.5 6.9102M2 730 327 24.3 0.3102M3 239 639 587 156 9.1 21.4 12.7 0.7102MI 197 0.5103CM 36 6 79 77 38.0 33.5 23.9 3.8103CN 119 115 5.5 18.8103FS 58 7 37.0 25.2103MD 79 35 165 159 19.0 39.3 29.3 10.0103RG 95 64 198 191 35.5 34.6 23.4 21.0103TS 158 73 331 319 35.7 35.0 28.6 29.0104FS 442 155 32.2 32.2104FS 81 78 26.9 1.0104H5 3041 724 11.5 26.3104H5 660 563 29.6 1.8104MS 1120 349 22.3 36.6104MS 199 179 4.6 1.7104RG 36 40.8104RG 13 21 19.2 3.1105FL 230 332 328 686 432 22.4 22.4 23.6 18.0 19.5105MD 464 668 665 1412 1071 17.4 20.5 18.0 13.7 14.4105RG 309 452 439 940 1094 15.0 33.0 22.9 24.9 21.2105TS 1830 2684 2627 5545 5577 15.0 23.6 19.3 16.8 15.8106CM 264 118 37.3 37.3106CR 34 17 24.8 37.3106MD 102 50 24.8 37.3106RG 102 50 24.8 37.3106TS 373 182 24.8 37.0107CR 332 313 161 32.1 17.6 14.1107FL 53 22 102 87 37 37.5 24.8 30.0 41.8 25.5107MD 237 101 445 379 164 18.6 37.5 29.3 17.2 20.0107RE 81 35 152 130 54 25.0 25.0 24.5 22.4 17.8107RG 266 110 508 434 179 37.5 50.0 33.5 36.6 32.0107TS 1103 982 398 18.5 28.4 22.0108MD 77 146 254 279 20.5 20.5 20.5 20.5109CR 143 0.0109FA 29 0.2109RG 893 149 28 21.1 6.8 0.0109ZC 887 150 28 17.4 0.0110AR 533 911 1069 1714 1499 712 2981 25.0 25.0 26.3 20.0 22.1 26.1 15.8110AR 628 32 7.1 15.3110BC 85 144 5.0 16.2110BC 349 629 627 411 1255 20.0 21.4 25.0 22.5 5.0110BC 462 162 9.2 4.3110CM 175 291 195 96 476 338 892 11.7 21.7 15.0 7.3 20.0 8.3 6.7110CM 179 11 10.0 1.6110DC 53 90 78 39 156 15.0 20.0 15.0 12.4111RG 4 46 3 0 14 8 2 7 0 15.0 12.4 23.0 13.4 3.4 11.6 5.1 0.0111TS 8 77 59 31 80 13 2 20 0 4.7 12.8 22.0 17.2 1.6 22.7 0.0112CR 818 740 18.0 24.0112RG 133 72 30.1 11.1112TS 277 120 9.5 16.6113MD 477 316 154 278 119 8077 3843 902 314 22.5 4.0 7.7 23.2 14.8 29.6 33.4 5.0113RG 393 360 317 376 277 13145 5692 1941 221 37.5 37.5 30.8 23.2 29.7 44.6 33.4 4.7 6.3114MS 124 39 572 607 37.8 31.5 29.0 27.0114RG 124 60 504 538 31.5 25.2 35.3 24.0115RG 38 27 20.7 41.4115RG 25 3.0116FS 11 50 135 150 71 20.5 17.3 18.5 15.6 20.5116MS 39 290 490 567 261 15.5 12.2 13.6 2.7 17.3116NC 160 166 2.3 20.7116RG 71 707 667 781 487 26.3 29.4 25.5 19.1 28.7116TS 81 258 362 400 221 26.3 18.1 21.6 18.8 23.1117RG 23 9 16 61 16.6 35.8 36.0 34.2117TS 172 77 102 1453 12.6 11.8 14.3 19.1118CA 32 29.2118CR 70 12.2118FS 42 13.5118MS 41 13.5118RG 45 26.4
SiteYield (t/ha) Cost of excess ($)
Continued on next page

Table Grape Irrigation Benchmarking 2002 - 2011 41
2003 2004 2005 2006 2007 2008 2009 2010 2011 2003 2004 2005 2006 2007 2008 2009 2010 2011118RS 274 9.2118TS 71 33.6119CR 138 8.9119MB 19 4.6119ME 169 185 22.4 13.8119ME 315 176 37 20.4 14.9 19.4119MF 262 279 27.8 8.5119MF 464 277 56 19.1 14.9 13.1119RG 540 701 22.0 18.5119RG 1320 742 130 25.4 12.2 27.2119TS 258 359 31.0 13.0120CR 959 1659 8.1 21.8120CR 1434 857 190 37.8 14.8 25.3120MB 44 13.3120TA 1160 1206 17.6 15.4120TA 1719 1070 185 38.5 12.6 20.0120TC 749 836 25.9 13.3120TC 999 586 130 39.2 12.6 23.4121TS 170 23.0122CA 69 77 53 67 387 52 5.3 9.6 4.0 17.8 19.5 13.4122CR 103 116 60 86 191 536 6.1 3.2 17.4 36.0 7.8122MS 69 87 77 99 387 151 4.0 10.8 15.7 51.9 6.0 8.9122RG 477 574 210 474 541 268 2.9 4.6 5.1 28.7 6.9 3.6122TS 260 333 298 390 238 402 7.8 5.2 11.0 19.3 4.8 5.0123AR 150 378 3 21.1 10.8 0.0123CS 465 512 314 662 5 18.0 10.4 16.4 5.9 0.0123RG 905 1022 1872 1310 10 9.0 28.8 58.8 2.4 0.0123TS 780 738 452 1001 10 20.3 13.4 31.5 13.2 0.0124CS 35 15.6124CS 110 125 11.6 32.0124ME 28 11.3124ME 195 39 3.8 21.0125CB 416 493 269 12.8 25.4 18.8125CM 362 412 246 23.5 53.1 18.8125GL 226 274 159 59.4 56.2 9.8125GR 347 395 250 28.3 32.5 9.8 0.0125MH 272 234 185 16.5 21.4 5.9125MP 272 282 216 13.4 12.5 5.9125OH 208 175 17.7 14.0125TO 725 675 442 7.8 23.2 14.9125TS 295 2080 1793 1358 2.0 14.5 23.2 14.9126CA 172 377 520 29.2 24.7 16.1127AR 86 13 291 171 19.4 14.6 4.5127CA 43 7 142 77 32.2 32.9 21.0 12.6127CR 43 7 160 85 14.8 11.3 8.1 9.0127FL 20 6 131 68 25.0 44.7 24.5 25.1127ME 128 22 319 256 13.0 13.0 6.0 5.5127RG 174 30 619 345 21.8 25.6 7.2 6.7128AR 100 24 6.0128CR 1147 53 35.9 25.0128GR 760 44 34.3 22.2128GS 504 29 34.3 22.2129CS 109 0.9129FL 109 63 73 45.3 20.8 2.9129SO 1110 523 110 21.1 9.1 0.9130SR 1299 187 36.7 25.6131CS 77 77 4.9 2.0131ME 46 1.0131RG 1140 30.0131RG 336 379 4.3 1.9131SS 182 180 25.2 1.2131YG 190 6.3132AR 383 56 8.2 0.8132CJ 40 0.0132CP 115 16 14.2 0.0132CR 255 42 6.9 1.5132MB 75 0.0132MS 154 25 18.6 11.0132RG 272 46 23.8 3.4133CS 177 44 11.5 0.0133MS 191 45 18.5 0.0134F1 70 14.0134F2 63 19.9134M1 326 2.15134M2 158 0134M3 167 1.55134M4 414 5.44
Cost of excess ($) Yield (t/ha) Site

42 Table Grape Irrigation Benchmarking 2002 - 2011
2003 2004 2005 2006 2007 2008 2009 2010 2011 2003 2004 2005 2006 2007 2008 2009 2010 2011101CS 29 227101MD 19 12 24 22 20 22 28 220 228 230 233 160 228 227101RG 19 13 24 22 21 25 29 220 230 230 233 160 220 224101TS 19 13 24 22 21 24 29 221 229 230 233 162 223 227102CR 51 135 100 238 129 163102FL 58 241102M2 41 85 242 163102M2 106 65 181 233102M3 58 138 112 54 237 181 174 241102MI 67 235103CM 48 44 52 51 240 211 208 171103CN 52 51 208 171103FS 48 43 240 212103MD 48 47 52 51 240 205 208 171103RG 48 47 52 51 240 204 208 171103TS 48 47 52 51 240 205 208 171104FS 42 52 232 231104FS 73 64 231 246104H5 42 49 229 236104H5 69 103 227 244104MS 42 50 231 229104MS 70 64 229 246104RG 48 231104RG 78 64 221 246105FL 31 28 30 24 20 195 206 207 208 199105MD 31 28 29 24 20 195 206 208 208 197105RG 31 28 28 24 24 195 207 209 208 191105TS 31 27 30 24 24 195 177 207 208 192106CM 21 16 194 163106CR 18 21 166 167106MD 18 21 166 167106RG 19 22 207 215106TS 18 21 166 167107CR 34 29 25 214 220 197107FL 25 24 34 29 25 256 200 214 221 199107MD 25 24 34 29 25 256 199 214 220 199107RE 25 24 33 29 25 256 199 214 221 198107RG 25 24 34 29 25 256 200 214 221 198107TS 35 29 25 215 220 196108MD 11 11 14 14 113 110 212 207109CR 87 222109FA 87 222109RG 89 89 87 210 228 222109ZC 88 88 87 206 228 222110AR 19 27 21 24 24 21 34 256 232 204 164 190 249 222110AR 73 18 195 225110BC 19 27 262 238110BC 17 23 24 22 34 206 166 190 248 222110BC 69 19 202 249110CM 19 27 18 14 24 24 33 254 232 208 179 190 251 224110CM 72 15 199 239110DC 19 27 18 14 24 256 233 206 178 190111RG 39 51 75 55 55 43 37 47 29 202 171 236 247 204 273 248 232 221111TS 41 51 77 54 57 43 41 46 29 193 165 218 228 193 272 243 227 220112CR 49 46 188 188112RG 43 44 223 212112TS 42 44 226 214113MD 44 44 73 122 102 99 100 98 70 228 225 211 165 207 203 192 215 207113RG 100 42 74 150 125 125 125 128 84 226 223 210 123 174 182 152 182 208114MS 53 46 49 48 236 238 196 196114RG 52 44 48 48 235 236 197 197115RG 36 30 213 225115RG 33 210116FS 39 37 39 34 33 259 214 222 220 133116MS 42 55 39 34 33 257 203 222 216 132116NC 31 35 218 216116RG 42 60 39 34 45 260 194 224 222 218116TS 42 54 39 34 43 254 202 234 220 199117RG 26 30 23 33 205 220 193 251117TS 26 30 23 33 203 220 196 248118CA 14 175118CR 15 173118FS 15 175118MS 15 175118RG 14 175
SiteNumber of irrigations Days below refill
Continued on next page

Table Grape Irrigation Benchmarking 2002 - 2011 43
2003 2004 2005 2006 2007 2008 2009 2010 2011 2003 2004 2005 2006 2007 2008 2009 2010 2011118RS 13 176118TS 13 174119CR 44 211119MB 44 212119ME 25 30 210 238119ME 71 69 44 191 206 211119MF 25 30 210 238119MF 70 69 44 193 207 211119RG 32 32 213 238119RG 73 70 45 191 205 211119TS 26 30 211 238120CR 33 35 204 222120CR 73 70 43 179 199 207120MB 43 213120TA 29 28 204 232120TA 72 69 43 186 199 209120TC 29 28 209 232120TC 72 69 43 186 200 209121TS 24 201122CA 35 30 42 45 72 34 190 134 240 221 223 212122CR 35 30 35 45 70 34 190 134 247 223 221 211122MS 35 32 45 52 72 34 190 166 237 214 223 212122RG 44 43 42 54 72 34 183 153 240 214 222 211122TS 44 43 44 54 72 34 197 163 238 216 222 211123AR 86 91 41 217 196 224123CS 76 96 89 90 41 163 227 218 197 224123RG 76 96 90 90 41 166 227 193 194 224123TS 76 96 88 89 41 211 231 214 206 241124CS 15 186124CS 19 64 273 230124ME 12 101124ME 11 66 273 231125CB 27 53 45 228 229 238125CM 21 53 44 236 230 219125GL 21 52 41 236 225 245125GR 21 53 43 235 233 242125MH 21 49 46 236 221 220125MP 21 52 46 236 223 217125OH 27 52 228 232125TO 27 53 41 228 231 250125TS 31 27 49 43 196 228 223 249126CA 84 59 61 266 212 213127AR 43 61 56 25 252 237 223 212127CA 43 61 56 25 252 237 223 212127CR 43 61 56 25 252 237 223 212127FL 64 61 56 25 237 237 222 212127ME 43 61 57 25 253 237 220 212127RG 43 61 55 25 252 237 222 212128AR 100 63 232 229128CR 116 64 189 218128GR 67 62 227 232128GS 67 63 227 232129CS 104 213129FL 107 86 104 222 225 213129SO 102 85 104 213 227 213130SR 41 35 237 258131CS 66 96 229 213131ME 96 211131RG 37 229131RG 70 96 231 213131SS 67 96 230 213131YG 64 228132AR 78 39 221 219132CJ 39 219132CP 79 39 210 219132CR 78 39 210 219132MB 39 219132MS 77 39 214 219132RG 77 39 215 219133CS 33 10 216 244133MS 33 10 214 244134F1 14 247134F2 13 248134M1 14 248134M2 14 248134M3 13 250134M4 14 248
SiteNumber of irrigations Days below refill

44 Table Grape Irrigation Benchmarking 2002 - 2011
2003 2004 2005 2006 2007 2008 2009 2010 2011 2003 2004 2005 2006 2007 2008 2009 2010 2011101CS 261 0.97101MD 99 102 102 104 104 877 263 2.90 4.34 1.43 3.00 4.70 3.92 2.59101RG 102 124 102 102 102 775 261 4.54 4.43 2.74 2.00 2.00 6.55 1.52101TS 99 102 102 104 104 816 261 4.54 5.61 2.74 4.00 0.17 2.32 2.04102CR 61 44 44 1.63 0.40 0.85102FL 50 0.00102M2 42 44 0.97 0.52102M2 44 50 3.06 0.08102M3 42 44 44 50 2.42 2.06 1.56 0.21102MI 50 0.11103CM 92 95 97 102 5.16 5.02 2.86 0.44103CN 97 102 0.66 2.22103FS 92 95 5.02 3.87103MD 92 95 97 102 2.58 5.49 3.51 1.18103RG 92 95 97 102 4.82 4.84 2.80 2.48103TS 92 95 97 102 4.85 4.89 3.43 3.43104FS 253 249 4.94 4.07104FS 150 115 4.57 0.30104H5 249 254 1.77 3.45104H5 150 115 5.03 0.37104MS 274 247 3.42 4.55104MS 150 115 0.78 0.48104RG 250 5.17104RG 152 115 3.38 0.89105FL 99 102 102 104 104 2.04 1.72 1.99 1.07 1.64105MD 99 102 102 104 104 1.58 1.58 1.52 0.81 1.09105RG 99 102 102 104 104 1.37 2.54 1.98 1.48 1.16105TS 99 102 102 104 104 1.37 1.86 1.63 1.00 0.92106CM 99 102 3.26 4.27106CR 99 102 5.05 6.51106MD 99 102 5.05 6.51106RG 99 102 4.79 6.22106TS 99 102 5.05 6.46107CR 102 104 104 3.60 1.94 1.80107FL 99 102 102 104 104 5.48 3.44 3.31 4.60 3.25107MD 99 102 102 104 104 2.72 5.20 3.25 1.89 2.55107RE 99 102 102 104 99 3.65 3.47 2.78 2.47 2.27107RG 99 102 102 104 99 5.48 6.93 3.69 4.03 4.08107TS 102 104 104 2.08 3.12 2.80108MD 10 12 13 13 3.81 3.81 2.10 2.10109CR 90 0.01109FA 90 0.05109RG 2024 1987 89 2.81 1.34 0.00109ZC 2038 1997 90 2.34 0.00110AR 111 115 118 122 102 312 172 2.81 2.29 2.26 1.50 1.61 3.02 1.01110AR 147 109 0.82 6.90110BC 111 116 0.84 2.14110BC 118 122 102 298 172 1.93 1.71 1.82 2.44 0.32110BC 106 109 1.10 1.94110CM 111 116 118 122 102 300 174 1.31 1.98 1.59 1.09 1.45 0.91 0.44110CM 148 109 1.17 0.89110DC 111 116 118 122 102 1.69 1.83 1.47 1.84111RG 80 81 81 81 81 81 84 84 90 5.38 2.49 5.68 3.19 0.76 4.62 1.38 0.00111TS 80 81 81 81 81 81 84 84 90 1.55 2.47 3.34 3.53 0.26 8.72 0.00112CR 13 13 1.59 2.20112RG 13 13 3.53 1.37112TS 13 13 1.10 2.10113MD 10 12 13 13 13 1218 485 257 115 2.53 0.47 1.33 2.95 2.26 4.69 5.19 1.07113RG 10 12 13 13 12 1031 426 236 115 5.18 4.61 4.26 2.59 3.87 5.89 4.37 0.61 1.12114MS 99 102 102 104 4.46 3.93 1.87 1.76114RG 99 102 102 104 3.69 2.97 2.43 1.67115RG 10 12 1.94 4.21115RG 13 0.43116FS 80 81 81 81 81 2.91 2.04 1.58 1.23 2.91116MS 80 81 81 81 81 2.03 1.13 1.18 0.21 2.45116NC 11 11 0.18 1.92116RG 80 81 81 81 81 3.43 2.27 2.23 1.51 2.92116TS 80 81 81 81 81 3.41 1.61 1.84 1.48 2.44117RG 99 102 102 100 3.08 6.98 5.51 4.49117TS 99 102 102 104 2.35 2.32 2.19 2.54118CA 81 3.69118CR 81 1.47118FS 81 1.59118MS 81 1.59118RG 81 3.3
SiteCost of water ($/ML) Crop production per megalitre (t/ML)
Continued on next page

Table Grape Irrigation Benchmarking 2002 - 2011 45
2003 2004 2005 2006 2007 2008 2009 2010 2011 2003 2004 2005 2006 2007 2008 2009 2010 2011118RS 81 1.23118TS 81 4.54119CR 115 1.92119MB 115 0.99119ME 81 531 3.17 2.02119ME 191 198 115 2.78 2.02 4.21119MF 84 531 3.93 1.25119MF 192 197 115 2.63 2.03 2.83119RG 81 502 2.50 2.52119RG 189 197 115 3.38 1.64 5.74119TS 81 531 4.36 1.90120CR 78 459 0.78 2.66120CR 188 190 115 4.98 1.94 5.55120MB 115 2.93120TA 81 454 2.01 2.34120TA 189 188 115 5.14 1.65 4.38120TC 81 547 2.93 2.02120TC 189 193 115 5.23 1.68 5.13121TS 104 3.56122CA 102 102 102 109 789 115 0.75 1.77 0.73 2.71 3.48 3.13122CR 102 102 102 109 563 115 0.86 0.58 3.60 6.42 1.81122MS 102 102 102 109 788 115 0.56 1.79 2.54 6.76 1.07 2.11122RG 102 102 102 109 280 115 0.34 0.55 0.93 3.54 1.22 0.83122TS 102 102 102 109 110 115 1.05 0.73 1.80 2.48 0.85 1.17123AR 339 379 115 2.77 1.37 0.00123CS 102 450 337 381 115 2.04 1.35 2.14 0.76 0.00123RG 102 450 308 377 115 1.02 3.74 6.69 0.30 0.00123TS 102 450 328 379 115 2.29 1.74 3.94 1.67 0.00124CS 79 3.63124CS 794 235 6.25 5.10124ME 79 3.27124ME 2824 84 3.65 3.46125CB 392 313 125 2.13 3.05 2.04125CM 430 313 124 4.44 6.39 2.00125GL 430 307 126 11.22 6.57 1.16125GR 430 307 126 5.34 3.80 1.16125MH 430 308 124 3.11 2.52 0.63125MP 430 306 124 2.53 1.45 0.63125OH 392 314 2.95 1.69125TO 392 315 128 1.29 2.82 1.92125TS 104 392 296 128 0.40 2.42 2.55 1.92126CA 79 87 84 5.54 3.75 2.29127AR 101 106 775 114 3.96 3.03 1.13127CA 102 107 777 115 5.97 6.70 4.33 3.16127CR 102 107 763 115 2.74 2.30 1.63 2.26127FL 101 106 763 114 3.84 9.12 4.99 6.31127ME 102 107 692 115 2.41 2.64 1.09 1.37127RG 102 107 777 115 4.03 5.21 1.47 1.68128AR 349 17 0.93128CR 257 15 3.90 3.58128GR 343 15 5.05 3.34128GS 343 15 5.05 3.34129CS 115 0.15129FL 251 148 115 5.81 3.40 0.47129SO 251 148 115 2.71 1.52 0.15130SR 246 143 4.55 3.72131CS 152 115 0.88 0.38131ME 115 0.19131RG 230 3.30131RG 165 115 0.83 0.37131SS 152 114 4.57 0.23131YG 154 1.18132AR 290 115 1.19 0.29132CJ 115 0.00132CP 293 115 2.11 0.00132CR 297 115 1.05 0.55132MB 115 0.00132MS 294 115 2.78 4.11132RG 297 115 3.60 1.25133CS 107 115 1.19 0.00133MS 107 115 1.92 0.00134F1 50 3.35134F2 50 4.58134M1 50 0.41134M2 50 0134M3 50 0.36134M4 50 1.3
SiteCost of water ($/ML) Crop production per megalitre (t/ML)

46 Table Grape Irrigation Benchmarking 2002 - 2011
2003 2004 2005 2006 2007 2008 2009 2010 2011 2003 2004 2005 2006 2007 2008 2009 2010 2011101CS 2911 284101MD 2905 4343 2008 5995 9865 8222 4662 39 27 80 39 25 227 107101RG 4538 4433 3830 3398 2805 11464 2728 25 31 336 58 57 120 182101TS 4538 1121 3283 6393 311 4175 3268 25 21 42 29 679 357 135102CR 5546 1282 2546 53 174 82102FL 0102M2 3308 1825 69 132102M2 10721 272 23 1021102M3 8222 7216 5061 749 28 34 46 370102MI 452 702103CM 9027 5973 3690 739 20 21 38 259103CN 834 3427 167 52103FS 10045 8465 21 28103MD 5313 9286 5007 2589 39 19 31 97103RG 8770 4838 3541 5813 21 22 39 46103TS 7753 6802 5285 6206 21 22 32 34104FS 10860 9779 54 64104FS 10058 654 35 429104H5 3361 7593 147 77104H5 12071 1107 32 345104MS 5806 9098 84 57104MS 2354 1054 206 266104RG 6720 51104RG 6089 1154 48 143105FL 3258 2752 2983 1819 2632 58 70 58 111 72105MD 2534 2522 2275 1217 1309 74 76 77 146 109105RG 2185 4060 2970 2361 2089 86 47 59 81 102105TS 2185 2973 2439 1593 1472 85 64 71 119 129106CM 5210 6838 33 26106CR 8083 10420 21 17106MD 8083 10420 21 17106RG 7658 9947 23 18106TS 8083 10337 21 17107CR 5044 3007 2515 31 58 63107FL 8771 5502 4962 6905 5198 20 32 33 24 35107MD 4350 8319 4550 2835 4077 39 21 34 59 44107RE 5847 5546 4036 2959 2608 29 32 39 46 47107RG 8771 11092 4433 4431 5606 20 16 30 28 26107TS 2499 4842 4064 53 36 40108MD 6099 6099 2935 2935 8 8 15 16109CR 20 10311109FA 103 2040109RG 5626 671 0 724 1491109ZC 2107 5 876 28129110AR 4494 3657 2712 2681 2087 4188 1719 46 58 60 93 74 109 185110AR 1147 15301 195 18110BC 1180 3002 152 62110BC 2311 2880 3177 10969 656 70 81 65 129 583110BC 2311 3614 108 63110CM 2103 3174 1585 1421 2034 1269 615 97 67 85 127 82 349 429110CM 1635 1249 137 137110DC 2697 2925 1173 2211 76 73 92 75111RG 2388 2848 6816 5751 954 7847 1381 0 20 44 19 34 142 24 80111TS 870 4438 4013 5642 391 9592 0 70 44 32 31 415 13112CR 2220 6114 27 19112RG 4239 3203 12 31112TS 1316 3504 38 20113MD 5562 759 1869 6480 4964 12661 14399 2144 15 84 30 14 18 266 99 136113RG 12442 6455 5364 5700 7744 14730 12144 1578 2247 7 9 9 16 10 180 104 437 102114MS 8910 6288 2248 3172 26 31 65 70114RG 8847 4158 3406 3342 32 40 50 74115RG 3306 2527 12 6115RG 645 59116FS 4949 4077 2930 3272 7555 33 48 61 79 33116MS 4069 1577 2115 418 4651 47 86 83 465 40116NC 451 4228 483 10116RG 6343 2956 3793 4031 5552 28 43 44 64 33116TS 6143 1930 3862 3949 5375 28 60 53 66 40117RG 4933 11160 6618 8982 36 16 20 25117TS 3756 3714 3067 3812 48 49 51 45118CA 5522 22118CR 2577 54.9118FS 2636 50.9118MS 3335 50.9118RG 7596 24.5
SiteCost of water per tonne of fruit ($/t) Gross return per megalitre ($/ML)
Continued on next page

Table Grape Irrigation Benchmarking 2002 - 2011 47
2003 2004 2005 2006 2007 2008 2009 2010 2011 2003 2004 2005 2006 2007 2008 2009 2010 2011118RS 2576 66118TS 7533 18119CR 4233 72119MB 2074 141119ME 4751 4038 34 276119ME 5008 5049 9270 78 109 33119MF 5896 2498 28 447119MF 4730 5069 6232 83 108 49119RG 3004 4084 43 210119RG 6764 2622 10254 64 134 24119TS 5229 3417 25 294120CR 1565 5860 134 182120CR 9702 3888 12205 43 109 25120MB 6149 39120TA 4013 4211 54 206120TA 9249 2804 7452 42 127 26120TC 5858 3634 37 284120TC 9408 2849 10468 41 128 27121TS 4073 33122CA 1252 2362 1056 4207 4039 5907 148 63 152 44 230 40122CR 2402 1715 10248 14324 4254 128 190 31 89 69122MS 1255 3206 3098 13187 537 4533 196 62 44 18 743 59122RG 715 749 1562 7964 1949 1620 328 202 119 33 238 152122TS 2269 1446 504 4461 683 2461 106 153 62 48 140 107123AR 8573 3977 0 123 284123CS 4488 2699 6167 1703 0 55 341 162 518123RG 1428 5790 12579 435 0 109 123 48 1292123TS 2524 3300 7887 2677 0 49 265 86 234124CS 7990 23124CS 11249 11977 129 49124ME 7530 26124ME 9124 5891 778 28125CB 6390 6407 6124 185 103 62125CM 13309 14048 5985 97 49 63125GL 17958 11823 1969 39 47 110125GR 8552 6838 1969 81 81 110125MH 5291 4530 1428 139 123 198125MP 4297 2616 1428 171 212 198125OH 5907 3373 133 187125TO 2587 5068 4028 304 113 68125TS 759 4599 4718 4028 265 163 117 68126CA 7917 6299 4230 17 28 44127AR 10693 8070 3013 30 262 112127CA 8653 10382 5019 5974 19 18 180 36127CR 7819 5530 4337 5311 42 46 477 56127FL 10359 28262 8937 21653 30 13 155 20127ME 2938 5157 543 2945 48 45 648 93127RG 6785 14078 2356 3290 29 23 536 76128AR 2847 28128CR 10918 12024 68 7128GR 12167 7265 70 7128GS 12167 7265 70 7129CS 295 857129FL 12780 8165 1026 43 47 271129SO 4881 2427 291 93 105 866130SR 9097 7444 56 41131CS 2471 769 187 333131ME 285 674131RG 3633 76131RG 1492 477 203 349131SS 8224 396 36 548131YG 2115 142132AR 4034 720 254 457132CJ 0132CP 6325 0 145132CR 3302 1193 296 241132MB 0132MS 7237 8264 106 32132RG 6669 2303 86 105133CS 2135 0 96133MS 4121 0 63134F1 11914 12134F2 16262 9134M1 725 98134M2 0134M3 625 114134M4 2282 31.1
Gross return per megalitre ($/ML) Site
Cost of water per tonne of fruit ($/t)

48 Table Grape Irrigation Benchmarking 2002 - 2011
2003 2004 2005 2006 2007 2008 2009 2010 2011 2003 2004 2005 2006 2007 2008 2009 2010 2011101CS 11 61101MD 26 38 18 51 84 9 17 93 94 86 76 70 79 63101RG 39 32 4 30 24 15 10 94 92 86 76 77 76 61101TS 40 10 29 54 3 5 12 93 96 87 78 77 79 61102CR 64 18 36 82 57 52102FL 0 81102M2 50 27 62 66102M2 151 3 78 83102M3 120 102 71 10 76 77 74 83102MI 6 83103CM 88 56 34 6 90 98 82 84103CN 8 30 82 84103FS 97 80 89 99103MD 52 89 46 23 89 95 82 84103RG 86 46 32 51 89 93 82 84103TS 76 63 48 54 89 95 82 84104FS 41 37 71 91104FS 62 5 90 80104H5 13 29 71 94104H5 75 9 89 85104MS 20 35 70 92104MS 15 8 90 80104RG 26 93104RG 37 9 94 80105FL 28 23 26 15 22 70 65 60 43 49105MD 22 21 20 10 11 70 64 60 41 43105RG 19 34 26 20 18 70 64 59 41 37105TS 19 25 21 13 12 70 63 60 42 43106CM 48 62 65 80106CR 75 94 84 93106MD 75 94 84 93106RG 71 90 85 94106TS 75 93 84 93107CR 46 27 22 76 78 87107FL 82 50 45 62 46 82 93 74 79 89107MD 41 76 42 25 36 82 93 74 79 89107RE 55 50 37 26 24 82 93 74 79 89107RG 82 101 40 40 52 82 93 74 79 89107TS 23 43 36 74 78 90108MD 207 191 91 90 76 57 60 56109CR 0 83109FA 1 83109RG 3 0 0 85 96 83109ZC 1 0 85 96 83110AR 35 28 20 19 18 13 9 75 67 64 51 52 87 46110AR 7 125 76 94110BC 9 23 86 82110BC 17 21 27 35 4 69 55 52 82 46110BC 20 30 79 88110CM 17 24 12 10 17 4 3 74 66 75 83 51 81 48110CM 10 10 78 92110DC 21 22 9 16 77 69 72 79 52111RG 22 26 63 53 9 72 13 0 97 83 99 100 94 94 99 96 100111TS 8 41 37 52 4 87 0 95 73 83 88 76 92 99 92 100112CR 53 144 66 68112RG 101 75 84 91112TS 31 82 84 93113MD 149 19 47 160 122 10 28 15 68 79 85 81 90 77 74 89 90113RG 332 162 134 140 198 14 27 6 20 70 77 77 78 81 66 66 80 93114MS 76 52 19 26 79 93 49 47114RG 76 35 28 27 79 90 52 49115RG 145 100 74 82115RG 25 76116FS 52 42 30 34 78 95 80 60 59 65116MS 42 16 22 4 48 95 75 60 58 65116NC 5 219 52 64116RG 66 30 39 42 57 94 65 62 60 68116TS 64 20 40 41 55 86 71 60 59 70117RG 44 97 59 81 92 97 96 86117TS 34 32 27 33 91 96 96 48118CA 68 83118CR 31.9 74118FS 32.6 70118MS 41.3 70118RG 94 83
SiteGross return per $ water input Application efficiency (%)
Continued on next page

Table Grape Irrigation Benchmarking 2002 - 2011 49
2003 2004 2005 2006 2007 2008 2009 2010 2011 2003 2004 2005 2006 2007 2008 2009 2010 2011118RS 32 72118TS 93 70119CR 31 91119MB 15 92119ME 44 7 67 93119ME 23 23 67 71 84 91119MF 53 5 67 93119MF 22 23 45 71 83 91119RG 28 8 79 93119RG 31 12 74 70 83 93119TS 49 6 74 93120CR 15 12 67 85120CR 45 18 88 67 80 89120MB 53 92120TA 37 9 63 89120TA 43 13 65 68 80 89120TC 54 6 59 89120TC 44 13 75 68 81 89121TS 34 83122CA 11 21 10 36 5 47 82 74 83 83 83 76122CR 22 16 92 25 34 82 74 85 85 92 75122MS 11 29 28 112 1 36 82 74 78 78 83 76122RG 6 7 14 67 7 13 75 69 83 75 83 75122TS 21 13 5 38 6 20 84 79 78 79 82 75123AR 25 10 0 95 89 98123CS 40 6 18 4 0 76 93 94 89 98123RG 13 13 40 1 0 77 93 83 89 98123TS 23 7 23 7 0 80 95 96 92 98124CS 96 94124CS 14 48 95 95124ME 90 88124ME 3 61 92 92125CB 16 20 49 78 77 71125CM 31 45 48 80 81 74125GL 42 38 15 80 79 71125GR 20 22 15 81 81 71125MH 12 15 11 80 85 74125MP 10 9 11 80 82 70125OH 15 11 78 83125TO 7 16 31 78 82 69125TS 7 12 16 31 86 78 84 67126CA 82 61 42 94 91 88127AR 90 10 24 86 98 92 66127CA 75 88 7 52 86 97 92 66127CR 68 52 6 42 86 97 92 66127FL 91 241 12 172 93 97 91 66127ME 26 44 1 23 86 97 95 66127RG 59 119 3 26 86 97 92 66128AR 111 98 92128CR 41 508 86 90128GR 35 307 94 95128GS 35 307 94 95129CS 2 83129FL 51 51 8 89 88 83129SO 20 15 2 91 88 83130SR 36 49 89 97131CS 15 6 91 87131ME 2 87131RG 15 81131RG 9 4 92 87131SS 50 3 91 87131YG 13 90132AR 13 6 91 92132CJ 0 92132CP 21 0 90 92132CR 10.6 9.1 92 92132MB 0 92132MS 24.6 62.8 91 92132RG 21.5 17.5 92 92133CS 18.7 0 60 71133MS 33.9 0 59 71134F1 294 62134F2 401 55134M1 17.9 63134M2 0 60134M3 15.4 64134M4 56.4 66
Gross return per $ water input Application efficiency (%) Site

50 Table Grape Irrigation Benchmarking 2002 - 2011
2003 2004 2005 2006 2007 2008 2009 2010 2011 2003 2004 2005 2006 2007 2008 2009 2010 2011101CS 2.5 109.6101MD 39.3 73.2 10.5 12.5 15.9 18.3 7.0 2.9 1.6 11.0 9.4 7.4 48.7 39.7101RG 73.4 56.5 19.9 8.3 8.5 27.4 3.9 1.6 2.4 46.1 13.8 13.5 28.8 70.2101TS 68.1 135.8 20.5 17.9 0.8 11.2 5.3 1.7 0.8 5.6 6.6 156.4 74.3 52.1102CR 9.0 0.9 1.8 9.6 74.7 39.6102FL 0.0102M2 2.6 1.5 25.9 45.2102M2 13.7 0.5 5.2 173.1102M3 10.0 9.1 5.9 1.3 6.8 7.8 12.0 61.9102MI 0.7 122.3103CM 51.9 294.8 15.9 2.7 2.0 0.4 6.9 42.5103CN 3.7 13.5 30.1 8.5103FS 47.6 262.2 2.2 0.4103MD 24.5 117.3 19.5 7.2 4.2 0.9 5.6 15.9103RG 45.7 68.4 15.6 15.1 2.2 1.5 7.1 7.6103TS 45.9 104.5 19.0 20.9 2.2 1.0 5.8 5.5104FS 16.8 47.1 15.8 5.5104FS 46.7 1.5 3.5 86.8104H5 6.0 58.7 43.5 4.5104H5 44.0 2.4 3.7 52.6104MS 11.5 54.7 24.9 4.7104MS 7.6 2.4 21.2 53.6104RG 71.2 3.7104RG 56.3 4.5 2.9 28.0105FL 6.9 4.9 5.0 1.9 3.2 17.1 24.7 23.2 63.4 36.8105MD 5.3 4.4 3.8 1.4 1.9 22.2 27.2 30.8 86.0 62.2105RG 4.6 7.0 4.9 2.5 1.8 25.8 17.1 24.0 47.2 64.6105TS 4.6 5.0 4.1 1.7 1.6 25.4 23.7 28.4 68.8 73.5106CM 9.2 21.1 11.8 5.3106CR 31.6 100.1 3.4 1.1106MD 31.6 100.1 3.4 1.1106RG 31.6 100.1 3.4 1.1106TS 31.6 99.3 3.4 1.1107CR 14.9 8.9 13.8 7.4 12.7 8.1107FL 30.2 49.4 12.9 21.6 30.6 3.5 2.2 8.5 5.2 3.7107MD 14.7 71.3 12.6 8.9 24.0 7.3 1.5 8.7 12.6 4.7107RE 19.8 47.5 10.6 11.6 21.3 5.4 2.3 10.4 9.7 5.0107RG 30.2 99.7 14.5 18.9 38.4 3.5 1.1 7.6 5.9 2.8107TS 8.1 14.3 27.2 13.5 7.9 4.1108MD 15.8 9.0 5.2 4.8 1.9 3.6 6.2 6.8109CR 0.1 1728109FA 0.3 341.9109RG 19.2 36.5 0.0 106.0 54.8109ZC 16.1 0.0 127.4 4724110AR 11.4 6.9 6.3 3.1 3.3 22.9 1.9 11.2 19.2 21.4 45.1 35.7 14.4 99.4110AR 3.4 112.6 46.6 1.1110BC 6.0 11.9 21.3 11.1110BC 6.2 3.8 3.8 13.8 0.6 21.8 36.8 31.3 22.9 313.7110BC 5.3 16.3 22.3 7.5110CM 5.1 5.9 6.2 6.3 3.0 4.7 0.8 25.0 22.4 21.6 21.9 39.7 67.9 223.2110CM 5.4 10.8 29.8 11.4110DC 7.3 5.9 5.2 8.9 17.6 22.5 26.0 15.6111RG 181.8 14.6 426.6 12.8 316.0 38.0 0.6 7.5 0.3 0.0 8.4 0.3 2.9111TS 32.5 9.0 20.2 30.0 1.1 643.4 3.3 12.1 5.4 3.6 98.2 0.2112CR 4.6 6.9 9.1 6.2112RG 21.8 15.0 1.9 2.8112TS 6.9 28.4 6.1 1.5113MD 8.0 2.3 9.0 15.2 22.8 20.5 20.1 10.3 4.7 17.6 4.4 2.7 1.8 60.7 25.6 14.1113RG 17.1 19.9 18.7 12.0 20.1 17.2 12.8 3.1 15.6 2.2 2.0 2.1 3.4 1.9 61.4 35.6 86.3 7.4114MS 21.4 57.4 3.7 3.3 5.5 2.1 32.9 37.5114RG 17.9 30.3 5.1 3.3 6.5 4.0 23.8 37.3115RG 7.5 22.8 3.0 1.1115RG 1.8 14.2116FS 54.3 10.2 4.0 3.0 8.4 1.8 9.5 24.3 32.2 11.6116MS 42.3 4.5 3.0 0.5 7.1 2.3 21.6 32.8 194.4 13.8116NC 0.4 5.4 31.3 3.6116RG 57.1 6.5 5.9 3.8 9.2 1.7 15.0 16.3 25.6 10.6116TS 25.0 5.5 4.6 3.7 8.1 3.8 17.8 21.0 26.6 12.0117RG 39.9 239.0 130.0 31.2 2.8 0.5 0.9 3.5117TS 26.7 57.1 51.6 4.9 4.2 2.0 2.2 23.3118CA 22.0 3.7118CR 5.67 14.2118FS 5.23 15.4118MS 5.27 15.3118RG 18.9 4.3
SiteCost of drainage per tonne of fruit ($/t) Yield per volume of drainage (t/ML)
Continued on next page

Table Grape Irrigation Benchmarking 2002 - 2011 51
2003 2004 2005 2006 2007 2008 2009 2010 2011 2003 2004 2005 2006 2007 2008 2009 2010 2011118RS 4.4 18.4118TS 15.2 5.3119CR 22.4 6.2119MB 11.8 11.7119ME 9.6 27.8 11.2 20.1119ME 9.5 12.5 49.1 23.0 17.7 2.8119MF 11.9 17.2 9.3 32.4119MF 9.1 11.9 32.7 24.1 18.4 4.3119RG 11.8 37.3 9.2 14.2119RG 11.1 9.7 77.8 19.4 22.6 1.8119TS 16.8 26.2 6.4 21.3120CR 2.4 17.3 43.9 28.1120CR 15.3 9.9 49.8 14.0 21.5 2.8120MB 34.6 3.3120TA 5.4 20.4 19.9 23.6120TA 16.1 8.2 41.3 13.4 25.6 2.8120TC 7.2 17.6 15.0 32.6120TC 16.3 8.9 48.3 13.2 24.1 2.9121TS 20.8 5.7122CA 4 6.9 4.2 15.7 20.2 13.0 26.1 16.1 26.2 7.5 39.6 9.6122CR 4.9 2.3 23.9 81.1 7.4 22.6 48.9 4.6 7.1 17.0122MS 3.2 6.9 11.3 31.1 6.2 9.0 34.7 16.1 9.8 3.8 128.0 14.0122RG 1.4 1.8 5.4 14.4 7.3 3.4 81.6 62.0 20.5 8.2 39.5 37.3122TS 6.6 3.5 8.2 11.7 4.8 4.8 16.7 31.8 13.5 10.1 24.8 26.3123AR 52.4 12.3 0.0 6.5 31.7123CS 8.6 18.7 36.4 7.0 0.0 12.9 24.6 9.5 55.9123RG 4.4 51.8 40.0 2.8 0.0 25.1 8.9 8.0 137.9123TS 11.6 33.4 94.1 20.6 0.0 9.6 13.8 3.6 19.0124CS 59.8 1.4124CS 136.6 101.4 5.9 2.4124ME 27.1 3.1124ME 44.3 41.9 64.0 2.3125CB 9.8 13.1 7.1 40.2 23.9 17.7125CM 22.6 32.8 7.8 19.1 9.6 16.2125GL 57.3 32.0 4.0 7.5 9.7 32.1125GR 28.5 20.5 4.1 15.2 15.0 31.6125MH 15.9 17.3 2.5 27.2 18.0 51.3125MP 12.9 8.3 2.1 33.5 37.1 60.1125OH 13.6 10.2 29.0 31.1125TO 5.9 15.3 6.2 66.2 20.7 21.0125TS 2.9 11.1 15.6 5.8 36.9 35.4 19.1 22.5126CA 98.1 40.8 18.8 1.0 2.5 5.4127AR 172.2 39.8 3.4 0.7 19.8 37.6127CA 43.1 265.9 57.3 9.4 2.7 0.4 13.6 12.2127CR 19.8 91.5 19.6 6.7 5.8 1.2 39.6 19.0127FL 58.7 361.8 58.6 18.8 1.9 0.3 13.2 6.7127ME 17.6 105.0 20.0 4.1 6.5 1.1 35.2 31.2127RG 29.1 206.9 18.4 5.0 4.0 0.6 42.8 25.5128AR 11.3 2.3128CR 28.0 37.4 9.5 0.6128GR 89.6 67.1 3.9 0.4128GS 89.6 67.1 3.9 0.4129CS 0.9 146.0129FL 54.9 27.8 2.7 4.6 5.7 47.3129SO 31.6 13.1 0.8 7.9 12.2 151.0130SR 43.0 125.6 5.9 1.2131CS 9.4 3.0 17.5 43.0131ME 1.5 85.3131RG 17.5 14.3131RG 10.1 2.9 17.6 45.0131SS 48.6 1.8 3.4 70.6131YG 11.6 14.4132AR 12.8 3.6 23.7 36.8132CJ 0.0132CP 21.5 0.0 14.2132CR 12.7 6.8 24.6 19.4132MB 0.0132MS 32.0 51.1 9.2 2.6132RG 44.0 15.6 7.1 8.4133CS 3.0 0.0 38.7133MS 4.7 0.0 25.8134F1 8.8 4.6134F2 10.1 4.0134M1 1.11 36.3134M2 0134M3 1 40.5134M4 3.87 10.5
Yield per volume of drainage (t/ML) Site
Cost of drainage per tonne of fruit ($/t)

52 Table Grape Irrigation Benchmarking 2002 - 2011
D. Interpretation of box plots
A box plot is an excellent tool for illustrating the distribution and location of performance indicators for the sites under study. It is
very efficient and useful for identifying outliers and for comparing distributions. The figure below describes the different components
of a box plot regularly used throughout this report.
Water
applied
(Ml/ha)
Site Index Site
Water
applied
(Ml/ha)
- - 26 110BC-Cr 9.2
- - 25 110CM-Me 9.2
- - 24 102M2-Me 8.8
15.6 110AR-RG 23 110AR-RG 8.6
15.6 110BC-Cr 22 120CR-Cr 8.2
15.2 110CM-Me 21 119RG-RG 7.3
13.3 102M2-Me 20 119ME-Me 6.8
9.1 125TS-Th 19 119TS-Th 6.8
9.1 131RG-RG 18 119MF-Me 6.8
8.6 125MP-Me 17 120TA-Th 6.6
8.6 125GL-RG 16 120TC-Th 6.6
8.6 125GR-RG 15 104MS-Me 6.5
8.5 125MH-Me 14 104FS-Fl 6.5
8.3 125CB-Cr 13 104H5-Su 6.5
8.3 125CM-Cr 12 125CB-Cr 6.0
8.3 125OH-Oh 11 125TS-Th 6.0
8.2 125TO-Th 10 125TO-Th 6.0
8.1 130SR-Su 9 125OH-Oh 6.0
8.1 104MS-Me 8 101RG-RG 5.6
7.9 104RG-RG 7 125GL-RG 5.3
7.9 104FS-Fl 6 125CM-Cr 5.3
7.6 104H5-Su 5 125GR-RG 5.3
7.3 101TS-Th 4 125MH-Me 5.3
7.3 101RG-RG 3 125MP-Me 5.3
7.3 101CS-Cr 2 101TS-Th 5.3
7.2 101MD-Me 1 101MD-Me 4.9
Low level
irrigation (2009)
Low level
irrigation (2008)
46
81
01
21
41
6
46
81
01
21
41
6
75th percentile25% of sites have applied more water
and 75% of sites have applied less water than this value
50th percentile (Median)50% of sites have applied more water than this value
IR
25th percentile75% of sites have applied more water
and 25% of sites have applied less water than this value
MaximumGreatest value excluding any outlier
MinimumLowest value excluding any outlier
OutliersValues at a distance greater than
1½ IR from 75th percentile
IR: Inter-quartile range, i.e. 75th percentile - 25th percentile.


ISBN 978-1-74264-684-8 (print)
ISBN 978-1-74264-685-5 (online)