table of content - amazon s3wave+dna/... · chapter #2 - trend welcome to chapter #2 trend, in this...
TRANSCRIPT


Table of Content
Chapter #1 - Main Idea & Goal of the Ultimate Trader
Chapter #2 - Trend
Chapter #3 - Patterns
Chapter #4 - Indicators
Chapter #5 Risk
Chapter #6 - Ultimate Trader

Chapter #1 - Main Idea & Goal of the Ultimate Trader
Welcome to the first chapter of the Ultimate Trader Strategy. In this chapter, you are
going to learn how our strategy really works and the key steps that you need to
follow if you want to become a successful forex day trader.
What Is Ultimate Trader Really?
Ultimate Trader is a simple, yet effective day trading strategy, that was developed
based on the Elliott Wave Theory. I have tried to make it as simple as possible, you
just need to follow few rules and that’s all! I can bet you right now that you are going
to make money with this strategy every single day if you learn how to be a
disciplined trader.
What Is The Core Of the Ultimate Trader Strategy?
After trading for many years, I figured out that there are only 4 really important steps
required to make money in this game… First, I want you to check the picture below.
Our core strategy is going to be based around Trend Following, Trading the “Right”
Patterns, Use few Indicators & strict Risk Management.
Since you now know the basics concept of the strategy, let’s move the next chapter
where we are going to cover the first thing: “Trend”.

Chapter #2 - Trend
Welcome to Chapter #2 Trend, in this chapter we are going to talk about why trend is
important in the forex world, and how you can easily identify a trend in less than 5
seconds!
Trend Is Your Friend?
I know that you already heard me saying “Trend Is Your Friend”, but I’m going to
keep repeating this until it’s ingrained in your memory so deep that if I wake you in
the middle of night and ask “What’s the trader's best friend?” I want you to say
“Trend!”
Everyone thinks that you can pick up the tops and the bottoms of currency pair
every single day, but that’s just not possible! The main reason is because trends
don’t disappear overnight. For one cycle to complete in the market can take a lot of
time. You only need to learn two types of the trends: Bullish and Bearish.
Upwards / Bullish Trend
Uptrend appears on the market when investors are optimistic about some currency
and think that the currency will be stronger against the other currencies. An easy
way to identify an uptrend is to use trend line tools (every single platform has one)
and all you will to do is connect two or more higher lows on the chart. The Trend line
that you draw will be a good support and you will usually see new buyers stepping in
every time the trend line is tested.
On the chart above, we can see price movements of the USDCAD pair, that’s trading
in a simple upward trend. The yellow line represents a potential support point. While
the price remains above the trend line, we can watch for new buying opportunities.

Downwards / Bearish Trend
The Downward Trend appears on the market when investors are pessimistic about
some currency and they think that currency will be weaker against the other currency
pair. We are going to use the same trend line tool to identify a bearish trend, just in
this case, we will draw a trendline through two or more lower highs.
Chart above shows the price movements of the EURUSD pair, that’s trading in a
downward trend. The yellow line represents a potential resistance point. While the
price remains above the trend line, we can watch for new selling opportunities.
Just a quick tip: The best way to identify a trend of any pair in the world is to open a
clean chart on higher time frames like 4h – 1d.
Also keep in mind: “If you can’t recognize the trend standing 2m away from your
screen you are probably wrong”!
In this chapter, you learned how to identify a bullish or bearish trend, this is one of
the key things that you are going to need to master before you start making money
trading forex, so I suggest you to stop reading this ebook for 1h, open all instruments
you have with your broker and try to practice spotting trends! Once you think you’ve
got it, move to the next chapter.

Chapter #3 - Patterns
In this chapter, I’ll show you all technical patterns that you need to master, so we can
continue building your trading strategy.
What’s Patterns?
Patterns are one of the most commonly used techniques that technical analysts use.
Patterns, in reality, are just the graphical representation on a chart, and we (technical
analysts) are trying to spot this systematic movement on the chart that will help us
predict future movements. Of course, like any other tool in trading, patterns are not
perfect, but since we can identify them in real time, this gives us a clue where the
market is going next.
Three Patterns That We Need To Learn?
There are a lot of chart patterns that you already know, like head & shoulders,
double top, wedges etc… it’s nice and handy to know them , (check recordings of our
session if you are not familiar with basic patterns) but right now, I want us to focus
only on one pattern: Triangle.
Triangles made me the most money in the last 6 years, so I want to build a trading
strategy just based on them. One very smart trader told me a long time ago, “If you
find what’s working, just stick to that!”
First off all, you need to understand that there are a few variations of the triangle
pattern, and I choose only #3 triangles for our strategy. To make everything a little
more clear, let’s call our patterns T1 T2 T3. Let’s dive into these 3 patterns right
away.
T1 Trading Pattern.
The first pattern is called T1. Please understand that I really love triangles that have
five legs, so T1 is going to be a simple five legs pattern. Every leg of T1 is shorter
than the previous one. For trading, breakout in a direction of the larger trend is going
to be the key. On the picture below, you can see how T1 pattern should look like.
T1 Pattern Rules
Every pattern needs to have rules that we need to respect so I
want you to follow this rules every single time or forget trading.
- Rule #1 - Leg #3 Must End Above Ending Point Of Leg #1
- Rule #2 - Leg 4 Must End Below Ending Point Of Leg #2
- Rule #3 - Leg #5 Must End Above Ending Point Of Leg #3

T1 Trading Pattern Example
The chart above shows price movements of the $EURNZD pair on the 1h. We can
see slight upwards movements first, after that we have consolidation and if you look
at this consolidation really close you can see a five legs. When we draw a trend line
between legs 1-3-5 and 2-4, we have a perfect triangle where each leg is shorter
than previous. After a breakout, we can see that price continued to trade in a
direction of the previous trend move (in this case up).
How To Trade T1?
Learning to trade T1 triangle pattern is relatively easy. First of all, you need to spot
the triangle on the chart. Check if you have five legs and pull your trend line tool,
draw it from the ending point of the 2nd leg through the ending point of 4th leg. Now,
use this trend line as your entry point. For target #1 you are going to use inverse
161.8% of the 1st leg (use Fibonacci retracement tool for this) and for target #2 you
are going to go and use the inverse 200% of the 1st leg. For stop loss, you have two
options to choose: 1st (favorite) use the ending point of final 5th leg, or you can put
stop loss at the ending of 3rd leg (since you know that if 5th leg breaks below 3rd leg
it’s not allowed according to rules).
If this looks clear enough, let’s move to the second pattern from our group T2.
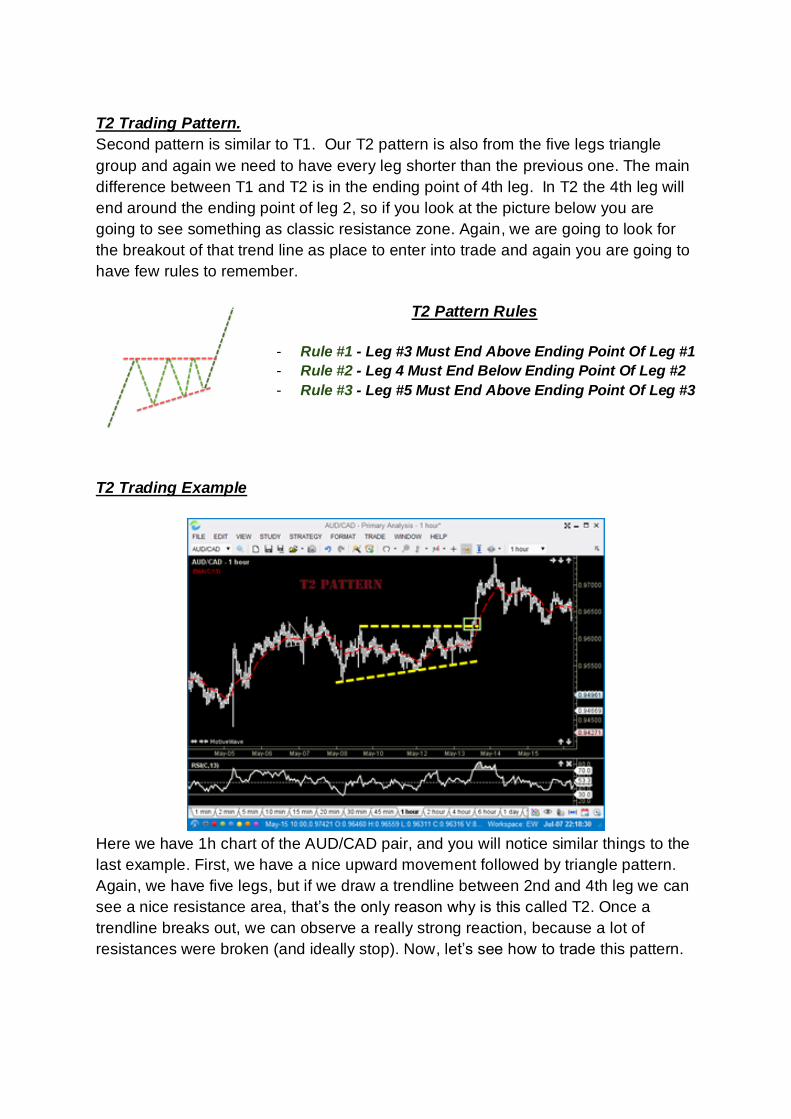
T2 Trading Pattern.
Second pattern is similar to T1. Our T2 pattern is also from the five legs triangle
group and again we need to have every leg shorter than the previous one. The main
difference between T1 and T2 is in the ending point of 4th leg. In T2 the 4th leg will
end around the ending point of leg 2, so if you look at the picture below you are
going to see something as classic resistance zone. Again, we are going to look for
the breakout of that trend line as place to enter into trade and again you are going to
have few rules to remember.
T2 Pattern Rules
- Rule #1 - Leg #3 Must End Above Ending Point Of Leg #1
- Rule #2 - Leg 4 Must End Below Ending Point Of Leg #2
- Rule #3 - Leg #5 Must End Above Ending Point Of Leg #3
T2 Trading Example
Here we have 1h chart of the AUD/CAD pair, and you will notice similar things to the
last example. First, we have a nice upward movement followed by triangle pattern.
Again, we have five legs, but if we draw a trendline between 2nd and 4th leg we can
see a nice resistance area, that’s the only reason why is this called T2. Once a
trendline breaks out, we can observe a really strong reaction, because a lot of
resistances were broken (and ideally stop). Now, let’s see how to trade this pattern.
How To Trade T2?
Trading style between T2 and T1 is more-less the same, so again, once you find the
T2 triangle on the chart, we are going to go and connect the ending points of the 2nd
and 4th leg with trend line tool. For entry point, go and look for the breakout (but
don’t forget to check if all rules are still holding. Target #1 is going to be the inverse
161.8% of 1st leg and for Target #2 we are going to use the inverse 200% of 1st leg.
Stop Loss for T2 is going to be only the ending point of 5th leg (in this case end of
3rd leg won’t give us any risk/reward, so forget that).
Now it’s time to learn the final T3 pattern.
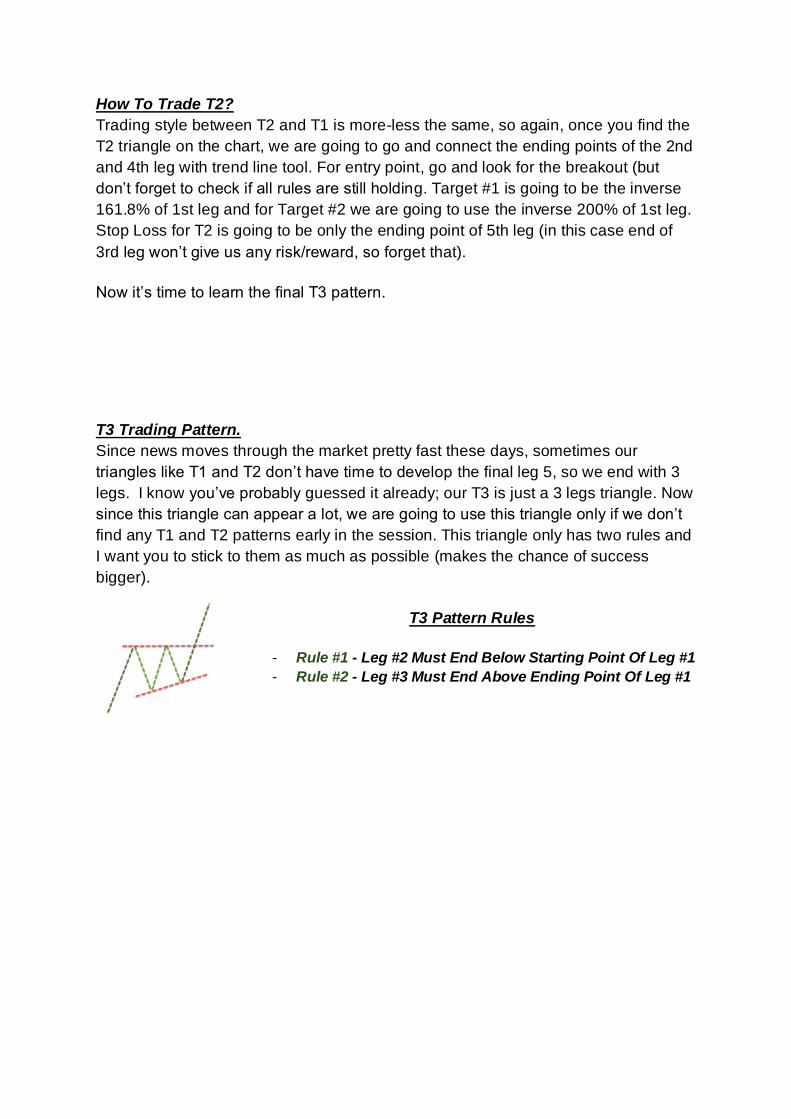
T3 Trading Pattern.
Since news moves through the market pretty fast these days, sometimes our
triangles like T1 and T2 don’t have time to develop the final leg 5, so we end with 3
legs. I know you’ve probably guessed it already; our T3 is just a 3 legs triangle. Now
since this triangle can appear a lot, we are going to use this triangle only if we don’t
find any T1 and T2 patterns early in the session. This triangle only has two rules and
I want you to stick to them as much as possible (makes the chance of success
bigger).
T3 Pattern Rules
- Rule #1 - Leg #2 Must End Below Starting Point Of Leg #1
- Rule #2 - Leg #3 Must End Above Ending Point Of Leg #1

T3 Trading Example
The picture above shows the 4h chart of the AUDUSD pair. I’ve picked up this
example on purpose, and more so because we have not one, but two patterns that
you are going to watch for trading. The first pattern appears after a nice upward
movement, but if we check this smaller triangle we can see only three legs inside,
breakout moved us higher and after that we have a five leg triangle, that is T1, after
a breakout of T1 we have another spike higher.
How To Trade T3?
The final T3 triangle is going to be easy to trade because there are only few different
things to keep in mind if we compare it to trading T1 or T2. For entry point, you are
going to look for a breakout of the trend line that you are going to draw from the
starting point of 1st leg through the ending point of 2nd leg. For target #1 we are
going to use the inverse 123.6% of the 1st leg and for the target #2 we are going to
use inverse 161.8%. Stop loss in this case is logically going to be at the ending point
of the final T3 leg, so put the stop loss at the end of 3rd leg. Don’t forget that you
should trade T3 only if T1 and T2 patterns don’t appear early in the session.
Most Important Thing About Patterns?
You need to understand one thing completely, there is no 100% winning pattern, so
stick to the rules and you will have a good chance to make money… Also keep in
mind that our triangles (T1, T2, T3) also appear on the bearish market, everything is
same just flip the images down …

Chapter #4 - Indicators
In Chapter #4 we are going to talk about two indicators that you are going to use
every day until the end of your trading carrier!
What's Indicator?
Indicators are one of the most commonly used tools by technical analysts. To make
it as simple as possible, indicator is a mathematical calculation based on price
movements or volume of the currency pair. So similar to patterns, this is just pure
mathematics where you are trying to predict a future based on the price movements
from the past. The most commonly used indicators are: Moving Average, Relative
Strength Index, MACD, Stochastic etc… Because I like to keep my charts as clean
as possible, we are only going to use MA & RSI inside our strategy.
Moving Averages?
Moving Average smoothes the collected price data from a given instrument and
forms a line on the chart that traders call a trend following indicator. The important
thing to understand is that MA really does not predict the future price direction. MA’s
main job is to define the current trend direction with a little bit of a lag, of course this
lag is more than normal, we are using data from history and plotting them on the
chart. Two of the most popular versions of the MA indicators are EMA (Exponential
Moving Average) and SMA (Simple Moving Average). You can look at the chart
below how SMA and EMA looks like.
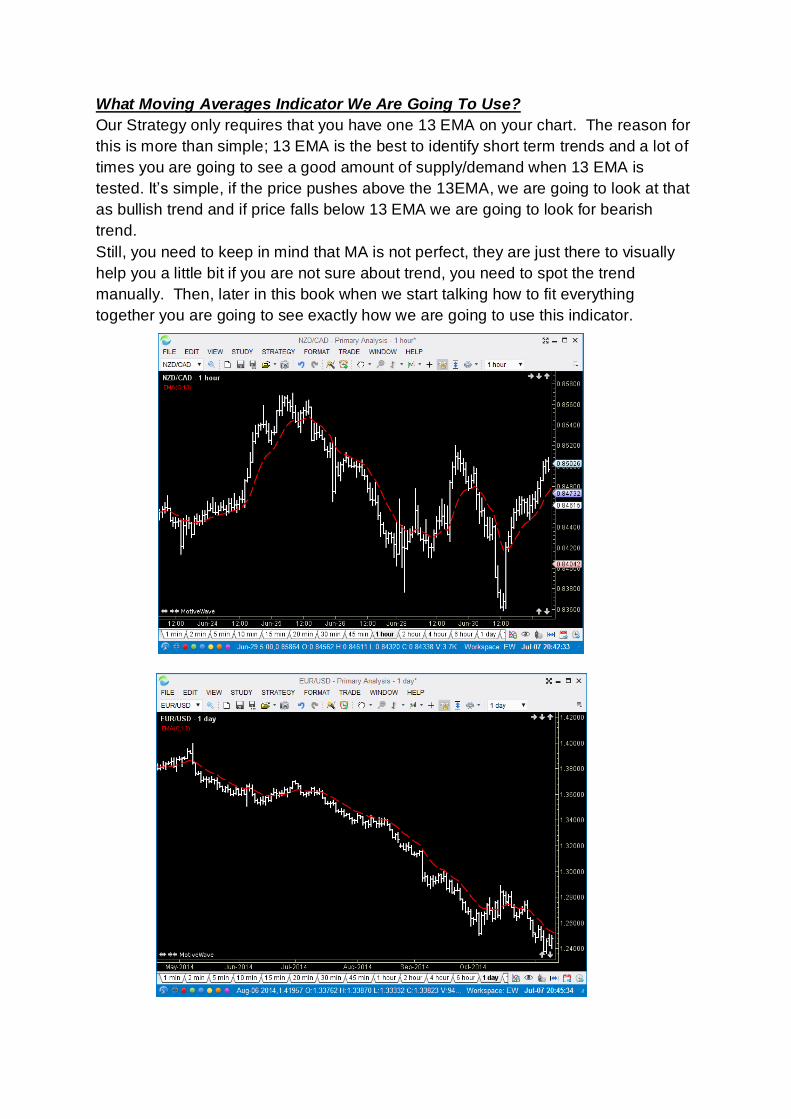
What Moving Averages Indicator We Are Going To Use?
Our Strategy only requires that you have one 13 EMA on your chart. The reason for
this is more than simple; 13 EMA is the best to identify short term trends and a lot of
times you are going to see a good amount of supply/demand when 13 EMA is
tested. It’s simple, if the price pushes above the 13EMA, we are going to look at that
as bullish trend and if price falls below 13 EMA we are going to look for bearish
trend.
Still, you need to keep in mind that MA is not perfect, they are just there to visually
help you a little bit if you are not sure about trend, you need to spot the trend
manually. Then, later in this book when we start talking how to fit everything
together you are going to see exactly how we are going to use this indicator.

RSI?
Relative Strength Index or often called in shorter version RSI indicator is one of the
basic indicators that most of trader is using every day. RSI is an oscillator that
identifies oversold and overbought conditions and like many oscillators, RSI scales
from 0 to 100. If price goes below 30 we say that the market is oversold and if the
price goes above 70, we called that market is overbought.
What Are We Looking for in an RSI Exactly.
First of all, I want you to forget that if RSI goes to 70 you go and sell, it’s not going to
work that way. RSI is a really nice indicator for watching for divergence, which tells
us one thing “Good Chance That Market Will Change Trend Soon!”….
On the chart above we can see USDCAD first pushing higher from Feb-Apr while the
RSI indicator is pushing down. We connected with trend line on RSI high with lower
high and on the chart high and higher high, this is the indication that market will push
down (that’s what happened right?) Now, after a spike down until May, we have Low
and Lower Low on chart and we have Low and higher Low on RSI, that’s an
indication that market should push up soon.

Conclusion About RSI
Relative Strength Index (RSI) is one of the great indicators because we can use it on
any currency pair and on any timeframe. Keep practicing a divergence and you
should be able to spot great trading setups in the next few days. Remember
,divergence won’t always give you trend changes, that’s on market to decide, but you
watching for divergence can be helpful while you are in trade for example, because
you will have your warning to get out of the position. I will talk more about that in
next chapter.
Most Commonly Mistakes?
I see it every day, a lot of people just throw indicators on the chart. Traders usually
have 4-6 indicators on chart, but they don’t get one thing: they are all analyzing
prices, so you are watching 4-6 things that will tell you the same thing. Don’t make
that mistake!
This Chapter was about Indicators, which will help you a lot while your trade is filled.
You will use them to scale out of position on time, or to be sure that it’s time to move
stop to break even etc.
Let's now move to next chapter Risk Management.

Chapter #5 Risk
In Chapter #5 we are going to talk about Risk Management & Discipline, it’s easy to
find patterns, find divergence and enter a trade, the hard part is to pick up the right
risk setup and to be a discipline trader.
Why Is Risk So Important?
Almost all traders lose their first account, sometimes they even lose the second and
third. If you check your statement from your first account that you blew up, you’ll
notice that you probably used more risk than you should be using, that some trades
didn’t have a stop loss and that you traded every pair you could get your hands on.
So, I want to show you guys how to use risk management the right way and help you
to never below your account again.
The table above shows how much capital you need to earn back, just to recover from
the losing trade. Let’s say for example if you lose 30% on your trade, you will need to
make 42.85% just to get to break even, and if you lose 50% you need to make 100%
just to break even… I know a lot of people say they can make 100% easy, but that’s
just bull. When your account is down, your mind is focused on that loss, I know that
best because when my first account was down 40% all day long I was talking about
that 40% loss and that didn’t allow me to open a new trade. So, you need to keep
your risk in the normal range so even if you lose money, you can just say to yourself
“Ok, this is something I can fix with just one good trade” .
Risk Plan?
Having a risk plan is something that’s crucial. It’s basically a plan of how much
money you are going to risk for each of your trades. How much can you risk this
week, etc. So, let’s build you a perfect Risk Plan…

What Things I Need To Have In Risk Plan?
First of all, you need to have a defined Risk Per Trade (RPT), which is a fixed
amount of risk that you are going to take for each of your trades. I always suggest
people go with 1%, even on larger accounts because 1% is acceptable loss (if you
have a small account, you can go to 3% but not more).
After RPT we need to have a defined Risk Per Week (RPW), which is a defined risk
that you are going to take each week. Let’s say you want to risk 3% per week, and
you reach that level on Wednesday, now you need to forget about trading until the
next Monday (believe me don’t try to cheat this step, it just won’t work for you). You
need to do something else, relax, play basketball, go to the movies, just don’t trade!
Your best risk per week should be between 3-5% which is a number that you can
make pretty fast if you lose.
The next thing is Risk Per Month (RPM), which is the same thing as RPW, except
this is how much money you can lose for the entire month, and if you reach your
RPM target, stop trading until the end of the month… Your best Risk per Month
number is 10%, and you can set it higher for small accounts, but my honest
suggestion is not to go above 20%.
The final thing I like to have in my Risk Plan is a defined minimum Risk Reward, so I
know how much money I’m going to risk for how much profit. If you risk 100$ just to
get 100$ it’s not going to work for you, since you won’t make money every single
time. Ideally, I like to have a minimum RR set to 1:2. I absolutely love trades with 1:3
rr, so in case 2 of my trades fail, but the 3rd one reaches the target, I still make
money!
Don’t move to the next chapter until you open a notebook and write down your Risk
Plan (keep in mind, it’s not just write it and forget, you need to stick to that plan,
that’s what separates a winning trader from losing trader!)
Let’s now move on to the final chapter where we will talk about how you are going to
combine everything that you have learned so far.

Chapter #6 - Ultimate Trader
In Chapter #6 we are going to talk about how to combine everything you’ve learned
in the last few chapters and build a perfect strategy.
Market Run In Cycles.
We all know that the market won’t go up all day long or down, there is always some
sort of consolidation, right? So my idea is simple, markets have 3 Phases, and these
3 phases we can spot every day on any time frame and any instrument. Look at the
picture below to see how a perfect cycle looks like.
We have Phase 1 – where we can see the start of a new trend, usually volatility is
low and during first phase we can see that traders are changing their thinking about
some currency, let’s say from bearish to bullish.
After we see the initial reactions (movements) from the instrument that we watch, the
market is usually going to go in a consolidation stage, which is Phase 2. This phase
can last from few minutes to few weeks (depending on the time frame that you look
for in a trend). However, at the end of each phase 2 there is always going to be a
breakout.
That breakout will move the market in the same direction as Phase 1 did, we are
calling this post breakout movement, Phase 3. This final phase usually is a reaction
of the news events or strong change in traders thinking, in Phase 3.
Important: It doesn’t mean that price needs to change a trend after phase 3, that’s
on the market to decide, not on us!
Our job is going to be simple: to identify a phase 1, wait for phase 2 and buy/sell
phase 3….

How To Plan A Trade (Things To Do Before Order Is Filled)
Our strategy will work on any time frame, but the best results are showing right now
on smaller time frames, we are picking a day trading style over swing!
Step #1 -> You need to select 4-6 instruments that you are going to trade every
single day. This is all up to you which instruments you choose, but I want you to stick
to pairs (of course every month, you can see which pair you found less T1,T2,T3
patterns and switch it with another instrument).
Step #2 – Open your selected pairs inside your favorite platform. For all pairs, try to
use the same time frame, since we are day traders look at the 5min or 15min time
frames.
Step #3 – Every morning, check your selected pairs. You can use a notebook to
help you write down trends and inside what phases are your pairs and what you are
going to trade. Usually, you will find two to three phase 2’s every morning. In case
you don’t see it in the morning, give it a few hours and check again (few hours before
major news you can always spot at least one phase 2).
Step #4 – Now, watch for our T1, T2, T3 triangles and don’t worry if they don’t come
every time (phase 2 is either a triangle or simple A-B-C move, but we trade
triangles). When you spot one of our patterns you need to check the risk reward, and
only if RR is better than 1:2 you can watch to enter a position.
Quick Tip: Use Breakout EA for entry points, it’s built for triangle traders!
Another Quick Tip: Don’t Take More Than 3 Traders Per Day!

What To Do Once Your Order Is Filed!
When you are a day trader, you are in position and you can move on, but you need
to watch your trade at least until your first target isn’t reached. The only good part is
that we are trading in smaller time frames, so the average time for trade will be
between 10min – 2h.
Step #1 – Once your order is filled, you will add two indicators: EMA (13) and RSI
(13) since they can be really helpful in the second phase of trade.
- 13 EMA is the mother of the short term trend and the price will test it
usually few times while you are in a trade which is normal, but I want you to
watch the second test of the EMA if the price falls below/above, which is a
sign that maybe there is going to be a spike. When this happens you are
going to move to a stop loss to break even.
- While trading is on watch for divergence on the RSI indicator, in case
you are in a buy position and your RSI divergence shows you that maybe
there is going to be a change in a trend, you need to move the stop loss to
break even (if you want you can also book half position).
Step #2 – Watch for basic patterns like head & shoulders, double tops, wedges on
your chart. You’ll be amazed how often you are going to see them, and if you see
one of these patterns, just close entire position!
Step #3 – Always be aware of news that can impact your pairs. Although we are
technical traders and don’t care too much about news events, a few minutes before
and after the news there is usually going to be a strong reaction! You need to be in
front of your pc to watch your trade and don’t let others to take advantage of your
winning trade. The best thing to do is set an alarm on your phone 5min before
every important news!
MOST IMPORTANT RULE OF THE SECOND HALF OF THE GAME PLAN: Once
Target #1 Is Reached, Move to Stop Loss To Break Even (Use Trade Manager EA).
This simple strategy only requires you to follow a few rules, and to follow a few
steps, nothing more. I think it’s simple and something every single one of you can
fully understand, so let’s take a look at a few trading examples.

Example #1 GBPUSD T1 Pattern
The GBPUSD chart above show us that GBP was pushing higher from Jun 07 all the
way until Jun 11 and the price movements in that period were strong and clear so we
can call this our Phase #1. After that, we will observe some consolidation from 11
Jun until 14 June and this is our Phase #2. If we check how many legs this triangle
has we can see five, and each leg is shorter than the previous one, this is a T1
pattern.
So, your buying opportunity would be a breakout of the upper trend line (yellow on
chart), and for a stop loss we are going to use an ending point of final leg and for
targets we are going to use an inverse 161.8% and 200% of the 1st leg.
In this case, both targets would be reached, but you also need to watch for RSI.
There was some sort of divergence between the starting point of the triangle and
target #1, so their moving a stop loss to break even. The first reason is divergence
and the second reason is that TP #1 is reached so in any case you are moving sl.
Let’s move to the next example…

Example #2 NZDUSD T1 Pattern
Again we have a T1 pattern, but in this case the trend was bearish, so don’t worry because
our entire strategy works in bearish market also. We have a drop down from Jun 10 until
Jun 13, for us this is our Phase #1 where we can see a change in trends followed by strong
lower reaction.
After push down we have what? Consolidation period in the NZDUSD pair from 13 – 17
June. Again, we have five legs, so we are going to do the same thing to enter a trade, we
are going to draw a trendline which will help us to sell this pair, for stop loss ending point of
5th leg and targets inverse 161.8 and 200% of the 1st leg.
During the trade, this pair was perfect, EMA wasn’t tested all the way until the test of 2nd
target level, and RSI showed us divergence after 200% was reached…. Again, you are
moving a stop loss to break even once 161.8% is reached.
Let’s go on to the next example:

Example #3 USDJPY T3 Pattern
On this 5min chart of the USDJPY pair, we can observe that price started to change
a trend right after the market open on 29 of Jun. First, we found resistance around
1h but consolidation after that didn’t give us any triangle pattern, so we are moving to
the next, around 2:30 we are seeing that price started to make some pullbacks.
This is a time when we are going to watch for our Phase 2 and our patterns.
Because the price action was small and we had only 3 legs we are going to call this
triangle a T3.
For trading you are drawing a trend line from the top through the end of the point of
the 2nd leg and you are buying a breakout. For targets in this case we are using
127.2 and 161.8% and for a stop loss ending point of the 3rd leg.
Now we can see that the price spiked higher and tested 127.2%. There you are
moving a stop loss to break even and booking half of your position because that’s
your tp #1. After that price starts to trade around 13EMA and breaks that level, now
you have two options, 1st don’t do anything (since your stops are already at
breakeven) or 2nd you go and close the rest of your trade. Also, RSI showed a nice
divergence so closing a trade after a breakout of EMA would be the best option.

Check recordings for more examples, it’s much easier to visual everything from video….
The Key To Becoming A Successful Day Trader?
First, to become the best trader you can be, you need to practice a lot and the most
important thing is iron discipline, so if your rules tell you to close a position, go and
close. I don’t want you to say “ok the price will go in my direction” …
In the movie that I think many of you have seen, Edge of Tomorrow, Tom Cruise is
the solider that’s fighting to save the world from the aliens. Now, every day he dies
and starts his day all over again until he manages to defeat all the enemies.
While it would be great to lose money, wake up and start all over again and make
money, it just doesn’t happen that way! So, I figure instead of Live, Die, Repeat we
are going to use Trade, Win and Repeat!
So all I ask from you traders is to wake up each day, Trade Our Patterns, Win Profit
& Repeat that process! The more you practice, the better you’ll become and
everything will be much easier!
I really hope that you have enjoyed our trader’s sensation weekend, and I want you
to go and make as much profit as you ever dreamed! Keep in mind that me and Vlad
are waiting to hear how all off you are progressing, so keep us updated!