table of contents - cordis.europa.eu · a figure s1 b 1700 1650 1600 1550 1500 wavelength (cm-1)...
TRANSCRIPT
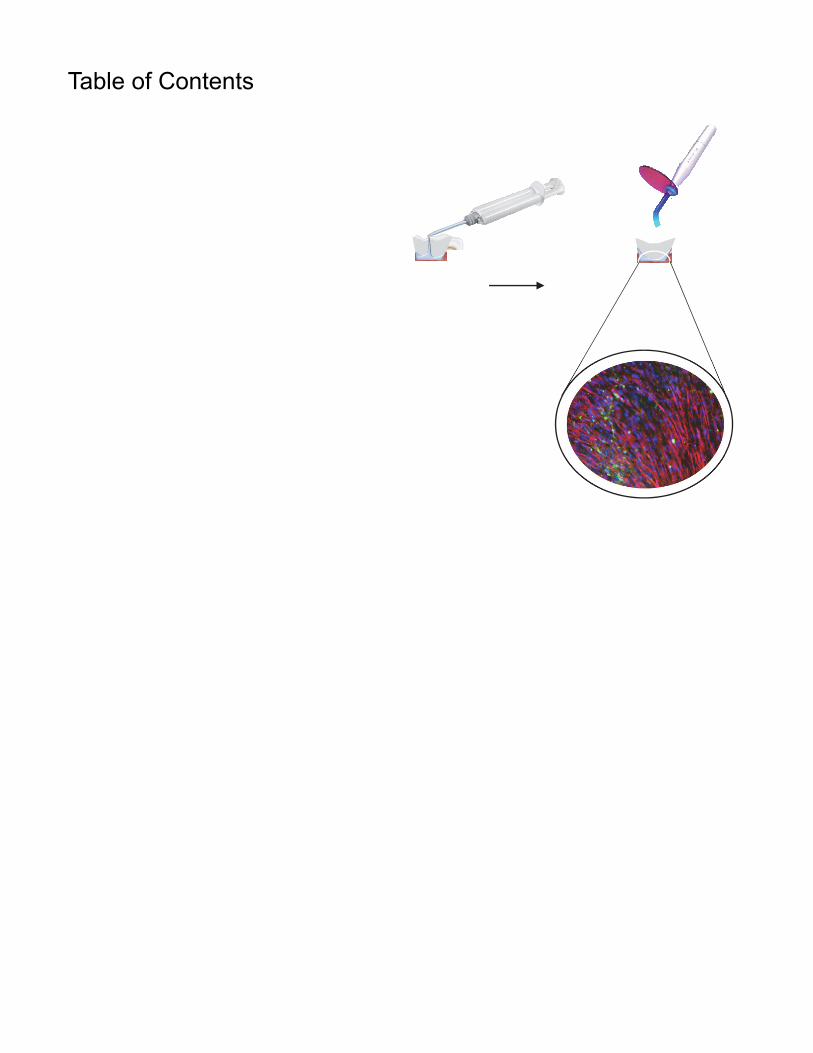
Table of Contents
0
1
Rel
ativ
e C
ell C
ount
Rank
0
1
Rel
ativ
e ar
ea
Rank
0
1
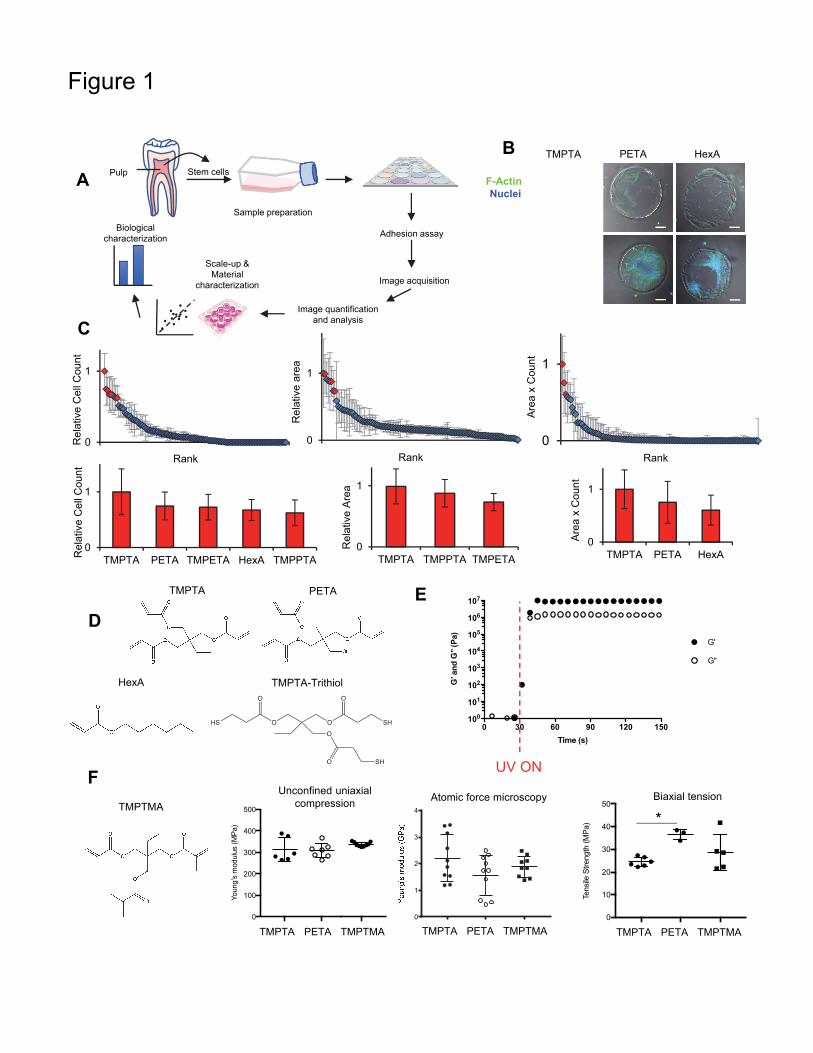
TMPTA TMPPTA TMPETA
Rel
ativ
e A
rea
0
1
TMPTA PETA HexA
Are
a x
Cou
nt
0
1
Are
a x
Cou
nt
Rank
0
1
TMPTA PETA TMPETA HexA TMPPTARel
ativ
e C
ell C
ount
HexAPETATMPTA
F-Actin Nuclei
A
B
C
TMPTA PETA
HexA
D
0 30 60 90 120 150100
101
102
103
104
105
106
107
Time (s)
G’ a
nd
G’’
(Pa)
G'
G''
E
UV ON
Figure 1
F
TMPTMA
TMPTA-Trithiol
AT03AT06
0
100
200
300
400
500
Youn
g’s
mod
ulus
(M
Pa)
BT01TMPTA PETA TMPTMA
Unconfined uniaxial compression
TMPTA PETA TMPTMA
0
1
2
3
4
TMPTA PETA TMPTMA
Atomic force microscopy
AT03 AT060
10
20
30
40
50
Tens
ile S
tren
gth
(MP
a)
BT01TMPTA PETA TMPTMA
Biaxial tension
*
Pulp Stem cells
Sample preparation
Adhesion assay
Image acquisition
Image quantification and analysis
Biological characterization
Scale-up &Material
characterization
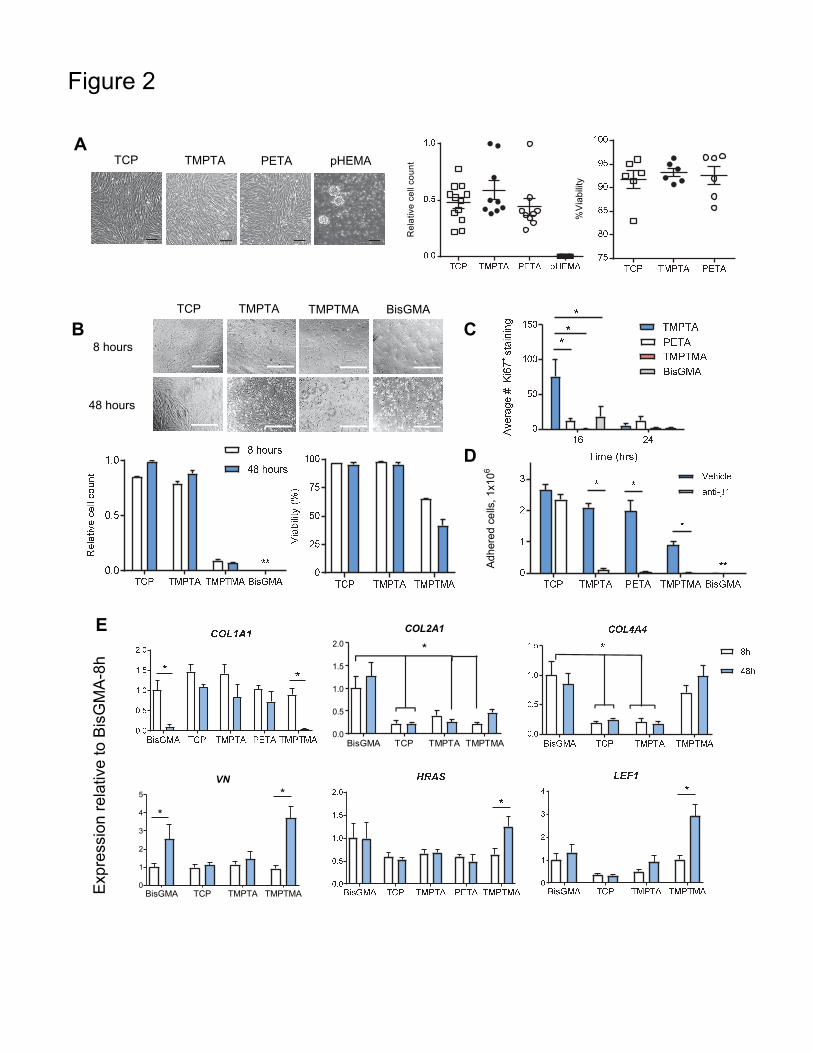
TCP TMPTA TMPTMA BisGMA
8 hours
48 hours
CB
Adh
ered
ce
lls,
1x10
6
D
BisGMA TCP TMPTA TMPTMA0
1
2
3
4
5
VN
*
*
E
Exp
ress
ion
rela
tive
to B
isG
MA
-8h
Figure 2
PETA pHEMATMPTATCP
Re
lativ
e c
ell
cou
nt
%V
iab
ility
A
BisGMA TCP TMPTA TMPTMA0.0
0.5
1.0
1.5
2.0
COL2A1
*
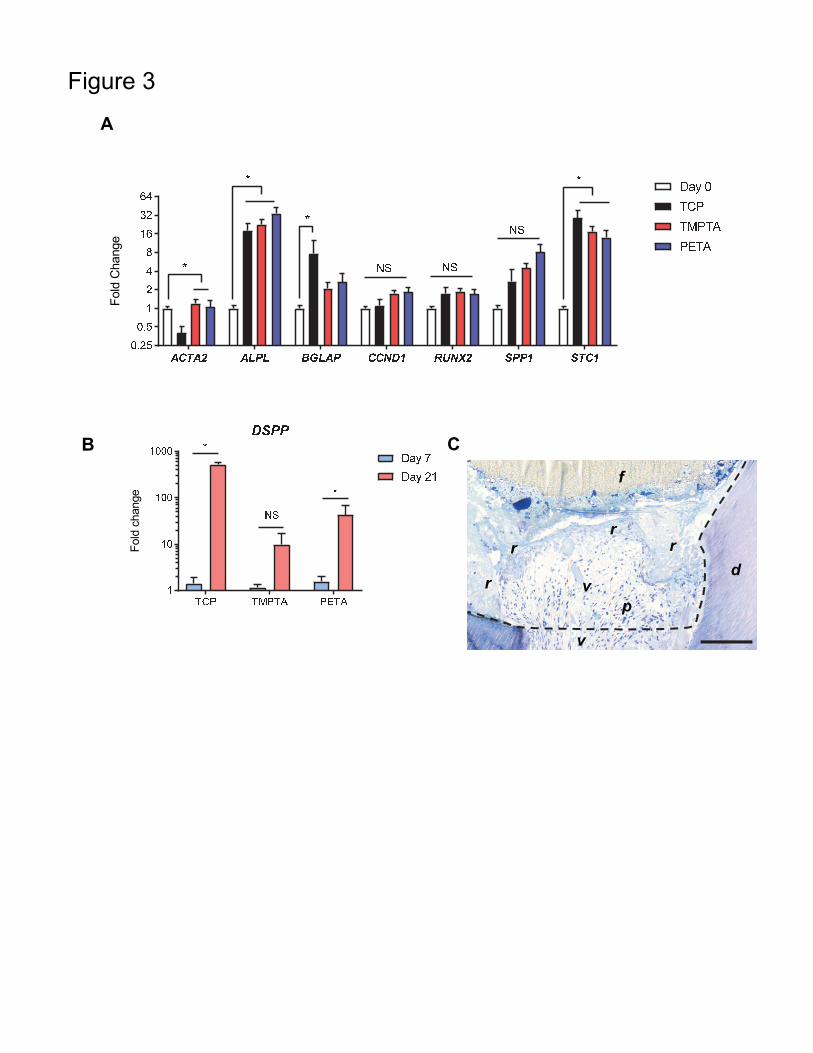
A
B
Figure 3F
old
Cha
nge
Fol
d ch
ange
f
r
p
d
r
r
r
v
v
C
A
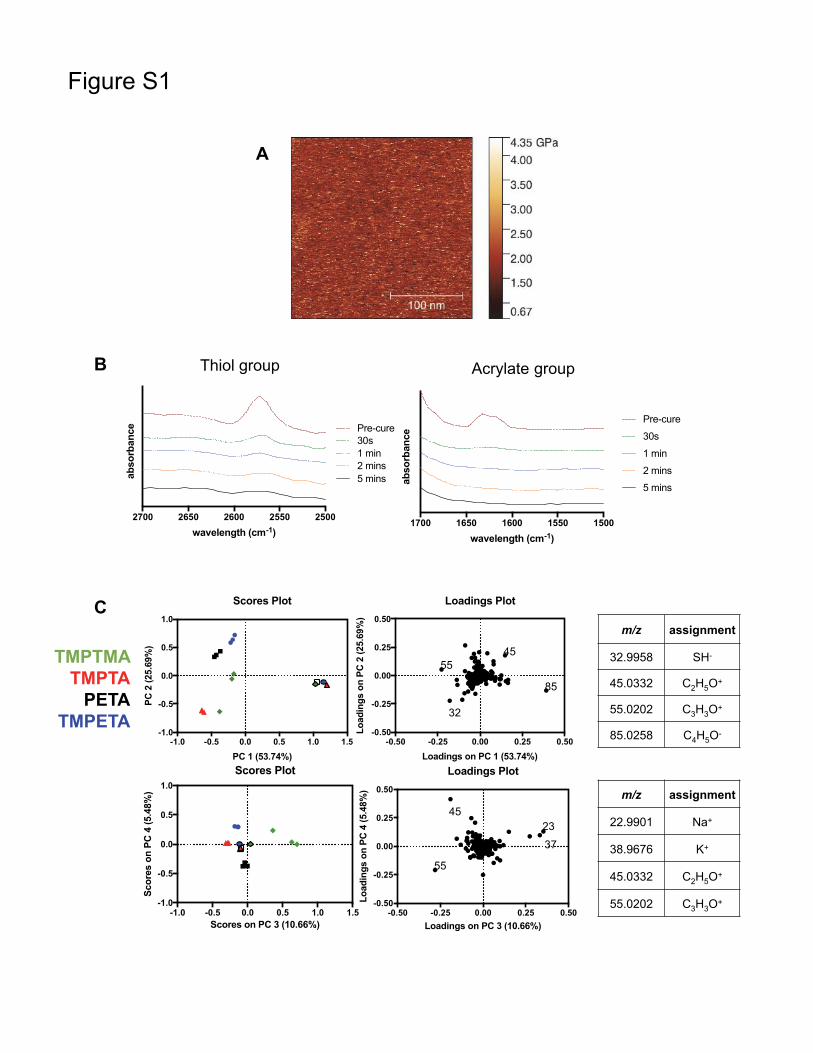
Figure S1
B
15001550160016501700
wavelength (cm-1)
abso
rban
cePre-cure
30s
1 min
2 mins
5 mins
25002550260026502700
wavelength (cm-1)
abso
rban
ce
Pre-cure30s1 min2 mins5 mins
Acrylate groupThiol group
-1.0 -0.5 0.0 0.5 1.0 1.5-1.0
-0.5
0.0
0.5
1.0
PC 1 (53.74%)
PC
2 (
25.6
9%)
Scores Plot
-0.50 -0.25 0.00 0.25 0.50-0.50
-0.25
0.00
0.25
0.50
Loadings on PC 1 (53.74%)
Lo
adin
gs
on
PC
2 (
25.6
9%)
Loadings Plot
85
45
32
55
-1.0 -0.5 0.0 0.5 1.0 1.5-1.0
-0.5
0.0
0.5
1.0
Scores on PC 3 (10.66%)
Sco
res
on
PC
4 (
5.48
%)
Scores Plot
-0.50 -0.25 0.00 0.25 0.50-0.50
-0.25
0.00
0.25
0.50
Loadings on PC 3 (10.66%)
Lo
adin
gs
on
PC
4 (
5.48
%)
Loadings Plot
23
37
55
45
TMPTMATMPTA
PETATMPETA
Cm/z assignment
32.9958 SH-
45.0332 C2H5O+
55.0202 C3H3O+
85.0258 C4H5O-
m/z assignment
22.9901 Na+
38.9676 K+
45.0332 C2H5O+
55.0202 C3H3O+
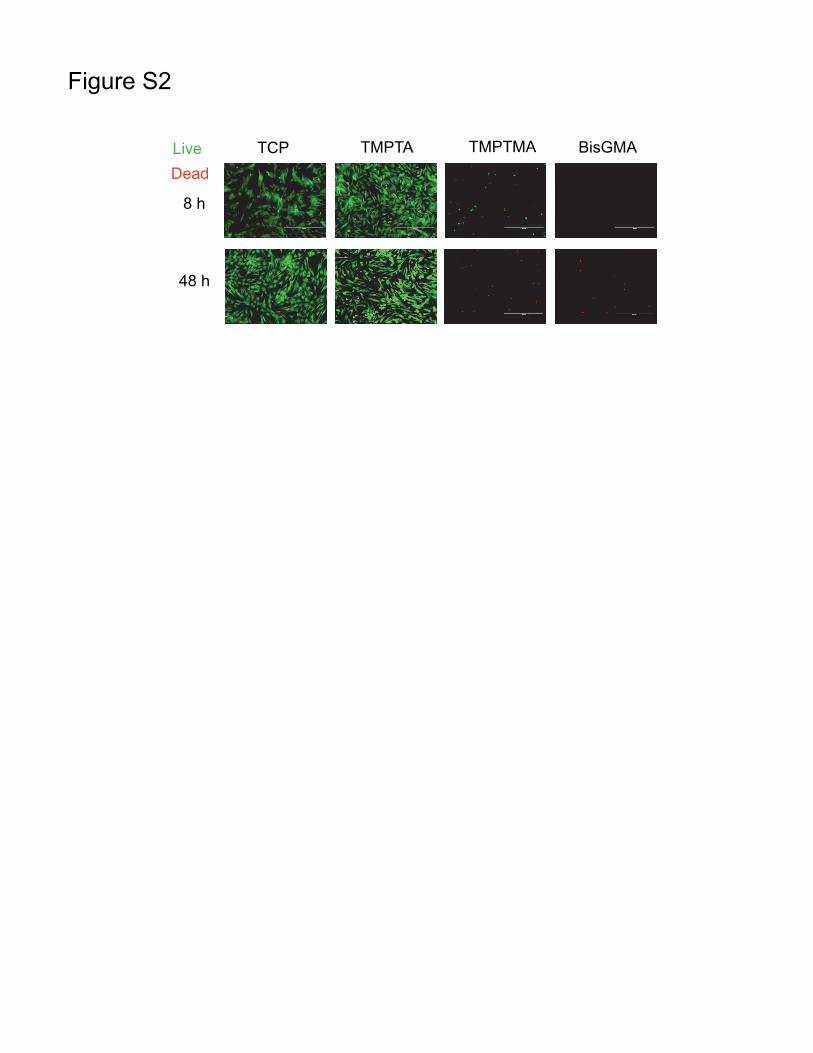
TMPTA TMPTMA BisGMATCP
8 h
48 h
Figure S2
Dead
Live

B
TMPTA BisGMATMPTMA
Ki67
F-actin
16 h
24 h
PETA
8 16 24 480
20
40
60
80
100
Time (hrs)
TMPTAPETA
BisGMATMPTMA
A
Figure S3
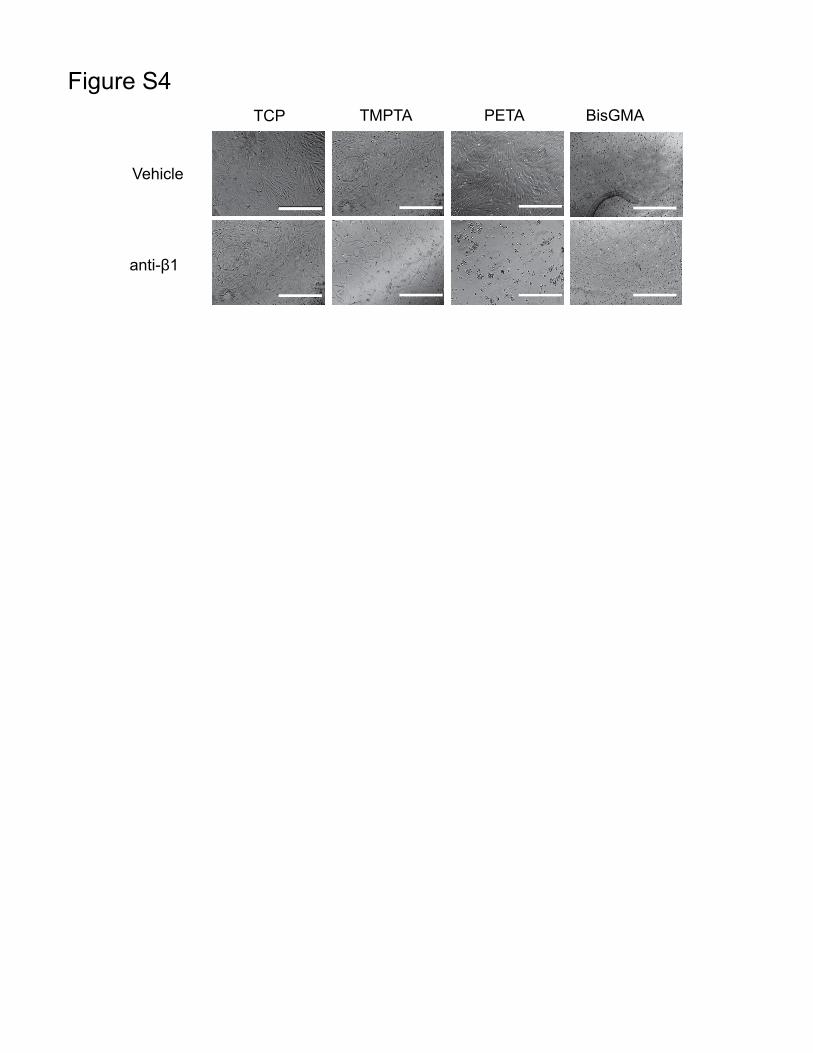
Vehicle
anti-β1
TMPTA PETA BisGMATCP
Figure S4

A
Pol
ymer
log 2
(Re
lativ
e E
xpre
ssio
n)
Pol
ymer
log 2
(Re
lativ
e E
xpre
ssio
n)
Pol
ymer
log 2
(Re
lativ
e E
xpre
ssio
n)
Pol
ymer
log 2
(Re
lativ
e E
xpre
ssio
n)
Pol
ymer
log 2
(Re
lativ
e E
xpre
ssio
n)
B
Figure S5

Pol
ymer
log 2
(Re
lativ
e E
xpre
ssio
n)
AP
olym
er
log 2
(Re
lativ
e E
xpre
ssio
n)
Pol
yme
r lo
g 2(R
ela
tive
Exp
ress
ion
)
Pol
yme
r lo
g 2(R
ela
tive
Exp
ress
ion
)
Pol
ymer
log 2
(Re
lativ
e E
xpre
ssio
n)
B
Figure S6

SRC
MAPK3
COL4A4
HRAS
COL2A1
ACTG1
AC0020
94.1LE
F1
ITGB1
COL1A1
ACTB
ITGA5
GRB2
AKT2
MAPK1
ITGA3
COL1A2
AKT3
RAC1
FLNAVCL
ITGAV
JUN
MAP2K
1
COL4A1
LAM
B1
COL4A3
FN1
TCF7L2
ACTN4
CTNNB1
CCND1TBP
COL4A2
Rel
ativ
e ex
pres
sion
AE
xpre
ssio
n re
lativ
e to
Bis
GM
A-8
h
Exp
ress
ion
rela
tive
to B
isG
MA
-8h
BisGMA TCP TMPTA PETA TMPTMA0.0
0.5
1.0
1.5
2.0
Exp
ress
ion
rela
tive
to B
isG
MA
-8h
ACTG1
*
B
Figure S7
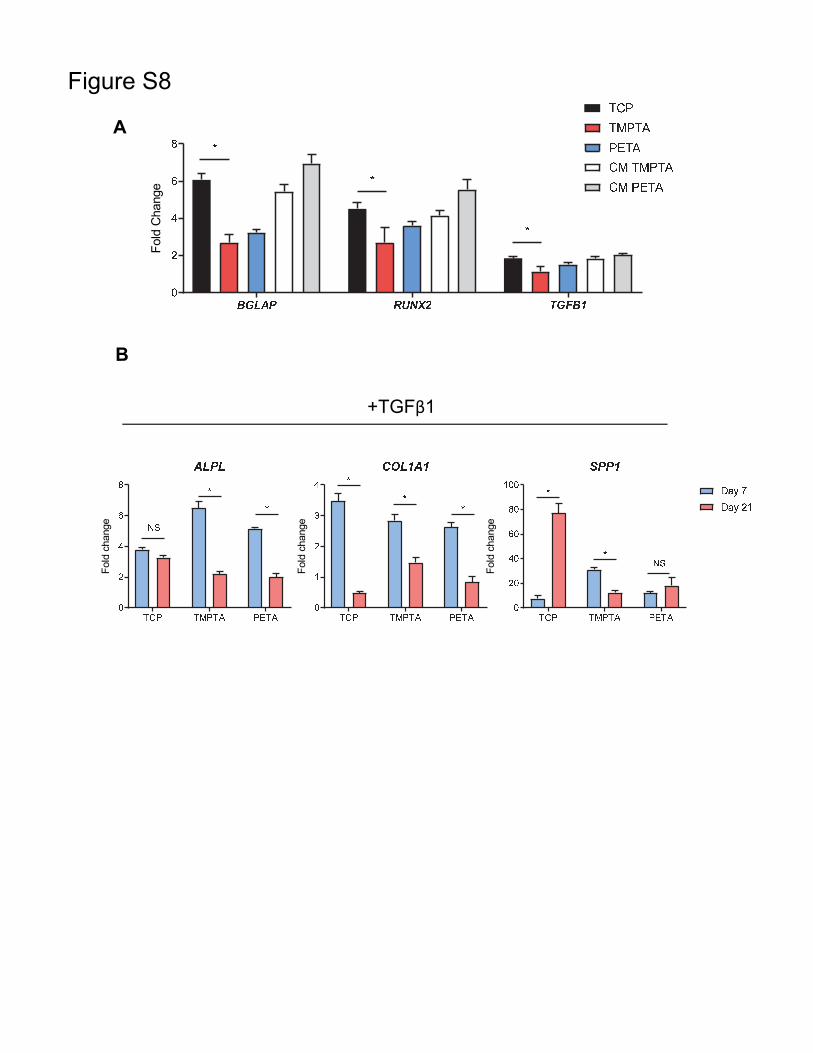
A
B
Figure S8F
old
chan
ge
Fol
d ch
ange
Fol
d ch
ange
Fol
d C
hang
e
+TGFβ1

Resincomposite
TMPTA TMPTA +composite
0.0
0.2
0.4
0.6
0.8
Ca(OH)2 +composite
Figure S9
TMPTAResin composite + Ca(OH)2 control
**
A
B

+Composite+Triacrylate
Figure S10
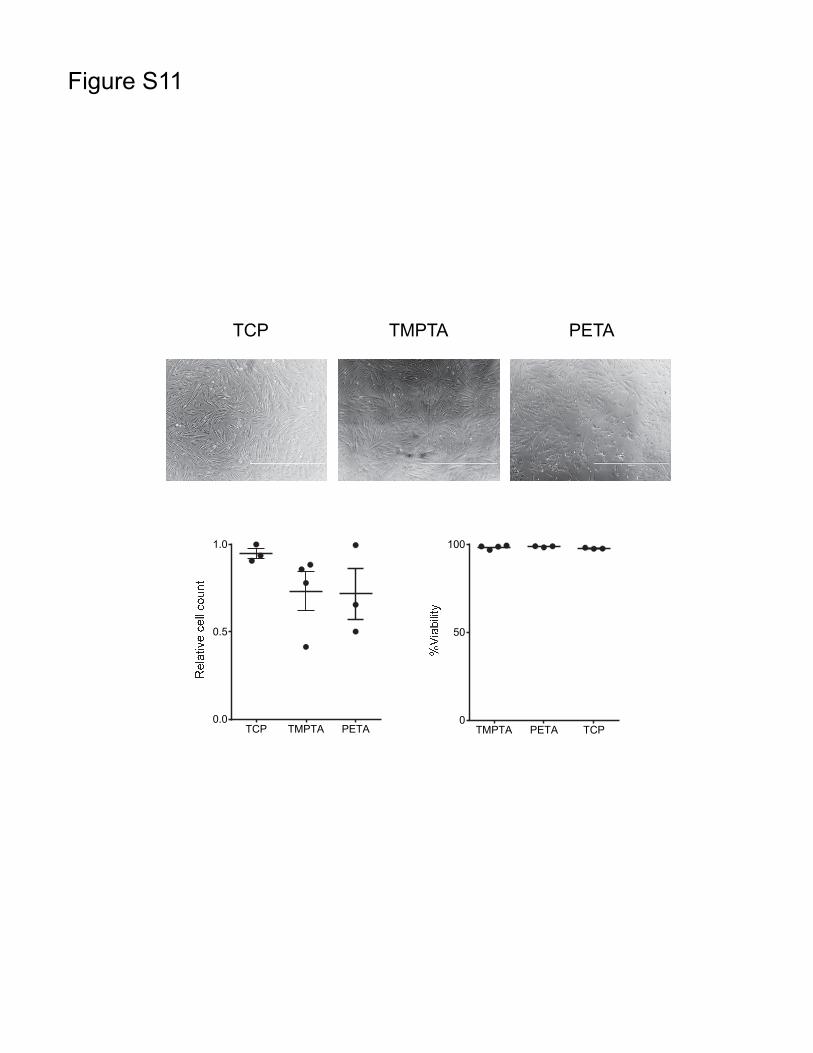
TCP TMPTA PETA0.0
0.5
1.0
TMPTA PETA TCP0
50
100
TCP TMPTA PETA
Figure S11