table of contents - alison...2 module 1: an introduction to risk management unit 5: types of risks -...
TRANSCRIPT
1
Table of Contents
Case Study 1: The Risks of E-exposures:............................................. 2
Case Study 2: Risks in the New Millennium: ......................................... 4
Case Study 3: Is Airport Security Worth It to You?: ............................... 6
Case Study 4: How to Handle the Risk Management of a Low-
Frequency but Scary Risk Exposure: The Anthrax Scare:....................... 8
Case Study 5: Dana’s Story: ............................................................... 10
Case Study 6: The Risk Management Decision—Return to the
Example: ............................................................................................... 14
An Introduction to Risk Management
2
Module 1: An Introduction to Risk Management
Unit 5: Types of Risks - Risk Exposures Part 2
Case Study: The Risks of E-exposures
Electronic risk, or e-risk, comes in many forms. Like any property, computers are
vulnerable to theft and employee damage (accidental or malicious). Certain
components are susceptible to harm from magnetic or electrical disturbance or
extremes of temperature and humidity. More important than replaceable hardware or
software is the data they store; theft of proprietary information costs companies
billions of dollars. Most data theft is perpetrated by employees, but “netspionage”—
electronic espionage by rival companies—is on the rise.
Companies that use the Internet commercially—who create and post content or sell
services or merchandise—must follow the laws and regulations that traditional
businesses do and are exposed to the same risks. An online newsletter or e-zine can
be sued for libel, defamation, invasion of privacy, or misappropriation (e.g.,
reproducing a photograph without permission) under the same laws that apply to a
print newspaper. Web site owners and companies conducting business over the
Internet have three major exposures to protect: intellectual property (copyrights,
patents, trade secrets); security (against viruses and hackers); and business
continuity (in case of system crashes).
All of these losses are covered by insurance, right? Wrong. Some coverage is
provided through commercial property and liability policies, but traditional insurance
policies were not designed to include e-risks. In fact, standard policies specifically
exclude digital risks (or provide minimal coverage). Commercial property policies
cover physical damage to tangible assets—and computer data, software, programs,
and networks are generally not counted as tangible property. (U.S. courts are still
debating the issue.)
This coverage gap can be bridged either by buying a rider or supplemental coverage
to the traditional policies or by purchasing special e-risk or e-commerce coverage. E-
risk property policies cover damages to the insured’s computer system or Web site,
including lost income because of a computer crash. An increasing number of insurers
are offering e-commerce liability policies that offer protection in case the insured is
sued for spreading a computer virus, infringing on property or intellectual rights,
invading privacy, and so forth.
Cybercrime is just one of the e-risk-related challenges facing today’s risk managers.
They are preparing for it as the world evolves faster around cyberspace, evidenced
by record-breaking online sales during the 2005 Christmas season.
An Introduction to Risk Management

3
Sources: Harry Croydon, “Making Sense of Cyber-Exposures,”National Underwriter,
Property & Casualty/Risk & Benefits Management Edition, 17 June 2002; Joanne
Wojcik, “Insurers Cut E-Risks from Policies,” Business Insurance, 10 September
2001; Various media resources at the end of 2005 such as Wall Street Journal and
local newspapers.
4
Module 1: An Introduction to Risk Management
Unit 5: Types of Risks - Risk Exposures Part 2
Case Study: Risks in the New Millennium
While man-made and natural disasters are the stamps of this decade, another type
of man-made disaster marks this period. [3]Innovative financial products without
appropriate underwriting and risk management coupled with greed and lack of
corporate controls brought us to the credit crisis of 2007 and 2008 and the deepest
recession in a generation. The capital market has become an important player in the
area of risk management with creative new financial instruments, such as
Catastrophe Bonds and securitized instruments. However, the creativity and
innovation also introduced new risky instruments, such as credit default swaps and
mortgage-backed securities. Lack of careful underwriting of mortgages coupled with
lack of understanding of the new creative “insurance” default swaps instruments and
the resulting instability of the two largest remaining bond insurers are at the heart of
the current credit crisis.
As such, within only one decade we see the escalation in new risk exposures at an
accelerated rate. This decade can be named “the decade of extreme risks with
inadequate risk management.” The late 1990s saw extreme risks with the stock
market bubble without concrete financial theory. This was followed by the worst
terrorist attack in a magnitude not experienced before on U.S. soil. The corporate
corruption at extreme levels in corporations such as Enron just deepened the sense
of extreme risks. The natural disasters of Katrina, Rita, and Wilma added to the
extreme risks and were exacerbated by extraordinary mismanagement. Today, the
extreme risks of mismanaged innovations in the financial markets combined with
greed are stretching the field of risk management to new levels of governmental and
private controls.
However, did the myopic concentration on terrorism risk derail the holistic view of
risk management and preparedness? The aftermath of Katrina is a testimonial to the
lack of risk management. The increase of awareness and usage of enterprise risk
management (ERM) post–September 11 failed to encompass the already well-
known risks of high-category hurricanes on the sustainability of New Orleans levies.
The newly created holistic Homeland Security agency, which houses FEMA, not only
did not initiate steps to avoid the disaster, it also did not take the appropriate steps to
reduce the suffering of those afflicted once the risk materialized. This outcome also
points to the importance of having a committed stakeholder who is vested in the
outcome and cares to lower and mitigate the risk. Since the insurance industry did
not own the risk of flood, there was a gap in the risk management. The focus on
terrorism risk could be regarded as a contributing factor to the neglect of the natural
disasters risk in New Orleans. The ground was fertile for mishandling the extreme
hurricane catastrophes. Therefore, from such a viewpoint, it can be argued that
An Introduction to Risk Management An Introduction to Risk Management
5
September 11 derailed our comprehensive national risk management and
contributed indirectly to the worsening of the effects of Hurricane Katrina.
Furthermore, in an era of financial technology and creation of innovative modeling for
predicting the most infrequent catastrophes, the innovation and growth in human
capacity is at the root of the current credit crisis. While the innovation allows firms
such as Risk Management Solutions (RMS) and AIR Worldwide to provide models
[4] that predict potential man-made and natural catastrophes, financial technology
also advanced the creation of financial instruments, such as credit default derivatives
and mortgage-backed securities. The creation of the products provided “black boxes”
understood by few and without appropriate risk management. Engineers,
mathematicians, and quantitatively talented people moved from the low-paying jobs
in their respective fields into Wall Street. They used their skills to create models and
new products but lacked the business acumen and the required safety net
understanding to ensure product sustenance. Management of large financial
institutions globally enjoyed the new creativity and endorsed the adoption of the new
products without clear understanding of their potential impact or just because of
greed. This lack of risk management is at the heart of the credit crisis of 2008. No
wonder the credit rating organizations are now adding ERM scores to their ratings of
companies.
The following quote is a key to today’s risk management discipline: “Risk
management has been a significant part of the insurance industry…, but in recent
times it has developed a wider currency as an emerging management philosophy
across the globe…. The challenge facing the risk management practitioner of the
twenty-first century is not just breaking free of the mantra that risk management is all
about insurance, and if we have insurance, then we have managed our risks, but
rather being accepted as a provider of advice and service to the risk makers and the
risk takers at all levels within the enterprise. It is the risk makers and the risk takers
who must be the owners of risk and accountable for its effective management.” [5]
6
Module 1: An Introduction to Risk Management
Unit 6: Perils and Hazards
Case Study: Is Airport Security Worth It to You?
Following the September 11, 2001, terrorist attacks, the Federal Aviation
Administration (now the Transportation Security Administration [TSA] under the U.S.
Department of Homeland Security [DHS]) wrestled with a large question: how could
a dozen or more hijackers armed with knives slip through security checkpoints at two
major airports? Sadly, it wasn’t hard. Lawmakers and security experts had long
complained about lax safety measures at airports, citing several studies over the
years that had documented serious security lapses. “I think a major terrorist incident
was bound to happen,” Paul Bracken, a Yale University professor who teaches
national security issues and international business, told Wired magazine a day after
the attacks. “I think this incident exposed airport security for what any frequent
traveler knows it is—a complete joke. It’s effective in stopping people who may have
a cigarette lighter or a metal belt buckle, but against people who want to hijack four
planes simultaneously, it is a failure.”
Two days after the attacks, air space was reopened under extremely tight security
measures, including placing armed security guards on flights; ending curbside
check-in; banning sharp objects (at first, even tweezers, nail clippers, and eyelash
curlers were confiscated); restricting boarding areas to ticket-holding passengers;
and conducting extensive searches of carry-on bags.
In the years since the 2001 terrorist attacks, U.S. airport security procedures have
undergone many changes, often in response to current events and national terrorism
threat levels. Beginning in December 2005, the Transportation Security
Administration (TSA) refocused its efforts to detect suspicious persons, items, and
activities. The new measures called for increased random passenger screenings.
They lifted restrictions on certain carry-on items. Overall, the changes were viewed
as a relaxation of the extremely strict protocols that had been in place subsequent to
the events of 9/11.
The TSA had to revise its airline security policy yet again shortly after the December
2005 adjustments. On August 10, 2006, British police apprehended over twenty
suspects implicated in a plot to detonate liquid-based explosives on flights originating
from the United Kingdom bound for several major U.S. cities. Following news of this
aborted plot, the U.S. Terror Alert Level soared to red (denoting a severe threat
level). As a result, the TSA quickly barred passengers from carrying on most liquids
and other potentially explosives-concealing compounds to flights in U.S. airports.
Beverages, gels, lotions, toothpastes, and semisolid cosmetics (such as lipstick)
were thus expressly forbidden.
An Introduction to Risk Management
7
Less-burdensome modifications were made to the list of TSA-prohibited items not
long after publication of the initial requirements. Nevertheless, compliance remains a
controversial issue among elected officials and the public, who contend that the
many changes are difficult to keep up with. Many contended that the changes
represented too great a tradeoff of comfort or convenience for the illusion of safety.
To many citizens, though, the 2001 terrorist plot served as a wake-up call, reminding
a nation quietly settling into a state of complacency of the need for continued
vigilance. Regardless of the merits of these viewpoints, air travel security will no
doubt remain a
hot topic in the years ahead as the economic, financial, regulatory, and sociological
issues become increasingly complex.
Questions for Discussion
1. Discuss whether the government has the right to impose great cost to many in
terms of lost time in using air travel, inconvenience, and affronts to some people’s
privacy to protect a few individuals.
2.Do you see any morale or moral hazards associated with the homeland security
monitoring and actively searching people and doing preflight background checks on
individuals prior to boarding?
3.Discuss the issue of personal freedom versus national security as it relates to this
case.
Sources: Tsar’s Press release
At http://www.tsa.gov/public/display?theme=44&content=090005198018c27e. For
more information regarding TSA, visit our Web site at http://www.TSA.gov; Dave
Linkups, “Airports Vulnerable Despite Higher Level of Security,”Business Insurance,
6 May 2002; “U.S. Flyers Still at Risk,”National Underwriter Property & Casualty/Risk
& Benefits Management Edition, 1 April 2002; Stephen Power, “Background Checks
Await Fliers,” The Wall Street Journal, 7 June 2002. For media sources related to
2006 terrorist
plot,seehttp://en.wikipedia.org/wiki/2006_transatlantic_aircraft_plot#References
8
Module 2: The Fundamental Tools of Risk Management
Unit 1: Introduction
Case Study: How to Handle the Risk Management of a
Low-Frequency but Scary Risk Exposure: The
Anthrax Scare
The date staring up from the desk calendar reads June 1, 2002, so why is the
Capitol Hill office executive assistant opening Christmas cards? The anthrax scare
after September 11, 2001, required these late actions. For six weeks after an
anthrax-contaminated letter was received in Senate Majority Leader Tom Daschle’s
office, all Capitol Hill mail delivery was stopped. As startling as that sounds, mail
delivery is of small concern to the many public and private entities that suffered loss
due to the terrorism-related issues of anthrax. The biological agent scare, both real
and imagined, created unique issues for businesses and insurers alike since it is the
type of poison that kills very easily.
Who is responsible for the clean-up costs related to bioterrorism? Who is liable for
the exposure to humans within the contaminated facility? Who covers the cost of a
shutdown of a business for decontamination? What is a risk manager to do?
Senator Charles Grassley (R-Iowa), member of the Senate Finance Committee at
the time, estimated that the clean-up project cost for the Hart Senate Office Building
would exceed $23 million. Manhattan Eye, Ear, and Throat Hospital closed its doors
in late October 2001 after a supply-room worker contracted and later died from
pulmonary anthrax. The hospital—a small, thirty-bed facility—reopened November
6,2001, announcing that the anthrax scare closure had cost the facility an estimated
$700,000 in revenue.
These examples illustrate the necessity of holistic risk management and the effective
use of risk mapping to identify any possible risk, even those that may remotely affect
the firm. Even if their companies aren’t being directly targeted, risk managers must
incorporate disaster management plans to deal with indirect atrocities that slow or
abort the firms’ operations. For example, an import/export business must protect
against extended halts in overseas commercial air traffic. A mail-order-catalog
retailer must protect against long-term mail delays. Evacuation of a workplace for
employees due to mold infestation or biochemical exposure must now be added to
disaster recovery plans that are part of loss-control programs. Risk managers take
responsibility for such programs.
After a temporary closure, reopened facilities still give cause for concern. Staffers at
the Hart Senate Office Building got the green light to return to work on January 22,
2002, after the anthrax remediation process was completed. Immediately, staffers
began reporting illnesses. By March, 255 of the building’s employees had
An Introduction to Risk Management

9
complained of symptoms that included headaches, rashes, and eye or throat
irritation, possibly from the chemicals used to kill the anthrax. Was the decision to
reopen the facility too hasty?
Sources: “U.S. Lawmakers Complain About Old Mail After Anthrax Scare.” Dow
Jones Newswires, 8 May 2002; David Pilla, “Anthrax Scare Raises New Liability
Issues for Insurers,” A.M. Best Newswire, October 16, 2001; Sheila R. Cherry,
“Health Questions Linger at Hart,” Insight on the News, April 15, 2002, p.16; Cinda
Becker, “N.Y. Hospital Reopens; Anthrax Scare Costs Facility $700,000,” Modern
Healthcare, 12 November 2001, p. 8; Sheila R. Cherry, “Health Questions Linger at
Hart,” Insight on the News, April 15, 2002, p. 16(2).
10
Module 2: The Fundamental Tools of Risk Management
Unit 4: Projected Frequency and Severity and Cost-Benefit Analysis
Case Study: Dana’s Story
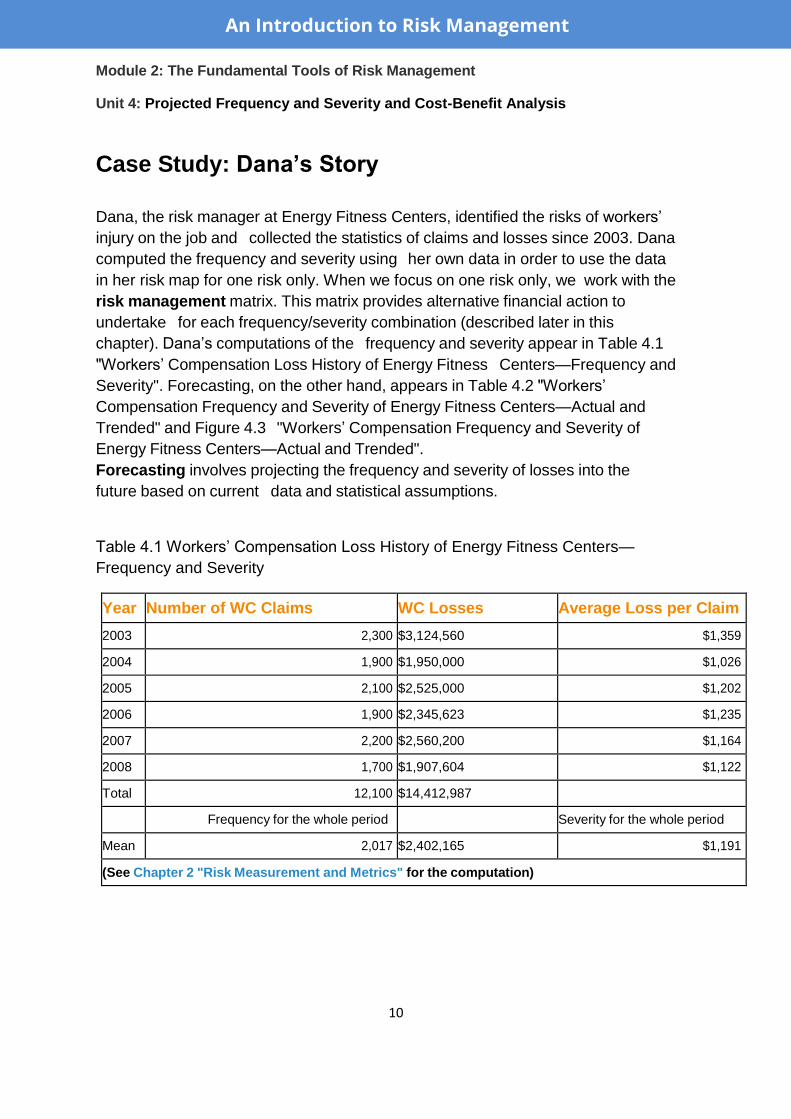
Dana, the risk manager at Energy Fitness Centers, identified the risks of workers’
injury on the job and collected the statistics of claims and losses since 2003. Dana
computed the frequency and severity using her own data in order to use the data
in her risk map for one risk only. When we focus on one risk only, we work with the
risk management matrix. This matrix provides alternative financial action to
undertake for each frequency/severity combination (described later in this
chapter). Dana’s computations of the frequency and severity appear in Table 4.1
"Workers’ Compensation Loss History of Energy Fitness Centers—Frequency and
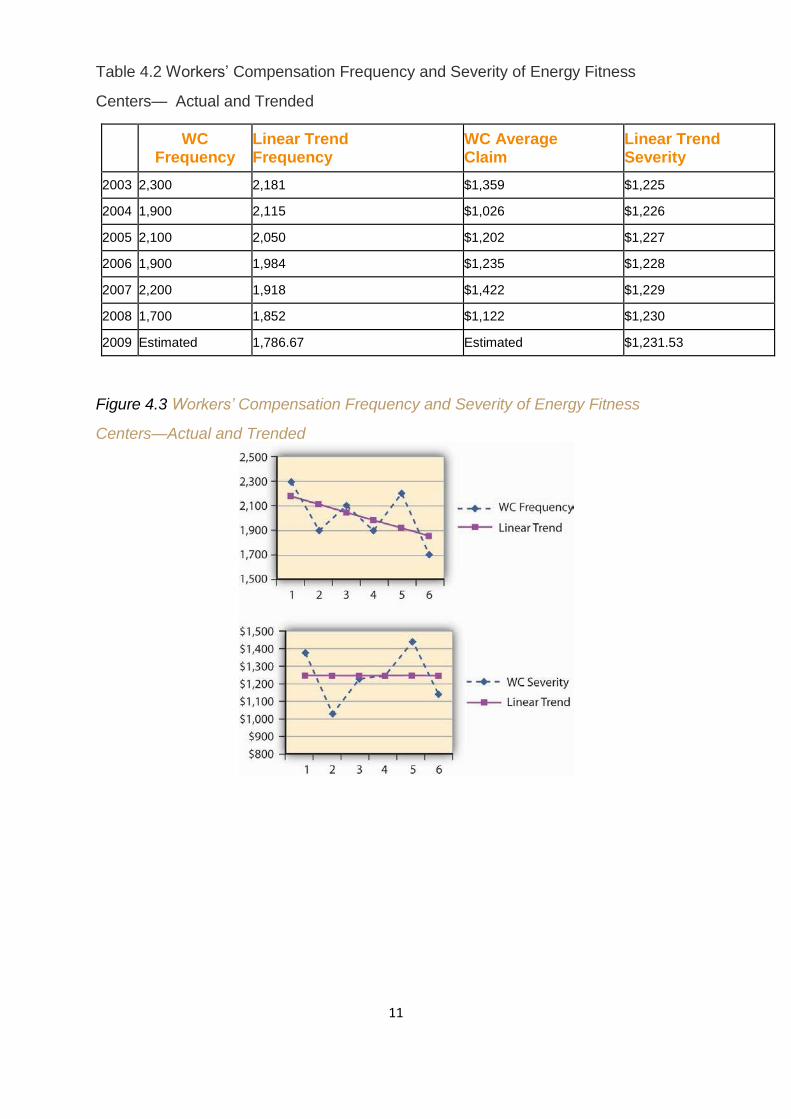
Severity". Forecasting, on the other hand, appears in Table 4.2 "Workers’
Compensation Frequency and Severity of Energy Fitness Centers—Actual and
Trended" and Figure 4.3 "Workers’ Compensation Frequency and Severity of
Energy Fitness Centers—Actual and Trended".
Forecasting involves projecting the frequency and severity of losses into the
future based on current data and statistical assumptions.
Table 4.1 Workers’ Compensation Loss History of Energy Fitness Centers—
Frequency and Severity
Year Number of WC Claims WC Losses Average Loss per Claim
2003 2,300 $3,124,560 $1,359
2004 1,900 $1,950,000 $1,026
2005 2,100 $2,525,000 $1,202
2006 1,900 $2,345,623 $1,235
2007 2,200 $2,560,200 $1,164
2008 1,700 $1,907,604 $1,122
Total 12,100 $14,412,987
Frequency for the whole period Severity for the whole period
Mean 2,017 $2,402,165 $1,191
(See Chapter 2 "Risk Measurement and Metrics" for the computation)
An Introduction to Risk Management
11
Table 4.2 Workers’ Compensation Frequency and Severity of Energy Fitness
Centers— Actual and Trended
WC Frequency
Linear Trend Frequency
WC Average Claim
Linear Trend Severity
2003 2,300 2,181 $1,359 $1,225
2004 1,900 2,115 $1,026 $1,226
2005 2,100 2,050 $1,202 $1,227
2006 1,900 1,984 $1,235 $1,228
2007 2,200 1,918 $1,422 $1,229
2008 1,700 1,852 $1,122 $1,230
2009 Estimated 1,786.67 Estimated $1,231.53
Figure 4.3 Workers’ Compensation Frequency and Severity of Energy Fitness
Centers—Actual and Trended
12
Dana installed various loss-control tools during the period under study. The result
of the risk reduction investments appear to be paying off. Her analysis of the
results indicated that the annual frequency trend has decreased (see the negative
slope for the frequency in Figure 4.2 "Notable Notions Risk Map"). The company’s
success in decreasing loss severity doesn’t appear in such dramatic terms.
Nevertheless, Dana feels encouraged that her efforts helped level off the severity.
The slope of the annual severity (losses per claim) trend line is 1.09 per year—and
hence almost level as shown in the illustration in Figure 4.2 "Notable Notions Risk
Map". (See the Section 4.6 "Appendix: Forecasting" to this chapter for explanation
of the computation of the forecasting analysis.)
Capital Budgeting: Cost-Benefit Analysis for Loss-Control Efforts
With the ammunition of reducing the frequency of losses, Dana is planning to
continue her loss-control efforts. Her next step is to convince management to
invest in a new innovation in security belts for the employees. These belts have
proven records of reducing the severity of WC claim in other facilities. In this
example, we show her cost-benefit analysis—analysis that examines the cost of the
belts and compares the expense to the expected reduction in losses or savings in
premiums for insurance. If the benefit of cost reduction exceeds the expense for
the belt, Dana will be able to prove her point. In terms of the actual analysis, she
has to bring the future reduction in losses to today’s value of the dollar by looking at
the present value of the reduction in premiums. If the present value of premium
savings is greater than the cost of the belts, we will have a positive net present
value (NPV) and management will have a clear incentive to approve this loss-
control expense.
With the help of her broker, Dana plans to show her managers that, by lowering the
frequency and severity of losses, the workers’ compensation rates for insurance
can be lowered by as much as 20–25 percent. This 20–25 percent is actually a
true savings or benefit for the cost-benefit analysis. Dana undertook to conduct
cash flow analysis for purchasing the new innovative safety belts project. A cash
flow analysis looks at the amount of cash that will be saved and brings it into
today’s present value. Table 4.3 "Net Present Value (NPV) of Workers’
Compensation Premiums Savings for Energy Fitness Centers When Purchasing
Innovative Safety Belts for $50,000" provides the decrease in premium anticipated
when the belts are used as a loss-control technique.
13
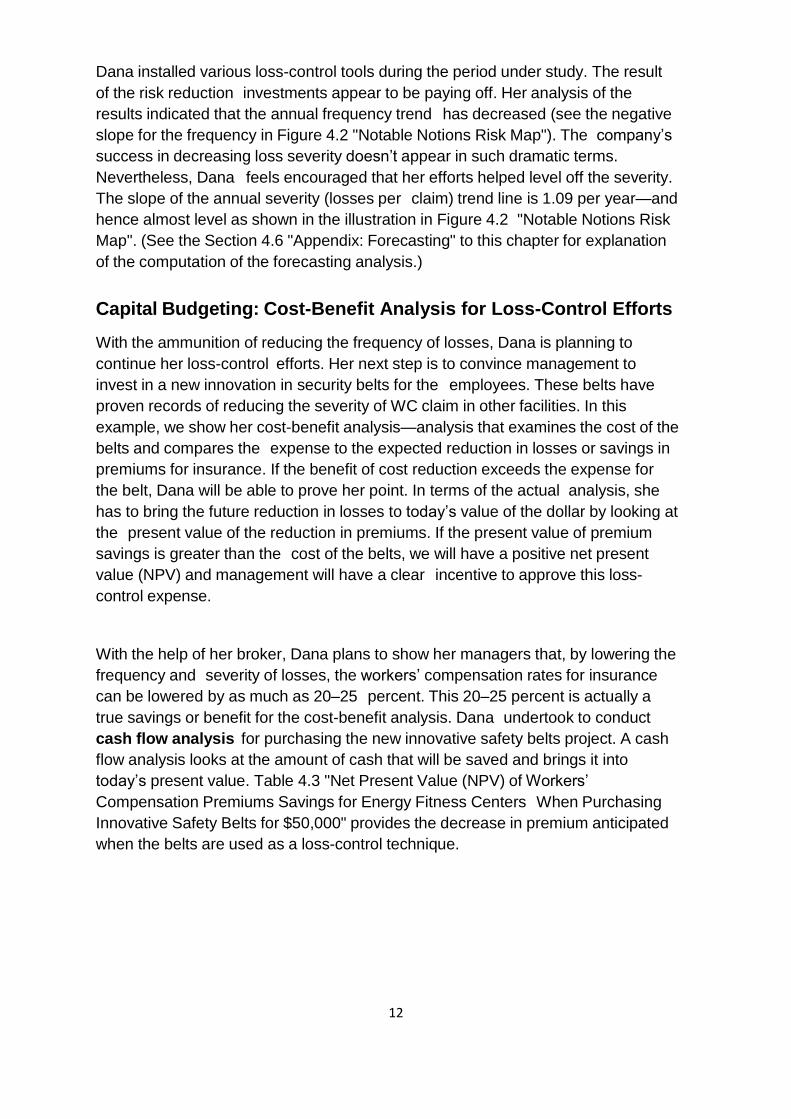
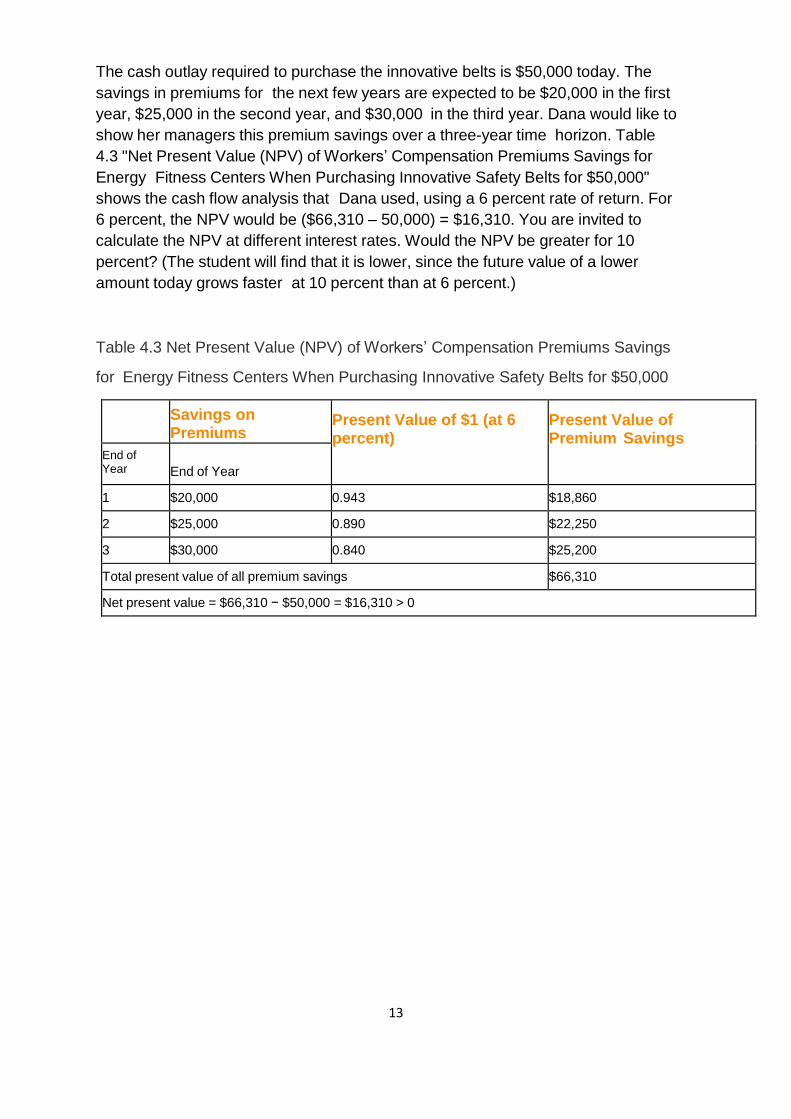
The cash outlay required to purchase the innovative belts is $50,000 today. The
savings in premiums for the next few years are expected to be $20,000 in the first
year, $25,000 in the second year, and $30,000 in the third year. Dana would like to
show her managers this premium savings over a three-year time horizon. Table
4.3 "Net Present Value (NPV) of Workers’ Compensation Premiums Savings for
Energy Fitness Centers When Purchasing Innovative Safety Belts for $50,000"
shows the cash flow analysis that Dana used, using a 6 percent rate of return. For
6 percent, the NPV would be ($66,310 – 50,000) = $16,310. You are invited to
calculate the NPV at different interest rates. Would the NPV be greater for 10
percent? (The student will find that it is lower, since the future value of a lower
amount today grows faster at 10 percent than at 6 percent.)
Table 4.3 Net Present Value (NPV) of Workers’ Compensation Premiums Savings
for Energy Fitness Centers When Purchasing Innovative Safety Belts for $50,000
Savings on Premiums
Present Value of $1 (at 6 percent)
Present Value of Premium Savings
End of Year
End of Year
1 $20,000 0.943 $18,860
2 $25,000 0.890 $22,250
3 $30,000 0.840 $25,200
Total present value of all premium savings $66,310
Net present value = $66,310 − $50,000 = $16,310 > 0

14
Module 2: The Fundamental Tools of Risk Management
Unit 5: The Risk Management Matrix
Case Study: The Risk Management Decision—Return
to the Example
Dana, the risk manager of Energy Fitness Centers, also uses a risk management
matrix to decide whether or not to recommend any additional loss-control devices.
Using the data in Table 4.3 "Net Present Value (NPV) of Workers’ Compensation
Premiums Savings for Energy Fitness Centers When Purchasing Innovative Safety
Belts for $50,000" and Figure 4.3 "Workers’ Compensation Frequency and Severity
of Energy Fitness Centers—Actual and Trended", Dana compared the forecasted
frequency and severity of the worker’s compensation results to the data of her peer
group that she obtained from the Risk and Insurance Management Society (RIMS)
and her broker. In comparison, her loss frequency is higher than the median for
similarly sized fitness centers. Yet, to her surprise, EFC’s risk severity is lower than
the median. Based on the risk management matrix she should suggest to
management that they retain some risks and use loss control as she already had
been doing. Her cost-benefit analysis from above helps reinforce her decision.
Therefore, with both cost-benefits analysis and the method of managing the risk
suggested by the matrix, she has enough ammunition to convince management to
agree to buy the additional belts as a method to reduce the losses.
An Introduction to Risk Management