table of contents - automotive logistics
TRANSCRIPT


2
Table of Contents
1. Executive Summary…………………………………………………………………………….…......6
2. Global Automotive Powertrain Forecast By Type 2020-2030…......................7Table 2.1 Global Automotive Powertrain Forecast by Type 2017-2030 (units million)
Figure 2.1 Global Automotive Powertrain Forecast by Type 2017-2030 (units million)
2.1 Global Powertrain Analysis
2.2 Global Petrol Vehicles (including 12V ‘micro-hybrid’) Forecast 2020-2030
Figure 2.2 Global Automotive Powertrain Forecast By Type 2020 (% share)
Figure 2.3 Global Automotive Powertrain Forecast By Type 2030 (% share)
Figure 2.4 Global Petrol Automotive Powertrain Forecast 2017-2030 (units million)
Figure 2.5 Regional Petrol Automotive Powertrain Penetration Forecast 2020 vs 2030 (% of Sales)
2.3 Global Diesel Vehicles (including 12V ‘micro-hybrid’) Forecast 2020-2030
Figure 2.6 Global Diesel Automotive Powertrain Forecast 2017-2030 (units million)
Figure 2.7 Regional Diesel Automotive Powertrain Penetration Forecast 2020 vs 2030 (% of Sales)
2.4 Global 48V Mild Hybrid Electric Vehicles (MHEV) Forecast 2020-2030
Table 2.2 Comparison of Different Levels of Hybridisation
Figure 2.8 Global Mild Hybrid Electric Vehicle (MHEV) Automotive Powertrain Forecast 2017-2030
(units million)
Figure 2.9 Regional Mild Hybrid Electric Vehicle Automotive Powertrain Penetration Forecast
2020 vs 2030 (% of Sales)
2.5 Global Hybrid Electric Vehicles (HEV) Forecast 2020-2030
Figure 2.10 Global Hybrid Electric Vehicle (HEV) Automotive Powertrain Forecast 2017-2030 (units
million)
Figure 2.11 Regional Hybrid Electric Vehicle Automotive Powertrain Penetration Forecast 2020 vs
2030 (% of Sales)
2.6 Global Plug-In Hybrid Electric Vehicles (PHEV) Forecast 2020-2030
Figure 2.12 Global Plug-In Hybrid Electric Vehicle (PHEV) Automotive Powertrain Forecast
2017-2030 (units million)
Figure 2.13 Regional Plug-In Hybrid Electric Vehicle Automotive Powertrain Penetration Forecast
2020 vs 2030 (% of Sales)
2.7 Global Electric Vehicles (EV) Forecast 2020-2030
Figure 2.14 Global Electric Vehicle (EV) Automotive Powertrain Forecast 2017-2030 (units million)
Figure 2.15 Regional Electric Vehicle Automotive Powertrain Penetration Forecast 2020 vs 2030
(% of Sales)
2.8 Global Fuel Cell Electric Vehicles (FCEV) Forecast 2020-2030
Figure 2.16 Global Fuel Cell Electric Vehicle (FCEV) Automotive Powertrain Forecast 2017-2030 (units million) Figure 2.17 Regional Fuel Cell Electric Vehicle Automotive Powertrain Penetration Forecast 2020 vs 2030 (% of Sales)

3
2.9 Global Natural Gas Vehicles (NGV) Forecast 2020-2030
Figure 2.18 Global Natural Gas Vehicle (NGV) Automotive Powertrain Forecast 2017-2030 (units
million)
Figure 2.19 Regional Natural Gas Vehicle Automotive Powertrain Penetration Forecast 2020 vs
2030 (% of Sales)
3. US Automotive Powertrain Forecast By Type 2020-2030…….……………………26Table 3.1 US Automotive Powertrain Forecast by Type 2017-2030 (units million)
Figure 3.1 US Automotive Powertrain Forecast by Type 2017-2030 (units million)
3.1 US Automotive Market Forecast 2020-2030
3.2 US Automotive Powertrain Analysis
Figure 3.2 Tesla Model 3 Electric Vehicle
Figure 3.3 Rivian R1T Electric Pick-Up Truck
4. Rest of North America Automotive Powertrain Forecast By Type 2020-
2030………………………………………………………………………………………………………………30Table 4.1 Rest of North America Automotive Powertrain Forecast by Type 2017-2030 (units
million)
Figure 4.1 Rest of North America Automotive Powertrain Forecast by Type 2017-2030 (units
million)
4.1 Rest of North America Automotive Forecast 2020-2030
4.2 Rest of North America Automotive Powertrain Analysis
5. Europe Automotive Powertrain Forecast By Type 2020-2030…………………..32Table 5.1 Europe Automotive Powertrain Forecast by Type 2017-2030 (units million)
Figure 5.1 Europe Automotive Powertrain Forecast by Type 2017-2030 (units million)
5.1 European Automotive Market Forecast 2020-2030
5.2 European Automotive Powertrain Analysis
5.3 European Emissions Regulations Are The Strictest In The World
6. China Automotive Powertrain Forecast By Type 2020-2030…..………………..35Table 6.1 China Automotive Powertrain Forecast by Type 2017-2030 (units million)
Figure 6.1 China Automotive Powertrain Forecast by Type 2017-2030 (units million)
6.1 China Automotive Market Forecast 2020-2030
6.2 China Automotive Powertrain Analysis
6.3 Tightening Regulatory Climate
6.4 Chinese EV Subsidies Being Phased Out

4
7. Japan Automotive Powertrain Forecast By Type 2020-2030………………...….38Table 7.1 Japan Automotive Powertrain Forecast by Type 2017-2030 (units million)
Figure 7.1 Japan Automotive Powertrain Forecast by Type 2017-2030 (units million)
7.1 Japan Automotive Market Forecast 2020-2030
7.2 Japan Automotive Powertrain Analysis
8. Rest of APAC & Oceania Automotive Powertrain Forecast By Type 2020-
2030…………………………………………………………………………….…………………………….….40Table 8.1 Rest of APAC & Oceania Automotive Powertrain Forecast by Type 2017-2030 (units
million)
Figure 8.1 Rest of APAC & Oceania Automotive Powertrain Forecast by Type 2017-2030 (units
million)
8.1 Rest of APAC & Oceania Automotive Market Forecast 2020-2030
8.2 Other Countries In The Region
8.3 Rest of APAC & Oceania Automotive Powertrain analysis
9. Central & South America Automotive Powertrain Forecast By Type 2020
-2030……………………………………………………………………………………………….…………..43Table 9.1 Central & South America Automotive Powertrain Forecast by Type 2017-2030 (units
million)
Figure 9.1 Central & South America Automotive Powertrain Forecast by Type 2017-2030 (units
million)
9.1 Central & South America Automotive Market Forecast 2020-2030
9.2 Central & South America Automotive Powertrain Analysis
9.3 Ethanol ‘Flex-Fuel’ Vehicles Penetration Uniquely High In Brazil
10. Middle East & Africa Automotive Powertrain Forecast By Type 2020-30….………………………………………………………….………….……………………………………..…46Table 10.1 Middle East & Africa Automotive Powertrain Forecast by Type 2017-2030 (units million)
Figure 10.1 Middle East & Africa Automotive Powertrain Forecast by Type 2017-2030 (units
million)
10.1 Middle East & Africa Automotive Market Forecast 2020-2030
10.2 Middle East & Africa Automotive Powertrain Analysis
11. Conclusion………………………………………………………………………………..……………..4811.1 Investment risk
11.2 Technological Risk
11.3 Opportunities Ahead For Suppliers, Start-ups and Synergies
12. Appendix……………………………………………………………..………………………………….51
5
Automotive from Ultima Media
Report by Daniel Harrison
Automotive Analyst
October 2019

6
1. Executive SummaryThe next decade will undoubtedly be a period of unprecedented transition for the automotive
industry, as it shifts from internal combustion engines (ICE) to hybrid and electric powertrains.
Over the next 10 years we expect a range of alternative powertrains to gain substantial market
share, growing in volume even as the global automotive market stagnates for the next 4-5 years. As
the total cost of ownership for electric vehicles moves towards parity with ICEs towards the middle
of the next decade, we then forecast a significant rise in electrification. By 2030, we expect that over
50% of powertrains globally will be electrified to some extent, from ‘mild’ hybrid (MHEV) to ‘full’
hybrid (HEV), fully electric vehicles (EV) and beyond to fuel cell electric vehicles (FCEV).
However, the speed of evolution and rate of adoption will vary from region to region according to
regulatory differences, purchase subsidies, fuel taxation policy, road pricing, state support (or lack
thereof) as well as consumer preferences. In regions such as Europe, China, Japan and South Korea,
strict regulations are likely to force OEMs to market more electrified options. Other key factors will
also influence powertrain evolution such as whether the necessary charging infrastructure is
developed, as well as differing geography and terrain. For example, the vast distances in countries
such as the US favour a very different vehicle and product mix to congested Asian or European cities.
These variations create challenges in investment for OEMs selling into these disparate markets, as
they struggle to reach economies of scale and ROI, especially relating to reducing battery costs.
There are indications that OEMs are also confusing consumers with the many different types of
alternative-propulsion powertrains coming onto the market. Unsure of what option is best for them,
consumers may continue to delay such purchases until the technological roadmap becomes more
certain. In our view, OEMs have work to do in communicating clearly with consumers and focusing
on which options will suit them and in which market, as these are not always the same. There are
also opportunities for OEMs to improve consumer awareness of the other benefits of EVs and
electrified powertrains, particularly around performance and lower running costs. For these reasons,
this report will provide definition and clarity on each powertrain type.
While the growth of electrified powertrains will be substantial, our forecast suggests that ICEs will
still play a substantial role, both as purely ICE and in hybridised powertrains. OEMs and tier suppliers
will continue to invest billions of dollars in developing and refining ICE technologies, even as
regulatory pressure in many regions push them to transition faster to EVs.
This report analyses and forecasts the automotive powertrain mix for each of the key regions and
explains the reasons for those differences. We also analyse the implications of this for OEMs and tier
suppliers and the risks and opportunities that this brings.
This report is the next in the series from Automotive from Ultima Media examining the business-critical issues facing the sector, providing insightful analysis of the industry and its prospects.
7
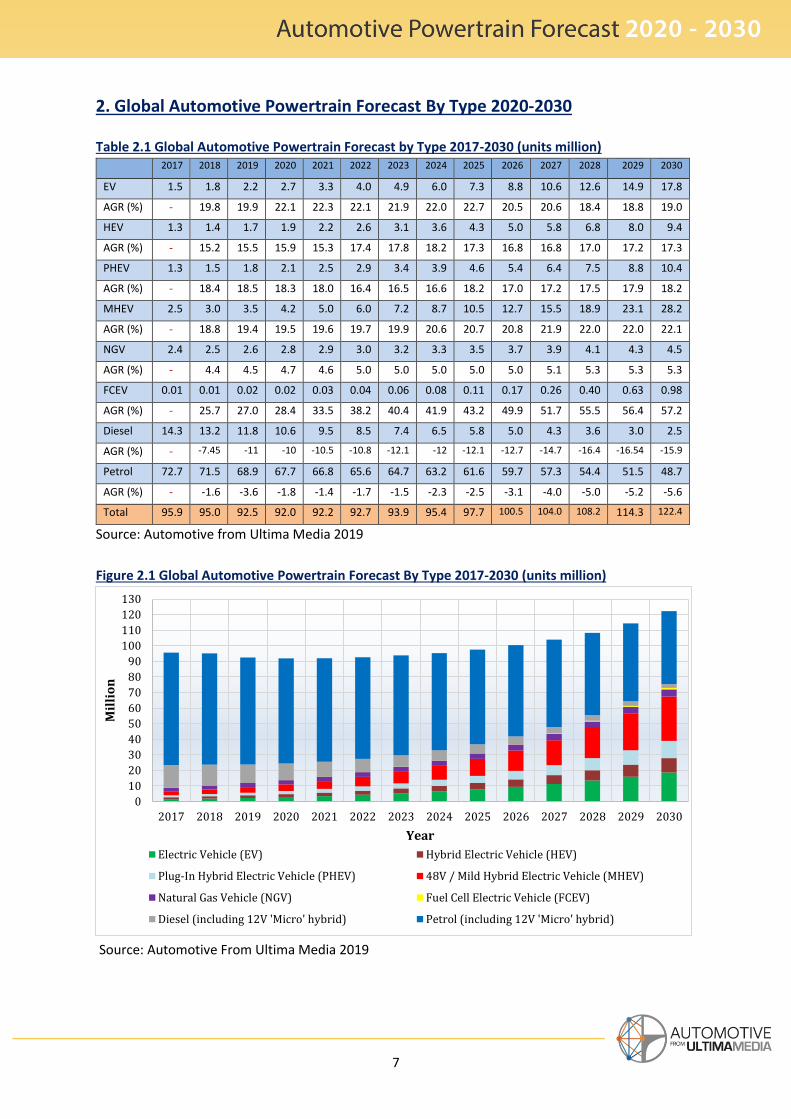
2. Global Automotive Powertrain Forecast By Type 2020-2030
Table 2.1 Global Automotive Powertrain Forecast by Type 2017-2030 (units million) 2017 2018 2019 2020 2021 2022 2023 2024 2025 2026 2027 2028 2029 2030
EV 1.5 1.8 2.2 2.7 3.3 4.0 4.9 6.0 7.3 8.8 10.6 12.6 14.9 17.8
AGR (%) - 19.8 19.9 22.1 22.3 22.1 21.9 22.0 22.7 20.5 20.6 18.4 18.8 19.0
HEV 1.3 1.4 1.7 1.9 2.2 2.6 3.1 3.6 4.3 5.0 5.8 6.8 8.0 9.4
AGR (%) - 15.2 15.5 15.9 15.3 17.4 17.8 18.2 17.3 16.8 16.8 17.0 17.2 17.3
PHEV 1.3 1.5 1.8 2.1 2.5 2.9 3.4 3.9 4.6 5.4 6.4 7.5 8.8 10.4
AGR (%) - 18.4 18.5 18.3 18.0 16.4 16.5 16.6 18.2 17.0 17.2 17.5 17.9 18.2
MHEV 2.5 3.0 3.5 4.2 5.0 6.0 7.2 8.7 10.5 12.7 15.5 18.9 23.1 28.2
AGR (%) - 18.8 19.4 19.5 19.6 19.7 19.9 20.6 20.7 20.8 21.9 22.0 22.0 22.1
NGV 2.4 2.5 2.6 2.8 2.9 3.0 3.2 3.3 3.5 3.7 3.9 4.1 4.3 4.5
AGR (%) - 4.4 4.5 4.7 4.6 5.0 5.0 5.0 5.0 5.0 5.1 5.3 5.3 5.3
FCEV 0.01 0.01 0.02 0.02 0.03 0.04 0.06 0.08 0.11 0.17 0.26 0.40 0.63 0.98
AGR (%) - 25.7 27.0 28.4 33.5 38.2 40.4 41.9 43.2 49.9 51.7 55.5 56.4 57.2
Diesel 14.3 13.2 11.8 10.6 9.5 8.5 7.4 6.5 5.8 5.0 4.3 3.6 3.0 2.5
AGR (%) - -7.45 -11 -10 -10.5 -10.8 -12.1 -12 -12.1 -12.7 -14.7 -16.4 -16.54 -15.9
Petrol 72.7 71.5 68.9 67.7 66.8 65.6 64.7 63.2 61.6 59.7 57.3 54.4 51.5 48.7
AGR (%) - -1.6 -3.6 -1.8 -1.4 -1.7 -1.5 -2.3 -2.5 -3.1 -4.0 -5.0 -5.2 -5.6
Total 95.9 95.0 92.5 92.0 92.2 92.7 93.9 95.4 97.7 100.5 104.0 108.2 114.3 122.4
Source: Automotive from Ultima Media 2019
Figure 2.1 Global Automotive Powertrain Forecast By Type 2017-2030 (units million)
Source: Automotive From Ultima Media 2019
0
10
20
30
40
50
60
70
80
90
100
110
120
130
2017 2018 2019 2020 2021 2022 2023 2024 2025 2026 2027 2028 2029 2030
Million
Year
Electric Vehicle (EV) Hybrid Electric Vehicle (HEV)
Plug-In Hybrid Electric Vehicle (PHEV) 48V / Mild Hybrid Electric Vehicle (MHEV)
Natural Gas Vehicle (NGV) Fuel Cell Electric Vehicle (FCEV)
Diesel (including 12V 'Micro' hybrid) Petrol (including 12V 'Micro' hybrid)

8
Market definition: Market data includes both passenger vehicles and commercial vehicle sales.
Historical data for 2017 and 2018 is based on official OICA published sales data. All regional forecasts
and powertrain segment forecasts are derived from Ultima Media research and analysis.
After a sharp contraction of automotive sales in the first half of 2019, we predict a slight recovery in
the second half of the year. However, along with a 2.7% decline for global sales in 2019, our outlook
for 2020 and 2021 is still negative, while we don’t expect sales volume to surpass 2017 highs until
after 2025 (see Figure 1). That is around the time we expect EVs to achieve price parity with ICE
technologies (at least in the EU, while in North America, due to less regulatory pressure, it is likely to
come later around 2028). By then we also expect the global macroeconomic climate to have
improved, with increasing population growth and rising middle classes in emerging markets
counteracting the stagnating or falling demand in western markets.
Thanks to the convergence of global economic recovery and regulatory drivers together with falling
costs in electric battery powertrains in the next decade, we expect strong growth in a variety of
electrified powertrains.
*For more details on the tough automotive industry outlook, please see our report Automotive headwinds align into a perfect storm
2.1 Global Powertrain Analysis
For 100 years or so, the consumer essentially had one powertrain choice: a petrol engine, with the
relatively recent introduction in some regions of diesel. That binary choice of diesel vs. petrol has
now multiplied with up to eight powertrains choices and a whole spectrum of hybridisation in
between. Consumer confusion is understandable, and the automotive industry is not doing very well
at communicating this industry transition en masse to electrification.
Part of the problem is the profusion of sometimes misleading terminologies, which can overwhelm
the consumer with baffling words and phrases. For example, the term ‘micro hybrid’ is misleading in
that it usually amounts to just a ‘stop-start’ technology and does not include any powertrain
hybridisation or propulsion from an electric motor. In terms of being a ‘hybrid’, It is purely marketing
hype. The confusion is not just a question of semantics. Part of the reason for a fall in sales may well
be that consumers are holding off on major new car purchases and waiting for the range of available
technologies to mature and the roadmap to full electrification to become clearer. The lack of a
charging infrastructure or any sort of public/private coordinated strategy to rollout a charging
infrastructure also leaves consumers reluctant to make the leap to an electric future.

9
To demonstrate how transformative the next decade will be for the automotive industry, please see
Figure 2.2 and Figure 2.3 which quantifies the powertrain penetration percentage share in 2020 and
in 2030, including dramatic global increases across virtually all electrified powertrains.
Figure 2.2 Global Automotive Powertrain Forecast By Type 2020 (% share)
Source: Automotive From Ultima Media 2019
Figure 2.3 Global Automotive Powertrain Forecast By Type 2030 (% share)
Source: Automotive From Ultima Media 2019
Not only will this transition be demanding upon OEMs, the regional divergence in regulatory drivers
compelling OEMs towards electrification will create challenges for manufacturing, supply chains and
distribution channels. For example, much faster EV adoption rates in EU and China compared to
those in the US will make the return on return for investment in developing these technologies much
more challenging than if it were a fully global transformation. The powertrain type and regional
analysis that follows quantifies and analyses these regional differences.
2.9% 2.1% 2.3%4.6%
3.0%
0.0%
11.5%
73.6%
EV HEV PHEV MHEV NGV FCEV Diesel Petrol
14.5%
7.6%
8.5%
23.0%
3.7%0.8%
2.1%
39.7%
EV HEV PHEV MHEV NGV FCEV Diesel Petrol
10
2.2 Global Petrol Vehicles (Including 12V ‘Micro-Hybrid’) Automotive Powertrain Forecast 2020-
2030
Petrol powertrains are expected to sell 68.9m units in 2019. We forecast that this will decrease to
67.7m units in 2020 and continue falling to 48.7m units in 2030 with a -3.3% CAGR. Petrol
powertrains remain the cash cow for most OEMs, and we predict that despite the strong push to
hybrid and EV powertrains, around 40% of vehicles will still have a purely petrol ICE powertrain in
2030.
However, to help meet emission regulations, petrol vehicles are increasingly being fitted with 12V
‘micro-hybrid’ systems. ‘Micro hybrid’ is a misnomer as such powertrains are usually just stop-start
systems for when vehicles are idling; they do not provide any electric power assist and are not
technically a ‘hybrid’ (see section 2.4). The attractiveness of micro-hybrid systems, however, is that
the technology can achieve meaningful fuel economy savings of ~5% across the entire product range
and do so at fairly minimal costs per vehicle.
However, increasingly these micro hybrids also have slightly enhanced batteries and perform some
regenerative braking, which allows power assistance during acceleration and slightly more
improvements in fuel economy. Such technology demonstrates that, even though petrol engines are
being gradually phased out, OEMs will continue to invest and develop them.
Nevertheless, the overall decline of pure petrol engines is clear over the forecast period. The
introduction of the next Euro 7 standard in the EU will make petrol engines more expensive, whilst
fully electric powertrains are becoming more cost competitive due to falling battery prices. We
expect price parity between ICE vs. EV powertrains to be achieved around 2023 and 2025 in the EU.
11
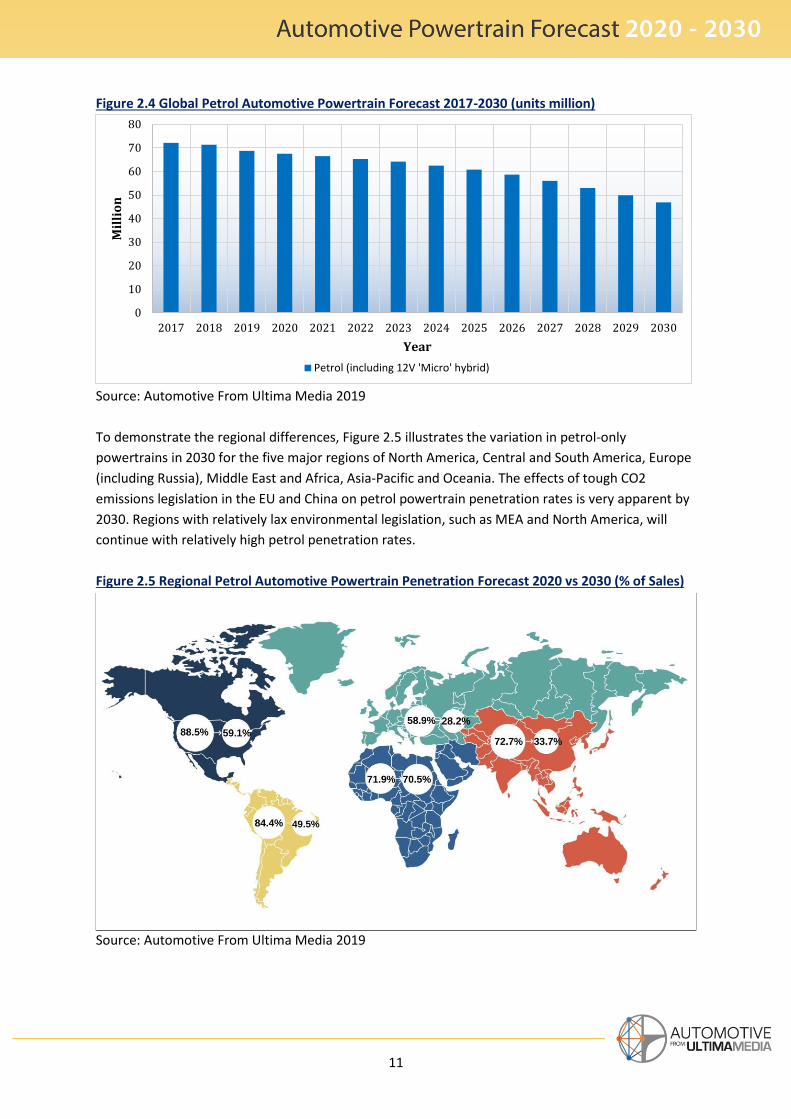
Figure 2.4 Global Petrol Automotive Powertrain Forecast 2017-2030 (units million)
Source: Automotive From Ultima Media 2019
To demonstrate the regional differences, Figure 2.5 illustrates the variation in petrol-only
powertrains in 2030 for the five major regions of North America, Central and South America, Europe
(including Russia), Middle East and Africa, Asia-Pacific and Oceania. The effects of tough CO2
emissions legislation in the EU and China on petrol powertrain penetration rates is very apparent by
2030. Regions with relatively lax environmental legislation, such as MEA and North America, will
continue with relatively high petrol penetration rates.
Figure 2.5 Regional Petrol Automotive Powertrain Penetration Forecast 2020 vs 2030 (% of Sales)
Source: Automotive From Ultima Media 2019
0
10
20
30
40
50
60
70
80
2017 2018 2019 2020 2021 2022 2023 2024 2025 2026 2027 2028 2029 2030
Million
Year
Petrol (including 12V 'Micro' hybrid)

12
2.3 Global Diesel Powertrain (Including 12V ‘Micro-Hybrid’) Automotive Powertrain Forecast 2020-
2030
Diesel powertrains are quantified as selling 11.8m units in 2019. We forecast that this will decrease
to 10.6m units in 2020 and continue falling to 2.5m units in 2030 with a -13.4% CAGR.
Diesel powertrains are being rapidly phased out in most regions due to the powertrain being
implicated in many health conditions related to high particulate and NoX emissions. We expect that
over time the only major remaining use of diesels will be for larger commercial, industrial and
construction vehicles, where hybrid or electric powertrains are less viable.
Some diesel vehicles are being fitted with 12V micro-hybrid systems to achieve modest fuel
efficiency increases at a reasonably low cost. However, we expect pure diesel vehicles to play an
increasingly small role in future powertrain mixes.
Figure 2.6 Global Diesel Automotive Powertrain Forecast 2017-2030 (units million)
Source: Automotive From Ultima Media 2019
0
2
4
6
8
10
12
14
16
2017 2018 2019 2020 2021 2022 2023 2024 2025 2026 2027 2028 2029 2030
Million
Year
Diesel (including 12V 'Micro' hybrid)

13
To illustrate the regional differences, Figure 2.7 displays the variation in diesel-only powertrains in
2030 for the five major regions of North America, Central and South America, Europe, Middle East
and Africa, Asia-Pacific and Oceania. Although 56% of EU vehicle sales in 2011 were diesel, due to
the complete reversal in policy of encouraging diesels, we expect this EU diesel penetration rate to
fall drastically by 2030 and to align more closely with other regions, where diesels are used mainly
for commercial and heavy goods vehicles (see section 5).
Figure 2.7 Regional Diesel Automotive Powertrain Penetration Forecast 2020 vs 2030 (% of Sales)
Source: Automotive From Ultima Media 2019

14
2.4 Global 48V Mild Hybrid Electric Vehicles Automotive Powertrain Forecast 2020-2030
In our forecast window, 48V mild hybrid electric vehicle (MHEV) powertrains are quantified as selling
3.5m units in 2019. We expect that this will increase to 4.2m units in 2020 and dramatically rise to
28.2m units in 2030, with a 20.9% CAGR, thanks in parts to the lower costs to implement them and
the ability to use them within existing infrastructure.
Hybridisation is a spectrum of electrification, so it is helpful to understand the features that define
the different categories of ‘hybrids’. In our forecast, 48V MHEV powertrains refer to a moderate
form of hybridisation with a modest size battery that provides some improvements in fuel economy
without the high costs associated with ‘full’ hybridisation. Most mild hybrid electric vehicles now use
48-volt battery systems, a higher voltage used in this type of hybrid that allows more power from
the electric motor (most cars traditionally have a 12V battery/electrical system).
Table 2.2 Comparison of Different Levels of Hybridisation
Type Start-stop
systems
Regenerative braking
Electric propulsion
Charge-
depleting
Rechargeable Fuel efficiency
gain
12V ‘Micro
hybrid’
Yes No No No 5%
48V MHEV Yes Yes No No 5% - 15%
HEV Yes Yes Yes No 25%-34%
PHEV Yes Yes Yes Yes 50%- 70%
Source: Automotive From Ultima Media 2019
* ‘Micro hybrids’ is a widely used terminology for ‘start-stop’ systems but is not actually a hybrid.
This higher voltage allows more powerful hybrid system to power the car for a higher percentage of
the time, improving fuel efficiency over a 12V ‘micro-hybrid’ system, but at a much lower costs to
implement compared to ‘full hybrids’ that effectively require two powertrain systems
simultaneously (see section 2.5). Mild hybrids can be applied more efficiently to some or all of an
OEM’s petrol and diesel engine vehicle fleet, which is why we expect such dramatic growth over the
coming decade.

15
Figure 2.8 Global Mild Hybrid Electric Vehicle Automotive Powertrain Forecast 2017-2030 (units million)
Source: Automotive From Ultima Media 2019
To demonstrate the regional differences, Figure 2.9 illustrates the variation in MHEV powertrains in
2030 for the five major regions of North America, Central and South America, Europe, MEA, Asia-
Pacific and Oceania. In 2030, MHEV penetration rates will correlate strongly to emissions regulations
in the respective regions, in particular the EU and China, where MHEVs are thought to be an
affordable way to meet escalating CO2 emission targets.
Figure 2.9 Regional Mild Hybrid Electric Vehicle Automotive Powertrain Penetration Forecast 2020
vs 2030 (% of Sales)
Source: Automotive From Ultima Media 2019
0
5
10
15
20
25
30
2017 2018 2019 2020 2021 2022 2023 2024 2025 2026 2027 2028 2029 2030
Million
Year
48V / Mild Hybrid Electric Vehicle (MHEV)

16
2.5 Global Hybrid Electric Vehicles Automotive Powertrain Forecast 2020-2030 Hybrid electric vehicle (HEV) powertrains are quantified as selling 1.7m units in 2019. We forecast
that this will increase to 1.9m units in 2020 and rise to 9.2m units in 2030 with a 16.9% CAGR.
HEV – which is also referred to as a ‘full hybrid’ – uses a downsized, internal combustion engine
supplemented with a moderate electric motor and battery powerful enough to operate in fully
electric mode when it is typically driving below 30mph. At higher speeds, the electric motor provides
extra power, for example when accelerating. Importantly, when the engine is in operation, it
recharges and replenishes the battery (in addition to regenerative braking). Therefore, an HEV is
self-sufficient in that the battery pack does not need charging by the user.
There are two main types of such hybrids: parallel and series hybrids. In a parallel hybrid, both the
electric motor and the internal combustion engine are both connected to the transmission and work
in parallel to power the vehicle. Electronics control whether just the petrol engine and/or the
electric motor are switched on.
In a series hybrid, the electric motor is all that is connected to the wheels providing traction. The
electric motor is charged by the battery pack or by the generator, which is powered by the internal
combustion engine. The engine is not connected to the wheels and does not directly power the car.
Electronics determine how much power is needed to propel the vehicle and decide whether to
obtain it from the battery and/or the generator.
Whilst we see strong growth in HEV, there are high costs associated with ‘full hybrids’, because in
effect the vehicle has two separate powertrains with all of the costs and complexity that this
involves. Therefore, we foresee higher growth in other forms of hybrid, such as mild hybrid electric
vehicles (see section 2.4), which achieve fuel economy savings at a much lower cost than full
hybrids. Nevertheless, we still expect full hybrid powertrains to grow rapidly.

17
Figure 2.10 Global Hybrid Electric Vehicle Automotive Powertrain Forecast 2017-2030 (units
million)
Source: Automotive From Ultima Media 2019
To illustrate the regional differences, Figure 2.11 shows the variation in hybrid electric vehicle
powertrains in 2030 for the five major regions of North America, Central and South America, Europe,
MEA, Asia-Pacific and Oceania. The relatively low figures for hybrids in the EU and APAC may be a
surprise. This is because a high percentage of hybrids in this region will be in the mild hybrid and
plug-in hybrid (see section 2.6) categories, rather than being ‘full’ hybrids. The relatively high
penetration rate in North America for HEV is due to the long distances in the US and Canada, and the
lack of charging infrastructure, with consumers therefore favouring full hybrids.
Figure 2.11 Regional Hybrid Electric Vehicle Automotive Powertrain Penetration Forecast 2020 vs
2030 (% of Sales)
Source: Automotive From Ultima Media 2019
0
2
4
6
8
10
2017 2018 2019 2020 2021 2022 2023 2024 2025 2026 2027 2028 2029 2030
Million
YearHybrid Electric Vehicle (HEV)

18
2.6 Global Plug-In Hybrid Electric Vehicles Automotive Powertrain Forecast 2020-2030
Plug-in hybrid electric vehicle (PHEV) powertrains are expected to sell 1.8m units in 2019. We
forecast this will increase to 2.1m units in 2020 and reach 10.4m units in 2030 with a 17.3% CAGR.
PHEVs are similar to full hybrids but usually have a larger battery pack that can also be plugged in for
recharging like a fully electric vehicle. This allows greater use of the electric-only mode and less
dependence on the ICE. So, in essence, a PHEV is between an HEV and a full EV in terms of fuel
economy, often achieving emissions below 50g CO2 per km.
PHEVs can operate very flexibly according to the availability of electricity and this will make them
increasingly attractive compared to full electric vehicles. As a result, we expect PHEVs to grow in
popularity and actually overtake full hybrid electric vehicles. The higher cost to develop and adapt
vehicles to PHEVs, however, means that they will not achieve as high a market share as MHEVs in
the forecast window (see section 2.4). We do, however, expect that their flexibility and low
emissions will help them grow faster and surpass volumes of full hybrid vehicles (see section 2.5).
Figure 2.12 Global Plug-In Hybrid Electric Vehicle Automotive Powertrain Forecast 2017-2030
(units million)
Source: Automotive From Ultima Media 2019
0
2
4
6
8
10
12
2017 2018 2019 2020 2021 2022 2023 2024 2025 2026 2027 2028 2029 2030
Million
Year
Plug-In Hybrid Electric Vehicle (PHEV)

19
To demonstrate the regional differences, Figure 2.13 reveals the variation in plug-in hybrid electric
vehicle powertrains in 2030 for the five major regions of North America, Central and South America,
Europe, MEA, Asia-Pacific and Oceania. The outlook for PHEVs is largely dependent upon the specific
tax incentives in the respective regions, especially in regard to whether PHEVs are categorised below
the 50g CO2/km threshold and regarded as ultra-low emission vehicles (ULEZ), with exemptions
from various taxes and emission zones similar to fully electric vehicles.
Figure 2.13 Regional Plug-In Hybrid Electric Vehicle Automotive Powertrain Penetration Forecast
2020 vs 2030 (% of Sales)
Source: Automotive From Ultima Media 2019

20
2.7 Global Electric Vehicles Automotive Powertrain Forecast 2020-2030
Electric vehicle (EV) powertrains are expected to sell 2.2m units in 2019. We forecast that this will
increase to 2.7m units in 2020 and strongly increase to 17.8m units in 2030 with a 20.8% CAGR. This
amounts to nearly 15% of all vehicles sold by 2030.
Electric vehicles are also called fully electric vehicles, battery electric vehicles (BEV), zero emissions
vehicle (ZEV), or ultra-low emission vehicle (ULEZ), terminology which, together with degrees of
hybridisation, is likely confusing some consumers. EVs rely entirely upon an electric motor and
battery pack, producing zero emissions at the tailpipe.
The important point to understand about EVs is that it is primarily regulations, especially in the EU
and China, driving the wider investment shift, rather than consumer demand and, more pertinently,
before there is a clear business case or a clear path to profitability for OEMs who make and sell
them. EV battery packs add $10,000-$12,000 for an average size vehicle, significantly increasing the
purchase price and adding a premium that most consumers are so far unwilling to pay. It’s notable
that Tesla, the only major electric-only OEM, has yet to make any meaningful profit.
Despite government purchase subsidies in many regions, OEMs are often being forced to sell EVs at
cost or even below cost price, which is squeezing margins and affecting profits at a crucial time when
manufacturers are expected to invest heavily to develop EVs and low emission technology. Battery
prices are currently around $180-200 per KwH. Many commentators believe that the crucial tipping
point at which EVs achieve price parity with ICE vehicles will be when battery prices drop to the
symbolic $100/KwH. We expect that level to be attained, at least in Europe, around 2023–2025, at
which point the total cost of ownership of an EV will be cheaper than an ICE vehicle, including lower
road tax, lower running costs, lower services and maintenance costs.
Along with a higher purchase prices, other constraints for consumers in buying EVs today include
performance concerns and range anxiety combined with a lack of charging infrastructure and long
charging times. As battery prices reduce, and charging technology improves, most of these concerns
will fade, too. Indeed, other benefits of EVs are also likely to permeate public consciousness and lead
to widespread adoption, including their quietness, reliability, low maintenance and running costs.
Further out, synergies between autonomous vehicle and electric vehicle development could
accelerate EVs further – however, the impact of this development is likely to occur beyond our
forecast window.

21
Figure 2.14 Global Electric Vehicle Automotive Powertrain Forecast 2017-2030 (units million)
Source: Automotive From Ultima Media 2019
To demonstrate the regional differences, Figure 2.15 illustrates the variation in EV powertrains in
2030 for the five major regions. In 2030, the high EV penetration rates are clearly correlated to those
regions with the toughest CO2 emission regimes, especially the EU and China.
Figure 2.15 Regional Electric Vehicle Automotive Powertrain Penetration Forecast 2020 vs 2030 (%
of Sales)
Source: Automotive From Ultima Media 2019
0
2
4
6
8
10
12
14
16
18
2017 2018 2019 2020 2021 2022 2023 2024 2025 2026 2027 2028 2029 2030
Million
Year
Electric Vehicle (EV)

22
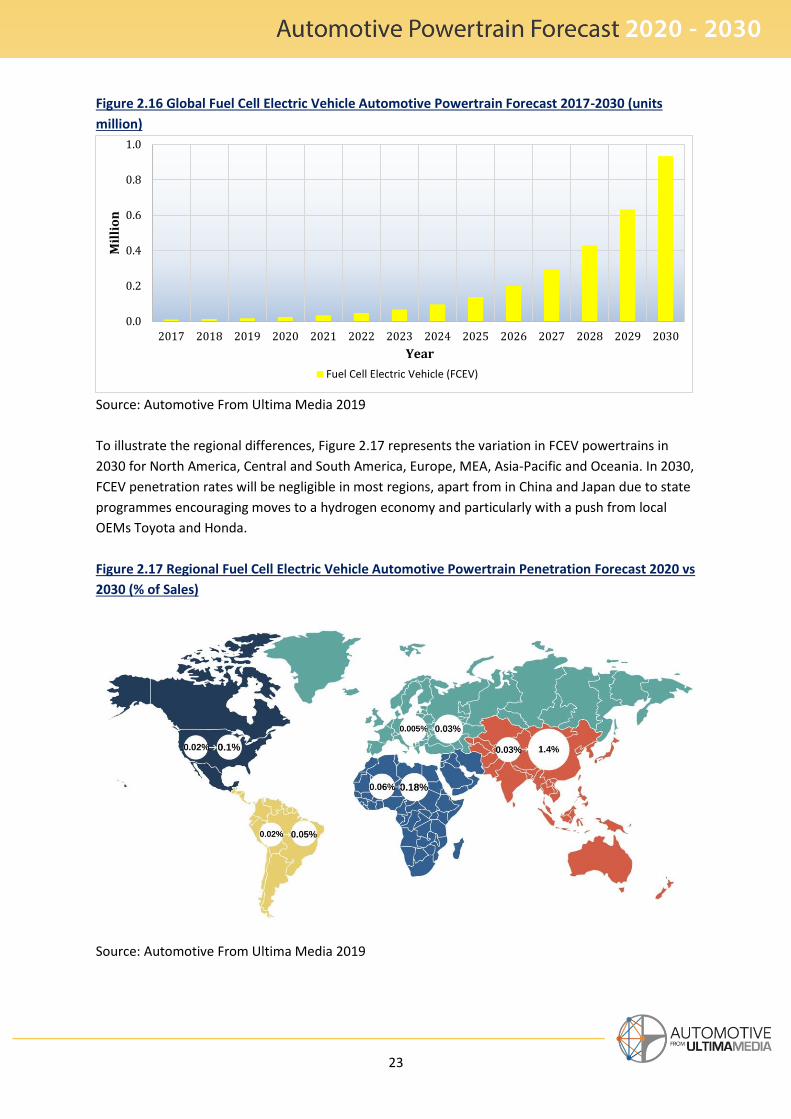
2.8 Global Fuel Cell Electric Vehicles Automotive Powertrain Forecast 2020-2030
Fuel Cell Electric Vehicle (FCEV) powertrains are quantified as selling 17,000 units in 2019. We
forecast that this will increase to 22,000 units in 2020 and reach 984,000 units in 2030 with a 46.6%
CAGR. This amounts to less than 1% of all vehicles sold by 2030, so we do not foresee significant
penetration. Fuel cell electric vehicles are also known as hydrogen vehicles or fuel cell vehicles, and
likewise fall under the label zero emissions vehicle – yet another example of the terminology
creating consumer confusion.
In essence, fuel cell technology combines pure hydrogen and oxygen from the air to produce
electricity that can drive an electric motor. The only by-product of the process is water, and
therefore it is deemed to be the most environmentally friendly vehicle (as long as the hydrogen can
be produced from a renewable source). It is a form of electric vehicle, but instead of a battery pack
that can be recharged, it has a large hydrogen tank – and therein lies one of the problems.
FCEVs face three main technological challenges in achieving a higher market share:
The energy density of hydrogen is actually very low (hence why the gas is the lightest element on
the periodic table). To provide a significant amount of energy, a tank must be compressed to very
high pressure. This process makes such tanks expensive to make, while increasing the risks of
explosion, and other refuelling challenges.
The purchase price of hydrogen vehicles still costs around $100,000, primarily due to the cost of
manufacturing the fuel cell unit and the high-pressure hydrogen fuel tank.
There is a lack of hydrogen-refuelling infrastructure. This would be very expensive to rollout as a
national infrastructure for consumers. The cost of delivering hydrogen to these sites, and/or
generating hydrogen on site (e.g. with solar panels) means that there are always likely to be real
world challenges that keep refuelling costs higher than other fuels. For the foreseeable future,
the economics for passenger car use of hydrogen doesn’t add up compared with EVs.
Nonetheless, several major OEMs, most notably Honda and Toyota, are investing in developing FCEV
technologies, as they are regarded as the holy grail of true zero emission vehicles. China and Japan
have government programmes to encourage the development of the hydrogen economy and FCEV.
Unless there is a major technological breakthrough to overcome cost and supply challenges, we
don’t foresee significant sales volumes of FCEV passenger cars. Instead, the main opportunity for
FCEV will be within commercial vehicles, trucks, buses and especially in heavy goods vehicles.
There are a number of reasons why hydrogen is better suited to larger commercial vehicles. Trying
to electrify heavy trucks is unviable due to the size and weight of battery required, reducing the
freight capacity. The roundtrip nature of many commercial fleets also means that having only a few
isolated hydrogen refuelling stations (perhaps converted truck filling stations) becomes more
realistic. The potential slow refuelling time for hydrogen also makes more sense for journeys over
longer distances.
23
Figure 2.16 Global Fuel Cell Electric Vehicle Automotive Powertrain Forecast 2017-2030 (units
million)
Source: Automotive From Ultima Media 2019
To illustrate the regional differences, Figure 2.17 represents the variation in FCEV powertrains in
2030 for North America, Central and South America, Europe, MEA, Asia-Pacific and Oceania. In 2030,
FCEV penetration rates will be negligible in most regions, apart from in China and Japan due to state
programmes encouraging moves to a hydrogen economy and particularly with a push from local
OEMs Toyota and Honda.
Figure 2.17 Regional Fuel Cell Electric Vehicle Automotive Powertrain Penetration Forecast 2020 vs
2030 (% of Sales)
Source: Automotive From Ultima Media 2019
0.0
0.2
0.4
0.6
0.8
1.0
2017 2018 2019 2020 2021 2022 2023 2024 2025 2026 2027 2028 2029 2030
Million
Year
Fuel Cell Electric Vehicle (FCEV)

24
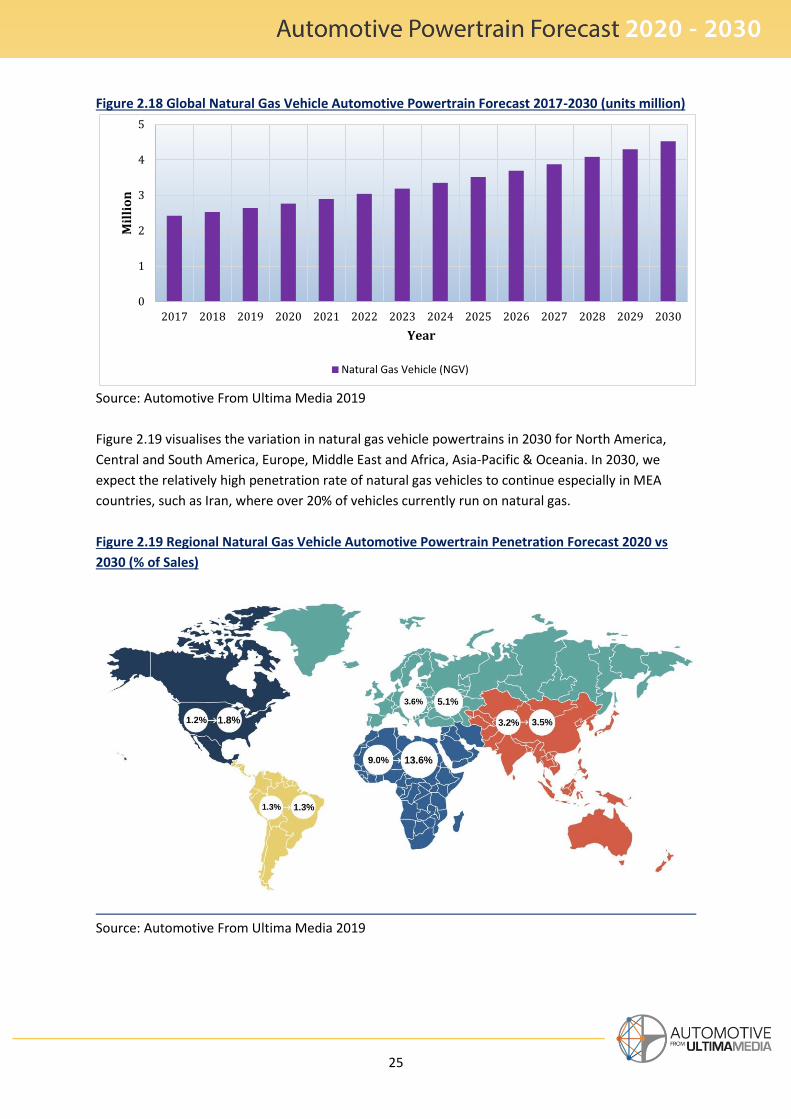
2.9 Global Natural Gas Vehicles Automotive Powertrain Forecast 2020-2030
Natural Gas Vehicles (NGV) powertrains are quantified as selling 2.6m units in 2019. We forecast
that this will increase to 2.8m units in 2020 and to 4.5m units in 2030 with a 15% CAGR. This
amounts to less than 4% of all vehicles sold by 2030.
Natural gas vehicles are a relatively niche powertrain type which only really has any significant
penetration levels in a few markets such as Iran, India and Pakistan, and mainly for commercial
applications. We expect the higher penetration rate of natural gas vehicles in these regions to be
maintained over the forecast period thanks to established infrastructure and consumer acceptance.
Although natural gas vehicles burn quite cleanly compared to petrol or diesel, they are still reliant
upon fossil fuels. Like all other carbon-based fuels, they emit CO2 and will ultimately have to be
phased out, which is why we only see modest growth for NGVs.
Part of the reason that natural gas vehicles, despite their benefits, have not achieved mass-market
adoption rates beyond commercial vehicles is down mainly to infrastructure for refuelling.
However, confusion over different types of ‘gas’ vehicle may also be an issue. There are three main
types of gas vehicle: compressed natural gas (CNG) where the (mainly methane) gas is pressurised in
a tank, requiring less than 1% of the original space.
There is liquefied natural gas (LNG) where the (methane) gas is cooled to −162 °C and condensed
into a liquid state requiring only about 1/600 of the original space so more fuel energy can be stored.
But these are not to be confused with a third type of gas called liquefied petroleum gas (LPG), which
is technically not a natural gas as it is a mixture of propane/butane – a by-product of the petroleum
refining process. LPG is often confusingly referred to as ‘autogas’, as it is not derived from natural
gas as CNG and LNG are. It is no wonder that consumers are left confused.
25
Figure 2.18 Global Natural Gas Vehicle Automotive Powertrain Forecast 2017-2030 (units million)
Source: Automotive From Ultima Media 2019
Figure 2.19 visualises the variation in natural gas vehicle powertrains in 2030 for North America,
Central and South America, Europe, Middle East and Africa, Asia-Pacific & Oceania. In 2030, we
expect the relatively high penetration rate of natural gas vehicles to continue especially in MEA
countries, such as Iran, where over 20% of vehicles currently run on natural gas.
Figure 2.19 Regional Natural Gas Vehicle Automotive Powertrain Penetration Forecast 2020 vs
2030 (% of Sales)
Source: Automotive From Ultima Media 2019
0
1
2
3
4
5
2017 2018 2019 2020 2021 2022 2023 2024 2025 2026 2027 2028 2029 2030
Million
Year
Natural Gas Vehicle (NGV)
26
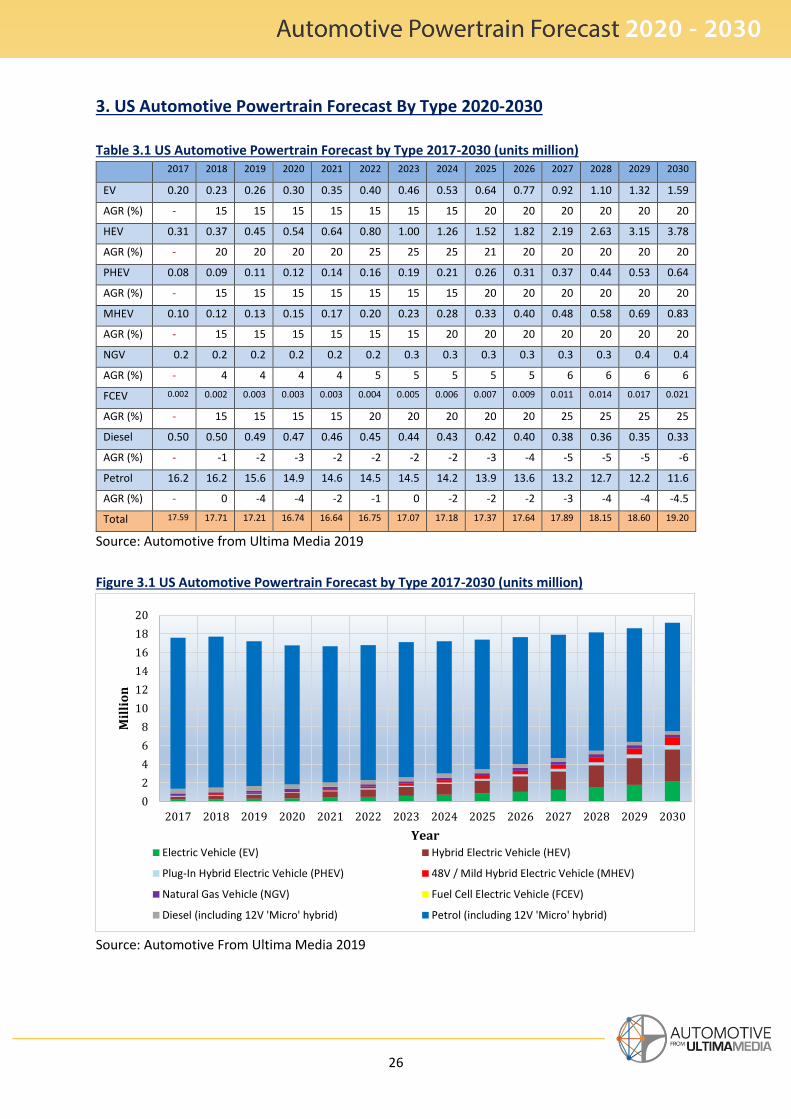
3. US Automotive Powertrain Forecast By Type 2020-2030
Table 3.1 US Automotive Powertrain Forecast by Type 2017-2030 (units million) 2017 2018 2019 2020 2021 2022 2023 2024 2025 2026 2027 2028 2029 2030
EV 0.20 0.23 0.26 0.30 0.35 0.40 0.46 0.53 0.64 0.77 0.92 1.10 1.32 1.59
AGR (%) - 15 15 15 15 15 15 15 20 20 20 20 20 20
HEV 0.31 0.37 0.45 0.54 0.64 0.80 1.00 1.26 1.52 1.82 2.19 2.63 3.15 3.78
AGR (%) - 20 20 20 20 25 25 25 21 20 20 20 20 20
PHEV 0.08 0.09 0.11 0.12 0.14 0.16 0.19 0.21 0.26 0.31 0.37 0.44 0.53 0.64
AGR (%) - 15 15 15 15 15 15 15 20 20 20 20 20 20
MHEV 0.10 0.12 0.13 0.15 0.17 0.20 0.23 0.28 0.33 0.40 0.48 0.58 0.69 0.83
AGR (%) - 15 15 15 15 15 15 20 20 20 20 20 20 20
NGV 0.2 0.2 0.2 0.2 0.2 0.2 0.3 0.3 0.3 0.3 0.3 0.3 0.4 0.4
AGR (%) - 4 4 4 4 5 5 5 5 5 6 6 6 6
FCEV 0.002 0.002 0.003 0.003 0.003 0.004 0.005 0.006 0.007 0.009 0.011 0.014 0.017 0.021
AGR (%) - 15 15 15 15 20 20 20 20 20 25 25 25 25
Diesel 0.50 0.50 0.49 0.47 0.46 0.45 0.44 0.43 0.42 0.40 0.38 0.36 0.35 0.33
AGR (%) - -1 -2 -3 -2 -2 -2 -2 -3 -4 -5 -5 -5 -6
Petrol 16.2 16.2 15.6 14.9 14.6 14.5 14.5 14.2 13.9 13.6 13.2 12.7 12.2 11.6
AGR (%) - 0 -4 -4 -2 -1 0 -2 -2 -2 -3 -4 -4 -4.5
Total 17.59 17.71 17.21 16.74 16.64 16.75 17.07 17.18 17.37 17.64 17.89 18.15 18.60 19.20
Source: Automotive from Ultima Media 2019
Figure 3.1 US Automotive Powertrain Forecast by Type 2017-2030 (units million)
Source: Automotive From Ultima Media 2019
0
2
4
6
8
10
12
14
16
18
20
2017 2018 2019 2020 2021 2022 2023 2024 2025 2026 2027 2028 2029 2030
Million
YearElectric Vehicle (EV) Hybrid Electric Vehicle (HEV)
Plug-In Hybrid Electric Vehicle (PHEV) 48V / Mild Hybrid Electric Vehicle (MHEV)
Natural Gas Vehicle (NGV) Fuel Cell Electric Vehicle (FCEV)
Diesel (including 12V 'Micro' hybrid) Petrol (including 12V 'Micro' hybrid)
27
3.1 US Automotive Market Forecast 2020-2030
The US has been one of the few regions where overall sales of passenger and commercial vehicle
volumes have held up relatively well at 17.7m units in 2018; this year has seen a small decline. But,
like other regions, the US is starting to feel the effects of global economic headwinds. And the
consensus view on US GDP growth is that it will remain low at 1.5-2% over the next five years, while
with indications of a potential recession occurring over that timeline.
Slower growth will impact consumer confidence especially on big ticket items like vehicles. New
vehicle prices are also increasing for a variety of factors, which is driving more customers to the used
vehicle market. There are other headwinds such as increasing difficulties with consumer access to
vehicle financing. Trade wars and tariffs are also impacting the price and sales of imported new
vehicles. As a result, we forecast that US sales are likely to fall slightly to 17.2m units in 2019 and
again to 16.7m units in 2020, only recovering to a growth phase with 17m units from 2023 onwards
and exceeding 19m units by 2030.
3.2 US Automotive Powertrain Analysis
The powertrain mix in the US is fundamentally characterised by a long history of very low petrol
(‘gas’ or ‘gasoline’) prices due to low fuel taxation. At an average of around $2.50 per US gallon (55
cents per litre), costs are less than 50% those of European petrol, which is around $5.50 per US
gallon ($1.43 per litre and $6.50 per imperial gallon).
This disparity is the result of a complicated history of different political discourses and
environmental focus in the US where, compared to other regions, much environmental efforts have
emphasised the reduction of particulate pollution; this legacy is part of the reason why diesel – even
before the VW ‘Dieselgate’ scandal – has had a low market share in the US (around 3% including
commercial vehicles).
Together with low fuel prices, cultural preferences, lower population density, and a protected
market for pickup trucks, the US has long displayed a preference for larger vehicles – a tendency that
has increased in recent years. And as the current US administration loosens environmental policy
further, the US could diverge further in powertrain mix, with internal combustion engines retaining a
higher share than in other major markets.
Other factors make hybrid and electric powertrains less attractive. Long distances challenge EV
battery ranges and infrastructure rollout. Fuel cell vehicles will also struggle to gain traction due to
their high costs (both purchase price and fuel costs) and a lack of fuelling infrastructure.
As a consequence, self-powering hybrid vehicles – e.g. mild hybrids (see 2.4) and full hybrids (see
2.5) – are likely to gain more traction than full EVs. We predict that full EVs will only reach sales of
1m units in the US in 2028, which is when the price parity with ICE vehicles will be achieved. Full
hybrids will grow by much more in our forecast, increasing more than sevenfold to 3.78m vehicles in
the forecast window. We expect pure internal combustion engines will still account for 65% of sales

28
in 2030 – about a 25% higher share than our forecasted global average, and an almost 40% higher
share than in the EU (see section 5).
Current and future deregulation is set to play a key role in the relatively subdued EV growth
compared to other regions. The National Highway Traffic Safety Administration (NHTSA) applies the
Corporate Average Fuel Economy (CAFE) standard, a target each year based upon vehicle
‘footprint’. However, the CAFE standard is relatively easy to reach and there has only been one
significant penalty, which was a $77m civil penalty against FCA in 2016 for cars that failed to meet
required fuel economy targets.
The Trump administration is also carrying out a midterm evaluation of the CAFE standard and has
proposed freezing the target at the existing 43mpg for passenger cars for 2021 rather than rising to
the previous target of 52mpg by 2025 set by the Obama administration. California, the largest US
state for automotive sales, has a special federal waiver to set stricter emissions standards, which 13
other states follow voluntarily. However, the Trump administration has sought to end this waiver,
and there is an ongoing legal case between the Environmental Protection Agency (EPA) and the state
over vehicles emissions legislation.
While regulatory pressures to improve fuel consumption are having a slight effect on higher
investment in hybridisation and electrification, we expect that the likely relaxation of fuel economy
standards, as well as consumer preferences, will lead to a relatively slow and gradual adoption of
EVs in the US.
Figure 3.2 Tesla Model 3 Electric Vehicle
Source: Tesla
29
One of the success stories worth noting is Tesla’s emergence as an ‘aspirational’ EV. Tesla has
succeeded in making EVs attractive as a premium lifestyle choice rather than because OEMs or
regulators are forcing them on consumers for environmental reasons. What is often overlooked in
EV adoption rates are these factors which could overshadow regulation, subsidies and taxation
policies, including good design, performance and ownership benefits such as rapid continuous
acceleration, smooth driving, low cost per mile and low maintenance costs.
Figure 3.3 Rivian R1T Electric Pick-Up Truck
Source Rivian
If emissions regulations do remain loose in the US, then OEMs who succeed in the EV market are
likely to be those who can appeal to consumers on these grounds as well as environmental benefits.
Although not yet proven in the market, electric pickup vehicle start-up Rivian will be an interesting
case study, as the company focuses electrification on a model type uniquely popular amongst
American consumers.

30
4. Rest of North America Automotive Powertrain Forecast By Type 2020-2030
Table 4.1 Rest of North America Automotive Powertrain Forecast by Type 2017-2030 (units
million) 2017 2018 2019 2020 2021 2022 2023 2024 2025 2026 2027 2028 2029 2030
EV 0.04 0.05 0.06 0.08 0.10 0.12 0.14 0.17 0.20 0.24 0.29 0.35 0.42 0.50
AGR (%) - 25 25 25 25 20 20 20 20 20 20 20 20 20
HEV 0.03 0.04 0.04 0.05 0.06 0.08 0.10 0.12 0.15 0.17 0.21 0.25 0.30 0.36
AGR (%) - 20 20 20 20 25 25 25 20 20 20 20 20 20
PHEV 0.03 0.04 0.05 0.06 0.07 0.09 0.11 0.13 0.15 0.18 0.22 0.26 0.31 0.38
AGR (%) - 25 25 25 25 20 20 20 20 20 20 20 20 20
MHEV 0.03 0.03 0.04 0.04 0.05 0.06 0.08 0.11 0.14 0.18 0.23 0.30 0.39 0.51
AGR (%) - 20 20 20 20 20 30 30 30 30 30 30 30 30
NGV 0.02 0.02 0.02 0.02 0.02 0.02 0.03 0.03 0.03 0.03 0.03 0.03 0.04 0.04
AGR (%) - 4 4 4 4 5 5 5 5 5 6 6 6 6
FCEV 0.001 0.001 0.001 0.002 0.002 0.002 0.002 0.003 0.003 0.004 0.005 0.007 0.008 0.010
AGR (%) - 15 15 15 15 15 20 20 20 20 25 25 25 25
Diesel 0.20 0.20 0.19 0.19 0.18 0.18 0.18 0.17 0.17 0.16 0.16 0.15 0.14 0.14
AGR (%) - -2 -2 -2 -2 -2 -2 -3 -3 -3 -3 -4 -4 -4
Petrol 3.1 3.0 2.9 2.9 2.8 2.8 2.7 2.6 2.6 2.5 2.4 2.3 2.2 2.1
AGR (%) - -3 -2 -2 -2 -2 -2 -3 -3 -3 -4 -4 -4 -4
Total 3.4 3.4 3.4 3.3 3.3 3.3 3.3 3.4 3.4 3.5 3.5 3.6 3.8 4.0
Source: Automotive From Ultima Media 2019
Figure 4.1 Rest of North America Automotive Powertrain Forecast by Type 2017-2030 (units
million)
Source: Automotive From Ultima Media 2019
0
1
2
3
4
2017 2018 2019 2020 2021 2022 2023 2024 2025 2026 2027 2028 2029 2030
Million
Year
Electric Vehicle (EV) Hybrid Electric Vehicle (HEV)
Plug-In Hybrid Electric Vehicle (PHEV) 48V / Mild Hybrid Electric Vehicle (MHEV)
Natural Gas Vehicle (NGV) Fuel Cell Electric Vehicle (FCEV)
Diesel (including 12V 'Micro' hybrid) Petrol (including 12V 'Micro' hybrid)

31
4.1 Rest of North America Automotive Market Forecast 2020-2030
We forecast that sales in the Rest of North America – Canada and Mexico – will remain relatively
weak. Mexico’s economic growth is weakening and recent economic data suggest that the country
just recently avoided a recession. In Canada, GDP growth flatlined in 2018, and has a relatively weak
economic outlook, with expectations of 1.3% growth in 2019 and 1.5% in 2020.
Of the 3.4m unit sales in 2018, Canada accounts for 1.98m units in 2018 and Mexico 1.42m units in
2018. We forecast that combined sales are likely to dip slightly, at 3.4m units in 2019 and 3.3m units
in 2020; growth is forecasted to resume from 2025 onwards, reaching 4m units in 2030.
4.2 Rest of North America Automotive Powertrain Analysis
Canada and Mexico both exhibit a somewhat similar powertrain mix to the US. This is in part
because of their geographic proximity, but also because the countries have closely aligned their
regulatory standards with the intention to harmonise passenger vehicle fuel emission standards
throughout North America.
Canada has greenhouse gas emissions legislation for the fleet average of new light-duty vehicles
under its Passenger Automobile and Light Truck Greenhouse Gas Emission Regulations. The
legislation requires a 5% annual reduction in CO2-equivalent per mile for passenger cars over the
period 2017 to 2025. For light trucks, the fleet average GHG limit reduces by 3.5% per year from
2017 to 2021 and then by 5% per year from 2022 to 2025.
Likewise, the Mexican government has aligned CO2 emissions regulations and fuel economy
equivalents for new passenger vehicles with the standards of the US NHTS.
As such, we foresee a somewhat similar evolution in product mix, albeit with a slightly higher
penetration of diesel vehicles.
32
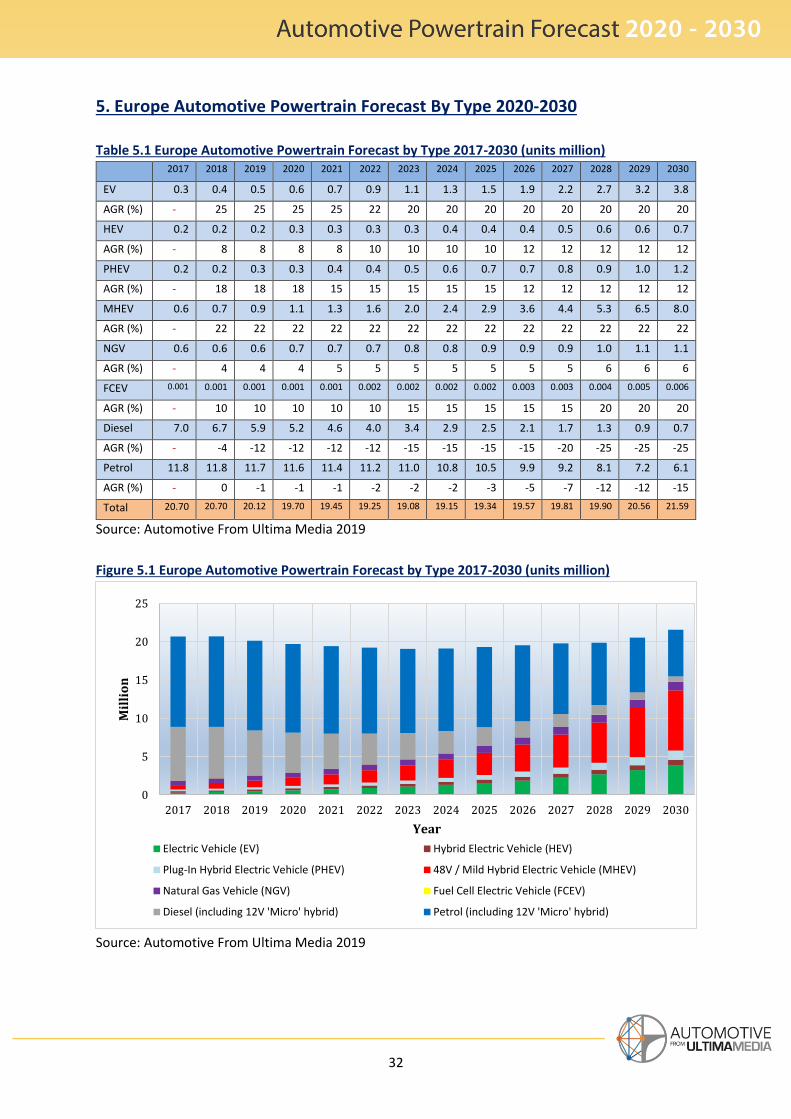
5. Europe Automotive Powertrain Forecast By Type 2020-2030
Table 5.1 Europe Automotive Powertrain Forecast by Type 2017-2030 (units million) 2017 2018 2019 2020 2021 2022 2023 2024 2025 2026 2027 2028 2029 2030
EV 0.3 0.4 0.5 0.6 0.7 0.9 1.1 1.3 1.5 1.9 2.2 2.7 3.2 3.8
AGR (%) - 25 25 25 25 22 20 20 20 20 20 20 20 20
HEV 0.2 0.2 0.2 0.3 0.3 0.3 0.3 0.4 0.4 0.4 0.5 0.6 0.6 0.7
AGR (%) - 8 8 8 8 10 10 10 10 12 12 12 12 12
PHEV 0.2 0.2 0.3 0.3 0.4 0.4 0.5 0.6 0.7 0.7 0.8 0.9 1.0 1.2
AGR (%) - 18 18 18 15 15 15 15 15 12 12 12 12 12
MHEV 0.6 0.7 0.9 1.1 1.3 1.6 2.0 2.4 2.9 3.6 4.4 5.3 6.5 8.0
AGR (%) - 22 22 22 22 22 22 22 22 22 22 22 22 22
NGV 0.6 0.6 0.6 0.7 0.7 0.7 0.8 0.8 0.9 0.9 0.9 1.0 1.1 1.1
AGR (%) - 4 4 4 5 5 5 5 5 5 5 6 6 6
FCEV 0.001 0.001 0.001 0.001 0.001 0.002 0.002 0.002 0.002 0.003 0.003 0.004 0.005 0.006
AGR (%) - 10 10 10 10 10 15 15 15 15 15 20 20 20
Diesel 7.0 6.7 5.9 5.2 4.6 4.0 3.4 2.9 2.5 2.1 1.7 1.3 0.9 0.7
AGR (%) - -4 -12 -12 -12 -12 -15 -15 -15 -15 -20 -25 -25 -25
Petrol 11.8 11.8 11.7 11.6 11.4 11.2 11.0 10.8 10.5 9.9 9.2 8.1 7.2 6.1
AGR (%) - 0 -1 -1 -1 -2 -2 -2 -3 -5 -7 -12 -12 -15
Total 20.70 20.70 20.12 19.70 19.45 19.25 19.08 19.15 19.34 19.57 19.81 19.90 20.56 21.59
Source: Automotive From Ultima Media 2019
Figure 5.1 Europe Automotive Powertrain Forecast by Type 2017-2030 (units million)
Source: Automotive From Ultima Media 2019
0
5
10
15
20
25
2017 2018 2019 2020 2021 2022 2023 2024 2025 2026 2027 2028 2029 2030
Million
Year
Electric Vehicle (EV) Hybrid Electric Vehicle (HEV)
Plug-In Hybrid Electric Vehicle (PHEV) 48V / Mild Hybrid Electric Vehicle (MHEV)
Natural Gas Vehicle (NGV) Fuel Cell Electric Vehicle (FCEV)
Diesel (including 12V 'Micro' hybrid) Petrol (including 12V 'Micro' hybrid)
33
5.1 European Automotive Forecast 2020-2030
Within Europe, GDP growth is expected to be low at 1.5% over the next few years. However, there is
a significant downside risk of a recession in one or more of the major European economies, including
Germany, Italy and the UK – likely in almost any scenario if and when it leaves the EU.
With volumes of 20.7m units in 2018, we expect several years of continual sales decline to 19.1m
units in 2023 before bottoming out and only exhibiting growth from 2024 onwards; we expect total
unit sales only to surpass 2018 volumes by the end of the decade, reaching 21.6m units by 2030.
This prolonged stagnation is in part because of slowing economic growth across the EU region,
especially in Germany and Italy, which are indicating weakening economic performance, and
possibly some or most of the Eurozone heading into recession.
The looming CO2 emissions regulations* that the European Commission is imposing is also likely to
make vehicles increasingly expensive as they are fitted with new technology to meet those stringent
targets. This is deterring many customers from buying new and to instead purchase used vehicles,
which they perceive as better value.
*Please see our report Climate Change vs. Carmakers
5.2 European Automotive Powertrain Analysis
The European automotive powertrain mix has been overwhelmingly shaped by high fuel prices,
emissions regulation and taxation policy. In Europe, fuel prices have always been relatively high,
primarily due to high taxation. Petrol, for example, is on average more than double average US
prices (see section 3.2). These costs combined with a relatively high population density in Europe
and small, congested roads in many countries, have contributed to a preference for smaller, more
fuel-efficient vehicles.
The European powertrain mix is also characterised by a very high share for diesel engines which has
been driven mainly by regulations over the past two decades aimed at reducing CO2, as well as an
alliance between governments and industry in favour of diesel – an alliance that has since crumbled.
In 1990, diesels had a fairly low penetration rate of less than 10% in the EU. After the Kyoto Protocol
agreement in 1997, many wealthy countries were legally obliged to cut CO2 emissions by an average
of 8% over 15 years. At the same time, the European Commission set increasingly tough CO2 targets.
The automotive industry, led by the major German OEMs such as BMW, Volkswagen and Daimler,
lobbied the EC hard to incentivise diesel, which the industry considered was an easier, lower cost
strategy to meet stricter CO2 targets. The result was a perfect alliance in favour of diesel. As diesel
vehicles are around 20% more fuel efficient than petrol vehicles, and emit correspondingly less CO2,
European governments have spent billions of euros effectively subsidising diesel through lower fuel
taxation, CO2-based road tax and by taxing new diesel cars at a lower rate than petrol cars. As a
result of this strong price incentive, diesel penetration peaked at 56% of EU vehicle sales in 2011.
34
The direction of travel began to shift in 2012, when the World Health Organization (WHO) published
a report stating that diesel emissions caused cancer by emitting four times as much nitrogen oxides
and 22 times more particulates, which can penetrate the lungs, brain and heart.
The big disruption came in 2015 when VW was caught cheating in emissions tests for its diesel
vehicles. Part of the impact of ‘Dieselgate’ has been a higher public awareness of diesel’s damaging
health effects. Governments then began to completely reverse earlier policies, and instead started
taxing and penalising diesels. The result has been a steep decline in diesel sales and a higher share of
petrol vehicles in the product mix. Diesel’s market share for new vehicle sales in the EU fell to 44% in
2017 and to 36% in 2018. Early indications for 2019 indicate a continued downward trajectory for
diesel as in Q2 of 2019 diesel accounted for just 31.3% of sales.
Some manufacturers and automotive associations, including the UK’s SMMT and Germany’s VDA,
have defended the use of diesel technology as a means to mitigate CO2 emissions but at a lower
cost than rapid electrification. We believe this analysis in favour of diesel to be correct; an
unintended consequence of diesel’s declining share has already been an increase in average fleet
CO2 emission in the EU even as OEMs are being given strict targets to reduce them. However, diesel
would only be a short-term strategy and not meet longer-term environmental objectives.
5.3 European Emissions Regulations Are The Strictest In The World
“European emissions regulations are the strictest in the world and we predict that collectively, the
OEMs selling into the EU market will incur fines of €2bn in 2020 and €5bn in 2021.”
EU emissions regulation requires automotive OEMs to reduce CO2 emissions of their ‘fleet average’
emissions to meet the overall fleet targets in 2020 and 2021 of 95g CO2/km (NEDC test cycle*) for
passenger vehicles. The targets will be phased in for 2020, when the ‘best’ 95% of an OEM’s fleet will
be used to calculate emissions. From 2021, 100% of vehicles will be used in the calculation. In
parallel, the target for light-commercial vehicles (LCV) is 147g CO2/km in 2020 and 2021.
OEMs who do not reach their individual targets will be fined €95 ($106) for each 1g/km over their
target, multiplied by their entire EU sales volume. We predict that the OEMs selling into the EU will
miss the overall target by 5g CO2/km in 2021. As a consequence, we predict that collectively, the
OEMs selling into the EU market will incur fines of €2bn in 2020 and €5bn in 2021.
These punitive fines are driving intensive investment in hybrids and fully electric vehicles for the EU
market, and we forecast that they will continue to spur rapid changes in the powertrain mix,
including some of the fastest adoption rates of HEV, PHEV and EV in the world. This creates
significant risks but also opportunities for OEMs and tier suppliers.
*See our report Climate Change vs. Carmakers

35
6. China Automotive Powertrain Forecast By Type 2020-2030
Table 6.1 China Automotive Powertrain Forecast by Type 2017-2030 (units million) 2017 2018 2019 2020 2021 2022 2023 2024 2025 2026 2027 2028 2029 2030
EV 0.6 0.7 0.9 1.1 1.4 1.7 2.1 2.6 3.3 4.0 4.7 5.5 6.3 7.2
AGR (%) - 20 20 25 25 25 25 25 25 20 20 15 15 15
HEV 0.2 0.2 0.3 0.3 0.4 0.5 0.5 0.6 0.7 0.8 0.9 1.0 1.1 1.2
AGR (%) - 20 20 20 15 15 15 15 15 12 12 12 12 12
PHEV 0.4 0.5 0.6 0.7 0.8 1.0 1.1 1.3 1.5 1.6 1.8 2.0 2.3 2.6
AGR (%) - 20 20 20 20 15 15 15 15 12 12 12 12 12
MHEV 1.1 1.3 1.6 1.9 2.3 2.7 3.3 3.9 4.7 5.7 6.9 8.4 10.3 12.6
AGR (%) - 20 20 20 20 20 20 20 20 20 22 22 22 22
NGV 0.50 0.52 0.53 0.55 0.57 0.60 0.63 0.66 0.70 0.73 0.78 0.82 0.87 0.92
AGR (%) - 3 3 4 4 5 5 5 5 5 6 6 6 6
FCEV 0.003 0.004 0.006 0.008 0.012 0.019 0.028 0.042 0.063 0.100 0.160 0.256 0.410 0.655
AGR (%) - 40 40 40 50 50 50 50 50 60 60 60 60 60
Diesel 3.0 2.6 2.2 2.0 1.7 1.5 1.3 1.2 1.0 0.9 0.7 0.6 0.5 0.4
AGR (%) - -15 -15 -10 -12 -12 -12 -12 -12 -15 -15 -15 -20 -20
Petrol 23 22.3 21.0 20.8 20.6 20.1 19.7 19.1 18.6 17.8 16.9 16.1 15.1 14.2
AGR (%) - -3 -6 -1 -1 -2 -2 -3 -3 -4 -5 -5 -6 -6
Total 28.80 28.14 26.99 27.29 27.71 28.11 28.75 29.47 30.53 31.57 32.98 34.72 36.87 39.78
Source: Automotive From Ultima Media 2019
Figure 6.1 China Automotive Powertrain Forecast by Type 2017-2030 (units million)
Source: Automotive From Ultima Media 2019
0
10
20
30
40
2017 2018 2019 2020 2021 2022 2023 2024 2025 2026 2027 2028 2029 2030
Million
Year
Electric Vehicle (EV) Hybrid Electric Vehicle (HEV)
Plug-In Hybrid Electric Vehicle (PHEV) 48V / Mild Hybrid Electric Vehicle (MHEV)
Natural Gas Vehicle (NGV) Fuel Cell Electric Vehicle (FCEV)
Diesel (including 12V 'Micro' hybrid) Petrol (including 12V 'Micro' hybrid)
36
6.1 China Automotive Market Forecast 2020-2030
From the heady days of nearly double-digit growth or higher in 2004-2011, China’s GDP growth rate
has since moderated. Its GDP expanded by 6.6% in 2018 and is expected to gradually soften to 6% in
2021 and 5.5% by 2024. Let’s be clear: this is still very high growth by the standards of most other
economies. But the relative slowing of the world’s second largest economy will have global
repercussions across all economies and all verticals, including the automotive sector, where Chinese
new vehicle sales are set to fall for a second year in a row.
Trade wars with the US are a major factor driving down vehicle sales in China and have contributed
to a sharp fall from 27.9m units in 2018 to 26.6m units expected in 2019. Trade tariffs are not only
affecting overall sales, but also impacting Chinese vehicle exports from domestic manufacturers.
Other factors contributing to the sharp fall in 2019 include regulatory changes on emissions and also
the recent reduction of subsidies for EVs.
We forecast that Chinese vehicle sales are likely to start recovering in 2020 due to an expected
easing of trade wars and economic growth recovering moderately and growing thereafter. New
vehicle sales are forecasted to reach 39.7m units in 2030.
6.2 China Automotive Powertrain Analysis
China currently has a fairly low penetration rate for alternatively fuelled vehicles. However, we see
that rapidly changing due to the tightening regulatory climate forcing OEMs selling into the Chinese
market to comply with some of the tightest CO2 and particulate emissions standards in the world.
As a consequence, we forecast that all types of HEV, PHEV, MHEV and fully EV are expected to
flourish in China over the forecast period and will account for over 60% of powertrains.
China also has a pilot programme to encourage the development of fuel cell vehicles, which we
anticipate will lead it (and Japan, see section 7) to be among the few countries where FCEVs gain any
significant traction. Rather than for passenger cars, we expect FCEV sales most likely to occur first
with commercial heavy good vehicles and trucks (albeit in relatively small volumes) where
electrification with very large batteries is not viable and fuel cells are a more realistic route to full
electrification and zero emissions (see section 2.8).
6.3 Tightening Regulatory Climate
In China the regulatory climate is tightening, and the Corporate Average Fuel Consumption (CAFC)
limit for passenger cars will be 5 litres per 100km in 2020 (this converts to ~116g CO2/km), and then
4 litres/100km in 2025 (~93g CO2/km).
Like the EU, China operates fleet average, weight-based targets for individual OEMs. It has been
reported that China has intentionally tried to achieve regulatory alignment with EU CO2 regulations
to help OEMs in releasing global vehicles models.
37
Like in the EU, the extra cost of making vehicles compliant for Chinese emissions regulations
(typically $300 to $700) has made it harder to sell volume models with slim margins; OEMs have
largely had to absorb these costs as consumers have been unwilling to pay the extra cost.
6.4 Chinese EV Subsidies Being Phased Out
Generous Chinese state subsidies have been very effective at encouraging EV uptake. Sales of fully
electric, PHEV and FCEV vehicles grew strongly by 138% year on year in January 2019 due to these
subsidies, demonstrating the important role of government in electrification.
However, in June the China Ministry of Finance announced it would reduce its EV state subsidies by
half from 50,000 RMB ($6,000) to 25,000 RMB per vehicle to encourage innovation. It also increased
the minimum range for the subsidy to those vehicles with a range of at least 250km. For 2020, the
government has announced that the subsidies will be removed completely, leading to a slow down
or more moderate growth rate for EVs. It is expected that China’s carmakers will respond by
correspondingly increasing the prices of their EVs.
Alongside this, the government implemented China stage VI emission standards for all new vehicles
on 1st July 2019. These relate to particulate emissions and public health and are some of the strictest
in the world. These standards apply initially across 15 provinces and municipalities, including Beijing
and Shanghai. For 2020, the regulations will apply to all of China – putting upward pressure on
vehicle prices and likely to affect vehicles sales. However, despite this we do still see growing
demand after 2020, due to recovering economic growth, a growing population and rising disposable
incomes.

38
7. Japan Automotive Powertrain Forecast By Type 2020-2030
Table 7.1 Japan Automotive Powertrain Forecast by Type 2017-2030 (units million) 2017 2018 2019 2020 2021 2022 2023 2024 2025 2026 2027 2028 2029 2030
EV 0.15 0.17 0.18 0.20 0.22 0.25 0.28 0.31 0.35 0.39 0.43 0.49 0.54 0.61
AGR (%) - 10 10 10 10 12 12 12 12 12 12 12 12 12
HEV 0.30 0.32 0.34 0.37 0.40 0.43 0.46 0.50 0.55 0.60 0.67 0.73 0.81 0.89
AGR (%) - 7 7 7 8 8 8 8 10 10 10 10 10 10
PHEV 0.20 0.22 0.25 0.28 0.30 0.33 0.37 0.40 0.44 0.49 0.54 0.59 0.65 0.72
AGR (%) - 12 12 10 10 10 10 10 10 10 10 10 10 10
MHEV 0.30 0.34 0.38 0.42 0.47 0.53 0.59 0.65 0.72 0.79 0.87 0.95 1.05 1.15
AGR (%) - 12 12 12 12 12 12 10 10 10 10 10 10 10
NGV 0.05 0.05 0.06 0.06 0.06 0.07 0.07 0.07 0.08 0.08 0.08 0.09 0.09 0.09
AGR (%) - 6 6 6 6 5 5 5 5 4 4 3 3 3
FCEV 0.002 0.002 0.003 0.004 0.006 0.009 0.013 0.019 0.029 0.044 0.066 0.105 0.168 0.269
AGR (%) - 40 40 40 40 50 50 50 50 50 50 60 60 60
Diesel 0.20 0.19 0.16 0.15 0.13 0.12 0.11 0.10 0.09 0.08 0.07 0.06 0.06 0.05
AGR (%) - -7 -12 -10 -10 -10 -10 -10 -10 -10 -10 -10 -10 -10
Petrol 4.07 4.0 3.8 3.8 3.6 3.5 3.3 3.2 3.0 2.8 2.6 2.4 2.2 2.0
AGR (%) - -1 -5 -2 -3 -4 -5 -5 -6 -6 -7 -7 -8 -8
Total 5.27 5.32 5.20 5.23 5.23 5.22 5.21 5.21 5.21 5.26 5.31 5.43 5.58 5.81
Source: Automotive From Ultima Media 2019
Figure 7.1 Japan Automotive Powertrain Forecast by Type 2017-2030 (units million)
Source: Automotive From Ultima Media 2019
0
1
2
3
4
5
6
2017 2018 2019 2020 2021 2022 2023 2024 2025 2026 2027 2028 2029 2030
Million
YearElectric Vehicle (EV) Hybrid Electric Vehicle (HEV)
Plug-In Hybrid Electric Vehicle (PHEV) 48V / Mild Hybrid Electric Vehicle (MHEV)
Natural Gas Vehicle (NGV) Fuel Cell Electric Vehicle (FCEV)
Diesel (including 12V 'Micro' hybrid) Petrol (including 12V 'Micro' hybrid)

39
7.1 Japan Automotive Market Forecast 2020-2030
Underpinning Japan’s weak automotive outlook is GDP growth, which is expected to be very low at
0.5-1% over the next five years. Consumer confidence is also very low.
Furthermore, the Japanese government was expected to increase consumption tax from 8% to 10%
from October 2019, which is also likely to harm vehicle sales. However, in December 2018, Japanese
legislators formulated a draft tax reform package, intended to provide tax breaks to buyers to
counteract the consumption tax.
Trade wars between the US and China are likely to reduce global demand, impacting Japan’s crucial
exports markets for various sectors, which ultimately affects Japanese jobs and thereby reduces
domestic demand.
Consequently, we expect vehicle sales to fall from 5.3m units in 2018 to 5.2m units in 2019. Beyond
that, we also foresee a very stagnant marketplace until 2025 when the economy is expected to
strengthen slowly, although it will take until 2030 to achieve a modest increase in vehicle sales to
5.8m units.
7.2 Japan Automotive Powertrain Analysis
Japan’s regulatory climate is a major driver of alternative fuel powertrains. It has quite a strict
regulatory regime with a vehicle emissions target of 105g CO2/km for 2020. Although not quite as
stringent as the EU target of 95g CO2/km in 2020/21, the Japanese target is still one of the toughest
in the world. This is leading to rapid adoption of hybridised and electric vehicles in Japan.
Beyond this, Japan taken has a co-operative approach with industrial stakeholders to achieve an 80%
reduction in CO2 emissions from OEMs by 2050 (90% of which is from passenger vehicles, including
vehicles for export). This is expected to be achieved by a mixture of hybrid, PHEV and fully electric
vehicles, with mild hybrids having the largest share by 2030. There will also be a somewhat more
significant role for fuel cell electric vehicles.
Even here, however, we do not expect a significant number of FCEV passenger cars. As with China
we expect more uptake (albeit in relatively small volumes) primarily in commercial heavy good
vehicles and truck segments (see 2.8).

40
8. Rest of APAC & Oceania Automotive Powertrain Forecast By Type 2020-
2030
Table 8.1 Rest of APAC & Oceania Automotive Powertrain Forecast by Type 2017-2030 (units million) 2017 2018 2019 2020 2021 2022 2023 2024 2025 2026 2027 2028 2029 2030
EV 0.18 0.22 0.27 0.33 0.40 0.50 0.62 0.78 0.97 1.22 1.52 1.90 2.41 3.07
AGR (%) - 22 22 22 22 25 25 25 25 25 25 25 27 27
HEV 0.15 0.18 0.22 0.27 0.33 0.39 0.47 0.56 0.68 0.81 0.96 1.13 1.34 1.58
AGR (%) - 22 22 22 20 20 20 20 20 20 18 18 18 18
PHEV 0.3 0.4 0.4 0.5 0.6 0.7 0.9 1.1 1.3 1.7 2.1 2.6 3.3 4.1
AGR (%) - 20 20 20 20 20 20 20 25 25 25 25 25 25
MHEV 0.3 0.3 0.4 0.5 0.6 0.7 0.9 1.1 1.3 1.7 2.1 2.6 3.3 4.1
AGR (%) - 15 20 20 20 20 20 25 25 25 25 25 25 25
NGV 0.70 0.74 0.79 0.83 0.88 0.92 0.97 1.01 1.06 1.12 1.16 1.21 1.26 1.31
AGR (%) - 6 6 6 5 5 5 5 5 5 4 4 4 4
FCEV 0.001 0.001 0.001 0.001 0.001 0.002 0.002 0.003 0.004 0.005 0.006 0.007 0.009 0.012
AGR (%) - 30 30 30 30 30 30 25 25 25 25 25 25 25
Diesel 2.4 2.2 2.0 1.8 1.7 1.5 1.4 1.2 1.1 1.0 0.9 0.8 0.7 0.7
AGR (%) - -10 -8 -8 -8 -10 -10 -10 -10 -10 -10 -10 -10 -10
Petrol 8.2 8.0 7.7 7.6 7.4 7.3 7.1 7.0 6.8 6.7 6.6 6.4 6.3 6.2
AGR (%) - -3 -3 -2 -2 -2 -2 -2 -2 -2 -2 -2 -2 -2
Total 12.2 12.0 11.8 11.8 11.9 12.0 12.3 12.7 13.3 14.2 15.3 16.7 18.6 21.0
Source: Automotive From Ultima Media 2019
Figure 8.1 Rest of APAC & Oceania Automotive Powertrain Forecast by Type 2017-2030 (units million)
Source: Automotive From Ultima Media 2019
0
2
4
6
8
10
12
14
16
18
20
22
2017 2018 2019 2020 2021 2022 2023 2024 2025 2026 2027 2028 2029 2030
Million
Year
Electric Vehicle (EV) Hybrid Electric Vehicle (HEV)
Plug-In Hybrid Electric Vehicle (PHEV) 48V / Mild Hybrid Electric Vehicle (MHEV)
Natural Gas Vehicle (NGV) Fuel Cell Electric Vehicle (FCEV)
Diesel (including 12V 'Micro' hybrid) Petrol (including 12V 'Micro' hybrid)

41
8.1 Rest of APAC & Oceania Automotive Market Forecast 2020-2030
The Rest of APAC and Oceania automotive market is mainly accounted for by five countries: India
(4.4m units in 2018), South Korea (1.83m units in 2018), Indonesia (1.15m units in 2018), Australia
(1.12m units in 2018) and Thailand (1.08m units in 2018).
Across this wide grouping of regions, we expect that vehicle sales will remain flat at 11.8m units in
2019 to 11.8m units in 2020 due to global economic headwinds. However, most of the regions are
likely to start recovering in 2021 and will grow strongly during the next decade to reach 21m units by
2030.
8.2 Other Countries In The RegionThe Indian vehicle market, the largest is in this grouping, is in sharp decline. Passenger vehicle sales
in India dropped 23.5% in April-September 2019 compared to the same period in 2018, with even
sharper drops among passenger cars. Stricter lending requirements and deteriorating consumer
confidence have led consumers to postpone spending decisions.
We also expect that the introduction of stricter emissions and particulate standards will make
vehicles more expensive and will likely undermine new vehicle sales (see section 8.3). However,
we do expect the Indian market to recover and resume growth during the next decade.
Elsewhere in Asia Pacific, South Korea automotive sales are stable, in part due to the strength
of South Korea’s advanced economy. However, like Japan, South Korea’s economy is highly
export focused, and will be hit by any further escalation in global trade wars.
In Indonesia, a market with considerable potential given its large population, vehicle sales have gone
into reverse and could end the year more than 10% lower than 2018. In Thailand, new vehicle sales
have grown by around 6% this year compared to last year.
In Australia, year-to-date sales through September totalled 811,464 vehicles, which was a fall of 7.9%,
on the same period in 2018.
Although this grouping of regions includes disparate economies and conditions, across them we can
see a variety of challenges and headwinds contributing to an overall flat market outlook, part of a
global trend of weak vehicle sales over the next five years or so. Likewise, we don’t expect any
significant volume growth until beyond 2025.
8.3 Rest of APAC & Oceania Automotive Powertrain Analysis
In terms of powertrain mix, we foresee that the tightening emissions regulations in India and South
Korea will drive profound powertrain evolution in these countries.

42
India has set fleet average emissions targets of 113g CO2/km for April 2022. Furthermore, India has
serious particulate pollution problems and the government plans to tackle this by introducing
tightening regulations and enforcing its Bharat Stage 6 (BS 6) fuel emission targets by 2020, which
are some of the strictest in the world and comparable to the Euro 6 emissions standards in the EU.
South Korea, meanwhile, also has an emissions target of 97g CO2/km for 2020, which is one of the
strictest in the world.
Thailand, Sri Lanka and Vietnam are the other main countries in the region which have implemented
fuel efficiency policies.
For the wider rest of APAC and Oceania, we therefore predict an evolving powertrain mix evolving
on a similar trajectory to China; by 2030 over 50% of powertrains will be electrified to some degree
from mild hybrid to fully hybrid and fully electric.
We also expect the relatively high penetration rate of natural gas vehicles in parts of these regions to
be maintained over the forecast period, especially in countries such as India and Pakistan, as natural
gas is a relatively clean burning fuel.

43
9. Central & South America Automotive Powertrain Forecast By Type 2020-
2030
Table 9.1 Central & South America Automotive Powertrain Forecast by Type 2017-2030 (units million) 2017 2018 2019 2020 2021 2022 2023 2024 2025 2026 2027 2028 2029 2030
EV 0.05 0.06 0.07 0.09 0.11 0.14 0.17 0.21 0.26 0.33 0.41 0.52 0.64 0.81
AGR (%) - 22 22 22 22 22 25 25 25 25 25 25 25 25
HEV 0.05 0.06 0.07 0.09 0.11 0.13 0.16 0.19 0.23 0.28 0.36 0.45 0.56 0.70
AGR (%) - 20 20 20 22 22 22 22 22 22 25 25 25 25
PHEV 0.05 0.06 0.08 0.10 0.12 0.15 0.19 0.24 0.29 0.35 0.43 0.51 0.61 0.74
AGR (%) - 25 25 25 25 25 25 25 22 22 20 20 20 20
MHEV 0.05 0.06 0.07 0.09 0.11 0.14 0.18 0.23 0.29 0.37 0.47 0.60 0.76 0.96
AGR (%) - 22 22 22 25 25 27 27 27 27 27 27 27 27
NGV 0.05 0.05 0.06 0.06 0.06 0.07 0.07 0.07 0.08 0.08 0.08 0.09 0.09 0.09
AGR (%) - 6 6 6 5 5 5 5 5 4 4 4 4 4
FCEV 0.001 0.001 0.001 0.001 0.001 0.001 0.001 0.001 0.001 0.002 0.002 0.002 0.003 0.003
AGR (%) - 10 10 10 10 15 15 15 15 20 20 20 20 20
Diesel 0.4 0.4 0.3 0.3 0.3 0.3 0.2 0.2 0.2 0.1 0.1 0.1 0.1 0.1
AGR (%) - -3 -10 -10 -10 -10 -10 -10 -15 -20 -20 -20 -20 -20
Petrol 3.7 3.9 3.8 3.8 3.8 3.7 3.7 3.7 3.6 3.5 3.5 3.4 3.3 3.3
AGR (%) - 5 -1 -1 -1 -1 -1 -1 -1 -2 -2 -2 -2 -2
Total 4.4 4.6 4.6 4.5 4.6 4.6 4.7 4.8 5.0 5.1 5.3 5.7 6.1 6.6
Source: Automotive From Ultima Media 2019
Figure 9.1 Central & South America Automotive Powertrain Forecast by Type 2017-2030 (units million)
Source: Automotive From Ultima Media 2019
0
1
2
3
4
5
6
7
2017 2018 2019 2020 2021 2022 2023 2024 2025 2026 2027 2028 2029 2030
Million
YearElectric Vehicle (EV) Hybrid Electric Vehicle (HEV)
Plug-In Hybrid Electric Vehicle (PHEV) 48V / Mild Hybrid Electric Vehicle (MHEV)
Natural Gas Vehicle (NGV) Fuel Cell Electric Vehicle (FCEV)
Diesel (including 12V 'Micro' hybrid) Petrol / Flex Fuel (+ 12V 'Micro' hybrid)

44
9.1 Central & South America Automotive Market Forecast 2020-2030
Across the overall Central and South American region with current sales of 4.6m units, we predict
flat growth from 2019-2022, with a stronger recovery only really appearing from 2023 onwards as
consumer confidence and economic growth recovers. We expect that sales will reach 6.6m units by
2030.
Brazil dominates the region with sales of 2.47m units in 2018, an increase of 14% from 2017; sales
are expected to increase by 10% for 2019 to reach 2.7m units, helped by increased credit availability,
low interest rates on car finance and improving consumer confidence. However, recent economic
data has suggested that Brazil slipped into recession in the second quarter of 2019.
Passenger cars and LCV sales have also shown sharp increases in other, relatively small markets in the
region, including in Ecuador and Chile.
However, in Argentina, the second-largest vehicle market in the South American region, vehicle sales
fell from 862,000 in 2017 to 773,000 in 2018; in the first nine months of 2019, they have virtually
halved and dropped a further 48% amidst a worsening economic crisis in the region.
9.2 Central & South America Automotive Powertrain Analysis
Emission regulations and fuel economy standards are among the major factors influencing the
evolution of the South American powertrain market. Brazil and Chile are the two main countries in
the region to have implemented fuel efficiency policies.
Brazil had a fuel economy target in 2017 that equated to 138g CO2/km, and an 11% improvement is
already set into legislation for 2022, equating to 123g CO2/km. There is currently debate over the
target for 2030, which is reported to include a minimum overall requirement plus two more
advanced targets called ‘challenge targets’.
Brazil has a policy called ROTA 2030 which covers three main areas of the vehicle market:
regulations (including safety and energy efficiency), fiscal incentives and priority programmes –
although its fuel efficiency targets are not currently as stringent compared to other countries.
As a result of tightening emission regulations from their relatively relaxed current standards, we do
foresee growth across electrified powertrains in the region, but from a very low base of 6% of sales
this year. Overall, we expect petrol-based ICEs, including ethanol ‘flex-fuel’ vehicles in Brazil (see
9.3), to still account for 50% of powertrains by 2030.
9.3 Ethanol ‘Flex-Fuel’ Vehicles Penetration Uniquely High In Brazil
One of the major unique characteristics of the Brazilian automotive market is the use of ethanol
derived from sugar cane, which takes advantage of the country’s natural resources and industries.

45
Brazil has by far the highest penetration rate of flex-fuel vehicles with 44-46% able to operate on a
mixture of ethanol and gasoline. Flex-fuel vehicles are essentially petrol engine vehicles that have
been modified to also operate on pure ethanol or an ethanol/petrol mix (in our forecast, they are
thus counted as petrol powertrains, or as hybrid when partly electrified).
Since July 1st 2007 the mandatory fuel blend is for a minimum 25% of anhydrous ethanol and 75%
gasoline, and is referred to as ‘E25’ blend. The government policy has been very successful; by 2013,
over 90% of vehicles were flex-fuel. As Flex fuel vehicles can operate on any proportion of petrol
(E20-E25 blend) up to fully hydrous ethanol (E100), this has in reality resulted in 50% of actual fuel
consumed being ethanol across the petrol-powered fleet.
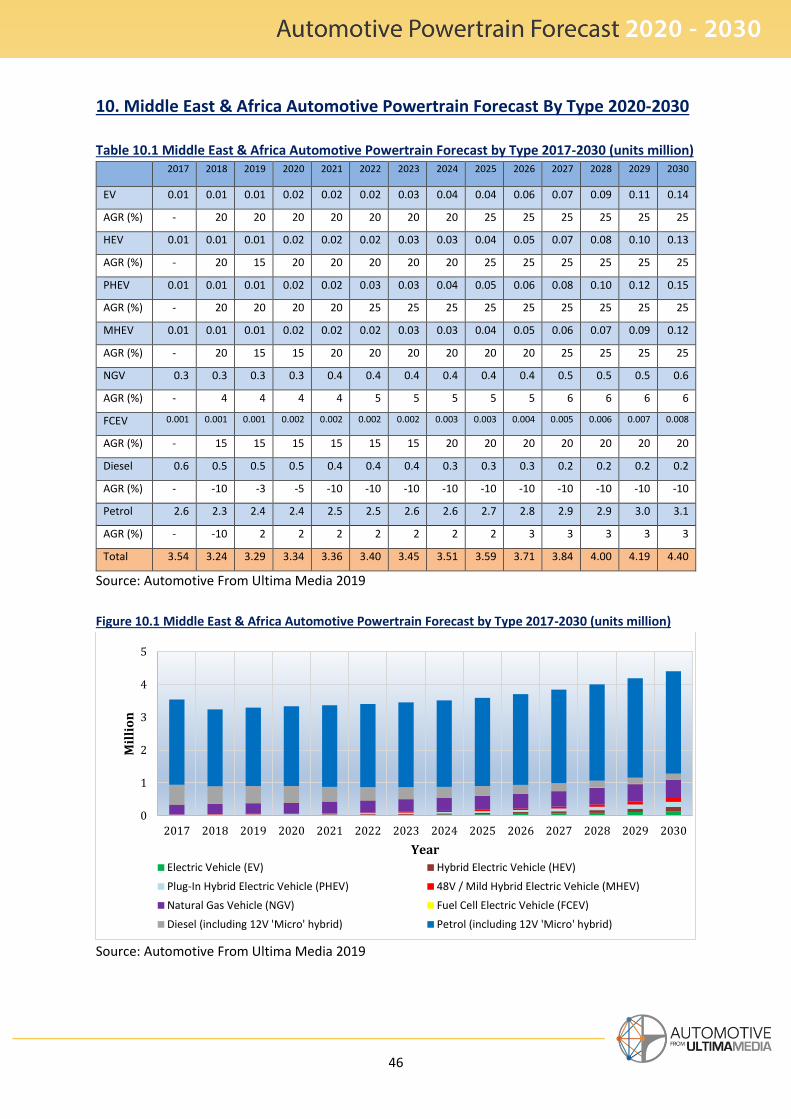
46
10. Middle East & Africa Automotive Powertrain Forecast By Type 2020-2030
Table 10.1 Middle East & Africa Automotive Powertrain Forecast by Type 2017-2030 (units million) 2017 2018 2019 2020 2021 2022 2023 2024 2025 2026 2027 2028 2029 2030
EV 0.01 0.01 0.01 0.02 0.02 0.02 0.03 0.04 0.04 0.06 0.07 0.09 0.11 0.14
AGR (%) - 20 20 20 20 20 20 20 25 25 25 25 25 25
HEV 0.01 0.01 0.01 0.02 0.02 0.02 0.03 0.03 0.04 0.05 0.07 0.08 0.10 0.13
AGR (%) - 20 15 20 20 20 20 20 25 25 25 25 25 25
PHEV 0.01 0.01 0.01 0.02 0.02 0.03 0.03 0.04 0.05 0.06 0.08 0.10 0.12 0.15
AGR (%) - 20 20 20 20 25 25 25 25 25 25 25 25 25
MHEV 0.01 0.01 0.01 0.02 0.02 0.02 0.03 0.03 0.04 0.05 0.06 0.07 0.09 0.12
AGR (%) - 20 15 15 20 20 20 20 20 20 25 25 25 25
NGV 0.3 0.3 0.3 0.3 0.4 0.4 0.4 0.4 0.4 0.4 0.5 0.5 0.5 0.6
AGR (%) - 4 4 4 4 5 5 5 5 5 6 6 6 6
FCEV 0.001 0.001 0.001 0.002 0.002 0.002 0.002 0.003 0.003 0.004 0.005 0.006 0.007 0.008
AGR (%) - 15 15 15 15 15 15 20 20 20 20 20 20 20
Diesel 0.6 0.5 0.5 0.5 0.4 0.4 0.4 0.3 0.3 0.3 0.2 0.2 0.2 0.2
AGR (%) - -10 -3 -5 -10 -10 -10 -10 -10 -10 -10 -10 -10 -10
Petrol 2.6 2.3 2.4 2.4 2.5 2.5 2.6 2.6 2.7 2.8 2.9 2.9 3.0 3.1
AGR (%) - -10 2 2 2 2 2 2 2 3 3 3 3 3
Total 3.54 3.24 3.29 3.34 3.36 3.40 3.45 3.51 3.59 3.71 3.84 4.00 4.19 4.40
Source: Automotive From Ultima Media 2019
Figure 10.1 Middle East & Africa Automotive Powertrain Forecast by Type 2017-2030 (units million)
Source: Automotive From Ultima Media 2019
0
1
2
3
4
5
2017 2018 2019 2020 2021 2022 2023 2024 2025 2026 2027 2028 2029 2030
Million
Year
Electric Vehicle (EV) Hybrid Electric Vehicle (HEV)
Plug-In Hybrid Electric Vehicle (PHEV) 48V / Mild Hybrid Electric Vehicle (MHEV)
Natural Gas Vehicle (NGV) Fuel Cell Electric Vehicle (FCEV)
Diesel (including 12V 'Micro' hybrid) Petrol (including 12V 'Micro' hybrid)
47
10.1 Middle East & Africa Automotive Market Forecast 2020-2030
For the Middle East & Africa (MEA) region, sales contracted sharply from 3.54m units in 2017 to
3.24m units in 2018.
We predict vehicle sales will stay essentially flat from 3.29m units in 2019 to a predicted 3.34m in
2020. Sales will slowly recover but only reach 2017 levels once again in 2024 and only achieve
significant growth over the latter part of the decade to reach 4.4m units in 2030.
Sales in the Middle East region have declined recently in large part because of sharp falls in the
Iranian market, which saw new vehicle sales drop by more than 30% from 1.43m in 2017 to 0.96m in
2018. This is in part due to the sanctions imposed on Iran by the US, which largely shut the country
out of global investment and supply chains. A weakening currency has also made vehicle imports
much more expensive.
Saudi Arabian sales also appear to be on a downward trajectory, having fallen from 500,601 in 2017
to 403,857 in 2018.
South Africa, which has a far more advanced GDP compared to much of the rest of the region, is one
of the major Africa markets in the MEA region with sales of 552,000 units in 2018. Although vehicle
sales have been restrained by economic and political instability in the last few years, the South
African population is young and economic growth for the country looks promising; we expect to see
a growing aspiration to purchase vehicles in the country.
Only Egypt (184,000 units in 2018), Morocco (177,000 units in 2018), Algeria (127,000 units in 2018)
and Tunisia (51,000 units in 2018) have sizable vehicle markets in Africa. The remaining countries
have sales of less than 30,000 units annually. African sales increased strongly in 2018, mainly due to
a recovery in both Egypt and Algeria.
10.2 Middle East & Africa Automotive Powertrain Analysis
In 2018, petrol vehicles account for 71% of vehicle sale and diesel vehicles 15.5%, with 13.5% being
alternative fuels. As an oil producing region, the politics around fuel efficiency are complicated.
However, Saudi Arabia and the UAE have implemented fuel emissions policies.
The penetration for HEV and EV has a low starting point, but we expect an increase to 25% by 2030
for all types of electrified vehicles (MHEV, HEV, PHEV, EV and FCEV). This is markedly lower than the
rest of the global average by then, but still a significant rise across the region.
48
11. ConclusionThe next decade will undoubtedly be a period of unprecedented transition for the automotive
industry. For over 100 years, the internal combustion engine has dominated powertrains across all
types of vehicles. But the next decade will see the ICE powertrain supplemented by a whole
spectrum of electric hybridisation and phasing in of full electrification.
“Despite the internal combustion engine (ICE) being phased out, ICE powertrains (petrol, diesel,
NGV, all hybrids) will still feature in 85% of vehicles sold in 2030.”
Despite billions in investment, and a significant rise in development, production and sales of EVs, by
2030 we still expect only 15% of powertrains to be fully electric vehicles. Therefore, technological
improvements will still need to be achieved in ICE powertrains over the next decade from this legacy
technology, as fuel economy and emission targets tighten.
11.1 Investment Risk
Imminent CO2 emissions targets in the EU being phased in from 2020/2021 and similar fuel
economy targets in China for 2020 are compelling OEMs to invest in developing low emissions
technologies. This will result in tough financial fines for the OEMs– which will reduce the OEMs’
ability to invest in emission reduction technologies.
“Punitive fines for OEMs breaching EU CO2 emissions targets are estimated to reach €2bn in 2020
and €5bn in 2021.”
Please see our report Climate Change vs. Carmakers
The consequence is that OEMs will have to adapt and re-tool existing production lines, as well as
likely constructing completely new plants for hybrid and electric vehicles. Not only is this extremely
capital intensive for the OEMs, the profitability of hybrid and electric vehicles is currently low or
non-existent, resulting in the return on capital employed being correspondingly very low. That puts
into question the future viability of many existing OEMs – and especially so for new EV start-ups. The
cancellation in October 2019 of vacuum-specialist Dyson’s planned EV project, and financial
problems seen by the likes of China’s Nio or Faraday Future, illustrate these risks.
11.2 Technological Risk
OEMs must choose an electrification strategy to help meet emissions targets. However, there is a
considerable risk that the OEMs invest in the wrong technology, such as heavily investing in EVs
when mild hybrids are preferred, or investing in fuel cells when there is no state-led efforts to invest
in the refuelling infrastructure.
The regional divergence in emissions regulations also creates risk for the OEMs, as to achieve
economies of scale and a good return on investment, OEMs need to be confident that hybrid and EV
technologies will sell with a global reach.

49
Additionally, the extra technological compliance costs to meet the emissions regulations are costly
per vehicle, ranging from $500 for a ‘micro-hybrid’ up to $12,000 for a fully electric vehicle.
A further risk is that government purchase subsidies could be suddenly removed causing a sharp
drop in vehicle sales in that segment, affecting the return on investment in that powertrain
technology. For example, China has recently reduced and will remove completely EV purchase
subsidies and the UK also removed HEV and PHEV purchase subsidies, retaining them only for EVs.
11.3 Opportunities Ahead for Suppliers, Startups and Synergies
“Over 55% of powertrains of vehicles sold in 2030 will be electrified or hybridised to some degree.”
Of course, this unparalleled industry transition also provides enormous potential business
opportunities, especially for tier suppliers, which we expect to become ever more important to
OEMs in the successful transition to an electric future.
There are clearly enormous growth prospects for hybrid and EV powertrains. Existing players such as
Borg Warner, Bosch, Denso, Delphi, GKN, ZF, Schaeffler, Univance, Mitsubishi Electric, Magna, Valeo,
Mahle, Magtec, Dana TM4, AVID, Continental, Yasa and the alliances they form with OEMs will be
pivotal to the success of any strategy towards powertrain transition.
Further down the supply chain, we foresee that battery suppliers will become the crucial
‘kingmakers’ to the success of electric vehicles. Leading battery manufacturers such as A123
Systems, BYD, CATL, Panasonic, LG Chem, Samsung SDI, Toshiba, JTEKT, Toyota Boshoku, XALT
Energy, NTK, SK Innovation will become central to the automotive industry success. In parallel to this
it is interesting to note that major EV OEMs such as VW and Tesla are starting to develop their own
JVs with key battery suppliers to ensure reliability of supply and retain more control over the value
chain.
The relative simplification of the powertrain in EVs makes the prospect of new OEM entrants more
likely. The large number of new EVs destined for launch soon indicate that the legacy OEMs are not
necessarily going to dominate anymore. One example is Rivian, which will produce electric SUVs and
pick-up trucks, targeting US market preferences for these larger vehicles.
We also expect there will be increasing JVs, powertrain and platform sharing agreements amongst
OEMs to join forces to spread the huge R&D costs. For example, Ford is using VW’s electric vehicle
MEB platform. Audi will join Daimler and BMW’s alliance on autonomous vehicle technologies. VW
has expanded its collaboration with Ford on AV technologies. Such shared investment is the only
realistic way to manage these huge investment costs, as well as to compete with the immense
resources of Waymo, owned by Alphabet, the parent company of Google.

50
Indeed, we expect that the synergies between electric and autonomous vehicles will be a major
opportunity as the powertrain shift continues. It is much easier to automate an EV powertrain than
it is the clutch and gears of a conventional ICE powertrain.
Investment in AVs has totalled more than $100 billion and will remain a major R&D focus, even if
their arrival in terms of level 4 or 5 autonomy will only occur beyond 2030. But whilst EV penetration
is set to arrive sooner, both new technologies are travelling on the same road. The collaboration
between Volkswagen and Ford forged this past July on both autonomous and electric vehicles –
including VW investing $2.6 billion in Argo AI – illustrates the path that industry transformation is
taking.
“The future is not only electric, a new category will emerge for shared, autonomous and electric
vehicles (SAEV)”

51
12. Appendix
Copyright © 2019 Ultima Media Ltd.
All rights reserved. No part of this publication may be reproduced, distributed, or transmitted in any form or by any means, including photocopying, recording, or other electronic or mechanical methods, without the prior written permission of the publisher, except in the case of brief quotations embodied in critical reviews and certain other non-commercial uses permitted by copyright law. For permission requests, write to the publisher, at the address below.
Ultima Media Ltd part of Süddeutscher Verlag
401 King Street
Hammersmith
London, W6 9NJ
www.ultimamedia.com
P: +44 (0)20 8987 0900
Disclaimer
All facts and figures are believed to be accurate at the time of publication; Ultima Media accepts no
responsibility for inaccuracies due to future developments in the market or incorrect information
provided by Ultima Media's sources. Ultima Media is unable to accept any legal liability for any
consequential loss or damage, however caused, arising as a result of any actions taken on the basis
of the information provided in this report.
Contact Details
Daniel Harrison (report author)
Automotive Analyst
P: +44 (0)208 987 0946
Christopher Ludwig
Editor-in-Chief
P: +44 (0)208 987 0968