table of contents - advcloudfiles.advantech.com · established a joint venture in italy with 25%...
TRANSCRIPT


Table of Contents
I. Letter to Shareholders 01
II. Company profiles 03
1. Date of Incorporation 03
2. Company History 03
III. Corporate Governance Report 10
1. Organization 10
2. Directors and Management Team 13
3. The remuneration paid to Directors, President and Vice President for the
Most Recent Fiscal Year
25
4. Implementation of Corporate Governance 62
5. Information Regarding the Company’s Professional Fees 62
6. Information Regarding the change of Certified Public Accountant Firm 62
7. The Company’s Chairman, President, Officers in charge of Financial or
Accounting Affairs has served in Its Certified Public Accountant Firm or
Its Affiliated Enterprise for the Most Recent Fiscal Year
63
8. Change in shares held and pledged by directors, managers, and major
shareholders holding over 10% of outstanding shares in the most recent
year and up to the publication of the annual report
64
9. Relationship among the Top Ten Shareholders 65
10. The number of Shares of an Enterprise held by the Company, the
Company’s Directors and officers and the Enterprises Controlled by the
Company Directly or Indirectly, and the Consolidated Shareholding
Percentage
IV. Gapital Overview 67
1. Capital and Shares 67
2. Issuance of Corporate Bonds 73
3. Preferred Shares 73
4. Issuance of American Depositary Shares 74
5. Status of Employee Stock Option Plan 76
6. Status of Employee Restricted Stock 76
7. Status of New Share Issuance in Connection with Mergers and
Acquisitions
76
8. Financing Plans and Implementation 76
V. Operational Highlights 77
1. Business Activities 77
2. Market and Sales overview 84
3. Status of Employees 97
4. Environmental Protection Expenditures 97
5. Labor Relations 104

6. Important Contracts 111
VI. Financial Information 112
1. Five-Year Financial Summary 112
2. Five-Year Financial Analysis 116
3. Audit Committee’s Report in the most recent year 120
4. Financial Statements in the most recent year 121
5. Consolidated financial statements in the most recent year 121
6. If the Company or Its Affiliates Have Experienced Financial Difficulties
for the Most Recent Fiscal Year or during the Current Fiscal Year up to
the Date of Publication of the Annual Report, the Annual Report Shall
Explain How The Difficulties Affected the Company’s Financial Situation
121
VII. Financial Status, Operating Results, and Risk Management 122
1. Analysis of Financial Status 122
2. Analysis of Operating Results 123
3. Analysis of Cash Flow 124
4. Major Capital Expenditure 125
5. Investment Policy in Last Year,Main Causes for Profits or
Losses,Imporvement Plans and the Investment Plans for Coming Year
125
6. Analysis of Risk Management 125
7. Other Major Risks 128
VIII. Special Notes 129
1. Affiliated Enterprises 129
2. Private Placement Securities in the Most Recent Years 138
3. The Shares of the Company Held or Disposed of by the Subsidiaries in
the Most Recent Years
138
4. Other supplementary information or explanations 138
IX. Significant issues in the most recent year and up to the publication of the
annual reportwhich might affect shareholders’ equity or price of shares
pursuant to Item 2,Paragraph 3, Article 36 of the Securities Exchange Law
138

Letter to Shareholders
Dear Shareholders,
2018 Summary of Results
In 2018, Advantech reported consolidated revenues of NT$ 48.8 billion, an increase of ten
percent over the NT$44.4 billion of 2017. Net income was NT$6.31 billion and diluted earnings
per share were NT$9.02. Gross profit margin was 38.2 percent, compared with 39.2 percent in
2017, and operating profit margin was 15.3 percent at the same level as a year earlier. Net
profit margin was 12.9 percent, from the previous year’s 13.9 percent.
By segment, the three major business groups- Embedded IoT, Industrial IoT and Service IoT-
all delivered double digit revenue growth in 2018. In US dollar term, Advantech achieved
US$1.6 billon revenues in 2018, up 11.2% from US$1.45 billion in 2017. The decrease of gross
margin was mainly due to component price increase. Thanks to operating efficiency
improvement, Advantech sustained operating margin at 15.3% in 2018.
We maintain our positive view for the future of industrial IoT. After several years’ development,
the overall industrial IoT benefit has become meaningful to customers, especially for
manufacturers. In fiscal 2019, we will continue to build our strengths in industrial IoT computing
platforms to achieve our target in both revenues and profit growth.
Our Development for IoT
Looking forward, we believe the overall industrial IoT growth pattern will enter into a new era
and the hardware and software integration service providers will benefit the most. The
WISE-PaaS software platform is designed for industrial IoT users. Our mission is to collaborate
with third party partners to introduce SRPs (Solution Ready Package), the software and
hardware combination solutions, to facilitate our platform customers in different vertical markets.
When the overall industrial IoT application is getting mature, the final winners will be cloud
service providers. Advantech intends to support and enable our partners in this area. Also
Advantech might participate in the growth through investments.
Given this belief, Advantech host our first IoT Co-Creation Summit in Suzhou in November
2018. Totally we had over 5000 guests together with Advantech to explore the future outlook of
the wave II and wave III growth profile of Industrial IoT application. At same time, Advantech
also introduced the latest embedded computing platforms and 34 SRPs at the summit. During
2019 and 2020, Advantech will expand WISE-PaaS global footprints and expect to achieve the
target of 1,000 WISE-PaaS VIP memberships by 2021.
Strengthening Corporate Governance and Business Leadership
Advantech markets “Advantech” as an industrial brand since the firm start-up and now
Advantech has operations in 23 countries around the world. In 2018, Advantech was awarded
1

as the top 5 Taiwan International Brand, the only B2B company at the top 10 Taiwan
International Brands. The “Advantech” brand valued US$500mn in 2018. To enhance corporate
governance and comply with international trend, Advantech transformed our Board
Organization from Supervisory Systems to Independent Directors Systems starting since 2017.
Our goal is the pursuit of excellence and sustainable operation and Advantech has established
its altruistic spirit at the core of its business culture, along with the pursuit of the best and
balanced interests of society, shareholders, customers, and employees.
K.C. Liu
Chairman and CEO of Advantech Co., Ltd.
2

II. Company Profile 2.1 Date of incorporation: September 7, 1981
2.2 Company history
Year Important Events
1981 Decided that the official company name would be “Advantech Co., Ltd.” and established the company at Sec. 2, Chongqing S. Road, Taipei City, to operate as a business for desktop computer module measurement automation systems. Invested a capital stock of NT$2,000,000
1985 Increased the authorized and paid-in capital to NT$5,000,000. Reorganized the company as a limited company and relocated it to 3F, No. 80, Ningbo W. Street, Taipei City. Launched various standardized PC-based automatic test system products.
1987 Relocated to 2F-1, No. 76, Sec. 3, Roosevelt Rd., Taipei City. Developed and produced PC/XT/AT plug-in data acquisition cards (i.e., the PC-Lab Card series) and launched them domestically and internationally.
1989 Established the Xindian factory at 4F, No. 10/12, Lane 130, Minquan Road, Xindian District, New Taipei County. Developed the industrial PC (IPC) product line and experienced smooth production and sales. This became Advantech’s second major product line.
1990 Increased the authorized and paid-in capital to NT$25,000,000. Relocated all non-factory departments to the office at 4F, No. 108-3, Minquan Road, Taipei County.
1991 Increased the authorized and paid-in capital to NT$60,000,000. Integrated the in-house developed industrial-grade CPU card and IPC chassis into a complete industrial-grade PC. Now offering a complete line of products, Advantech had become a comprehensive PC system component supplier for industrial automation applications, gradually gaining international recognition.
1992 Introduced the Industrial Workstation series for industrial monitoring workstations. Successfully developed the ADAM-4000 series of remote data acquisition modules, which became a breakthrough product for distal measurement signal processing and communication.
1993 Received with the 2nd National Award for Small & Medium Enterprises (National Association of Small & Medium Enterprises. Received ISO-9001 Quality Management System Certification. Developed the AWS-850/860-II IPC Workstation.
1994 Increased the authorized and paid-in capital to NT$120,000,000. Founded Advantech Germany with 100% equity acquired. Developed overseas sales offices. Cooperated with ITRI MIRL to introduce PC and industrial controllers and motion control cards. Developed the Embedded Computer Module series.
1995 Increased the authorized and paid-in capital to NT$190,000,000. Established global branch offices in Singapore (100% equity acquired) and Budapest, Hungary (30% equity acquired).
1996 Received the 4th Taiwan Industrial Technology Advancement Most Outstanding Award (MOEA, Taiwan, R.O.C.). Established a quality
3

assurance laboratory to significantly improve product quality. Symbol of Taiwan Excellence Winner (MOEA, Taiwan, R.O.C.) for the ADAM-4000 series.
1997 Approved for public offering. Increased the authorized capital to NT$1,000,000,000 and paid-in capital to NT$475,000,000. Established an audit office as well as internal control and audit systems. Established subsidiaries in Japan, the UK, and France with 100% equity acquired. Merged the U.S. subsidiary with 72.03% equity acquired. Received the 5th Taiwan Industrial Technology Advancement Most Outstanding Award (MOEA, Taiwan, R.O.C.). Symbol of Taiwan Excellence Winner for the PPC-102 series.
1998 Increased the paid-in capital to NT$807,500,000. Established subsidiaries in the Netherlands, Germany, and the Virgin Islands with 100% equity acquired. Established a joint venture in Italy with 25% equity acquired. Equity of the U.S. subsidiary increased from 72.03% to 100%. Purchased land (834 ping; equiv. 2,757.5 m2) in Neihu. 6th Symbol of Taiwan Excellence Gold Award Winner for the PPC-102T Panel Computer. 7th Symbol of Taiwan Excellence Winner for the PPC-140T multi-function panel PC and ADAM-5000 series of distributed DA&C systems. Received the Singapore Comdex Asia Best Hardware System Award for the PPC-140T multi-function panel PC. Received ISO-14001 Environmental Management System Certification. Awarded with the Most Representative Outstanding Company (Industrial Development Bureau, MOEA, Taiwan, R.O.C.).
1999 ADAM series received the 1st Taiwan Outstanding Safety Instrument Award. Began constructing the Advantech Neihu Technology Building with completion forecast for mid-2001. Paid-in capital increased to NT$1,307,000,000. Purchased land (2,147 ping; equiv. 7,097.5 m2) in Donghu and occupied the premises by the end of September. Completed IPO on the Taiwan Stock Exchange on December 13.
2000 Increased the paid-in capital to NT$1,745,000,000. Purchased additional land (1,445 ping; 4,776.9 m2) at the Donghu Plant. Merged with PCS for US$1.77 million. Established several investment companies: Advantech Investment, Advantech (Guangzhou Bond Zone) Co., ABR, AAC (BVI), AACB, APN, and AKL. Received the 2000 Outstanding Export & Import Performance Award (General Chamber of Commerce, Taiwan, R.O.C.).
2001 Increased the paid-in capital to NT$2,334,294,000. Moved into Advantech Headquarters in Neihu District, Taipei, in July 2001. Established AHK and AKMC and invested in AAU. Symbol of Taiwan Excellence Winner for the WEB-2143 Web Controller, EH-760 Home Terminal, ES-510 Multimedia Web Payphone, and PPC-153T Panel Computer.
2002 Increased the paid-in capital to NT$2,855,291,000. Established AASC and invested in ABB and Axiomtek Co., Ltd. Received “2002 Headquarters Operation Certification” (Industrial Development Bureau, MOEA, Taiwan, R.O.C.).
4

Implemented the Innovation Center Operations Plan Embedded Systems R&D Center with approval from the Department of Industrial Technology (MOEA, Taiwan, R.O.C.). Accepted as the sole Gold-Level Partner in Microsoft’s Windows Embedded Partner ODM Category. Symbol of Taiwan Excellence Winner for the EH-7102G/GH Home Appliance and WebLink2059-BAR/CE/SDA/SKT Web-Enabled Device Connection via PC Card.
2003 Increased the paid-in capital to NT$3,413,039,000. Established AEU and invested in Advantech Consulting Co., Ltd. Received “2003 Headquarters Operation Certification” from the Industrial Development Bureau (MOEA). Symbol of Taiwan Excellence Winner for the ADAM-6000 series of intelligent data acquisition network control modules.
2004 Increased the paid-in capital to NT$3,742,962,000. Won first prize in the 2004 Control Design (USA) Reader’s Choice Award for single-board computers. Received first prize for the 2004 Editor’s Choice Award under the human–machine interface (HMI) category from the magazine Control Engineering (USA) for the FPM-3170 17” Flat Panel Monitor.
2005 Increased the paid-in capital to NT$4,489,003,000. Formed a strategic alliance with AsusTek; Advantech acquired 1.36% equity of AsusTek and AsusTek acquired 15% equity of Advantech through stock swap. Symbol of Taiwan Excellence Winner for the TPC-60S, UNO-3062, and AWS-8100G. Received third prize in the 2005 Readers’ Choice Award for Industrial Computers from Control Buyer’s Guide (USA). Embedded Control Europe magazine readers nominated the TREK-755 Sunlight Readable Model for the Gold Award of the 13th MOEA Industrial Technology Advancement Award of Excellence.
2006 Increased the paid-in capital to NT$4,636,295,000. Received the Readers’ Choice Award for single-board computers from Control Design. Received the 2nd Corporate Social Responsibility Award from the magazine Global Views (Taiwan, R.O.C.). Received The Most Growth in Asia Award from Microsoft. Received the Intel Associate Partner of the Year and Multi-Core Solution Contest Award.
2007 Increased the paid-in capital to NT$4,915,770,000. Received the 3rd Corporate Social Responsibility Award, Top Honor for 2006 from Global Views (Taiwan, R.O.C.). Received the 1st Corporate Social Responsibility Award from CommonWealth Magazine (Taiwan, R.O.C.) Received the Computex Taipei Best Choice Award for the ARK-3381. 15th Symbol of Taiwan Excellence Winner for the UibQ-230, ARK-4170, and ADAM-5550.
2008
Increased the paid-in capital to NT$5,113,458,000. Received 4th prize in the 2nd Corporate Social Responsibility Award from CommonWealth Magazine. 16th Symbol of Taiwan Excellence Winner for the UbiQ350, VITA350, UNO-2182, TPC-30T, TPC-32T, IPPC-7157A, and IPPC-7158B.
5

2009
Established Shanghai Advantech Intelligent Services Co., Ltd. (AiSC). Established Xi’An Advantech Software Co., Ltd. Acquired Advantech Yang-Kwong Building as an office building in Neihu District, Taipei City. Increased the paid-in capital to NT$5,161,337,000. Received the Decade Industrial Contribution and Decade Leading Industry awards from Chinagkong. 18th Symbol of Taiwan Excellence Winner for the IPPC-8151S series, APAX-5000 series, UNO-1100 series, UTC-W101E, NCP-7560, and MIC-5322. Advantech and the U.S. subsidiary jointly acquired 60% equity of Advantech Brazil S/A (ABR).
2010 Advantech Co., Ltd. established Advantech Intelligent Co., Ltd. Decreased the paid-in capital to NT$5,016,337,000. Received the Taiwan Top 12 Global Brands Award. Advantech paid EUR12.85 million to acquire 100% equity of DLoG GmbH Company of Augusta Technologies AG. Advantech paid ₩2,668 million to acquire 100% equity of Advantech KR Co., Ltd. of SG Advantech Co., Ltd. Advantech paid £3.34 million to acquire 100% equity of Innocore Gaming Ltd.
2011 Increased the paid-in capital to NT$5,517,971,000. Advantech paid NT$93 million to acquire 99.36% equity of ACA. 19th Symbol of Taiwan Excellence Winner for the ARK-VH200, FWA-6500, NCP-5260, PC/104, PCM 9562, PIT-1501W, SOM-5788, Advantech Touch Panel Computer, and TREK-550. Received the Taiwan Top 10 Global Brands Award.
2012 Increased the paid-in capital to NT$5,639,971,000. Advantech paid NT$306 million to acquire 50% equity of Advansus Corp. 20th Symbol of Taiwan Excellence Winner for the TREK-753, FPM-8151H, ADAM-6117, ADAM-6118, ADAM-6150, ADAM-6151, ADAM-6156, ADAM-6160, SOM-7562, MIO-5270, MIO-2260, PCM-3363, AIMB-213, UNO-4600 series, ITM-5115R-PA1E, ARK-DS220, ARK-DS520, and IPC-6025. Ranked 11th for the Taiwan 2012 Top-20 Global Brand Award with a brand value of US$260 million. Established a subsidiary in India (AIN).
2013 Increased the paid-in capital to NT$5,652,059,000. Ranked 11th in the 2012 Corporate Citizen Award from CommonWealth Magazine. Advantech Industrial Automation Group HMI TPC and SPC series won the 2013 iF Product Design Award in Germany. 21st Symbol of Taiwan Excellence Winner for the FWA-6510, MIC-5332, ATCA-7310, MIO-5250, MIO-2261, PCM-9389, ARK-1120, ARK-DS262, ARK-DS762, UBC-D31, IDS-3115, IDK-2131, TREK-722, TPC-671/1071/1271/1571, WebOP, BEMG-4110/4220, ADAM-2000, and EKI-6340. Paid NT$319 million to acquire 70.2% equity of POS manufacturer AdvanPOS. Paid NT$730 million to acquire 100% equity of the controller manufacturer LNC. Paid £5.85 million to acquire 100% equity of the wisdom embedded displays manufacturer GPEG (UK).
6

2014 Increased the paid-in capital to NT$5,714,511,000. Established Advantech Plus Technology Center (A+TC), Kunshan, China. Grand opening of the Advantech Linkou IoT Campus. Received the CSR Best Workplace Excellence Award from Global Views Monthly in 2014. 22nd Symbol of Taiwan Excellence Winner for the CGS-6000, ATCA-9112, Advantech WebAccess, APAX-5620, IDK-2110, TPC-1840WP, TPC-2140WP, SPC-1840WP, FPM-7181W, FPM-7211W, ADAM-6200 series, EKI-3000 series, SOM-5894, ARK-1122F, UBC-200, SOM-7567, SOM-3565, MIC-5333, AMiS-50, POC-W181, and IPS-M420. Formally established the Advantech Investment Department to actively deploy solutions for smart city and IoT markets. Composed Advantech Global smart city case studies for the publication of “Smart City” in Simplified and Traditional Chinese as well as English.
2015 Increased the paid-in capital to NT$6,318,531,000. 23rd Symbol of Taiwan Excellence Winner for the TREK-674, TREK-306, PWS-870, UTX-3115, DPX-435 (with the DPX-S1000 chassis), SOM-5893, SOM-6896, UBC-220, PCIE-181X, Mic-3100, ARK-2151V, DS-862, MIT-M101, ATCA-9223, EKI-9778, UNO-2000 series, IDS-3121W, WebAccess 8.0, Pocket Pad, and ARK-5261. 23rd Symbol of Taiwan Excellence Award Gold and Silver Medal Nominee for the MIT-M101 and MICA-071.
2016 Increased the paid-in capital to NT$6,326,091,000. 24th Symbol of Taiwan Excellence Winner for the ASR-3100, POC-W242, TREK-733L, TREK-973, DPX-E135, MIO-3260, EKI 5 series, SOM-7568 TPC, WISE4 series, WISE-3100, ARS-2510, UNO-3483G, TREK-773, ITA-2230, ROM-7421, IDS-3118W, AIMB-T1215, DS-270, APAX-5580, ARK-2230, UNO 1 series, and IPS-M420S; and Taiwan Excellence Award Gold and Silver Medal Nominee for the REK-773. Received the 2016 iF product design award in Germany for the PWS-870.Formed a strategic alliance with Inventec Corporation to establish the joint venture company “AIMobile Co., Ltd.” Acquired 100% stock rights of B+B SmartWorx, Inc. from Graham Partners for US$9.985 million. ATC (HK) purchased 100% stock rights of Yeh Chiang (Kunshan) Co., Ltd. from Yeh Chiang Technology (Cayman) Corp. for RMB$9.35 million.
2017 Increased the paid-in capital to NT$6,330,741,000. 25th Symbol of Taiwan Excellence Winner for the DMS-SA21, ARS-P3800, AIM-65, UNO-2271G, IPPC-5211WS, HIT-W101C, SOM-3568, ARK-2231R, ARK-2230R, ARK-1124H, ARK-1124U, ARK-1124C, ECU-4784, AIIS-1200, AIIS-5410P, MIC-7500, DS-980, EPC-T2285, MVP-3245, ADAM-3600, ADAM-3617, ADAM-3618, ADAM-3624, ADAM-3651, ADAM-3656, and EKI-7700; as well as Gold and Silver Medal Winner for WebAccess/Cloud and the WISE-DK1520 starter kit/development kit for RTX v2.0 CPU Module ROM-3420. Advantech Linkou Industrial Park Stage II construction officially completedat the end of October. Advantech announced that it will acquire a 60% stake in the South Koreanmedical display company Kostec. Advantch invests 12 million private placement common shares of Winmate at a price of NT$45 per share (total, NT$540 million) Advantech ranked No. 6 (with brand value USD484 million) in the Taiwan Top 20 Global Brands Award.
7

2018 Increased the paid-in capital to NT$6,982,275,000. Subsidiary company Advantech Corporate Investment, and the Institute for Information Industry, jointly invested in the establishment of an Industrial Internet of Things platform company called Yun Yan, Wu-Lian Co., Ltd., and each own half of the total equity. Subsidiary company Advantech Corporate Investment and the Industrial Technology Research Institute jointly funded the establishment of the joint venture Huan Yan, Jhih-Lian Co., Ltd., with both parties investing 50% of the total capital. Advantech subsidiary company ASG acquired ATH’s equity interest and jointly increased its joint venture with ATH. Consequently, the capitalization of ACL and ASG is now held at 51% and 49% respectively. Advantech opens its new European Service Center and it becomes the first Advantech Industry 4.0 real site demo in Europe. 26th Symbol of Taiwan Excellence Silver Medal Winner for the iPS-M100 Hot Swappable Medical-grade Industrial Power System and POC-WP243 24” Medical Computer 26th Symbol of Taiwan Excellence Winner for the CRV31-430WP 43”
Industrial Curved Monitor, the TPC-5000 series Modular Industrial Touch Panel Computer and the SRP-ESP315 Solar Power Management Solution. There are a total of 17,500,000 privately held ordinary shares of AzureWave Technologies, Inc. The subscription price per share is $17.1 TWD and the total subscription amount is $299,250,000 TWD. In addition, a total of 12,099,000 shares were acquired on the centralized stock exchange, resulting in Advantech Investment holding 19.65% of the equity. The Company has subscribed 1,004,310 shares of common stock of Nippon RAD Inc. (a Japanese system integration corporate). The subsidiary Advaninvest (whose 100% of shares is held by the Company) has acquired 15% of shares (15,710,000 shares of common stock) of MILDEX via subscription by a payment of NT$ 200 million. The Vietnamese Subsidiary (AVN) and the Russian Subsidiary (ARU) are established. SIoT (Cayman) and SIoT(China) were established by the Subsidiary AAC (BVI). The Subsidiary Advaninvest acquired 25% and 49% of shares from ILINK ICT and Yung-yen Corp., respectively by investing NT$ 10.067 million and NT$ 4.9 million in cash, respectively. The second-tier subsidiary Advantech (Shanghai) acquired 45% of shares from Yen-le Corp. by investing NT$ 4.392 million in cash. Advantechheld the first Advantech IoT Co-Creation Summit at Suzhou International Expo Center today with over 6 thousand Advantech clients and partners around the world attended the Summit which Advantech had introduce itsnewest IoT platform structure WISE-PaaS 3.0 and 32 IoT solution ready packages (SRPs) that was co-created with software and industry partners. Advantech ranked No. 5 (with brand value USD500 million) in the Taiwan Top 20 Global Brands Award. Advantedh DLT-V4108 Vehicle-Mounted Terminal Wins 2018 Red Dot Product Design Award.
8

2019 Advantech complete the 80% stake acquisition of OMRON Nohgata, a subsidiary of OMRON Corporation. OMRON Nohgata will now be known as “Advantech Technologies Japan” (ATJ) . Advantech + Technology Campus (original referred to as “A+TC”), the English name is officially changed to Advantech Kunshan Technology Campus (AKTC) started from Feb 2019. Advantech subscribed shares from the Turkish Company Alitek and issued new shares, and Advantech held 60% of shares of Alitek. The 27th Symbol of Taiwan Excellence Winner for the compact fanless system MIC-7420. The 27th Symbol of Taiwan Excellence Winner for the LPWAN wireless moduel WISE-4200. The 27th Symbol of Taiwan Excellence Winner for the 16-ch DAQ platform MIC-1816.
9

III. Corporate Government Report 3.1 Organization 3.1.1 Organizational Chart
Chairman/ President
Infrastructure
Corporate Quality
IT
Human Resource
Legal
Brand Development & Public Relations
CSR
Finance
Manufacturing Business Planning & Analysis
Strategic Procuremen
Board of Directors
Shareholders
- Greater China - North America - Europe - Northern Asia - LATAM & Intercon
Global Service
CTO Office
Compensation Committee
Manufacturing Strategic Business Group
Regional Business Units
Corporate Investment
Digital Marketing & CRM
Industrial IoT Group
Embedded-IoTGroup
Networks and Communications
Group
Service-IoT Group
Advantech Collaborative Design Innovation
Internal Auditing
Audit Committee
10

3.1.2 Major Corporate Function
Main Main Responsibilities
Internal Auditing
Review the adequacy and consistency of internal control processes to ensure the effectiveness of internal control. Perform audit according to the annual plan approved by board meeting. On a request basis, conduct project-based audit to provide management with operational status of internal control processes to enhance corporate governance as well as to establish corporate risk assessment and control mechanism.
Legal
1. Review contracts and agreements 2. Handle company’s lawsuits and disputes 3. Provide internal legal trainings and legal opinions 4. Handle company’s Intellectual Property Right issue.
Business Planning & Analysis
Develop corporate strategies and performance indicators as well as supervising them. Assist management team to formulate annual plans and the implementation and execution of follow-up projects.
Finance
1. Responsible for budgeting, accounting, financial report, variance analysis; planning, management and control of tax administration, finance, and stock affairs. 2. Domestic and oversea financial statement preparation and analysis. 3. Operating performance of oversea investment 4. Cash flow management
IT 1. Information technology execution and management. 2. Crucial technology implementation and professional technical services.
Human Resource
1. Work with corporate and business leaders to develop and execute human resources strategies. 2. Enhance employee satisfaction and employer brand. 3. Establish human resources policies and compensation structure; develop and execute talent recruiting, training and empowerment. 4. Develop employees’ core competencies, and enhance organization capability.
Brand Development & Public Relations
1. Global branding promotion and company identity system. 2. Global branding marketing campaigns coordination and related marketing collaterals production. 3. Company’s public relations.
CSR Focus on “Enterprise-academic Collaboration”, “Social care” and “employee care” to contribute to the society.
CTO Office
Manage IoT.SENSE (IoT Solution Enabling Services) to develop and promote WISE-PaaS (Industrial PaaS Cloud Platform) and IoT Solutions, including Software Enabling, Consulting Services, Solution Co-creation and Knowledge Sharing.
Global Service Manage Advantech worldwide service centers to provide one-stop global services and total solutions, including design, manufacture, quality management, procurement, logistics, assembly, repair and maintenance.
Corporate
Quality
1. Coordinate with related department, including RD, manufacturing, sales and after services, to ensure and enhance product quality, monitor and prevent major quality deviation. 2. Develop and implement company quality assurance system, to meet and satisfy the needs of customer and ISO requirements. 3. Design process control to assure design quality in product development phase. 4. Evaluate and apply product regulations. 5. Monitor and enhance quality of products of factory and supply chains. 6.Plan and implement customer services, and establish global services strategies to provide real-time service.
11

Strategic Procurement
1. Negotiate and purchase required components and equipment. 2. Develop new vendors of components and equipment in response to rapid
changing technology evolution. 3. Develop integrated purchasing strategies that support organizational
strategies, goals and objectives. 4. Develop the supply chain strategy, and contact procurement for the long-term
and competitive components and material supply.
Corporate Investment
Develop corporate investment roadmap based on corporate strategy, and define project management guidelines. Proactively and passively look for corporate investment and M&A opportunities with discipline and focus, properly execute investment strategy and evaluate the potential targets. The goal is to complete strategic business portfolio and to enhance growth momentum.
Digital Marketing & CRM
Expending digital marketing channels and methodologies toward the target sector market communication, and leverage the big data analysis plus CRM management including sales automation, productivity enhancement, real-time support, to achieve the automatic marketing intelligence.
ACDI (Advantech
Collaborative Design
Innovation)
1.Collaboration of corporate design functions to achieve consistent design, style, and image for brand name. 2.Integration and optimization of both internal and external design resources.
Manufacturing Setting production goal & capacity planning; and manage production, quality, logistics and operation related executions.
Industrial IoT Group
Focus on General IIoT, Industrial Equipment Manufacturing (IEM), Intelligent Factory (iFactory), Energy and Environment (E&E), Transportation and Industrial Networking (iNetworking) sectors and applications to be responsible for the sales of industrial IoT products and solution ready platforms related to marketing, research & development, manufacture and implementation of solutions sales and integrated solutions to clients.
Embedded-IoT Group
As a global leader of the embedded computing market, Advantech Embedded-IoT Group not only offers a wide range of embedded boards, Intelligent systems, industrial peripherals and design-in services, but also provides streamline services form R&D, manufacturing, to global support and services. Furthermore, devoted regionally-based embedded service teams in Taiwan, China, USA, Germany, UK to offer medical, gaming, transportation, manufacturing, self-service solutions and dedicated DMS (Design and Manufacture Serv ices) that enable domain sector dep loyment . To address the market for IoT applications, Embedded-IoT Group developed a series of integrated IoT solutions and services from edge computing to cloud services, including M2.COM wireless sensor node, IoT Gateways, Edge Intelligence Servers(EIS), WISE-PaaS software platform, and third party cloud services. Moreover, following the SRP concept, built an organization of E2I (Equipment to Intelligence) SBU to accelerate the IoT solution business development and implementation in regions.
Networks and Communications
Group
Provide product development, production, and sales of video, network and communication related products to clients.
Service-IoT Group
Provide product development, production, marketing and sales of computers of vertical applications and software integration solutions to clients, in three vertical domains: iHealthcare, iRetail, and iLogistics.
12

3.2 Directors and Management Team
3.2.1 Directors
March 30, 2019
Title Nationality Name Date elected Term
(Years)First elected
Shareholding when
elected Current shareholding
Spouse and Minor
shareholdings
Shareholding by
nominee
arrangement Education and selected past positions
Current
additional
positions
Other heads, directors, or
supervisors as spouse or kin
within the second degree
Shares % Shares % Shares % Shares % Title Name Relation
Chairman ROC K.C. Liu 05.26.2017 3 years 11.11.1985 23,292,484
3.68 25,620,886 3.67 1,343,794 0.19 0 0 Founder of Advantech:
Former salesman of Instruments Dept. of
Hewlett-Packard; Department of
Telecommunications Engineering, National
Chiao Tung University
Note 1 None None None
Director ROC Advantech Foundation. 05.26.2017 3 years 05.26.2017 18,244,889 2.88 20,288,715 2.90 0 0 0 0 President of Le Wel Co.,Ltd.
Tatung Institute of Technology,Taiwan None 2 None None None
Representative Chaney Ho 61,011 0 99,109 0.01 175,587 0.03 0 0
Director ROC AIDC Investment Coorp. 05.26.2017 3 years 05.26.2017 74,636,266 11.79 82,097,182 11.75 President of Greater China of 3M
Bachelor Chemical Engineering,
Chinese Culture University
Note 3 None None None
Representative Donald Chang
Director ROC Ted Hsu 05.26.2017 3 years 05.25.2011 0 0 0 0 0 0 0 0 Chief Strategy Officer of ASUSTeK
EMBA,National Chiao Tung University
Note 4 None None None
Independent
Director
ROC Jeff Chen 05.26.2017 3 years 06.18.2014 0 0 0 0 0 0 0 0 VP of Stanley Black & Decker and President
of Asia Region
EMBA,Northwestern University
None None None None
Independent
Director
ROC Joseph Yu 05.26.2017 3 years 05.25.2011 249 0 273 0 1,099 0 0 0 PhD of Business Administration, University
of Michigan
Professor, Department of Business
Administration, National Chengchi
University
Note 5 None None None
Independent
Director
ROC Benson Liu 05.26.2017 3 years s 05.26.2017 0 0 0 0 0 0 0 0 Chairman and President of Bristol-Myers
Squibb (Taiwan) Ltd.
Master, International Business
Administration, University of Northrop, USA
Note 6 None None None
Note 1: Simultaneously act as the chairman of the following companies:
Advantech Foundation、Beijing Yan Hua Xing Ye Electronic Science & Technology Co., Ltd. (ACN)、Advantech Investment Fund-A Co., Ltd. Representative、Advanixs Corporation.Representative.、Advantech Technology (China) Company Ltd. (AKMC)、Shanghai Advantech Intelligent Services Co., Ltd. (AiSC)、Xi’an Advantech Software Ltd. (AXA)、Advantech Intelligent Service (AiST) Representative、K&M Imvestment Co.,Ltd.、AdvanPOS Technology Co., Ltd. (AdvanPOS) Representative、Aimobile Co., Ltd. Representative、Advantech Service-IoT Co., Ltd.、Advantech Innovative Design Co., Ltd. Representative.、Advantech Japan Co., Ltd. (AJP)、B+B Smartworx Inc.、Kostec co.,Ltd.、ADVANTECH SERVICE-IOT (SHANGHAI) CO., LTD. Simultaneously act as the director of the following companies: AIDC Investment Corp.、Spring Foundation of NCTU、LNC Technology Co., Ltd. (LNC) Representative、LNC DONG GUAN CO., LTD.、Advantech Europe B.V.(AEU)、Advantech Service-IoT GmbH. (A-SIoT)、ADVANTECH INTERNATIONAL PT. (AID)、Advantech
13

Electronics,S. De R. L. De C. (AMX)、Advantech Technology Co., Ltd. (ATC)、HK Advantech Technology Co., Ltd. (ATC (HK))、Advantech Automation Corp.(BVI) (AAC(BVI))、Advantech Automation Corp.(HK) Limited.(AAC (HK))、Advantech Co. Singapore Pte, Ltd. (ASG)、Advantech Corp.(ANA)、Advantech Europe Holding B.V.(AEUH)、Advantech Co., Malaysia Sdn.Bhd (AMY)、Advantech KR Co., Ltd. (AKR)、Advantech Corporation (Thailand) Co., Ltd (ATH)、and Advantech Industrial Computing India Private Limited (AIN)。
Simultaneously act as the supervisor of the following companies: Moxa Technology Co., Ltd.
Note 2: Simultaneously act as the director of the following companies: Beijing Yan Hua Xing Ye Electronic Science & Technology Co., Ltd(ACN)、Advantech Co., Malaysia Sdn.Bhd. (AMY)、Advantech KR Co., Ltd. (AKR)、Advantech Industrial Computing India Private Limited. (AIN)、Board Director of Unabiz Pte Ltd.
Note 3: Simultaneously act as the independent director of the following companies: Chung Hwapulp Corp. Note 4: Simultaneously act as the chairman of the following companies: Eeizprise Inc. Simultaneously act as the director of the following companies:
ASUSTeK、Asmedia Technology Inc.、Eusol Biotech Co.,Ltd.、i-motion Inc. Note 5: Simultaneously act as the independent director of the following companies: Yuanta Futures Co,Ltd. and Yuanta Bank Co., Ltd. Note 6: Simultaneously act as the independent director of the following companies:
Global Unichip Corp.、Vanguard International Semiconductor Co. Simultaneously act as the director of the following companies: Maywufa Company Ltd.Vice Chairman.
14

Major shareholders of the institutional shareholders
March 30, 2019 (stop transfer date)
Name of Institutional shareholders Major shareholders
AIDC Investment Corp. K.C. Liu
Mary Chang
Advantech Foundation
15

Information regarding directors and supervisor
Criteria
Name
Meet the Following Professional Qualification Requirements, Together with at Least Five Years Work Experience
Independence criteria (Note) Number of Other Taiwanese Public Companies Concurrently Serving as a Compensation Committee Member in Taiwan
An Instructor or Higher Position in a Department of Commerce, Law, Finance, Accounting, or Other Academic Department Related to the Business Needs of the Company in a Public or Private Junior College,College or University
A Judge, Public Prosecutor, Attorney,Certified Public Accountant, or OtherProfessional or Technical Specialists Who Has Passed a NationalExamination and Been Awarded a Certificate in a Profession Necessaryfor the Business of the Company
Have Work Experience in the Area of Commerce,Law, Finance, or Accounting, or Otherwise Necessary for the Business of the Company
1 2 3 4 5 6 7 8 9 10
K.C. Liu 0 Chaney Ho 0 Donald Chang
1
Ted Hsu 0 Jeff Chen 0 Joseph Yu 2 Benson Liu 2 Note: Please tick the corresponding boxes that apply to the directors or supervisors during the two years prior to being elected or during the term of office. 1. Not an employee of the Company or any of its affiliates. 2. Not a director or supervisor of the Company or any of its affiliates. Not applicable in cases where the person is
an independent director of the Company, its parent company, or any subsidiary as appointed in accordance with the Act or with the laws of the country of the parent or subsidiary.
3. Not a natural-person shareholder who holds shares, together with those held by the person’s spouse, minor children, or held by the person under others’ names, in an aggregate amount of 1% or more of the total number of outstanding shares of the Company or ranking in the top 10 in holdings.
4. Not a spouse, relative within the second degree of kinship, or lineal relative within the third degree of kinship, of any of the persons in the preceding three subparagraphs. 5. Not a director, supervisor, or employee of a corporate shareholder who directly holds 5% or more of the total number of outstanding shares of the Company or who holds shares
ranking in the top five holdings. 6. Not a director, supervisor, officer, or shareholder holding 5% or more of the shares, of a specified company or institution which has a financial or business relationship with the
Company. 7. Not a professional individual who is an owner, partner, director, supervisor, or officer of a sole proprietorship, partnership, company, or institution that provides commercial, legal,
financial, accounting services or consultation to the Company or to any affiliate of the Company, or a spouse thereof. These restrictions do not apply to any member of the remuneration committee who exercises powers pursuant to Article 7 of the “Regulations Governing the Establishment and Exercise of Powers of Remuneration Committees of Companies whose Stock is Listed on the TWSE or Traded on the TPEx“.
8. Not having a marital relationship, or a relative within the second degree of kinship to any other director of the Company. 9. Not been a person of any conditions defined in Article 30 of the Company Law. 10. Not a governmental, juridical person or its representative as defined in Article 27 of the Company Law.
16

3.2.2 Management Team March 30, 2019
Title Nationality Name Date elected
Shareholding Spouse and MinorShareholdinng
Shareholding by nominee arrangement
Education and selected past positions
Current additional positions
Spouse or relatives within two degrees who
are managers Shares % Shares % Shares % Title Name Relationship
Chairman ROC K.C. Liu 06.01.2003 25,620,886 3.67 1,343,794 0.19 0 0 Founder of Advantech Co., Ltd.Salesman of Instruments Dept. of Hewlett-Packard Department of Telecommunications Engineering, National Chiao Tung University
Note1 None None None
Executive Board Director
ROC Chaney Ho 05.01.2004 69,109 0.01 175,587 0.03 0 0 President of Li-Wei Company Tatung Institute of Technology
Note2 None None None
President ROC Eric Chen 09.01.2017 268,215 0.04 0 0 0 0 Elitegroup Computer Systems Co., Ltd. Tai Sen Enterprise Co., Ltd. Department of Computer Science, Tamkang University
None3 None None None
President ROC Miller Chang 09.01.2017 30,885 0 0 0 0 0 Phoenix Technologies Ltd. EMBA,National Taiwan University of Science and Technology
None None None None
Vice President
ROC Linda Tsai 09.01.2017 217,606 0.03 0 0 0 0 QUANTA COMPUTER INC. Syracuse University Master of Information Resources
None None None None
Vice President
ROC Deyu Yin 09.30.2004 0 0 425,199 0.06 0 0 Director of Human Resources, Delta Group Bachelor of Economics, National Taiwan University Tulane University EMBA
Note4 None None None
Accounting Officer
ROC Rorie Kang 04.13.2011 3,409 0 0 0 0 0 Affiliates of Advantech Group Senior Accountant Department of Accounting, Chung Hsing University
None None None None
Note 1: Simultaneously act as the chairman of the following companies: Advantech Foundation、Beijing Yan Hua Xing Ye Electronic Science & Technology Co., Ltd. (ACN)、Advantech Investment Fund-A Co., Ltd.
17

Representative、Advanixs Corporation.Representative.、Advantech Technology (China) Company Ltd. (AKMC)、Shanghai Advantech Intelligent Services Co., Ltd. (AiSC)、Xi’an Advantech Software Ltd. (AXA)、Advantech Intelligent Service (AiST) Representative、K&M Imvestment Co.,Ltd.、AdvanPOS Technology Co., Ltd. (AdvanPOS) Representative、Aimobile Co., Ltd. Representative、Advantech Service-IoT Co., Ltd.、Advantech Innovative Design Co., Ltd. Representative.、Advantech Japan Co., Ltd. (AJP)、B+B Smartworx Inc、
Kostec co.,Ltd.、ADVANTECH SERVICE-IOT (SHANGHAI) CO., LTD. Simultaneously act as the director of the following companies: AIDC Investment Corp.、Spring Foundation of NCTU、LNC Technology Co., Ltd. (LNC) Representative、LNC DONG GUAN CO., LTD.、Advantech Europe B.V.(AEU)、Advantech Service-IoT GmbH. (A-SIoT)、ADVANTECH INTERNATIONAL PT. (AID)、Advantech Electronics,S. De R. L. De C. (AMX)、Advantech Technology Co., Ltd. (ATC)、HK Advantech Technology Co., Ltd. (ATC (HK))、Advantech Automation Corp.(BVI) (AAC(BVI))、Advantech Automation Corp.(HK) Limited.(AAC (HK))、Advantech Co. Singapore Pte, Ltd. (ASG)、Advantech Corp.(ANA)、Advantech Europe Holding B.V.(AEUH)、Advantech Co., Malaysia Sdn.Bhd (AMY)、Advantech KR Co., Ltd. (AKR)、Advantech Corporation (Thailand) Co., Ltd (ATH)、and Advantech Industrial Computing India Private Limited (AIN)。 Simultaneously act as the supervisor of the following companies: Moxa Technology Co., Ltd.
Note 2: Simultaneously act as the director of the following companies: Beijing Yan Hua Xing Ye Electronic Science & Technology Co., Ltd(ACN)、Advantech Co., Malaysia Sdn.Bhd. (AMY)、Advantech KR Co., Ltd. (AKR)、Advantech Industrial Computing India Private Limited. (AIN)、Board Director of Unabiz Pte Ltd.
Note 3: Simultaneously act as the director of the following companies: Advantech Investment Fund-A Co., Ltd.、Advanixs Corporation.、Advantech Innovative Design Co., Ltd.、Advantech Intelligent Service AdvanPOS Technology Co., Ltd.
Note 4: Simultaneously act as the director of the following companies: Advantech Innovative Design Co., Ltd.
18

3.2.3 Remuneration of Directors, Presidents, and Vice Presidents
Remuneration of Directors Unit: NT$ Thousand
Title Name
Rremuneration Ratio of Total Remuneration(A+B+C+D) to net
income % (Note 10)
Relevant Remuneration Received by Directors who are Also Employees Ratio of Total
Compensation
(A+B+C+D+E+F+G)t
o net income %
(Note 10)
Compensation Paid
to Directors from an
Invested Company
Other than the
Company’s
subsidiary (Note11)
Basc Compensation
(A) (Note 2)
Severance Pay (B)
Directors Compensation
(C)
Allowances (D)(Note 4)
Salary, bonuses
and allowance (E)
(Note 5)
Severance Pay (F) Employee Compensation (G) (Note 6)
Ad
vante
ch
From
All
Co
nso
lidate
d E
ntitie
s (No
te 7
*)
Ad
vante
ch
From
All
Co
nso
lidate
d E
ntitie
s (No
te 7
)
Ad
vante
ch
Fro
m A
ll C
on
solid
ated
En
tities (N
ote
7)
Ad
vante
ch
From
All
Co
nso
lidate
d E
ntitie
s (No
te 7
)
Ad
vante
ch
From
All
Co
nso
lidate
d E
ntitie
s (No
te 7
)
Ad
vante
ch
From
All
Co
nso
lidate
d E
ntitie
s (No
te 7
)
Ad
vante
ch
From
All
Co
nso
lidate
d E
ntitie
s (No
te 7
)
Advantech From All Consolidated
Entities (Note 7)
Ad
vante
ch
Fro
m A
ll C
on
solid
ated
En
tities (N
ote
7)
Cash Stock Cash Stock
Chairman K.C.Liu
0 0 0 0 10,600 10,600 0 0 0.17% 0.17% 5,100 5,100 0 0 1,326 0 1,326 0 0.27% 0.27% 0
Director
Advantech Foundation
Representati Chaney Ho
Director
AIDC Investment Corp.
Representati Donald Chang
Director Ted Hsu
Independen
Director Jeff Chen
Independen
Director Joseph Yu
Independen
Director Benson Liu
19

Range of Remuneration
Range of Remuneration
Names of Directors
First four categories of remuneration (A+B+C+D) First seven categories of remuneration (A+B+C+D+E+F+G)
Advantech (Note 9) Consolidated subsidiaries (Note 10) Advantech (Note 9) Consolidated subsidiaries
(Note 10)
Under NT$2,000,000
K.C. Liu、Advantech Foundation, Ted Hsu, AIDC Investment Corp.,Jeff Chen, Joseph Yu , Benson Liu.
K.C. Liu、Advantech Foundation, Ted Hsu, AIDC Investment Corp.,Jeff Chen, Joseph Yu ,Benson Liu.
Advantech Foundation,Ted Hsu,Jeff Chen, AIDC Investment Corp.,Joseph Yu, Benson Liu.
Advantech Foundation, Ted Hsu, Jeff Chen, AIDC Investment Corp., Joseph Yu, Benson Liu.
NT$2,000,001 – NT$5,000,000 - - - -
NT$5,000,001 – NT$10,000,000 - - K.C. Liu K.C. Liu
NT$10,000,001 – NT$15,000,000 - - - -
NT$15,000,001 – NT$30,000,000 - - - -
NT$30,000,001 – NT$50,000,000 - - - -
NT$50,000,001 – NT$100,000,000 - - - -
Over NT$100,000,000 - - - -
Total 7 7 7 7 Note 1: Illustrate the name of each director (the institutional shareholder and its representative should be illustrated separately) and disclose the payment amount in a lump sum. Please fill
out this form and form (3-1) or (3-2) for the director who is also the President or Vice President of the Company. Note 2: Refers to the remuneration (including director salary, duty allowances, severance pay, various bonuses, incentives, etc.) paid to the directors in the most recent year. Note 3: Refers to the remuneration to directors from the earnings of the most recent year proposed and approved by the board of directors prior to the shareholders’ meeting. Note 4: Refers to the relevant business expenses of the directors in the most recent year (including traveling expenses, special expenses, allowances, dormitories, and transportation
vehicles). For the housing, automobiles and other transportation vehicles, or the exclusive personal expenses provided, the nature and cost of the assets, the actual or imputed rent at fair market value, the gasoline expense, and other payments should be disclosed. In addition, for the chauffeur appointed, please explain in the notes regarding the remuneration paid but the amount will not be included in the total remuneration amount.
Note 5: Refers to the salary, job allowance, severance pay, resignation compensation, prize money, incentive payments, traveling expenses, special expenses, allowances, dormitories, and transportation vehicles paid to the directors who are also employees (including concurrent President, Vice President, other managers, and employees) in the most recent year. For the housing, automobiles and other transportation vehicles, or the exclusive personal expenses provided, the nature and cost of the assets, the actual or imputed rent at fair market value, the gasoline expense, and other payments should be disclosed. In addition, for the chauffeur appointed, please explain in the notes regarding the remuneration paid but the amount will not be included in the total remuneration amount.
Note 6: Refers to the employee bonuses (including stock dividend and cash dividend) paid to the directors who are also employees (including concurrent President, Vice President, other managers, and employees) in the most recent year. The employee bonus amount from the earnings of the most recent year proposed and approved by the board of directors prior to the shareholders’ meeting should be disclosed. If the distribution amount of the current year cannot be estimated, it is to base on the amount distributed in the prior year proportionally with Table 1-3 filled out.
Note 7: Refers to the number of shares (excluding the portion executed) to be subscribed by the directors who are also employees (including concurrent President, Vice President, other managers, and employees) with stock options in the most recent year and up to the publication of the annual report. In addition to this form, please fill out Table 15.
Note 8: The remuneration amount paid to the board directors of Advantech by the companies (including Advantech) in the consolidated report should be disclosed. Note 9: Disclose the name of the directors in the respective range of remuneration paid by the Company.
20

Note 10: Disclose the name of the directors in the respective range of remuneration paid by all the companies (including the Company) in the consolidated financial report. Note 11: Net income meant for the net profit after tax in the most recent year. For those companies with the international financial reporting standard adopted, net income meant for the net
income after tax in the proprietary or individual financial report of the most recent year. a.The remuneration amount received by the board directors from the invested companies other than the subsidiaries should be disclosed in this column. b.The remuneration amount, if any, received by the board directors from the invested companies other than the subsidiaries should be disclosed in column J of the Range of
Remuneration; also, the column should be renamed as “All transfer-investment businesses.” c.Remuneration meant for the relevant reward, income, employee bonus, and business expense collected by the board directors of the Company acted as a director, supervisor, or
manager of the invested companies other than the subsidiaries. *The remuneration disclosed in the Range of Remuneration differs from the concept of income defined according to Income Tax Law; therefore, the table is for the purpose of
information disclosure instead of tax levy.
Remuneration paid to the presidents and vice presidents Unit: NT$ Thousand / Thousand units
Title Name
Salary (A)
(Note 2) Severance Pay (B)
Bonuses and Allowance etc. (C) (Note 3)
Employee Compensation (D)
(Note 4) Ratio of total compensation (A+B+C+D) to net income (Note 8)
Compensation Paid to the President
and Vice Presidents from an
Invested Company Other than the
Company’s subsidiary (Note10)
Ad
vante
c
Fro
m A
ll C
on
solid
ated
En
tities (N
ote
5)
Ad
vante
ch
Fro
m A
ll C
on
solid
ated
En
tities (N
ote
5)
Ad
vante
ch
Fro
m A
ll
Co
nso
lidate
d
En
tities (N
ote
5)
Advantech From All Consolidated
Entities (Note5)
Ad
vante
ch
Fro
m A
ll
Co
nso
lidate
d
En
tities (N
ote
5)
Cash Stock Cash Stock
Chairman K.C. Liu
18,928 18,928 0 0 39,412 39,412 7,491 0 7,491 0 1.05% 1.05% 0
Executive Board Director
Chaney Ho
President Eric Chen
President Miller Chang
President Linda Tsai
Vice President Deyu Yin
21

Range of Remuneration
Range of Rremuneration Name of the President and Vice President
Advantech (Note 6) Consolidated subsidiaries (Note 7) E
Under NT$2,000,000 - -
NT$2,000,001 – NT$5,000,000 - -
NT$5,000,001 – NT$10,000,000 K .C. Liu, Chaney Ho, Deyu Yin, Eric Chen,
Miller Chang, Linda Tsai K.C. Liu, Chaney Ho, Deyu Yin, Eric Chen
Miller Chang, Linda Tsai NT$10,000,001 – NT$15,000,000 - - NT$15,000,001 – NT$30,000,000 - - NT$30,000,001 – NT$50,000,000 - - NT$50,000,001 – NT$100,000,000 - - Over NT$100,000,000 - - Total 6 6
Note 1: Illustrate the name of the President and Vice President and disclose the payment amount itemized. Please fill out this form and form (1-1) or (1-2) for the director who is also the President or Vice President of the Company.
Note 2: Refers to the salary, duty allowances, and severance paid to the President and Vice President in the most recent year. Note 3: Refers to the reward, incentives, traveling expenses, special expenses, allowances, dormitories, transportation vehicles, and other compensations paid to the President and
Vice President in the most recent year. For the housing, automobiles and other transportation vehicles, or the exclusive personal expenses provided, the nature and cost of the assets, the actual or imputed rent at fair market value, the gasoline expense, and other payments should be disclosed. In addition, for the chauffeur appointed, please explain in the notes regarding the remuneration paid but theamount will not be included in the total remuneration amount.
Note 4: Refers to the employee bonus (including stock dividend and cash dividend) to the President and Vice President from the earnings of the most recent year proposed and approved by the board of directors prior to the shareholders’ meeting. If the distribution amount of the current year cannot be estimated, it is to base on the amount distributed in the prior year proportionally with Table 1-3 filled out. Net income meant for the net profit after tax in the most recent year. For those companies with the international financial reporting standard adopted, net income meant for the net income after tax in theproprietary or individual financial report of the most recent year.
Note 5: Refers to the number of shares (excluding the portion executed) to be subscribed by the President and Vice President with stock options in the most recent year and up to the publication of the annual report. In addition to this form, please fill out Table 15.
Note 6: Disclose the itemized amount paid to the President and Vice President by all the companies (including the Company) in the consolidated financial statements. Note 7: Disclose the name of the President and Vice President in the respective range of remuneration paid by the Company. Note 8: Disclose the name of the President and Vice President in the respective range of remuneration paid by all the companies (including the Company) in the consolidated financial
report. Note 9: Net income meant for the net profit after tax in the most recent year. For those companies with the international financial reporting standard adopted, net income meant for the
net income after tax in the proprietary or individual financial report of the most recent year. Note 10: a.The remuneration amount received by the President and Vice President from the invested companies other than the subsidiaries should be disclosed in this column.
b.The remuneration amount, if any, received by the President and Vice President from the invested companies other than the subsidiaries should be disclosed in column E of the Range of Remuneration and the column should be renamed as “All transfer-investment businesses.” c. Remuneration meant for the relevant reward, income, employee bonus, and business expense collected by the President and Vice President of the Company acted as a director, supervisor, or manager of the invested companies other than the subsidiaries. *he remuneration disclosed in the Range of Remuneration differs from the concept of income defined according to Income Tax Law; therefore, the table is for the purpose of information disclosure instead of tax levy.
22

Employee Compensation amount paid to managers
March 30, 2019
Title (Note 1) Name
(Note 1)
Stock bonus
amount
(proposed)
Cash bonus
amount
(proposed)
Total
Ratio of Total
Amount to
Net Income
(%)
Manager
Chairman K.C. Liu
0 7,491 7,491 0.12%
Executive Board Director
Chaney Ho
Presiden Eric Chen
President Miller Chang
President Linda Tsai
Vice President Deyu Yin
Accounting
Officer
Rorie Kang
Note 1: Illustrate the name and job title of each manager and disclose the distribution of earnings in a lump sum. Note 2: It refers to the employee Compensation (including stock dividend and cash dividend) to the managers from
the earnings of the most recent year proposed and approved by the board of directors prior to the shareholders’ meeting. If the distribution amount of the current year cannot be estimated, it is to base on the amount distributed in the prior year proportionally. Net income meant for the net profit after tax in the most recent year.
Note 3: Scope of applicability to managers, according to the Tai.Chai.Chen III Tzi No. 0920001301 Letter dated March 27, 2003 by the Commission, is as follows:
(1)President and the equals (2)Vice President and the equals (3)Junior VP and the equals (4)Finance Officer (5)Accounting Officer (6)Other authorized personnel for management and signature
Note 4: For the directors, President, and Vice President who have collected employee Compensation (including stock dividend and cash dividend), in addition to Table 1-2 enclosed, please fill out this form.
23

3.2.4 Comparison of Remuneration for Directors, Supervisors, President and Vice Presidents in the Most Recent Two Fiscal Years and Remuneration Policy for Directors, Supervisors, President and Vice Presidents A. The ratio of total remuneration paid by the Company and by all companies included in the
consolidated financial statements for the two most recent fiscal years to directors, supervisors, president and vice presidents of the Company, to the net income.
Job Title Ratio of 2018 total remuneration to net income (%)
Ratio of 2017 total remuneration to net income (%)
Directors, supervisor, President, and Vice
President
Advantech All consolidated subsidiaries
Advantech All consolidated subsidiaries
1.32% 1.32% 1.39% 1.39%
B. The policies, standards, and portfolios for the payment of remuneration, the procedures for determining remuneration, and the correlation with risks and business performance. According to the provision of Article 20 of the Company’s Articles of Incorporation, remuneration of directors shall not exceed 1% of the Company’s profit in the year; in addition, remuneration of directors shall be distributed reasonably in consideration of the Company’s operating results and directors’ contribution to the Company’s operating results. Remuneration of the President shall be distributed according to the Company’s Regulations Governing Remuneration of Managerial Officers, the average salary of the same position in the industry, and the President’s contribution to the Company’s operational objectives within the scope of the President’s responsibility. Remuneration shall be set according to the Company’s Regulations Governing Performance Evaluation of the Board of Directors and the Regulations Governing Remuneration of Directors. Reasonable remuneration shall be distributed in consideration of the Company’s operating results, risks and development trends in the industry, and personal performance and its contribution to the Company’s operating results. Evaluation of performance and reasonableness of remuneration shall be reviewed by the Remuneration Committee and the Board of Directors, and may be adjusted in a timely manner according to the operations and related laws and regulations, so as to achieve the Company’s sustainable development and risk management.
24

3.3 Implementation of Corporate Governance 3.3.1 Board of Directors
A total of 7 (A) meetings of the Board of Directors were held in the previous period. The attendance of director and supervisor were as follows:
Title Name Attendance in Person
(B)
By Proxy
Aattendance Rate (%) (B/A)
Remarks
Chairman K.C. Liu 7 0 88%
Director Advantech Foundation: Representative: Chaney Ho
6 1 86%
Director Ted Hsu 6 1 86%
Director AIDC Investment Corp. Representative:Donald Chang
7 0 100%
Independent Director
Joseph Yu 7 0 100%
Independent Director
Jeff Chen 4 3 57%
Independent Director
Benson Liu 7 0 100%
Other mentionable items:1. If any of the following circumstances occur,, the dates of the meetings, sessions, contents of
motion, all independent directors’ opinions and the company’s response should be specified:(1) Matters referred to in Article 14-3 of the Securities and Exchange Act.
BOD Subjects Securities and Exchange Act,rticle 14-3
Opinions of independent directors
Company’s treatment of the pinions
Resolution results
The sevsn time of the 13th edition Mar 02,2018
Approved the Company’s offering endorsement/guarantee to the subsidiaries for applying for bank credit line.
v None None The matter is approved by all the attendees.
The first time of the 13th edition March 30,2018 (interim)
Approved the Company’s BOD acquire Nippon RAD Inc v None None
The matter is approved by all the attendees.
The ten time of the 13th edition Jul 27,2018
Amendment to the “Procedures For Lending Funds to Other Parties”.
v None None The matter is approved by all the attendees.
The twelve time of the 13th edition Oct 26,2018
Approved the BOD approved to acquire the stakes of OMRON Nohgata Co.,Ltd . from OMRON Corp.
v None None The matter is approved by all the attendees.
Approved the company acquires Advantech Automation Corp. (BVI) shares
v None None The matter is approved by all the attendees.
25

Approved the Company to acquire Advantech Corporate Investment. shares
v None None The matter is approved by all the attendees.
Approved the announcement of the resolution of the board of directors of the company to pass the construction of Advantech Linkuo Industrial Park Stage III construction
v None None The matter is approved by all the attendees.
2. If there are directors’ avoidance of motions in conflict of interest, the directors’ names, contents of motion, causes for avoidance and voting should be specified: None
3. Measures taken to strengthen the functionality of the board: The Board of Directors of the Company has established the Audit Committee (in 2017) and the Remuneration Committee (in 2011) the two functional committees were established to assist the Board of Directors in fulfilling supervisory duties. The Audit Committee consisted of Independent Directors (3 personnel) in overall, and the Remuneration Committee consisted of Independent Directors and experts of relevant fields (3 personnel in total). The charter of each committee has been approved by the Board of Directors and each committee is required to report their activities and resolutions to the Board of Directors on a regular basis. In order to materialize corporate governance, set specific performance goal for enhancing the functions and operating efficiency of the board of directors. In line with article 37 of the "practical guidelines for corporate governance of listed companies on the centralized and OTC markets," the board of directors resolved on Mar. 06,2015 to formulate the company's "measures for evaluating the performance of the board of directors." 2015 to formulate the company's "measures for evaluating the performance of the board of directors." Accordingly, at the end of a fiscal year, the secretariat of the board of directors would collect information on the activities of the board of directors, issue questionnaires for self evaluation to be filled by directors, and record the results for submission to the board of directors for review and improvement. In fiscal 2015 and 2016, under the arrangement of the secretariat, "self evaluation of the performance of the board of directors" was completed. The Company’s board of directors operates in accordance with the Company’s ‘’Parliamentary Rules for Directors’s Meeting and related laws. The executive financial officers and chief auditors will also attend a directors’s meeting and produce relevant reports to directors for reference.Meanwhile,in order to upgrads the board members’s competency,the Company will invite extermal trainers to give lessons and arrange advanced studies for the board members.
2018 attendance records
◎: In person ☆ : Delegate to attend *: Not present2018 first time second time third time fourth time fifth time sixth time seventh time Joseph Yu ◎ ◎ ◎ ◎ ◎ ◎ ◎ Jeff Chen ◎ ☆ ◎ ☆ ◎ ☆ ◎ Benson Liu ◎ ◎ ◎ ◎ ◎ ◎ ◎
26

3.3.2 Audit Committee :
A total of 4 (A) Audit Committee meetings were held in the previous period. The attendance of the independent directors was as follows:
Title Name Attendance in Person
(B) By Proxy
Attendance Rate (%)【B/A】
Remarks
Independent director Benson Liu 4 0 100
Independen director Jeff Chen 4 0 100
Independent director Joseph Yu 4 0 100
Other mentionable items: 1. If any of the following circumstances occur, the dates of meetings, sessions, contents of motion,
resolutions of the Audit Committee and the Company’s response to the Audit Committee’s opinion should be specified:
(1) Matters referred to in Article 14-5 of the Securities and Exchange Act.
Audit Committee Subjects
Securities and Exchange Act,rticle 14-5
Opinions of independent directors
Company’s treatment of the pinions
Resolution results
The four time of the 13th edition March 02,2018 02,2018
Approved the Company’s 2017 consolidated financial statements. v None None
The matter is approved by all Independent Directors
Approved the Company’s 2017 Statement of Internal Control System v None None
The matter is approved by all Independent Directors
Approved the Company’s offering endorsement /guarantee to the subsidiaries for applying for bank credit line.
Assessment to Independence of Certified Public Accountants
Major assets transaction, derivative commodities, capital loaning, and endorsements/guarantees.
The five time of the 13th edition April 27,2018 02,2018
Approved the Company’s 2018Q1 consolidated financial statements. v None None
The matter is approved by all Independent Directors
Status of activities regarding derivative commodities, capital loaning, endorsements/guarantees, and major assets transaction in the first Quarter of 2018.
v None None
The matter is approved by all Independent Directors
27

The Six time of the 13th edition July 27,2018 02,2018
Approved the Company’s 2018Q2 consolidated financial statements. v None None
The matter is approved by all Independent Directors
Amendment to the “Procedures For Lending Funds to Other Parties”. v None None
The matter is approved by all Independent Directors
Key accounting policies including planned structure and implementation progress report for accounting items classification
v None None
The matter is approved by all Independent Directors
Status of activities regarding derivative commodities, capital loaning, endorsements/guarantees, and major assets transaction in the 2018Q2
v None None
The matter is approved by all Independent Directors
The Seven time of the 13th edition October 26,2018 02,2018
Approved the Company’s 2018Q3 consolidated financial statements. v None None
The matter is approved by all Independent Directors
Approved the 2018 audit plan
v None None
The matter is approved by all Independent Directors
Approved the BOD approved to acquire the stakes of OMRON Nohgata Co.,Ltd . from OMRON Corp.
v None None
The matter is approved by all Independent Directors
Approved the company acquires Advantech Automation Corp. (BVI) shares
v None None
The matter is approved by all Independent Directors
Approved the Company to acquire Advantech Corporate Investment. shares
v None None
The matter is approved by all Independent Directors
Approved the announcement of the resolution of the board of directors of the company to pass the construction of Advantech Linkuo Industrial Park Stage III construction
v None None
The matter is approved by all Independent Directors
Status of activities regarding derivative v None None The matter is
approved by
28

commodities, capital loaning, endorsements/guarantees, and major assets transaction in the 2018Q3
all Independent Directors
Recruitment of the auditing directors for the auditing units of the Company
v None None
The matter is approved by all Independent Directors
(2) Other matters which were not approved by the Audit Committee but were approved by two-thirds or more of all directors:None.
2. If there are independent directors’ avoidance of motions in conflict of interest, the directors’ names, contents of motion, causes for avoidance and voting should be specified: None
3. Communications between the independent directors, the Company's chief internal auditor and CPAs (e.g. the material items, methods and results of audits of corporate finance or operations, etc.) (1) The chief audit executive of the Company communicates with the Audit Committee about the
results of audits on a regular basis and reports internal audits in quarterly meetings of the Audit Committee; in case of special circumstances, the chief audit executive reports to the Audit Committee immediately. In 2018, there was no special circumstance mentioned above. The chief audit executive communicated well with the Audit Committee.
(2) The Company’s CPA reports the audits or findings of quarterly financial statements and other statutory matters to be communicated in quarterly meetings of the Audit Committee; in case of special circumstances, the CPA reports to the Audit Committee immediately. In 2018, there was no special circumstance mentioned above. The CPA communicated well with the Audit Committee.
(3) Major Tasks and Operation of the Audit Committee: The Audit Committee of the Company consisted of three Independent Directors. The Audit Committee was established to assist the Board of Directors in achieving quality and integrity in supervising and reviewing the accounting, auditing, financial reporting processes and financial controls of the Company. Major Items Considered during Reviewing: ‧ Financial statements auditing and accounting policies and procedures ‧ Internal control systems and related policies and procedures ‧ Major assets or derivatives transactions ‧ Major capital loaning and endorsements or guarantees ‧ Placement or issuance of securities ‧ Derivative financial commodities and cash investment ‧ Legal compliance ‧ Investigation to possible conflict of interest or relationships of transaction parties between
managers and Director ‧ Anti-fraud scheme and fraud investigation/appeal reports ‧ Information security ‧ Corporate risk management ‧ Certified public accountants qualification, experience, independence and performance
evaluation ‧ Appointment, dismissal or remuneration of certified public accountants ‧ Appointment and dismissal of financial, accounting or internal auditing directors ‧ Audit Committee performance ‧ Self-evaluation questionnaires of Audit Committee performance assessment
(4)The Company’s 2018 annual auditing plan includes regular review to information and communication security of the Company. The Company has security and a disaster recovery plans, automatic warning mechanism for emails and firewall implemented to protect key systems and data security. Audit results: no major abnormalities found.
(5) Independent director discussion Items with Internal Chief Auditor、CPA reply as follow:
29

Date (Session) Discussion Items with Internal Chief Auditor
Discussion Items with CPA
The four time of the 13th edition March 02,2018 02,2018
‧ Review the internal audit report (in a closed-door meeting)
‧ Review the Company’s 2017 Statement of Internal Control System
Discuss the audit process of the 2017 financial statements, including problems or challenges and the management’s responses (in a closed-door meeting) Review CPA’s qualifications,
performance, and independency
The five time of the 13th edition April 27,2018 02,2018
‧ Review the internal audit report (in a closed-door meeting)
‧ Discuss the review of the Q118 financial statements, including problems or challenges and the management’s responses (in a closed-door meeting)
The Six time of the 13th edition July 27,2018 02,2018
‧ Review the internal audit report (in a closed-door meeting)
‧ Review the Company’s revision and the amended Procedures for lending funds to other parties.
‧ Discuss the review of the Q218 financial statements, including problems or challenges and the management’s responses (in a closed-door meeting)
‧ Report the changes in laws and regulations
The Seven time of the 13th edition October 26,2018 02,
‧ Review the internal audit report (in a closed-door meeting)
‧ Review 2019 audit plan
Discuss the review of the Q318 financial statements, including problems or challenges and the management’s responses (in a closed-door meeting) Review key audit items in
2018 Report the review and audit
plan for 2019 financial statements
Result: The above matters have been reviewed or approved by the Audit Committee without any objection raised by independent directors.
30

3.3.3 The Company’s implementation of corporate governance and its deviating from the “Corporate Governance Best-Practice Principles for TWSE/GTSM Listed Companies” and the root cause
Evaluation Item
Implementation Status Deviating from the “Corporate Governance Best-Practice Principles for TWSE/GTSM Listed Companies” and the root cause
Yes No Abstract Illustration
1.Does the Company base on the “Corporate Governance Best-Practice Principles for TWSE/GTSM Listed Companies” to set up and disclose the Company’s corporate governance best-practice principles?
V
The Company has based on the “Corporate Governance Best-Practice Principles for TWSE/GTSM Listed Companies” to set up and disclose the Company’s corporate governance best-practice principles for guidelines on the MOPS.
None
2.The Company’s equity structure and shareholders’ equity
(1)Does the Company have the internal procedures regulated to handle shareholders’ proposals, doubts, disputes, and litigation matters; also, have the procedures implemented accordingly?
(2) Does the Company possess the list of the Company’s major shareholders and the list of the ultimate controllers of the major shareholders?
(3) Does the Company establish and implement the risk control and firewall mechanism with the related parties?
(4) Does the Company set up internal norms to prohibit the insiders from utilizing the undisclosed information to trade securities?
V
V
V
V
(1)The Company has a spokesperson, stock affairs supervisor, and associated person assigned to effectively handle shareholder’s suggestions or disputes. Legal issues, if any, will be handled with the assistance of the legal affair personnel.
(2)Regularly disclose the pledge, increase or decrease of shareholding, or the occurrence of other events that may cause significant changes in the shares of the shareholders with over 10% shareholding; also, maintain a good relationship with the major shareholder at any time for control.
(3)The management responsibilities of the Company and the affiliated enterprises are clearly defined; also, business transactions are conducted in compliance with the Company’s internal control system and the relevant requirements. For strengthening the control mechanism, the procedures for monitoring subsidiaries are regulated with proper risk control.
(4)The ADVANTECH worked out the “Procedure Preventing Insider Trading” for all employees, managers and board members, as well as those who know the information based on the occupation or control relation to prohibit any
None
31
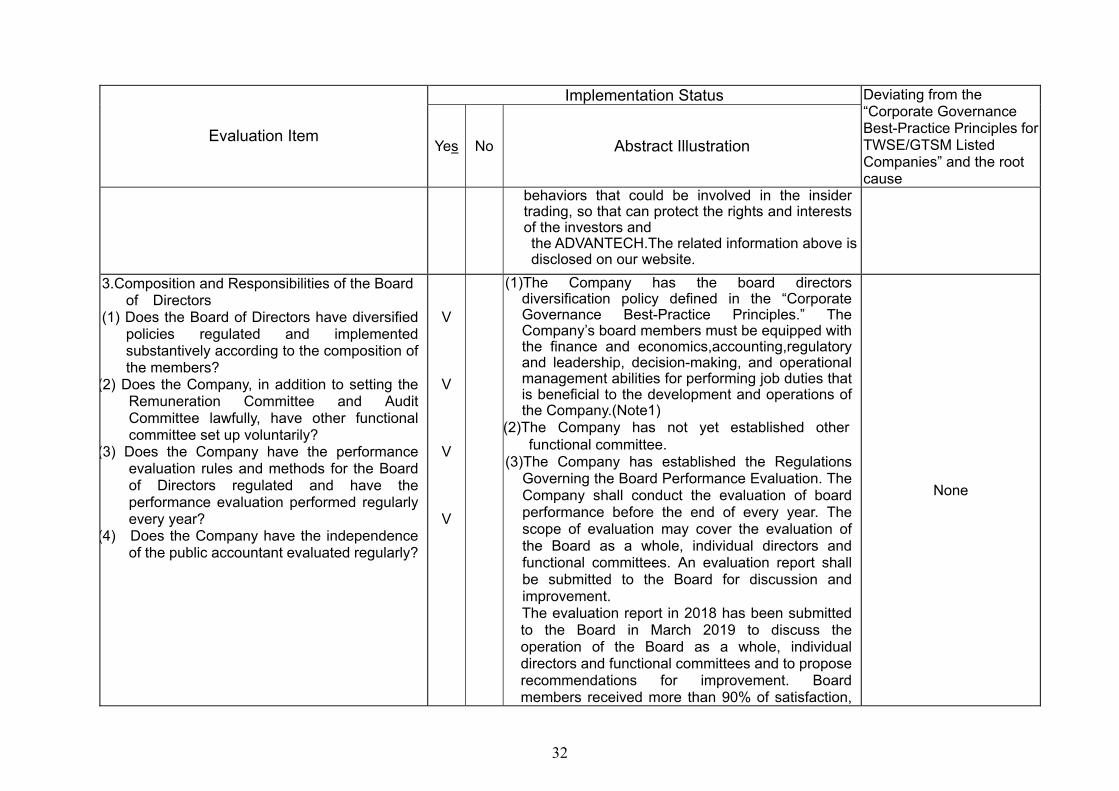
Evaluation Item
Implementation Status Deviating from the “Corporate Governance Best-Practice Principles for TWSE/GTSM Listed Companies” and the root cause
Yes No Abstract Illustration
behaviors that could be involved in the insider trading, so that can protect the rights and interests of the investors and the ADVANTECH.The related information above is disclosed on our website.
3.Composition and Responsibilities of the Board of Directors
(1) Does the Board of Directors have diversified policies regulated and implemented substantively according to the composition of the members?
(2) Does the Company, in addition to setting the Remuneration Committee and Audit Committee lawfully, have other functional committee set up voluntarily?
(3) Does the Company have the performance evaluation rules and methods for the Board of Directors regulated and have the performance evaluation performed regularly every year?
(4) Does the Company have the independence of the public accountant evaluated regularly?
V
V
V
V
(1)The Company has the board directors diversification policy defined in the “Corporate Governance Best-Practice Principles.” The Company’s board members must be equipped with the finance and economics,accounting,regulatory and leadership, decision-making, and operational management abilities for performing job duties that is beneficial to the development and operations of the Company.(Note1)
(2)The Company has not yet established other functional committee.
(3)The Company has established the Regulations Governing the Board Performance Evaluation. The Company shall conduct the evaluation of board performance before the end of every year. The scope of evaluation may cover the evaluation of the Board as a whole, individual directors and functional committees. An evaluation report shall be submitted to the Board for discussion and improvement. The evaluation report in 2018 has been submitted to the Board in March 2019 to discuss the operation of the Board as a whole, individual directors and functional committees and to propose recommendations for improvement. Board members received more than 90% of satisfaction,
None
32

Evaluation Item
Implementation Status Deviating from the “Corporate Governance Best-Practice Principles for TWSE/GTSM Listed Companies” and the root cause
Yes No Abstract Illustration
and the evaluation of board performance was graded excellent. In the future, the Company will continue to improve the operation of the Board and its participation in the Company’s operation. From October to December 2017, the Company employed Taiwan Corporate Governance Association to conduct the evaluation of Board performance in 2017. The evaluation contained 38 questions in eight aspects, namely composition, guidance, authorization, supervision, communication, self-regulation, internal control, and risk management of the Board and was conducted by survey and field review. The result of the evaluation was reported to the Board in March 2018 to further improve the functions of the Board. Overall Evaluation to the Board of Directors of Advantech: There are seven members in the Board of Directors of Advantech, except two seats are taken by the Chairman and the former General Manager, the other five seats are taken by appointed personnel not employed by the Company (including three Independent Directors). The backgrounds of the members covers fields of science and technology, business management, corporate governance, and most of the members have experience of managing large-scale MNEs, which matches the Company's goals of becoming a global business with the most key influence to industries of automation , embedded computers, and Internet of Things.
(4) The Board of Directors of the Company evaluates
33

Evaluation Item
Implementation Status Deviating from the “Corporate Governance Best-Practice Principles for TWSE/GTSM Listed Companies” and the root cause
Yes No Abstract Illustration
the independence, competence and professionalism of the CPA every year on a regular basis, and requests the CPA to provide the statement of independence every year. The Board of Directors reviews the independence and appointment of the CPA based on his/her profile (including detailed work experience and current clients), non-audit services, and the statement of independence (in compliance with the Norm of Professional Ethics for CPA No.10). Note2
4.Does the company set up a corporate governance unit or appoint personnel responsible for corporate governance matters (including but not limited to providing information for directors and supervisors to perform their functions, handling work related to meetings of the board of directors and the shareholders' meetings, filing company registration and changes to company registration, and producing minutes of board meetings and shareholders’ meetings)?
V
It has been reported to the Board that the Company will set up a full-time corporate governance unit as the corporate governance team under the Corporate Social Responsibility Steering Committee, and that a person will be selected from the corporate governance team to be in charge of corporate governance affairs, including matters related to the Board and shareholders’ meeting, corporate registration and amendment registration, and information disclosure. i. Arrangement of the meetings of the board of directors according to law/regulation: Notify all directors seven days in advance and provide related data, to facilitate their understanding of items on the agenda;remind directors avoiding interest of conflict, should the items be related to their interests or the interests of legal entities they represent; distribute minutes for the meeting within 20 days.
None
34

Evaluation Item
Implementation Status Deviating from the “Corporate Governance Best-Practice Principles for TWSE/GTSM Listed Companies” and the root cause
Yes No Abstract Illustration
ii. Arrangement of shareholders' meeting according to law/regulation: Register date for shareholders' meeting by legal deadline,produce and submit notice, manual, and minutes of the meeting by deadline, and change corporate registration after revision of corporate charter or election of directors and supervisors. iii. Based upon “Regulations Governing the Board Performance Evaluation,” board secretary collects the information related activities of the board, distributing the questionnaire to collect self evaluation of the board of directors, turning in to the board to review and improve at the end of the year. iv.Oversee the establishment of "administrative platform for corporate governance," in order to integrate and track various corporate-governance indicators and have a firm grip of the progress of corporate governance. Starting from the company's vision for corporate governance and based on the evaluation indicators of the "corporate governance evaluation," drafted by the Taiwan Stock Exchange, the platform reviews regularly, alongside various related units, various corporate-governance items,sets various corporate-governance goals,and tracks the execution, as well as results,of various corporate-governance items by units in charge, so as to sustain performance. v.Handle related issue about investor relations:
None
35

Evaluation Item
Implementation Status Deviating from the “Corporate Governance Best-Practice Principles for TWSE/GTSM Listed Companies” and the root cause
Yes No Abstract Illustration
5.Does the company establish a communication
channel and build a designated section on its website for stakeholders (including but not limited to shareholders, employees, customers, and suppliers), as well as handle all the issues they care for in terms of corporate social responsibilities?
V
investor relations team provides AGM information, material information announcement, financial statements,presentation material about finance and operation, information about domestic and overseas conferences.
(1)The Company has a spokesperson, stock affairs supervisor, and associated person assigned to establish a comprehensive communication channel, and regularly or irregularly held briefings to offer a face-to-face and comprehensive communication interface targeting on various issues and inquiries.
(2)The Company sets up the Advantech CSR website in English and the stakeholder section on the Company’s website. The Company also responds to the stakeholder’s concern over CSR issues through stakeholder questionnaire, notice of collection, website, and CSR reports.
None
6.Does the company appoint a professional shareholder service agency to deal with shareholder affairs?
V The Company commissioned a professional stock affairs service agent - KGI Securities Co., Ltd. Shareholder Service Department to handle the Company’s stock service matters, and with the “Guidelines for Handling of Stock Affairs” stipulated to regulate the relevant operations.
None
7.Information disclosure (1)Does the Company have a website setup and
the financial business and corporate governance information disclosed?
(2)Does the Company have adopted other information disclosure methods (such as,
V V
(1)The company profile and business information is disclosed in the Company’s website with the shareholder’s section setup to disclose financial information and corporate governance; also, to establish a communication channel for communicating to investors.
None
36

Evaluation Item
Implementation Status Deviating from the “Corporate Governance Best-Practice Principles for TWSE/GTSM Listed Companies” and the root cause
Yes No Abstract Illustration
establishing an English website, designating responsible person for collecting and disclosing information of the Company, substantiating the spokesman system, placing the juristic person seminar program on the Company’s website, etc.)?
(2)The Company has information fully disclosed through the English website, assigning the Investor Relations Commissioner for information collection and disclosure, a clear spokesperson system, and the investor conference on the Company’s website.
8.Are there any other important information (including but not limited to the interests of employees, employee care, investor relations, supplier relations, the rights of stakeholders, the continuing education of directors and supervisors, the implementation of risk management policies and risk measurement standards, the execution of customer policy, the purchase of liability insurance for the Company’s directors and supervisors) that are helpful in understanding the corporate governance operation of the Company?
V
(1).The interests of employees and employee care: Offer staff salaries higher than the minimum wage defined in the Labor Standards Act, better employee benefits than the industry standard, insurance coverage and pension benefits according to the law; also, group insurance and overseas business traveling insurance in order to protect the work and life safety of colleagues. Regulate labor safety and health code, exercise Job Equality Act, provide safe, healthy, and harassment-free working environment and culture, and achieve ISO-14001 (Environmental Management International Standard) and OHSAS-18001 (Occupational Health and Safety Management System) certification. Initiate two performance evaluations of the colleagues during the middle of the year and at the end of the year in order to achieve the overall business plan and as a reference for staff promotion, employee training and development, and payment of salaries. Ensure all employees are protected by the Collective Bargaining Agreement through labor meetings, department meetings, seminars, Suggestion Box, and other communication
None
37

Evaluation Item
Implementation Status Deviating from the “Corporate Governance Best-Practice Principles for TWSE/GTSM Listed Companies” and the root cause
Yes No Abstract Illustration
channels. (2)Supplier relation: On the supplier management,
the ADVANTECH had introduced the “Electronic Industry Code of Conduct (EICC)” since 2010, and strictly brought the principle of the environmental protection into the mechanism of supplier management to establish the Green Supply Chain Management System. The suppliers are managed via the Supplier Management System (SMS), and the behavior review/verification for the important suppliers, including supplier add/change as well as the procedures to evaluate the suppliers are specified in the Management Document (M-001_ purchase procedure). The “Purchase Behavior Criteria”worked out in the ADVANTECH specifies the purchase behavior. Meanwhile, the suppliers must sign the Commitment to Honesty to follow the honesty. The ADVANTECH will annually convene the supplier meetings, and directly communicate with the supplier management for the development direction and the strategy cooperation.
(3)Investor Relations: Information is fully disclosed through the MOPS and the Company’s Website to help investors understand the Company’s operating conditions and to communicate with investors through the shareholders’ meeting and the spokesman.
(4)Continuing education of directors and supervisors: The Company actively encourages directors to
38

Evaluation Item
Implementation Status Deviating from the “Corporate Governance Best-Practice Principles for TWSE/GTSM Listed Companies” and the root cause
Yes No Abstract Illustration
participate in continuing education as scheduled below.
(5)Customer Policy: The Company keeps in contact with customers regularly and communicates the needs of the customers through online/telephone, customer service, and Account Manager System; also, a Suggestion Box is setup to respond to customer complaint promptly.
(6)The acquisition of liability insurance for directors : The Company has acquired liability insurance for directors and supervisors .
9.Does the Company have a corporate governance self-assessment report prepared or a corporate governance assessment report issued by the commissioned professional institutions? (If yes, please state the opinion of the board of directors, the self-assessment or outsourcing evaluation results, the main nonconformity or suggestion, and implementation of improvement)
V
ACL elected the independent directors,set up the audit committee,and particularly disclosed the information on ourwebsite to meet the corporate governance requirements.The Company will make improvement progressively according to the plan to be made for the matters that have not been improved.
None
39
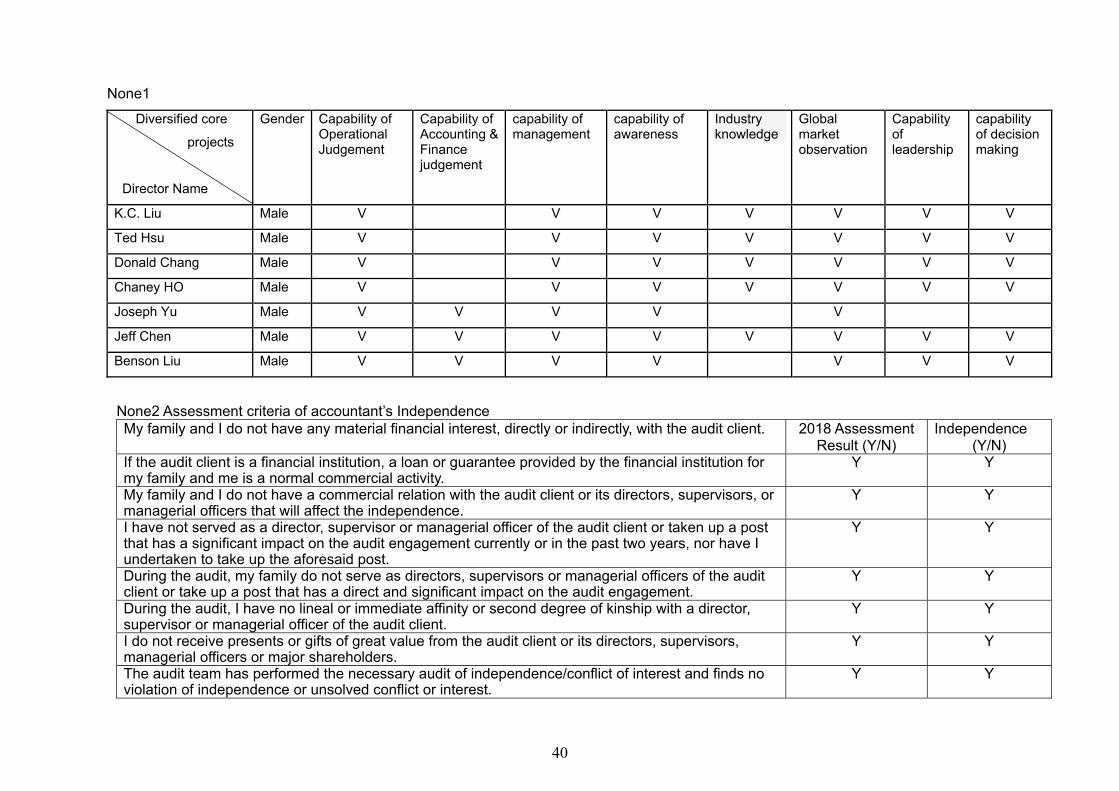
None1
Diversified core
projects
Director Name
Gender Capability of Operational Judgement
Capability ofAccounting & Finance judgement
capability of management
capability of awareness
Industry knowledge
Global market observation
Capability of leadership
capability of decision making
K.C. Liu Male V V V V V V V
Ted Hsu Male V V V V V V V
Donald Chang Male V V V V V V V
Chaney HO Male V V V V V V V
Joseph Yu Male V V V V V
Jeff Chen Male V V V V V V V V
Benson Liu Male V V V V V V V
None2 Assessment criteria of accountant’s Independence My family and I do not have any material financial interest, directly or indirectly, with the audit client. 2018 Assessment
Result (Y/N) Independence
(Y/N) If the audit client is a financial institution, a loan or guarantee provided by the financial institution for my family and me is a normal commercial activity.
Y Y
My family and I do not have a commercial relation with the audit client or its directors, supervisors, or managerial officers that will affect the independence.
Y Y
I have not served as a director, supervisor or managerial officer of the audit client or taken up a post that has a significant impact on the audit engagement currently or in the past two years, nor have I undertaken to take up the aforesaid post.
Y Y
During the audit, my family do not serve as directors, supervisors or managerial officers of the audit client or take up a post that has a direct and significant impact on the audit engagement.
Y Y
During the audit, I have no lineal or immediate affinity or second degree of kinship with a director, supervisor or managerial officer of the audit client.
Y Y
I do not receive presents or gifts of great value from the audit client or its directors, supervisors, managerial officers or major shareholders.
Y Y
The audit team has performed the necessary audit of independence/conflict of interest and finds no violation of independence or unsolved conflict or interest.
Y Y
40

■ The acquisition of liability insurance for directors and supervisors:
Insured object Insurance company Amount of insurance coverage (NT$)
Insurance period
All directors and supervisors
Cathay Century Insurance Co., Ltd. 153,575,000 04/01/2018 - 04/01/2019
3.3.4 The composition of the Remuneration Committee, responsibilities, and operation”:
A. Remuneration Committee members:
Identity
(Note 1)
Terms
Name
Over five years of experience and the following professional
qualifications Independence criteria (Note 2) Serving as a
Remuneration Committee member of another public company
Remarks (Note 3)
University teaching in areas of commerce, law, finance, accounting or related corporate business
Working as a judge, attorney, lawyer, accountant or other positions that require professional certification
Work experience in commerce, law, finance, accounting or related corporate experiences
1 2 3 4 5 6 7 8
Independent director
Joseph Yu
v v v v v v v v v v 2 NA
Independent director
Benson Liu
v v v v v v v v v v 2 NA
Others Caroline Wang
v v v v v v v v v v 0 NA
Note 1: Please indicate the identity as directors, independent directors, or others. Note 2: A ““ is marked in the space beneath the respective column when a director or supervisor has met that condition during the two-year prior to election and
during his or her period of service; the conditions are as follows: (1) Not employed by the Company or an affiliated business. (2) Not a director or supervisor of the Company or its affiliated company. This restriction does not apply to independent directors of subsidiaries in which the
company or its parent company directly or indirectly holds over 50% of the shareholder voting rights. (3) company shares or being a top-10 natural person shareholder in one’s own name, held by a spouse or underage child, or held by nominee agreement. (4) Neither a spouse, second-degree relative, nor a fifth degree direct relative of the persons listed under the previous three items. (5) Neither a director, supervisor or employee of an institutional shareholder directly owning more than 5% of the company’s outstanding shares, nor one of
the company’s top-five institutional shareholder. (6) Neither a director, supervisor, manager or shareholder holding more than a 5% stake in certain companies or institutions that have a financial or
business relationship with the Company.
41
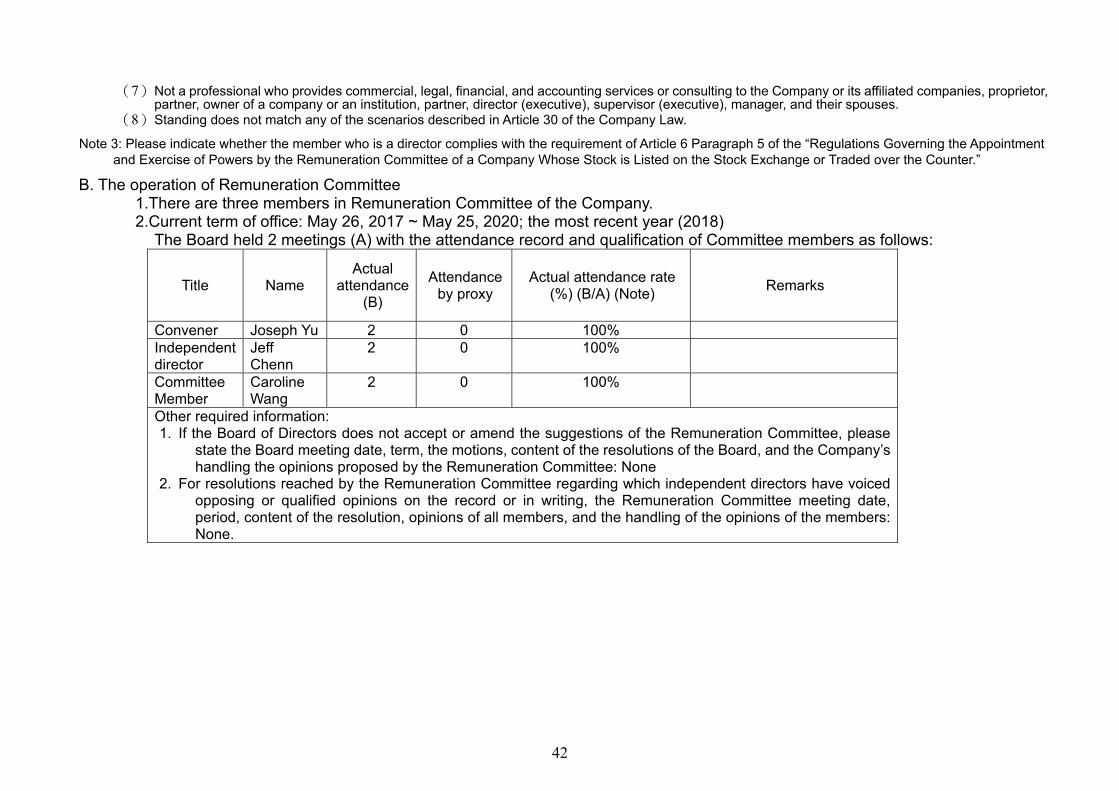
(7) Not a professional who provides commercial, legal, financial, and accounting services or consulting to the Company or its affiliated companies, proprietor, partner, owner of a company or an institution, partner, director (executive), supervisor (executive), manager, and their spouses.
(8) Standing does not match any of the scenarios described in Article 30 of the Company Law.
Note 3: Please indicate whether the member who is a director complies with the requirement of Article 6 Paragraph 5 of the “Regulations Governing the Appointment and Exercise of Powers by the Remuneration Committee of a Company Whose Stock is Listed on the Stock Exchange or Traded over the Counter.”
B. The operation of Remuneration Committee 1.There are three members in Remuneration Committee of the Company. 2.Current term of office: May 26, 2017 ~ May 25, 2020; the most recent year (2018)
The Board held 2 meetings (A) with the attendance record and qualification of Committee members as follows:
Title Name Actual
attendance (B)
Attendance by proxy
Actual attendance rate (%) (B/A) (Note)
Remarks
Convener Joseph Yu 2 0 100% Independent director
Jeff Chenn
2 0 100%
Committee Member
Caroline Wang
2 0 100%
Other required information: 1. If the Board of Directors does not accept or amend the suggestions of the Remuneration Committee, please
state the Board meeting date, term, the motions, content of the resolutions of the Board, and the Company’s handling the opinions proposed by the Remuneration Committee: None
2. For resolutions reached by the Remuneration Committee regarding which independent directors have voiced opposing or qualified opinions on the record or in writing, the Remuneration Committee meeting date, period, content of the resolution, opinions of all members, and the handling of the opinions of the members: None.
42
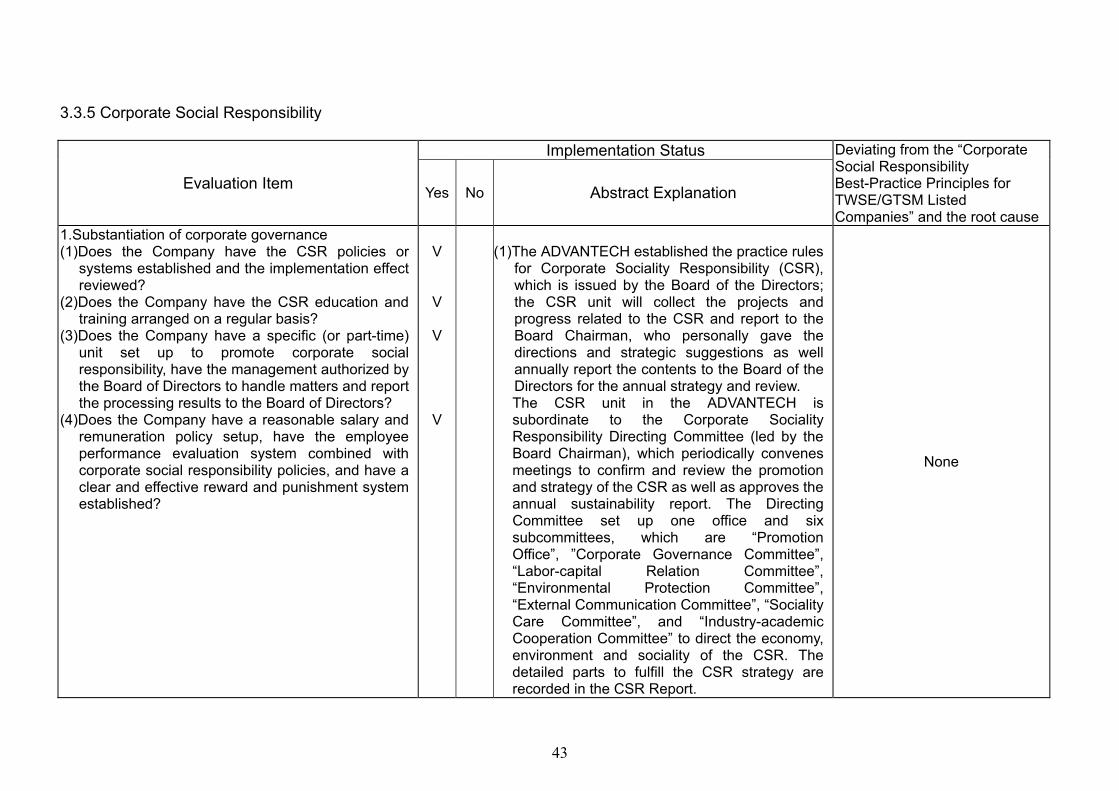
3.3.5 Corporate Social Responsibility
Evaluation Item
Implementation Status Deviating from the “Corporate Social Responsibility Best-Practice Principles for TWSE/GTSM Listed Companies” and the root cause
Yes No Abstract Explanation
1.Substantiation of corporate governance (1)Does the Company have the CSR policies or
systems established and the implementation effect reviewed?
(2)Does the Company have the CSR education and training arranged on a regular basis?
(3)Does the Company have a specific (or part-time) unit set up to promote corporate social responsibility, have the management authorized by the Board of Directors to handle matters and report the processing results to the Board of Directors?
(4)Does the Company have a reasonable salary and remuneration policy setup, have the employee performance evaluation system combined with corporate social responsibility policies, and have a clear and effective reward and punishment system established?
V
V
V
V
(1)The ADVANTECH established the practice rules
for Corporate Sociality Responsibility (CSR), which is issued by the Board of the Directors; the CSR unit will collect the projects and progress related to the CSR and report to the Board Chairman, who personally gave the directions and strategic suggestions as well annually report the contents to the Board of the Directors for the annual strategy and review. The CSR unit in the ADVANTECH is subordinate to the Corporate Sociality Responsibility Directing Committee (led by the Board Chairman), which periodically convenes meetings to confirm and review the promotion and strategy of the CSR as well as approves the annual sustainability report. The Directing Committee set up one office and six subcommittees, which are “Promotion Office”, ”Corporate Governance Committee”, “Labor-capital Relation Committee”, “Environmental Protection Committee”, “External Communication Committee”, “Sociality Care Committee”, and “Industry-academic Cooperation Committee” to direct the economy, environment and sociality of the CSR. The detailed parts to fulfill the CSR strategy are recorded in the CSR Report.
None
43

Evaluation Item
Implementation Status Deviating from the “Corporate Social Responsibility Best-Practice Principles for TWSE/GTSM Listed Companies” and the root cause
Yes No Abstract Explanation
(2).The Company has the CSR education and training arranged in the orientation that is held once in every two-month. II. Not only provide a copy of the learning manual for new employees on the first day when they are on board, but also explain item by item, which the contents comprise anti-bribery, human right, environment and labor codes, as well as upload on the website for the enquiry at any time; they will be emphasized and explained again in the employee training, as well as required to strictly execute and obey; there is a unit of “morality and ethics” for the managers to ensure they can set an example by personally taking part. III.In order to guide the employee behavior in compliance with the mortality, we make the interested parties understand and follow our mortalities, including: the prohibition against the improper gift, bribery or benefit from other people, insider trading, no difference treatment owing to the gender, race, religion, party, aptitude, job position, nationality and age, or discrimination in any form as well as the adhesion to employee labor and environmental regulations. “Employee Behavior Criteria” are uploaded on the website for the enquiry and reading. IV. The purchase units and the employees and managers in charge of purchase are required to deal with the worldwide purchase activities based on the highest ethics. The purpose is to
44

Evaluation Item
Implementation Status Deviating from the “Corporate Social Responsibility Best-Practice Principles for TWSE/GTSM Listed Companies” and the root cause
Yes No Abstract Explanation
prevent the improper behavior or bribery; the suppliers are required to sign “Commitment to Honesty”, and the mailbox is established for complain to eliminate our employees from bribery.
(3)The Company has a “Corporate Culture and Social Responsibility” Department setup; also, there are specific individuals responsible for planning and promoting industry-academia collaboration, Able Club, social welfare, arts and cultures sponsorship, corporate social responsibility websites, and other CSR-related projects. The work progress and project achievement is reported to the Chairman and the Board of Directors periodically. Please refer to the illustration below regarding the CSR-related tasks: CSR Website:http://www.advantech.tw/csr/ Corporate Social Responsibility Report (CSR Report): https://advcloudfiles.advantech.com/csr/Report/2017-CSR-Report.pdf Advantech Co., Ltd. Able Club website: http://ableclub.advantech.com.tw In addition, in order to substantiate the spirit of corporate social responsibility, except for the specifically designated departments, in response to the different professions and focuses for each CSR project, a trans-departmental work team is setup to be responsible for planning and execution. Such
45

Evaluation Item
Implementation Status Deviating from the “Corporate Social Responsibility Best-Practice Principles for TWSE/GTSM Listed Companies” and the root cause
Yes No Abstract Explanation
as, for Corporate Social Responsibility Report, the Corporate Culture Department, Brand Development Department, and Public Relation Department shall cooperate to organize a trans-departmental Promotion Office jointly with all the accountable departments, including “Corporate Governance Committee,” “Labor Relation Committee,” “Environmental Protection Energy-Saving Committee,” “Communication Committee,” “Social Care Committee,” “Industry-Academia Collaboration Committee,” etc. to promote and realize corporate social responsibility.
(4)The Company has a reasonable remuneration policy setup; also, required employees to comply with Advantech Code of Conduct and Practiced the “Integrity and Probity” of corporate value. The employees are evaluated with the Compassion Award issued for their participating in the charity activities, or the offenders of the Code of Conduct will be disciplined accordingly.
2.Development of sustainable environment (1)Is the Company committed to enhance the
utilization efficiency of resources and use renewable materials that are with low impact on the environment?
(2)Does the Company have an appropriate environmental management system established in accordance with its industrial character?
(3)Does the Company pay attention to the impact of climate change on the operational activities,
V
V
V
(1)The Company is committed to enhance the
utilization efficiency of resources and use renewable materials that are with low impact on the environment
(2)Th Company has established ESH Management Committee and ISO14001 environmental management system, which includes the following items: a.Collect, assess, and identify the impact of the
None
46

Evaluation Item
Implementation Status Deviating from the “Corporate Social Responsibility Best-Practice Principles for TWSE/GTSM Listed Companies” and the root cause
Yes No Abstract Explanation
implement greenhouse gas check, and form an energy-saving, carbon-reduction, and greenhouse emissions reduction strategy?
Company’s activities, products, and services on the natural environment.
b.Establish measurable goals of environmental sustainability and regularly review the continuity and relevance of its development.
c.Set specific action plans and regularly review the effectiveness of the operation.
(3)The Company adopts the guidelines of ISO14064 commonly used domestically and internationally and CDP Carbon Disclosure Plan to implement greenhouse gas inspection and disclosure within the scope of: a.Direct greenhouse gas emissions b.Indirect greenhouse gas emissions The Company does pay attention to the impact of climate change on the operational activities, form and activate an energy-saving, carbon-reduction, and greenhouse emissions reduction strategy according to the business operation and greenhouse gas check results in order to reduce the impact of the Company’s business activity on the climate change.
3.Maintenance of social welfare (1)Does the Company have the relevant management
policies and procedures stipulated in accordance with the relevant laws and regulations and international conventions on human rights?
(2)Does the Company have the complaint mechanism and channel established for employees and have it handled properly?
(3)Does the Company provide employee with a safe
V
V
(1)In compliance with the relevant laws and labor regulations and in accordance with International Labor Convention and International Bill of Human Rights, Advantech Co. Ltd. formulated Business Conduct and the Employee Handbook and had them published on the Employee Portal for the convenience of our employees and managers. Advantech respects for employees’ equal
None
47

Evaluation Item
Implementation Status Deviating from the “Corporate Social Responsibility Best-Practice Principles for TWSE/GTSM Listed Companies” and the root cause
Yes No Abstract Explanation
and healthy working environment, and provide safety and health education to employees regularly?
(4)Does the Company have established a mechanism of periodical communication with employees and have the employee notified in a reasonable manner regarding the potential impact of the operation changes.
(5)Does the Company have an effective career capacity development training program established for the employees?
(6)Does the Company have the relevant consumer protection policies and complaint procedures established in the sense of R&D, procurement, production, operations, and service processes?
(7)Does the Company have products and services marketed and labeled in accordance with the relevant regulations and international norms?
(8)Does the Company have the suppliers checked in advance for any records of impacting the environment and society?
(9)Does the contract signed by the Company with the major suppliers entitle the Company to have the contract cancelled or terminated at any time when the suppliers violate the CSR policies that have a significant impact on the environment and society?
V
V
V
V
V
V
V
appointment and career development opportunities and will have no disparate treatment discrimination, or any form of discrimination in terms of personal gender, race, religion, political party, sexual orientation, rank, age, nationality and other issues. We are committed to providing employees with a safe and high-quality work environment, and with respect to our policies, Advantech faithfully abides by all kinds employment and labor laws; employment of child labor or illegal workers is prohibited; sexual harassment is prohibited; and the company is committed to providing employees with a safe and healthy work environment complying with various environmental laws and regulations and avoiding environmental pollution through proper management and technical applications.
(2)Advantech created Suggestion Box on the Employee Portal encouraging employees to make comments in a positive way, including workflow improvement, environmental improvement, product advice or cross-departmental operations, so as to build a culture of participation in the operation of the company and to encourage employees to make suggestions at any time. After receiving the proposal from the employee, Human Resources Department will forward it to the head of the relevant department, which will assess the proposal content and the need for improvement. After the content is carefully assessed and
48

Evaluation Item
Implementation Status Deviating from the “Corporate Social Responsibility Best-Practice Principles for TWSE/GTSM Listed Companies” and the root cause
Yes No Abstract Explanation
concluded, the colleague making the proposal will simultaneously receive the related information on the case concluded.
(3)The Company offers employees safe and healthy working environment and passes the occupational safety and health management system certification; provides employees with annual health checks that is better than the requirement of the Labor Standards Act; also, has the safety and health education arranged in the orientation that is held once in every two-month.
(4)Advantech releases and announces the results of operations and the future development policy, and the major operational changes by means of regular plenary meetings, meetings of heads, departmental meetings, and group meetings, complemented by the company’s periodicals, the internal employee website, and the video platform of "Advantech Executive Talks" to instantly share the company's business philosophy, the latest business information and the changes.
(5)The Company, through “Advantech School,” has diversified curriculum planned, established effective career capacity development and training program for employees; also, reflected the Company’s operating performance and results appropriately in the employee remuneration policies to ensure the recruitment, retention, and encouragement of human resources in order to reach the goal of
49

Evaluation Item
Implementation Status Deviating from the “Corporate Social Responsibility Best-Practice Principles for TWSE/GTSM Listed Companies” and the root cause
Yes No Abstract Explanation
sustainable business operation. (6)The Company has the consumer protection
policies and complaint procedures established; also, has had the procedure document of quality feedback system, customer service and satisfaction management, ATSC RMA operating instructions available to ensure proper handling.
(7)The Company has products and services marketed and labeled in accordance with the relevant regulations and international norms. The products are indeed 100% in compliance with the green product regulations of the international Environmental Protection Act throughout the Life Cycle Assessment (LCA) from the effective use of natural resources, the prohibition of hazardous substances, to proper waste management. Advantech based on safety, energy conservation, and environmental protection to promote green products and to have the product information and international standards published on the Company’s website (http://www.advantech.tw/csr/social_contribution/care_for_environment_over view) for the understanding of the customers and consumers.
(8)All the Company’s suppliers / contractors are required to sign the corporate social responsibility (CSR) agreement before signing the contract. Try to avoid dealing with the suppliers who are in violation of the Company’s corporate social responsibility policies. The CSR agreement requires the suppliers / contractors to comply with SA8000 social
50
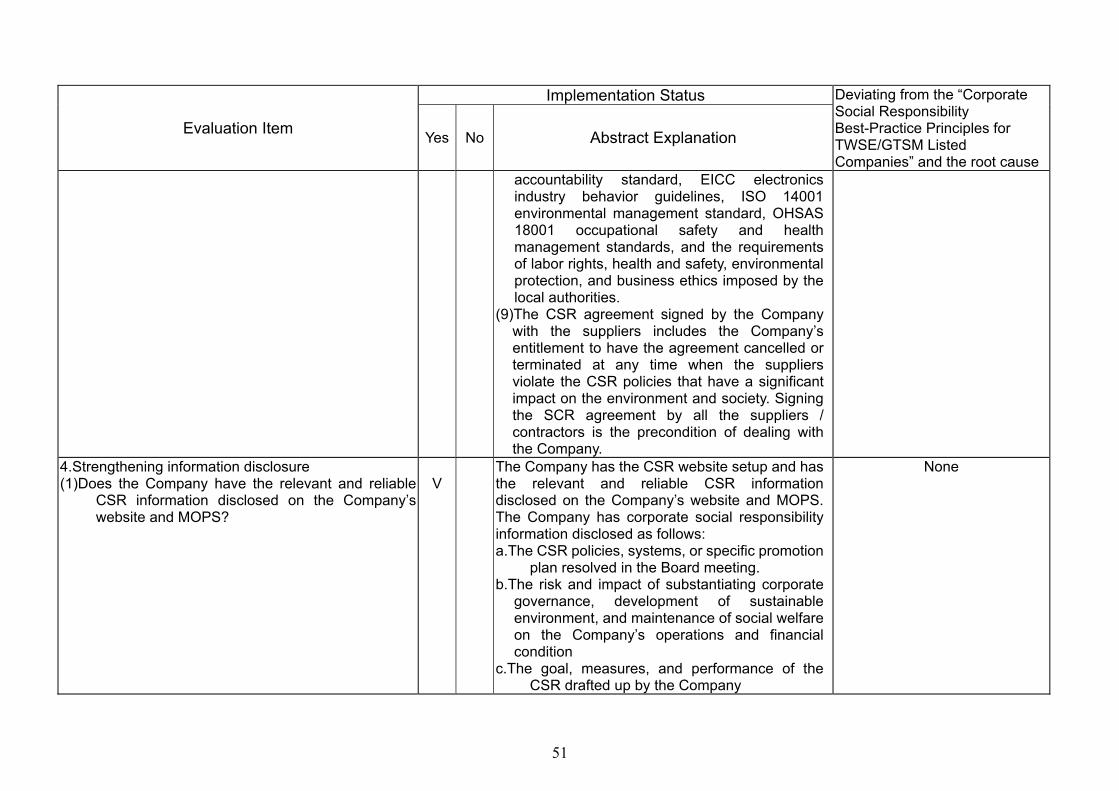
Evaluation Item
Implementation Status Deviating from the “Corporate Social Responsibility Best-Practice Principles for TWSE/GTSM Listed Companies” and the root cause
Yes No Abstract Explanation
accountability standard, EICC electronics industry behavior guidelines, ISO 14001 environmental management standard, OHSAS 18001 occupational safety and health management standards, and the requirements of labor rights, health and safety, environmental protection, and business ethics imposed by the local authorities.
(9)The CSR agreement signed by the Company with the suppliers includes the Company’s entitlement to have the agreement cancelled or terminated at any time when the suppliers violate the CSR policies that have a significant impact on the environment and society. Signing the SCR agreement by all the suppliers / contractors is the precondition of dealing with the Company.
4.Strengthening information disclosure (1)Does the Company have the relevant and reliable
CSR information disclosed on the Company’s website and MOPS?
V
The Company has the CSR website setup and has the relevant and reliable CSR information disclosed on the Company’s website and MOPS. The Company has corporate social responsibility information disclosed as follows: a.The CSR policies, systems, or specific promotion
plan resolved in the Board meeting. b.The risk and impact of substantiating corporate
governance, development of sustainable environment, and maintenance of social welfare on the Company’s operations and financial condition
c.The goal, measures, and performance of the CSR drafted up by the Company
None
51

Evaluation Item
Implementation Status Deviating from the “Corporate Social Responsibility Best-Practice Principles for TWSE/GTSM Listed Companies” and the root cause
Yes No Abstract Explanation
d.The main stakeholders and the issues of concerne.The management and performance of
environmental and social issues disclosed by the major suppliers
f.Other CSR-related information 5.If the Company has the “Corporate Social Responsibility Best-Practice Principles” stipulated in accordance with the “Corporate Social Responsibility
Best-Practice Principles for TWSE/GTSM Listed Companies,” please state its deviating from the “Corporate Social Responsibility Best-Practice Principles for TWSE/GTSM Listed Companies” in operation:
The Company has the policies of corporate social responsibility commitment, employee code of conduct, environment safety and health, and the prohibition of hazardous substances in products stipulated and substantiated in compliance with the “Corporate Social Responsibility Best-Practice Principles for TWSE/GTSM Listed Companies.” 6.Other important information helpful in understanding the corporate social responsibility operation:
Advantech always believes that corporate citizen in the society must fulfill its civic responsibility. We have brought this belief into our daily business operation mechanism. In practice, Advantech fulfills its civic responsibilities through the following four aspects of corporate commitment, social care, cooperation of academy and industry, and staff care: Corporate commitment: We have the corporate governance perfected and been responsible to the stakeholders through the organizational
operation and audit system of the Board of Directors, Audit Committee, Remuneration Committee, and Risk Management Committee; also, dedicated to the continuing innovation of design, production quality, and reliability through the quality management and commitment that is part of the corporate culture, been responsible to the customers and the environment, and received a number of international certifications and affirmations.
Social Care: Advantech is committed to the promotion of culture and education, and through Advantech Education and Culture Foundation, numerous projects have been organized to give back to society and assist those in need. In sponsoring social innovation projects, the “TiC100 Social Enterprise Competition” and the “iLab Project”, are the project which provide resources and nutrients for Taiwan’s social innovation practitioners. In so doing, our partner and Advantech are making positive change in society. As for the educational projects, our partner, Junyi Academy, uses technology to arrow the digital gap in the remote county for those disadvantaged students. And the “ACT's Active & Creative Teaching” project, Advantech volunteers in Taiwan provide life education through story-telling in elementary schools. Advantech Foundation also sponsor "Your vote, the power to decide the love" social welfare proposal – total grant $1.5M TWD to help small social welfare organization to realize their project around Taiwan. Last but not least, in promoting culture, Advantech Foundation are committed to promoting a series of art and cultural projects for years, hoping to enhance the artistic and Taiwan cultural literacy. We sponsor the National Taiwan Opera Academy to cultivate traditional art stars, and to be a traditional art culture. In addition, the Advantech Foundation regularly sponsor local performing arts groups, total grans in 2018 is over $3.5M TWD.
52
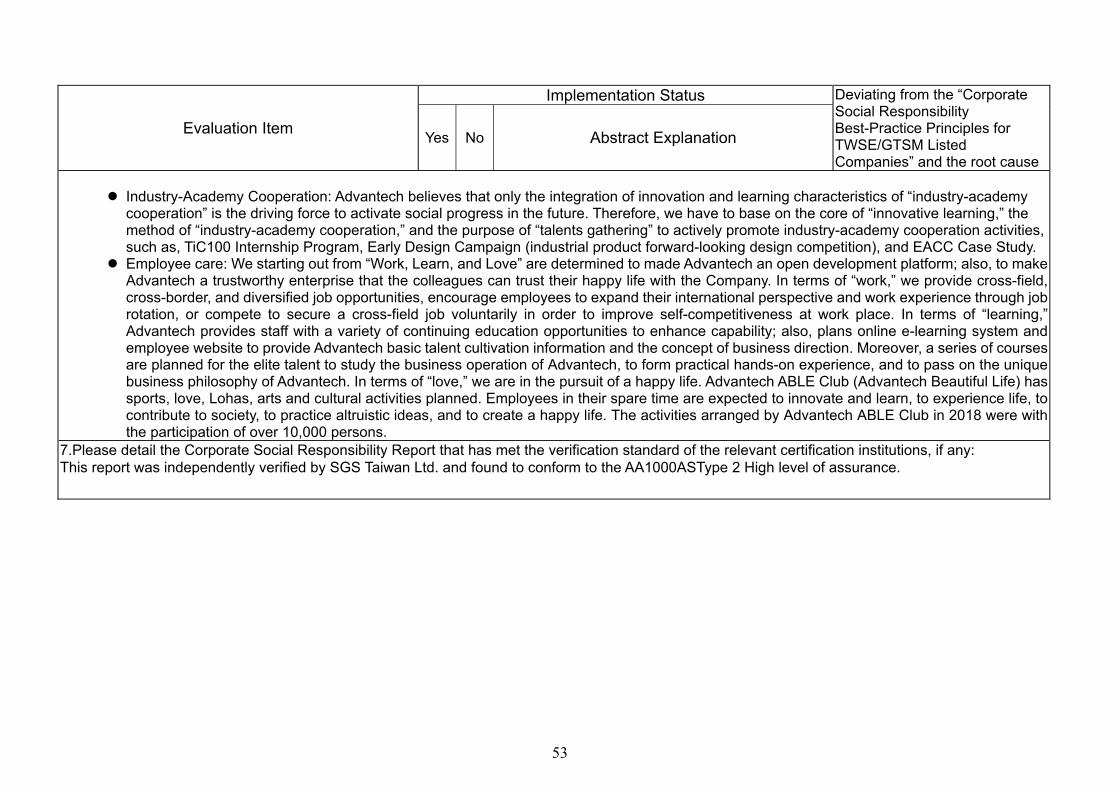
Evaluation Item
Implementation Status Deviating from the “Corporate Social Responsibility Best-Practice Principles for TWSE/GTSM Listed Companies” and the root cause
Yes No Abstract Explanation
Industry-Academy Cooperation: Advantech believes that only the integration of innovation and learning characteristics of “industry-academy
cooperation” is the driving force to activate social progress in the future. Therefore, we have to base on the core of “innovative learning,” the method of “industry-academy cooperation,” and the purpose of “talents gathering” to actively promote industry-academy cooperation activities, such as, TiC100 Internship Program, Early Design Campaign (industrial product forward-looking design competition), and EACC Case Study.
Employee care: We starting out from “Work, Learn, and Love” are determined to made Advantech an open development platform; also, to make Advantech a trustworthy enterprise that the colleagues can trust their happy life with the Company. In terms of “work,” we provide cross-field, cross-border, and diversified job opportunities, encourage employees to expand their international perspective and work experience through job rotation, or compete to secure a cross-field job voluntarily in order to improve self-competitiveness at work place. In terms of “learning,” Advantech provides staff with a variety of continuing education opportunities to enhance capability; also, plans online e-learning system and employee website to provide Advantech basic talent cultivation information and the concept of business direction. Moreover, a series of courses are planned for the elite talent to study the business operation of Advantech, to form practical hands-on experience, and to pass on the unique business philosophy of Advantech. In terms of “love,” we are in the pursuit of a happy life. Advantech ABLE Club (Advantech Beautiful Life) has sports, love, Lohas, arts and cultural activities planned. Employees in their spare time are expected to innovate and learn, to experience life, to contribute to society, to practice altruistic ideas, and to create a happy life. The activities arranged by Advantech ABLE Club in 2018 were with the participation of over 10,000 persons.
7.Please detail the Corporate Social Responsibility Report that has met the verification standard of the relevant certification institutions, if any: This report was independently verified by SGS Taiwan Ltd. and found to conform to the AA1000ASType 2 High level of assurance.
53

3.3.6 Ethical Corporate Management
Assessment Items
Operation (Note 1) Deviating from the “Ethical Management Best-Practice Principles for TWSE/GTSM Listed Companies” and the root cause
Yes No Summary
1.Formation of ethical management policies and methods (1)Does the Company have the ethical management
policy and method declared explicitly in the Articles of Incorporation and external documents; also, the commitment of the board of directors and the management to actively implement the operating policies?
(2)Does the Company have the prevention program for any fraud stipulated; also, have the respective operating procedures, guidelines for conduct, disciplinary actions, and complaints system declared explicitly; also have it implemented substantively?
(3)Does the Company have preventive measures adopted in response to the conducts stated in Article 7 Paragraph 2 of the “Ethical Management Best Practice Principles for TWSE/GTSM Listed Companies” or other business activities subject to higher risk of fraud?
V
V
V
(1)The Company has established the Ethical Corporate Management Best Practice Principles, which has been published on the Company’s website and CSR website. The Ethical Corporate Management Best Practice Principles stipulate that directors, managers, employees, and mandataries of the Company or persons having substantial control over the Company shall implement the concept of ethical corporate management with the principle of good faith.
(2)The Ethical Corporate Management Best Practice Principles explicitly stipulate procedures and guidelines for preventing unethical conduct. The Whistle-blowing Handling Guidelines have also been established for implementation.
(3)The Ethical Corporate Management Best Practice Principles have stipulated the preventive measures for business activities which are possibly at a higher risk of being involved in unethical conduct prescribed in Paragraph 2, Article 7 of the Ethical Corporate Management Best Practice Principles for TWSE/GTSM Listed Companies or within other business scopes.
None
2.Substantiation of ethical management (1)Does the company have the integrity of the trade
counterparty assessed and with the code of integrity expressed in the contract signed?
(2)Does the Company have a specific (part-time) unit setup under the board of directors to advocate the code
V
V
(1)The Company expects and takes action to help trading partners recognize and comply with ethical corporate management. Depending on the circumstances, the provisions pertaining to ethical conduct will be prescribed in the contracts entered into with trading partners. If any unethical conduct
None
54

Assessment Items
Operation (Note 1) Deviating from the “Ethical Management Best-Practice Principles for TWSE/GTSM Listed Companies” and the root cause
Yes No Summary
of integrity and to report on its implementation to the Board on a regular basis?
(3)Does the Company have developed policies to prevent conflicts of interest, provided adequate channel for communication, and substantiated the policies?
(4)Does the Company have established effective accounting systems and internal control systems to substantiate ethical management; also, have audits performed by the internal audit unit on a regular basis or by the commission CPAs?
(5)Does the Company have organized ethical management internal and external education and training programs on a regular basis?
V
V
V
is found during transactions, the Company may terminate the transactions or rescind the contracts.
(2) The Human Resources Department and the Legal Department jointly cooperate to conduct internal education and training for the Company’s employees and establish an effective system of professional ethics and compliance. Externally, the Purchase Department invites external suppliers to participate in the supplier conferences held by the Company for directly and face-to-face share the concept of the Company's integrity management with suppliers, and inform the Legal Department about such implementation. The Legal Department will report the relevant operations to the Board of Directors once per year, and ensure that all operations of the Company comply with the requirements of relevant regulations and Ethical Corporate Management Best Practice Principles under the supervision of the Board of Directors.
(3)The Company’s “Guidelines for the Adoption of Codes of Conduct” for employees and the “Guidelines for the Adoption of Codes of Ethical Conduct” for the directors and managers include the clause of conflict of interest prevention; also, report any doubtful conflict of interest to the direct supervisor.
(4)To ensure the implementation of ethical corporate management, the Company has set up the accounting system and the internal control
55

Assessment Items
Operation (Note 1) Deviating from the “Ethical Management Best-Practice Principles for TWSE/GTSM Listed Companies” and the root cause
Yes No Summary
system, whose implementation will be audited by internal auditors on a regular basis and reported to the Board.
(5)The Company has published regulations and policies on the website for all employees’ access. They are also included in the employee orientation and user manuals; in addition, the Company will organize a supplier conference on a regular basis to facilitate communication and make known related regulations pertaining to ethical corporate management.
3.The operation of the Company’s Report System (1)Does the Company have a specific report and reward
system stipulated, a convenient report channel established, and a responsible staff designated to handle the individual being reported?
(2)Does the Company have the standard investigating procedures and related confidentiality mechanism established for the incidents being reported?
(3)Does the Company have taken proper measures to protect the whistleblowers from suffering any consequence of reporting an incident?
V
V
V
(1)The Company has set up an email box and a whistle-blowing mailbox to encourage employees, clients, and third-party suppliers to express their opinions and report unethical conduct. The audit unit takes charge of the whistle-blowing mailbox and report to the Board and the chairman of the Board. Depending on the circumstances, investigators will be appointed to investigate the cases reported.
(2)The Company has established the Whistle-blowing Handling Guidelines and related procedures, which stipulate that the identity of whistleblowers and contents reported shall be kept confidential and that investigators shall take proper care of information obtained during the investigation. To fully protect whistleblowers, an independent code will be assigned to each case reported.
(3)The Company has the “Regulations Governing
None
56

Assessment Items
Operation (Note 1) Deviating from the “Ethical Management Best-Practice Principles for TWSE/GTSM Listed Companies” and the root cause
Yes No Summary
the Reporting” and related operating procedures stipulated. The identity of the whistleblower and the content of the reporting should be kept confidential and protected; also, the involving investigators should not disclose any information without authorization so to protect the whistleblower from any unfair treatment, retaliation, or threat.
4.Strengthening information disclosure (1)Does the Company have the content of ethical
management and its implementation disclosed on the website and MOPS?
V The Company has a website in Chinese and English and a CSR website established; also, the “Ethical Management Best-Practice Principles” is published on the MOPS.
None
5.If the Company has the “Ethical Management Best-Practice Principles” stipulated in accordance with the “Ethical Management Best-Practice Principles for TWSE/GTSM Listed Companies,” please state its deviating from the “Ethical Management Best-Practice Principles for TWSE/GTSM Listed Companies” in operation: Advantech has established the Code to require that all employees, officers and board members comply with the Code and the other policies and procedures. There is no discrepancy between the Code, including its affiliate policies and procedures, and its implementation. 6.Other important information helpful in understanding the ethical management operation: (Such as, the Company has its Ethical Management
Best-Practice Principles reviewed and amended, etc.) Request the suppliers and contractors (including security company) through the Procurement Department and General Affairs Department to sign the “Corporate Social Responsibility and Environmental Safety and Health Commitment” and implement the relevant education and training and advocacy through the Supplier Convention. 3.3.7 The Company has the corporate governance Best-Practice Principle and the related inquiries established: The Company website is
with the corporate governance section designated for investor’s inquiring and downloading corporate governance-related regulations; also, it is published on the MOPS.
3.3.8 Other important information helpful in understanding the corporate governance operation: None
57

3.3.9 The implementation of the internal control system:
Advantech Co., Ltd.
Statement of Internal Control System Date: March 31, 2019
Based on the findings of a self-assessment, Advantech Co., Ltd. (Advantech) states the following with regard to its internal control system during the year 2018:
1. Advantech’s Board of Directors and Management are responsible for establishing, implementing, and maintaining an adequate internal control system, and Advantech has established such a system. Our internal control system is designed to provide reasonable assurance over the effectiveness and efficiency of operations (including profitability, performance, and safeguarding of assets), reliability, timeliness, transparency of reporting, and compliance with applicable laws and regulations.
2. An internal control system has its inherent limitations. No matter how perfectly designed, an effective internal control system can only provide reasonable assurance of accomplishment the objectives mentioned above. Furthermore, the effectiveness of an internal control system may be subject to changes due to circumstances beyond control. Nevertheless, the internal control system of Advantech contains self-monitoring mechanisms, and Advantech takes immediate remedial actions in response to any identified deficiencies.
3. Advantech evaluates the design and operating effectiveness of its internal control system based on the criteria provided in the “Regulations Governing the Establishment of Internal Control Systems by Public Companies” (herein below, the “Regulations“). The criteria adopted by the Regulations identify five components of managerial internal control: (1) control environment, (2) risk assessment, (3) control activities, (4) information and communication, and (5) monitoring activities. Each component further contains several items. Please refer to the Regulations for details.
4. Advantech has evaluated the design and operating effectiveness of its internal control system according to the aforesaid criteria.
5. Based on the findings of the evaluation mentioned in the preceding paragraph, Advantech believes that, on December 31, 2018, it has maintained, in all material respects, and effective internal control system (that includes the supervision and management of subsidiaries), to provide reasonable assurance over operational effectiveness and efficiency, reliability , timeliness, transparency of reporting, and compliance with applicable laws and regulations.
6. This Statement will be an integral part of Advantech’s Annual Report and Prospectus and will be made public. Any falsehood, concealment, or other illegality in the content made public will entail legal liability under Articles 20, 32, 171, and 174 of the Securities and Exchange Act.
7. This Statement has been passed by the Board of Directors in their meeting on March 8, 2019, with all of the seven attending directors all affirming the content of this Statement.
Advantech Co.,Ltd.
K.C. Liu Chairman
Eric Chen General Manager Miller Chang General Manager Linda Tsai General Manager
58

3.3.10 If a CPA is commissioned to review internal control system specifically, the review report should be disclosed: None The Company and its internal staff being punished lawfully, the punishment given by the Company to the violators of internal control system, major nonconformity, and the improvement in the most recent year and up to the publication of the annual report: None
3.3.11 The material resolutions reached in the shareholders’ meeting and board meeting in the most recent year and up to the publication of the annual report: Important resolution reached in the Shareholders’ meeting and its implementation
Advantech had the 2018 general shareholders’ meeting held at the Neihu Headquarters on May 24, 2018. The resolutions reached in the shareholders’ meeting and their implementations are as follows: 1. The acknowledgement of the 2017 business report and financial statements
Implementation: Resolved and acknowledged. 2. The acknowledgement of the Company’s 2017 earnings distribution.
Implementation:Scheduled the distribution date on July 15, 2018 and the payment date on August 08, 2018 (Cash dividend: NT$6.6)
3.The acknowledgement of the Company’s “Articles of Association” amendment. Implementation:The Ministry of Economic Affairs approved the change registration and the announcement on the Company’s website on June 06, 2018.
4. Discussion of the listing plan of the company’s subsidiary LNC Technology Co.Ltd. In order to meet the requirements of applicable laws and regulations, we intend to have the shareholders authorize through the meeting that the Board of Directors may handle related capital increase by cash and release of shares within one year for the subsidiary. Implementation: The board of directors resolved to dispose the stocks of subsidiary (LNC Technology Co.Ltd ).
Important resolutions of the Board of Directors The important resolutions of the Board of Directors in 2018 and up to the printing date of the annual report are summarized as follows: 1.General board meeting on March 02, 2018: ‧ Approved the Company’s 2018 business budget and operating plan. ‧ Approved the Company’s 2017 business report, proprietary financial
statements and consolidated financial statements. ‧ Approved the Company’s 2017 distribution of remuneration to employees
and remuneration to directors and supervisors. ‧ Approved the Company’s 2017 earnings distribution. ‧ Approved the Company’s 2018 general shareholders’ meeting convening
matters. ‧ Approved the time period and place to accept shareholder’s proposals for
the Company’s 2018 general shareholders’ meeting. ‧ Approved the planning of the listing plan of the company’s subsidiary LNC
Technology Co.Ltd. In order to meet the requirements of applicable laws and regulations, The Company intend to have the shareholders authorize through the meeting that the Board of Directors may handle related capital increase by cash and release of shares within one year for the subsidiary.
‧ Approved the Company’s offering endorsement/guarantee to the subsidiaries for applying for bank credit line.
59

‧ Approved the application filed for the Company’s 2018 bank credit line and authorized the Chairman to apply to the bank for credit loan renewal project within the credit line depending on the business operation.
‧ Approved the Company’s 2017 “Declaration of Internal Control” completed. ‧ Approved the Company’s “Articles of Association” amendment. ‧ Approved the 2017 CPA Independence Assessment Proposal
2.General board meeting on March 30, 2018: ‧ Approved the Company’s BOD acquire Nippon RAD Inc .
3. General board meeting on April 27, 2018: ‧ Approved the Company’s 2018Q1 consolidated financial statements.
4.General board meeting on May 24, 2018: ‧ Approved the 2017 earnings distribution proposal that was resolved in the
general shareholders’ meeting on May 24, 2018 with the distribution base date scheduled.
‧ Approved the board of directors resolved to dispose the stocks of subsidiary (LNC Technology Co.Ltd )
5.General board meeting on July 27, 2018: ‧ Approved the Company’s 2018Q2 consolidated financial statements. 6.General board meeting on September 26, 2018: ‧ Approved the Company is approved to subscribe 100% of shares of Omron
Nohgata Co., Ltd., a subsidiary of Omron Corp. (a Japanese corporate), and the action will be completed in two subscriptions. Additional meeting of the Board of Directors is suggested to be convened after the aforesaid conditions have been agreed upon.
‧ Approved the proposal of application for bank financing or foreign exchange account for the Company's newly established subsidiary Omron Nohgata Co., Ltd. (or Advantech Nohgata Co.,Ltd in the future) (referred to the “Debtor”) has been approved. Therefore, the Company attempts to contact Citibank National Association, Citibank Taiwan and Citigroup Inc. (collectively referred as “Citibank”, as defined in the Guarantee) to acquire financing from, conduct foreign exchange and derivate transactions with, and submit Guarantee to Citibank. All Directors have agreed the proposal of stock subscription of Omron Nohgata Co.,Ltd.(the subsidiary of Japan’s Omron Group) may only be approved under conditions of “such proposal itself approved and the subscription contract signed by the Board of Directors”.
‧ Approved the proposal of revision to the proposal of investment framework to
its Subsidiary DLOG Gesellschaft fur elektronische Datentechnik mbH
(A-DLoG) by the Company has been approved. 7.General board meeting on Oct 26, 2018: ‧ Approved the Company’s 2018Q3 consolidated financial statements. ‧ Approved the the Company is approved to subscribe 100% of shares of
Omron Nohgata Co., Ltd., a subsidiary of Omron Corp. (a Japanese corporate), and the action will be completed in two subscriptions.
‧ Approved the Company’s the proposal of application for bank financing or foreign exchange account for the Company's newly established subsidiary Omron Nohgata Co., Ltd. (or Advantech Nohgata Co.,Ltd in the future)
60

(referred to the “Debtor”) has been approved. Therefore, the Company attempts to contact Citibank National Association, Citibank Taiwan and Citigroup Inc. (collectively referred as “Citibank”, as defined in the Guarantee) to acquire financing from, conduct foreign exchange and derivate transactions with, and submit Guarantee to Citibank.
‧ Approved the proposal of the Company’s 2018 internal auditing plan. ‧ Approved the company acquires Advantech Automation Corp. ‧ (BVI) shares ‧ Approved the Company to acquire Advantech Corporate Investment. shares ‧ Approved the announcement of the resolution of the board of directors of the
company to pass the construction of Advantech Linkuo Industrial Park Stage III construction
8.General board meeting on Mar 08, 2019: ‧ Approved the Company’s 2019 business budget and operating plan. ‧ Approved the Company’s 2018 business report, proprietary financial
statements and consolidated financial statements. ‧ Approved the Company’s 2018 distribution of remuneration to employees
and remuneration to directors supervisors. ‧ Approved the Company’s 2018 earnings distribution. ‧ Approved the Company’s 2018 general shareholders’ meeting convening
matters. ‧ Approved the time period and place to accept shareholder’s proposals for the
Company’s 2019 general shareholders’ meeting. ‧ Approved the 2018 CPA Independence Assessment Proposal. ‧ Approved the Company’s offering endorsement/guarantee to the subsidiaries
for applying for bank credit line. ‧ Approved the application filed for the Company’s 2019 bank credit line and
authorized the Chairman to apply to the bank for credit loan renewal project within the credit line depending on the business operation.
‧ Approved the Company’s 2018 “Declaration of Internal Control” completed. ‧ Approved the Company’s “Articles of Association” amendment. ‧ Approved the Company’s “Procedures For Acquisition or Disposal of Assets ”
amendment ‧ Approved the Company’s “Procedures For Financial Derivatives
Transactions ” amendment ‧ Approved the of Advantech subsidiary Advantech Corporate Investment, a
new company will be incorporated. 3.3.12 The contents of the board resolutions regarding which independent directors have
voiced opposing or qualified opinions on the record or in writing in the most recent year or up to the publication of the annual report: None
3.3.13 The resignation or dismissal of the Company’s Chairman, President, Accounting Officer, Finance Office, Internal Audit Director, and R&D Director in the most recent year or up to the publication of the annual report: None
61
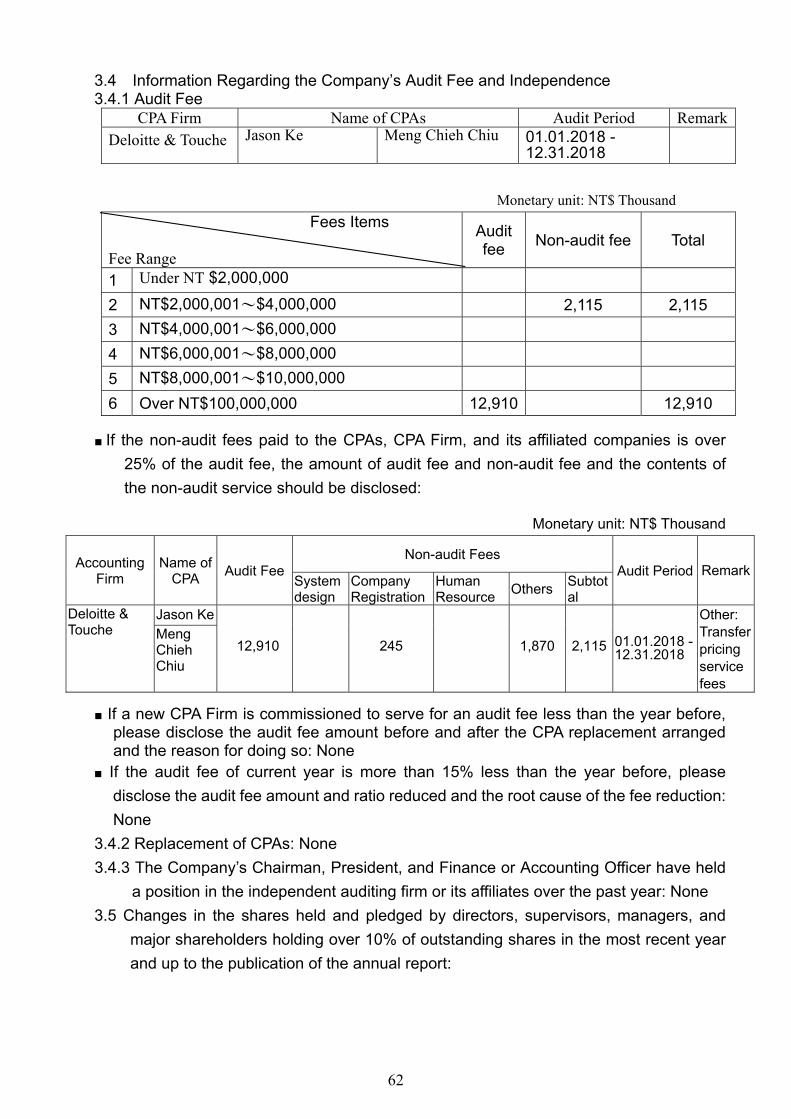
3.4 Information Regarding the Company’s Audit Fee and Independence 3.4.1 Audit Fee
CPA Firm Name of CPAs Audit Period RemarkDeloitte & Touche Jason Ke Meng Chieh Chiu 01.01.2018 -
12.31.2018
Monetary unit: NT$ Thousand
Fees Items Fee Range
Audit fee
Non-audit fee Total
1 Under NT $2,000,000
2 NT$2,000,001~$4,000,000 2,115 2,115
3 NT$4,000,001~$6,000,000
4 NT$6,000,001~$8,000,000
5 NT$8,000,001~$10,000,000
6 Over NT$100,000,000 12,910 12,910
■ If the non-audit fees paid to the CPAs, CPA Firm, and its affiliated companies is over
25% of the audit fee, the amount of audit fee and non-audit fee and the contents of
the non-audit service should be disclosed:
Monetary unit: NT$ Thousand
Accounting Firm
Name of CPA
Audit Fee Non-audit Fees
Audit Period RemarkSystem design
Company Registration
Human Resource
Others Subtotal
Deloitte & Touche
Jason Ke
12,910
245
1,870
2,115 01.01.2018 - 12.31.2018
Other: Transfer pricing service fees
Meng Chieh Chiu
■ If a new CPA Firm is commissioned to serve for an audit fee less than the year before, please disclose the audit fee amount before and after the CPA replacement arranged and the reason for doing so: None
■ If the audit fee of current year is more than 15% less than the year before, please
disclose the audit fee amount and ratio reduced and the root cause of the fee reduction:
None
3.4.2 Replacement of CPAs: None
3.4.3 The Company’s Chairman, President, and Finance or Accounting Officer have held
a position in the independent auditing firm or its affiliates over the past year: None
3.5 Changes in the shares held and pledged by directors, supervisors, managers, and
major shareholders holding over 10% of outstanding shares in the most recent year
and up to the publication of the annual report:
62

Changes in equity:
Title Name
2018 As of March 31
Increase (decrease) of shareholding
Increase (decrease) of
shares pledged
Increase (decrease)
of shareholdin
g
Increase (decrease) of shares pledged
Director K.C. Liu 0 0 0 0
Director Advantech Foundation 0 0 0 0
Representative Chaney Ho 0 0 (30,000) 0
Director Ted Hsu 0 0 0 0
Director AIDC Investment Corp. 0 0 0 0
Representative Donald Chang 0 0 0 0
Independent director
Jeff Chen 0 0 0 0
Independent director
Joseph Yu 0 0 0 0
Independent director
Benson Liu 0 0 0 0
President Eric Chen 50,000 0 0 0
President Miller Chang 30,000 0 (59,000) 0
President Linda Tsai 53,000 0 0 0
Vice President Deyu Yin 0 0 0 0
Accounting Officer
Rorie Kang 0 0 0 0
Major shareholder
Asus Computer Co., Ltd. 0 0 0 0
Major shareholder
K and M Investment Co., Ltd. 205,000 0 0 0
3.5.1 The counterparty of the equity transfer is a related party: None
3.5.2 The counterparty of the equity pledge is a related party: None
63

3.6 The Top-10 shareholders who are the spouses or relatives within second-degree to each other:
Unit: Shares; %
Name
Current
Shareholding
Spouse’s/minor’s Shareholding
Shareholdingby Nominee Arrangement
Name and Relationship Between the Company’s Top Ten Shareholders, or Spouses or Relatives Within Two Degrees
Remark
Shares (%) Shares (%) Shares (%) Title Relations
Asus Computer Co., Ltd. Representative: Jonny Shih 100,628,870 14.40 0 0 0 0 None None None
0 0 0 0 0 0 None None None
K and M Investment Co., Ltd. Representative: K.C. Liu 82,868,163 11.89 0 0 0 0 AIDC Investment Corp. Director
None 25,620,886 3.67 1,343,794 0.19 0 0 Advantech Foundation Director
AIDC Investment Corp. Representative: Mary Chang 82,097,182 11.75 0 0 0 0 K and M Investment Co., Ltd Director
None
1,343,794 0.19 25,620,886 3.67 0 0 Advantech Foundation Director
K.C. Liu
25,620,886 3.67 1,343,794 0.19 0 0
K and M Investment Co., Ltd.
Director
None AIDC Investment Corp. Director
Advantech Foundation Director
HSBC commissioned to manage Yuan-Wang Partner Fund Limited Partnership account
24,599,359 3.52 0 0 0 0 None None None
Tran-Fei Development Co., Ltd. 20,324,916 2.91 0 0 0 0 None None None
Advantech Foundation Representative: K.C. Liu 20,288,715 2.90 0 0 0 0
K and M Investment Co., Ltd.
DirectorNone
25,620,886 3.67 1,343,794 0.19 0 0 AIDC Investment Corp. Director
Yong-Shun Zhuang 15,921,725 2.28 0 0 0 0 None None None
HSBC (Taiwan) Commercial Bank Co., Ltd Trustee Account 10,859,812 1.55 0 0 0 0 None None None
Hermes Investment Funds plc on behalf of Hermes Global Emerging Markets Fund
8,902,919 1.27 0 0 0 0 None None None
Note1: lustrate the name of the Top-10 shareholders; also, illustrate separately the name of the institutional shareholder and its representative.
Note2: The shareholding ratio is calculated by referring to the shares held by the Principal, the Principal’s spouses and underage children, or by nominee agreement.
Note3: Disclose the relationship among shareholders referred to above, including the juristic person and natural person.
64

3.7 The shares of the invested company held by the Company, the Company’s directors, supervisors, managers, and companies controlled directly or indirectly, and the aggregated overall shareholding ratio:
% Unit: Shares; %
Item
Affiliated Enterprises
Abbreviation
Ownership by the
Company
Direct or Indirect
Ownership by
Directors/Supervisors/
Managers
Total Ownership
Shares (%) Shares (%) Shares (%)
01 Advanixs Corporation. Advansus 10,000,000 100 -- -- 10,000,000 100
02 Advantech Corporate Investment . -- 150,000,000 100 -- -- 150,000,000 100
03 Advantech Co. Singapore Pte, Ltd. ASG 1,450,000 100 -- -- 1,450,000 100
04 Advantech Japan Co., Ltd. AJP 1,200 100 -- -- 1,200 100
05 Advantech Australia Pty Ltd. AAU 500,204 100 -- -- 500,204 100
06 Advantech Co.,Malaysia Sdn. Bhd AMY 2,000,000 100 -- -- 2,000,000 100
07 Advantech Europe Holding B.V. AEUH 25,961,250 100 -- -- 25,961,250 100
08 Advantech Technology Co., Ltd. ATC 33,850,000 100 -- -- 33,850,000 100
09 Advantech Automation Corp. AAC(BVI) 74,623,834 100 -- -- 74,623,834 100
10 Advantech Europe B.V. AEU -- -- 32,315,215 100 32,315,215 100
11 Advantech Poland Sp z.o.o APL -- -- 6,350 100 6,350 100
12 Advantech Technology (China) Company., Ltd. AKMC -- -- -- 100 -- 100
13 Advantech Corporation ANA -- -- 10,952,606 100 10,952,606 100
14 Beijing Yan Hua Xing Ye Electronics
Science &Technology Co., Ltd. ACN -- -- -- 100 -- 100
15 HK Advantech Technology Co., Limited ATC(HK) -- -- 57,890,679 100 57,890,679 100
16 Advantech Automation Corp.(HK) Limited AAC(HK) -- -- 15,230,001 100 15,230,001 100
17 Shanghai Advantech Intelligent Services Co., Ltd. AiSC -- -- -- 100 -- 100
18 Xi’An Advantech Software Co., Ltd. AXA -- -- -- 100 -- 100
19 Advantech Brazil S/A ABR 1,794,996 80 -- -- 1,794,996 80
20 Advantech Intelligent Service. AiST 10,000,000 100 -- -- 10,000,000 100
21 Advantech KR Co., Ltd. AKR 600,000 100 -- -- 600,000 100
22 Advantech Service IoTGmbH A-SIoT -- -- 1 100 1 100
23 Cermate Technology Inc. Cermate -- -- 5,500,000 55 5,500,000 55
24 Advantech Corporation (Thailand) Co., Ltd. ATH 51,000 51 49,000 49 100,000 100
25 LandMark Co.,Ltd. LandMark -- -- 972,284 100 972,284 100
65

Item
Investment Business
Abbreviation
The Company’s
investment
Investment of
directors, supervisors,
managers, and directly
or indirectly controlled
business
Omnibus investment
Shares
Sharehol
ding
ratio (%)
Shares
Share
holdin
g ratio
(%)
Shares
Sharehol
ding ratio
(%)
26 Cermate Technologies (Shanghai) Inc. Cermate
Shanghai-- -- -- 100 -- 100
27 Shenzhen Cermate Technologies Inc. Cermate
Shenzhen-- -- -- 90 -- 90
28 Advantech International PT. AID -- -- 300,000 100 300,000 100
29 Advantech Industrial Computing India Pvt. Ltd. AIN 3,999,999 99.99 1 0.01 4,000,000 100
30 Advantech Electronics, S.De R.L.De C. AMX -- 100 -- -- -- 100
31 AdvanPOS Technology Co., Ltd. AdvanPOS 1,000,000 100 -- -- 1,000,000 100
32 LNC Technology Co.,Ltd. LNC 19,230,000 64.10 -- -- 19,230,000 64.10
33 Better Auto Holdings Limited -- -- -- 7,900,000 100 7,900,000 100
34 Famous Now Limited -- -- -- 1 100 1 100
35 LNC DONG GUAN CO., LTD - -- -- -- 100 -- 100
36 Advantech Innovative Design Co., Ltd. Advantech Innovative
Design 1,000,000 100 -- -- 1,000,000 100
37 B+B SmartWorx Inc. B+B 230,467 60 153,644 40 384,111 100
38 B+B SmartWorx Limited BBI -- -- -- 100 -- 100
39 B&B IMC, LLC. IMC -- -- -- 100 -- 100
40 B&B Electronics Holdings LLC B&B
Electronics-- -- -- 100 -- 100
41 Advantech B+B SmartWorx s.r.o.CZ B+B(CZ) -- -- -- 100 -- 100
42 Conel Automation s.r.o. Conel
Automation-- -- -- 100 -- 100
43 Advantech Technology DMCC. DMCC -- -- -- 100 -- 100
44 Kostec co.,Ltd. AKST 69,740 76 22,023 24 91,763 100
45 Limited Liability Company Advantech TechnologyARU 500,000 100 -- -- 500,000 100
46 Advantech Vietnam Technology Company Limited AVN 8,100 60 -- -- 8,100 60
47 雲研物聯股份有限公司 雲研 -- -- 500,000 50 500,000 50
48 環研智聯股份有限公司 環研 -- -- 500,000 50 500,000 50
49 Advantech Service-IoT Co. Ltd. SIoT(Cayma
n) -- -- 30,000,000 100 30,000,000 100
50 研華服創(上海)智能科技有限公司 SIoT(China) -- -- -- 100 -- 100
66

IV. Capital Overview 4.1 Capital and shares
4.1.1 Sources of capital
Unit: Thousand shares; NT$ Thousand
Month /
year
Par Value (NT$)
Authorized capital Paid-in capital Remark
Shares Amount Shares Amount Source of capital
Capital Increased byAssets Other
than Cash
Others
07.1997 10 100,000 1,000,000 47,500 475,000Capitalization by cash 171,000
None Note 1Capitalization by earnings 114,000
06.1998 10 100,000 1,000,000 80,750 807,500Capitalization by cash 95,000 None
Note 2Capitalization by earnings 237,500
06.1999 10 200,000 2,000,000 130,700 1,307,000 Capitalization by earnings 499,500 None Note 3
05.2000 10 298,000 2,980,000 174,500 1,745,000 Capitalization by earnings 438,000 None Note 4
08.2001 10 298,000 2,980,000 233,200 2,332,000 Capitalization by earnings 587,000 None Note 5
12.2001 10 298,000 2,980,000 233,429 2,334,294 Conversion of convertible bond 2,294 None
02.2002 10 298,000 2,980,000 233,486 2,334,865 Conversion of convertible bond 571 None
06.2002 10 500,000 5,000,000 285,513 2,855,130Capitalization by earnings 520,135 None
Note 6Conversion of convertible bond 130
12.2002 10 500,000 5,000,000 285,529 2,855,292 Conversion of convertible bond 162 None
02.2003 10 500,000 5,000,000 286,242 2,862,423 Conversion of convertible bond 7,131 None
04.2003 10 500,000 5,000,000 292,846 2,928,462 Capitalization 66,039 Note 9 Note 7
06.2003 10 500,000 5,000,000 341,304 3,413,039 Capitalization by earnings 484,577 None Note 8
03.2004 10 500,000 5,000,000 337,728 3,377,279Cancellation of Treasury Stock (38,620) None
Conversion of convertible bond 2,860
06.2004 10 500,000 5,000,000 362,862 3,628,617Capitalization by earnings 223,864 None
Note 10Conversion of convertible bond 27,474
09.2004 10 500,000 5,000,000 369,230 3,692,299 Conversion of convertible bond 63,682 None
12.2004 10 500,000 5,000,000 374,296 3,742,812 Conversion of convertible bond 50,513 None
03.2005 10 500,000 5,000,000 374,767 3,747,672 Conversion of convertible bond 4,860 None
06.2005 10 500,000 5,000,000 401,683 4,016,833Capitalization by earnings 237,384 None
Note 11Conversion of convertible bond 31,777
09.2005 10 500,000 5,000,000 403,889 4,038,893 Conversion of convertible bond 22,060 None
12.2005 10 500,000 5,000,000 448,783 4,487,826 Exchange of shares 448,933 None Note 12
67

Month / Year
Par Value (NT$)
Authorized capital Paid-in capital Remark
Shares Amount Shares Amount Source of capital
Capital Increased byAssets Otherthan Cash
Others
01.2006 10 500,000 5,000,000 448,900 4,489,003 Conversion of convertible bond 477 None
Conversion of stock option 700
04.2006 10 500,000 5,000,000 448,960 4,489,603 Conversion of stock option 600 None
07.2006 10 500,000 5,000,000 463,180 4,631,795 Capitalization by earnings 139,792 None Note 13
Conversion of convertible bond 2,100
Conversion of stock option 300
09.2006 10 500,000 5,000,000 463,365 4,633,645 Conversion of stock option 1,850 None
12.2006 10 500,000 5,000,000 463,630 4,636,295 Conversion of stock option 2,650 None
03.2007 10 500,000 5,000,000 463,665 4,636,645 Conversion of stock option 350 None
07.2007 10 600,000 6,000,000 490,847 4,908,470 Capitalization by earnings 271,825 None Note 14
09.2007 10 600,000 6,000,000 491,227 4,912,270 Conversion of stock option 3,800 None
12.2007 10 600,000 6,000,000 491,577 4,915,770 Conversion of stock option 3,500 None
04.2008 10 600,000 6,000,000 491,877 4,918,770 Conversion of stock option 3,000 None
07.2008 10 600,000 6,000,000 481,877 4,818,770 Cancellation of Treasury Stock (100,000) None Note 15
07.2008 10 600,000 6,000,000 481,962 4,819,620 Conversion of stock option 850 None
08.2008 10 600,000 6,000,000 511,330 5,113,308 Capitalization by earnings 293,688 None Note 16
10.2008 10 600,000 6,000,000 511,346 5,113,458 Conversion of stock option 150 None
04.2009 10 600,000 6,000,000 511,366 5,113,658 Conversion of stock option 200 None
07.2009 10 600,000 6,000,000 511,386 5,113,858 Conversion of stock option 200 None
08.2009 10 600,000 6,000,000 516,009 5,160,087 Capitalization by earnings 46,229 None Note 17
10.2009 10 600,000 6,000,000 516,134 5,161,337 Conversion of stock option 1,250 None
11.2010 10 600,000 6,000,000 501,634 5,016,337 Cancellation of Treasury Stock (145,000) None Note 18
08.2011 10 600,000 6,000,000 551,797 5,517,971 Capitalization by paid-in capital 501,634 None Note 19
01.2012 10 600,000 6,000,000 552,996 5,529,961 Conversion of stock option 11,990 None Note 20
04.2012 10 600,000 6,000,000 553,832 5,538,321 Conversion of stock option 8,360 None Note 21
10.2012 10 600,000 6,000,000 560,893 5,608,937 Conversion of stock option 70,616 None Note 22
01.2013 10 600,000 6,000,000 563,997 5,639,970 Conversion of stock option 31,033 None Note 23
05.2013 10 600,000 6,000,000 565,205 5,652,050 Conversion of stock option 12,080 None Note 24
08.2013 10 600,000 6,000,000 565,627 5,656,270 Conversion of stock option 4,220 None Note 25
10.2013 10 600,000 6,000,000 566,924 5,669,248 Conversion of stock option 12,978 None Note 26
02.2014 10 600,000 6,000,000 569,400 5,694,000 Conversion of stock option 24,752 None Not e27
05.2014 10 600,000 6,000,000 571,451 5,714,511 Conversion of stock option 20,511 None Note 28
07.2014 10 600,000 6,000,000 571,762 5,717,621 Conversion of stock option 3,110 None Note 29
09.2014 10 800,000 8,000,000 628,702 6,287,021 Capitalization by earnings 569,400 None Note 30
11.2014 10 800,000 8,000,000 630,103 6,301,031 Conversion of stock option 14,010 None Note 31
02.2015 10 800,000 8,000,000 631,209 6,312,091 Conversion of stock option 11,060 None Note 32
04.2015 10 800,000 8,000,000 631,518 6,315,186 Conversion of stock option 3,095 None Note 33
06.2015 10 800,000 8,000,000 631,853 6,318,531 Conversion of stock option 3,345 None Note 34
10.2016 10 800,000 8,000,000 632,609 6,326,091 Conversion of stock option 756 None Note 35
01.2017 10 800,000 8,000,000 633,074 6,330,741 Conversion of stock option 465 None Note 36
04.2017 10 800,000 8,000,000 633,254 6,332,541 Conversion of stock option 180 None Note 37
07.2017 10 800,000 8,000,000 696,611 6,966,115 Capitalization by earnings 63,357 None Note 38
11.2017 10 800,000 8,000,000 697,032 6,970,325 Conversion of stock option 421 None Note 39
03.2018 10 800,000 8,000,000 697,282 6,972,825 Conversion of stock option 250 None Note 4005.2018 10 800,000 8,000,000 697,457 6,974,575 Conversion of stock option 175 None Note 41
68

08.2018 10 800,000 8,000,000 697,544 6,975,445 Conversion of stock option 87 None Note 4211.2018 10 800,000 8,000,000 698,227 6,982,275 Conversion of stock option 683 None Note 4303.2019 10 800,000 8,000,000 698,695 6,986,955 Conversion of stock option 468 None Note 44
Note 1: (86) Tai.Chai.Chen (I) No. 42710 Letter dated May 28, 1997
Note 2: (87) Tai.Chai.Chen (I) No. 47165 Letter dated May 29, 1998
Note 3: (88) Tai.Chai.Chen (I) No. 44698 Letter dated May 17, 1999
Note 4: (89) Tai.Chai.Chen (I)) No. 42068 Letter dated May 16, 2000
Note 5: (90) Tai.Chai.Chen (I) No. 131759 Letter dated May 22, 2001
Note 6: Tai.Chai.Chen.I.Tzi No. 0910131630 Letter dated June 11, 2002
Note 7: Tai.Chai.Chen.I.Tzi No. 0920111609 Letter dated April 16, 2003
Note 8: Tai.Chai.Chen.I.Tzi No. 0920128945 Letter dated June 30, 2003
Note 9: Issued new stock shares to exchange for the common stock shares of AXIOMTEK.
Note 10: Tai.Chai.Chen.I.Tzi No. 0930126256 Letter dated June 14, 2004
Note 11: FSC.S.I.Tzi No. 0940124309 Letter dated June 17, 2005
Note 12: FSC.S.I.Tzi No. 0940006036 Letter dated December 22, 2005
Note 13: FSC.S.I.Tzi No. 0950130113 Letter dated July 12, 2006
Note 14: FSC.S.I.Tzi No. 0960035881 Letter dated July 13, 2007
Note 15: MOEA.So.Sun.Tzi No. 09701161800 Letter dated July 4, 2008
Note 16: FSC.S.I.Tzi No. 0970034562 Letter dated July 10, 2008
Note 17: FSC.S.Far.Tzi No. 0980027007 Letter dated June 3, 2009
Note 18: MOEA.So.Sun.Tzi No. 09901265490 Letter dated November 26, 2010
Note 19: MOEA.So.Sun.Tzi No. 10001174140 Letter dated August 1, 2011
Note 20: MOEA.So.Sun.Tzi No. 10101008150 Letter dated January 13, 2012
Note 21: MOEA.So.Sun.Tzi No. 10101074290 Letter dated April 27, 2012
Note 22: MOEA.So.Sun.Tzi No. 10101215000 Letter dated October 17, 2012
Note 23: MOEA.So.Sun.Tzi No. 10201009210 Letter dated January 15, 2013
Note 24: MOEA.So.Sun.Tzi No. 10201077320 Letter dated May 1, 2013
Note 25: MOEA.So.Sun.Tzi No. 10201153720 Letter dated August 1, 2013
Note 26: MOEA.So.Sun.Tzi No. 10201219700 Letter dated October 29, 2013
Note 27: MOEA.So.Sun.Tzi No. 10301021080 Letter dated February 11, 2014
Note 28: MOEA.So.Sun.Tzi No. 10301077560 Letter dated May 1, 2014
Note 29: MOEA.So.Sun.Tzi No. 10301150080 Letter dated July 28, 2014
Note 30: MOEA.So.Sun.Tzi No. 10301198730 Letter dated September 23, 2014
Note 31: MOEA.So.Sun.Tzi No. 10301225080 Letter dated November 3, 2014
Note 32: MOEA.So.Sun.Tzi No. 10401013670 Letter dated February 4, 2015
Note 33: MOEA.So.Sun.Tzi No. 10401076830 Letter dated April 27, 2015
Note 34: MOEA.So.Sun.Tzi No. 10401159550 Letter dated July 29, 2015
Note 35: MOEA.So.Sun.Tzi No. 10501245810 Letter dated October 18, 2016
Note 36: MOEA.So.Sun.Tzi No. 10601005570 Letter dated January 16, 2017
Note 37: MOEA.So.Sun.Tzi No. 10601046990 Letter dated April 12, 2017
Note 38: MOEA.So.Sun.Tzi No. 10601104750 Letter dated Julyl 21, 2017
Note 39: MOEA.So.Sun.Tzi No. 10601155330 Letter dated November 15, 2017
Note 40: MOEA.So.Sun.Tzi No. 10701027200 Letter dated March 22, 2018
Note 41: MOEA.So.Sun.Tzi No. 10701051810 Letter dated May 22, 2018
Note 42: MOEA.So.Sun.Tzi No. 10701100250 Letter dated August 23, 2018
Note 43: MOEA.So.Sun.Tzi No. 10701140180 Letter dated November 21, 2018
Note 44: MOEA.So.Sun.Tzi No. 10801031320 Letter dated March 28, 2019
Share Type Authorized capital
Remarks Issued Shares Un-issued shares Total
Order common
stock
699,075,510 100,924,490 800,000,000 Authorized capital stock, of which, 50,000thousand shares are reserved for exercising stock options.
Note: It is the number of shares of the listed stock as of March 30, 2019.
Information of shelf registration: NA
69

4.1.2 Shareholder structure:
March 30, 2019 (Ex-transfer date) Structure of
Shareholder
QTY
Government
institutions
Financial
institutions
Other juristic
person Natural person
Foreign institution &
foreigners Total
Number of persons 1 87 70 8,938 772 9,868
Shareholding 8 16,577,799 331,804,144 75,145,234 275,548,325 699,075,510
Shareholding ratio 0 2.37% 47.46% 10.75% 39.42% 100%
4.1.3 Status of Ownership Dispersion: NT$10 Par
March 30, 2019 (Ex-transfer date)
Shareholding class Number of shareholders
Shareholding Shareholding ratio
1 ~ 999 5,284 943,028 0.13%
1,000 ~ 5,000 3,048 5,956,959 0.85%
5,001 ~ 10,000 478 3,459,030 0.49%
10,001 ~ 15,000 176 2,152,506 0.31%
15,001 ~ 20,000 113 1,993,453 0.29%
20,001 ~ 30,000 145 3,578,978 0.51%
30,001 ~ 40,000 77 2,691,101 0.38%
40,001 ~ 50,000 48 2,175,634 0.31%
50,001 ~ 100,000 147 10,452,508 1.50%
100,001 ~ 200,000 122 17,405,340 2.49%
200,001 ~ 400,000 76 21,852,615 3.13%
400,001 ~ 600,000 44 22,099,665 3.16%
600,001 ~ 800,000 17 11,830,429 1.69%
800,001 ~ 1,000,000 19 17,452,326 2.50%
1,000,001 or over 74 575,031,938 82.26%
Total 9,868 699,075,510 100%
Note: The Company does not have preferred stock shares issued.
70

4.1.4 List of major shareholders: March 30, 2019 (Ex-transfer date) Unit: Shares
Shares
Name of major shareholders
Shareholding
Shareholding ratio
ASUSTEK COMPUTER Inc 100,628,870 14.40%
K and M Investment Co., Ltd. 83,073,163 11.89%
AIDC Investment Co., Ltd. 82,097,182 11.75%
K.C. Liu 25,620,886 3.67%
HSBC commissioned to manage Yuan-Wang Partner Fund Limited Partnership account
24,599,359 3.52%
Tran-Fei Development Co., Ltd. 20,324,916 2.91%
Advantech Foundation 20,288,715 2.90%
Yong-Shun Zhuang 15,921,725 2.28%
HSBC (Taiwan) Commercial Bank Co., Ltd Trustee Account
10,859,812 1.55%
Hermes Investment Funds plc on behalf of Hermes Global Emerging Markets Fund
8,902,919 1.27%
4.1.5 Market price, net worth, earnings, and dividends of per share within 2 years:
Unit: NT$ Year Item
2017 2018 As of March 31, 2019
Market price per
share
Max. 273.5 239 262
Min. 197 186.5 210
Average 232.09 211.99 236.37
Net worth per share
Before distribution 39.56 41.94 44.74
After distribution 32.96 (註四) -
Earnings per share
Weighted average shares 696,802,088 697,744,259 698,743,843
Earnings per share
Before adjustment
8.84 2.31(註五) 1.95(註五)
After adjustment 8.84 (註四) -
Dividend per share
Cash dividend 6.6 6.8 -
Stock dividend
Stock Dividend from Retained earnings
1.0 - -
Stock Dividend from additional paid-in capital
- - -
Cumulative un-paid dividend - - -
Return on investment
analysis
Price / Earnings Ratio (Note 1) 26.25 23.50 - Price / Dividend Ratio (Note 2) 35.17 31.18 - Cash Dividend Yield Rate (Note 3)
2.84 3.21 -
Note 1: Price-Earning (PE) ratio = Annual average closing price per share / Earnings per share Note 2: Price-Dividend ratio = Annual average closing price per share / Cash dividend per share Note 3: Cash Dividend Yield = Cash dividend per share / Annual average closing price per share Note 4: The proposal for the 2018 earnings distribution has not yet been resolved in the shareholders’ meeting. Note 5: The audited financial data as of 2019Q1 are presented.
4.1.6 Dividend Policy and Execution Status: A. Advantech’s existing rules concerning dividend policy are as follows:
71
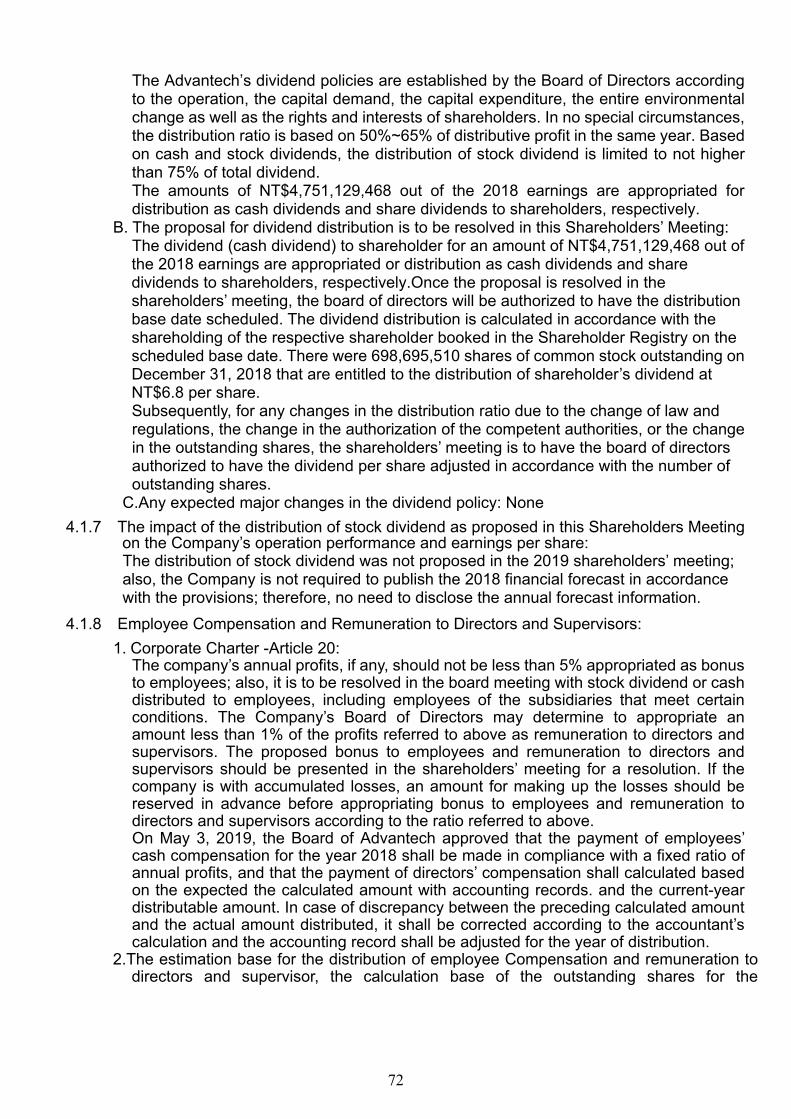
The Advantech’s dividend policies are established by the Board of Directors according to the operation, the capital demand, the capital expenditure, the entire environmental change as well as the rights and interests of shareholders. In no special circumstances, the distribution ratio is based on 50%~65% of distributive profit in the same year. Based on cash and stock dividends, the distribution of stock dividend is limited to not higher than 75% of total dividend. The amounts of NT$4,751,129,468 out of the 2018 earnings are appropriated for distribution as cash dividends and share dividends to shareholders, respectively.
B. The proposal for dividend distribution is to be resolved in this Shareholders’ Meeting: The dividend (cash dividend) to shareholder for an amount of NT$4,751,129,468 out of the 2018 earnings are appropriated or distribution as cash dividends and share dividends to shareholders, respectively.Once the proposal is resolved in the shareholders’ meeting, the board of directors will be authorized to have the distribution base date scheduled. The dividend distribution is calculated in accordance with the shareholding of the respective shareholder booked in the Shareholder Registry on the scheduled base date. There were 698,695,510 shares of common stock outstanding on December 31, 2018 that are entitled to the distribution of shareholder’s dividend at NT$6.8 per share. Subsequently, for any changes in the distribution ratio due to the change of law and regulations, the change in the authorization of the competent authorities, or the change in the outstanding shares, the shareholders’ meeting is to have the board of directors authorized to have the dividend per share adjusted in accordance with the number of outstanding shares.
C.Any expected major changes in the dividend policy: None
4.1.7 The impact of the distribution of stock dividend as proposed in this Shareholders Meeting on the Company’s operation performance and earnings per share: The distribution of stock dividend was not proposed in the 2019 shareholders’ meeting; also, the Company is not required to publish the 2018 financial forecast in accordance with the provisions; therefore, no need to disclose the annual forecast information.
4.1.8 Employee Compensation and Remuneration to Directors and Supervisors:
1. Corporate Charter -Article 20: The company’s annual profits, if any, should not be less than 5% appropriated as bonus to employees; also, it is to be resolved in the board meeting with stock dividend or cash distributed to employees, including employees of the subsidiaries that meet certain conditions. The Company’s Board of Directors may determine to appropriate an amount less than 1% of the profits referred to above as remuneration to directors and supervisors. The proposed bonus to employees and remuneration to directors and supervisors should be presented in the shareholders’ meeting for a resolution. If the company is with accumulated losses, an amount for making up the losses should be reserved in advance before appropriating bonus to employees and remuneration to directors and supervisors according to the ratio referred to above. On May 3, 2019, the Board of Advantech approved that the payment of employees’ cash compensation for the year 2018 shall be made in compliance with a fixed ratio of annual profits, and that the payment of directors’ compensation shall calculated based on the expected the calculated amount with accounting records. and the current-year distributable amount. In case of discrepancy between the preceding calculated amount and the actual amount distributed, it shall be corrected according to the accountant’s calculation and the accounting record shall be adjusted for the year of distribution.
2.The estimation base for the distribution of employee Compensation and remuneration to directors and supervisor, the calculation base of the outstanding shares for the
72

distribution of stock dividend,and the accounting process for the differences between the actual amount distributed and the estimated amount: For the earnings distribution resolved in the shareholders’ meeting, if the amount of the employee Compensation and remuneration to directors and supervisors is changed, the amount of difference should be handled in accordance with changes in accounting estimates and booked in the profit and loss of the following year without affecting the financial report that had already been acknowledged.
3.Information about the proposed distribution of employee bonus as approved by the Board of Director:
(1) On May 3, 2019, according to the revised charter based on the resolution, the company will disburse annual profit sharing: Employee bonuses:NT$452,355,000. Remuneration to directors and supervisors:NT$10,600,000. Payments will be made in cash. The above amounts accurately reflect 2018 expenses already accounted for.
(2) The ratio of the proposed distribution of employee stock dividend payments to the total amount of the net income and employee bonus on the proprietary or individual financial statements: NA
4. The distribution of the 2017 earnings as employee bonus and remuneration to directors and supervisors:
(1)The distribution of the annual employee bonus and remuneration to directors and supervisors is as follows: Employees Cash dividend: NT$273,000,000 Remuneration to directors and supervisors: NT$10,600,000
(2)If the amount referred to above differs from the employee bonus and remuneration to directors and supervisors recognized, please state the number of differences, causes of differences, and the treatment scenarios: None
4.1.9 Situations of the Company’s buy back stocks: None 4.2 Corporate bond:NA. 4.3 Preferred Stock issued: NA
4.4 Global depositary receipts issued: NA
4.4.1 Employee Stock Options issued The Company’s outstanding employee stock options and its impact on shareholders’ equity up to the publication of the annual report:
73

Types of employee stock option certificate 2014
Employ s tock op t ion2016
Employ s tock op t i on 2018
Employ s tock op t ion
The effective date of declaration July 29, 2014 June 17, 2016 June 14, 2018
Issuing date August 12, 2014 August 12, 2016 July 27, 2018
The number of units issued 5,000 units 6,500 units 8,000 units
Ratio of the number of shares available for subscription to the total number of shares issued
0.72% 0.93% 1.14%
Duration of subscription 8/12/2016 ~ 8/11/2020 8/12/2018 ~ 8/11/2022 7/27/2020 ~ 7/26/2024
Method of performance Issuance of new shares Issuance of new shares Issuance of new shares
Restrictive subscription period and ratio (%)
40% of the granted stock option certificate is exercisable after 2 years, 60% after 3 years, 80% after 4 years, and100% after 5 years
40% of the granted stock option certificate is exercisable after 2 years, 60% after 3 years, 80% after 4 years, and100% after 5 years
40% of the granted stock option certificate is exercisable after 2 years, 50% after 3 years, 100%
Number of shares subscribed 3,116,000 799,000 0
Amount of shares subscribed 81,718,400 68,394,400 0
Number of shares yet to be subscribed 1,884,000 5,701,000 8,000,000
Subscription price per share for the unsubscribed shares
81.5 85.6 202.5
Ratio of the unsubscribed shares to the total number of shares issued (%)
0.27% 0.82% 1.14%
Impact on shareholders’ equity
The granted employee stockoption certificates after 2years shall be exercised inaccordance with theconditioned subscriptionperiod and ratio; also, thenumber of shares to besubscribed is 0.72% of thenumber of shares issued,which will not have significant impact onshareholders’ equity.
The granted employee stock option certificates after 2 years shall be exercised in accordance with the conditioned subscription period and ratio; also, the number of shares to be subscribed is 0.93% of the number of shares issued, which will not have significant impact on shareholders’ equity.
The granted employee stock option certificates after 2 years shall be exercised in accordance with the conditioned subscription period and ratio; also, the number of shares to be subscribed is 1.14% of the number of shares issued, which will not have significant impact on shareholders’ equity.
74

4.4.2 Name of the managers with employee stock option certificates obtained, the top-10 employees with stock option certificates obtained, the respective acquisition and subscription:
March 30, 2019 Units: Except for stock subscription price in NTD, NT$ Thousand
Title Name
Number o f sha res
acqu i red
Rat io o f subsc r ibed shares to
to ta l number o f
sha res i ssued
Subscribed Unsubscribed
Number o f sha res
subsc r ibed
Pr ice o f sha res
subsc r ibed
Amount o f sha res
subsc r ibed
Ra t io o f subsc r ibed
shares to to ta l number o f
sha res i ssued
Number o f sha res
subsc r ibed
Pr ice o f sha res
subsc r ibed
Amount o f sha res
subsc r ibed
Ra t io o f subsc r ibed
shares to to ta l number o f
sha res i ssued
Ma
na
ge
me
nt
Executive Board Director
Chaney Ho 2014 employee stock option certificate
580,000 0.08 432,000 81.5 37,277 0.06 148,000 81.5 12,062 0.02
President Eric Chen
President Miller Chang
President Linda Tsai
Vice President
Deyu Yin
President Eric Chen 2016 employee stock option certificate
430,000 0.06 172,000 85.6 14,723 0.02 258,000 85.6 22,085 0.04 President Miller Chang President Linda Tsai
Vice President
Deyu Yin
President Eric Chen 2018 employee stock option certificate
1,400,000 0.20 - - - - 1,400,000 202.5 283,500 0.2 President Miller Chang
President Linda Tsai
Em
pl
oy
ee
s
Ttop-10 employee 2014 employee stock option certificate
325,000 0.05 204,000 81.5 18,151 0.03 121,000 81.5 9,861 0.02
Ttop-10 employee 2016 employee stock option certificate
250,000 0.04 67,000 85.6 5,735 0.01 183,000 85.6 15,665 0.03
Ttop-10 employee 2018 employee stock option certificate
1,450,000 0.21 - - - - 1,450,000 202.5 293,625 0.21
75

4.4.3 Restricted Employee Shares: NA 4.4.4 Issuance of new shares for the shares acquired or transferred from other companies: NA 4.4.5 Implementation of fund plan: NA
76

V. HIGHTLIGHTS OF OPERATIONS 5.1 Business Content
5.1.1 Business Scope
A. Major business operation of the Company: (1) The design, assembly, combination, production, and trade of computer testing equipment
and automated test systems; (2) The processing, manufacturing, and importing/exporting (except for the restricted items)
of computers, electronics, and electrical components and devices; (3) The design, contracting, installation, and maintenance of computers and electronic
control automation systems; (4) Computer software design; (5) Handling the agency, quotes, bidding, and sales of the products referred to above on
behalf of the domestic and foreign manufacturers; (6) The assembly, manufacturing, trade, and importing/exporting business of the wired and
wireless communications equipment;
B. Major products and business ratio of the Company: Unit: NT$ Thousand
Ratio Major product
2018 Sales Amount %
Embedded boards and Chassis 21,354,713 44 Industrial computer and industrial control 21,099,031 43 After-sales service and others 6,272,774 13
Total 48,726,518
100
C.The Company’s currently offered products: Embedded board and case, industrial computer,
and others. D. New product development plan of the Company:
(1) Wireless IoT Gateway (2) Protocol Conversion (3) AI Computing Platform (4) Deep Learning based AOI (Automated Optical Inspection) (5) WISE-PaaS/EnSaaS, a PaaS for cloud applications (6) Solution Ready Platforms for Industry 4.0 and Intelligent Factory (7) Solution Ready Platforms for Energy and Environment (8) Solution Ready Platforms for Intelligent Retail (9) Medical Video Encoder/Decoder
5.1.2 Industry Summary
A. Industry status and development In early stage, Industrial PC (IPC) was mainly applied on the manufacturing process, instrument and the control and monitoring, testing of machine & equipment. The form-factor was restricted to industrial automated board system and the main application is automation system. In past few years, due to the rise of integrated solution of communication, internet, software and optical technology, IPC started to penetrate into more application markets, including MRT reader, vending machine, ATM,
77

POS, monitcompspeciareachmarke
Source:
Howeveindustriainfrastructechnolostyle in specializecosysteto create
B. The s
The
game, noring sysuters. Thealized to “ed US$3.9et, IPC is a
HIS
r, benefitinal PC and cture in Io
ogy transitiocoming 1
zed charaem and fore 15~20%
supply cha
supply cha
etwork stostems ande overall intelligent”
9bn in 201a niche ma
ng from tembedded
oT ecosysteon, transfo0~15 yeacteristics rm-factor dCAGR in 1
ain in ups
ain of indu
orage (NAd environm
targeting ” specialize8 with 11%rket segme
he rise ofd system em. The m
orm the comrs. Howevand prefe
design. Acc10~15 yea
stream, mi
strial PC a
AS), Digitamental m
markets ed. Accord
% YoY growent with m
f intelligenis gradual
market conmpetition laver, each erence, whcording to rs.
dstream a
and embed
al Signagemonitoring
spread oding to IHSwth. Compore stable
nt system lly transfor
nsensus vieandscape end appli
hich will rIDC and G
and downs
dded system
e, smart systems,
out from S, the globpared with and mode
and interrmed to a ews that Ioand changcation maresult in a
Gartner, IoT
stream
ms
building aand lottoriginal “
bal IPC mPC and sm
erate growt
rnet of thikey elem
oT will domge human barket has a more-coT market is
automationtery ticket“industrial”
market sizemartphoneth.
ngs (IoT),ment of the
minate thebeing’s lifeits owned
omplicateds expected
n t ” e e
, e e e d d d
78

Simp“instcharGE aNokithirdand servlineaspec
ply speakinrumentatio
rt). The keyand etc. Thia, Alctel a layer is inGoogle. Tice to the e
ar supply ccialized ven
ng, IoT is fon”, “conney players inhe key playnd etc, wh
ntelligent cohey also cend custom
chain compndors.
formed by tectivity” ann the first layers in the ich are resomputing aooperate w
mers. As thpetition but
three layerd ‘intelligeayer- instru second la
sponsible toand the keywith softwahe result, tht more relie
rs of architnt computiumentation
ayer- conneo transcody players a
are vendorshe ecosystes on the c
tecture, incing” (pleasn- are Advaectivity- arede the dataare IBM, Ms to providtem of IoT
cooperation
cluding se refer to bantech, Dee AT& T, C
a up to the cMicrosoft, Ade data ana
is not the n between
below elta, ABB, Cisco, cloud. The
Amazon alytics traditional different
e
79

C. The i
Accordinpublishefigure bebeneficia(like smhappenesecond wmajor beWe mighmaturedGoogle, customemore pre
ndustry d
ng to the red by McKelow). The aries are Io
martphone ed in 2015wave will geneficiariesht see acc in 2040. TAmazon a
ers and useecise big d
evelopme
report “Theinsey in 2first wave oT device makers a
5-16 and get matures in 2nd waelerating gThe servicand Microsers due to
data analyt
ent
e Internet 015, therehappened makers, li
and smartwill accele
ed in 2025 ave are hagrowth sence providersoft. But t the new bics.
of Thingse are three in 2010 anke fablesst wearableerate the and entere
ardware anntiment in trs will be thhe biggestbusiness m
: Mapping e wave of nd will get s houses ae device growth seed into thend softwarethe 3rd wahe main bet value cre
model, the
the Valuegrowing stmatured in
and certainmakers).
entiment de third wavee integrateave startingeneficiarieeation will new techn
e beyond ttage of IoTn 2020 andn hardware
The secoduring 201ve of IoT gred solution g from 203
es, includincome from
nology ado
the Hype”,T (see thed the majore providersond wave9-20. Therowth. Theproviders.
30 and getg Alibaba,m the endoption and
e r s e e e . t , d d
80

AccordinUS$4.6 tretail, hemiscelladiversity
A pure hnot catcboundar
ng to IDC trillion in 2ealthcare aneous seg
y and comp
hardware pching the ry in differe
forecast, t018. By ap
and transpgment will plex of IoT
provider wIoT techn
ent layers.
the total repplication mortation wicreate USmarket.
ill face moology trenFor examp
evenues cmarkets, mill create th
S$1.8 trillio
ore severe nd and opple, GE is t
created by manufacturhe biggestn market v
price compportunity. the global b
the IoT eing, governt opportunivalue, whic
mpetition anIoT will n
biggest eng
ecosystem nment infraities. In adch is in lin
nd the cycnarrow thegine manu
will reachastructure,ddition, thene with the
clical risk ife industry
ufacturer in
h ,
e e
f y n
81

5
5
railway “Digitalizprovide will realizdownstrecooperat
5.1.3 Tech1. The
ann(1) (2)
2.SucThemaUSmaThepat
5.1.4 Lon
Short-
and aircrazation”. GEdifferentiatze IT compeam valuetion will be
nology ane R&D expnual reportTotal R&DTotal R&D
ccessfully de Compan
anpower inSA, Europearket develoe Compantents acqu
ng-term an
-term busi
aft market.E Predix notion and tapanies try ve chain. If ecome the
nd Researcpense incut:
D expense D expense
developed y values th product R, and Chinopment. y has moreired domes
nd short-te
iness deve
. They ideow is the mailor-madevery hard twe review“new norm
ch & Deveurred in the
amountedamounted
technologyhe importaR&D in Taia to accele
e than fourstically or i
erm busin
elopment
entify the most famoue service toto expand w the M&Amal” in the f
elopmente most rec
to NT$3,9 to NT$97
y or produnce of R&iwan, thereerate the p
r new prodinternation
ness deve
future grous industriao end custtheir businA activitiesfuture.
cent year a
997,313 in 3,440 in 20
ct D. In addite are also
product dev
ducts launcnally by the
lopment p
owing cataal data anatomers Fro
ness footprs in 2014-1
and up to t
2018; 019Q1;
ion to dediR&D team
velopment
ched in evee end of 20
plan
alyst will calytic platfoom below rints to ups16, the cr
the publica
icating mams designaspeed and
ery year an018.
come fromorm, whichfigure, we
stream andoss-sector
ation of the
ssive ated in thed grasp the
nd with 45
m h e d r
e
e e
82

Ensy
Pradopadpl
Stpa
Long-t
En
AdvdivR&Admevis
Es
ToinvintfeReto AdSRAdex
圖說
Loca
In a
nhance tystematicrovide lodvantageperation dd new oan in Untrengthenartnershi
term busi
nhance t
vantech wersity requ
&D centervantech
ega campsion of sm
stablish
o catching vested in stegration aw successeady Platfo provide advantech RPs at Addvantech txpand our
說:WISE-PaaS
ooking foapability
addition to
he industc risk fromcalized a with peesites in Eperating ited Statn certaip.
ness deve
the adva
will keep inuest from rs in Taiwconsolida
pus in Linmart man
the WIS
up the 2nsoftware pland platforsful user orm). In 20a more resuccessfu
dvantech Iotargets to aglobal pres
Sharing Platform
or investand mark
cooperate
try diversm single and tailorers. In paEurope an
sites in Ies. n mark
elopment
ntage in
vesting in IoT speci
wan, Chinate all thkou Taiwufacturin
E-PaaS S
nd wave oflatform sinrm architeccases in
017, WISE eliable andlly commeoT Summitachieve 10sence in in
m
ment andket share
e with exter
sity and gindustry -made se
ast few yend emergIsrael an
et insig
R&D an
R&D to pialized cus
na, Germae producan start ing.
Software
f IoT grownce 2015.Incture deveEIS(Edge PaaS tran
d speedy iercialized t in Suzho000 activendustrial so
d M&A o
rnal partne
global saand coun
ervice to ears, Advging markd Turkey
ght to
d manuf
provide diffstomer. Gany and t ion sitesng from O
e Platform
wing opportn 2015, WIlopment. IIntelligenc
nsformed thintelligent WISE-Paa
ou in China WISE-Pa
oftware pla
opportun
ers, Advant
ales netwntry scale up
vantech hkets. In 2 and also
increase
acturing
ferentiatediven thisUnited Sts in northOctober 2
m
tunity, AdvSE PaaS fn 2016, Wce Server)he overall scomputing
aS and offa in NovemaS VIP me
atform spac
ity to en
tech is agg
ork to re
the leadhad expa2019, the o has exp
e the c
g
d service tos, Advantates. In
hern Taiw2016 to re
vantech agfocused on
WISE PaaS) and SRservice to g platformfficially laumber. In 2embers gloce.
nhance te
gressively
duce the
ding nded ourfirm wil l
pansion
customer
o fulfill thetech hasaddit ion,an to the
ealize the
ggressivelyn resource
S identifiedP(Solutioncloud side. In 2018,
unched 342019-2021,obally and
chnology
looking for
r
r
e s , e e
y e d n e
4 ,
d
y
r
83

M&A opportunities to enhance the capability in technology and software and to accelerate the development in IoT vertical market ecosystem. In 2016, Advantech successfully acquired B+B SmartWorx into the group. In January 2017, Advantech announced to invest Kostec, a healthcare monitor provider. In October 2017,Advantech invested 18% stake of Winmate Communication Inc.(3416.TW) through private placement to expand the scope of IoT All ied Platform Service Alliance.
Furthermore, Advantech is cooperating with young talents through University Collaboration. The long term is to facil i tate the IoT supply chain in Taiwan.
5.2.1 Market, Production, and Sales Review A. Market Analysis
1. Main product and main market: Unit: NT$ Thousand
Area 2018 Asia (including Taiwan) 23,615,672
America 14,211,217
Europe 8,485,831
Other 2,413,798
Total 48,726,518
2. The market share and competition landscape Embedded board and industrial PC market will benefit from the
rising new application market demand Advantech has multiple selling channels. The firm produces and markets the embedded board and industrial PC products through distributors, machine/equipment markers, system integrators, which consolidate all the elements and device with value-added development and then sell to end users, like manufacturers, public transportation system, airports and any fields which require computing capability to enhance the information collection and operating efficiency.
Given the variety of form factor, wide-spread application markets, and ASP difference, the total market size of embedded board/systems is very difficult to estimate, especially when all the embedded boards are equipped into any type of machine, equipment, and systems. In addition, the M&A makes the market share number is even more difficult to be precise, given limited disclosure after consolidation. For example, B&R Automation (peer in Europe) was acquired by ABB in 2017; Kontron (peer in Europe) was acquired by Ennoconn in 2017 as well. Radisys (peer in US) was acquired by Reliance and delisted in 2018.
84

In facapplicdigit commhospittotal ecity spput int
T
Accor2013-markewith 1shareAdvan
ct, the growcation markYoY grow
munication tal and othembeddedpending wito the calc
The market
rding to IH-2022. In et share; T16% marke. Based ntech had
wth opportukets, out ofwth), than
infrastrucher smart board andill reach US
culation of t
t share for
S report, t2017, the
The 2nd laret share; aon IHS e34% mark
Pict
Picture:Adv
unity for emf traditionanks to thcture deplcity applicd industriaS$200bn btraditional
traditional
the global major ap
rgest applicand the 3rdestimation ket share in
ture:Applicat
vantech has m
mbedded bal industrialhe develoloyment. cations wilal PC sectoby 2020. Hembedded
industrial
industrial pplication cation mard applicatio
ofUS$3.9n 2017.
tion for Indust
multiple selling
board and l applicatiopment of For examl drive theors. Accorowever, th
d board an
PC
PC markemarket warket was traon market 9bn globa
trial PC, IHS 2
channels
industrial Pon (, which
computinmple, retail
bigger grding to Ar
hose new ad industria
et generateas industriansportatiowas medicl industria
2017, US$ mn
PC will reponly gene
ng technol, logistic,rowth catarup, the gloapplicational PC surve
ed 4% CAGial sector on and infrcal with 10al PC ma
ply on newrate single
ology and building,lyst of theobal smarts have notey.
GR duringwith 51%
rastructure0% marketarket size,
w e d
e t t
g % e t ,
85

Th
Due tothere industverticain a cbasedwill im
SinceelectrICs/CHoweutilizinstill imour pr
AdvanHowetraditisharebusinepenetsoftwa
he suppl
o the naturis no overtrial cycle aal market. conservativd companie
mpact nega
2017, givic componhipsets an
ever, Advanng productmpacted nerofitability t
ntech is pever the ovonal mothe due to theess, the trated into are capabi
y deman
re of highlyr-supply sitand busineThe risk w
ve attitudees are exp
atively to th
ven the risnents has snd PCB, ntech sustt mix and imegatively tothrough co
positioned verall markerboard mae stability future gronew appliclity, and ex
nd condit
y tailor-matuation in iess sentimwill come fe of enterpport-drivenhe profitabi
sing demasupply showhich lea
tained the mproving po the margontinuing op
well in thket growth akers are aembeddedowth potecation markxpect IoT m
Picture:A
tion and
ade form fandustrial P
ment is highfrom the mprise capen business ility.
and in elecrtage with
ad a margoperating
productionin profile. perating ef
he industri is relativeaggressived market nential is lket and IoTmight provi
Advantech has
product
actor and dPC and emhly related
macroeconox planningmodel. Th
ctric vehiclrising selli
gin pressumargin ab efficiencyIn long runfficiency im
ial PC ane milder inely to take ature. If Aimited as T industry side new gr
34% market sha
t compet
diversity cumbedded sy
to enterpriomic dynamg. In addithe big exc
le and crying price, i
ure to Advbove 15% . In 2018, t
n, Advantecmprovemen
d embeddthe future
the low-endvantech o
well. Thsince 2010owth catal
are in 2017, upo
tition
ustomer reqystem. Hoise capex mic, whichion, most change rat
yptocurrencncluding flvantech’s in 2017, othe compoch intendsnt.
ded systeme. At the snd embeddonly eyes
herefore, A0, keeping yst in the f
on IHS estimate
quirement,wever, thein different
h will resultof Taiwan
te volatility
cy, certainash, SSD,operation.
on back ofonent price to sustain
m market.same time,ded marketon currentAdvantechenhancingfuture.
e
, e t t n y
n , . f
e n
. , t t
h g
86

The Company’s other products awarded in recent
Year Awards
2018 ⋅ 26th Symbol of Taiwan Excellence Silver Medal Winner for the iPS-M100 Hot Swappable Medical-grade Industrial
Power System ⋅ 26th Symbol of Taiwan Excellence Silver Medal Winner for the POC-WP243 24” Medical Computer ⋅ 26th Symbol of Taiwan Excellence Winner for the CRV31-430WP 43” Industrial Curved Monitor ⋅ 26th Symbol of Taiwan Excellence Winner for the TPC-5000 series Modular Industrial Touch Panel Computer ⋅ 26th Symbol of Taiwan Excellence Winner for the SRP-ESP315 Solar Power Management Solution
2017 Advantech receives "Taiwan Top 6 Global Brands" award from the Bureau of Foreign Trade Advantech named Asia no.36 and Taiwan no.5 in Nikkei’s Asia 300 list Advantech Wins “ROI Industry 4.0 Award China” for Its Digital Factory The 25th Symbol of Excellence Winner for high performance 4U server system DMS-SA21, the MOEA, Taiwan, ROC
with the right to use the Symbol of Excellence lawfully.
The 25th Symbol of Excellence Winner for fanless railway panel PC ARS-P3800 , the MOEA, Taiwan, ROC with the right to use the Symbol of Excellence lawfully.
The 25th Symbol of Excellence Winner for 8” multi-functional handheld POS system AIM-65 , the MOEA, Taiwan, ROC with the right to use the Symbol of Excellence lawfully.
The 25th Symbol of Excellence Winner for pocket-size smart factory edge gateway UNO-2271G, the MOEA, Taiwan, ROC with the right to use the Symbol of Excellence lawfully.
The 25th Symbol of Excellence Winner for 21.5" industrial multi-touch panel PC stainless steel chassis IPPC-5211WS, the MOEA, Taiwan, ROC with the right to use the Symbol of Excellence lawfully.
The 25th Symbol of Excellence Winner for 10.1” healthcare/hospitality infortainment terminal HIT-W101C, the MOEA, Taiwan, ROC with the right to use the Symbol of Excellence lawfully.
The 25th Symbol of Excellence Winner for embedded Qseven board SOM-3568, the MOEA, Taiwan, ROC with the right to use the Symbol of Excellence lawfully.
The 25th Symbol of Excellence Winner for rolling stock fanless system ARK-2231R/ ARK-2230R, the MOEA, Taiwan, ROC with the right to use the Symbol of Excellence lawfully.
The 25th Symbol of Excellence Winner for modular fanless box PC ARK-1124H / ARK-1124U /ARK-1124C, the MOEA, Taiwan, ROC with the right to use the Symbol of Excellence lawfully.
The 25th Symbol of Excellence Winner for power automation computers ECU-4784, the MOEA, Taiwan, ROC with the right to use the Symbol of Excellence lawfully.
The 25th Symbol of Excellence Winner for palm Size vision system AIIS-1200, the MOEA, Taiwan, ROC with the right to use the Symbol of Excellence lawfully.
The 25th Symbol of Excellence Winner for fanless vision system AIIS-5410P, the MOEA, Taiwan, ROC with the right to use the Symbol of Excellence lawfully.
The 25th Symbol of Excellence Winner for compact fanless system MIC-7500, the MOEA, Taiwan, ROC with the right to use the Symbol of Excellence lawfully.
The 25th Symbol of Excellence Winner for video wall signage player DS-980, the MOEA, Taiwan, ROC with the right to use the Symbol of Excellence lawfully.
The 25th Symbol of Excellence Winner for thin barebone system EPC-T2285, the MOEA, Taiwan, ROC with the right to use the Symbol of Excellence lawfully.
The 25th Symbol of Excellence Winner for embedded motion controller MVP-3245, the MOEA, Taiwan, ROC with the right to use the Symbol of Excellence lawfully.
The 25th Symbol of Excellence Winner for intelligent remote terminal unit ADAM-3600/ ADAM-3617/ ADAM-3618/ ADAM-3624/ ADAM-3651/ ADAM-3656, the MOEA, Taiwan, ROC with the right to use the Symbol of Excellence lawfully.
The 25th Symbol of Excellence Winner for managed redundant industrial ethernet switches EKI-7700 Series, the MOEA, Taiwan, ROC with the right to use the Symbol of Excellence lawfully.
The 25th Symbol of Excellence Winner for Advantech WebAccess/Cloud , the MOEA, Taiwan, ROC with the right to use the Symbol of Excellence lawfully.
The 25th Symbol of Excellence Winner for WISE-DK1520 starter kit , the MOEA, Taiwan, ROC with the right to use the Symbol of Excellence lawfully.
The 25th Symbol of Excellence Winner for development kit for RTX v2.0 CPU Module ROM-3420 , the MOEA, Taiwan, ROC with the right to use the Symbol of Excellence lawfully.
87

2016 TREK-773 rewarded the 24th Taiwan Excellence Gold and Silver Awards from Ministry of Economic Affairs, R.O.C. to
enjoy the official authorization from the symbol of Taiwan Excellence.
PWS-870 rewarded 2016 iF Product Design Award. 1U High-efficiency Server rewarded the 24th Taiwan Excellence Gold and Silver Awards from Ministry of Economic
Affairs, R.O.C. to enjoy the official authorization from the symbol of Taiwan Excellence. 24” Medical Computer rewarded the 24th Taiwan Excellence Gold and Silver Awards from Ministry of Economic
Affairs, R.O.C. to enjoy the official authorization from the symbol of Taiwan Excellence. 7” High-efficiency Integrated Vehicle-mount Terminal – Light Vehicle Management rewarded the 24th Taiwan
Excellence Gold and Silver Awards from Ministry of Economic Affairs, R.O.C. to enjoy the official authorization from the symbol of Taiwan Excellence.
7” Ultra-slim Vehicle-mount Tablet Computer rewarded the 24th Taiwan Excellence Gold and Silver Awards from Ministry of Economic Affairs, R.O.C. to enjoy the official authorization from the symbol of Taiwan Excellence.
DPX-E135 Embedded Gambling System rewarded the 24th Taiwan Excellence Gold and Silver Awards from Ministry of Economic Affairs, R.O.C. to enjoy the official authorization from the symbol of Taiwan Excellence.
Pico-ITX 2.5” Micro Embedded Computer rewarded the 24th Taiwan Excellence Gold and Silver Awards from Ministry of Economic Affairs, R.O.C. to enjoy the official authorization from the symbol of Taiwan Excellence.
ProView Ethernet Exchange rewarded the 24th Taiwan Excellence Gold and Silver Awards from Ministry of Economic Affairs, R.O.C. to enjoy the official authorization from the symbol of Taiwan Excellence.
SOM-7568 Fan-free Embedded Micro COM Expres Computer rewarded the 24th Taiwan Excellence Gold and Silver Awards from Ministry of Full-flat Compact Industrial Touch Computer rewarded the 24th Taiwan Excellence Gold and Silver Awards from Ministry of Economic Affairs, R.O.C. to enjoy the official authorization from the symbol of Taiwan Excellence.
Economic Affairs, R.O.C. to enjoy the official authorization from the symbol of Taiwan Excellence. Internet of Things Wireless Data Retrieval Module rewarded the 24th Taiwan Excellence Gold and Silver Awards
from Ministry of Economic Affairs, R.O.C. to enjoy the official authorization from the symbol of Taiwan Excellence. Wireless Internet of Things Gateway rewarded the 24th Taiwan Excellence Gold and Silver Awards from Ministry of
Economic Affairs, R.O.C. to enjoy the official authorization from the symbol of Taiwan Excellence. High-efficiency Computer Control System for Train Car rewarded the 24th Taiwan Excellence Gold and Silver Awards
from Ministry of Economic Affairs, R.O.C. to enjoy the official authorization from the symbol of Taiwan Excellence. Fan-free Industrial Computer for Control Cabinet rewarded the 24th Taiwan Excellence Gold and Silver Awards from
Ministry of Economic Affairs, R.O.C. to enjoy the official authorization from the symbol of Taiwan Excellence. Third-generation 7” Aluminum Vehicle-mount Terminal – Heavy Vehicle Management rewarded the 24th Taiwan
Excellence Gold and Silver Awards from Ministry of Economic Affairs, R.O.C. to enjoy the official authorization from the symbol of Taiwan Excellence.
Fan-free Wayside Control Platform rewarded the 24th Taiwan Excellence Gold and Silver Awards from Ministry of Economic Affairs, R.O.C. to enjoy the official authorization from the symbol of Taiwan Excellence.
Mobile Multimedia Computing Module rewarded the 24th Taiwan Excellence Gold and Silver Awards from Ministry of Economic Affairs, R.O.C. to enjoy the official authorization from the symbol of Taiwan Excellence.
Ultra-slim Open-framed LED Touch Display rewarded the 24th Taiwan Excellence Gold and Silver Awards from Ministry of Economic Affairs, R.O.C. to enjoy the official authorization from the symbol of Taiwan Excellence.
Ultra-slim Mini-ITX rewarded the 24th Taiwan Excellence Gold and Silver Awards from Ministry of Economic Affairs, R.O.C. to enjoy the official authorization from the symbol of Taiwan Excellence.
Ultra-HD OPS Multimedia Player rewarded the 24th Taiwan Excellence Gold and Silver Awards from Ministry of Economic Affairs, R.O.C. to enjoy the official authorization from the symbol of Taiwan Excellence
Modular Industrial Control Platform rewarded the 24th Taiwan Excellence Gold and Silver Awards from Ministry of Economic Affairs, R.O.C. to enjoy the official authorization from the symbol of Taiwan Excellence.
Modular Embedded Intelligent System rewarded the 24th Taiwan Excellence Gold and Silver Awards from Ministry of Economic Affairs, R.O.C. to enjoy the official authorization from the symbol of Taiwan Excellence.
Aluminum Rail Industrial Computer rewarded the 24th Taiwan Excellence Gold and Silver Awards from Ministry of Economic Affairs, R.O.C. to enjoy the official authorization from the symbol of Taiwan Excellence.
Medical Intelligent Battery System rewarded the 24th Taiwan Excellence Gold and Silver Awards from Ministry of Economic Affairs, R.O.C. to enjoy the official authorization from the symbol of Taiwan Excellence
2015 The 23rd Symbol of Excellence Gold Medal and Silver Medal Winner for 7” medical and industrial-grade handheld
tablet computer, the MOEA, Taiwan, ROC with the right to use the Symbol of Excellence lawfully.
The 23rd Symbol of Excellence Winner for ATCA 100GbE advanced communications server, the MOEA, Taiwan, ROC with the right to use the Symbol of Excellence lawfully.
The 23rd Symbol of Excellence Winner for EKI Spec. Ethernet network switches, the MOEA, Taiwan, ROC with the right to use the Symbol of Excellence lawfully.
The 23rd Symbol of Excellence Winner for Open-type network structure HMI/SCADA software, the MOEA, Taiwan, ROC with the right to use the Symbol of Excellence lawfully.
88

2015 The 23rd Symbol of Excellence Winner for Ultra-low-power consumption simple embedded IoT system, the MOEA,
Taiwan, ROC with the right to use the Symbol of Excellence lawfully.
The 23rd Symbol of Excellence Winner for industrial-grade tablet computer, the MOEA, Taiwan, ROC with the right to use the Symbol of Excellence lawfully.
The 23rd Symbol of Excellence Winner for Fanless & Wide-range temperature Embedded System, the MOEA, Taiwan, ROC with the right to use the Symbol of Excellence lawfully.
The 23rd Symbol of Excellence Winner for Embedded Gambling System, the MOEA, Taiwan, ROC with the right to use the Symbol of Excellence lawfully.
The 23rd Symbol of Excellence Winner for High-performance smart embedded computer module, the MOEA, Taiwan, ROC with the right to use the Symbol of Excellence lawfully.
The 23rd Symbol of Excellence Winner for SoC wide-range temperature embedded applied computer modules, the MOEA, Taiwan, ROC with the right to use the Symbol of Excellence lawfully.
The 23rd Symbol of Excellence Winner for 4K2K four-display high-performance smart digital signage player, the MOEA, Taiwan, ROC with the right to use the Symbol of Excellence lawfully.
The 23rd Symbol of Excellence Winner for 21.5” Thin open-type frame LED backlit touch screen, the MOEA, Taiwan, ROC with the right to use the Symbol of Excellence lawfully.
The 23rd Symbol of Excellence Winner for Integrated on-board computer, the MOEA, Taiwan, ROC with the right to use the Symbol of Excellence lawfully.
The 23rd Symbol of Excellence Winner for high-performance broad application robust Tablet PC, the MOEA, Taiwan, ROC with the right to use the Symbol of Excellence lawfully.
The 23rd Symbol of Excellence Winner for multi-function data collection card series, the MOEA, Taiwan, ROC with the right to use the Symbol of Excellence lawfully.
The 23rd Symbol of Excellence Winner for robust Industrial Computers, the MOEA, Taiwan, ROC with the right to use the Symbol of Excellence lawfully.
The 23rd Symbol of Excellence Winner for 7” medical handheld tablet computer, the MOEA, Taiwan, ROC with the right to use the Symbol of Excellence lawfully.
The 23rd Symbol of Excellence Winner for on-board monitoring Embedded fanless smart system, the MOEA, Taiwan, ROC with the right to use the Symbol of Excellence lawfully.
2014 Awarded with the “2014 Taiwan Top 10 Global Brands” Award.
Advantech received the CSR Best Workplace Excellent Award from Global Views Monthly in 2014.
The 22nd Symbol of Excellence Winner for High-performance network security equipment, the MOEA, Taiwan, ROC with the right to use the Symbol of Excellence lawfully.
The 22nd Symbol of Excellence Winner for ATCA 40GbE advanced communications motherboard, the MOEA, Taiwan, ROC with the right to use the Symbol of Excellence lawfully.
The 22nd Symbol of Excellence Winner for Advantech WebAccess-open network structure HMI / SCADA software, the MOEA, Taiwan, ROC with the right to use the Symbol of Excellence lawfully.
The 22nd Symbol of Excellence Winner for Programmable Automation Controllers, the MOEA, Taiwan, ROC with the right to use the Symbol of Excellence lawfully.
The 22nd Symbol of Excellence Winner for Superthin and bright industrial LCD panel, the MOEA, Taiwan, ROC with the right to use the Symbol of Excellence lawfully.
The 22nd Symbol of Excellence Winner for Industrial-grade multi-touch points man-machine interface, the MOEA, Taiwan, ROC with the right to use the Symbol of Excellence lawfully.
The 22nd Symbol of Excellence Winner for Industrial-grade wide-screen tablet displays, the MOEA, Taiwan, ROC with the right to use the Symbol of Excellence lawfully.
The 22nd Symbol of Excellence Winner for Smart remote Ethernet network data collection modules, the MOEA, Taiwan, ROC with the right to use the Symbol of Excellence lawfully.
The 22nd Symbol of Excellence Winner for PoE (Power over Ethernet) industrial Ethernet Switch, the MOEA, Taiwan, ROC with the right to use the Symbol of Excellence lawfully.
The 22nd Symbol of Excellence Winner for High-performance smart embedded computer modules, the MOEA, Taiwan, ROC with the right to use the Symbol of Excellence lawfully.
The 22nd Symbol of Excellence Winner for lightweighted smart micro-fanless embedded systems, the MOEA, Taiwan, ROC with the right to use the Symbol of Excellence lawfully.
The 22nd Symbol of Excellence Winner for Low-power consumption simple smart connected device, the MOEA, Taiwan, ROC with the right to use the Symbol of Excellence lawfully.
The 22nd Symbol of Excellence Winner for Low-power consumption ultra-compact embedded computer modules, the MOEA, Taiwan, ROC with the right to use the Symbol of Excellence lawfully.
89

The 22nd Symbol of Excellence Winner for Low-power consumption miniature embedded computer modules, the
MOEA, Taiwan, ROC with the right to use the Symbol of Excellence lawfully.
The 22nd Symbol of Excellence Winner for ATCA dual processor advanced communications motherboard, the MOEA, Taiwan, ROC with the right to use the Symbol of Excellence lawfully.
The 22nd Symbol of Excellence Winner for Mobile Industrial Computers, the MOEA, Taiwan, ROC with the right to use the Symbol of Excellence lawfully.
2013 Awarded with the “2013 Taiwan Top 12 Global Brands” Award.
Advantech Industrial Automation Group - Human Machine Interfaces (HMI) TPC and SPC series won Germany iF product design award in 2013.
The 21st Symbol of Excellence Winner for High-performance network security equipment, the MOEA, Taiwan, ROC with the right to use the Symbol of Excellence lawfully.
The 21st Symbol of Excellence Winner for ATCA 40GbE advanced communications motherboard, the MOEA, Taiwan, ROC with the right to use the Symbol of Excellence lawfully.
The 21st Symbol of Excellence Winner for Industrial-grade wireless data collection module, the MOEA, Taiwan, ROC with the right to use the Symbol of Excellence lawfully.
The 21st Symbol of Excellence Winner for IEEE 802.11a / b / g / n Industrial Wireless Outdoor Mesh, the MOEA, Taiwan, ROC with the right to use the Symbol of Excellence lawfully.
The 21st Symbol of Excellence Winner for Low-power consumption ultra-compact embedded computer module, the MOEA, Taiwan, ROC with the right to use the Symbol of Excellence lawfully.
The 21st Symbol of Excellence Winner for Green low-power consumption smart industrial-grade server, the MOEA, Taiwan, ROC with the right to use the Symbol of Excellence lawfully.
The 21st Symbol of Excellence Winner for Innovative high elastic expansion single-board computer, the MOEA, Taiwan, ROC with the right to use the Symbol of Excellence lawfully.
The 21st Symbol of Excellence Winner for Smart wide-range temperature miniature motherboard MI/O Ultra Series, the MOEA, Taiwan, ROC with the right to use the Symbol of Excellence lawfully.
The 21st Symbol of Excellence Winner for Robust design, high elastic expansion single-board computer, the MOEA, Taiwan, ROC with the right to use the Symbol of Excellence lawfully.
The 21st Symbol of Excellence Winner for Super bright smart industrial-grade display panel, the MOEA, Taiwan, ROC with the right to use the Symbol of Excellence lawfully.
The 21st Symbol of Excellence Winner for Industrial-grade ultra-thin open-frame display, the MOEA, Taiwan, ROC with the right to use the Symbol of Excellence lawfully.
The 21st Symbol of Excellence Winner for Dual processors ATCA advanced communications server, the MOEA, Taiwan, ROC with the right to use the Symbol of Excellence lawfully.
The 21st Symbol of Excellence Winner for Smart miniature fanless embedded systems, the MOEA, Taiwan, ROC with the right to use the Symbol of Excellence lawfully.
The 21st Symbol of Excellence Winner for Open-style Easy handling digital electronic multimedia player, the MOEA, Taiwan, ROC with the right to use the Symbol of Excellence lawfully.
The 21st Symbol of Excellence Winner for High-Performance Multi-Display Digital Electronic Multimedia Player, the MOEA, Taiwan, ROC with the right to use the Symbol of Excellence lawfully.
The 21st Symbol of Excellence Winner for Streamline energy-saving digital signage, the MOEA, Taiwan, ROC with the right to use the Symbol of Excellence lawfully.
The 21st Symbol of Excellence Winner for Energy data centralized computation, the MOEA, Taiwan, ROC with the right to use the Symbol of Excellence lawfully.
2012 Awarded with the 11th place of the “2012 Corporate Citizen Award” by Commonwealth Magazine.
Awarded with the “2012 Taiwan Top 11 Global Brands” Award.
The 20th Symbol of Excellence Winner for TREK-753 full-featured integrated on-board computer, the MOEA, Taiwan, ROC with the right to use the Symbol of Excellence lawfully.
The 20th Symbol of Excellence Winner for Industrial tablet touch panel display, the MOEA, Taiwan, ROC with the right to use the Symbol of Excellence lawfully.
The 20th Symbol of Excellence Winner for Cascaded-type real-time Ethernet remote data collection module, the MOEA, Taiwan, ROC with the right to use the Symbol of Excellence lawfully.
The 20th Symbol of Excellence Winner for Low-power consumption ultra-compact embedded computer modules, the MOEA, Taiwan, ROC with the right to use the Symbol of Excellence lawfully.
The 20th Symbol of Excellence Winner for Innovative interface single-board computers MI/O Extension, the MOEA, Taiwan, ROC with the right to use the Symbol of Excellence lawfully.
The 20th Symbol of Excellence Winner for Smart miniature motherboard MI/OUltra Series, the MOEA, Taiwan, ROC with the right to use the Symbol of Excellence lawfully.
90

The 20th Symbol of Excellence Winner for High seismic wide-range temperature PCI-104 CPU board, the MOEA,
Taiwan, ROC with the right to use the Symbol of Excellence lawfully. The 20th Symbol of Excellence Winner for Green energy-saving industrial-grade motherboard, the MOEA, Taiwan,
ROC with the right to use the Symbol of Excellence lawfully. The 20th Symbol of Excellence Winner for Electricity market exclusive fanless embedded industrial computer, the
MOEA, Taiwan, ROC with the right to use the Symbol of Excellence lawfully. The 20th Symbol of Excellence Winner for Industrial-grade flat touch panel LED display, the MOEA, Taiwan, ROC with
the right to use the Symbol of Excellence lawfully. The 20th Symbol of Excellence Winner for Open-style Easy handling digital multimedia player, the MOEA, Taiwan,
ROC with the right to use the Symbol of Excellence lawfully. The 20th Symbol of Excellence Winner for Low-power consumption high display digital multimedia player, the MOEA,
Taiwan, ROC with the right to use the Symbol of Excellence lawfully. The 20th Symbol of Excellence Winner for Expandable blade-type 5-slot Industrial PC, the MOEA, Taiwan, ROC with
the right to use the Symbol of Excellence lawfully.
2011 Awarded with the “2011Taiwan Top 10 Global Brands” Award. The 19th Symbol of Excellence Winner for ARK-VH200 fanless on-board DVR embedded systems, the MOEA,
Taiwan, ROC with the right to use the Symbol of Excellence lawfully. The 19th Symbol of Excellence Winner for FWA-6500 network applied platform, the MOEA, Taiwan, ROC with the right
to use the Symbol of Excellence lawfully. The 19th Symbol of Excellence Winner for NCP-5260, the MOEA, Taiwan, ROC with the right to use the Symbol of
Excellence lawfully. The 19th Symbol of Excellence Winner for PC/104, the MOEA, Taiwan, ROC with the right to use the Symbol of
Excellence lawfully. The 19th Symbol of Excellence Winner for PCM 9562, the MOEA, Taiwan, ROC with the right to use the Symbol of
Excellence lawfully. The 19th Symbol of Excellence Winner for PEC-3240 fanless industrial-grade embedded motion controller, the MOEA,
Taiwan, ROC with the right to use the Symbol of Excellence lawfully. The 19th Symbol of Excellence Winner for PIT-1501W healthcare and infotainment entertainment systems, the MOEA,
Taiwan, ROC with the right to use the Symbol of Excellence lawfully. The 19th Symbol of Excellence Winner for SOM-5788 Intelligent smart embedded computer modules, the MOEA,
Taiwan, ROC with the right to use the Symbol of Excellence lawfully. The 19th Symbol of Excellence Winner for Low-power consumption and wide-range temperature industrial touch
control PC, the MOEA, Taiwan, ROC with the right to use the Symbol of Excellence lawfully. The 19th Symbol of Excellence Winner for TREK-550, the MOEA, Taiwan, ROC with the right to use the Symbol of
Excellence lawfully.
2010 Awarded with the “2010 Taiwan Top 12 Global Brands” Award. Awarded by Chinagkong with the “Decade Industrial Contribution” and “Decade Leading Industry.” The 18th Symbol of Excellence Winner for IPPC- 8151S, the MOEA, Taiwan, ROC with the right to use the Symbol of
Excellence lawfully. The 18th Symbol of Excellence Winner for APAX- 5000 series, the MOEA, Taiwan, ROC with the right to use the
Symbol of Excellence lawfully. The 18th Symbol of Excellence Winner for Uno- 1100 series, the MOEA, Taiwan, ROC with the right to use the Symbol
of Excellence lawfully. The 18th Symbol of Excellence Winner for UTC-W101E, the MOEA, Taiwan, ROC with the right to use the Symbol of
Excellence lawfully. The 18th Symbol of Excellence Winner for NCP-7560, the MOEA, Taiwan, ROC with the right to use the Symbol of
Excellence lawfully. The 18th Symbol of Excellence Winner for MIC-5322, the MOEA, Taiwan, ROC with the right to use the Symbol of
Excellence lawfully.
2009 The 17th Symbol of Excellence Winner for IPPC 7517, the MOEA, Taiwan, ROC with the right to use the Symbol of
Excellence lawfully. The 17th Symbol of Excellence Winner for EKI 5000 series, the MOEA, Taiwan, ROC with the right to use the Symbol
of Excellence lawfully. Awarded with the “Electron d'Or Award for Industrial and Network Computing Architecture (INCA)” Awarded with the “2009 Taiwan Top 12 Global Brands” Award. Awarded with the “2009 China Outstanding Innovation Enterprise” award by CIO IT Magazine.
2008 Advantech received the 4th prize of the 2nd “Corporate Social Responsibility Award” from Commonwealth Magazine,
Taiwan, ROC The 16th Symbol of Excellence Winner for UbiQ 350, the MOEA, Taiwan, ROC with the right to use the Symbol of
Excellence lawfully. The 16th Symbol of Excellence Winner for VITA 350, the MOEA, Taiwan, ROC with the right to use the Symbol of
Excellence lawfully.
91
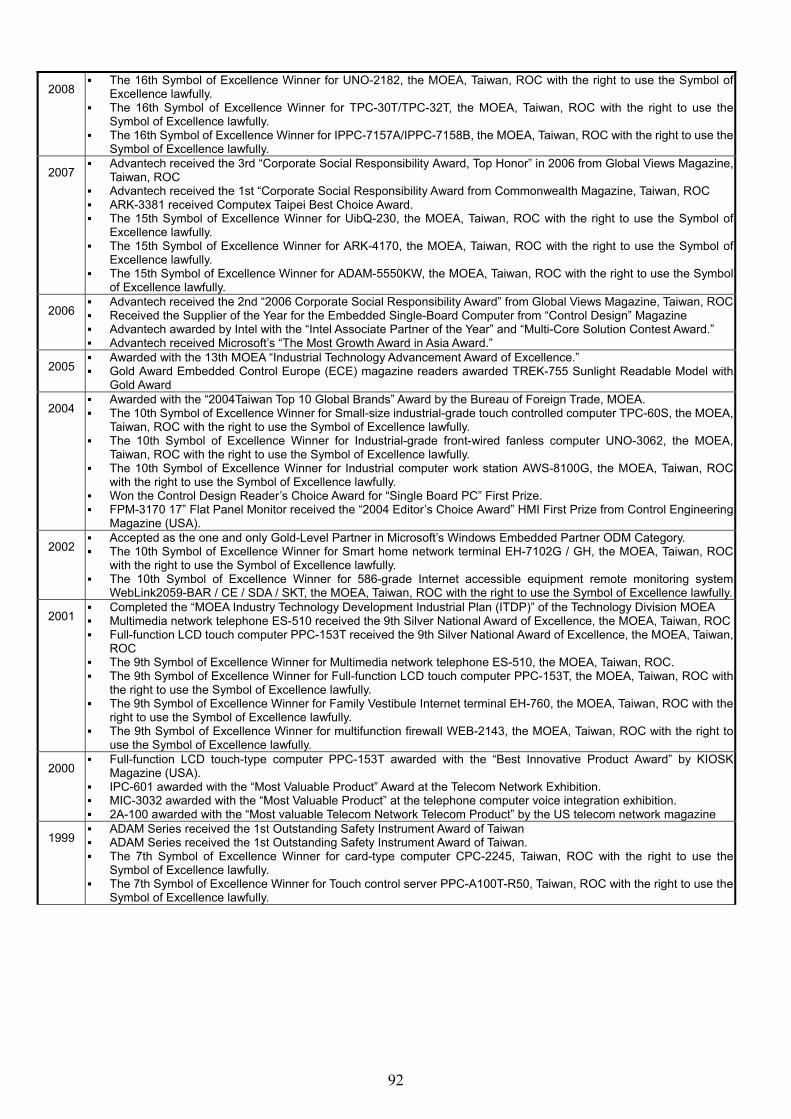
2008 The 16th Symbol of Excellence Winner for UNO-2182, the MOEA, Taiwan, ROC with the right to use the Symbol of
Excellence lawfully. The 16th Symbol of Excellence Winner for TPC-30T/TPC-32T, the MOEA, Taiwan, ROC with the right to use the
Symbol of Excellence lawfully. The 16th Symbol of Excellence Winner for IPPC-7157A/IPPC-7158B, the MOEA, Taiwan, ROC with the right to use the
Symbol of Excellence lawfully.
2007 Advantech received the 3rd “Corporate Social Responsibility Award, Top Honor” in 2006 from Global Views Magazine,
Taiwan, ROC Advantech received the 1st “Corporate Social Responsibility Award from Commonwealth Magazine, Taiwan, ROC ARK-3381 received Computex Taipei Best Choice Award. The 15th Symbol of Excellence Winner for UibQ-230, the MOEA, Taiwan, ROC with the right to use the Symbol of
Excellence lawfully. The 15th Symbol of Excellence Winner for ARK-4170, the MOEA, Taiwan, ROC with the right to use the Symbol of
Excellence lawfully. The 15th Symbol of Excellence Winner for ADAM-5550KW, the MOEA, Taiwan, ROC with the right to use the Symbol
of Excellence lawfully.
2006 Advantech received the 2nd “2006 Corporate Social Responsibility Award” from Global Views Magazine, Taiwan, ROC Received the Supplier of the Year for the Embedded Single-Board Computer from “Control Design” Magazine Advantech awarded by Intel with the “Intel Associate Partner of the Year” and “Multi-Core Solution Contest Award.” Advantech received Microsoft’s “The Most Growth Award in Asia Award.”
2005 Awarded with the 13th MOEA “Industrial Technology Advancement Award of Excellence.” Gold Award Embedded Control Europe (ECE) magazine readers awarded TREK-755 Sunlight Readable Model with
Gold Award
2004 Awarded with the “2004Taiwan Top 10 Global Brands” Award by the Bureau of Foreign Trade, MOEA. The 10th Symbol of Excellence Winner for Small-size industrial-grade touch controlled computer TPC-60S, the MOEA,
Taiwan, ROC with the right to use the Symbol of Excellence lawfully. The 10th Symbol of Excellence Winner for Industrial-grade front-wired fanless computer UNO-3062, the MOEA,
Taiwan, ROC with the right to use the Symbol of Excellence lawfully. The 10th Symbol of Excellence Winner for Industrial computer work station AWS-8100G, the MOEA, Taiwan, ROC
with the right to use the Symbol of Excellence lawfully. Won the Control Design Reader’s Choice Award for “Single Board PC” First Prize. FPM-3170 17” Flat Panel Monitor received the “2004 Editor’s Choice Award” HMI First Prize from Control Engineering
Magazine (USA).
2002 Accepted as the one and only Gold-Level Partner in Microsoft’s Windows Embedded Partner ODM Category. The 10th Symbol of Excellence Winner for Smart home network terminal EH-7102G / GH, the MOEA, Taiwan, ROC
with the right to use the Symbol of Excellence lawfully. The 10th Symbol of Excellence Winner for 586-grade Internet accessible equipment remote monitoring system
WebLink2059-BAR / CE / SDA / SKT, the MOEA, Taiwan, ROC with the right to use the Symbol of Excellence lawfully.
2001 Completed the “MOEA Industry Technology Development Industrial Plan (ITDP)” of the Technology Division MOEA Multimedia network telephone ES-510 received the 9th Silver National Award of Excellence, the MOEA, Taiwan, ROC Full-function LCD touch computer PPC-153T received the 9th Silver National Award of Excellence, the MOEA, Taiwan,
ROC The 9th Symbol of Excellence Winner for Multimedia network telephone ES-510, the MOEA, Taiwan, ROC. The 9th Symbol of Excellence Winner for Full-function LCD touch computer PPC-153T, the MOEA, Taiwan, ROC with
the right to use the Symbol of Excellence lawfully. The 9th Symbol of Excellence Winner for Family Vestibule Internet terminal EH-760, the MOEA, Taiwan, ROC with the
right to use the Symbol of Excellence lawfully. The 9th Symbol of Excellence Winner for multifunction firewall WEB-2143, the MOEA, Taiwan, ROC with the right to
use the Symbol of Excellence lawfully.
2000 Full-function LCD touch-type computer PPC-153T awarded with the “Best Innovative Product Award” by KIOSK
Magazine (USA). IPC-601 awarded with the “Most Valuable Product” Award at the Telecom Network Exhibition. MIC-3032 awarded with the “Most Valuable Product” at the telephone computer voice integration exhibition. 2A-100 awarded with the “Most valuable Telecom Network Telecom Product” by the US telecom network magazine
1999 ADAM Series received the 1st Outstanding Safety Instrument Award of Taiwan ADAM Series received the 1st Outstanding Safety Instrument Award of Taiwan. The 7th Symbol of Excellence Winner for card-type computer CPC-2245, Taiwan, ROC with the right to use the
Symbol of Excellence lawfully. The 7th Symbol of Excellence Winner for Touch control server PPC-A100T-R50, Taiwan, ROC with the right to use the
Symbol of Excellence lawfully.
92

1998 Awarded with the Most Representative Outstanding Company by Industrial Development Bureau, MOEA, Taiwan,
ROC PPC-102T Panel Computer received the 6th Gold National Award of Excellence, Taiwan, ROC The 6th Symbol of Excellence Winner for PC-based remote monitoring system ADAM-5000 series, Taiwan, ROC with
the right to use the Symbol of Excellence lawfully. The 6th Symbol of Excellence Winner for PPC-102T Panel Computer, Taiwan, ROC with the right to use the Symbol of
Excellence lawfully. The 6th Symbol of Excellence Winner for Multi-function LCD panel computers PPC-140T, Taiwan, ROC with the right
to use the Symbol of Excellence lawfully. PPC-140T Multi-Function Panel PC received the Comdex Asia 98 “Best Hardware System Award.” Multi-function LCD panel computers PPC-140T awarded with the “KIOSK Best Solution Product” by CRN Magazine
(USA). IPC-6908 awarded with the “Most Valuable Product of the Year” by CTI Magazine (USA) Advantech received the 4th place of the “Most Worthy of Investment Companies” Award from Commonwealth
Magazine, Taiwan, ROC Advantech received the 6th place of “The Best Performing Companies” Award from Commonwealth Magazine, Taiwan,
ROC
1997 Received ISO-14001 Environmental Management System Certification. Awarded with the 5th Award for Industrial Technology Advancement Most Outstanding Award, the MOEA, Taiwan,
ROC IPC-622 awarded with the “Most Valuable Product of the Year” Award by the US Computer Telephony Magazine.
1996 Awarded with the 4th Award for Industrial Technology Advancement and Outstanding Award, the MOEA, Taiwan, ROC The 4th Symbol of Excellence Winner for ADAM-4000 Series, the MOEA, Taiwan, ROC with the right to use the
Symbol of Excellence lawfully.
1995 The in-house developed industrial control software -GENIE awarded with the “Outstanding Information Application
Award.”
1993 Awarded with the 2nd National Award of Small & Medium Enterprise by National Association of Small & Medium
Enterprise Received ISO-9001 Quality Management System Certification.
1992 Awarded with the “Outstanding Export & Import Performance Award” by General Chamber of Commerce of New Taipei
City ROC Blue Chip Corporate Training Unit “Gold Merchant Award”
1991 Awarded with the “Outstanding Export & Import Performance Award” by General Chamber of Commerce of New Taipei
City
1990 Awarded with the “Outstanding Export & Import Performance Award” by General Chamber of Commerce of New Taipei
City
1989 Awarded with the “Innovative Product Award” at the 3rd Instrument Exhibition, Taipei City, ROC
5.2 Main Applications of major products and their manufacturing processes 5.2.1 Main applications of major products:
(1) Embedded Computing Including Computer On Modules, Industrial Motherboards, Industrial Display Systems, Fanless Embedded computer, and Digital Signage Players. The main function is based on PC core control module with high performance applications and streamlined platforms design, so system integrators can reduce product development time .
(2) Industry Automation Advantech provides customers several standard solution ready packages and products,
like Embedded Automation Computers, Human Machine Interfaces, Industrial Communication, Machine Automation, Remote I/O Modules and so on. Build stable automation operation with real-time monitoring solution.
(3) Intelligent System As a leading provider in the industrial computing market, Advantech is committed to giving more value-added solution and services for the implement of IoT development, Data Acquisition (DAQ) & Communication, Industrial Servers & Storage, Intelligent Transportation Systems, Video Solution, modular IPC are included.
93

(4) InteAdvflexPoCoinfo
5.2.2 The
(1) BoaAfterinspemecstanvisuatimefuncFQC
(2) SystSimifor pto asqualenviShopbefoworld
elligent Sevantech noxible for vaint-of-Caremputers, Mormation dproduction
ard Level Pr warehousect the in
chanism fdard to peal inspecti high tem
ction test toC inspectiotem Level lar to boar
preparing mssembly thity. Long tronment, fp Floor Info
ore move dwide.
ervices ot only fulfiarious apple terminalsMedical Caelivery, hen process
Production se receivincoming mfor preparierform leadon for dou
mperature bo ensure thn will be peProduction
rd product,materials fohe systemtime high tfollowed bormation Sto packing
ills customications. T, All-in-one
arts and POealthcare eof main pro
Advantec
Flow ng materia
material, onng materia-free solde
uble checkburn-in to
he product erformed bn Flow only acce
or work ordm product atemperatury the full f
System willg process
mer requiremThe produce Service TOS systemnvironmen
roducts:
ch Process C
l from vennly accepteals for woer printing k and man
filter out quality is a
before ship
pted mateder requesand perforre burn-in function tel monitor e. FQC ins
ments, butct lines are Touch Com
m …etc., arnt and logis
Control Cha
dors, well-ed materiark order refor SMT p
nual insertithe early
accord withpping world
rial will be st. The werm full funtest is ado
est and cueach unit shspection w
t also makewell comp
mputers, Ine applied istics mana
art
-trained IQal will be equest. Adrocess, folon for DIPdefect pa
h industrialdwide.
stored andll-trained oction test opted to sistomized should passwill be per
es expanspleted, sucndustrial Min each fie
agement.
QC personastored an
dvantech allowed by 1P process.arts and fol standard.
d follow FIFoperators wto ensureimulate thesettings. Ts all the rigrformed b
ion more h as obile ld of retail
al will samnd follow Fadopted R100% AOI . Through ollowed by. After pac
FO mechawill follow S the assee user worThe Producgid tests abefore ship
pling FIFO
RoHS plus long
y full king,
nism SOP mbly rking ction
bove, pping
94
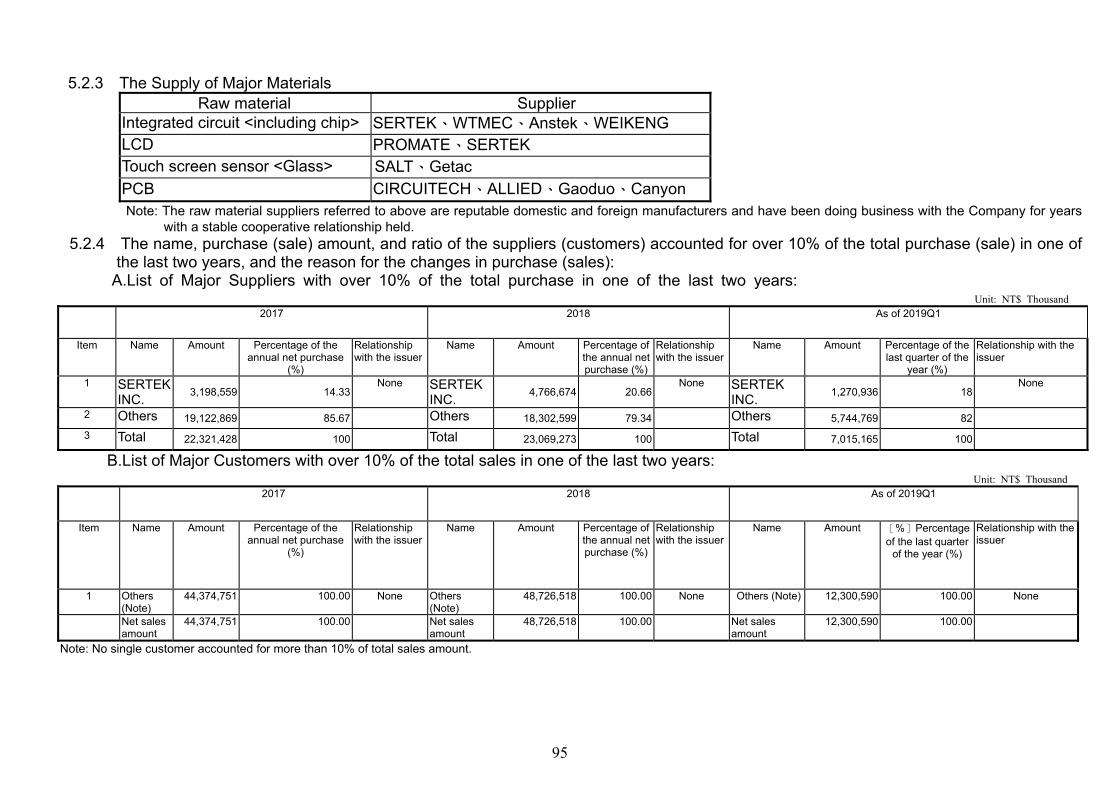
5.2.3 The Supply of Major Materials Raw material Supplier
Integrated circuit <including chip> SERTEK、WTMEC、Anstek、WEIKENG LCD PROMATE、SERTEK Touch screen sensor <Glass> SALT、Getac PCB CIRCUITECH、ALLIED、Gaoduo、Canyon Note: The raw material suppliers referred to above are reputable domestic and foreign manufacturers and have been doing business with the Company for years
with a stable cooperative relationship held. 5.2.4 The name, purchase (sale) amount, and ratio of the suppliers (customers) accounted for over 10% of the total purchase (sale) in one of
the last two years, and the reason for the changes in purchase (sales): A.List of Major Suppliers with over 10% of the total purchase in one of the last two years:
Unit: NT$ Thousand 2017 2018 As of 2019Q1
Item Name Amount Percentage of the annual net purchase
(%)
Relationship with the issuer
Name Amount Percentage of the annual net purchase (%)
Relationship with the issuer
Name
Amount Percentage of the last quarter of the
year (%)
Relationship with the issuer
1 SERTEK INC.
3,198,559 14.33None SERTEK
INC. 4,766,674 20.66
None SERTEK INC.
1,270,936 18None
2 Others 19,122,869 85.67 Others 18,302,599 79.34 Others 5,744,769 82
3 Total 22,321,428 100 Total 23,069,273 100 Total 7,015,165 100
B.List of Major Customers with over 10% of the total sales in one of the last two years: Unit: NT$ Thousand
2017 2018 As of 2019Q1
Item Name
Amount Percentage of the annual net purchase
(%)
Relationship with the issuer
Name
Amount Percentage of the annual net purchase (%)
Relationship with the issuer
Name
Amount 〔%〕Percentage of the last quarter
of the year (%)
Relationship with the issuer
1 Others (Note)
44,374,751 100.00 None Others (Note)
48,726,518 100.00 None Others (Note) 12,300,590 100.00 None
Net sales amount
44,374,751 100.00 Net sales amount
48,726,518 100.00 Net sales amount
12,300,590 100.00
Note: No single customer accounted for more than 10% of total sales amount.
95

5.2.5 Production, Volume, and Value of the last two years
Unit: Unit/PC; NT$ Thousand
Year
Output
Main Products
2017 2018
Production
capacity
Production
quantity
Production
Value
Production
capacity
Production
quantity
Production
Value
Embedded boards and
Chassis 1,821,477 1,690,595 11,051,580 1,949,092 1,733,502 11,055,837
Industrial computer and
industrial control 2,197,119 2,020,599 7,948,275 2,437,134 2,370,573 10,306,993
After-sales service and
others 82,990 65,553 103,452 88,970 72,724 113,486
Total 4,101,586 3,776,747 19,103,307 4,475,196 4,176,799 21,476,316
5.2.6 Sales Volume and Value of the last two years
Unit: Unit/PC; NT$ Thousand
Year
Shipments
& Sales
Main Products
2017 2018
Domestic Sales Export Sales Domestic sales Export Sales
Volume Value Volume Value Volume Value Volume Value
Embedded boards and
Chassis 242,959 1,491,860 1,471,688 19,482,087 213,961 1,445,224 1,602,212 19,909,489
Industrial computer and
industrial control 211,086 1,243,973 2,695,258 16,652,665 234,068 1,320,262 2,863,155 19,778,769
After-sales service and
others 10,911 713,528 112,255 4,790,638 13,255 838,958 107,009 5,433,816
Total 464,956 3,449,361 4,279,201 40,925,390 461,284 3,604,444 4,572,376 45,122,074
96

5.3 Employee information
March 31, 2019
Year 2017 2018 As of March 31,
2019
No. of
Employee
Direct staff 2,362 2,467 2,468
Indirect staff 5,431 5,692 5,748
Total 7,793 8,159 8,216
Average age 36.3 36.3 35.9
Average seniority 5.8 6.2 5.7
Academy Ratio
Ph.D 0.2 0.3 0.3
Master 19.4 19.1 19.7
College 47.4 48.8 47.5
Senior High School 27.7 26.9 27.3
Below Senior High School 5.2 5.0 5.2
5.4 Expenditures on Environment Pollution Control
5.4.1 The amount of penalty/fine (including compensation) imposed due to
environmental pollution in the most recent year and up to the publication of
the annual report, countermeasures and potential expenditures: None
5.4.2 Advantech recognizes the concept of the "LITA (altruistic) tree", believing
that society is like the earth nurturing a tree and it is the foundation for a
corporation to grow; therefore, we must give back to society what we have
gained. Following 30 years of hard work, all of Advantech's current
achievements rely upon the continuous resources provided by the
environment. As a member of society with the goal of creating a beautiful life,
Advantech is willing to commit its utmost effort in improving the environment
and ensuring labor safety. In light of this, not only did Advantech incorporate
the ISO 14001 environmental management system in 1996, OHSAS 18001
occupational safety and health management system in 2005, and
implemented practices in accordance with government regulations for
environmental protection, labor safety, and health, Advantech also worked
hard to lessen the impacts of its operational activities with respect to GHG
97

management, product design and use, and waste disposal to improve the
safety and health of the environment. It is through these efforts, in
conjunction with employee participation and commitment, Advantech has
achieved the goal of environmental protection and corporate sustainable
development.
Eco-friendly product design
Advantech believes in protecting the environment by preventing pollution,
using less energy and raw materials, reducing the generation of waste, and
using clean production technologies; it focuses on modifying the production
process to reduce pollution rather than using end-of-pipe treatments to
resolve pollution problems. When promoting waste reduction, the Company
recycles waste packaging materials for reuse. In addition, when designing
products and selecting production technologies, we try to minimize the use
of raw materials and energy. Through energy conservation designs, the goal
of cyclic use can be achieved. Advantech adopts the ISO 14000
environmental management system to facilitate pollution prevention and life
cycle assessment, thereby enabling the Company to raise its environmental
performance while increasing its profitability.
In recent years, climate change, environmentally hazardous substances
in products, labor safety and health, and human rights have become key
CSR issues. Advantech has also incorporated these issues into the focus of
green supply chain management (Please refer to section 3.3 for details). For
example, regarding the management of environment-related substances,
Advantech has amended its internal management standards according to
various environmental protection policies .
In addition to the aforementioned green design regulations, the Company
requires all product designs and development to be verified for safety,
thereby ensuring their compliance with CE/ FCC/CCC safety requirements.
Advantech follows international environmental protection laws and
regulations; from natural resource use, hazardous substance restrictions, to
the life cycle assessment (LCA) with respect to waste management. All of
these procedures conform 100% to international declarations for green
products. The Company's products are promoted as green products based
on three dimensions: safety, energy-saving, and environmental protection.
Environmental protection management
To sustain human lives and Earth's green environment, Advantech has
endeavored to lessen the impacts of product design and application, as well
as waste disposal for the overall safety and health of the environment. In
98

addition to complying with relevant regulations, the Company has mobilized
all of its employees to participate in the protection of the environment and
achieve corporate sustainable development.
Overview of Advantech’s environmental protection investments
Environmental Management Targets Achievements
Energy saving and carbon reduction programs
Reduced electricity consumption per unit of product produced by 5%
Reduced electricity consumption per unit of production by 7.43%
Waste reduction program Reduce industrial Scrap rate waste under 3%
industrial Scrap rate waste is 1%
Remarks: Formula 1) Electricity consumption per unit of production unit: annual use/annual production 2) Waste reduction index (rejection rate): total amount of hazardous waste in the year / total production of the year
Looking to the future, Advantech will integrate Taiwan's smart factory at Linkou Phase II, and implement energy management systems and production line optimization management mechanisms to reduce energy consumption targets and reduce electricity consumption to implement energy-saving benefits. In response to waste reduction measures, Advantech's plant will introduce a continuous improvement project to study the ineffective timing of tin in DIP process tin waste, which is expected to reduce the output of waste tin slag.
2018 Advantech Environmental Protection Investment Expenses List
Item Cost(NT1,000)
1 Energy Star/ Environment Product safety/environmental certification fees 205
2 ISO 14001/ OHSAS18000 Environmental Safety Management System Certification Fees and Pollution Source Monitoring Fees 379
Total 584Including verification fees, the company's 2018 environmental protection investment exceeded NT$584,000, as shown in the table.
Water resource usage and management
The amount of precipitation in Taiwan during the dry and wet seasons are
significantly different. Storing water resource is a challenging task. When bad weather
occurs, various industries may face severe water shortage. Advantech has attempted
measures such as using water-saving faucets and toilets in order to reduce the
average water consumption per capita. Advantech's plants are located in developed
industrial zones or parks in urban areas. All of these plants use tap water as their
water supply 100% of the time; they are not involved in extracting underground or well
water and their water consumption activities exert no negative influence on the
surrounding water resources.
• Monitoring and management of cooling water tower
• Monitoring and management of cooling water towers' conductivity
• Installation of water-saving faucets
99

• Smart irrigation water-saving system
• Monitoring and management of cooling water and chiller systems with smart
air-conditioning systems
Waste management and resource recycling
Having zero waste is Advantech's ultimate goal in waste management. More
specifically, by reducing the amount of total waste produced, recycling waste into
resources, and implementing source management measures (e.g., reduce raw
material use), Advantech attempts to output less waste, replace the end-of-pipe
treatment model with the recycling-and-reuse model, convert trash into useful
resources, realize resource recycling, and reduce the energy and costs consumed
during waste treatment.
Regarding the use of raw materials, the use of electronic materials accounts for
approximately 90% of the total usage, whereas the remaining 10% includes
mechanical, packaging, plastics, and other non-metal mechanical materials. metric
tons which can be divided into four major categories: PCB wastes, tin slag, chemical
waste, and others. In the future, Advantech will continue to increase its process yield,
reduce the output of electronic waste and tailings, and achieve efficient industrial
waste reduction.
Greenhouse gas management
By promoting a series of activities related to "energy conservation, carbon
reduction, and loving our planet," Advantech strengthens its employees' awareness
on conserving energy. Concurrently, the Environmental Safety and Health Committee
is established to construct Advantech's conceptual framework that promotes
environmental safety and health, advocates energy conservation, and helps increase
energy efficiency. Moreover, the Company includes energy cost reduction as one of
its crucial auditing items.
Since 2009, Advantech has cooperated in the Carbon Disclosure Project (CDP),
which is currently the world's largest database related to global climate change. Each
year, questionnaires are distributed to determine how businesses are responding to
climate change and reducing their GHG emissions. The survey results are then used
to evaluate the potential business risks and opportunities caused by climate change.
Through annual CDP information disclosure, Advantech carefully reviews
climate-related issues such as climate regulations and hazards caused by climate
change. To mitigate potential risks in business management, the Company adopts
effective reduction and elimination measures and thereby adheres to the GHG
management requirements requested by international clients.
Advantech Taiwan includes our Neihu headquarters, as well as factories in
Donghu and Xindian. The Linkou Smart Technology Park officially started its
operation in 2014; its construction divided into three phases, and the total area spans
100

34,470 m2. Currently, the completed first-phase covers an area of 9,983 m2, and its
main buildings include an R&D center, production center, and offices. In the future,
the second and third phases will contain more office space, a production center, and a
living area, which will be integrated with the original Linkou Plant to form Advantech’s
second headquarters where R&D, production, warehousing, and product distribution
will take place. Advantech has developed the Linkou Park into an innovative
experimental site for smart-buildings, where two major smart-building solutions,
smart-building energy management, and smart contextual space management are
implemented. By cooperating with partners from the smart-building industry,
Advantech has established a close-knit smart-building collaboration system, where
consulting teams are available to provide sales services. For our partners from the
building industry, Linkou Park is an experimental site where collaborative R&D can be
performed. To clients, Linkou Park is a place where they can experience smart
building solutions. When customers walk into Advantech’s Linkou Park, they can
experience various smart building solutions developed by the collaboration system,
including the smart central control room, smart parking, smart reception, and smart
conference rooms.
Several smart sites have already been developed inside Linkou Park, all of which
have incorporated the concept of smart energy conservation. Furthermore, Linkou
Park continuously engages in innovative development to increase the
smart-capabilities of the smart green buildings. Relevant designs are described as
follows:
I. Smart parking: Smart parking is a smart service system that combines various
functions such as reserving a parking space, identifying license plates, eTag,
welcoming guest messages, guiding a vehicle to its parking space, parking
area control and management, and finding a vehicle. The smart parking system
is equipped with an automated system that uses lights to guide vehicles
forward, as well as an air conditioner system for air quality control to provide
excellent smart parking services and parking environment, as well as conserve
energy.
II. Smart reception: When visitors arrive, the big monitor in the lobby will display a
welcome message. As soon as visitors touch the automated visitor registration
system, relevant personnel are notified of their arrival via mobile phone
messages. Visitors are then issued with an electronic identification card that
enables them to interact with the multimedia facilities within the building. With
interactive multimedia signboards featuring centralized control management
and regional connectivity, park-related information, weather, and traffic data
can be viewed. Thus, businesses with branches in other regions can easily
announce their management information. Furthermore, through an interactive
101
e-Catalog system, visitors can browse product catalogs and advertisement
videos, use their emails online and share information with others; they can also
read QR codes with their mobile phones. At night, these signboards
automatically enter sleep mode and automatically turns on the next day,
thereby achieving the effects of energy conservation.
III. Smart conference room: The multimedia signboard in the lobby displays the
booking information for the conference room. Similarly, at the entrance of the
conference room, a signboard is also installed to display meeting information.
Users will be given the rights to use each conference facility, and they can
automatically switch the situational configurations within the conference room
with a single touch of a button depending on their needs. Concurrently, air
quality sensors and automatic regulating fans are also installed to enhance the
indoor air quality. If no one is detected to be present in the room for 15 minutes,
the system automatically issues a command to switch off all power and the
air-conditioning system in the room to conserve energy.
IV. Smart office:In addition to the air conditioning system automatically detecting
and regulating the air quality, the people sensing energy conservation system
will also divide the office area into several regions and generate a schedule
based on work hours and lunch breaks. During off hours, smart office connects
with the access control system and the entry card reader automatically
activates the lights in the room. Furthermore, the system can be operated via a
webpage and a touch screen panel. Based on the behavioral characteristics of
users, lights and air conditioners in that area switch off automatically when the
room is empty.
In addition to introducing smart solutions for reducing energy consumption,
Advantech is also constantly involved with the promotion of energy.
• The Linkou Smart Technology Park contains building energy management
and people sensing energy conservation, with the latter aimed at making the
buildings smarter including smart air-conditioning and parking, as well as
all-in-one access cards. After following the steps for comprehensive detection,
reliable transmission, and smart processing, combined with cloud systems to
facilitate convenient living, smart buildings are realized; through the use of
smart management, achieve effective energy conservation and prevent
wasting resources.
• Smart power management is handled by a single button operation to control
the lightings and projectors in the conference room; different settings such as
presentation mode or discussion mode are also provided. This prevents the
unnecessary waste of resources when employees forget to switch off other
power supplies.
102

• Replacing high-performance lighting equipment; currently, the Linkou Smart
Technology Park and the Sunshine Building both use energy-saving light bulbs,
whereas Xindian and Donghu plants are still in the process of replacing their
energy-consuming lights. New Advantech buildings all use energy-saving
bulbs.
• Use video conferencing instead of on-site meetings whenever possible
• Prioritize the purchase of green-label office equipment and information
electronic products
• Maintain the indoor temperature at 25°C
• Encourage employees to develop the habit of switching off the lights as soon
as they leave a room
Advantech and caring for nature
Environmental protection is a crucial topic for mankind; therefore, Advantech not
only values its relationships with local communities, but also actively assumes its
environmental protection responsibilities in creating a sustainable green industry.
Advantech will transform Linkou into smart parks and IoT demonstration centers,
cooperate with its partners in the innovation and execution of IoT solutions, reform
both Linkou into smart building demonstrations and indicators, promote smart energy
saving and carbon reduction concepts, alter conventional thinking through actual
experiences, and promote the implementation of smart cities.
More specifically, Linkou Park followed the optimal energy saving design
formulated based on user needs. The design enhances the comfort level for
employees inside the building as well as their working efficiency. While lowering the
amount of unnecessary energy consumption, it also improved the quality of the overall
work environment. The Park's energy management system is optimized continuously
with the hope that the Park will become a benchmark for Taiwan's green enterprises.
Organic Farm
Encourage all Advantech employees to step outside, accept the baptism and the
nurturing of mother nature, participate in various sustainable conservation activities
organized by Advantech to allow them to get closer to nature without damaging its
ecological systems, and adopt the organic farms with their families. Through each
seeding and harvesting, Advantech employees could truly appreciate and understand
mother nature; enjoy the beauty of this planet as well as the joys of a rich harvest.
"Organic & natural, eco-friendly and earth loving" have always been our goals, and
being close to and feeling nature's vitality are the energy source for Advantech
employees. In 2009, Director KC Liu happened to come across an organic farm in
Yilan County, where he had first-hand experience with natural, chemical-free
agriculture; he was inspired by the idea of providing all employees with an opportunity
to get close to nature and enjoy organic fruits and vegetables, this idea planted the
103

seeds for Advantech's organic farms.
After careful investigation and planning, the "Advantech Organic Farm - Work
Holiday" was launched in 2010 in Shenkeng. Each month, Advantech employees can
participate in an ecological trip at the organic farm. In order to allow more Advantech
employees with the chance to enjoy organic farming experience, Advantech's organic
farm plots have been open for employee adoption since 2011. In addition to providing
organic fertilizer, seeds, and seedlings for the eager gardeners, we also provided
organic produce and environmentally friendly daily living necessities as special
awards for those employees who take a serious interest in organic horticulture. The
annual organic farm adoption events and harvesting activities are the happiest times
experienced by Advantech employees and their families.
The aim of Advantech Taiwan's organic farms is to provide employees, their
families, and other individuals with the opportunity to experience organic farming and
a healthy diet. The farms also allow employees to take better care of themselves, their
families, and our planet; helping to achieve sustainable agriculture. "Come admiringly,
come willingly, come frequently, come together" is the motto of Advantech's organic
farms, in the hope that employees can feel the vitality of nature and experience an
inner green happiness.
5.5 Labor-Employer Relation
(I) The Company’s employee welfare measures, education, training, retirement
system and its implementation, as well as the agreement between the
employers and the employees, and the implementation of the employee’s
rights protection:
1.Employee welfare measures:
Uphold the “Perfectionism” business philosophy. The Company values the
employee benefits policy. A dedicated unit (Human Resources Department)
is setup within the organization to plan a series of welfare measures in
order to provide the staff with a stable lifestyle, to protect the interests of
employees, and thus promote employer-employee harmony.
The Company believes that the employee will be able devote to work
wholeheartedly and exercise their job strengths to create high quality
products and promote the progress and prosperity of the whole enterprise
only when their welfares and life security are protected.
(1) The welfare measures directly handled by the Company:
A、Employee bonus;
B、Labor insurance;
C、National health insurance
104

D、G
E、An
F、Ma
G、Dr
H、Ye
I、Do
J、Ov
K、M
L、Co
M、B
N、De
O、M
P、Ar
Q、Em
2. Educ
With a
Colleg
On-Job
hoping
Main C
Camp,
global
continu
improv
outline
Ad
an
Cu
roup insura
nnual healt
arriage, fun
ragon Boa
earend ban
mestic tou
verseas tou
agazine su
ommunity a
irthday cel
epartmenta
Movies
rts and cult
mergency
cation, train
a view to c
e has des
b Training
g to develo
Core Curri
, TCAP, a
growth pl
uous learn
vement for
ed as follow
Advantec
dvantech's
nd skills of
urricula, th
ance
th check
neral, joy, c
t Festival a
nquet dinn
ur
ur
ubscription
ac
ebration
al function
tural appre
rescue go
ning system
cultivating t
igned a se
, the train
op his/her
icula, Cas
and Cham
atform targ
ning and d
r all Advan
ws:
ch 10-Cor
executive
f Advantec
he five cat
celebration
and Mid-A
er
ns subsidie
fund
eciation
ld
m, and its i
talents and
eries of tale
nee will be
expertise
se Study, R
pion Prog
geting on
developme
ntech talen
re Program
es have e
ch and com
tegories o
n grants
utumn Fes
es
implement
d expandin
ent cultivat
e assigned
honed thro
Reading C
gram, Adva
learning, c
ent so as
nts. Each t
m
laborated
mpiled the
of which in
stival gifts
ation
ng the hor
tion progra
d with a w
ough the ta
Club, E-Lea
antech Co
creating an
to accele
talent cultiv
the most
Advantec
nclude qua
rizons, Adv
ams: starti
work-relate
ask, and w
arning and
ollege prov
n environm
erate grow
vation pro
basic kno
ch Ten Ma
ality comm
vantech
ng from
ed task,
with Ten
d LEAP
vides a
ment for
wth and
gram is
owledge
in Core
mitment,
105
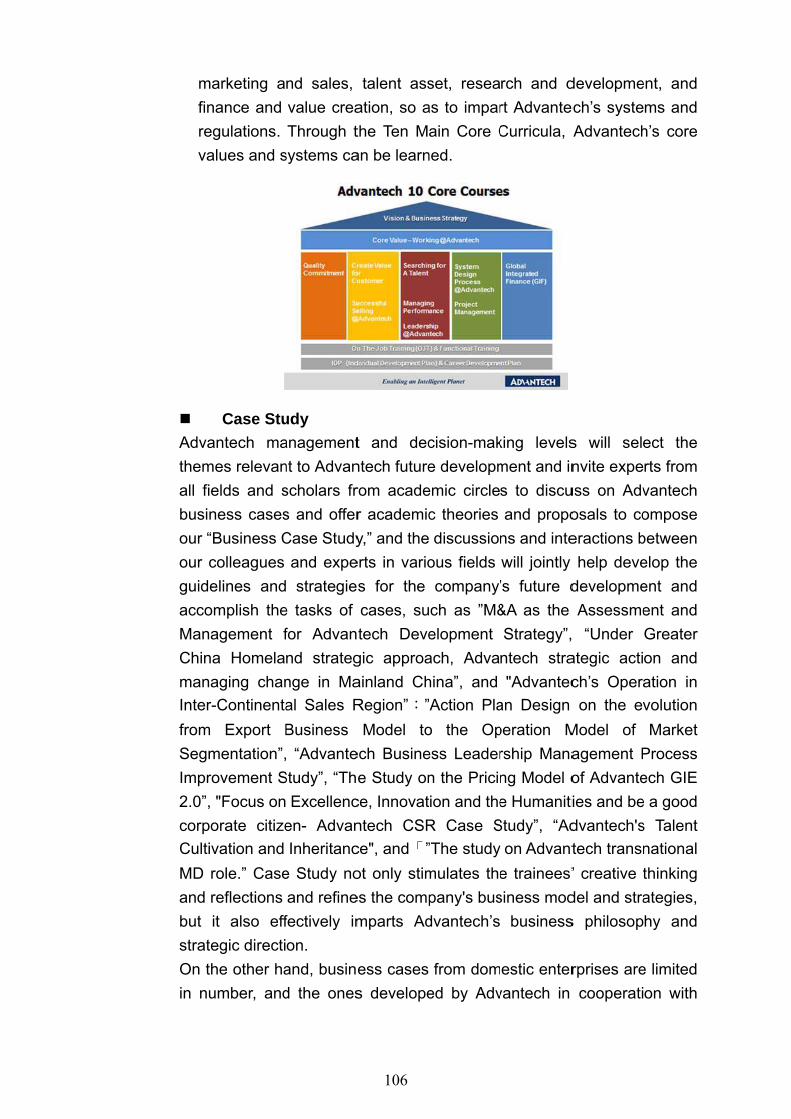
ma
fin
reg
va
Adva
them
all fie
busin
our “B
our c
guide
accom
Mana
China
mana
Inter-
from
Segm
Impro
2.0”,
corpo
Cultiv
MD r
and r
but i
strate
On th
in nu
arketing a
ance and
gulations.
lues and s
Case Stu
antech ma
es relevan
elds and s
ness cases
Business C
colleagues
elines and
mplish the
agement f
a Homela
aging chan
-Continenta
Export B
mentation”,
ovement S
"Focus on
orate citize
vation and
role.” Case
reflections
t also eff
egic directi
he other ha
umber, and
nd sales,
value crea
Through t
systems ca
udy
anagement
nt to Advan
scholars fr
s and offer
Case Study
and expe
strategie
e tasks of
for Advan
nd strateg
nge in Ma
al Sales R
Business
“Advante
Study”, “Th
Excellenc
en- Advan
Inheritanc
e Study no
and refine
fectively im
on.
and, busine
d the ones
talent ass
ation, so a
the Ten M
an be learn
t and dec
ntech future
rom acade
r academic
y,” and the
erts in vario
s for the
cases, su
tech Deve
gic approa
ainland Ch
Region”:”
Model to
ech Busine
e Study on
ce, Innovat
ntech CSR
ce", and「”
ot only stim
es the comp
mparts Ad
ess cases
s develope
set, resea
as to impar
ain Core C
ned.
cision-mak
e developm
emic circle
c theories
discussion
ous fields
company’
ch as ”M&
elopment
ach, Adva
hina”, and
Action Pla
o the Op
ess Leader
n the Pricin
ion and the
R Case S
”The study
mulates the
pany's bus
dvantech’s
from dom
ed by Adv
rch and d
rt Advante
Curricula,
king levels
ment and in
s to discu
and propo
ns and inte
will jointly
’s future d
&A as the
Strategy”,
ntech stra
"Advantec
an Design
peration M
rship Mana
ng Model o
e Humaniti
Study”, “Ad
on Advant
e trainees’
siness mod
business
estic enter
vantech in
developme
ech’s syste
Advantech
s will sele
nvite expe
uss on Adv
osals to co
eractions b
help deve
developme
Assessme
, “Under
ategic acti
ch’s Opera
on the ev
Model of
agement P
of Advante
ies and be
dvantech's
tech transn
’ creative t
del and stra
s philosop
rprises are
cooperati
ent, and
ms and
h’s core
ect the
rts from
vantech
ompose
between
elop the
ent and
ent and
Greater
on and
ation in
volution
Market
Process
ech GIE
e a good
s Talent
national
thinking
ategies,
hy and
e limited
on with
106

acade
stude
time,
expe
The
wisdo
news
allow
philos
they a
obtai
learn
simul
acces
know
know
the e
webs
Adv
Imp
emp
iden
Bus
Set
Adv
emic circle
ents to inte
it also al
rience to s
e-Learnin
Advantech
om, core
s and eve
ws employe
sophy and
are enable
n the lates
ing free o
ltaneously
ssing infor
wledge effe
wledge prof
efficiency c
site content
vantech Ph
part Advan
ployees a
ntification a
siness Lea
forth the
vantech Bu
es are avai
grate theo
lows the
serve as a
ng
h e-Learni
values an
ents, and
ees aroun
d its corpor
ed to
st informat
f geograp
and com
rmation fro
ectively br
file and ma
collaboratio
ts:
hilosophy:
ntech wisd
around the
and consen
dership Mo
spirit, the
usiness Lea
lable not o
ory and pra
industry to
heritage.
ing platfor
nd culture,
instructing
nd the wor
rate culture
tion accord
hical and
mmunicate
om all ove
roadens A
akes the m
on, integra
dom, core
e world
nsus.
odel:
knowledg
adership M
only for tea
ctice throu
o observe
rm, create
delivering
g professio
rld to find
e through
ding their o
time cons
with colle
er the wor
Advanteche
most of the
tion & leve
e values a
to enhanc
e profile,
Manageme
ching purp
gh Case S
each othe
d for imp
g the com
onal know
out Adva
online lear
own needs
straints, an
eagues all
rld in the
ers’ global
learning re
erage. List
and cultur
ce the c
and the a
nt Process
poses, but
Study;at th
er and ex
parting Adv
mpany’s im
wledge and
antech's b
rning. Mea
s to learn,
nd they ca
l over the
exclusive
perspecti
esources t
ted below
re to ena
corporate
actual prac
s.
also for
he same
xchange
vantech
mportant
d skills,
usiness
anwhile,
making
an learn
e world;
field of
ive and
to reach
are the
ble our
cultural
ctices of
107

Professional courses:
Offer various types of professional knowledge and skills training,
expecting our employees will be more proficient at work.
New employee Orientation:
Provide a variety of policies and guidelines for the newcomers so that
they will know well their work quickly.
Advantech Scholar:
It provides the information Advantechers must know, such as the
interview articles of Advantech senior level managers, business cases in
cooperation with professors, Advantech quarterly and Advantech
abbreviation dictionary.
Advantech Important Events:
It provides videos and contents of the company’s important activities,
allowing employees around the world to know about the spirit and the
meaning of Advantech important events.
Management LEAP Camp
In order to accelerate the cultivation of mid-level managers, Advantech
has developed “Management LEAP Camp” through the design of
branding to impart the culture and business philosophy unique to
Advantech. This program allows the excellent mid-level managers to be
involved in the company’s decision-making on major issues, and
executives and the elite will have more interactions so that the future
leaders can be discovered.
Champion Program’s two-stage course design has its strategic meaning
from its content planning to the venue of course. In terms of the venue, in
order to give the attendees a whole picture of the company’s
management, the stage-one course took place at the headquarters in
Taipei, enabling the elite trainees to grasp the core values and culture of
the headquarters in Taipei and improving the interaction between the
trainees and senior-level managers;the stage-two course was held in
Kunshan, China (Manufacturing and R&D Center). It aimed to make the
trainees have a profound understanding and experience on the
operations of value chain from product planning, development, sampling,
to manufacturing.
The course planning adopted the approach of multi-faceted cultivation -
Case Study, Study Group, Pre-Assignment, and Essay, and the contents
are described as follows:
Case Study- Studying the cases of Advantech major issues, the trainees
discuss on the enhancement or the improvement of the issues with senior
108

level managers and offer their suggestions to the company, enabling the
trainees to take part in the operation.
Study Group- (such as From A to A+, Kazuo Inamori's "Amoeba operating”
concept)- By previewing the book, the trainees will understand the
operator's business philosophy, and they will do the presentations in class
to share their own views and interact with and learn from managers and
other trainees.
Pre-assignment- Through the Assignment, the trainees will learn about
leadership and teamwork, expecting to enhance the trainees’ team spirit
by ways of Assignment and to make them understand all aspects of the
company.
Essay -At the end of stage-one course, Advantech’s major issues will be
presented in top-down and bottom-up manner, and during the
development of their dissertations, the trainees are able to continuously
discuss with senior level managers, the units related to the issues, and
other trainees, offer the practicable action plan in response to the issues,
and make the presentation in stage-two course. Through Essay, the
trainees can participate in the company’s decision-making, learn about
how senior managers integrate and coordinate major issues, and
establish practical experience;after the paper is published, the action
plan in the Essay will be delivered to the responsible unit and have it
executed faithfully and kept for record and control.
Global Elite LEAP Camp
LEAP means Jump, signifying the hope that every trainee will make huge
progress, and its symbolic connotation refers to” Learn,” ” Experience,
“Alignment” & “Partnership”. LEAP Camp will invite new employees from
all over the world to Advantech headquarters every year, and the training
of a five-day global camp aims to enhance the employees’ professional
knowledge and skills and make them experience Advantech's culture and
core values, allowing them to interact and get into contact with the
partners from the world so as to achieve global collaboration.
The course design of LEAP Camp is divided into Sales Track, Marketing
Track, and AE Track in accordance of the duties of the trainees, and each
Track’s content focuses on the field of expertise in each Track, enabling
the trainees to grow by way of LEAP Camp while experiencing
Advantech's culture.
Study Group
Our CEO is convinced that "all supervisors can build the team consensus
109
by reading a book together." Advantech Reading Club holds reading
parties on a regular basis. Outside experts and scholars in the fields of
business management, operational planning and others, or mid-to-senior
level managers from the affiliated companies are invited to develop
concepts and introduce innovative management concepts, which
continually refines Advantech’s management model and thus leads to the
formation of key business strategy. As the prime directive of Advantech
towards talent says,” Right People on Bus- finding right people before
deciding what to do,” and this policy is quoted from the book, “Good to
Great” written by Jim Collins.
Temporary Coverage Assignment Program , TCAP
In order to expand the Advantech elite’s global perspective and
experience, the company offers short-term and task-based overseas
dispatch opportunities (dispatch rotation period ranging from 3 to 6
months) for the major, top-down, emerging markets, emerging
opportunities. It gives employees the chance to face different challenges
and grow. Through the variance of working environment and position, the
talents will develop diverse international perspectives and acquire
valuable experience by achieving the goal of the short-term task.
The internal rotation and station assignment is also the best way to help
build up the international perspective of the elites. Plan short-term TCAP
program so that the personnel can develop a diversified international
perspective through the change of working environment and job rotations
in order to achieve the short-term assignment and gather valuable
experience.
For example, in 2018, the total amount invested in the education and
training of staff was NT$33.31 million with an average of 40.77 hours
training for each employee. The colleagues continue to grow as a person
and career planning through the training program of the Company.
3. Retirement system and the status of its implementation, including the old
system and the new system:
(1)Old system: The employees who had reported to duty before June 30,
2005 may choose discretionally between the new system and old
system. The Company in accordance with the provisions of the Labor
Standards Law provides a retirement plan for all formal employees.
According to the retirement plan, pension payment is paid in
accordance with the average years of service and the average salary
six months prior to the retirement. The Company has pension reserve
appropriated monthly and has it handled by the Labor Pension
110

Reserve Committee and then deposited in the name of the Committee
with the Bank of Taiwan.
(2) New system: The employees who have reported to duty since July 1,
2005 are subject to the new system, as well as the employees who had
reported to duty before July 1, 2005 but chose to apply the new system.
The Company has an amount equivalent to 6% of the monthly wages
and salaries appropriated to the pension account of each employee.
Employees may also set aside an amount equivalent to 0%-6% of the
monthly wages and salaries discretionally to the pension account and
the appropriated amount will be deducted from the monthly paycheck
of the respective employee.
4. Agreement between employer and employees:
The Company upholds the concepts of “Unified employer and employee”
and “Coexistence” and applies reasonable and humane management with
an “Openness” method to establish a smooth communication channel, to
maintain a good labor relation, to work together for higher productivity, to
share profits, and to establish a stable and harmonious labor relation.
The Company has always upheld the principle of “fairness and impartiality”
and “reasonableness and lawfulness” within the consideration of
sentiment and legality to communicate and coordinate with the employees
in recent years. Explain the difficulties and problems faced by the
Company adequately and express the position and assertion of the
Company. Respect each other and agree with each other so that both
parties will be able to resolve disputes and improve labor relation with
both parties treated fairly and justly. Therefore, the Company has never
suffered any loss due to labor disputes; moreover, both parties are able to
work together for professional development and labor welfare.
5. The protection measures for employee’s benefits:
The Company has Labor Welfare Committee and Labor Pension Reserve
Committee established lawfully to plan, appropriate, reserve, and apply
the benefit funds and pension reserves, and the matters regulated by the
relevant law and regulations; also, has the employee’s benefits and
welfare system implemented in accordance with the specifications.
(II) Labor/employer dispute loss incurred in the most recent year and up to the
publication of the annual report; also, disclosing estimated current and future
loss and its countermeasure: None
5.6 Important Contracts: None
111

VI. FINANCIAL INFORMATION 6.1 Condensed Balance Sheet, Income Statement, Name of the Auditors and Audit opinions
with the last five years
(I) Condensed Balance Sheet and comprehensive Income Statement
Condensed Balance Sheets
Year
Item
Financial Data within the last 5 years (Note 1) Financial data up to
March 31, 2019 (Note 2)
2018 2017 2016 2015 2014
Current Assets 25,366,573 23,200,572 21,181,711 18,085,746 17,990,032 26,947,896
Property, plant, and equipment 9,782,781 9,967,332 10,089,836 9,576,879 8,876,606 9,854,043
Intangible assets 1,095,899 1,124,407 1,317,440 227,686 286,312 1,067,006
Other assets 7,691,819 6,411,458 5,949,966 6,088,822 4,390,870 8,994,829
Total assets 43,937,072 40,703,769 38,538,953 33,979,133 31,543,820 46,863,774
Current Liabilities
Before distribution 12,146,590 11,046,661 11,435,611 9,242,530 7,779,820 12,574,102
After distribution (註 3) 15,647,075 15,423,978 13,033,648 11,567,075 (註 3)
Noncurrent liabilities 2,249,896 1,896,668 1,716,445 1,282,826 1,230,981 2,647,637
Total liabilities Before distribution 14,396,486 12,943,329 13,152,056 10,525,356 9,010,801 15,221,739
After distribution (註 3) 17,543,743 17,140,423 14,316,474 12,798,056 (註 3)
Shareholder’s equity attributable to parent
company 29,302,703 27,581,074 25,213,582 23,307,501 22,346,019 31,274,496
Capital stock 6,986,955 6,972,825 6,330,841 6,318,531 6,312,091 6,990,755
Additional paid-in capital 7,073,348 6,554,842 6,058,884 5,587,555 5,306,958 7,179,266
Retained
earnings
Before distribution 16,041,163 14,423,062 12,909,061 11,061,291 9,825,337 17,657,977
After distribution (註 3) 9,822,648 8,920,694 7,270,173 6,038,082 (註 3)
Other equity (798,763) (369,655) (85,204) 340,124 901,633 (553,502)
Treasury stock - - - - - -
Non-controlling equity 237,883 179,366 173,315 146,276 187,000 367,539
Total equity Before distribution 29,540,586 27,760,440 25,386,897 23,453,777 22,533,019 31,642,035
After distribution (註 3) 23,160,026 21,398,530 19,662,659 18,745,764 (註 3)
Note 1: For the financial data with the IFRS adopted for less than five years, the financial data in Table (II) should be prepared in accordance with the Financial Accounting Standards of the R.O.C. The 2014~2018 financial data were audited by the CPA.
Note 2: The 2019Q1 financial data were reviewed by the CPA. Note 3: The proposal for the distribution of the 2018 earnings is yet to be resolved in the shareholders’ meeting.
112

Condensed Balance Sheet - Proprietary
Year
Item
Financial Data within the last 5 years (Note 1) Financial data up
to March 31, 20182018 2017 2016 2015 2014
Current assets 14,946,607 12,153,703 10,361,304 7,853,529 9,411,709
Property, plant, and
equipment 6,752,642 6,865,025 6,938,084 6,278,109 5,354,959
Intangible assets 105,532 75,584 78,321 74,049 86,240
Other assets 19,237,645 18,385,713 17,179,706 17,059,718 14,626,214
Total assets 41,042,426 37,480,025 34,557,415 31,265,405 29,479,122
Current
liabilities
Before
distribution 9,860,591 8,450,778 8,109,627 6,816,368 6,038,793
After
distribution (註 2) 13,051,192 12,097,994 10,607,486 9,826,048
Noncurrent liabilities 1,879,132 1,448,173 1,234,206 1,141,536 1,094,310
Total
liabilities
Before
distribution 11,739,723 9,898,951 9,343,833 7,957,904 7,133,103
After
distribution (註 2) 14,499,365 13,332,200 11,749,022 10,920,358
Capital stock 6,986,955 6,972,825 6,330,841 6,318,531 6,312,091
Additional paid-in capital 7,073,348 6,554,842 6,058,884 5,587,555 5,306,958
Retained
earnings
Before
distribution 16,041,163 14,423,062 12,909,061 11,061,291 9,825,337
After
distribution (註 2) 9,822,648 8,920,694 7,270,173 6,038,082
Other equity (798,763) (369,655) (85,204) 340,124 901,633
Total equity Before
distribution 29,302,703 27,581,074 25,213,582 23,307,501 22,346,019
After
distribution (註 2) 22,980,660 21,225,215 19,516,383 18,558,764
Note 1: The 2014~2018 financial data were audited by the CPA. Note 2: The proposal for the distribution of the 2018 earnings is yet to be resolved in the shareholders’ meeting.
113

Condensed Income Statement
Year
Item
Financial Data within the last 5 years (Note 1) Financial data up to
March 31, 2019
(Note 2) 2018 2017 2016 2015 2014
Operating income 48,726,518 44,374,751 42,002,198 38,000,582 35,731,699 12,300,590
Gross Profit 18,663,448 17,380,958 17,117,549 15,344,990 14,392,664 4,724,054
Operating profit or loss
7,467,399 6,778,477 6,631,493 5,928,507 5,508,324 1,858,169
Non-Operating income and expense
527,090 755,066 465,872 361,028 546,621 196,380
Net income before tax 7,994,489 7,533,543 7,097,365 6,289,535 6,054,945 2,054,549
Net income of continuing operations 6,316,748 6,149,289 5,688,954 5,126,975 4,931,876 1,622,869
Net income 6,316,748 6,149,289 5,688,954 5,126,975 4,931,876 1,622,869
Other comprehensive profit and loss (net) (492,463) (307,450) (465,097) (598,879) 840,142 274,046
Total current comprehensive profit and loss 5,824,285 5,841,839 5,223,857 4,528,096 5,772,018 1,896,915
Net income attributable to parent company’s shareholders 6,294,657 6,156,516 5,666,862 5,104,346 4,907,648 1,617,358
Net income attributable to non-controlling equity 22,091 (7,227) 22,092 22,629 24,228 5,511
Total comprehensive profit and loss attributable to parent company’s shareholders 5,807,959 5,850,991 5,217,251 4,524,603 5,750,571 1,861,801
Total comprehensive profit and loss attributable to non-controlling equity 16,326 (9,152) 6,606 3,493 21,447 35,114
Earnings per share 9.02 8.84 8.15 8.08 7.80 2.31
Note 1: The 2019Q1 financial data were reviewed by the CPA.
114

Condensed Income Statement - Proprietary
Year
Item
Financial Data within the last 5 years (Note 1) Financial data up to
March 31, 2019 2018 2017 2016 2015 2014
Operating income 35,382,776 30,900,577 30,501,099 28,995,652 26,297,138
Gross profit 10,646,905 9,380,105 8,896,852 8,237,078 7,029,911
Operating profit or loss 5,933,437 4,845,682 4,777,417 4,181,323 3,315,662
Non-Operating income and expense 1,700,703 2,298,307 1,866,279 1,691,178 2,333,849
Net income before tax 7,634,140 7,143,989 6,643,696 5,872,501 5,649,511
Net income 6,294,657 6,156,516 5,666,862 5,104,346 4,907,648
Other comprehensive profit and loss (net) (486,698) (305,525) (449,611) (579,743) 842,923
Total current comprehensive profit and loss 5,807,959 5,850,991 5,217,251 4,524,603 5,750,571
Earnings per share 9.02 8.84 8.15 8.08 7.80
Note 1: The 2014~2018 financial data were audited by the CPA.
6.1.2 The name and opinion of the independent auditor within the last 5 year
Year Name of CPA Firm Name of CPAs
(Certified Public Accountant)
Auditor’s opinions
2018 Deloitte & Touche CPA Jr Shian Ke / CPA Meng Chieh Chiu Modified Unqualified
opinion
2017 Deloitte & Touche CPA Meng Chieh Chiu / CPA Jr Shian Ke Modified Unqualified opinion
2016 Deloitte & Touche CPA Meng Chieh Chiu / CPA Chin Hsiang Chen Modified Unqualified opinion
2015 Deloitte & Touche CPA Meng Chieh Chiu / CPA Chin Hsiang Chen Modified Unqualified opinion
2014 Deloitte & Touche CPA Meng Chieh Chiu / CPA Chin Hsiang Chen Modified Unqualified opinion
115

6.2 Financial Analysis within the last 5 years
(I) Financial Analysis - consolidated
Year (Note 1)
Analysis item
(Note 3)
Financial analysis within the last 5 years As of March 31, 2019 (Note 2)
2018 2017 2016 2015 2014
Finance structure
(%)
Debt to assets ratio
32.77 31.80 34.13 30.98 28.55 32.48
Long term funds to
property, plant, and
equipment ratio 324.96 297.54 268.62 258.30 266.88 347.98
Solvency(%
)
Current ratio (%) 208.84 210.02 185.23 195.68 229.06 214.31
Quick ratio (%) 142.31 149.48 132.00 138.06 161.64 144.59
Interest coverage ratio 170,740.11 62,273.33 61,517.14 62,738.53 42,091.03 33,372.05
Operatin
g ability
Receivables turnover (times) 6.01 5.83 6.09 6.16 6.34 5.78
Accounts receivable
collecting days 60.73 62.60 59.93 59.25 57.57 63.14
Inventory turnover (times) 4.36 4.56 4.76 4.70 4.39 3.85
Payables turnover (times) 5.42 5.26 6.06 7.09 6.67 5.24
Average inventory turnover
on sales 83.71 80.04 76.68 77.65 83.14 94.8
Property, plant, and property
turnover (times) 4.93 4.42 4.27 4.12 4.25 5.01
Total asset turnover (times) 1.15 1.12 1.16 1.16 1.21 1.08
Profitability
Return on assets (%) 14.93 15.55 15.72 15.67 20.54 14.34
Return on equity (%) 22.05 23.14 23.30 22.30 23.51 21.22
Ratio of net income before
tax to paid-in capital (%)
(Note 7) 114.42 108.04 112.11 93.83 87.27 117.56
Profit margin (%) 12.96 13.86 13.54 13.49 13.80 13.19
Earnings Per Share (NT$) 9.02 8.84 8.15 8.08 7.80 2.31
Cash flow
Cash flow ratio (%) 61.13 27.26 70.08 63.88 62.53 8.34
Cash Flow Adequacy Ratio
(%) 92.44 91.61 103.81 93.25 89.33 92.44
Cash Flow Re-investment
Ratio (%) 9.29 -3.49 17.16 9.36 8.31 3.18
Levera
ge
Operating leverage 3.05 3.11 3.32 3.48 3.70 2.55
Financial leverage 1.00 1.00 1.00 1.00 1.00 1.00
116
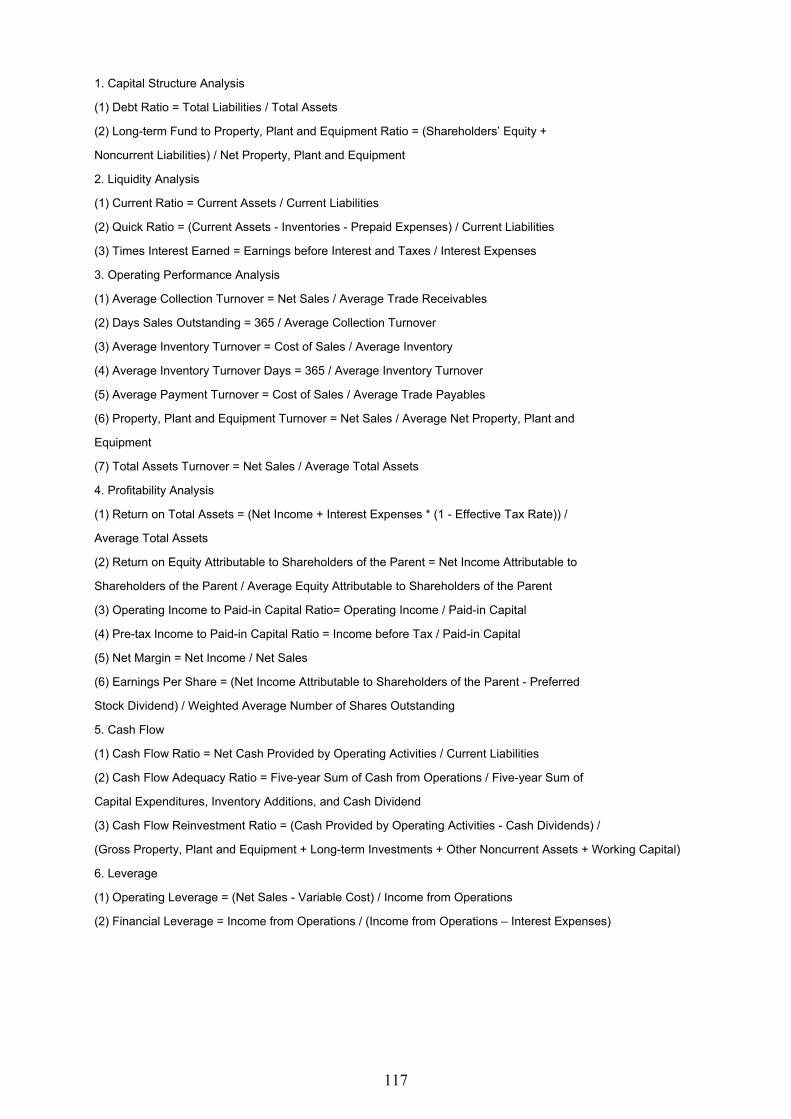
1. Capital Structure Analysis
(1) Debt Ratio = Total Liabilities / Total Assets
(2) Long-term Fund to Property, Plant and Equipment Ratio = (Shareholders’ Equity +
Noncurrent Liabilities) / Net Property, Plant and Equipment
2. Liquidity Analysis
(1) Current Ratio = Current Assets / Current Liabilities
(2) Quick Ratio = (Current Assets - Inventories - Prepaid Expenses) / Current Liabilities
(3) Times Interest Earned = Earnings before Interest and Taxes / Interest Expenses
3. Operating Performance Analysis
(1) Average Collection Turnover = Net Sales / Average Trade Receivables
(2) Days Sales Outstanding = 365 / Average Collection Turnover
(3) Average Inventory Turnover = Cost of Sales / Average Inventory
(4) Average Inventory Turnover Days = 365 / Average Inventory Turnover
(5) Average Payment Turnover = Cost of Sales / Average Trade Payables
(6) Property, Plant and Equipment Turnover = Net Sales / Average Net Property, Plant and
Equipment
(7) Total Assets Turnover = Net Sales / Average Total Assets
4. Profitability Analysis
(1) Return on Total Assets = (Net Income + Interest Expenses * (1 - Effective Tax Rate)) /
Average Total Assets
(2) Return on Equity Attributable to Shareholders of the Parent = Net Income Attributable to
Shareholders of the Parent / Average Equity Attributable to Shareholders of the Parent
(3) Operating Income to Paid-in Capital Ratio= Operating Income / Paid-in Capital
(4) Pre-tax Income to Paid-in Capital Ratio = Income before Tax / Paid-in Capital
(5) Net Margin = Net Income / Net Sales
(6) Earnings Per Share = (Net Income Attributable to Shareholders of the Parent - Preferred
Stock Dividend) / Weighted Average Number of Shares Outstanding
5. Cash Flow
(1) Cash Flow Ratio = Net Cash Provided by Operating Activities / Current Liabilities
(2) Cash Flow Adequacy Ratio = Five-year Sum of Cash from Operations / Five-year Sum of
Capital Expenditures, Inventory Additions, and Cash Dividend
(3) Cash Flow Reinvestment Ratio = (Cash Provided by Operating Activities - Cash Dividends) /
(Gross Property, Plant and Equipment + Long-term Investments + Other Noncurrent Assets + Working Capital)
6. Leverage
(1) Operating Leverage = (Net Sales - Variable Cost) / Income from Operations
(2) Financial Leverage = Income from Operations / (Income from Operations – Interest Expenses)
117

Financial Analysis - Proprietary
Year
Analysis item
Financial analysis within the last 5 years
2018 2017 2016 2015 2014
Finance
structure
(%)
Debt to assets ratio
28.6 26.41 27.04 25.45 24.18
Long term funds to property,
plant, and equipment ratio 461.77 422.86 381.20 389.43 437.73
Solvency (%
)
Current ratio (%) 151.58 143.82 127.77 115.22 155.85
Quick ratio (%) 114.32 111.85 103.42 89.78 131.44
Interest coverage ratio 23,133,857.58 - 159,689.14 - 1,342,064.85
Operating ability
Receivables turnover (times) 5.27 5.27 5.71 5.67 5.82
Accounts receivable collecting days 69.25 69.25 63.92 64.37 62.7
Inventory turnover (times) 7.87 9.38 11.97 13.49 13.42
Payables turnover (times) 4.83 4.92 5.58 6.11 6.57
Average inventory turnover on
sales 46.37 38.91 30.49 27.05 27.2
Property, plant, and property
turnover (times) 5.2 4.48 4.62 4.99 5.28
Total asset turnover (times) 0.9 0.86 0.93 0.95 0.96
Profitability
Return on assets (%) 16.03 17.09 17.23 16.81 17.92
Return on equity (%) 22.13 23.32 23.36 22.36 23.59
Ratio of net income before tax to
paid-in capital (%) (Note 7) 109.26 102.45 104.94 92.94 89.51
Profit margin (%) 17.79 19.92 18.58 17.60 18.66
Earnings Per Share (NT$) 9.02 8.84 8.15 8.08 7.80
Cash flow
Cash flow ratio (%) 48.72 39.96 64.88 67.97 61.81
Cash Flow Adequacy Ratio (%) 71.62 77.43 81.29 76.46 79.82
Cash Flow Re-investment Ratio (%) 0.64 -2.10 5.62 3.84 3.22
Leverage
Operating leverage 3.55 3.89 4.10 4.46 5.31
Financial leverage
1.00 1.00 1.00 1.00 1.00
118

*Glossary
1. Capital Structure Analysis
(1) Debt Ratio = Total Liabilities / Total Assets
(2) Long-term Fund to Fixed Assets Ratio = (Shareholders’ Equity + Long-term Liabilities) / Net
Fixed Assets
2. Liquidity Analysis
(1) Current Ratio = Current Assets / Current Liabilities
(2) Quick Ratio = (Current Assets - Inventories - Prepaid Expenses) / Current Liabilities
(3) Times Interest Earned = Earnings before Interest and Taxes / Interest Expenses
3. Operating Performance Analysis
(1) Average Collection Turnover = Net Sales / Average Trade Receivables
(2) Days Sales Outstanding = 365 / Average Collection Turnover
(3) Average Inventory Turnover = Cost of Sales / Average Inventory
(4) Average Inventory Turnover Days = 365 / Average Inventory Turnover
(5) Average Payment Turnover = Cost of Sales / Average Trade Payables
(6) Fixed Assets Turnover = Net Sales / Average Net Fixed Assets
(7) Total Assets Turnover = Net Sales / Average Total Assets
4. Profitability Analysis
(1) Return on Total Assets = (Net Income + Interest Expenses * (1 - Effective Tax Rate)) /
Average Total Assets
(2) Return on Equity = Net Income / Average Shareholders’ Equity
(3) Operating Income to Paid-in Capital Ratio = Operating Income / Paid-in Capital
(4) Pre-tax Income to Paid-in Capital Ratio = Income before Tax / Paid-in Capital
(5) Net Margin = Net Income / Net Sales
(6) Earnings Per Share = (Net Income - Preferred Stock Dividend) / Weighted Average Number
of Shares Outstanding
5. Cash Flow
(1) Cash Flow Ratio = Net Cash Provided by Operating Activities / Current Liabilities
(2) Cash Flow Adequacy Ratio = Five-year Sum of Cash from Operations / Five-year Sum of
Capital Expenditures, Inventory Additions, and Cash Dividend
(3) Cash Flow Reinvestment Ratio = (Cash Provided by Operating Activities - Cash Dividends) /
(Gross Fixed Assets + Long-term Investments + Other Assets + Working Capital)
6. Leverage
(1) Operating Leverage = (Net Sales - Variable Cost) / Income from Operations
(2) Financial Leverage = Income from Operations / (Income from Operations – Interest Expenses)
119

6.3 Audit Committee’s Report for the Most Recent Year
Audit Committee’s Review Report
The Audit Committee has adopted the Company’s 2018 Financial Statements
resolved by the Board of Directors. Deloitte & Touche was retained by the Board of
Directors to audit the Company’s Financial Statements. Deloitte & Touche has
completed the audit procedures and issued the audit report.
The Company’s 2018 Business Report and proposal for distribution of earnings
submitted by the Board of Directors have also been reviewed by the Audit Committee
and determined to be in conformity with the Company Act and related regulations.
According to Article 14-4 of Securities and Exchange Act and Article 219 of the
Company Act, this report is hereby prepared.
Advantech Co., Ltd. 2019 Shareholders’ Meeting
Convener : Benson Liu
March 08, 2019
120

6.4 Financial Statements of the most recent year: Please refer to above first
attachment 6.5 The consolidated financial statements of the parent and subsidiary audited by the
CPA in the most recent year : Please refer to above second attachment
6.6 Financial difficulties, if any, encountered by the Company and its affiliated
companies in the most recent year and up to the publication of the annual report,
and its impact on the Company’s financial status: None
121

VII. Review of Financial Conditions, Financial Performance, and Risk Management
7.1 Financial Conditions:
Unit: NT$ Thousand
Year Item 2018 2017
Difference Amount %
Current assets 25,366,573 23,200,572 2,166,001 9.34%
Property, plant,
and equipment 9,782,781 9,967,332 (184,551) (1.85%)
Intangible
assets
1,095,899 1,124,407(28,508) (2.54%)
Other assets 7,691,819 6,411,458 1,280,361 19.97%
Total assets 43,937,072 40,703,769 3,233,303 7.94%
Current liabilities 12,146,590 11,046,661 1,099,929 9.96%
Noncurrent liabilities 2,249,896 1,896,668
353,228 18.62%
Total liabilities 14,396,486 12,943,329 1,453,157 11.23%
Capital stock 6,986,955 6,972,825 14,130 0.20%
Additional paid-in capital
7,073,348 6,554,842518,506 7.91%
Retained earnings
16,041,163 14,423,0621,618,101 11.22%
Other equity (798,763) (369,655) (429,108) 116.08%
Non-controlling equity
237,883 179,366 58,517 32.62%
Total equity 29,540,586 27,760,440 1,780,146 6.41%
122

7.2 Analysis of Financial Status
Unit: NT$ Thousand
Year
Item 2018 2017 Increased or decreased amount
Ratio change
(%)
Operating income 48,726,518 44,374,751 4,351,767 9.81%
Operating cost 30,063,070 26,993,793 3,069,277 11.37%
Gross profit 18,663,448 17,380,958 1,282,490 7.38%
Operating expense 11,196,049 10,602,481 593,568 5.60%
Operating profit 7,467,399 6,778,477 688,922 10.16%
Non-operating income
and expense 527,090 755,066 (227,976) (30.19)%
Net income before tax 7,994,489 7,533,543 460,946 6.12%
Income tax expense 1,677,741 1,384,254 293,487 21.20%
Net income 6,316,748 6,149,289 167,459 2.72%
Annual other comprehensive profit and loss (Net) (492,463) (307,450) (185,013) 60.18%
Annual total comprehensive net income 5,824,285 5,841,839 (17,554) (0.30)%
Net income attributable to the shareholder’s equity of the parent company 6,294,657 6,156,516 138,141 2.24%
Total comprehensive profit and loss attributable to the shareholder’s equity of the parent company 5,807,959 5,850,991 (43,032) (0.74)%
123
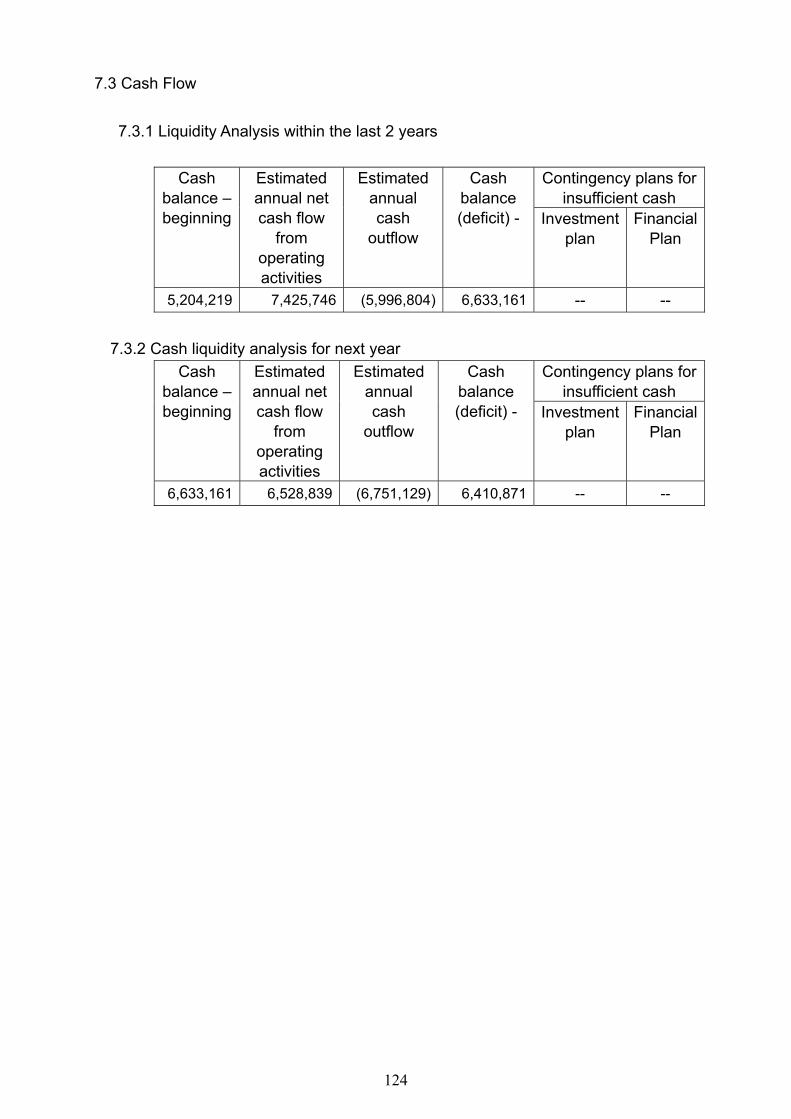
7.3 Cash Flow
7.3.1 Liquidity Analysis within the last 2 years
Cash balance – beginning
Estimated annual net cash flow
from operating activities
Estimated annual cash
outflow
Cash balance (deficit) -
Contingency plans for insufficient cash
Investment plan
Financial Plan
5,204,219 7,425,746 (5,996,804) 6,633,161 -- --
7.3.2 Cash liquidity analysis for next year
Cash balance – beginning
Estimated annual net cash flow
from operating activities
Estimated annual cash
outflow
Cash balance (deficit) -
Contingency plans for insufficient cash
Investment plan
Financial Plan
6,633,161 6,528,839 (6,751,129) 6,410,871 -- --
124

7.4 The impact of material capital expenditure on financial business in the most recent year:
Project Actual or intended financing
Actual or intended
completion date
Total funds needed
Actual or intended use of funds
2018 2019 2020 2021
Plant purchase (construction) –Linkou Campus Phase 3
Equity fund 2021.12 1,050,000 - 630,000 210,000 210,000
Overseas reinvestment –NipponRAD
Equity fund 2018.06 297,647 297,647 - - -
Domestic reinvestment - AzureWave
Equity fund 2018.11 578,563 578,563 - - -
Domestic reinvestment - MILDEX Equity fund 2018.10 202,948 202,948 - - -
(I) Advantech Linkou Campus: In response to the global carbon reduction requirements and the development of networking technology, the Advantech Campus in Linkou was built into a pioneering experimental field of smarter buildings so as to realize the two iBuilding Solutions composed of intelligent energy management and intelligent space management.
(II) Overseas reinvestment (NipponRAD ):Advantech and Nippon RAD officially form a strategic alliance on a co-creation model between a platform provider and a system integrator, aiming to further expand the business scope in IIoT and machine-to-intelligence (M2I) sectors in Japan. Domestic reinvestment (AzureWave): The Board of Directors made the decision to agree that Advantech Corporate Investment acquire common stocks of AzureWave Technologies ,Inc. Through this strategic alliance,the wifi modules market will be adopted to construct the industrial IoT (IIoT) ecosystem and strengthen the influence of vertical domains. Domestic reinvestment (MILDEX): The subsidiary Advaninvest (whose 100% of shares is held by the Company) has acquired 15% of shares (15,710,000 shares of common stock) of MILDEX via subscription by a payment of NT$ 200 million.
7.5 Reinvestment policy in the most recent year, the reasons for profit or loss resulted, its improvement plan, and next year’s investment plan: Advantech adopts reinvestment of equity method with all focusing on long-term strategic purposes; in 2018, the profits of Advantech reinvestment of equity method reached NT$ 95,635, with an increase of NT$ 123,016 compared to the previous year, which resulted from the recognition of Axiomtek Co., Ltd. In the future, Advantech will hold the principle of long-term strategic investment and continue assessing carefully reinvestment plans.
7.6 Risk analysis and evaluation (I) Interest rates, exchange rates, and inflation, their impact on the Company’s profit or loss,
and future countermeasures: The Company has sufficient proprietary capital and sound financial structure; therefore, is from the risk of increasing capital cost. The capital planning is based on a conservative and sound principle with the focus on the security and mobility; also, regularly evaluate money market rates and financial information. In terms of exchange rate, the Company has a clear foreign exchange policy stipulated; also, a strict control of the procedures is for hedging risk instead of adopting active operation to gain profits. In terms of inflation, the main sales markets of the Company are without any sign of inflation in recent years, which has not significant impact on the Company’s operations.
(II) Engage in the policies of high-risk, highly-leveraged investments, loaning of funds, endorsements and guarantees, and derivative transactions, the reasons for profit or loss resulted, and the future countermeasures:
125

The Company has each investment project evaluated prudently and handled in accordance with the “Procedures for the Acquisition and Disposal of Assets” and the limits of authority without engaging in any high-risk and highly-leveraged investments. In terms of loaning of funds and making of endorsements/guarantees, it is mainly arranged for the subsidiaries and sub-subsidiaries of the Company; also, it is to be processed in accordance with the Company’s “Procedures for Loaning of Funds” and “Procedures for Making of Endorsements/Guarantees.” In terms of financial derivatives, the purpose is to hedge the exchange rate risks arising from business operation; also, it is to be processed in accordance with the Company’s “Procedures for the Trading of Financial Derivatives.”
(III) Future R&D plans and the projected R&D investment: 1. Future R&D plans:
As an enabler of intelligent planet, Advantech is dedicated to building an industrial platform for accelerating IoT in practices. Since WISE-PaaS launched in 2014, Advantech has continued its integration and improved connectivity with open source communities. Advantech IoT software modules are developed to create operational cloud platform services oriented around the commercial value generated by data acquisition. Data-driven innovation has thus become the main target for our WISE-PaaS evolution. Our key R&D items in 2019 will be described as follows: a. Keep integrating with a diversity of industrial protocol, Advantech also plans to support the latest edge computing open standard, EdgeX Foundry which provide a scalable, flexible framework to enable seamless connectivity of more IoT edge devices and make development easy in any context. b. Enhance configurable data visualization tools in WISE-PaaS. WISE-PaaS/SaaS Composer supports customized component plotting for simple and intuitive 3D modeling application and interaction. It updates views at millisecond rates, and, together with WISE-PaaS/Dashboard, presents critical management data in a visually intuitive display to help extract valuable data and improve operational efficiency. c. Build an artificial intelligence training model and deployment service framework. The WISE-PaaS/AFS provides a simple drag and drop interface that allows developers to quickly input industrial data. When combined with AI algorithms, the service builds an effective inference engine with automatic deployment to edge computing platforms. AFS offers model accuracy management, model retraining, and automated redeployment. It offers automated model accuracy improvements and life-cycle management services. d. Build up rich Solution Ready Platforms (SRP’s) for domain-focused applications, like smart manufacturing, retail, hospital,digital logistics and environmental conservation.
2. The projected R&D investment: 8% of the annual turnover. (IV) The impact of significant changes in domestic and foreign policies and law on the
Company’s financial operations and the countermeasures: There had not any significant changes in domestic and foreign policies and law that had a significant impact on the Company in the most recent year. In addition to irregularly collect and assess the impact of significant changes in domestic and foreign policies and law on the Company’s finance and business operation, the Company will consult relevant professionals to take countermeasures in a timely
126

manner. (V) The impact of changes in technology and industry on the Company’s financial operations
and the countermeasures: A complete IoT value chain from botton to top includes sensors, edge computing, communications, PaaS platform, SRPs, and cloud service operation. In view of the IoT application characteristics diversity, extensivity, and fragmentated market, Advantech has assisted industries in integrating and connecting existing hardware and software, and regards creating a complete industry value chain as its primary task in IoT industry development. Advantech understands that for this chain to be fully executed and for application landing population, the key of success lies in adequate collaboration and integration between the platform technology supplier and industry professionals to create standardized and replicable IoT solutions with combined software and hardware systems. No single company can deal with the whole value proposition, and the most effective way is to collaborate with external partners with one sharing platform. Advantech proposed two types of co-creation models from 2018: a. Solution Ready Package(SRP) Co-creation: cooperates with software providers that
expertise in the field of smart factory, industry 4.0, environmental conservation, smart city, intelligent retail, hospital and digital logistics to develop a sellable and replicable IoT Solution Ready Package(SRP) with Advantech WISE-PaaS and hardware platform supported. And leverage with Advantech global marketing and sales channel to promote the co-created SRP worldwide.
b. Domain-Focused Solution Integrator Co-creation: joint ventures and incubates a new IoT cloud services team with regional large-scale system integrators to sell standard SRP’s and facilitate implementation of IoT cloud solution in customers’ site.
(VI) The impact of changes in corporate image on the crisis management of the Company and the countermeasures: The Company is with a good corporate image. In addition to irregularly receive domestic and international juristic persons, technical symposium and corporate seminars are held on a regular basis to help the investors and customers understand the Company.
(VII) The expect benefit of initiating acquisition, the possible risks, and the countermeasures: 1. Advantech and its 100% owned subsidiary Advantech Japan (AJP) will own 50% and
30% stake respectively. OMRON Nohgata will be led by the current management team and will join Advantech’s Embedded IoT Business Group in developing new products and integrating sales resources. With this acquisition, Advantech will effectively expand its embedded system market share in Japan and enhance the localized manufacturing services capability. Also Advantech envisions to further cooperate with OMRON Corporation in IoT platform.
2. Advantech subscribed shares from the Turkish Company Alitek and issued new shares, and Advantech held 60% of shares of Alitek.
3.The above acquisitions were all carefully assessed by the Board, the possible risks of which may include the overall recession in the market and the demand falling short of expectations. In response to the risks, Advantech reduces costs by actively developing the innovative product technology and makes every effort to secure market share to maintain the stability of the company's revenue growth rate.
4. Lately and as of the date of printing the annual report, apart from the above matters, Advantech and its subsidiaries has had no other acquisition plans.
(VIII) The expected benefits of a plant expansion, the possible risks, and the countermeasures: To fulfill business growth and keep the self-manufacturing strategy, we had built one new
127

SMT line in Linkou and Kunshan separately last year.This year, we would not built new SMT but will invest iFactory solutions include automation machine and softward; The new plant of Chassis factory will start to operate that increase mechanical productive capacity in the last-half year .In conclusion, our planning with the area/factory can fulfill the growth for at least 5~8 years, and the investment of equipment will be according with products and business requirement, to ensure the balancing of business fulfillment and capacity stability.
(IX) Risks faced by the centralized purchase or sales and the countermeasures: The Company’s main source of raw materials is from the well-known domestic and international manufacturers that have a good reputation and product quality; also, have maintained a stable relation of cooperation with the Company and provide a stable supply of raw materials. In terms of sales, the Company is a market leader in brand with a smooth sales channel I service; therefore, the Company is free of any risk from the centralized purchase and sale.
(X) The impact of the massive equity transfer or exchange by the directors, supervisors, or shareholders holding more than 10% shareholding on the Company, the risk, and the countermeasures: None
(XI)The impact of the changes in the ownership on the Company, the risk, and the countermeasures: None
(XII)For litigation or non-litigation events, the closed or in-pending material litigation, non-litigation, or administrative contentious events, which may have a significant impact on the shareholder’s equity or security price, of the Company, the Company’s directors, supervisors, President, responsible person, shareholders holding more than 10% shareholding, and the subsidiaries should be illustrated: None
(XIII) Other important risks and countermeasures: None VII. Other Important matters: None
128

8. Affiliat 8.1 Aff O
ted compfiliated com
Organization
V
pany’s infompany’s Con Chart of
VIII. Sp
ormationonsolidatedthe Affiliate
pecial D
d Businessed Compa
Disclos
s Report anies
sure
129

8.1.2 Basic information of affiliated companies Unit: NT$ Thousand
No. Name Establishing Date
Address Paid-in capital Main Business or Production Items
01 Advanixs Corporation. Jan. 2006 Taipei NTD100,000 Manufacturing, marketing, and trade of industrial use PC
02 Advantech Corporate Investment
Feb. 2000 Taipei NTD1,500,000 Investment in marketable securities
03 Advantech Co. Singapore Pte, Ltd. (ASG)
Dec. 1995 Techplace, Singapore
SGD1,450 Marketing and trade of industrial use PC
04 Advantech Japan Co.,Ltd. (AJP)
Sep. 1997 Tokyo, Japan JPY60,000 Marketing and trade of industrial use PC
05 Advantech Australia Pty Ltd. (AAU)
Dec. 1994 Sydney, Australia
AUD500 Marketing and trade of industrial use PC
06 Advantech Co. Malaysia Sdn. Bhd (AMY)
Mar. 2006 Malaysia MYR2,000 Marketing and trade of industrial use PC
07 Advantech Europe Holding B.V. (AEUH)
Dec. 1995 Helmond, The Netherlands
EUR25,961 Overseas investment of manufacturing and service industry
08 Advantech Technology Co., Ltd. (ATC)
Sep. 1998 British Virgin Islands
USD33,850 Marketing and trade of industrial use PC
09 Advantech Automation Corp.(AAC(BVI))
Mar. 2000 British Virgin Islands
USD74,624 Overseas investment of manufacturing and service industry
10 Advantech Europe B.V.(AEU) Jun. 1998 Helmond,The Netherlands
EUR32,315 Marketing and trade of industrial use PC
11 Advantech Poland Sp. z.o.o(APL)
Jan. 2006 Warsaw, Poland
PLZ1,000 Marketing and trade of industrial use PC
12 Advantech Technology (China) Company., Ltd.(AKMC)
Nov. 2000 Jiangsu Province
USD43,750 Marketing and trade of industrial use PC
13 Advantech Corporation. (ANA)
Aug. 1987 Sunnyvale, USA
USD11,139 Assembly, marketing, and trade of industrial use PC
14 Beijing Yan Hua Xing Ye Electronics Science &Technology Co., Ltd. (ACN)
Apr. 1994 Beijing City USD4,230 Marketing and trade of industrial use PC
15 Advantech Technology (HK) Co., Limited(ATC HK)
Apr. 2008 Hong Kong USD57,891 Overseas investment of manufacturing and service industry
16 Advantech Automation Corp.(HK) Limited (AAC HK)
Dec. 2007 Hong Kong USD15,230 Overseas investment of manufacturing and service industry
17 Shanghai Advantech Intelligent Services Co., Ltd. (AiSC)
Sep. 2008 Shanghai City USD8,000 Marketing and trade of industrial use PC
18 Xi’An Advantech Software Co., Ltd. (AXA)
Sep. 2008 Xi’an USD1,000 Marketing and trade of industrial use PC
19 Advantech Brazil S/A (ABR) Apr. 2000 Sao Paulo, Brazil
BRL4,444 Marketing and trade of industrial use PC
20 Advantech Intelligent Service. Dec. 2009 Taipei City NTD10,000 Marketing and trade of industrial use PC
21 Advantech KR Co., Ltd. Feb. 2009 Seoul Korea KRW300,000 Marketing and trade of industrial use PC
22 Advantech Service-IoT GmbH.(A-SIoT)
Oct. 1984 Munich, Germany
EUR512 The industrial on-board computer product design, R&D, sales, and trading
23 Cermate Technology Inc. Mar. 2003 Taipei City NTD100,000 Electronic Components Manufacturing Industry
24 Advantech Corporation (Thailand) Co., Ltd.
Aug. 2004 Thailand THB10,000 The production and manufacturing of computer products
130
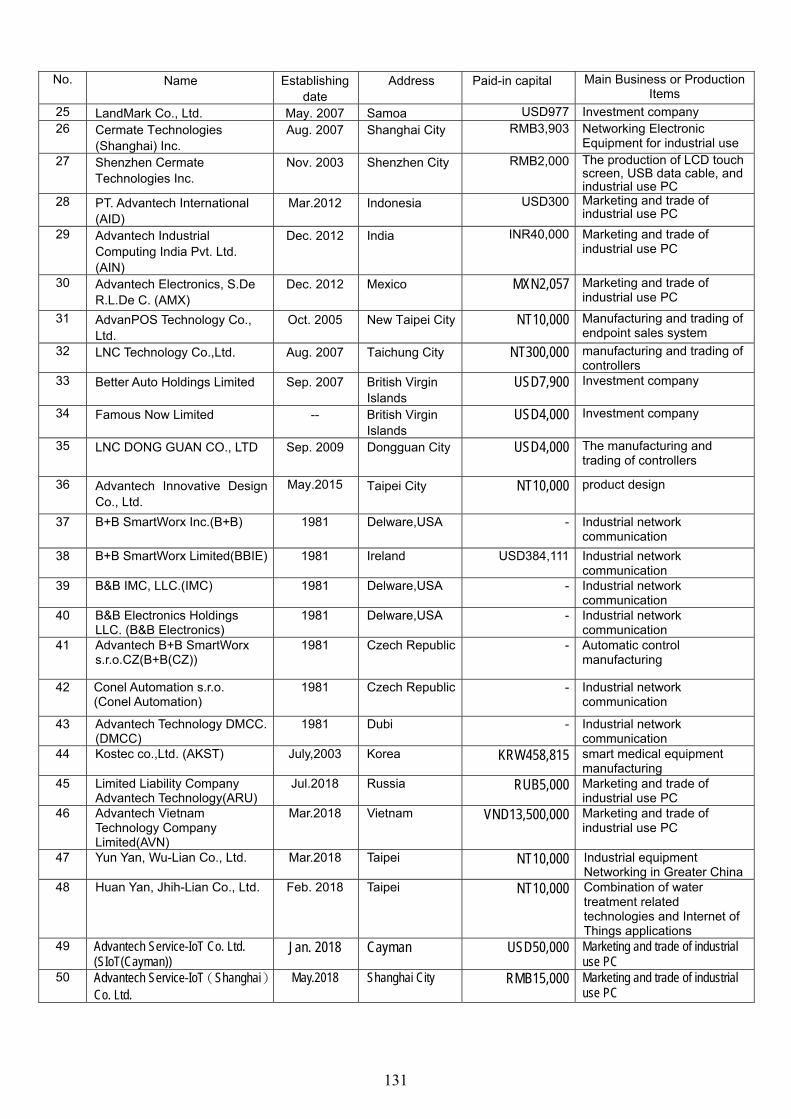
No. Name Establishing date
Address Paid-in capital Main Business or Production Items
25 LandMark Co., Ltd. May. 2007 Samoa USD977 Investment company 26 Cermate Technologies
(Shanghai) Inc. Aug. 2007 Shanghai City RMB3,903 Networking Electronic
Equipment for industrial use
27 Shenzhen Cermate Technologies Inc.
Nov. 2003 Shenzhen City RMB2,000 The production of LCD touch screen, USB data cable, and industrial use PC
28 PT. Advantech International (AID)
Mar.2012 Indonesia USD300 Marketing and trade of industrial use PC
29 Advantech Industrial Computing India Pvt. Ltd. (AIN)
Dec. 2012 India INR40,000 Marketing and trade of industrial use PC
30 Advantech Electronics, S.De R.L.De C. (AMX)
Dec. 2012 Mexico MXN2,057 Marketing and trade of industrial use PC
31 AdvanPOS Technology Co., Ltd.
Oct. 2005 New Taipei City NT10,000 Manufacturing and trading of endpoint sales system
32 LNC Technology Co.,Ltd. Aug. 2007 Taichung City NT300,000 manufacturing and trading of controllers
33 Better Auto Holdings Limited Sep. 2007 British Virgin Islands
USD7,900 Investment company
34 Famous Now Limited -- British Virgin Islands
USD4,000 Investment company
35 LNC DONG GUAN CO., LTD Sep. 2009 Dongguan City USD4,000 The manufacturing and trading of controllers
36 Advantech Innovative Design Co., Ltd.
May.2015 Taipei City NT10,000 product design
37 B+B SmartWorx Inc.(B+B) 1981 Delware,USA - Industrial network communication
38 B+B SmartWorx Limited(BBIE) 1981 Ireland USD384,111 Industrial network communication
39 B&B IMC, LLC.(IMC) 1981 Delware,USA - Industrial network communication
40 B&B Electronics Holdings LLC. (B&B Electronics)
1981 Delware,USA - Industrial network communication
41 Advantech B+B SmartWorx s.r.o.CZ(B+B(CZ))
1981 Czech Republic - Automatic control manufacturing
42 Conel Automation s.r.o. (Conel Automation)
1981 Czech Republic - Industrial network communication
43 Advantech Technology DMCC. (DMCC)
1981 Dubi - Industrial network communication
44 Kostec co.,Ltd. (AKST) July,2003 Korea KRW458,815 smart medical equipment manufacturing
45 Limited Liability Company Advantech Technology(ARU)
Jul.2018 Russia RUB5,000 Marketing and trade of industrial use PC
46 Advantech Vietnam Technology Company Limited(AVN)
Mar.2018 Vietnam VND13,500,000 Marketing and trade of industrial use PC
47 Yun Yan, Wu-Lian Co., Ltd. Mar.2018 Taipei NT10,000 Industrial equipment Networking in Greater China
48 Huan Yan, Jhih-Lian Co., Ltd. Feb. 2018 Taipei NT10,000 Combination of water treatment related technologies and Internet of Things applications
49 Advantech Service-IoT Co. Ltd. (SIoT(Cayman))
Jan. 2018 Cayman USD50,000 Marketing and trade of industrial use PC
50 Advantech Service-IoT(Shanghai)Co. Ltd.
May.2018 Shanghai City RMB15,000 Marketing and trade of industrial use PC
131

8.1.3 The Company does not have any other affiliated companies with a presumed controlling and dependency relationship according to Article 369.3 of the Company Law.
8.1.4 The overall affiliated company’s business operation covers the assembly of the computer,the marketing and sales, the trade of electronic control automation system equipment, the manufacturing, trade, and production of automation control equipment engineering, and the overseas investment of the service industry. The division of labor among the affiliated companies is as follows: A. Purchase of finished goods (including three-way trade) B. Purchasing raw materials
132

8.1.5 Each affiliated company’s Director, Supervisor, and President:
No.
Company Name
Title
Name or representative
Shareholding Shares or investment amount (NT$ housand)
Shareholding or investment ratio (%)
01 Advanixs Corporation. Director Representatives of Advantech: K.C. Liu , MingChin Wu, Eric Chen
10,000,000shares
100
Supervisor Representatives of Advantech: Jessica Tsai
02 Advantech Corporate Investment .
Director Representatives of Advantech: K.C. Liu, Mary Chang, Eric Chen
150,000,000shares
100
Supervisor Representatives of Advantech: Jessica Tsai
03 Advantech Co. Singapore Pte, Ltd. (ASG)
Director Representatives of Advantech: K.C. Liu, David Soon
1,450,000shares
100
04 Advantech Japan Co., Ltd. (AJP)
Director Representatives of Advantech: K.C. Liu, Eric Chen
1,200shares
100
Supervisor Representatives of Advantech: Mary Chang
President Chaney Ho
05 Advantech Australia Pty Ltd. (AAU)
Director Representatives of Advantech: David Soon, Santo Gazzo
500,204shares
100
06 Advantech Co. Malaysia Sdn. Bhd (AMY)
Director Representatives of Advantech: K.C. Liu, David Soon, Chaney Ho, Ng Hock Chuan, Choong Beng Chou
2,000,000shares
100
07 Advantech Europe Holding B.V. (AEUH )
Director Representatives of Advantech: K.C. Liu
25,961,250shares
100
08 Advantech Technology Co., Ltd. (ATC)
Director Representatives of Advantech: K.C. Liu
33,850,000shares
100
09 Advantech Automation Corp.(AAC BVI)
Director Representatives of Advantech: K.C. Liu
74,623,834shares
100
10 Advantech Europe B.V.(AEU) Director Representatives of Advantech Europe Holding B.V.: K.C. Liu
32,315,215shares
100
11 Advantech Poland Sp. z.o.o(APL)
Director Representative of Advantech Europe Holding B.V.: Jeff Shy
6,350shares
100
12 Advantech Technology (China) Company., Ltd. (AKMC)
Director Representative of Advantech Europe Holding B.V.: K.C. Liu, Shun-Long Chen, Chaney Ho
USD43,750shares
100
13 Advantech Corporation (ANA)
Director Representative of Advantech Automation Corp.: K.C. Liu
10,952,606shares
100
14 Beijing Yan Hua Xing Ye Electronics Science &Technology Co., Ltd (ACN)
Director Representative of Advantech Automation Corp.: K.C. Liu, Chaney Ho, Shih-Yang Tsai
USD4,230 100
15 HK Advantech Technology Co., Limited (ATC HK)
Director Representatives of Advantech: K.C. Liu
57,890,679shares
100
16 Advantech Automation Corp.(HK) Limited. (AAC HK)
Director Representative of Advantech Automation Corp.: K.C. Liu
15,230,001shares
100
17 Shanghai Advantech Intelligent Services Co., Ltd. (AiSC)
Director Representative of Advantech Automation Corp.(HK): K.C. Liu
USD8,000 100
Supervisor Eric Chen
President Chaney Ho
133

No. Company Name Title Name or representative
Shareholding
Shares or investment amount (NT$ housand)
Shareholding or
investment ratio (%)
18 Xi’An Advantech Software Co., Ltd.(AXA)
Director Representative of Advantech Automation Corp.(HK): K.C. Liu
USD1,000 100
Supervisor shi.jun 19 Advantech Brazil Ltda.
(ABR) Director Advantech Co., Ltd.
Representative:Mario Franco Neto 1,794,996
shares80
20 Advantech Intelligent Service. (AiST)
Director Representatives of Advantech: K.C. Liu, MingChin Wu, Eric Chen
10,000,000 shares
100
Supervisor Jessica Tsai
21 Advantech KR Co., Ltd. Director Representatives of Advantech: K.C. Liu, Chaney Ho, YJ Choi
600,000 shares
100
Supervisor Representatives of Advantech: Eric Chen
22 Advantech Service-IoT GmbH. (A-SIoT )
President K.C. Liu 1 share 100
23 Cermate Technology Inc.. Director Representatives of Advantech Corporate Investment.: Jonney Chang,Allan Tsai, Tony Liu Representative of Wen Xin International Investment Company: Sunny.Lee, Chris Chiang
5,500,000 shares
55
Supervisor Yuzhen Liu
24 Advantech Corporation (Thailand) Co., Ltd.
Director Representative of Advantech Co. Singapore Pte, Ltd.: KC. Liu, David Soon
100,000 shares
100
25 LandMark Co., Ltd. Director Yuling Liu 972,284 shares
100
26 Cermate Technologies (Shanghai) Inc.
Director Sunny.Lee RMB3,903 100
Supervisor Jun Shi
27 Shenzhen Cermate Technologies Inc.
Director Sunny.Lee RMB2,000 90
Supervisor Chris Chiang
28 PT. Advantech International (AID)
Director Representative of Advantech Co. Singapore Pte, Ltd. (ASG): K.C. Liu
300,000 shares
100
29 Advantech Industrial Computing India Pvt. Ltd. (AIN)
Director Representative of Advantech: K.C. Liu, Chaney Ho
3,999,999 shares
99.99
30 Advantech Electronics, S.De R.L.De C. (AMX)
Director Representative of Advantech Corporation.(ANA): K.C. Liu
MNX2,057 100
31 AdvanPOS Technology Co., Ltd.
Director Representative of Advantech: K.C. Liu, Mary Chang, Eric Chen
1,000,000 shares
100
Supervisor Representatives of Advantech: Jessica Tsai
32 LNC Technology Co., Ltd Director Representative of Advantech: K.C. Liu, Allan Tsai, Michael Kuo
19,230,000shares
64.10
Supervisor Representatives of Advantech: Jessica Tsai
134

No. Company Name Title Name or representative Shareholding Shares or investment
amount (NT$ Thousand)
Shareholding or
investment ratio (%)
33 Better Auto Holdings Limited Director Representative of Advantech LNC Technology Co., Ltd.: K.C. Liu
USD7,900 100
34 Famous Now Limited Director Representative of Better Auto Holdings Limited: K.C. Liu
USD4,000 100
35 LNC DONG GUAN CO., LTD. Director Representative of Famous Now Limited: Michael Kuo ,K.C. Liu, Allan Tsai
USD4,000 100
36 Advantech Innovative Design Co., Ltd.
Director Representatives of Advantech: K.C. Liu ,Deryu Yin,EricChe
1,000,000shares
100
Supervisor Representatives of Advantech: Jessica Tsai
37 B+B SmartWorx Inc.(B+B) Director Advantech Co.,Ltd. Representative: K.C.Liu
USD384,111 100
38 Kostec,co.,Ltd. (AKST) Director Representatives of Advantech: K.C. Liu, MingChin Wu, Frank Hung
91,763 100
39 Limited Liability Company Advantech Technology(ARU)
Director Olga.Alioshina 500,000shares
100
40 Advantech Vietnam Technology Company Limited(AVN)
President Hau.Do 8,100shares
60
41 YUN YAN,WU-LIAN Co., Ltd. Director Representatives of Advantech Corporate Investment.: K.C.Liu, Allan Yang Representatives of Institute for Information Industry: Cheng Hong Cho
500,000shared
50
Supervisor Po Jen ,Hsiao
42 HUAN YAN,JHIH-LIAN Co., Ltd.
Director Representatives of Advantech Corporate Investment.: ChingPo Lin, Tony Liu Representatives of Industrial Technology Investment Corporation : CJ CHANG
500,000shared
50
Supervisor GIT Consultants Corporation
43 Advantech Service-IoT Co. Ltd. (SIoT(Cayman))
Director Representative of Advantech Automation Corp.: K.C. Liu
30,000,000shares
100
44 ADVANTECH SERVICE-IOT (SHANGHAI) CO., LTD. (SIoT(China))
Director K.C. Liu, MC Chiang ,Tony Liu RMB15,000 100
Supervisor Paul Lo
135

8.1.6 Affiliated company’s Operating Results
Unit: NT$ Thousand, Except Earnings per Share in NT$ No. Company Name Capital
stock Total
assets Total
liabilitiesNet worth Operating
income Operating profit (loss)
Net Income (Loss)
EPS (Loss) / NT$ (after
tax) 01 Advanixs Corporation. 100,000 341,477 163,412 178,065 941,696 60,341 53,065 5.31
02 Advantech Corporate Investment .
1,500,000 1,593,033 1,020 1,592,013 45,306 (5,196) 39,830 0.27
03 Advantech Co. Singapore Pte, Ltd. (ASG)
33,800 203,935 90,163 113,772 439,431 11,275 18,154 12.52
04 Advantech Japan Co., Ltd. (AJP)
21,480 591,057 249,449 341,608 1,302,316 71,191 50,427 42,022
05 Advantech Australia Pty Ltd. (AAU)
14,846 109,364 66,706 42,658 350,694 (6,780) (4,729) (9.45)
06 Advantech Co., Malaysia Sdn.Bhd (AMY)
18,138 84,540 19,793 64,747 241,873 25,682 16,937 8.47
07 Advantech Europe Holding B.V. (AEUH)
338,906 1,124,090 9,347 1,114,743 - (521) 101,355 3.90
08 Advantech Technology Co., Ltd. (ATC)
1,009,108 3,779,457 - 3,779,457 - (44,872) 310,451 9.17
09 Advantech Automation Corp. (AAC(BVI))
2,229,052 6,288,411 6,977 6,281434 - (835) 482,772 6.47
10 Advantech Europe B.V. (AEU)
1,138,092 2,778,384 1,742,614 1,035,770 7,762,237 92,112 96,894 3.00
11 Advantech Poland Sp z.o.o(APL)
10,145 36,197 5,322 30,875 109,279 8,176 4,982 784.54
12 Advantech Technology (China) Company., Ltd. AKMC
1,475,414 5,860,426 2,321,289 3,539,137 12,685,395 353,807 365,352 -
13 Advantech Corporation (ANA)
337,232 5,410,131 2,690,335 2,719,796 12,448,644 295,754 220,598 20.14
14 Beijing Yan Hua Xing Ye Electronics Science &Technology Co., Ltd.
164,856 3,492,319 2,288,620 1,203,699 10,836,935 78,700 137,418 -
15 Advantech Technology(HK) Co., Limited.(ATC HK)
1,790,224 3,777,505 - 3,777,505 - - 355,324 6.14
16 Advantech Automation Corp.(HK) Limited (AAC HK)
461,088 1,927,788 23,867 1,903,921 77,011 1,794 127,611 8.38
17 Shanghai Advantech Intelligent Services Co., Ltd. (AiSC)
252,065 725,684 62,074 663,610 309,641 (25,719) (17,003) -
18 Xi’An Advantech Software Co., Ltd. (AXA)
31,589 29,986 99 29,887 - (852) (13) -
19 Advantech Brazil S/A (ABR)
69,934 137,937 48,797 89,140 260,932 7,317 18,354 8.18
20 Advantech Intelligent Service. (AiST)
10,000 22,173 2,679 19,494 - 267 458 0.46
21 Advantech KR Co., Ltd.(AKR)
7,800 568,728 191,383 377,345 1,941,918 137,280 99,992 166.65
22 Advantech Service-IoT GmbH. (A-SIoT)
20,060 544,714 199,966 344,748 1,426,270 85,603 81,512 -
136

No. Company Name Capital stock
Total assets
Total liabilities
Net worth Operating income
Operating profit (loss)
Net Income (Loss)
EPS (Loss) / NT$ (after
tax) 23 Cermate Technology Inc. 100,000 261,277 87,871 173,406 264,061 12,684 33,408 3.34
24 Advantech Corporation(Thailand)Co., Ltd.(ATH)
93,215 113,835 12,070 101,765 108,242 7,580 6,184 61.84
25 Land Mark 27,057 110,652 - 110,652 - - 29,488 30.33
26 Cermate Technologies (Shanghai) Inc.
18,760 27,346 1,604 25,742 45,073 3,318 3,074 -
27 Shenzhen Cermate Technologies Inc.
9,320 119,435 27,239 92,196 291,537 38,518 29,348 -
28 PT. ADVANTECH INTERNATIONAL (AID)
5,465 17,164 8,524 8,640 41,352 1,382 3,565 11.88
29 ADVANTECH INDUSTRIAL COMPUTING INDIA (AIN)
19,754 82,565 65,394 17,171 154,305 7,731 5,249 1.31
30 Advantech Electronics, S. De R. L. De C. (AMX)
2,047 500 278 222 6,798 639 639 -
31 AdvanPOS Technology Co., Ltd.
10,000 83,797 1,569 82,228 - (459) (370) (0.37)
32 LNC Technology Co., Ltd.
300,000 440,232 116,658 323,574 433,836 22,740 4,061 0.14
33 Better Auto Holdings Limited.( Better Auto)
244,615 43,539 - 43,539 - - (13,003) -
34 Famous Now Limited. (Famous Now)
123,630 150,696 - 150,696 - - (12,845) -
35 LNC DONG GUAN CO., LTD.
123,630 271,223 251,166 20,057 481,201 (13,089) (13,004) -
36 Advantech Innovative Design Co., Ltd.
10,000 10,160 94 10,066 - (21) 25 0.02
37 B+B SmartWorx Inc.(B+B) 3,280,073 3,182,834 202,085 2,980,749 1,083,665 (2,934) (4,216) (10.98)
38 B+B SmartWorx Limited. (BBIE)
1,273,262 103,749 318 103,430 77,478 16,099 12,367 -
39 Advantech B+B SmartWorx s.r.o.CZ(B+B CZ)
- 272,621 (4,193) 276,814 405,693 72,023 63,495 -
40 B+B SmartWorx DMCC (B&B DMCC)
- 772 2,269 (1,497) 9,254 (350) 1,723 -
41 Conel Automation s.r.o. (Conel Automation)
- 19,541 28,083 (8,542) 86,413 (30,546) (15,773) -
42 Kostec co.,Ltd.(AKST) 12,435 117,786 144,581 (26,795) 116,644 (48,131) (48,434) (527.82)
43 Limited Liability Company Advantech Technology(ARU)
23,822 21,440 38 21,402 - (808) (655) (1.31)
44 Advantech Vietnam Technology Company Limited(AVN)
17,550 35,966 16,031 19,935 52,048 2,528 2,385 176.65
45 YUN YAN,WU-LIAN Co., Ltd.
10,000 5,961 (171) 6,132 - (3,894) (3,868) (3.87)
46 HUAN YAN,JHIH-LIAN Co., Ltd.
10,000 9,962 20 9,942 - (88) (58) (0.06)
137

47 Advantech Service-IoT Co. Ltd. (SIoT(Cayman))
1,366,780 2,080,192 317,492 1,762,700 530,631 130,104 136,666 4.56
48 ADVANTECH SERVICE-IOT (SHANGHAI) CO., LTD. (SIoT(China))
70,184 85,773 25,150 60,623 52,507 (7,087) (6,584) -
A The companies to be included in the affiliate’s consolidated financial statements are same as the companies to be
included in the parent company-subsidiary consolidated financial statements in accordance with Article 7 of
the “Taiwan’s Financial Accounting Standards;” therefore, the affiliate’s consolidated financial statements will
not be prepared separately. B. The Company is not a subsidiary of other companies; therefore, it is not necessary to have the relationship report
prepared.
8.2 The status of issuing private placement securities in the most recent year and up to the publication
of the annual report: None
8.3. Acquisition or disposal of the Company’s stock shares by subsidiaries in the most recent year and
up to the publication of the annual report: None
8.4 Other necessary supplementary notes: None
IX. The occurrence of any events as stated in Section 3 Paragraph 2 in Article 36 of the Securities
Exchange Act that had significant impact on shareholders’ equity or securities prices in the most recent year and up to the publication of the annual report: None
138

INDEPENDENT AUDITORS’ REPORT
The Board of Directors and the Shareholders Advantech Co., Ltd.
Opinion
We have audited the accompanying financial statements of Advantech Co., Ltd. (the “Company”), which comprise the balance sheets as of December 31, 2018 and 2017, and the statements of comprehensive income, changes in equity and cash flows for the years then ended, and the notes to the financial statements, including a summary of significant accounting policies.
In our opinion, the accompanying financial statements present fairly, in all material respects, the financial position of the Company as of December 31, 2018 and 2017, and its financial performance and its cash flows for the years then ended in accordance with the Regulations Governing the Preparation of Financial Reports by Securities Issuers.
Basis for Opinion
We conducted our audits in accordance with the Regulations Governing Auditing and Attestation of Financial Statements by Certified Public Accountants and auditing standards generally accepted in the Republic of China. Our responsibilities under those standards are further described in the Auditors’ Responsibilities for the Audit of the Financial Statements section of our report. We are independent of the Company in accordance with The Norm of Professional Ethics for Certified Public Accountant of the Republic of China, and we have fulfilled our other ethical responsibilities in accordance with these requirements. We believe that the audit evidence we have obtained is sufficient and appropriate to provide a basis for our opinion.
Key Audit Matters
Key audit matters are those matters that, in our professional judgment, were of most significance in our audit of the financial statements for the year ended December 31, 2018. These matters were addressed in the context of our audit of the financial statements as a whole, and in forming our opinion thereon, and we do not provide a separate opinion on these matters.
Key audit matters on the financial statements for the year ended December 31, 2018 were as follows:
Assessment of Provision for Inventory Write-downs
Inventories as of December 31, 2018 amounted to NT$3,630,979 thousand and accounted for 9% of the total assets in the Company’s financial statements, which represented a material percentage of the total asset.
Attachment I. Financial Statements of the most recent year
139

The inventories of the Company are measured at the lower of cost or net realizable value and according to the ratios of possible impairment for aged inventories. Due to the rapid changes in the technological environment and the significant size and variety of inventories, after analyzing the structure of provisions for inventory valuation, we noticed that the provisions were generated from obsolescent inventories which were aged longer. We considered the evaluation of inventory write-downs of aged inventories as having a significant impact on the Company’s financial statements. Therefore, the assessment of provisions for inventory write-downs was deemed to be one of the key audit matters. Our audit procedures performed in respect of the above area included the following: 1. We assessed and analyzed the Company’s policies for the inventory write-downs provisions and
compared them with other competitors’ policies to affirm the reasonableness and consistency of application.
2. We understood the internal control, evaluated and tested the design and operating effectiveness of the
internal controls over the provisions for inventory write-downs. 3. We reviewed the historical inventory aging reports to trace the process for the usage and scrap of
aged inventories in order to assess the reasonableness of percentages for recognizing aged inventories.
4. We verified the appropriateness of source data, parameters and logic used in the Company’s
inventory aging analysis reports. Sales Revenue Since the Company operates in the highly competitive industry, we determined that revenue recognition of the Company carries risk due to the demand for the growth of sales and the need to remain competitive in the industry. Hence, the Company’s sales revenue from several product lines whose sales increased materially in numbers and percentages was considered as a key audit matter. Our audit procedures performed in respect of sales revenue included the following: 1. We analyzed the trend of the industry, categories of revenue, product lines and customer categories
for two consecutive years to confirm whether there were any abnormal situations or centralized trading which might put revenue recognition at risk.
2. We interviewed personnel who operates the control activities and reviewed related internal vouchers
to understand the processes of internal controls related to revenue-recognition and evaluate the design, implementation, and operating effectiveness of internal controls over revenue recognition. We tested such internal controls to obtain sufficient and appropriate audit evidence of the effectiveness of key controls.
3. We obtained details of accounts, analyzed balances and confirmed or reconciled them with general
ledgers; we tested the reconciliation between detailed and general ledgers and traced the reconciliation to acquire sufficient and appropriate evidence.
4. We determined the appropriate methods of sampling and sample sizes and audited sales orders,
packing lists and export declarations in order to evaluate whether the amount of revenue is recognized accurately and in accordance with the regulations for the preparation of financial reports.
5. We audited the records and vouchers of collections to evaluate whether the amounts of collections
are accurate and the payers of such collections and the recipients of the related orders are consistent in order to attest the reality of sales.
140

Responsibilities of Management and Those Charged with Governance for the Financial Statements Management is responsible for the preparation and fair presentation of the financial statements in accordance with the Regulations Governing the Preparation of Financial Reports by Securities Issuers and for such internal control as management determines is necessary to enable the preparation of financial statements that are free from material misstatement, whether due to fraud or error. In preparing the financial statements, management is responsible for assessing the Company’s ability to continue as a going concern, disclosing, as applicable, matters related to going concern and using the going concern basis of accounting unless management either intends to liquidate the Company or to cease operations, or has no realistic alternative but to do so. Those charged with governance, including the audit committee, are responsible for overseeing the Company’s financial reporting process. Auditors’ Responsibilities for the Audit of the Financial Statements Our objectives are to obtain reasonable assurance about whether the financial statements as a whole are free from material misstatement, whether due to fraud or error, and to issue an auditors’ report that includes our opinion. Reasonable assurance is a high level of assurance, but is not a guarantee that an audit conducted in accordance with auditing standards generally accepted in the Republic of China will always detect a material misstatement when it exists. Misstatements can arise from fraud or error and are considered material if, individually or in the aggregate, they could reasonably be expected to influence the economic decisions of users taken on the basis of these financial statements. As part of an audit in accordance with auditing standards generally accepted in the Republic of China, we exercise professional judgment and maintain professional skepticism throughout the audit. We also: 1. Identify and assess the risks of material misstatement of the financial statements, whether due to
fraud or error, design and perform audit procedures responsive to those risks, and obtain audit evidence that is sufficient and appropriate to provide a basis for our opinion. The risk of not detecting a material misstatement resulting from fraud is higher than for one resulting from error, as fraud may involve collusion, forgery, intentional omissions, misrepresentations, or the override of internal control.
2. Obtain an understanding of internal control relevant to the audit in order to design audit procedures
that are appropriate in the circumstances, but not for the purpose of expressing an opinion on the effectiveness of the Company’s internal control.
3. Evaluate the appropriateness of accounting policies used and the reasonableness of accounting
estimates and related disclosures made by management. 4. Conclude on the appropriateness of management’s use of the going concern basis of accounting and,
based on the audit evidence obtained, whether a material uncertainty exists related to events or conditions that may cast significant doubt on the Company’s ability to continue as a going concern. If we conclude that a material uncertainty exists, we are required to draw attention in our auditors’ report to the related disclosures in the financial statements or, if such disclosures are inadequate, to modify our opinion. Our conclusions are based on the audit evidence obtained up to the date of our auditors’ report. However, future events or conditions may cause the Company to cease to continue as a going concern.
5. Evaluate the overall presentation, structure and content of the financial statements, including the
disclosures, and whether the financial statements represent the underlying transactions and events in a manner that achieves fair presentation.
141

6. Obtain sufficient and appropriate audit evidence regarding the financial information of entities or business activities within the Company to express an opinion on the financial statements. We are responsible for the direction, supervision and performance of the audit. We remain solely responsible for our audit opinion.
We communicate with those charged with governance regarding, among other matters, the planned scope and timing of the audit and significant audit findings, including any significant deficiencies in internal control that we identify during our audit. We also provide those charged with governance with a statement that we have complied with relevant ethical requirements regarding independence, and to communicate with them all relationships and other matters that may reasonably be thought to bear on our independence, and where applicable, related safeguards. From the matters communicated with those charged with governance, we determine those matters that were of most significance in the audit of the financial statements for the year ended December 31, 2018 and are therefore the key audit matters. We describe these matters in our auditors’ report unless law or regulation precludes public disclosure about the matter or when, in extremely rare circumstances, we determine that a matter should not be communicated in our report because the adverse consequences of doing so would reasonably be expected to outweigh the public interest benefits of such communication. The engagement partners on the audit resulting in this independent auditors’ report are Jr-Shian Ke and Meng-Chieh Chiu. Deloitte & Touche Taipei, Taiwan Republic of China March 8, 2019
Notice to Readers The accompanying financial statements are intended only to present the financial position, financial performance and cash flows in accordance with accounting principles and practices generally accepted in the Republic of China and not those of any other jurisdictions. The standards, procedures and practices to audit such financial statements are those generally applied in the Republic of China. For the convenience of readers, the independent auditors’ report and the accompanying financial statements have been translated into English from the original Chinese version prepared and used in the Republic of China. If there is any conflict between the English version and the original Chinese version or any difference in the interpretation of the two versions, the Chinese-language independent auditors’ report and financial statements shall prevail.
142

ADVANTECH CO., LTD. BALANCE SHEETS DECEMBER 31, 2018 AND 2017 (In Thousands of New Taiwan Dollars) 2018 2017 ASSETS Amount % Amount % CURRENT ASSETS
Cash and cash equivalents (Notes 4 and 6) $ 2,509,958 6 $ 2,436,648 7 Financial assets at fair value through profit or loss - current (Notes 4, 7 and 27) 1,360,381 3 645,100 2 Notes receivable (Notes 4 and 10) 75,203 - 62,468 - Trade receivables (Notes 4 and 10) 1,487,837 4 1,546,135 4 Trade receivables from related parties (Notes 4 and 28) 5,655,196 14 4,603,076 12 Other receivables 143,225 - 143,493 - Other receivables from related parties (Note 28) 41,111 - 15,569 - Inventories (Notes 4, 5 and 11) 3,630,979 9 2,654,681 7 Other current assets 42,717 - 46,533 -
Total current assets 14,946,607 36 12,153,703 32
NON-CURRENT ASSETS
Available-for-sale financial assets - non-current (Notes 4, 9 and 27) - - 1,419,479 4 Financial assets at fair value through other comprehensive income - non-current (Notes 4, 8 and 27) 1,028,441 3 - - Investments accounted for using the equity method (Notes 4, 5 and 12) 17,723,652 43 16,591,055 44 Property, plant and equipment (Notes 4 and 13) 6,752,642 17 6,865,025 19 Goodwill (Notes 4 and 14) 111,599 - 111,599 - Other intangible assets (Note 4) 105,532 - 75,584 - Deferred tax assets (Notes 4 and 19) 343,646 1 236,699 1 Prepayments for equipment 26,344 - 20,126 - Other non-current assets 3,963 - 6,755 -
Total non-current assets 26,095,819 64 25,326,322 68
TOTAL $ 41,042,426 100 $ 37,480,025 100 LIABILITIES AND EQUITY CURRENT LIABILITIES
Financial liabilities at fair value through profit or loss - current (Notes 4, 7 and 27) $ 6,128 - $ 6,226 - Notes payable and trade payables 3,963,470 10 3,459,433 9 Trade payables to related parties (Note 28) 1,695,599 4 1,123,366 3 Other payables (Note 15) 2,530,927 6 2,470,498 7 Other payables to related parties (Note 28) 54,583 - 77,549 - Current tax liabilities (Notes 4 and 19) 1,413,134 4 1,108,579 3 Short-term warranty provisions (Note 4) 57,675 - 53,304 - Other current liabilities 139,075 - 151,823 -
Total current liabilities 9,860,591 24 8,450,778 22
NON-CURRENT LIABILITIES
Deferred tax liabilities (Notes 4 and 19) 1,568,910 4 1,162,514 3 Net defined benefit liabilities (Notes 4 and 16) 255,273 1 236,251 1 Other non-current liabilities 54,949 - 49,408 -
Total non-current liabilities 1,879,132 5 1,448,173 4
Total liabilities 11,739,723 29 9,898,951 26
EQUITY
Share capital Ordinary shares 6,982,275 17 6,970,325 19 Advance receipts for share capital 4,680 - 2,500 -
Total share capital 6,986,955 17 6,972,825 19 Capital surplus 7,073,348 17 6,554,842 18 Retained earnings
Legal reserve 5,655,613 14 5,039,962 13 Special reserve 369,655 1 85,204 - Unappropriated earnings 10,015,895 24 9,297,896 25
Total retained earnings 16,041,163 39 14,423,062 38 Other equity
Exchange differences on translation of foreign financial statements (475,245) (1) (463,479) (1) Unrealized gain on available-for-sale financial assets - - 93,824 - Unrealized gain on financial assets at fair value through other comprehensive income (324,254) (1) - - Other equity - unearned employee compensation 736 - - -
Total other equity (798,763) (2) (369,655) (1)
Total equity 29,302,703 71 27,581,074 74 TOTAL $ 41,042,426 100 $ 37,480,025 100 The accompanying notes are an integral part of the financial statements.
143

ADVANTECH CO., LTD. STATEMENTS OF COMPREHENSIVE INCOME FOR THE YEARS ENDED DECEMBER 31, 2018 AND 2017 (In Thousands of New Taiwan Dollars, Except Earnings Per Share) 2018 2017 Amount % Amount % OPERATING REVENUE (Notes 4 and 28)
Sales $ 34,928,854 99 $ 30,518,459 99 Other operating revenue 453,922 1 382,118 1
Total operating revenue 35,382,776 100 30,900,577 100
OPERATING COSTS (Notes 11, 18 and 28) 24,735,871 70 21,520,472 70 GROSS PROFIT 10,646,905 30 9,380,105 30 UNREALIZED GAIN ON TRANSACTIONS WITH
SUBSIDIARIES AND ASSOCIATES (Note 4) (665,475) (2) (446,326) (1) REALIZED GAIN ON TRANSACTIONS WITH
SUBSIDIARIES AND ASSOCIATES (Note 4) 446,326 2 264,679 1 REALIZED GROSS PROFIT 10,427,756 30 9,198,458 30 OPERATING EXPENSES (Notes 18 and 28)
Selling and marketing expenses 661,227 2 683,065 2 General and administrative expenses 867,975 3 832,526 3 Research and development expenses 2,965,117 8 2,837,185 9
Total operating expenses 4,494,319 13 4,352,776 14
OPERATING PROFIT 5,933,437 17 4,845,682 16 NON-OPERATING INCOME
Share of the profit of subsidiaries and associates accounted for using the equity method (Notes 4 and 12) 1,326,913 4 1,965,070 6
Interest income (Note 4) 234 - 923 - Gains on disposal of property, plant and equipment
(Note 4) 87,990 - 99,749 - Gains on disposal of investments (Notes 4 and 16) - - 165,076 1 Foreign exchange losses, net (Notes 4, 18 and 29) 38,413 - (45,802) - Gains on financial instruments at fair value through
profit or loss (Note 4) 39,052 - 65,594 - Dividend income (Note 4) 77,692 - 89,215 - Other income (Notes 8, 22 and 28) 168,230 1 109,510 - Finance costs (Note 18) (33) - - - Losses on financial instruments at fair value through
profit or loss (Note 4) (37,756) - (84,455) - (Continued)
144

ADVANTECH CO., LTD. STATEMENTS OF COMPREHENSIVE INCOME FOR THE YEARS ENDED DECEMBER 31, 2018 AND 2017 (In Thousands of New Taiwan Dollars, Except Earnings Per Share) 2018 2017 Amount % Amount %
Impairment loss recognized on investments accounted for using the equity method (Note 12) $ - - $ (66,443) -
Other losses (32) - (130) -
Total non-operating income 1,700,703 5 2,298,307 7 PROFIT BEFORE INCOME TAX 7,634,140 22 7,143,989 23 INCOME TAX EXPENSE (Notes 4 and 19) 1,339,483 4 987,473 3 NET PROFIT FOR THE YEAR 6,294,657 18 6,156,516 20 OTHER COMPREHENSIVE INCOME (LOSS)
Items that will not be reclassified subsequently to profit or loss: Remeasurement of defined benefit plans (Note 16) (21,155) - (23,710) - Share of the other comprehensive income (loss) of
subsidiaries and associates accounted for using the equity method (Notes 12 and 17) (14,802) - (1,395) -
Unrealized loss on investment in equity instruments as at fair value through other comprehensive income (Note 17) (445,333) (2) - -
Income tax relating to items that will not be reclassified subsequently to profit or loss (Note 19) 6,358 - 4,031 -
Items that may be reclassified subsequently to profit or loss: Exchange differences on translation of foreign
financial statements (Notes 4 and 17) (24,575) - (313,377) (1) Unrealized losses on available-for-sale financial
assets (Notes 4 and 17) - - (1,678) - Share of other comprehensive loss of subsidiaries
and associates accounted for using the equity method (Notes 4, 12 and 17) (11,074) - (23,846) -
Income tax relating to item that may be reclassified subsequently to profit (Notes 4, 17 and 19) 23,883 - 54,450 -
Other comprehensive loss for the year, net of
income tax (486,698) (2) (305,525) (1) TOTAL COMPREHENSIVE INCOME FOR THE
YEAR $ 5,807,959 16 $ 5,850,991 19 (Continued)
145

ADVANTECH CO., LTD. STATEMENTS OF COMPREHENSIVE INCOME FOR THE YEARS ENDED DECEMBER 31, 2018 AND 2017 (In Thousands of New Taiwan Dollars, Except Earnings Per Share) 2018 2017 Amount % Amount % EARNINGS PER SHARE (Note 20)
Basic $ 9.02 $ 8.84 Diluted $ 8.93 $ 8.77
The accompanying notes are an integral part of the financial statements. (Concluded)
146

AD
VA
NT
EC
H C
O.,
LT
D.
STA
TE
ME
NT
S O
F C
HA
NG
ES
IN E
QU
ITY
FO
R T
HE
YE
AR
S E
ND
ED
DE
CE
MB
ER 3
1, 2
018
AN
D 2
017
(In
Tho
usan
ds o
f New
Tai
wan
Dol
lars
)
O
ther
Equ
ity (N
otes
4 a
nd 1
7)
Exc
hang
e
Unr
ealiz
ed
Gai
n or
Los
s on
Fina
ncia
l Ass
ets a
t Fa
ir V
alue
Unr
ealiz
ed
U
near
ned
Is
sued
Cap
ital (
Not
es 1
7 an
d 21
)
Ret
aine
d E
arni
ngs (
Not
es 4
and
17)
Diff
eren
ces o
n
Thr
ough
Oth
er
G
ain
(Los
s) o
n
Sh
are-
Bas
ed
Shar
e C
apita
l
Adv
ance
Rec
eipt
s fo
r O
rdin
ary
Shar
e
Tot
al
C
apita
l Sur
plus
(N
otes
4, 1
7 an
d 21
)
Leg
al R
eser
ve
Sp
ecia
l Res
erve
Una
ppro
pria
ted
Ear
ning
s
Tot
al
T
rans
latin
g Fo
reig
n O
pera
tions
Com
preh
ensi
ve
Inco
me
A
vaila
ble-
for-
sale
Fi
nanc
ial A
sset
s
Em
ploy
ee
Com
pens
atio
n
Tot
al E
quity
BA
LAN
CE
AT
JAN
UA
RY
1, 2
017
$
6,33
0,74
1
$
10
0
$
6,
330,
841
$
6,05
8,88
4
$
4,
473,
276
$
-
$
8,
435,
785
$
12,9
09,0
61
$
(197
,633
)
$
-
$
112,
429
$
-
$
25
,213
,582
App
ropr
iatio
n of
the
2016
ear
ning
s
Le
gal r
eser
ve
-
-
-
-
56
6,68
6
-
(566
,686
)
-
-
-
-
-
- Sp
ecia
l res
erve
-
-
-
-
-
85,2
04
(8
5,20
4 )
-
-
-
-
-
-
Cas
h di
vide
nds o
n or
dina
ry s
hare
s
-
-
-
-
-
-
(3,9
88,3
67 )
(3
,988
,367
)
-
-
-
-
(3,9
88,3
67 )
Shar
e di
vide
nds o
n or
dina
ry s
hare
s
633,
074
-
63
3,07
4
-
-
-
(633
,074
)
(633
,074
)
-
-
-
-
-
Rec
ogni
tion
of e
mpl
oyee
shar
e op
tions
by
the
Com
pany
6,51
0
2,40
0
8,91
0
68,5
10
-
-
-
-
-
-
-
-
77
,420
Com
pens
atio
n co
sts r
ecog
nize
d fo
r em
ploy
ee sh
are
optio
ns
-
-
-
42
4,63
7
-
-
-
-
-
-
-
-
424,
637
C
hang
es in
cap
ital s
urpl
us fr
om in
vest
men
ts in
ass
ocia
tes a
ccou
nted
for
usin
g eq
uity
met
hod
-
-
-
2,
054
-
-
-
-
-
-
-
-
2,
054
C
hang
es in
per
cent
age
of o
wne
rshi
p in
tere
sts i
n su
bsid
iarie
s
-
-
-
757
-
-
-
-
-
-
-
-
75
7
Net
pro
fit fo
r the
yea
r end
ed D
ecem
ber 3
1, 2
017
-
-
-
-
-
-
6,
156,
516
6,
156,
516
-
-
-
-
6,
156,
516
O
ther
com
preh
ensi
ve lo
ss fo
r the
yea
r end
ed D
ecem
ber 3
1, 2
017,
net
of
inco
me
tax
-
-
-
-
-
-
(2
1,07
4 )
(2
1,07
4 )
(2
65,8
46 )
-
(1
8,60
5 )
-
(3
05,5
25 )
To
tal c
ompr
ehen
sive
inco
me
(loss
) for
the
year
end
ed D
ecem
ber 3
1,
2017
-
-
-
-
-
-
6,13
5,44
2
6,13
5,44
2
(265
,846
)
-
(18,
605 )
-
5,85
0,99
1
BA
LAN
CE
AT
DEC
EMBE
R 3
1, 2
017
6,
970,
325
2,
500
6,
972,
825
6,
554,
842
5,
039,
962
85
,204
9,29
7,89
6
14,4
23,0
62
(4
63,4
79 )
-
93
,824
-
27,5
81,0
74
Ef
fect
of r
etro
spec
tive
appl
icat
ion
and
retro
spec
tive
rest
atem
ent
-
-
-
-
-
-
(3
4,00
2 )
(3
4,00
2 )
-
12
3,25
4
(93,
824 )
-
(4,5
72 )
B
ALA
NC
E A
T JA
NU
AR
Y 1
, 201
8
6,97
0,32
5
2,50
0
6,97
2,82
5
6,55
4,84
2
5,03
9,96
2
85,2
04
9,
263,
894
14
,389
,060
(463
,479
)
123,
254
-
-
27
,576
,502
App
ropr
iatio
n of
the
2017
ear
ning
s
Le
gal r
eser
ve
-
-
-
-
61
5,65
1
-
(615
,651
)
-
-
-
-
-
- Sp
ecia
l res
erve
-
-
-
-
-
284,
451
(2
84,4
51 )
-
-
-
-
-
-
Cas
h di
vide
nds d
istrib
uted
on
ordi
nary
sha
res
-
-
-
-
-
-
(4
,600
,414
)
(4,6
00,4
14 )
-
-
-
-
(4
,600
,414
)
Rec
ogni
tion
of e
mpl
oyee
sha
re o
ptio
ns b
y th
e C
ompa
ny
11
,950
2,18
0
14,1
30
10
4,24
6
-
-
-
-
-
-
-
-
118,
376
C
ompe
nsat
ion
cost
s rec
ogni
zed
for e
mpl
oyee
shar
e op
tions
-
-
-
341,
624
-
-
-
-
-
-
-
-
34
1,62
4
Cha
nges
in c
apita
l sur
plus
from
inve
stm
ents
in a
ssoc
iate
s acc
ount
ed fo
r us
ing
equi
ty m
etho
d
-
-
-
2,66
0
-
-
-
-
-
-
-
736
3,
396
A
ssoc
iate
s usi
ng e
quity
met
hods
-
-
-
-
-
-
(14,
716 )
(14,
716 )
-
-
-
-
(14,
716 )
Diff
eren
ce b
etw
een
cons
ider
atio
ns a
nd c
arry
ing
amou
nts o
f sub
sidi
arie
s ac
quire
d or
disp
osed
of
-
-
-
70
,716
-
-
-
-
-
-
-
-
70,7
16
R
ecog
nize
d fo
r em
ploy
ee b
y su
bsid
iarie
s
-
-
-
(740
)
-
-
-
-
-
-
-
-
(740
)
Net
pro
fit fo
r the
yea
r end
ed D
ecem
ber 3
1, 2
018
-
-
-
-
-
-
6,
294,
657
6,
294,
657
-
-
-
-
6,
294,
657
O
ther
com
preh
ensi
ve lo
ss fo
r the
yea
r end
ed D
ecem
ber 3
1, 2
018,
net
of
inco
me
tax
-
-
-
-
-
-
(1
5,68
7 )
(1
5,68
7 )
(1
1,76
6 )
(4
59,2
45 )
-
-
(4
86,6
98 )
To
tal c
ompr
ehen
sive
inco
me
(loss
) for
the
year
end
ed D
ecem
ber 3
1,
2018
-
-
-
-
-
-
6,27
8,97
0
6,27
8,97
0
(11,
766 )
(459
,245
)
-
-
5,80
7,95
9
Ass
ocia
tes d
ispos
al o
f inv
estm
ents
in e
quity
inst
rum
ents
des
igna
ted
as a
t fa
ir va
lue
thro
ugh
othe
r com
preh
ensi
ve in
com
e
-
-
-
-
-
-
(11,
737 )
(11,
737 )
-
11,7
37
-
-
-
B
ALA
NC
E A
T D
ECEM
BER
31,
201
8
$
6,
982,
275
$
4,68
0
$
6,
986,
955
$
7,07
3,34
8
$
5,
655,
613
$
369,
655
$
10,0
15,8
95
$
16,0
41,1
63
$
(475
,245
)
$
(3
24,2
54 )
$
-
$
73
6
$
29
,302
,703
Th
e ac
com
pany
ing
note
s are
an
inte
gral
par
t of t
he fi
nanc
ial s
tate
men
ts.
147

ADVANTECH CO., LTD. STATEMENTS OF CASH FLOWS FOR THE YEARS ENDED DECEMBER 31, 2018 AND 2017 (In Thousands of New Taiwan Dollars) 2018 2017 CASH FLOWS FROM OPERATING ACTIVITIES
Income before income tax $ 7,634,140 $ 7,143,989 Adjustments to reconcile profit (loss):
Depreciation expenses 255,248 272,639 Amortization expenses 85,574 81,067 Impairment loss recognized for trade receivables - 185 Expected loss on credit impairment 6,815 - Net loss (gain) on financial assets or liabilities at fair value through
profit or loss (1,296) 18,861 Financial costs 33 - Interest income (234) (923) Dividend income (77,692) (89,215) Compensation costs of employee share options 341,624 424,637 Share of profit of subsidiaries and associates accounted for using the
equity method (1,326,913) (1,965,070) Gain on disposal of property, plant and equipment (87,990) (99,749) Gain on disposal of investments - (165,076) Impairment loss recognized on investments accounted for using the
equity method - 66,443 Realized loss on the transactions with subsidiaries and associates 219,149 181,647
Changes in operating assets and liabilities Financial assets held for trading (714,083) (632,232) Notes receivable (12,735) 4,755 Trade receivables 51,483 (2,716) Trade receivables from related parties (1,052,120) (694,628) Other receivables 268 (37,564) Other receivables from related parties (25,542) 3,433 Inventories (976,298) (718,808) Other current assets 3,816 (8,172) Notes payable and trade payables 504,037 1,908,464 Trade payables to related parties 572,233 (1,487,276) Other payables 60,429 (73,796) Other payables to related parties (22,966) (77,531) Short-term warranty provisions 4,371 4,149 Net defined benefit liabilities (2,133) 1,371 Other current liabilities (12,748) (2,169) Other non-current liabilities 5,385 13,655
Cash generated from operations 5,431,855 4,070,370 Interest received 234 923 Dividends received 77,692 89,215 Interests paid (33) - Income tax paid (705,238) (783,217)
Net cash generated from operating activities 4,804,510 3,377,291
(Continued)
148

ADVANTECH CO., LTD. STATEMENTS OF CASH FLOWS FOR THE YEARS ENDED DECEMBER 31, 2018 AND 2017 (In Thousands of New Taiwan Dollars) 2018 2017 CASH FLOWS FROM INVESTING ACTIVITIES
Purchase of available-for-sale financial assets $ - $ (5,082,000) Proceeds from sale of available-for-sale financial assets - 6,220,989 Acquisition of investments accounted for using equity method (1,731,720) (637,500) Proceeds from disposal of subsidiaries 126,769 - Proceeds from capital reduction of investees accounted for using equity
method 530,458 - Payments for property, plant and equipment (204,404) (252,269) Proceeds from disposal of property, plant and equipment 113,260 135,528 Increase(decrease) in refundable deposits 2,792 (1,094) Payments for intangible assets (111,209) (76,794) Decrease in prepayments for equipment 25,738 17,924 Dividends received from subsidiaries and associates 998,998 636,457
Net cash generated from (used in) investing activities (249,318) 961,241
CASH FLOWS FROM FINANCING ACTIVITIES
Increase in guarantee deposits received 156 816 Cash dividends paid (4,600,414) (3,988,367) Exercise of employee share options 118,376 77,420
Net cash used in financing activities (4,481,882) (3,910,131)
NET INCREASE IN CASH AND CASH EQUIVALENTS 73,310 428,401 CASH AND CASH EQUIVALENTS AT THE BEGINNING OF THE
YEAR 2,436,648 2,008,247 CASH AND CASH EQUIVALENTS AT THE END OF THE YEAR $ 2,509,958 $ 2,436,648 The accompanying notes are an integral part of the financial statements. (Concluded)
149

ADVANTECH CO., LTD. NOTES TO FINANCIAL STATEMENTS FOR THE YEARS ENDED DECEMBER 31, 2018 AND 2017 (In Thousands of New Taiwan Dollars, Unless Stated Otherwise) 1. GENERAL INFORMATION
Advantech Co., Ltd. (the “Company”) is a listed company that was established in September 1981. It designs, manufactures and sells embedded computing boards, industrial automation products, and applied and industrial computers. The Company’s shares have been listed on the Taiwan Stock Exchange since December 1999. To improve the entire operating efficiency of the Company and its subsidiaries, the Company’s board of directors resolved on June 30, 2009 to have a short-form merger with Advantech Investment and Management Service (“AIMS”). The effective merger date was July 30, 2009. As the surviving entity, the Company assumed all assets and liabilities of AIMS. On June 26, 2014, the Company’s board of directors resolved to have a whale-minnow merger with Netstar Technology Co., Ltd. (“Netstar”), an indirectly 95.51%-owned subsidiary through a wholly-owned subsidiary, Advantech Corporate Investment. The effective merger date was July 27, 2014. As the surviving entity, the Company assumed all assets and liabilities of Netstar. The functional currency of the Company is the New Taiwan dollar.
2. APPROVAL OF FINANCIAL STATEMENTS The financial statements were approved by the board of directors on March 8, 2019.
3. APPLICATION OF NEW, AMENDED AND REVISED STANDARDS AND INTERPRETATIONS a. Initial application of the amendments to the Regulations Governing the Preparation of Financial Reports
by Securities Issuers and the International Financial Reporting Standards (IFRS), International Accounting Standards (IAS), Interpretations of IFRS (IFRIC) and Interpretations of IAS (SIC) (collectively, the “IFRSs”) endorsed and issued into effect by the FSC Except for the following, whenever applied, the initial application of the amendments to the Regulations Governing the Preparation of Financial Reports by Securities Issuers and the IFRSs endorsed and issued into effect by the FSC would not have any material impact on the Company’s accounting policies: 1) Annual Improvements to IFRSs 2014-2016 Cycle
Several standards, including IFRS 12 “Disclosure of Interests in Other Entities” and IAS 28 “Investments in Associates and Joint Ventures,” were amended in this annual improvement. Furthermore, the amendments to IAS 28 clarify that when the Group (i.e. a non-investment entity) applies the equity method to account for its investment in an associate that is an investment entity, the Group may elect to retain the fair value of the investment interests in subsidiaries of the investment entity associate. The election should be made separately for each investment entity associate, at the later of the date that (a) the investment entity associate is initially recognized, (b) the associate becomes an investment entity, or (c) the investment entity associate first becomes a parent.
150
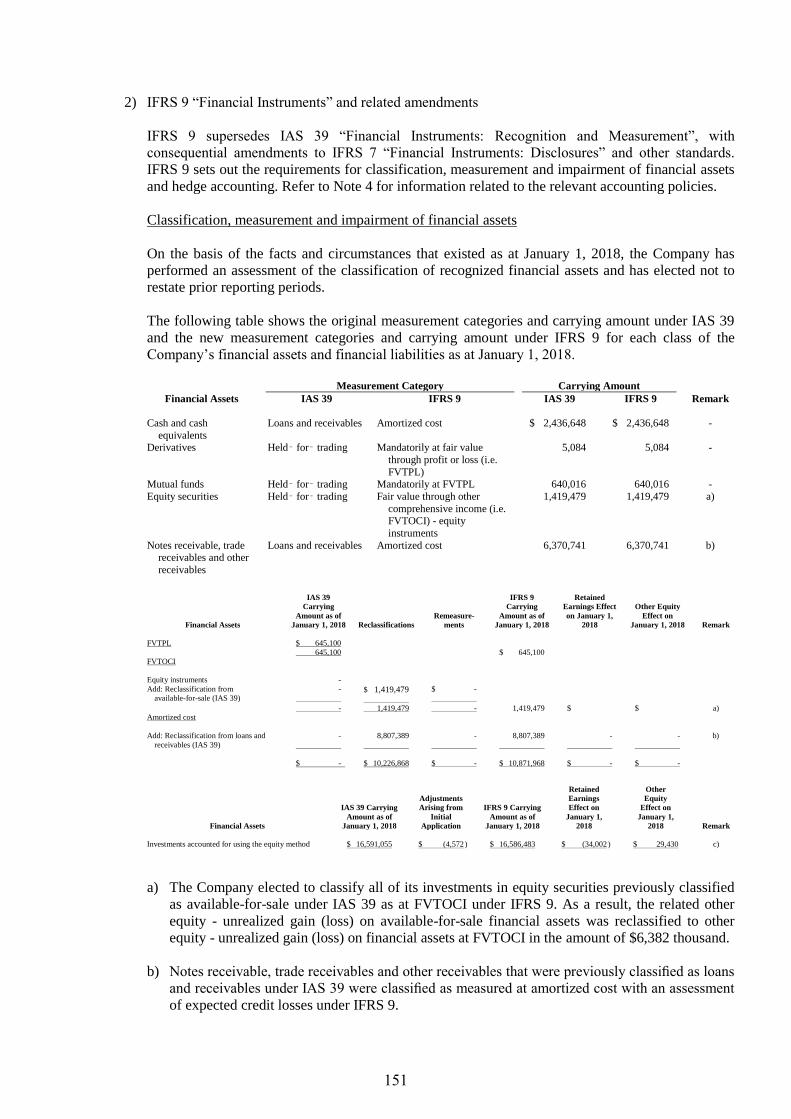
2) IFRS 9 “Financial Instruments” and related amendments IFRS 9 supersedes IAS 39 “Financial Instruments: Recognition and Measurement”, with consequential amendments to IFRS 7 “Financial Instruments: Disclosures” and other standards. IFRS 9 sets out the requirements for classification, measurement and impairment of financial assets and hedge accounting. Refer to Note 4 for information related to the relevant accounting policies. Classification, measurement and impairment of financial assets On the basis of the facts and circumstances that existed as at January 1, 2018, the Company has performed an assessment of the classification of recognized financial assets and has elected not to restate prior reporting periods. The following table shows the original measurement categories and carrying amount under IAS 39 and the new measurement categories and carrying amount under IFRS 9 for each class of the Company’s financial assets and financial liabilities as at January 1, 2018.
Measurement Category Carrying Amount Financial Assets IAS 39 IFRS 9 IAS 39 IFRS 9 Remark
Cash and cash
equivalents Loans and receivables Amortized cost $ 2,436,648 $ 2,436,648 -
Derivatives Held for trading Mandatorily at fair value through profit or loss (i.e. FVTPL)
5,084 5,084 -
Mutual funds Held for trading Mandatorily at FVTPL 640,016 640,016 - Equity securities Held for trading Fair value through other
comprehensive income (i.e. FVTOCI) - equity instruments
1,419,479 1,419,479 a)
Notes receivable, trade receivables and other receivables
Loans and receivables Amortized cost 6,370,741 6,370,741 b)
Financial Assets
IAS 39 Carrying
Amount as of January 1, 2018 Reclassifications
Remeasure- ments
IFRS 9 Carrying
Amount as of January 1, 2018
Retained Earnings Effect on January 1,
2018
Other Equity Effect on
January 1, 2018 Remark FVTPL $ 645,100 645,100 $ 645,100 FVTOCI Equity instruments - Add: Reclassification from
available-for-sale (IAS 39) -
$ 1,419,479
$ -
- 1,419,479 - 1,419,479 $ $ a) Amortized cost Add: Reclassification from loans and
receivables (IAS 39) -
8,807,389
-
8,807,389
-
-
b)
$ - $ 10,226,868 $ - $ 10,871,968 $ - $ -
Financial Assets
IAS 39 Carrying Amount as of
January 1, 2018
Adjustments Arising from
Initial Application
IFRS 9 Carrying Amount as of
January 1, 2018
Retained Earnings Effect on
January 1, 2018
Other Equity
Effect on January 1,
2018 Remark Investments accounted for using the equity method $ 16,591,055 $ (4,572 ) $ 16,586,483 $ (34,002 ) $ 29,430 c)
a) The Company elected to classify all of its investments in equity securities previously classified
as available-for-sale under IAS 39 as at FVTOCI under IFRS 9. As a result, the related other equity - unrealized gain (loss) on available-for-sale financial assets was reclassified to other equity - unrealized gain (loss) on financial assets at FVTOCI in the amount of $6,382 thousand.
b) Notes receivable, trade receivables and other receivables that were previously classified as loans
and receivables under IAS 39 were classified as measured at amortized cost with an assessment of expected credit losses under IFRS 9.
151

c) As a result of retrospective application of IFRS 9 by subsidiaries and associates, there was a decrease in investments accounted for using the equity method of $4,572 thousand, a increase in other equity - unrealized gain (loss) on financial assets at FVTOCI of $29,430 thousand and an decrease in retained earnings of $34,002 thousand on January 1, 2018.
3) IFRS 15 “Revenue from Contracts with Customers” and related amendment
IFRS 15 establishes principles for recognizing revenue that apply to all contracts with customers, and supersedes IAS 18 “Revenue”, IAS 11 “Construction Contracts” and a number of revenue-related interpretations. Please refer to Note 4 for related accounting policies. In identifying performance obligations, IFRS 15 and the related amendments require that a good or service is distinct if it is capable of being distinct (for example, the Company regularly sells it separately) and the promise to transfer it is distinct within the context of the contract (i.e. the nature of the promise in the contract is to transfer each good or service individually rather than to transfer a combined output). The Company provides service-type warranties in addition to assurance that its products comply with agreed-upon specifications. IFRS 15 requires such service to be considered as a performance obligation. Any transaction prices allocated to a service-type warranties is recognized as revenue, and the related costs are recognized when such warranty services is performed. Under IFRS 15, the net effect of revenue recognized and consideration received and receivable is recognized as a contract asset or a contract liability. Prior to the application of IFRS 15, receivables and deferred revenue were recognized when revenue was recognized for the contract under IAS 18. The Company elected only to retrospectively apply IFRS 15 to contracts that were not complete as of January 1, 2018 and recognize the cumulative effect of the change in retained earnings on January 1, 2018. For all contract modifications that occurred on or before December 31, 2017, the Company did not apply the requirements in IFRS 15 individually to each of the modifications, and the Company identified the performance obligations and determined and allocated transaction price in a manner that reflected the aggregate effect of all modifications that occurred on or before December 31, 2017. This reduced the complexity and cost of retrospective application, and resulted in financial information that closely aligns with the financial information that would be available under IFRS 15 without the expedient.
4) Amendments to IAS 12 “Recognition of Deferred Tax Assets for Unrealized Losses” In determining whether to recognize a deferred tax asset, the Company should assess a deductible temporary difference in combination with all of its other deductible temporary differences, unless the tax law restricts the utilization of losses as deduction against income of a specific type, in which case, a deductible temporary difference is assessed in combination only with other deductible temporary differences of the appropriate type. The amendments also stipulate that, when determining whether to recognize a deferred tax asset, the estimate of probable future taxable profit may include some of the Company’s assets for more than their carrying amount if there is sufficient evidence that it is probable that the Company will achieve the higher amount, and that the estimate for future taxable profit should exclude tax deductions resulting from the reversal of deductible temporary differences. In assessing a deferred tax asset, the Company assumed that it will recover the asset at its carrying amount when estimating probable future taxable profit, The Company applied the above amendments retrospectively in 2018.
152

5) IFRIC 22 “Foreign Currency Transactions and Advance Consideration” IAS 21 stipulated that a foreign currency transaction shall be recorded on initial recognition in the functional currency by applying to the foreign currency amount the spot exchange rate between the functional currency and the foreign currency at the date of the transaction. IFRIC 22 further explains that the date of the transaction is the date on which an entity recognizes a non-monetary asset or non-monetary liability from payment or receipt of advance consideration. If there are multiple payments or receipts in advance, the entity shall determine the date of the transaction for each payment or receipt of advance consideration. The Company applied IFRIC 22 prospectively to all assets, expenses and income recognized on or after January 1, 2018 within the scope of the interpretation.
b. Amendments to the Regulations Governing the Preparation of Financial Reports by Securities Issuers
and the International Financial Reporting Standards (IFRS), International Accounting Standards (IAS), Interpretations of IFRS (IFRIC) and Interpretations of IAS (SIC) (collectively, the “IFRSs”) endorsed by the FSC for application starting from 2019
New IFRSs Effective Date
Announced by IASB (Note 1) Annual Improvements to IFRSs 2015-2017 Cycle January 1, 2019 Amendments to IFRS 9 “Prepayment Features with Negative
Compensation” January 1, 2019 (Note 2)
IFRS 16 “Leases” January 1, 2019 Amendments to IAS 19 “Plan Amendment, Curtailment or
Settlement” January 1, 2019 (Note 3)
Amendments to IAS 28 “Long-term Interests in Associates and Joint Ventures”
January 1, 2019
IFRIC 23 “Uncertainty Over Income Tax Treatments” January 1, 2019 Note 1: Unless stated otherwise, the above New IFRSs are effective for annual periods beginning on
or after their respective effective dates. Note 2: The FSC permits the election for early adoption of the amendments starting from 2018. Note 3: The Company shall apply these amendments to plan amendments, curtailments or settlements
occurring on or after January 1, 2019. 1) IFRS 16 “Leases”
IFRS 16 sets out the accounting standards for leases that will supersede IAS 17, IFRIC 4 and a number of related interpretations. Definition of a lease Upon initial application of IFRS 16, the Company will elect to apply the guidance of IFRS 16 in determining whether contracts are, or contain, a lease only to contracts entered into (or changed) on or after January 1, 2019. Contracts identified as containing a lease under IAS 17 and IFRIC 4 will not be reassessed and will be accounted for in accordance with the transitional provisions under IFRS 16.
153

The Company as lessee Upon initial application of IFRS 16, the Company will recognize right-of-use assets and lease liabilities for all leases on the balance sheets except for those whose payments under low-value assets and short-term leases will be recognized as expenses on a straight-line basis. On the statements of comprehensive income, the Company will present the depreciation expense charged on right-of-use assets separately from the interest expense accrued on lease liabilities; interest is computed using the effective interest method. On the statements of cash flows, cash payments for the principal portion of lease liabilities will be classified within financing activities; cash payments for the interest portion will be classified within operating activities. Currently, payments under operating lease contracts, are recognized as expenses on a straight-line basis. Cash flows for operating leases are classified within operating activities on the statements of cash flows. Leased assets and finance lease payables are recognized for contracts classified as finance leases. The Company anticipates applying IFRS 16 retrospectively with the cumulative effect of the initial application of this standard recognized on January 1, 2019. Comparative information will not be restated. Lease liabilities will be recognized on January 1, 2019 for leases currently classified as operating leases with the application of IAS 17. Lease liabilities will be measured at the present value of the remaining lease payments, discounted using the lessee’s incremental borrowing rate on January 1, 2019. The Company will apply IAS 36 to all right-of-use assets. The Company expects to apply the following practical expedients: a) The Company will apply a single discount rate to a portfolio of leases with reasonably similar
characteristics to measure lease liabilities. b) The Company will account for those leases for which the lease term ends on or before
December 31, 2019 as short-term leases. c) The Company will exclude initial direct costs from the measurement of right-of-use assets on
January 1, 2019. d) The Company will use hindsight, such as in determining lease terms, to measure lease liabilities. The Company as lessor The Company will not make any adjustments for leases in which it is a lessor and will account for those leases with the application of IFRS 16 starting from January 1, 2019. Anticipated impact on assets, liabilities and equity
Carrying Amount as of December 31,
2018
Adjustments Arising from
Initial Application
Adjusted Carrying
Amount as of January 1, 2019
Right-of-use assets $ - $ 17,033 $ 17,033 Total effect on assets $ - $ 17,033 $ 17,033
(Continued)
154

Carrying Amount as of December 31,
2018
Adjustments Arising from
Initial Application
Adjusted Carrying
Amount as of January 1, 2019
Lease liabilities - current $ - $ 619 $ 619 Lease liabilities - non-current - 16,414 16,414 Total effect on liabilities $ - $ 17,033 $ 17,033
(Concluded)
2) IFRIC 23 “Uncertainty Over Income Tax Treatments” IFRIC 23 clarifies that when there is uncertainty over income tax treatments, the Company should assume that the taxation authority will have full knowledge of all related information when making related examinations. If the Company concludes that it is probable that the taxation authority will accept an uncertain tax treatment, the Company should determine the taxable profit, tax bases, unused tax losses, unused tax credits or tax rates consistently with the tax treatments used or planned to be used in its income tax filings. If it is not probable that the taxation authority will accept an uncertain tax treatment, the Company should make estimates using either the most likely amount or the expected value of the tax treatment, depending on which method the entity expects to better predict the resolution of the uncertainty. The Company has to reassess its judgments and estimates if facts and circumstances change.
3) Amendments to IAS 28 “Long-term Interests in Associates and Joint Ventures” The amendments clarified that IFRS 9 shall be applied to account for other financial instruments in an associate to which the equity method is not applied. These included long-term interests that, in substance, form part of the entity’s net investment in an associate. For long-term interests that, in substance, form part of the Company’s net investment in an associate and are governed by IFRS 9, the Company shall, based on the facts and circumstances that exist on January 1, 2019, perform an assessment of the classification under IFRS 9 applied retrospectively.
4) Amendments to IFRS 9 “Prepayment Features with Negative Compensation” IFRS 9 stipulated that if a contractual term of a financial asset permits the issuer (i.e. the debtor) to prepay a debt instrument or permits the holder (i.e. the creditor) to put a debt instrument back to the issuer before maturity and the prepayment amount substantially represents unpaid amounts of principal and interest on the principal amount outstanding, which may include reasonable compensation for early termination, the financial asset has contractual cash flows that are solely payments of principal and interest on the principal amount outstanding. The amendments further explained that reasonable compensation may be paid or received by either of the parties, i.e. a party may receive reasonable compensation when it chooses to terminate the contract early. Upon initial application of the above amendments, the Company will recognize the cumulative effect of retrospective application in retained earnings on January 1, 2019.
155

5) Annual Improvements to IFRSs 2015-2017 Cycle Several standards, including IFRS 3, IFRS 11, IAS 12 and IAS 23 “Borrowing Costs”, were amended in this annual improvement. IAS 23 was amended to clarify that, if any specific borrowing remains outstanding after the related asset is ready for its intended use or sale, the related borrowing costs shall be included in the calculation of the capitalization rate on general borrowings. Upon initial application of the above amendment, the related borrowing costs will be included in the calculation starting from 2019.
6) Amendments to IAS 19 “Plan Amendment, Curtailment or Settlement” The amendments stipulate that, if a plan amendment, curtailment or settlement occurs, the current service cost and the net interest for the remainder of the annual reporting period are determined using the actuarial assumptions used for the remeasurement of the net defined benefit liabilities (assets). In addition, the amendments clarify the effect of a plan amendment, curtailment or settlement on the requirements regarding the asset ceiling. The Company will apply the amendment prospectively.
Except for the above impact, as of the date the financial statements were authorized for issue, the Company assesses the significant impact that the application of other standards and interpretations will have no significant influence on the Company’s financial position and financial performance.
c. New IFRSs in issue but not yet endorsed and issued into effect by the FSC
New IFRSs Effective Date
Announced by IASB (Note 1) Amendments to IFRS 3 “Definition of a Business” January 1, 2020 (Note 2) Amendments to IFRS 10 and IAS 28 “Sale or Contribution of Assets
between An Investor and Its Associate or Joint Venture” To be determined by IASB
IFRS 17 “Insurance Contracts” January 1, 2021 Amendments to IAS 1 and IAS 8 “Definition of Material” January 1, 2020 (Note 3) Note 1: Unless stated otherwise, the above New IFRSs are effective for annual periods beginning on
or after their respective effective dates. Note 2: The Company shall apply these amendments to business combinations for which the
acquisition date is on or after the beginning of the first annual reporting period beginning on or after January 1, 2020 and to asset acquisitions that occur on or after the beginning of that period.
Note 3: The Company shall apply these amendments prospectively for annual reporting periods
beginning on or after January 1, 2020. 1) Amendments to IFRS 10 and IAS 28 “Sale or Contribution of Assets between an Investor and its
Associate or Joint Venture” The amendments stipulate that, when the Company sells or contributes assets that constitute a business (as defined in IFRS 3) to an associate, the gain or loss resulting from the transaction is recognized in full. Also, when the Company loses control of a subsidiary that contains a business but retains significant influence, the gain or loss resulting from the transaction is recognized in full.
156

Conversely, when the Company sells or contributes assets that do not constitute a business to an associate, the gain or loss resulting from the transaction is recognized only to the extent of the Company’s interest as an unrelated investor in the associate, i.e. the Company’s share of the gain or loss is eliminated. Also, when the Company loses control of a subsidiary that does not contain a business but retains significant influence over an associate, the gain or loss resulting from the transaction is recognized only to the extent of the Company’s interest as an unrelated investor in the associate, i.e. the Company’s share of the gain or loss is eliminated.
2) Amendments to IFRS 3 “Definition of a Business” The amendments clarify that, to be considered a business, an acquired set of activities and assets must include, at a minimum, an input and a substantive process applied to the input that together significantly contribute to the ability to create outputs. The amendments narrow the definitions of outputs by focusing on goods and services provided to customers, and the reference to an ability to reduce costs is removed. Moreover, the amendments remove the assessment of whether market participants are capable of replacing any missing inputs or processes and continuing to produce outputs. In addition, the amendments introduce an optional concentration test that permits a simplified assessment of whether an acquired set of activities and assets is not a business.
Except for the above impact, as of the date the consolidated financial statements were authorized for issue, the Company is continuously assessing the possible impact that the application of other standards and interpretations will have on the Company’s financial position and financial performance and will disclose the relevant impact when the assessment is completed.
4. SUMMARY OF SIGNIFICANT ACCOUNTING POLICIES
a. Statement of compliance The parent company only financial statements have been prepared in accordance with the Regulations Governing the Preparation of Financial Reports by Securities Issuers, and other regulations.
b. Basis of preparation The financial statements have been prepared on the historical cost basis except for financial instruments which are measured at fair value and net defined benefit liabilities which are measured at the present value of the defined benefit obligation less the fair value of plan assets. The fair value measurements, which are grouped into Levels 1 to 3 based on the degree to which the fair value measurement inputs are observable and based on the significance of the inputs to the fair value measurement in its entirety, are described as follows: 1) Level 1 inputs are quoted prices (unadjusted) in active markets for identical assets or liabilities; 2) Level 2 inputs are inputs other than quoted prices included within Level 1 that are observable for an
asset or liability, either directly (i.e. as prices) or indirectly (i.e. derived from prices); and 3) Level 3 inputs are unobservable inputs for an asset or liability.
157

When preparing these parent company only financial statements, the Company used the equity method to account for its investments in subsidiaries and associates. In order for the amounts of the net profit for the year, other comprehensive income for the year and total equity in the parent company only financial statements to be the same with the amounts attributable to the owners of the Company in its consolidated financial statements, adjustments arising from the differences in accounting treatments between the parent company only basis and the consolidated basis were made to investments accounted for using the equity method, the share of profit or loss of subsidiaries and associates, the share of other comprehensive income of subsidiaries and associates and the related equity items, as appropriate, in these parent company only financial statements.
c. Classification of current and non-current assets and liabilities Current assets include: 1) Assets held primarily for the purpose of trading; 2) Assets expected to be realized within 12 months after the reporting period; and 3) Cash and cash equivalents unless the asset is restricted from being exchanged or used to settle a
liability for at least 12 months after the reporting period. Current liabilities include: 1) Liabilities held primarily for the purpose of trading; 2) Liabilities due to be settled within 12 months after the reporting period, even if an agreement to
refinance, or to reschedule payments, on a long-term basis is completed after the reporting period and before the financial statements are authorized for issue; and
3) Liabilities for which the Company does not have an unconditional right to defer settlement for at
least 12 months after the reporting period. Terms of a liability that could, at the option of the counterparty, result in its settlement by the issue of equity instruments do not affect its classification.
Assets and liabilities that are not classified as current are classified as non-current.
d. Business combinations Acquisitions of businesses are accounted for using the acquisition method. Acquisition-related costs are generally recognized in profit or loss as they are incurred. Goodwill is measured as the excess of the sum of the consideration transferred and the fair value of the acquirer’s previously held equity interests in the acquiree over the net of the acquisition-date amounts of the identifiable assets acquired and the liabilities assumed. Where the consideration the Company transfers in a business combination includes assets or liabilities resulting from a contingent consideration arrangement, the contingent consideration is measured at its acquisition-date fair value and considered as part of the consideration transferred in a business combination. Changes in the fair value of the contingent consideration that qualify as measurement period adjustments are adjusted retrospectively, with the corresponding adjustments being made against goodwill or gains on bargain purchases. Measurement period adjustments are adjustments that arise from additional information obtained during the measurement period about facts and circumstances that existed as of the acquisition date. The measurement period does not exceed 1 year from the acquisition date.
158
The subsequent accounting for changes in the fair value of the contingent consideration that do not qualify as measurement period adjustments depends on how the contingent consideration is classified. Other contingent consideration is remeasured at fair value at the end of subsequent reporting period with any gain or loss recognized in profit or loss. If the initial accounting for a business combination is incomplete by the end of the reporting period in which the combination occurs, the Group reports provisional amounts for the items for which the accounting is incomplete. Those provisional amounts are adjusted retrospectively during the measurement period, or additional assets or liabilities are recognized, to reflect new information obtained about facts and circumstances that existed as of the acquisition date that, if known, would have affected the amounts recognized as of that date.
e. Foreign currencies In preparing the Company’s financial statements, transactions in currencies other than the Company’s functional currency (foreign currencies) are recognized at the rates of exchange prevailing at the dates of the transactions. At the end of each reporting period, monetary items denominated in foreign currencies are retranslated at the rates prevailing at that date. Exchange differences on monetary items arising from settlement or translation are recognized in profit or loss in the period in which they arise. Non-monetary items measured at fair value that are denominated in foreign currencies are retranslated at the rates prevailing at the date when the fair value was determined. Exchange differences arising from the retranslation of non-monetary items are included in profit or loss for the period except for exchange differences arising from the retranslation of non-monetary items in respect of which gains and losses are recognized directly in other comprehensive income, in which cases, the exchange differences are also recognized directly in other comprehensive income. Non-monetary items that are measured at historical cost in a foreign currency are not translated using the exchange rate at the date of the transaction. For the purpose of presenting financial statements, the functional currencies of the Company’s foreign operations (including subsidiaries and associates in other countries that use currencies which are different from the currency of the Company) are translated into the presentation currency, the New Taiwan dollars, as follows: Assets and liabilities are translated at the exchange rates prevailing at the end of the reporting period; and income and expense items are translated at the average exchange rates for the period. The resulting currency translation differences are recognized in other comprehensive income. Goodwill and fair value adjustments on identifiable assets and liabilities acquired arising from the acquisition of a foreign operation are treated as assets and liabilities of the foreign operation and translated at the rate of exchange prevailing at the end of each reporting period. Exchange differences arising are recognized in other comprehensive income.
f. Inventories
Inventories consist of raw materials, supplies, finished goods and work in process and are stated at the lower of cost or net realizable value. Inventory write-downs are made by item, except where it may be appropriate to group similar or related items. The net realizable value is the estimated selling price of inventories less all estimated costs of completion and costs necessary to make the sale. Inventories are recorded at the weighted-average cost on the balance sheet date.
g. Investment in subsidiaries
The Company uses the equity method to account for its investments in subsidiaries.
159

A subsidiary is an entity (including a structured entity) that is controlled by the Company. Under the equity method, an investment in a subsidiary is initially recognized at cost and adjusted thereafter to recognize the Company’s share of the profit or loss and other comprehensive income of the subsidiary. The Company also recognizes the changes in the Company’s share of equity of the subsidiaries. Changes in the Company’s ownership interests in subsidiaries that do not result in the Company losing control of the subsidiaries are equity transactions. The Company recognizes directly in equity any difference between the carrying amount of the investment and the fair value of the consideration paid or received. When the Company’s share of losses of a subsidiary exceeds its interest in that subsidiary (which includes any carrying amount of the investment accounted for using the equity method and long-term interests that, in substance, form part of the Company’s net investment in the subsidiary), the Company continues recognizing its share of further losses. Any excess of the cost of acquisition over the Company’s share of the net fair value of the identifiable assets and liabilities of a subsidiary at the date of acquisition is recognized as goodwill, which is included within the carrying amount of the investment and is not amortized. Any excess of the Company’s share of the net fair value of the identifiable assets and liabilities over the cost of acquisition is recognized immediately in profit or loss. The Company assesses its investment for any impairment by comparing the carrying amount with the estimated recoverable amount as assessed based on the investee’s financial statements as a whole. Impairment loss is recognized when the carrying amount exceeds the recoverable amount. If the recoverable amount of the investment subsequently increases, the Company recognizes a reversal of the impairment loss; the adjusted post-reversal carrying amount should not exceed the carrying amount that would have been recognized (net of amortization or depreciation) had no impairment loss been recognized in prior years. An impairment loss recognized on goodwill cannot be reversed in a subsequent period. When the Company loses control of a subsidiary, it recognizes the investment retained in the former subsidiary at its fair value at the date when control is lost. The difference between the fair value of the retained investment plus any consideration received and the carrying amount of the previous investment at the date when control is lost is recognized as a gain or loss in profit or loss. Besides, the Company accounts for all amounts previously recognized in other comprehensive income in relation to that subsidiary on the same basis as would be required if the Company had directly disposed of the related assets or liabilities. Profits or losses resulting from downstream transactions are eliminated in full only in the parent company’s financial statements. Profits and losses resulting from upstream transactions and transactions between subsidiaries are recognized only in the parent company’s financial statements only to the extent of interests in the subsidiaries that are not related to the Company.
h. Investment in associates An associate is an entity over which the Company has significant influence and that is not a subsidiary. The Company uses the equity method to account for its investment in associates. Under the equity method, investments in an associate are initially recognized at cost and adjusted thereafter to recognize the Company’s share of the profit or loss and other comprehensive income of the associate. The Company also recognizes the changes in the Company’s share of the equity of associates attributable to the Company.
160
Any excess of the cost of acquisition over the Company’s share of the net fair value of the identifiable assets and liabilities of an associate at the date of acquisition is recognized as goodwill, which is included within the carrying amount of the investment and is not amortized. Any excess of the Company’s share of the net fair value of the identifiable assets and liabilities over the cost of acquisition, after reassessment, is recognized immediately in profit or loss. When the Company subscribes for additional new shares of the associate at a percentage different from its existing ownership percentage, the resulting carrying amount of the investment differs from the amount of the Company’s proportionate interest in the associate. The Company records such a difference as an adjustment to investments with the corresponding amount charged or credited to capital surplus - changes in capital surplus from investments in associates accounted for using the equity method. If the Company’s ownership interest is reduced due to the additional subscription of the new shares of associate, the proportionate amount of the gains or losses previously recognized in other comprehensive income in relation to that associate is reclassified to profit or loss on the same basis as would be required if the investee had directly disposed of the related assets or liabilities. When the adjustment should be debited to capital surplus, but the capital surplus recognized from investments accounted for by the equity method is insufficient, the shortage is debited to retained earnings. When the Company’s share of losses of an associate equals or exceeds its interest in that associate (which includes any carrying amount of the investment accounted for using the equity method and long-term interests that, in substance, form part of the Company’s net investment in the associate), the Company discontinues recognizing its share of further losses. Additional losses and liabilities are recognized only to the extent that the Company has incurred legal obligations, or constructive obligations, or made payments on behalf of that associate. The entire carrying amount of an investment (including goodwill) is tested for impairment as a single asset by comparing its recoverable amount with its carrying amount. Any impairment loss recognized is not allocated to any asset, including goodwill, that forms part of the carrying amount of the investment. Any reversal of that impairment loss is recognized to the extent that the recoverable amount of the investment subsequently increases. The Company discontinues the use of the equity method from the date on which its investment ceases to be an associate. Any retained investment is measured at fair value at that date and the fair value is regarded as the investment’s fair value on initial recognition as a financial asset. The difference between the previous carrying amount of the associate attributable to the retained interest and its fair value is included in the determination of the gain or loss on disposal of the associate. The Company accounts for all amounts previously recognized in other comprehensive income in relation to that associate on the same basis as would be required had that associate had directly disposed of the related assets or liabilities. When the company entity transacts with its associate, profits and losses resulting from the transactions with the associate are recognized in the financial statements only to the extent that interests in the associate are not related to the Company.
i. Property, plant and equipment
Property, plant and equipment are measured at cost less accumulated depreciation and accumulated impairment loss. Property, plant and equipment in the course of construction are measured at cost less any recognized impairment loss. Cost includes professional fees and borrowing costs eligible for capitalization. Such assets are depreciated and classified to the appropriate categories of property, plant and equipment when completed and ready for their intended use. Freehold land is not depreciated.
161

Depreciation of property, plant and equipment is recognized using the straight-line method. Each significant part is depreciated separately. The estimated useful lives, residual values and depreciation methods are reviewed at the end of each reporting period, with the effects of any changes in estimates accounted for on a prospective basis. On derecognition of an item of property, plant and equipment, the difference between the sales proceeds and the carrying amount of the asset and is recognized in profit or loss.
j. Goodwill Goodwill arising from the acquisition of a business is measured cost as established at the date of acquisition of the business less accumulated impairment loss. For the purposes of impairment testing, goodwill is allocated to each of the Company’s cash-generating units or groups of cash-generating units (referred to as cash-generating units) that is expected to benefit from the synergies of the combination. A cash-generating unit to which goodwill has been allocated is tested for impairment annually or more frequently when there is an indication that the unit may be impaired, by comparing its carrying amount, including the attributed goodwill, with its recoverable amount. However, if the goodwill allocated to a cash-generating unit was acquired in a business combination during the current annual period, that unit shall be tested for impairment before the end of the current annual period. If the recoverable amount of the cash-generating unit is less than its carrying amount, the impairment loss is allocated first to reduce the carrying amount of any goodwill allocated to the unit and then pro rata to the other assets of the unit based on the carrying amount of each asset in the unit. Any impairment loss is recognized directly in profit or loss. An impairment loss recognized for goodwill is not reversed in subsequent periods. If goodwill has been allocated to a cash-generating unit and the entity disposes of an operation within that unit, the goodwill associated with the operation which is disposed of is included in the carrying amount of the operation when determining the gain or loss on disposal and is measured on the basis of the relative values of the operation deposed of and the portion of the cash-generating unit retained.
k. Intangible assets
1) Intangible assets acquired separately Intangible assets with finite useful lives that are acquired separately are initially measured at cost and subsequently measured at cost less accumulated amortization and accumulated impairment loss. Amortization is recognized on a straight-line basis. The estimated useful lives, residual values, and amortization methods are reviewed at the end of each reporting period, with the effect of any changes in the estimates accounted for on a prospective basis. Intangible assets with indefinite useful lives that are acquired separately are measured at cost less accumulated impairment loss.
2) Derecognition of intangible assets On derecognition of an intangible asset, the difference between the net disposal proceeds and the carrying amount of the asset is recognized in profit or loss.
162

l. Impairment of tangible and intangible assets other than goodwill At the end of each reporting period, the Company reviews the carrying amounts of its tangible and intangible assets, excluding goodwill, to determine whether there is any indication that those assets have suffered an impairment loss. If any such indication exists, the recoverable amount of the asset is estimated in order to determine the extent of the impairment loss. When it is not possible to estimate the recoverable amount of an individual asset, the Company estimates the recoverable amount of the cash-generating unit to which the asset belongs. Corporate assets are allocated to the individual cash-generating units on a reasonable and consistent basis of allocation. The recoverable amount is the higher of fair value less costs to sell and value in use. If the recoverable amount of an asset or cash-generating unit is estimated to be less than its carrying amount, the carrying amount of the asset or cash-generating unit is reduced to its recoverable amount, with the resulting impairment loss recognized in profit or loss. When an impairment loss is subsequently reversed, the carrying amount of the asset or cash-generating unit is increased to the revised estimate of its recoverable amount, but only to the extent of the carrying amount that would have been determined had no impairment loss been recognized for the asset or cash-generating unit in prior years. A reversal of an impairment loss is recognized in profit or loss.
m. Financial instruments Financial assets and financial liabilities are recognized when the Company becomes a party to the contractual provisions of the instruments. Financial assets and financial liabilities are initially measured at fair value. Transaction costs that are directly attributable to an acquisition or issuance of financial assets and financial liabilities (other than financial assets and financial liabilities at fair value through profit or loss) are added to or deducted from the fair value of the financial assets or financial liabilities, as appropriate, on initial recognition. Transaction costs directly attributable to the acquisition of financial assets or financial liabilities at fair value through profit or loss are recognized immediately in profit or loss. 1) Financial assets
All regular way purchases or sales of financial assets are recognized and derecognized on a trade date basis. a) Measurement categories
2018 Financial assets are classified into the following categories: Financial assets at FVTPL, financial assets at amortized cost and investments in equity instruments at FVTOCI. i. Financial assets at FVTPL
Financial assets are classified as at FVTPL when such a financial asset is mandatorily classified or designated as at FVTPL. Financial assets mandatorily classified as at FVTPL include investments in equity instruments which are not designated as at FVTOCI and debt instruments that do not meet the amortized cost criteria or the FVTOCI criteria. Financial assets at FVTPL are subsequently measured at fair value, with any gains or losses arising on remeasurement recognized in profit or loss. The net gain or loss recognized in profit or loss any dividends or interest earned on such a financial asset. Fair value is determined in the manner described in Note 27.
163

ii. Financial assets at amortized cost Financial assets that meet the following conditions are subsequently measured at amortized cost: i) The financial asset is held within a business model whose objective is to hold financial
assets in order to collect contractual cash flows; and ii) The contractual terms of the financial asset give rise on specified dates to cash flows
that are solely payments of principal and interest on the principal amount outstanding. Subsequent to initial recognition, financial assets at amortized cost, including cash and cash equivalents, and trade receivables at amortized cost, are measured at amortized cost, which equals the gross carrying amount determined using the effective interest method less any impairment loss. Exchange differences are recognized in profit or loss. Interest income is calculated by applying the effective interest rate to the gross carrying amount of such a financial asset, except for: i) Purchased or originated credit-impaired financial assets, for which interest income is
calculated by applying the credit-adjusted effective interest rate to the amortized cost of such financial assets; and
ii) Financial assets that are not credit-impaired on purchase or origination but have
subsequently become credit-impaired, for which interest income is calculated by applying the effective interest rate to the amortized cost of such financial assets in subsequent reporting periods.
Cash equivalents include time deposits with original maturities within 3 months from the date of acquisition, which are highly liquid, readily convertible to a known amount of cash and are subject to an insignificant risk of changes in value. These cash equivalents are held for the purpose of meeting short-term cash commitments.
iii. Investments in equity instruments at FVTOCI On initial recognition, the Company may make an irrevocable election to designate investments in equity instruments as at FVTOCI. Designation as at FVTOCI is not permitted if the equity investment is held for trading or if it is contingent consideration recognized by an acquirer in a business combination. Investments in equity instruments at FVTOCI are subsequently measured at fair value with gains and losses arising from changes in fair value recognized in other comprehensive income and accumulated in other equity. The cumulative gain or loss will not be reclassified to profit or loss on disposal of the equity investments; instead, it will be transferred to retained earnings. Dividends on these investments in equity instruments are recognized in profit or loss when the Company’s right to receive the dividends is established, unless the dividends clearly represent a recovery of part of the cost of the investment.
2017 Financial assets are classified into the following categories: Financial assets at fair value through profit or loss, available-for-sale financial assets, and loans and receivables.
164

i. Financial assets at fair value through profit or loss
Financial assets are classified as at fair value through profit or loss when the financial assets are either held for trading or designated as at fair value through profit or loss. Financial assets at fair value through profit or loss are stated at fair value, with any gains or losses arising on remeasurement recognized in profit or loss. The net gain or loss recognized in profit or loss incorporates any dividend or interest earned on the financial asset. Fair value is determined in the manner described in Note 27.
ii. Available-for-sale financial assets
Available-for-sale financial assets are non-derivatives that are either designated as available-for-sale or are not classified as loans and receivables, held-to-maturity investments or financial assets at fair value through profit or loss. Available-for-sale financial assets are measured at fair value. Changes in the carrying amounts of available-for-sale monetary financial assets relating to changes in foreign currency exchange rates, interest income calculated using the effective interest method and dividends on available-for-sale equity investments are recognized in profit or loss. Other changes in the carrying amount of available-for-sale financial assets are recognized in other comprehensive income and will be reclassified to profit or loss when the investments are disposed of or are determined to be impaired. Dividends on available-for-sale equity instruments are recognized in profit or loss when the Company’s right to receive the dividends is established.
iii. Loans and receivables Loans and receivables (including trade receivables and cash and cash equivalent) are measured using the effective interest method at amortized cost less any impairment, except for short-term receivables when the effect of discounting is immaterial. Cash equivalents include time deposits with original maturities within 3 months from the date of acquisition, which are highly liquid, readily convertible to a known amount of cash and are subject to an insignificant risk of changes in value. These cash equivalents are held for the purpose of meeting short-term cash commitments.
b) Impairment of financial assets 2018 The Company recognizes a loss allowance for expected credit losses on financial assets at amortized cost (including trade receivables), investments in debt instruments that are measured at FVTOCI, lease receivables, as well as contract assets. The Company always recognizes lifetime expected credit losses (i.e. ECLs) for trade receivables. For all other financial instruments, the Company recognizes lifetime ECLs when there has been a significant increase in credit risk since initial recognition. If, on the other hand, the credit risk on a financial instrument has not increased significantly since initial recognition, the Company measures the loss allowance for that financial instrument at an amount equal to 12-month ECLs.
165

Expected credit losses reflect the weighted average of credit losses with the respective risks of default occurring as the weights. Lifetime ECLs represent the expected credit losses that will result from all possible default events over the expected life of a financial instrument. In contrast, 12-month ECLs represent the portion of lifetime ECLs that is expected to result from default events on a financial instrument that are possible within 12 months after the reporting date. The Company recognizes an impairment gain or loss in profit or loss for all financial instruments with a corresponding adjustment to their carrying amount through a loss allowance account, except for investments in debt instruments that are measured at FVTOCI, for which the loss allowance is recognized in other comprehensive income and does not reduce the carrying amount of such a financial asset. 2017 Financial assets, other than those at fair value through profit or loss, are assessed for indicators of impairment at the end of each reporting period. Financial assets are considered to be impaired when there is objective evidence, as a result of one or more events that occurred after the initial recognition of the financial asset, that the estimated future cash flows of the investment have been affected. Financial assets at amortized cost, such as trade receivables are assessed for impairment on a collective basis even if they were assessed not to be impaired individually. Objective evidence of impairment for a portfolio of receivables could include the Company’s past experience of collecting payments, an increase in the number of delayed payments in the portfolio past the average credit period of 90 days, as well as observable changes in national or local economic conditions that correlate with defaults on receivables. For financial assets carried at amortized cost, the amount of the impairment loss recognized is the difference between the asset’s carrying amount and the present value of estimated future cash flows, discounted at the financial asset’s original effective interest rate. For a financial asset at amortized cost, if, in a subsequent period, the amount of the impairment loss decreases and the decrease can be related objectively to an event occurring after the impairment was recognized, the previously recognized impairment loss is reversed through profit or loss to the extent that the carrying amount of the investment at the date the impairment is reversed does not exceed what the amortized cost would have been had the impairment not been recognized. For available-for-sale equity investments, a significant or prolonged decline in the fair value of the security below its cost is considered to be objective evidence of impairment. For all other financial assets, objective evidence of impairment could include significant financial difficulty of the issuer or counterparty, breach of contract, such as a default or delinquency in interest or principal payments, it becoming probable that the borrower will enter bankruptcy or financial re-organization, or the disappearance of an active market for those financial assets because of financial difficulties. When an available-for-sale financial asset is considered to be impaired, cumulative gains or losses previously recognized in other comprehensive income are reclassified to profit or loss in the period.
166

In respect of available-for-sale equity securities, impairment loss previously recognized in profit or loss is not reversed through profit or loss. Any increase in fair value subsequent to an impairment loss is recognized in other comprehensive income. In respect of available-for-sale debt securities, impairment loss is subsequently reversed through profit or loss if an increase in the fair value of the investment can be objectively related to an event occurring after the recognition of the impairment loss. The carrying amount of the financial asset is reduced by the impairment loss directly for all financial assets, with the exception of trade receivables, where the carrying amount is reduced through the use of an allowance account. When trade receivables are considered uncollectible, they are written off against the allowance account. Subsequent recoveries of amounts previously written off are credited against the allowance account. Changes in the carrying amount of the allowance account are recognized in profit or loss except for uncollectible trade receivables that are written off against the allowance account.
c) Derecognition of financial assets The Company derecognizes a financial asset only when the contractual rights to the cash flows from the asset expire, or when it transfers the financial asset and substantially all the risks and rewards of ownership of the asset to another party. Before 2018, on derecognition of a financial asset in its entirety, the difference between the asset’s carrying amount and the sum of the consideration received and receivable and the cumulative gain or loss that had been recognized in other comprehensive income is recognized in profit or loss. Starting from 2018, on derecognition of a financial asset at amortized cost in its entirety, the difference between the asset’s carrying amount and the sum of the consideration received and receivable is recognized in profit or loss. On derecognition of an investment in an equity instrument at FVTOCI, the difference between the asset’s carrying amount and the sum of the consideration received and receivable is recognized in profit or loss, and the cumulative gain or loss that had been recognized in other comprehensive income is transferred directly to retained earnings, without recycling through profit or loss.
2) Equity instruments
Debt and equity instruments issued by the Company are classified as either financial liabilities or as equity in accordance with the substance of the contractual arrangements and the definitions of a financial liability and an equity instrument. Equity instruments issued by the Company are recognized at the proceeds received, net of direct issue costs. The repurchase of the Company’s own equity instruments is recognized in and deducted directly from equity. No gain or loss is recognized in profit or loss on the purchase, sale, issuance or cancellation of the Company’s own equity instruments.
3) Financial liabilities
a) Subsequent measurement Except the following situation, all financial liabilities are measured at amortized cost using the effective interest method: Financial liabilities at fair value through profit or loss Financial liabilities are classified as at fair value through profit or loss are either held for trading or are designated as at fair value through profit or loss.
167

Financial liabilities held for trading are stated at fair value, with any gain or loss arising on remeasurement recognized in profit or loss. The net gain or loss recognized in profit or loss incorporates any interest or dividend paid on the financial liability. Fair value is determined in the manner described in Note 27.
b) Derecognition of financial liabilities
The difference between the carrying amount of the financial liability derecognized and the consideration paid, including any non-cash assets transferred or liabilities assumed, is recognized in profit or loss.
4) Derivative financial instruments
The Company enters into forward contracts to manage its exposure to foreign exchange rate risks. Derivatives are initially recognized at fair value at the date on which the derivative contracts are entered into and are subsequently remeasured to their fair value at the end of each reporting period. The resulting gain or loss is recognized in profit or loss immediately unless the derivative is designated and effective as a hedging instrument, in which event the timing of the recognition in profit or loss depends on the nature of the hedge relationship. When the fair value of a derivative financial instruments is positive, the derivative is recognized as a financial asset; when the fair value of a derivative financial instrument is negative, the derivative is recognized as a financial liability. Before 2018, derivatives embedded in non-derivative host contracts were treated as separate derivatives when they met the definition of a derivative; their risks and characteristics were not closely related to those of the host contracts; and the contracts were not measured at FVTPL. Starting from 2018, derivatives embedded in hybrid contracts that contain financial asset hosts that is within the scope of IFRS 9 are not separated; instead, the classification is determined in accordance with the entire hybrid contract. Derivatives embedded in non-derivative host contracts that are not financial assets that is within the scope of IFRS 9 (e.g. financial liabilities) are treated as separate derivatives when they meet the definition of a derivative; their risks and characteristics are not closely related to those of the host contracts; and the host contracts are not measured at FVTPL.
n. Provisions
Provisions are measured at the best estimate of the discounted cash flows of the consideration required to settle the present obligation at the end of the reporting period, taking into account the risks and uncertainties surrounding the obligation. Provisions for the expected cost of warranty obligations are recognized at the date of sale of the relevant products at the best estimate by the management of the Company of the expenditure required to settle the Company’s obligations.
o. Revenue recognition
2018 Contracts applicable to IFRS 15 The Company identifies contracts with the customers, allocates transaction price to the performance obligations and recognizes revenue when the performance obligations are satisfied. For contracts where the period between the date on which the Company transfers a promised good or service to a customer and the date on which the customer pays for that good or service is one year or less, the Company does not adjust the promised amount of consideration for the effects of a significant financing component.
168

1) Revenue from sale of goods
Revenue from sale of goods comes from sales of embedded computing boards, industrial automation products and applied and industrial computers. Sales of the above products are majorly recognized as revenue under contracts when the goods are shipped because it is the time when the customer has full discretion over the manner of distribution and the price to sell the goods, has the primary responsibility for sales to future customers and bears the risks of obsolescence. Trade receivables are recognized concurrently. The Company does not recognize revenue on materials delivered to subcontractors because this delivery does not involve a transfer of control.
2) Revenue from rendering services Revenue from rendering services comes from developing products and extended warranty services. Such revenue is recognized when services are provided.
Contracts prior to 2018 without retrospective application of IFRS 15 Revenue is measured at the fair value of the consideration received or receivable. Revenue is reduced for estimated customer returns, rebates and other similar allowances. Allowances for sales returns and liabilities for returns are recognized at the time of sale based on the seller’s reliable estimate of future returns and based on past experience and other relevant factors. 1) Sale of goods
Revenue from the sale of goods is recognized when all the following conditions are satisfied: a) The Company has transferred to the buyer the significant risks and rewards of ownership of the
goods; b) The Company retains neither continuing managerial involvement to the degree usually
associated with ownership nor effective control over the goods sold; c) The amount of revenue can be measured reliably; d) It is probable that the economic benefits associated with the transaction will flow to the
Company; and e) The costs incurred or to be incurred in respect of the transaction can be measured reliably. The Company does not recognize sales revenue on materials delivered to subcontractors because this delivery does not involve a transfer of risks and rewards of the materials’ ownership.
2) Rendering of services Service income is recognized when services are provided. Revenue from a contract to provide services is recognized by reference to the stage of completion of the contract.
169

3) Dividend and interest income Dividend income from investments is recognized when the shareholder’s right to receive payment has been established and provided that it is probable that the economic benefits will flow to the Company and that the amount of income can be measured reliably. Interest income from a financial asset is recognized when it is probable that the economic benefits will flow to the Company and the amount of income can be measured reliably. Interest income is accrued on a time basis by reference to the principal outstanding and at the applicable effective interest rate.
p. Leasing
Leases are classified as finance leases whenever the terms of the lease transfer substantially all the risks and rewards of ownership to the lessee. All other leases are classified as operating leases. 1) The Company as lessor
Rental income from operating leases is recognized on a straight-line basis over the term of the relevant lease. Initial direct costs incurred in negotiating and arranging an operating lease are added to the carrying amount of the leased asset and amortized on a straight-line basis over the lease term.
2) The Company as lessee
Operating lease payments are recognized as expenses on a straight-line basis over the lease term.
q. Government grants
Government grants are not recognized until there is reasonable assurance that the Company will comply with the conditions attached to them and that the grants will be received. Government grants are recognized in profit or loss on a systematic basis over the periods in which the Company recognizes as expenses the related costs for which the grants are intended to compensate. Government grants that are receivable as compensation for expenses or losses already incurred or for the purpose of giving immediate financial support to the Company with no future related costs are recognized in profit or loss in the period in which they become receivable.
r. Employee benefits 1) Short-term employee benefits
Liabilities recognized in respect of short-term employee benefits are measured at the undiscounted amount of the benefits expected to be paid in exchange for the related services.
2) Retirement benefits
Payments to defined contribution retirement benefit plans are recognized as an expense when employees have rendered services entitling them to the contributions.
170

Defined benefit costs (including service cost, net interest and remeasurement) under defined benefit retirement benefit plans are determined using the projected unit credit method. Service cost (including current service cost, and past service cost) and net interest on the net defined benefit liabilities (assets) are recognized as employee benefits expense in the period in which they occur, or when the plan amendment or curtailment occurs. Remeasurement, comprising actuarial gains and losses, (the effect of the changes to the asset ceiling) and the return on plan assets (excluding interest), is recognized in other comprehensive income in the period in which it occurs. Remeasurement recognized in other comprehensive income is reflected immediately in retained earnings and will not be reclassified to profit or loss. Net defined benefit liabilities (assets) represent the actual deficit (surplus) in the Company’s defined benefit plans. Any surplus resulting from this calculation is limited to the present value of any refunds from the plans or reductions in future contributions to the plans.
s. Employee share options Employee share options granted to employee and others providing similar services. The fair value at the grant date of the employee share options is expensed on a straight-line basis over the vesting period, based on the Company’s best estimate of the number of shares or options that are expected to ultimately vest, with a corresponding increase in capital surplus - employee share options. It is recognized as an expense in full at the grant date if vesting immediately. At the end of each reporting period, the Company revises its estimate of the number of employee share options expected to vest. The impact of the revision of the original estimates is recognized in profit or loss such that the cumulative expense reflects the revised estimate, with a corresponding adjustment to the capital surplus - employee share options.
t. Taxation Income tax expense represents the sum of the tax currently payable and deferred tax. 1) Current tax
According to the Income Tax Law, an additional tax of unappropriated earnings is provided for as income tax in the year the shareholders approve to retain the earnings. Adjustments of prior years’ tax liabilities are added to or deducted from the current year’s tax provision.
2) Deferred tax
Deferred tax is recognized on temporary differences between the carrying amounts of assets and liabilities and the corresponding tax bases used in the computation of taxable profit. Deferred tax liabilities are generally recognized for all taxable temporary differences. Deferred tax assets are generally recognized for all deductible temporary differences, unused loss carryforwards and unused tax credits for purchases of machinery, equipment and technology, research and development expenditures, and personnel training expenditures to the extent that it is probable that taxable profits will be available against which those deductible temporary differences can be utilized.
171

Deferred tax liabilities are recognized for taxable temporary differences associated with investments in subsidiaries and associates, except where the Company is able to control the reversal of the temporary difference and it is probable that the temporary difference will not reverse in the foreseeable future. Deferred tax assets arising from deductible temporary differences associated with such investments and interests are only recognized to the extent that it is probable that there will be sufficient taxable profits against which to utilize the benefits of the temporary differences and they are expected to reverse in the foreseeable future. The carrying amount of deferred tax assets is reviewed at the end of each reporting period and reduced to the extent that it is no longer probable that sufficient taxable profits will be available to allow all or part of the asset to be recovered. A previously unrecognized deferred tax asset is also reviewed at the end of each reporting period and recognized to the extent that it has become probable that future taxable profit will allow the deferred tax asset to be recovered. Deferred tax liabilities and assets are measured at the tax rates that are expected to apply in the period in which the liabilities are settled or the assets are realized, based on tax rates (and tax laws) that have been enacted or substantively enacted by the end of the reporting period. The measurement of deferred tax liabilities and assets reflects the tax consequences that would follow from the manner in which the Company expects, at the end of the reporting period, to recover or settle the carrying amount of its assets and liabilities.
3) Current and deferred taxes for the year Current and deferred taxes are recognized in profit or loss, except when they relate to items that are recognized in other comprehensive income or directly in equity, in which case, the current and deferred taxes are also recognized in other comprehensive income or directly in equity, respectively.
5. CRITICAL ACCOUNTING JUDGMENTS AND KEY SOURCES OF ESTIMATION
UNCERTAINTY In the application of the Company’s accounting policies, management is required to make judgments, estimations and assumptions about the carrying amounts of assets and liabilities that are not readily apparent from other sources. The estimates and associated assumptions are based on historical experience and other factors that are considered relevant. Actual results may differ from these estimates. The estimates and underlying assumptions are reviewed on an ongoing basis. Revisions to accounting estimates are recognized in the period in which the estimates are revised if the revisions affect only that period or in the period of the revisions and future periods if the revisions affect both current and future periods. a. Inventory write-downs
The net realizable value of inventories is the estimated selling price in the ordinary course of business less the estimated costs of completion and disposal. The estimation of net realizable value is based on current market conditions and historical experience with product sales of a similar nature. Changes in market conditions may have a material impact on the estimation of the net realizable value.
b. Significant influence over associates
Note 12 describes that several companies are associates of the Company although the Company only holds less than 20% of the voting power in each of these companies. The Company has significant influence over these companies as it can obtain its representatives in the board of directors according to the investment contract.
172

c. Impairment of goodwill included in the investments in subsidiaries Determining whether the goodwill included in the investments in subsidiaries is impaired requires an estimation of the value in use of the cash-generating units which are expected to benefit from the synergies of the related combination and to which the goodwill has been allocated since the acquisition date. The calculation of the value in use requires management to estimate the future cash flows expected to arise from the cash-generating units and a suitable discount rate in order to calculate the present value. Where the actual future cash flows are less than expected, a material impairment loss may arise.
6. CASH AND CASH EQUIVALENTS December 31 2018 2017 Cash on hand $ 245 $ 245 Checking accounts and demand deposits 2,509,713 2,436,403 $ 2,509,958 $ 2,436,648 The market rate intervals of cash in bank at the end of the reporting period were as follows: December 31 2018 2017 Demand deposits 0.0001%-0.48% 0.0001%-0.35%
7. FINANCIAL INSTRUMENTS AT FAIR VALUE THROUGH PROFIT OR LOSS December 31 2018 2017 Financial assets at FVTPL - current Financial assets held for trading
Derivative financial assets(not under hedge accounting) Foreign exchange forward contracts $ - $ 5,084
Non-derivative financial assets Mutual funds - 640,016 - 645,100
Financial assets mandatorily classified as at FVTPL Derivative financial assets (not under hedge accounting)
Foreign exchange forward contracts 5,167 - Non-derivative financial assets
Mutual funds 1,355,214 - 1,360,381 - $ 1,360,381 $ 645,100
(Continued)
173

December 31 2018 2017 Financial liabilities at FVTPL - current Financial liabilities held for trading
Derivative financial liabilities(not under hedge accounting) Foreign exchange forward contracts $ - $ 6,226
Financial assets mandatorily classified as at FVTPL Derivative financial assets (not under hedge accounting)
Foreign exchange forward contracts 6,128 - $ 6,128 $ 6,226
(Concluded) At the end of the reporting period, outstanding foreign exchange forward contracts not under hedge accounting were as follows:
Currency Maturity Date Notional Amount (In Thousands)
December 31, 2018 Sell EUR/NTD 2019.01-2019.04 EUR12,500/NTD444,766 JPY/NTD 2019.01-2019.05 JPY380,000/NTD104,301 RMB/NTD 2019.01-2019.04 RMB67,000/NTD295,236 December 31, 2017 Sell EUR/NTD 2018.01-2018.05 EUR14,000/NTD499,225 EUR/USD 2018.01-2018.04 EUR1,500/USD1,805 JPY/NTD 2018.01-2018.05 JPY500,000/NTD134,549 RMB/NTD 2018.01-2018.03 RMB77,000/NTD346,212 The Company entered into foreign exchange forward contracts during the years ended December 31, 2018 and 2017 to manage exposures due to exchange rate fluctuations of foreign-currency denominated assets and liabilities. Because these contracts did not meet the criteria for hedge effectiveness, they were not subject to hedge accounting.
8. FINANCIAL ASSETS AT FAIR VALUE THROUGH OTHER COMPREHENSIVE INCOME -
2018
December 31,
2018 Non-current Investments in equity instrument at FVTOCI $ 1,028,441
174

Investments in equity instruments at FVTOCI:
December 31,
2018 Non-current Domestic investments
Listed shares and emerging market shares Ordinary shares - ASUSTek Computer Inc. $ 955,001 Ordinary shares - Allied Circuit Co., Ltd. 73,440
$ 1,028,441 These investments in equity instruments are not held for trading. Instead, they are held for medium to long-term strategic purposes. Accordingly, the management elected to designate these investments in equity instruments as at FVTOCI as they believe that recognizing short-term fluctuations in these investments’ fair value in profit or loss would not be consistent with the Company’s strategy of holding these investments for long-term purposes. These investments in equity instruments were classified as available-for-sale under IAS 39. Refer to Notes 3 and 9 for information related to their reclassification and comparative information for 2017.
9. AVAILABLE-FOR-SALE FINANCIAL ASSETS - 2017
December 31,
2017 Non-current Domestic investments
Quoted shares $ 1,419,479
10. NOTES RECEIVABLE AND TRADE RECEIVABLES
December 31 2018 2017
Notes receivable-operating $ 75,203 $ 62,468 Trade receivables At amortized cost
Gross carrying amount $ 1,499,599 $ 1,551,178 Less: Allowance for impairment loss (11,762) (5,043)
$ 1,487,837 $ 1,546,135
175

Trade Receivables For the year ended December 31, 2018 At amortized cost The average credit period of the sales of goods was 30-90 days. No interest was charged on trade receivables. In order to minimize credit risk, the management of the Company has delegated a team responsible for determining credit limits, credit approvals and other monitoring procedures to ensure that follow-up action is taken to recover overdue debts. In addition, the Company reviews the recoverable amount of each individual trade debt at the end of the reporting period to ensure that adequate allowance is made for possible irrecoverable amounts. In this regard, the management believes the Company’s credit risk was significantly reduced. The Company applies the simplified approach to providing for expected credit losses prescribed by IFRS 9, which permits the use of a lifetime expected loss provision for all trade receivables. The expected credit losses on trade receivables are estimated using a provision matrix by reference to past default experience of the debtor and an analysis of the debtor’s current financial positions, adjusted for general economic conditions of the industry in which the debtors operate and an assessment of both the current as well as the forecast direction of economic conditions at the reporting date. As the Company’s historical credit loss experience does not show significantly different loss patterns for different customer segments, the provision for loss allowance based on past due status is not further distinguished according to the Company’s customer base. The Company writes off a trade receivable when there is information indicating that the debtor is in severe financial difficulty and there is no realistic prospect of recovery of the receivable, e.g. when the debtor has been placed under liquidation, or when the trade receivables are over 1 year past due, whichever occurs earlier. For trade receivables that have been proposed a full amount of impairment loss, the Company continues to engage in enforcement activity to attempt to recover the receivables due. Where recoveries are made, these are recognized in profit or loss. The following table details the loss allowance of trade receivables based on the Company’s provision matrix. December 31, 2018 Not Past Due
Less than 90 Days 90 to 180 Days
180 to 360 Days Over 360 Days Total
Expected credit loss rate 0% 1.06% 23.49% 40.13% 100% - Gross carrying amount $ 1,244,881 $ 234,046 $ 2,490 $ 15,833 $ 2,349 $ 1,499,599 Loss allowance (Lifetime ECL) - (2,474 ) (585 ) (6,354 ) (2,349 ) (11,762 ) Amortized cost $ 1,244,881 $ 231,572 $ 1,905 $ 9,479 $ - $ 1,487,837 The movements of the loss allowance of trade receivables were as follows: 2018 Balance at January 1, 2018 - per IAS 39 $ 5,043 Adjustment on initial application of IFRS 9 - Balance at January 1, 2018 - per IFRS 9 5,043 Add: Net remeasurement of loss allowance 6,815 Less: Amounts written off (*) (96) Foreign exchange gains and losses - Balance at December 31, 2018 $ 11,762
176

* The Company wrote off trade receivables and related loss allowance of $96 thousand due to the fact
that the customers’ trade receivables have been aged more than 2 years and the legal attest letters were served without receivables collected.
For the year ended December 31, 2017 The Company applied the same credit policy in 2018 and 2017. The Company recognized an allowance for impairment loss of 100% against all receivables over 1 year because historical experience was that receivables that are past due beyond 1 year were not recoverable. Allowance for impairment loss was recognized against trade receivables between 91 days and 1 year based on estimated irrecoverable amounts determined by reference to past default experience of the counterparties and an analysis of their current financial position. For some trade receivables balances that were past due at the end of the reporting period, the Company did not recognize an allowance for impairment loss, because there was no significant change in credit quality and the amounts were still considered recoverable. The Company did not hold any collateral or other credit enhancements for these balances. The aging of receivables was as follows:
December 31,
2017 Not overdue $ 1,375,038 Overdue
1 to 90 days 164,718 91 to 360 days 11,422 Over 360 days -
$ 1,551,178 The above aging schedule was based on the number of past due days from the end of the credit term. The aging of receivables that were past due but not impaired was as follows:
December 31,
2017 1 to 30 days $ 148,904 31 to 60 days 7,821 61 to 90 days 7,993 $ 164,718 The above aging schedule was based on the number of past due days from the end of the credit term.
177

The movements of the allowance for doubtful trade receivables were as follows:
Individually Assessed for Impairment
Collectively Assessed for Impairment Total
Balance at January 1, 2017 $ 13,686 $ 3,330 $ 17,016 Plus: Impairment losses recognized on
receivables 185 - 185 Less: Amounts written off during the year as
uncollectible (12,158) - (12,158) Balance at December 31, 2017 $ 1,713 $ 3,330 $ 5,043
11. INVENTORIES
December 31 2018 2017
Finished goods $ 1,208,126 $ 869,571 Work in process 757,869 580,887 Raw materials 1,602,963 1,163,823 Inventories in transit 62,021 40,400 $ 3,630,979 $ 2,654,681 The costs of inventories recognized as cost of goods sold for the years ended December 31, 2018 and 2017 were $24,494,077 thousand and $21,396,382 thousand, respectively. The costs of inventories decreased by $184,980 thousand and $135,055 thousand as of December 31, 2018 and 2017, respectively, when stated at the lower of cost or net realizable value.
12. INVESTMENTS ACCOUNTED FOR USING THE EQUITY METHOD December 31 2018 2017 Investments in subsidiaries $ 16,235,491 $ 15,328,904 Investments in associates 1,488,161 1,262,151 $ 17,723,652 $ 16,591,055 a. Investments in subsidiaries
December 31 2018 2017 Unlisted companies
Advantech Automation Corp. (BVI) (“AAC (BVI)”) $ 5,932,170 $ 4,187,055 Advantech Technology Co., Ltd. (“ATC”) 3,718,200 3,518,872 Advantech Corporate Investment 1,590,325 1,899,479 Advanixs Corp. 237,593 856,049
(Continued)
178

December 31 2018 2017
Advantech Europe Holding B.V. (“AEUH”) $ 900,798 $ 925,225 LNC Technology Co., Ltd. (“LNC”) 433,078 492,441 AdvanPOS Technology Co., Ltd. (“AdvanPOS”) 297,296 552,116 Advantech KR Co., Ltd. (“AKR”) 322,524 278,131 Advantech Japan Co., Ltd. (“AJP”) 332,224 269,111 Advantech Co. Singapore Pte, Ltd. (“ASG”) 108,015 90,848 Advantech Brasil Ltda. (“ABR”) 67,328 64,801 Advantech Co. Malaysia Sdn. Bhd. (“AMY”) 68,499 66,713 Advantech Australia Pty Ltd. (“AAU”) 36,226 49,785 Advantech Industrial Computing India Private Limited
(“AIN”) 10,714
11,376 Advantech Innovative Design Co., Ltd. 10,066 10,421 Advantech Electronics, S. De R. L. Dec. V. (“AMX”) 222 (399) BEMC Holdings Corporation (“BEMC”) - 1,885,077 B+B SmartWorx, Inc. (B+B) 1,951,772 - Advantech Intelligent Service (“AiST”) 96,183 171,803 Kostec Co., Ltd. (“AKST”) (27,036) - Advantech Corporation (Thailand) Co., Ltd. (ATH) 51,353 - Advantech Vietnam Technology Company Limited (AVN) 76,539 - Advantech Technology Limited Liability Company (ARU) 21,402 -
$ 16,235,491 $ 15,328,904
(Concluded)
December 31 2018 2017 AAC (BVI) 100.00% 100.00% ATC 100.00% 100.00% Advantech Corporate Investment 100.00% 100.00% Advanixs Corporation 100.00% 100.00% AEUH 100.00% 100.00% LNC (Note 24) 64.10% 81.17% AdvanPOS 100.00% 100.00% AKR 100.00% 100.00% AJP 100.00% 100.00% ASG 100.00% 100.00% ABR 80.00% 80.00% AMY 100.00% 100.00% AAU 100.00% 100.00% AIN 99.99% 99.99% Advantech Innovative Design Co., Ltd. 100.00% 100.00% AMX 100.00% 100.00% BEMC - 60.00% B+B 60.00% - AiST 100.00% 100.00% AKST (Note 23 and 24) 76.00% 36.00% ATH (Note 24) 51.00% - AVN (Note 23) 60.00% - ARU 100.00% -
179

Refer to Note 29 to the Company’s consolidated financial statements of the year ended December 31, 2018 for the disclosures of the Company’s acquisitions of AVN and AKST. In the forth quarter of 2018, the Company adjusted its investment structure and placed BEMC under liquidation, which led the Company to directly hold B+B. Refer to Table 7 for the details of the subsidiaries indirectly held by the Company. Investments in the subsidiary AKST are accounted for using the equity method. As a result of the actual sales growth of the subsidiary AKST after the business combination did not turn out as expected, AKST had the continuous losses for the ended year December 31, 2017. In addition, the forecasted future operations of AKST is not optimism. Hence, the estimated future cash flows was decreased. The Company carried out a review of the recoverable amount of that related assets and determined that the carrying amount exceeded the recoverable amount. The review led the Company to recognize an impairment loss on investments in AKST of $66,443 thousand. Since AKST is mutually owned by AKR and the Company, an impairment loss of $44,328 thousand was recognized in the share of the profit of subsidiaries and associates. Except the financial statements of AJP, ASG, ABR, AMY, AAU, AIN, AMX, AKST, AVN, ATH, ARU, Advantech Innovative Design Co., Ltd., AiST and AdvanPOS, investments accounted for using the equity method and the share of profit or loss and other comprehensive income of those investments were calculated based on the financial statements which have been audited. Management believes there will be no material impact on its equity method accounting or its calculation of the share of profit or loss and other comprehensive income had the financial statements of the above subsidiaries been audited.
b. Investments in associates December 31 2018 2017 Associates that are not individually material Listed companies
Axiomtek Co., Ltd. (“Axiomtek”) $ 619,411 $ 622,604 Winmate Inc. (“Winmate”) 542,761 544,960 Nippon RAD Inc. (Nippon RAD) 252,967 -
Unlisted companies AIMobile Co., Ltd. (“AIMobile”) 65,012 84,140 Jan Hsiang Electronics Co., Ltd. (“Jan Hsiang”) 8,010 10,447 $ 1,488,161 $ 1,262,151
Aggregate information of associates that are not individually material For the Year Ended December 31 2018 2017 The Company’s share of:
Profit from continuing operations $ 121,391 $ 222,399 Other comprehensive income (loss) (1,021) (1,306) Total comprehensive income for the year $ 120,370 $ 221,093
In the fourth quarter of 2017, the Company paid cash of $540,000 thousand for 16.62% equity of Winmate Inc. The Company had significant influence over Winmate Inc.
180

In the second quarter of 2018, the Company paid cash of $251,915 thousand for 16.08% equity of Nippon RAD and holding a 19% equity of Nippon RAD with subsidiary Advantech Corporate. The Company had significant influence over Nippon RAD. Except for financial statement of Axiomtek Co., Ltd. and Nippon RAD which have been audited or reviewed, investments were accounted for using the equity method and the share of profit or loss and other comprehensive income of those investments were calculated based on financial statements which have been not audited or reviewed. Management believes there is no material impact on the equity method accounting or the calculation of the share of profit or loss and other comprehensive income from the above financial statements which have not been audited.
13. PROPERTY, PLANT, AND EQUIPMENT Freehold Land Buildings Equipment
Office Equipment Other Facilities
Construction in Progress Total
Cost Balance at January 1, 2017 $ 2,696,490 $ 4,142,572 $ 897,349 $ 283,969 $ 595,803 $ 41,973 $ 8,658,156 Additions - 95,260 18,292 30,052 37,079 71,586 252,269 Disposals (22,017 ) (13,046 ) (37,865 ) (18,489 ) (14,311 ) - (105,728 ) Reclassifications - 3,771 48,498 811 40,469 (110,130 ) (16,581 ) Balance at December 31, 2017 $ 2,674,473 $ 4,228,557 $ 926,274 $ 296,343 $ 659,040 $ 3,429 $ 8,788,116 Accumulated depreciation and impairment Balance at January 1, 2017 $ - $ 420,405 $ 671,418 $ 201,553 $ 426,696 $ - $ 1,720,072 Disposals - (5,381 ) (32,355 ) (18,375 ) (13,509 ) - (69,620 ) Depreciation expenses - 81,873 66,404 39,568 84,794 - 272,639 Balance at December 31, 2017 $ - $ 496,897 $ 705,467 $ 222,746 $ 497,981 $ - $ 1,923,091 Carrying amounts at December 31, 2017 $ 2,674,473 $ 3,731,660 $ 220,807 $ 73,597 $ 161,059 $ 3,429 $ 6,865,025 Cost Balance at January 1, 2018 $ 2,674,473 $ 4,228,557 $ 926,274 $ 296,343 $ 659,040 $ 3,429 $ 8,788,116 Additions - 1,938 62,328 39,787 34,247 66,104 204,404 Disposals (15,930 ) (15,136 ) (6,828 ) (11,380 ) (13,712 ) - (62,986 ) Reclassifications - - 24,507 107 5,974 (66,857 ) (36,269 ) Balance at December 31, 2018 $ 2,658,543 $ 4,215,359 $ 1,006,281 $ 324,857 $ 685,549 $ 2,676 $ 8,893,265 Accumulated depreciation and impairment Balance at January 1, 2018 $ - $ 496,897 $ 705,467 $ 222,746 $ 497,981 $ - $ 1,923,091 Disposals - (7,045 ) (5,899 ) (11,186 ) (13,586 ) - (37,716 ) Depreciation expenses - 82,281 64,660 35,939 72,368 - 255,248 Balance at December 31, 208 $ - $ 572,133 $ 764,228 $ 247,499 $ 556,763 $ - $ 2,140,623 Carrying amounts at December 31, 2018 $ 2,658,543 $ 3,643,226 $ 242,053 $ 77,358 $ 128,786 $ 2,676 $ 6,752,642
The above items of property, plant and equipment are depreciated on a straight-line basis over their estimated useful lives as follows: Buildings
Main buildings 20-60 years Electronic equipment 5 years Engineering systems 5 years
Equipment 2-8 years Office equipment 2-8 years Other facilities 2-10 years
181

14. GOODWILL For the Year Ended December 31 2018 2017 Cost Balance at January 1 $ 111,599 $ 111,599 Balance at December 31 $ 111,599 $ 111,599
15. OTHER LIABILITIES
December 31 2018 2017 Other payables
Payables for salaries or bonuses $ 1,691,022 $ 1,878,709 Payables for royalties 107,409 118,347 Payables for annual leave 37,132 44,063 Others (Note) 695,364 429,379
$ 2,530,927 $ 2,470,498 Note: Including marketing expenses, and freight expenses.
16. RETIREMENT BENEFIT PLANS a. Defined contribution plans
The Company adopted a pension plan under the Labor Pension Act (“LPA”), which is a state-managed defined contribution plan. Under the LPA, an entity makes monthly contributions to employees’ individual pension accounts at 6% of monthly salaries and wages.
b. Defined benefit plans
The defined benefit plan adopted by the Company in accordance with the Labor Standards Law is operated by the government of the ROC. Pension benefits are calculated on the basis of the length of service and average monthly salaries of the six months before retirement. The Company contribute amounts equal to 2% of total monthly salaries and wages to a pension fund administered by the pension fund monitoring committee. Pension contributions are deposited in the Bank of Taiwan in the committee’s name. Before the end of each year, the Company assesses the balance in the pension fund. If the amount of the balance in the pension fund is inadequate to pay retirement benefits for employees who conform to retirement requirements in the next year, the Company is required to fund the difference in one appropriation that should be made before the end of March of the next year. The pension fund is managed by the Bureau of Labor Funds, Ministry of Labor (“the Bureau”); the Company has no right to influence the investment policy and strategy.
182

The amounts included in the balance sheets in respect of the Company’s defined benefit plans were as follows:
December 31 2018 2017
Present value of defined benefit obligation $ 389,837 $ 368,670 Fair value of plan assets (134,564) (132,419) Deficit 255,273 236,251 Net defined benefit liabilities $ 255,273 $ 236,251 Movements in net defined benefit liabilities were as follows:
Present Value of the Defined
Benefit Obligation
Fair Value of the Plan Assets
Net Defined Benefit
Liabilities Balance at January 1, 2017 $ 343,036 $ (131,866) $ 211,170 Service cost
Current service cost 2,137 - 2,137 Past service cost 4,589 - 4,589 Net interest expense (income) 4,717 (1,865) 2,852
Recognized in profit or loss 11,443 (1,865) 9,578 Remeasurement
Return on plan assets (excluding amounts included in net interest) - 522 522
Actuarial gain or loss Changes in demographic assumptions 20,166 - 20,166 Experience adjustments 3,022 - 3,022
Recognized in other comprehensive income 23,188 522 23,710 Contributions from the employer - (8,207) (8,207) Benefits paid (8,997) 8,997 - Balance at December 31, 2017 368,670 (132,419) 236,251 Service cost
Current service cost 2,400 - 2,400 Net interest expense (income) 5,069 (1,831) 3,238
Recognized in profit or loss 7,469 (1,831) 5,638 Remeasurement
Return on plan assets (excluding amounts included in net interest) - (3,582) (3,582)
Actuarial gain or loss Changes in demographic assumptions 6,780 - 6,780 Changes in financial assumptions 11,436 - 11,436 Experience adjustments 6,521 - 6,521
Recognized in other comprehensive income 24,737 (3,582) 21,155 Contributions from the employer - (7,771) (7,771) Benefits paid (11,039) 11,039 - Balance at December 31, 2018 $ 389,837 $ (134,564) $ 255,273
183

An analysis by function of the amounts recognized in profit or loss in respect of the defined benefit plans is as follows: For the Year Ended December 31 2018 2017 Operating costs $ 1,370 $ 1,186 Selling and marketing expenses 905 1,464 General and administrative expenses 1,081 927 Research and development expenses 1,933 5,479 $ 5,289 $ 9,056 Through the defined benefit plans under the Labor Standards Law, the Company is exposed to the following risks: 1) Investment risk: The plan assets are invested in domestic and foreign equity and debt securities,
bank deposits, etc. The investment is conducted at the discretion of the Bureau or under the mandated management. However, in accordance with relevant regulations, the return generated by plan assets should not be below the interest rate for a 2-year time deposit with local banks.
2) Interest risk: A decrease in the bond interest rate will increase the present value of the defined
benefit obligation; however, this will be partially offset by an increase in the return on the plan’s debt investments.
3) Salary risk: The present value of the defined benefit obligation is calculated by reference to the
future salaries of plan participants. As such, an increase in the salary of the plan participants will increase the present value of the defined benefit obligation.
The actuarial valuations of the present value of the defined benefit obligation were carried out by qualified actuaries. The significant assumptions used for the purposes of the actuarial valuations were as follows:
December 31 2018 2017
Discount rate(s) 1.125% 1.375% Expected rate(s) of salary increase 3.250% 3.250% If possible reasonable changes in each of the significant actuarial assumptions will occur and all other assumptions will remain constant, the present value of the defined benefit obligation would increase(decrease) as follows:
December 31 2018 2017 Discount rate(s)
0.25% increase $ (11,542) $ (11,203) 0.25% decrease $ 12,030 $ 11,684
Expected rate(s) of salary increase 0.25% increase $ 11,589 $ 11,284 0.25% decrease $ (11,182) $ (10,880)
The sensitivity analysis presented above may not be representative of the actual change in the present value of the defined benefit obligation as it is unlikely that the change in assumptions would occur in isolation of one another as some of the assumptions may be correlated.
184

December 31 2018 2017
Expected contributions to the plans for the next year $ 9,047 $ 1,491 Average duration of the defined benefit obligation 12.5 years 12.6 years
17. EQUITY a. Share capital
Ordinary shares
December 31 2018 2017
Number of shares authorized (in thousands) 800,000 800,000 Amount of shares authorized $ 8,000,000 $ 8,000,000 Number of shares issued and fully paid (in thousands) 698,696 697,283 Amount of shares issued and fully paid $ 6,986,955 $ 6,972,825 Fully paid ordinary shares, which have a par value of NT$10, carry one vote per share and carry a right to dividends. The changes in shares are employees’ exercise of their employee share options.
b. Capital surplus December 31 2018 2017 May be used to offset a deficit, distributed as cash dividends, or transferred to share capital (1) Issuance of ordinary shares $ 3,396,888 $ 3,396,888 Conversion of bonds 931,849 931,849 The difference between consideration received or paid and the
carrying amount of subsidiaries’ net assets during actual disposal or acquisition 88,560 17,844
Share of changes in capital surplus of associates 55 - May be used to offset a deficit only Changes in percentage of ownership interests in subsidiaries (2) 4,263 5,003 Employee share options 1,519,818 1,241,557 Employees’ share compensation 78,614 78,614 Share of changes in capital surplus of associates 27,890 25,285 May not be used for any purpose Employee share options 1,025,411 857,802 $ 7,073,348 $ 6,554,842
185

1) Such capital surplus may be used to offset a deficit; in addition, when the Company has no deficit, such capital surplus may be distributed as cash dividends or transferred to share capital (limited to a certain percentage of the Company’s capital surplus and to once a year).
2) Such capital surplus arises from the effect of changes in ownership interest in a subsidiary resulting
from equity transactions other than actual disposals or acquisitions, or from changes in capital surplus of subsidiaries accounted for by using equity method.
c. Retained earnings and dividends policy
Under the dividends policy as set forth in the amended Articles, where the Company made profit in a fiscal year, the profit shall be first utilized for paying taxes, offsetting losses of previous years, setting aside as legal reserve 10% of the remaining profit, setting aside or reversing special reserve in accordance with the laws and regulations, and then any remaining profit together with any undistributed retained earnings shall be used by the Company’s board of directors as the basis for proposing a distribution plan, which should be resolved in the shareholders’ meeting for distribution of dividends and bonuses to shareholders. For the policies on distribution of employees’ compensation and remuneration of directors after amendment, refer to employees’ compensation and remuneration of directors in Note 18, d. The Company operates in an industry related to computers, and its business related to network servers is new but with significant potential for growth. Thus, in formulating its dividend policy, the Company takes into account the overall business and industry conditions and trends, its objective of enhancing the shareholders’ long-term interests, and the sustainability of the Company’s growth. The policy also requires that share dividends be less than 75% of total dividends to retain internally generated cash within the Company in order to finance future capital expenditures and working capital requirements. An appropriation of earnings to a legal reserve should be made until the legal reserve equals the Company’s paid-in capital. The legal reserve may be used to offset deficits. If the Company has no deficit and the legal reserve has exceeded 25% of the Company’s paid-in capital, the excess may be transferred to capital or distributed in cash. Items referred to under Rule No. 1010012865 and Rule No. 1010047490 issued by the FSC and in the directive titled “Questions and Answers for Special Reserves Appropriated Following Adoption of IFRSs” should be appropriated to or reversed from a special reserve by the Company. The appropriations of earnings for 2017 and 2016, which have been approved in the shareholders’ meetings on May 24, 2018 and May 26, 2017, respectively, were as follows:
Appropriation of Earnings Dividends Per Share
(NT$)
For the Year Ended
December 31 For the Year Ended
December 31 2017 2016 2017 2016 Legal reserve $ 615,651 $ 566,686 $ - $ - Special reserve 284,451 85,204 - - Cash dividends 4,600,414 3,988,367 6.6 6.3 Share dividends - 633,074 - 1.0
186

The appropriations of earnings for 2018 had been proposed by the Company’s board of directors on March 8, 2019. The appropriations and dividends per share were as follows:
Appropriation
of Earnings Dividends Per Share (NT$)
Legal reserve $ 629,466 $ - Special reserve 429,108 - Cash dividends 4,751,129 6.8 The appropriations of earnings for 2018 are subject to the resolution of the shareholders in their meeting to be held on May 28, 2019.
d. Special reserves
For the Year Ended December 31 2018 2017
Beginning at January 1 $ 85,204 $ - Appropriations in respect of
Debits to other equity items 284,451 85,204 Balance at December 31 $ 369,655 $ 85,204
e. Other equity items 1) Exchange differences on translating the financial statements of foreign operations
For the Year Ended December 31 2018 2017 Balance at January 1 $ (463,479) $ (197,633) Effect of change in tax rate 16,752 -
Recognized during the period Exchange differences arising on translating the financial statements of foreign entities (19,659) (260,103) Share of those of associates accounted for using the equity method (8,859) (5,743)
Other comprehensive income recognized for the period (11,766) (265,846) Balance at December 31 $ (475,245) $ (463,479)
2) Unrealized gain (loss) from available-for-sale financial assets
Balance at January 1, 2017 $ 112,429 Recognized during the period
Unrealized gain arising on revaluation of available-for-sale financial assets 163,398 Share from subsidiaries accounted for using the equity method (16,927)
Reclassification adjustment Disposal of available-for-sale financial assets (165,076)
Other comprehensive income recognized for the period (18,605) Balance at December 31, 2017 93,824 Adjustment on initial application of IFRS 9 (93,824) Balance at January 1, per IFRS 9 $ -
187

3) Unrealized gain or loss on Financial Assets at FVTOCI
For the Year Ended
December 31, 2018
Balance at January 1 per IAS 39 $ - Adjustment on initial application of IFRS 9 123,254 Balance at January 1 per IFRS 9 123,254 Recognized during the period
Unrealized loss - equity instruments (445,333) Share of those of associates accounted for using the equity method (13,912)
Other comprehensive income recognized for the period (459,245) Cumulative unrealized gain (loss) of equity instruments transferred to retained
earnings due to disposal 11,737 Balance at December 31 $ (324,254)
4) Unearned employee benefits
For the Year Ended
December 31, 2018
Balance at January 1 $ - Share from associates accounted for using the equity method 736 Balance at December 31 $ 736
18. NET PROFIT AND OTHER COMPREHENSIVE INCOME FROM CONTINUING OPERATIONS
a. Finance costs
For the Year Ended December 31 2018 2017 Interest on bank overdrafts and loans $ 29 $ - Other finance costs 4 - $ 33 $ -
b. Depreciation and amortization
For the Year Ended December 31 2018 2017 An analysis of depreciation by function
Operating costs $ 67,987 $ 66,559 Operating expenses 187,261 206,080
$ 255,248 $ 272,639
(Continued)
188

For the Year Ended December 31 2018 2017 An analysis of amortization by function
Operating costs $ 799 $ 740 Selling and marketing expenses 213 109 General and administrative expenses 51,894 49,338 Research and development expenses 32,668 30,880
$ 85,574 $ 81,067
(Concluded) c. Employee benefits expense
For the Year Ended December 31 2018 2017 Short-term benefits $ 3,007,903 $ 2,996,315 Post-employment benefits
Defined contribution plans 127,765 121,811 Defined benefit plans (Note 16) 5,289 9,056
133,054 130,867 Share-based payments - equity-settled 341,624 424,637 Other employee benefits 149,450 145,820 Total employee benefits expense $ 3,632,031 $ 3,697,639 An analysis of employee benefits expense by function
Operating costs $ 794,878 $ 793,642 Operating expenses 2,837,153 2,903,997
$ 3,632,031 $ 3,697,639
d. Employees’ compensation and remuneration of directors
According to the Articles of Incorporation of the Company, the Company accrued employees’ compensation at the rates of no less than 5% and remuneration of directors at the rates of no higher than 1%, of net profit before income tax, employees’ compensation, and remuneration of directors. The employees’ compensation and remuneration of directors for the years ended December 31, 2018 and 2017, which have been approved by the Company’s board of directors on March 8, 2019 and March 2, 2018, respectively, were as follows: For the Year Ended December 31 2018 2017 Cash Cash Employees’ compensation $ 275,000 $ 273,000 Remuneration of directors 10,600 10,600 If there is a change in the amounts after the annual financial statements were authorized for issue, the differences are recorded as a change in the accounting estimate. There is no difference between the actual amounts of employees’ compensation and remuneration of directors paid and the amounts recognized in the financial statements for the years ended December 31, 2017 and 2016.
189

Information on the employees’ compensation and remuneration of directors resolved by the Company’s board of directors in 2019 and 2018 is available at the Market Observation Post System website of the Taiwan Stock Exchange.
e. Gains or losses on foreign currency exchange
For the Year Ended December 31 2018 2017 Foreign exchange gains $ 743,207 $ 473,701 Foreign exchange losses (704,794) (519,503) Net losses $ 38,143 $ (45,802)
19. INCOME TAXES
a. Major components of tax expense recognized in profit or loss
For the Year Ended December 31 2018 2017 Current tax
In respect of the current year $ 1,156,236 $ 801,950 Income tax on unappropriated earnings 63,493 36,556 Adjustments for prior years (209,936) 16,640
1,009,793 855,146 Deferred tax
In respect of the current year 147,432 132,327 Effect of tax rate changes 182,258 -
Income tax expense recognized in profit or loss $ 1,339,483 $ 987,473 A reconciliation of accounting profit and income tax expenses is as follows: For the Year Ended December 31 2018 2017 Profit before tax $ 7,634,140 $ 7,143,989 Income tax expense calculated at the statutory rate $ 1,526,829 $ 1,214,478 Tax-exempt income (69,723) (214,229) Unrecognized investment credits (158,000) (85,000) Income tax on unappropriated earnings 63,493 36,556 Land value increment tax 4,562 7,733 Unrealized deductible temporary differences - 11,295 Effect of tax rate changes 182,258 - Adjustments for prior years’ tax (209,936) 16,640 Income tax expense recognized in profit or loss $ 1,339,483 $ 987,473 In 2017, the applicable corporate income tax rate used by the company in the ROC is 17%. However, the Income Tax Act in the ROC was amended in 2018, and the corporate income tax rate was adjusted from 17% to 20%, effective in 2018. In addition, the rate of the corporate surtax applicable to the 2018 unappropriated earnings will be reduced from 10% to 5%.
190

As the status of the 2019 appropriation of earnings is uncertain, the potential income tax consequences of 5% income tax rate of the 2018 unappropriated earnings are not reliably determinable.
b. Income tax recognized in other comprehensive income For the Year Ended December 31 2018 2017 Deferred tax Effect of change in tax rate $ (18,879) $ - In respect of the current year
Translation of foreign operations (7,131) (54,450) Remeasurement on defined benefit plans (4,231) (4,031) $ (30,241) $ (58,481)
c. Current tax liabilities
December 31 2018 2017 Current tax liabilities
Income tax payable $ 1,413,134 $ 1,108,579
d. Deferred tax assets and liabilities The movements of deferred tax assets and deferred tax liabilities were as follows: For the year ended December 31, 2018
Opening Balance
Recognized in Profit or Loss
Recognized in Other
Comprehensive Income Closing Balance
Deferred tax assets Temporary differences
Unrealized gross profit $ 75,876 $ 57,219 $ - $ 133,095 Unrealized loss on inventory
write-downs 22,959 14,037 - 36,996 Defined benefit obligation 15,423 2,294 - 17,717 Unrealized warranty liabilities 9,061 2,474 - 11,535 Unrealized exchange losses 3,007 (3,007) - - Sales allowance - 3,090 - 3,090 Exchange differences on
translating foreign operations 94,929 - 23,883 118,812 Remeasurement on defined
benefit plans 15,444 - 6,957 22,401 $ 236,699 $ 76,107 $ 30,840 $ 343,646
(Continued)
191

Opening Balance
Recognized in Profit or Loss
Recognized in Other
Comprehensive Income Closing Balance
Deferred tax liabilities Temporary differences
Unappropriated earnings of subsidiaries $ 1,158,717 $ 403,562 $ - $ 1,562,279
Government grants 406 (406) - - Remeasurement on defined
benefit plans 3,391 - 599 3,990 Financial assets - FVTPL - 87 - 87 Unrealized exchange gains - 2,554 - 2,554
$ 1,162,514 $ 405,797 $ 599 $ 1,568,910
(Concluded) For the year ended December 31, 2017
Opening Balance
Recognized in Profit or Loss
Recognized in Other
Comprehensive Income Closing Balance
Deferred tax assets Temporary differences
Unrealized gross profit $ 44,996 $ 30,880 $ - $ 75,876 Unrealized loss on inventory
write-downs 15,230 7,729 - 22,959 Defined benefit obligation 15,656 (233) - 15,423 Unrealized warranty liabilities 8,356 705 - 9,061 Unrealized exchange losses - 3,007 - 3,007 Exchange differences on
translating foreign operations 40,479 - 54,450 94,929 Remeasurement on defined
benefit plans 11,413 - 4,031 15,444 $ 136,130 $ 42,088 $ 58,481 $ 236,699 Deferred tax liabilities Temporary differences
Unappropriated earnings of subsidiaries $ 982,170 $ 176,547 $ - $ 1,158,717
Government grants - 406 - 406 Remeasurement on defined
benefit plans 3,391 - - 3,391 Unrealized exchange gains 2,538 (2,538) - -
$ 988,099 $ 174,415 $ - $ 1,162,514
e. Income tax assessments The Company’s tax returns through 2014 have been assessed by the tax authorities.
192

20. EARNINGS PER SHARE Unit: NT$ Per Share
For the Year Ended December 31 2018 2017 Basic earnings per share $ 9.02 $ 8.84 Diluted earnings per share $ 8.93 $ 8.77 The earnings and weighted average number of ordinary shares outstanding in the computation of earnings per share are as follows: Net Profit for the Year For the Year Ended December 31 2018 2017 Earnings used in the computation of basic earnings per share $ 6,294,657 $ 6,156,516 Earnings used in the computation of diluted earnings per share $ 6,294,657 $ 6,156,516 Weighted Average Number of Ordinary Shares Outstanding (In Thousand Shares) For the Year Ended December 31 2018 2017 Weighted average number of ordinary shares in computation of basic
earnings per share 697,744 696,802 Effect of potentially dilutive ordinary shares:
Employee share option 5,797 3,949 Employees’ compensation 1,501 1,479
Weighted average number of ordinary shares used in the
computation of diluted earnings per share 705,042 702,230 If the Company offered to settle compensation paid to employees in cash or shares, the Company assumed the entire amount of the compensation will be settled in shares, and the resulting potential shares were included in the weighted average number of shares outstanding used in the computation of diluted earnings per share, as the effect is dilutive. Such dilutive effect of the potential shares is included in the computation of diluted earnings per share until the number of shares to be distributed to employees is resolved in the following year.
21. SHARE-BASED PAYMENT ARRANGEMENTS Qualified employees of the Company and its subsidiaries were granted 8,000 options in 2018, 6,500 options in 2016 and 5,000 options in 2014. Each option entitles the holder to subscribe for one thousand ordinary shares of the Company. The holders of these shares include employees whom meet certain criteria set by the Company, from both domestic and overseas subsidiaries in which the Company directly or indirectly invests over 50%. Options issued in 2018, 2016 and 2014 are all valid for six years. All are exercisable at certain percentages after the second anniversary year from the grant date. The exercise prices granted in 2018 was the share price on the exercise date; the exercise prices of those granted in 2016 and 2014 were both NT$100 per share. For any subsequent changes in the Company’s capital surplus, the exercise price and the number of options will be adjusted accordingly.
193

Information on employee share options was as follows: For the Year Ended December 31 2018 2017
Employee Share Options
Number of Options (In Thousands)
Weighted- average Exercise
Price (NT$)
Number of Options (In Thousands)
Weighted- average Exercise
Price (NT$) Balance at January 1 9,378 $ 95.15 10,269 $ 98.20 Options granted 8,000 202.50 - - Options exercised (1.413) 83.78 (891) 86.89 Balance at December 31 15,965 143.64 9,378 95.15 Options exercisable, end of the year 7,965 84.53 2,878 84.20 Weighted-average fair value of
options granted (NT$) $ 49.15 $ - The weighted-average share price at the date of exercise of share options for the years ended December 31, 2018 and 2017 were from NT$196 to NT$226 and from NT$204 to NT$266, respectively. Information about outstanding options as of December 31, 2018 and 2017 was as follows: For the Year Ended December 31 2018 2017
Employee Share Options Exercise Price
(NT$)
Weighted- average
Remaining Contractual Life (Years)
Exercise Price (NT$)
Weighted- average
Remaining Contractual Life (Years)
Issuance in 2018 $ 202.5 5.58 $ - - Issuance in 2016 85.6 3.45 88.5 4.45 Issuance in 2014 81.5 1.63 84.2 2.63 Options granted were priced using the Black-Scholes pricing model and the inputs to the model were as follows: 2018 2017 2015 Grant-date share price (NT$) $202.5 $235 $239.5 Exercise price (NT$) $202.5 $100 $100 Expected volatility 28.42%-28.73% 31.42%-32.48% 28.28%-29.19% Expected life (in years) 4-4.5 4-5.5 4-5.5 Expected dividend yield 0% 0% 0% Risk-free interest rate 0.67%-0.69% 0.52%-0.65% 1.07%-1.30% Expected volatility was based on the historical share price volatility over the past 5 years. Compensation costs recognized were $341,624 thousand and $424,637 thousand for the years ended December 31, 2018 and 2017, respectively.
194
22. GOVERNMENT GRANTS
In 2018 and 2017, the Company participated in a governmental project plan and received a government grant of $27,590 thousand and $12,005 thousand, respectively. The amount was recognized as other income.
23. ACQUISITION OF SUBSIDIARIES - WITH OBTAINED CONTROL
Subsidiary Principal Activity Date of
Acquisition
Proportion of Voting Equity
Interests Acquired (%)
Consideration Transferred
Kostec Co., Ltd.
(AKST) Production and sale of
intelligent medical display
January 20, 2017 60 $ 120,592
Advantech Vietnam Technology Company Limited (AVN)
Sale of industrial automation products
June 6, 2018 60 $ 76,092
The Company acquired Advantech Vietnam Technology Company Limited (“AVN”) and Kostec Co., Ltd. (“AKST”) in 2018 and 2017, respectively, in order to expand its sales of industrial automation products in the Vietnam market and expand its sales in the global intelligent medical market. For the acquisition of AVN and AKST, refer to Note 29 to the Company’s 2018 consolidated financial statements.
24. PARTIAL ACQUISITION OR DISPOSAL OF SUBSIDIARIES - WITHOUT LOSS OF CONTROL In the first and third quarters of 2018, the Company disposed 1.11% and 15.96% shares of LNC, respectively. Therefore, the Company’s shareholding ratio in LNC decreased from 81.17% to 64.10%. In the first quarter of 2018, the Company and its subsidiary ASG acquired 49% shares of ATH. Thus, the Group’s shareholding ratio in ATH increased from 51% to 100%. The Company’s shareholding ratio in ATH is 51%. In the fourth quarter of 2018, the Company acquired 40% of the shares of AKST. Thus, the Company’s shareholding ratio in AKST increased from 36% to 76%. The above transactions were accounted for as equity transactions, since the Company did not cease to have control over these subsidiaries. For details about the above transactions, refer to Note 30 to the Company’s consolidated financial statements for the year ended December 31, 2018.
25. OPERATING LEASE ARRANGEMENTS The Company as Lessee Operating leases relate to leases of warehouses with lease term of 1 year. The future minimum lease payments of non-cancellable operating lease commitments are as follows: December 31 2018 2017 Not later than 1 year $ 1,486 $ 1,342
195

The lease payments recognized in profit or loss for the current period were as follows: For the Year Ended December 31 2018 2017 Minimum lease payments $ 3,448 $ 4,047
26. CAPITAL MANAGEMENT The Company manages its capital to ensure it will be able to continue as going concerns while maximizing the return to stakeholders through the optimization of the debt and equity balance. The Company’s overall strategy remains unchanged in both 2018 and 2017. The capital structure of the Company consists of net debt (borrowings offset by cash and cash equivalents) and equity of the Company (comprising issued capital, reserves, retained earnings, and other equity). The Company is not subject to any externally imposed capital requirements. Key management personnel of the Company review the capital structure on a quarterly basis. As part of this review, the key management personnel consider the cost of capital and the risks associated with each class of capital. Based on recommendations of the key management personnel, in order to balance the overall capital structure, the Company may adjust the amount of dividends paid to shareholders, the number of new shares issued, and the amount of new debt issued.
27. FINANCIAL INSTRUMENTS a. Fair value of financial instruments measured at fair value on a recurring basis
1) Fair value hierarchy December 31, 2018 Level 1 Level 2 Level 3 Total Financial assets at FVTPL
Derivative financial assets $ - $ 5,167 $ - $ 5,167 Mutual funds 1,355,214 - - 1,355,214
$ 1,355,214 $ 5,167 $ - $ 1,360,381 Financial assets at FVTOCI
Investments in equity instruments at FVTOCI Securities listed in ROC $ 1,028,441 $ - $ - $ 1,028,441
Financial liabilities at FVTPL
Derivative financial liabilities $ - $ 6,128 $ - $ 6,128
196

December 31, 2017 Level 1 Level 2 Level 3 Total Financial assets at FVTPL
Derivative financial assets $ - $ 5,084 $ - $ 5,084 Mutual funds 640,016 - - 640,016
$ 640,016 $ 5,084 $ - $ 645,100 Available-for-sale financial
assets Securities listed in ROC
Equity securities $ 1,419,479 $ - $ - $ 1,419,479 Financial liabilities at FVTPL
Derivative financial liabilities $ - $ 6,226 $ - $ 6,226 There were no transfers between Level 1 and 2 in the current and prior periods.
2) Valuation techniques and inputs applied for Level 2 fair value measurement Derivatives held by the Company were foreign exchange forward contracts, whose fair values were calculated using discounted cash flow. Future cash flows are estimated based on observable forward exchange rates at the end of the reporting period and contract forward rates, discounted at a rate that reflects the credit risk of various counterparties.
b. Categories of financial instruments December 31 2018 2017 Financial assets Fair value through profit or loss (FVTPL)
Held for trading $ - $ 645,100 Mandatorily classified as at FVTPL 1,360,381 -
Loans and receivables (Note 1) - 8,807,389 Available-for-sale financial assets (Note 2) - 1,419,479 Financial assets at amortized cost (Note 3) 9,912,530 - Financial assets at FVTOCI
Equity instrument 1,028,441 - Financial liabilities Fair value through profit or loss (FVTPL)
Held for trading - 6,226 Mandatorily classified as at FVTPL 6,128 -
Amortized cost (Note 4) 8,244,579 7,130,846 Note 1: The balances included loans and receivables measured at amortized cost, which comprise cash
and cash equivalents, note receivables, trade receivables, trade receivables from related parties, other receivables and other receivables from related parties.
Note 2: The balances included the carrying amount of available-for-sale financial assets measured at
cost.
197

Note 3: The balances included financial assets measured at amortized cost, which comprise cash and
cash equivalents, notes receivable, trade receivables, trade receivables from related parties, other receivables and other receivables from related parties.
Note 4: The balances included financial liabilities measured at amortized cost, which comprise, notes
payable and trade payables, trade payables from related parties, other payables, and other payable from related parties.
c. Financial risk management objectives and policies
The Company’s major financial instruments include equity investments, trade receivables and trade payables. The Company’s Corporate Treasury function provides services to the business, coordinates access to domestic and international financial markets, monitors and manages the financial risks relating to the operations of the Company through internal risk reports which analyze exposures by degree and magnitude of risks. These risks include market risk (including foreign currency risk, interest rate risk and other price risk), credit risk and liquidity risk. The Company sought to minimize the effects of these risks by using derivative financial instruments to hedge risk exposures. The use of financial derivatives was governed by the Company’s policies approved by the board of directors, which provided written principles on foreign exchange risk, interest rate risk, credit risk, the use of financial derivatives and non-derivative financial instruments, and the investment of excess liquidity. Compliance with policies and exposure limits was reviewed by the internal auditors on a continuous basis. The Company did not enter into or trade financial instrument, including derivative financial instruments, for speculative purposes. The Corporate Treasury function reports quarterly to the board of directors on the Company’s current derivative instrument management. 1) Market risk
The Company’s activities exposed it primarily to financial risks of changes in foreign currency exchange rates (see (a) below) and interest rates (see (b) below). The Company entered into a variety of forward contract to manage its exposure to foreign currency risk. There had been no change to the Company’s exposure to market risks or the manner in which these risks were managed and measured. a) Foreign currency risk
The Company undertook operating activities and investment of foreign operations denominated in foreign currencies, which exposed the Company to foreign currency risk. The Company manages the risk that fluctuations in foreign currency could have on foreign-currency denominated assets and future cash flow by using forward exchange contracts, which allow the Company to mitigate but not fully eliminate the effect. The maturities of the Company’s forward contracts were less than six months, and these contracts did not meet the criteria for hedge accounting. The carrying amounts of the Company’s foreign currency denominated monetary assets and monetary liabilities and of the derivatives exposing to foreign currency risk at the end of the reporting period are set out in Notes 29 and 7, respectively. Sensitivity analysis The Company was mainly exposed to U.S. dollar, Euro and Renminbi.
198

The following table details the Company’s sensitivity to a 5% increase in New Taiwan dollars (the functional currency) against the relevant foreign currencies. The sensitivity rate used when reporting foreign currency risk internally to key management personnel and representing management’s assessment of the reasonably possible change in foreign exchange rates is 5%. The sensitivity analysis included only outstanding foreign currency denominated monetary items and foreign currency forward contracts designated as cash flow hedges, and adjusts their translation at the end of the reporting period for a 5% change in exchange rates. The range of the sensitivity analysis included cash and cash equivalents, trade receivables and trade payables. A positive number below indicates an increase in pre-tax profit associated with the New Taiwan dollar weakening 5% against the relevant currency. For a 5% strengthening of the New Taiwan dollar against the relevant currency, there would be an equal and opposite impact on pre-tax profit and the balances below would be negative. U.S. Dollar Impact Euro Impact Renminbi Impact 2018 2017 2018 2017 2018 2017 Profit or loss $ 109,243
(Note 1) $ 109,459
(Note 1) $ 46,489
(Note 2) $ 57,967
(Note 2) $ 30,037
(Note 3) $ 13,624
(Note 3) Note 1: This was mainly attributable to the exposure outstanding on U.S. dollar-denominated
cash, trade receivables and trade payables, which were not hedged at the end of the reporting period.
Note 2: This was mainly attributable to the exposure outstanding on Euro-denominated cash,
trade receivables and trade payables, which were not hedged at the end of the reporting period.
Note 3: This was mainly attributable to the exposure outstanding on Renminbi-denominated
cash, trade receivables and trade payables, which were not hedged at the end of the reporting period.
b) Interest rate risk
The Company’s floating-rate bank savings are exposed to risk of changes in interest rates. The Company does not operate hedging instruments for interest rates. The Company’s management monitors fluctuations in market interest rates regularly. If it is needed, the management might perform necessary procedures for significant interest rate risks to control the risks from fluctuations in market interest rates. The carrying amount of the Company’s financial assets and financial liabilities with exposure to interest rates at the end of the reporting period were as follows: December 31 2018 2017 Cash flow interest rate risk
Financial assets $ 2,506,883 $ 2,433,560 Sensitivity analysis The sensitivity analyses below were determined based on the Company’s exposure to interest rates for non-derivative instruments at the end of the reporting period. For floating rate liabilities, the analysis was prepared assuming the amount of the liability outstanding at the end of the reporting period was outstanding for the whole year. A 50 basis point increase or decrease was used when reporting interest rate risk internally to key management personnel and represents management’s assessment of the reasonably possible change in interest rates.
199

If interest rates had been 50 basis points higher and all other variables were held constant, the Company’s pre-tax profit for the years ended December 31, 2018 and 2017 would have increased by $12,534 thousand and $12,168 thousand, respectively. Had interest rates been 50 basis points lower, the effects on the Company’s pre-tax profit would have been of the same amounts but negative. The source of the negative effects would have been mainly the floating-interest rates on bank savings.
c) Other price risk
The Company was exposed to equity price risk through its investments in listed equity securities. The Company manages this exposure by maintaining a portfolio of investments with different risks. The Company’s equity price risks was mainly concentrated on equity instruments trading in the Taiwan stock exchange. Sensitivity analysis The sensitivity analyses below were determined based on the exposure to equity price risks at the end of the reporting period. If equity prices had been 1% higher, the pre-tax other comprehensive income for the years ended December 31, 2018 would have increased by $10,284 thousand, as a result of changes in fair value of financial assets. And the pre-tax other comprehensive income for the year ended December 31, 2017 would have increase by $14,195, as a result of the changes in fair value of financial assets at fair value through other comprehensive income. Had equity prices been 1% lower, the effects on pre-tax other comprehensive gains would have been of the same amounts but negative.
2) Credit risk
Credit risk refers to the risk that counterparty will default on its contractual obligations resulting in financial loss to the Company. As at the end of the reporting period, the Company’s maximum exposure to credit risk which would cause a financial loss to the Company due to failure of counterparties to discharge an obligation provided by the Company could arise from the carrying amount of the respective recognized financial assets as stated in the balance sheets. In order to minimize credit risk, the management of the Company has delegated a team responsible for determining of credit limits, credit approvals and other monitoring procedures to ensure that follow-up action is taken to recover overdue debts. In addition, the Company reviews the recoverable amount of each individual trade debt at the end of the reporting period to ensure that adequate allowance are made for irrecoverable amounts. In this regard, management believes the Company’s credit risk was significantly reduced. Trade receivables consisted of a large number of customers, spread across diverse industries and geographical areas. The Company did transactions with a large number of unrelated customers and, thus, no concentration of credit risk was observed.
3) Liquidity risk
The Company manages liquidity risk by monitoring and maintaining a level of cash and cash equivalents deemed adequate to finance the Company’s operations and mitigate the effects of fluctuations in cash flows. In addition, management monitors the utilization of bank borrowings and ensures compliance with loan covenants.
200

Ultimate responsibility for liquidity risk management rests with the board of directors, which has built an appropriate liquidity risk management framework for the Company’s short, medium and long-term funding and liquidity management requirements. The Company manages liquidity risk by maintaining adequate reserves and continuously monitoring forecast and actual cash flows as well as matching the maturity profiles of financial assets and liabilities. As of December 31, 2018 and 2017, the Company had available unutilized bank loan facilities set out in (c) below. a) Liquidity and interest risk rate tables for non-derivative financial liabilities
The following table details the Company’s remaining contractual maturity for its non-derivative financial liabilities with agreed-upon repayment periods. The tables had been drawn up based on the undiscounted cash flows of financial liabilities from the earliest date on which the Company can be required to pay. The table included both interests and principal cash flows. Specifically, bank loans with a repayment on demand clause were included in the earliest time band regardless of the probability of the banks choosing to exercise their rights. The maturity dates for other non-derivative financial liabilities were based on the agreed repayment dates. To the extent that interest flows are at floating rate, the undiscounted amount was derived from the interest rate curve at the end of the reporting period. December 31, 2018
On Demand or Less than
1 Month 1-3 Months
Over 3 Months to
1 Year Over 1 Year -
5 Years Non-derivative financial liabilities Non-interest bearing $ 5,035,682 $ 2,372,944 $ 835,953 $ - December 31, 2017
On Demand or Less than
1 Month 1-3 Months
Over 3 Months to
1 Year Over 1 Year -
5 Years Non-derivative financial liabilities Non-interest bearing $ 4,808,601 $ 1,222,066 $ 1,100,179 $ - The amounts included above for variable interest rate instruments for both non-derivative financial assets and liabilities were subject to change if changes in variable interest rates differ from those estimates of interest rates determined at the end of the reporting period.
201

b) Liquidity and interest risk rate tables for derivative financial liabilities
The following tables detailed the Company’s liquidity analysis of its derivative financial instruments. The tables were based on the undiscounted gross cash inflows and outflows on those derivative instruments that require gross settlement. December 31, 2018
On Demand or Less than
1 Month 1-3 Months
Over 3 Months to
1 Year Total Gross settled Foreign exchange forward
contracts Inflows $ 235,499 $ 403,177 $ 205,677 $ 844,303 Outflows 234,880 403,256 207,128 845,264
$ 569 $ (79) $ (1,451) $ (961) December 31, 2017
On Demand or Less than
1 Month 1-3 Months
Over 3 Months to
1 Year Total Gross settled Foreign exchange forward
contracts Inflows $ 264,246 $ 488,029 $ 281,423 $ 1,033,698 Outflows 263,570 489,905 281,365 1,034,840
$ 676 $ (1,876) $ 58 $ (1,142)
c) Financing facilities
December 31 2018 2017 Unsecured bank loan facilities
Amount used $ - $ - Amount unused 3,955,919 2,345,362
$ 3,955,919 $ 2,345,362
202

28. TRANSACTIONS WITH RELATED PARTIES
Besides information disclosed elsewhere in the other notes, details of significant transactions between the Company and other related parties are disclosed below. a. Names and categories of related parties
Name Related Party Category AAC (HK) Subsidiary AAU Subsidiary ABR Subsidiary ACN Subsidiary A-DloG Subsidiary AEU Subsidiary AID Subsidiary AIN Subsidiary AiSC Subsidiary AJP Subsidiary AKMC Subsidiary AKR Subsidiary AKST Subsidiary AMY Subsidiary ANA Subsidiary APL Subsidiary ASG Subsidiary ATH Subsidiary AVN Subsidiary B+B Subsidiary B+B (CZ) Subsidiary BBI Subsidiary SIoT (Cayman) Subsidiary Cermate Subsidiary Advantech Corporate Investment Subsidiary AiST Subsidiary LNC Subsidiary Advanixs Subsidiary AdvanPOS Subsidiary Axiomtek Co., Ltd. Associate AIMobile Co., Ltd. Associate Deneng Scientific Research Co., Ltd. Associate Jan Hsiang Electronics Co., Ltd. Associate Winmate Inc. Associate Azurewave Technology Inc. Associate I-Link Co., Ltd. Associate Mildex Optical Inc. Associate Nippon Rad Inc. Associate Advantech Foundation Other related party K&M Investment Co., Ltd. Other related party AIDC Investment Corp. Other related party Ke Chang Liu Other related party (chairman’s second
immediate family) Li Ting Huang Other related party (spouse of
chairman’s second immediate family)
203

b. Sales of goods
For the Year Ended December 31 Related Party Category/Name 2018 2017 Subsidiaries
ANA $ 9,347,710 $ 8,255,247 ACN 7,382,801 6,039,617 AEU 4,889,200 4,316,172 Others 4,888,173 3,702,568
Associates 66,550 36,628 $ 26,574,434 $ 22,350,232
c. Purchases of goods
For the Year Ended December 31 Related Party Category/Name 2018 2017 Subsidiaries
AKMC $ 11,974,220 $ 10,519,469 Advanixs 7,730 1,328,501 Others 359,933 1,551,277
Associates 146,027 51,565 $ 12,487,910 $ 13,450,812
d. Receivables from related parties (excluding loans to related parties)
Related Party December 31 Line Item Category/Name 2018 2017
Trade receivables - related parties Subsidiaries ANA $ 1,906,993 $ 1,595,920 ACN 1,492,606 964,313 AEU 952,721 1,363,473 Others 1,295,528 671,867 Associates 7,348 7,203 Other related parties - 300 $ 5,655,196 $ 4,603,076 The outstanding trade receivables from related parties are unsecured. For the years ended December 31, 2018 and 2017 no impairment loss was recognized for trade receivables from related parties.
e. Payables to related parties (excluding loans from related parties)
December 31 Related Party Category/Name 2018 2017 Subsidiaries
AKMC $ 1,533,444 $ 932,599 Others 134,502 171,268
Associates 27,653 19,499 $ 1,695,599 $ 1,123,366
204

The outstanding trade payables to related parties are unsecured.
f. Other receivables from related parties
December 31 Related Party Category 2018 2017 Subsidiaries
ANA $ 14,516 $ 5,004 AEU 10,176 2,681 Others 16,419 7,884
$ 41,111 $ 15,569
g. Other payable from related parties
December 31 Related Party Category 2018 2017 Subsidiaries
AEU $ 36,568 $ 42,286 A-DLOG 13,672 - Others 4,343 7,688
Associates - 25,575 $ 54,583 $ 77,549
h. Acquisitions of property, plant and equipment
Purchase Price For the Year Ended December 31 Related Party Category 2018 2017 Associates $ - $ 8,381 Subsidiaries 2,100 - $ 2,100 $ 8,381
i. Disposals of property, plant and equipment
Proceeds Gain (Loss) on Disposal
For the Year Ended
December 31 For the Year Ended
December 31 Related Party Category/Name 2018 2017 2018 2017 Other related parties $ - $ 74,397 $ - $ 66,531
205

j. Other transactions with related parties
Operating Expenses For the Year Ended December 31 2018 2017 Administration expenses
Subsidiaries $ 49,588 $ 23,235 Research and development expenses
Associates $ 11,672 $ 23,709 Subsidiaries 1,654 5,267
$ 13,326 $ 28,976 Research and development expenses incurred between the Company and its associates were charged according to the agreed remuneration and payment terms on the contracts. For the rest of transactions with related parties, since normal payment terms with related parties were not stipulated, the payment terms were based on mutual agreement. Operating Expenses For the Year Ended December 31 2018 2017 Rent expenses
Subsidiaries $ 1,009 $ 1,539 Other Income For the Year Ended December 31 2018 2017 Rent income
Subsidiaries $ 3,036 $ 4,836 Other related parties 60 60
$ 3,096 $ 4,896 Others
Subsidiaries $ 110,178 $ 78,876 Other related parties 2,702 2,702
$ 112,880 $ 81,578 Lease contracts formed between the Company and its associates were based on market rental prices and had normal payment terms. Revenue contracts for technical services formed between the Company and its associates were based on market prices and had payment terms on the contracts. For the rest of transactions with related parties, since normal payment terms with related parties were not stipulated, the payment terms were based on mutual agreement.
k. Compensation of key management personnel
For the Year Ended December 31 2018 2017 Short-term employee benefits $ 45,159 $ 46,617 Post-employment benefits 199 201 Share-based payments 32,568 9,653 $ 77,926 $ 56,471
206

The remuneration of directors and key executives was determined by the remuneration committee based on the performance of individuals and market trends.
29. SIGNIFICANT ASSETS AND LIABILITIES DENOMINATED IN FOREIGN CURRENCIES The Company’s significant financial assets and liabilities denominated in foreign currencies aggregated by the foreign currencies other than functional currencies and the related exchange rates between foreign currencies and respective functional currencies were as follows: December 31, 2018
Foreign
Currencies Exchange Rate Carrying Amount
Financial assets Monetary items
USD $ 200,036 30.715 (USD:NTD) $ 6,144,115 RMB 443,904 4.4720 (RMB:NTD) 1,985,137 EUR 22,929 35.200 (EUR:NTD) 807,115 $ 8,936,367
Non-monetary items
Subsidiaries and associates accounted for using the equity method USD 391,494 30.715 (USD:NTD) $ 12,024,738 EUR 33,337 35.200 (EUR:NTD) 1,173,462 KRW 12,018,981 0.027 (KRW:NTD) 324,512 JPY 1,288,805 0.278 (JPY:NTD) 341,608
$ 13,864,320
Financial liabilities Monetary items
USD 128,904 30.715 (USD:NTD) $ 3,959,272 RMB 242,567 4.4720 (RMB:NTD) 1,084,758 $ 5,044,030
December 31, 2017
Foreign
Currencies Exchange Rate Carrying Amount
Financial assets Monetary items
USD $ 188,935 29.76 (USD:NTD) $ 5,622,706 RMB 326,570 4.565 (RMB:NTD) 1,490,792 EUR 32,336 35.57 (EUR:NTD) 1,150,192 $ 8,263,690
(Continued)
207

Foreign
Currencies Exchange Rate Carrying Amount
Non-monetary items
Subsidiaries and associates accounted for using the equity method USD $ 332,724 29.76 (USD:NTD) $ 9,901,866 EUR 30,536 35.57 (EUR:NTD) 1,086,166 KRW 10,914,513 0.028 (KRW:NTD) 305,606 JPY 1,044,091 0.264 (JPY:NTD) 275,640
$ 11,569,278
Financial liabilities Monetary items
USD 115,373 29.76 (USD:NTD) $ 3,433,500 RMB 189,882 4.565 (RMB:NTD) 866,811 $ 4,300,311
(Concluded)
For the years ended December 2018 and 2017, realized and unrealized net foreign exchange losses were $38,413 thousand and $(45,802) thousand, respectively. It is impractical to disclose net foreign exchange gains (losses) by each significant foreign currency due to the variety of the foreign currency transactions.
30. SEPARATELY DISCLOSED ITEMS
a. Information about significant transactions and b. information on investees:
1) Financing provided to others. (Table 1) 2) Endorsement/guarantee provided. (Table 2) 3) Marketable securities held (excluding investments in subsidiaries and associates). (Table 3) 4) Marketable securities acquired and disposed of at costs or prices of at least NT$300 million or 20%
of the paid-in capital. (Table 4) 5) Acquisition of individual real estate at costs of at least NT$300 million or 20% of the paid-in
capital. (None) 6) Disposal of individual real estate at prices of at least NT$300 million or 20% of the paid-in capital.
(None) 7) Total purchases from or sales to related parties amounting to at least NT$100 million or 20% of the
paid-in capital. (Table 5) 8) Receivables from related parties amounting to at least NT$100 million or 20% of the paid-in
capital. (Table 6) 9) Transactions of financial instruments. (Notes 7 and 27) 10) Name, locations, and other information of investees. (Table 7)
208

c. Information on investments in mainland China
1) Information on any investee company in mainland China, showing the name, principal business
activities, paid-in capital, method of investment, inward and outward remittance of funds, ownership percentage, net income of investees, investment gains or losses, carrying amount of the investment at the end of the period, repatriations investment gains, and limit on the amount of investment in the mainland China area. (Table 8)
2) Any of the following significant transactions with investee companies in mainland China, either
directly or indirectly through a third party, their prices, and payment terms, and unrealized gains or losses. Refer to Tables 1, 5 and 6.
209

TA
BLE
1
AD
VA
NT
EC
H C
O.,
LT
D. A
ND
INV
EST
EE
S FI
NA
NC
ING
PR
OV
IDE
D T
O O
THE
RS
FOR
TH
E Y
EA
R E
ND
ED
DE
CE
MB
ER
31,
201
8 (I
n T
hous
ands
of N
ew T
aiw
an D
olla
rs, U
nles
s Sta
ted
Oth
erw
ise)
No.
(N
ote
A)
Len
der
Bor
row
er
Fina
ncia
l Sta
tem
ent
Acc
ount
R
elat
ed
Part
ies
Cre
dit L
ine
(Not
e D
) A
ctua
l Bor
row
ing
Inte
rest
R
ate
(%)
Nat
ure
of
Fina
ncin
g
Bus
ines
s T
rans
actio
n A
mou
nt
Rea
sons
for
Shor
t-ter
m
Fina
ncin
g
Allo
wan
ce fo
r Im
pair
men
t Los
s
Col
late
ral
Fina
ncin
g L
imit
for
Eac
h Bo
rrow
er
Agg
rega
te
Fina
ncin
g L
imits
H
ighe
st B
alan
ce fo
r th
e Pe
riod
E
ndin
g Ba
lanc
e E
ndin
g Ba
lanc
e It
em
Val
ue
1
B+B
(CZ)
C
onel
Aut
omat
ion
Trad
e re
ceiv
able
s - re
late
d pa
rties
Y
es
$
17
,184
(CZK
12
,000
th
ousa
nd )
$
16
,392
(CZK
12
,000
th
ousa
nd )
$
16
,392
(CZK
12
,000
th
ousa
nd )
2 Sh
ort-t
erm
fin
anci
ng
$
-
Fina
ncin
g ne
ed
$
-
Non
e N
one
$
11
6,54
5
(N
ote
C)
$
11
6,54
5
(N
ote
C)
2
B+B
(CZ)
C
onel
Aut
omat
ion
Trad
e re
ceiv
able
s - re
late
d pa
rties
Y
es
6,83
0
(CZK
5,
000
thou
sand
)
6,83
0
(CZK
5,
000
thou
sand
)
6,83
0
(CZK
5,
000
thou
sand
)
2 Sh
ort-t
erm
fin
anci
ng
- Fi
nanc
ing
need
-
Non
e N
one
116,
545
(Not
e C
)
11
6,54
5
(N
ote
C)
3
LNC
LN
C D
ong
Gua
n Tr
ade
rece
ivab
les -
rela
ted
parti
es
Yes
30
,000
30
,000
-
- Sh
ort-t
erm
fin
anci
ng
- Fi
nanc
ing
need
-
Non
e N
one
32,3
08
(Not
e C
)
12
9,23
2
(N
ote
C)
4
B+B
(CZ)
C
onel
Aut
omat
ion
Trad
e re
ceiv
able
s - re
late
d pa
rties
Y
es
4,09
8
(CZK
3,
000
thou
sand
)
4,09
8
(CZK
3,
000
thou
sand
)
4,09
8
(CZK
3,
000
thou
sand
)
2 Sh
ort-t
erm
fin
anci
ng
- Fi
nanc
ing
need
-
Non
e N
one
116,
545
(Not
e C
)
11
6,54
5
(N
ote
C)
N
ote
A:
Inve
stee
com
pani
es a
re n
umbe
red
sequ
entia
lly fr
om 1
. N
ote
B:
The
exch
ange
rate
s as o
f Dec
embe
r 31,
201
8 w
ere
CZK
1=N
T$1.
366.
N
ote
C:
The
finan
cing
lim
it fo
r eac
h bo
rrow
er a
nd fo
r the
agg
rega
te fi
nanc
ing
wer
e bo
th 4
0% o
f the
B+B
(CZ)
’s n
et a
sset
val
ues.
Not
e D
: Th
e fin
anci
ng li
mit
for e
ach
borro
wer
and
for t
he a
ggre
gate
fina
ncin
g w
ere
10%
and
40%
, res
pect
ivel
y, o
f the
LN
C’s
net
ass
et v
alue
s. N
ote
E:
The
max
imum
bal
ance
for t
he y
ear a
nd e
ndin
g ba
lanc
e ar
e ap
prov
ed b
y th
e bo
ard
of d
irect
ors o
f fin
anci
ers.
210

TA
BL
E 2
A
DV
AN
TE
CH
CO
., L
TD
. AN
D IN
VE
STE
ES
EN
DO
RSE
ME
NT
/GU
AR
AN
TE
E P
RO
VID
ED
FO
R T
HE
YE
AR
EN
DE
D D
EC
EM
BE
R 3
1, 2
018
(In
Tho
usan
ds o
f New
Tai
wan
Dol
lars
, Unl
ess S
tate
d O
ther
wis
e)
No.
E
ndor
ser/
G
uara
ntor
End
orse
e/G
uara
ntee
Lim
its o
n E
ndor
sem
ent/
Gua
rant
ee
Giv
en o
n B
ehal
f of
Eac
h Pa
rty
(Not
e A
)
Max
imum
A
mou
nt
End
orse
d/
Gua
rant
eed
Dur
ing
the
Peri
od
Out
stan
ding
E
ndor
sem
ent/
Gua
rant
ee a
t th
e E
nd o
f the
Pe
riod
Act
ual
Bor
row
ing
Am
ount
Am
ount
E
ndor
sed/
G
uara
ntee
d by
C
olla
tera
ls
Rat
io o
f A
ccum
ulat
ed
End
orse
men
t/ G
uara
ntee
to
Net
Equ
ity in
L
ates
t Fi
nanc
ial
Stat
emen
ts
(%)
Max
imum
C
olla
tera
l/ G
uara
ntee
A
mou
nts
Allo
wab
le
(Not
e B
)
End
orse
men
t/ G
uara
ntee
G
iven
by
Pare
nt o
n B
ehal
f of
Subs
idia
ries
End
orse
men
t/ G
uara
ntee
G
iven
by
Subs
idia
ries
on
Beh
alf o
f Pa
rent
End
orse
men
t/ G
uara
ntee
G
iven
on
Beh
alf o
f C
ompa
nies
in
Mai
nlan
d C
hina
Nam
e R
elat
ions
hip
0 Th
e C
ompa
ny
AN
A
Subs
idia
ry
$
2,93
0,27
0
$
928,
650
(US$
30
,000
thou
sand
)
$
921,
450
(US$
30
,000
thou
sand
)
$
- $
-
3.14
$
8,
790,
811
Y
N
N
B+B
Su
bsid
iary
2,93
0,27
0
30
8,00
2 (U
S$
9,95
0
thou
sand
)
30
5,61
4 (U
S$
9,95
0
thou
sand
)
-
-
1.04
8,79
0,81
1 Y
N
N
B+B
(CZ)
Su
bsid
iary
2,93
0,27
0
1,
548
(US$
50
thou
sand
)
1,
536
(US$
50
thou
sand
)
-
-
0.01
8,79
0,81
1 Y
N
N
AK
ST
Subs
idia
ry
2,
930,
270
123,
820
(US$
4,
000
th
ousa
nd)
12
2,86
0 (U
S$
4,00
0
thou
sand
)
67
,581
- 0.
42
8,
790,
811
Y
N
N
AV
N
Subs
idia
ry
2,
930,
270
30,9
55
(US$
1,
000
th
ousa
nd)
30
,715
(U
S$
1,00
0
thou
sand
)
-
-
0.10
8,79
0,81
1 Y
N
N
AK
MC
Subs
idia
ry
2,
930,
270
185,
730
(US$
6,
000
th
ousa
nd)
18
4,29
0 (U
S$
6,00
0
thou
sand
)
-
-
0.63
8,79
0,81
1 Y
N
Y
Adv
anix
s Cor
p.
Subs
idia
ry
2,
930,
270
49,5
28
(US$
1,
600
th
ousa
nd)
49
,144
(U
S$
1,60
0
thou
sand
)
-
-
0.17
8,79
0,81
1 Y
N
N
Cer
mat
e Su
bsid
iary
2,93
0,27
0
30
,955
(U
S$
1,00
0
thou
sand
)
30
,715
(U
S$
1,00
0
thou
sand
)
-
-
0.10
8,79
0,81
1 Y
N
N
AiS
T Su
bsid
iary
2,93
0,27
0
4,
643
(US$
15
0
thou
sand
)
4,
607
(US$
15
0
thou
sand
)
-
-
0.02
8,79
0,81
1 Y
N
N
Adv
anPO
S Su
bsid
iary
2,93
0,27
0
30
,955
(U
S$
1,00
0
thou
sand
)
30
,715
(U
S$
1,00
0
thou
sand
)
-
-
0.10
8,79
0,81
1 Y
N
N
(Con
tinue
d)
211

No.
E
ndor
ser/
G
uara
ntor
End
orse
e/G
uara
ntee
Lim
its o
n E
ndor
sem
ent/
Gua
rant
ee
Giv
en o
n B
ehal
f of
Eac
h Pa
rty
(Not
e A
)
Max
imum
A
mou
nt
End
orse
d/
Gua
rant
eed
Dur
ing
the
Peri
od
Out
stan
ding
E
ndor
sem
ent/
Gua
rant
ee a
t th
e E
nd o
f the
Pe
riod
Act
ual
Bor
row
ing
Am
ount
Am
ount
E
ndor
sed/
G
uara
ntee
d by
C
olla
tera
ls
Rat
io o
f A
ccum
ulat
ed
End
orse
men
t/ G
uara
ntee
to
Net
Equ
ity in
L
ates
t Fi
nanc
ial
Stat
emen
ts
(%)
Max
imum
C
olla
tera
l/ G
uara
ntee
A
mou
nts
Allo
wab
le
(Not
e B
)
End
orse
men
t/ G
uara
ntee
G
iven
by
Pare
nt o
n B
ehal
f of
Subs
idia
ries
End
orse
men
t/ G
uara
ntee
G
iven
by
Subs
idia
ries
on
Beh
alf o
f Pa
rent
End
orse
men
t/ G
uara
ntee
G
iven
on
Beh
alf o
f C
ompa
nies
in
Mai
nlan
d C
hina
Nam
e R
elat
ions
hip
A-D
LoG
Su
bsid
iary
$
2,
930,
270
$
35
,890
(E
UR
1,
000
th
ousa
nd)
$
35,2
00
(EU
R
1,00
0
thou
sand
)
$
- $
-
0.12
$
8,
790,
811
Y
N
N
AB
R
Subs
idia
ry
2,
930,
270
46,4
33
(US$
1,
500
th
ousa
nd)
46
,073
(U
S$
1,50
0
thou
sand
)
-
-
0.16
8,79
0,81
1 Y
N
N
AA
U
Subs
idia
ry
2,
930,
270
6,19
1 (U
S$
200
th
ousa
nd)
6,
143
(US$
20
0
thou
sand
)
-
-
0.02
8,79
0,81
1 Y
N
N
AK
R
Subs
idia
ry
2,
930,
270
1,54
8 (U
S$
50
th
ousa
nd)
1,
536
(US$
50
thou
sand
)
-
-
0.01
8,79
0,81
1 Y
N
N
Shen
zhen
Cer
mat
e Te
chno
logi
es In
c.
Subs
idia
ry
2,
930,
270
17,0
25
(US$
55
0
thou
sand
)
16
,893
(U
S$
550
th
ousa
nd)
-
-
0.06
8,79
0,81
1 Y
N
Y
ATJ
B
usin
ess
rela
tions
hip
2,
930,
270
278,
000
(JPY
1,0
00,0
00
th
ousa
nd)
27
8,00
0 (J
PY 1
,000
,000
thou
sand
)
-
-
0.95
8,79
0,81
1 N
N
N
Not
e A
: Th
e lim
it on
end
orse
men
ts o
r gua
rant
ees p
rovi
ded
on b
ehal
f of t
he re
spec
tive
party
is 1
0% o
f the
Com
pany
’s n
et a
sset
val
ue.
Not
e B
: Th
e m
axim
um c
olla
tera
l or g
uara
ntee
am
ount
allo
wab
le is
30%
of t
he C
ompa
ny’s
net
ass
et v
alue
. N
ote
C:
The
exch
ange
rate
s as o
f Dec
embe
r 31,
201
8 w
ere
US$
1=N
T$30
.715
, EU
R1=
NT$
35.2
0 an
d JP
Y1=
NT$
0.27
8.
Not
e D
: Th
e la
test
net
equ
ity is
from
the
finan
cial
stat
emen
ts fo
r the
yea
r end
ed D
ecem
ber 3
1, 2
018.
(Con
clud
ed)
212

TA
BL
E 3
A
DV
AN
TE
CH
CO
., L
TD
. AN
D IN
VE
STE
ES
MA
RK
ET
AB
LE
SE
CU
RIT
IES
HE
LD
FO
R T
HE
YE
AR
EN
DE
D D
EC
EM
BE
R 3
1, 2
018
(In
Tho
usan
ds o
f New
Tai
wan
Dol
lars
, Unl
ess S
tate
d O
ther
wis
e)
Hol
ding
Com
pany
Nam
e T
ype
and
Nam
e of
Mar
keta
ble
Secu
ritie
s (N
ote
E)
Rel
atio
nshi
p w
ith
the
Hol
ding
C
ompa
ny
Fina
ncia
l Sta
tem
ent A
ccou
nt
Dec
embe
r 31
, 201
8 N
ote
Num
ber
of
Shar
es
Car
ryin
g A
mou
nt
Perc
enta
ge o
f O
wne
rshi
p (%
) Fa
ir V
alue
Th
e C
ompa
ny
Stoc
k
A
SUST
ek C
ompu
ter I
nc.
- Fi
nanc
ial a
sset
s at f
air v
alue
th
roug
h ot
her c
ompr
ehen
sive
in
com
e or
loss
- no
n - c
urre
nt
4,
739,
461
$
95
5,00
1
0.64
$
95
5,00
1 N
ote
A
A
llied
Circ
uit C
o., L
td.
-
1,
200,
000
73,4
40
2.41
73,4
40
Not
e A
Fu
nd
Meg
a D
iam
ond
Mon
ey M
arke
t -
Fina
ncia
l ass
ets a
t fai
r val
ue
thro
ugh
prof
it or
loss
- cu
rren
t
97,0
30,4
20
1,
215,
005
-
1,
215,
005
Not
e B
C
apita
l Mon
ey M
arke
t -
8,70
2,88
0
14
0,20
9
-
140,
209
Not
e B
A
dvan
tech
Cor
pora
te In
vest
men
t Sh
are
Hw
aCom
Sys
tem
Inc.
-
Fina
ncia
l ass
ets a
t fai
r val
ue
thro
ugh
prof
it or
loss
- cu
rren
t
5,17
5,00
0
60
,806
5.
00
60
,806
N
ote
A
Ph
ison
Ele
ctro
nics
Cor
pora
tion
62
2,00
0
14
1,81
6
0.32
141,
816
Not
e A
Con
tec
-
15
,500
5,27
0
0.23
5,27
0 N
ote
A
A
llied
Circ
uit C
o., L
td.
- Fi
nanc
ial a
sset
s at f
air v
alue
th
roug
h ot
her c
ompr
ehen
sive
in
com
e or
loss
- no
n-cu
rren
t
2,
501,
000
153,
061
5.
03
15
3,06
1 N
ote
A
B
road
Tec
Syst
em In
c.
-
22
5,00
0
3,
879
7.
50
3,
879
Not
e C
B
iose
nseT
ek C
orp.
-
37,5
00
-
1.79
- N
ote
C
Jugu
ar T
echn
olog
y -
500,
000
4,74
3
16.6
7
4,74
3 N
ote
C
Taiw
an D
SC P
V L
td.
-
16
0,00
0
-
3.20
- N
ote
C
Fu
nd
Meg
a D
iam
ond
Mon
ey M
arke
t -
Fina
ncia
l ass
ets a
t fai
r val
ue
thro
ugh
prof
it or
loss
- cu
rren
t
11,3
54,0
27
14
2,17
4
-
142,
174
Not
e B
A
dvan
ixs C
orpo
rate
Fu
nd
Jih
Sun
Mon
ey M
arke
t -
1,21
2,49
5
17
,937
-
17
,937
N
ote
B
Meg
a D
iam
ond
Mon
ey M
arke
t -
9,24
3,36
2
11
5,74
4
-
115,
744
Not
e B
A
iST
Fund
Ji
h Su
n M
oney
Mar
ket
-
1,
243,
566
18,3
97
-
18,3
97
Not
e B
(C
ontin
ued)
213

Hol
ding
Com
pany
Nam
e T
ype
and
Nam
e of
Mar
keta
ble
Secu
ritie
s (N
ote
E)
Rel
atio
nshi
p w
ith
the
Hol
ding
C
ompa
ny
Fina
ncia
l Sta
tem
ent A
ccou
nt
Dec
embe
r 31
, 201
8 N
ote
Num
ber
of
Shar
es
Car
ryin
g A
mou
nt
Perc
enta
ge o
f O
wne
rshi
p (%
) Fa
ir V
alue
A
dvan
POS
Fund
M
ega
Dia
mon
d M
oney
Mar
ket
- Fi
nanc
ial a
sset
s at f
air v
alue
th
roug
h pr
ofit
or lo
ss -
curr
ent
1,
139,
989
$
14
,275
-
$
14,2
75
Not
e B
A
dvan
tech
Inno
vativ
e D
esig
n C
o., L
td.
Fund
C
apita
l Mon
ey M
arke
t -
628,
613
10,1
27
-
10,1
27
Not
e B
C
erm
ate
Fund
M
ega
Dia
mon
d M
oney
Mar
ket
-
1,
766,
484
22,1
20
-
22,1
20
Not
e B
SI
oT(C
aym
an)
Fund
FS
ITC
Mon
ey M
arke
t -
975,
831
173,
821
-
17
3,82
1 N
ote
B
AiS
C
Fund
Sh
angh
ai S
hang
chua
ng X
inw
ei In
vest
men
t M
anag
emen
t Co.
, Ltd
. -
Fina
ncia
l ass
ets a
t fai
r val
ue
thro
ugh
othe
r com
preh
ensi
ve
inco
me
or lo
ss
-
10
7,32
8
9.14
107,
328
Not
e C
Ja
ma
Pro
Co.
, Ltd
. -
583,
300
2,81
5
10.0
0
2,81
5 N
ote
C
Hua
n Y
an, J
hih-
Lian
Co.
, Ltd
. Fu
nd
FSIT
C M
oney
Mar
ket
- Fi
nanc
ial a
sset
s at f
air v
alue
th
roug
h pr
ofit
or lo
ss -
curr
ent
33
,258
5,92
4
-
5,92
4 N
ote
B
Y
un Y
an, W
u-Li
an C
o., L
td.
Fund
FS
ITC
Mon
ey M
arke
t -
54,6
16
9,
729
-
9,
729
Not
e B
N
ote
A:
Mar
ket v
alue
was
bas
ed o
n th
e cl
osin
g pr
ice
on D
ecem
ber 3
1, 2
018.
N
ote
B:
Mar
ket v
alue
was
bas
ed o
n th
e ne
t ass
et v
alue
s of t
he o
pen-
ende
d m
utua
l fun
ds o
n D
ecem
ber 3
1, 2
018.
N
ote
C:
The
fair
valu
es a
re e
stim
ated
from
the
late
st n
et e
quity
from
the
finan
cial
stat
emen
ts.
N
ote
D:
Secu
ritie
s com
pris
e sh
ares
, ben
efic
iary
cer
tific
ates
, and
secu
ritie
s der
ived
from
the
shar
es a
nd b
enef
icia
ry c
ertif
icat
es u
nder
IFR
S 9
“Fin
anci
al In
stru
men
ts”.
(Con
clud
ed)
214
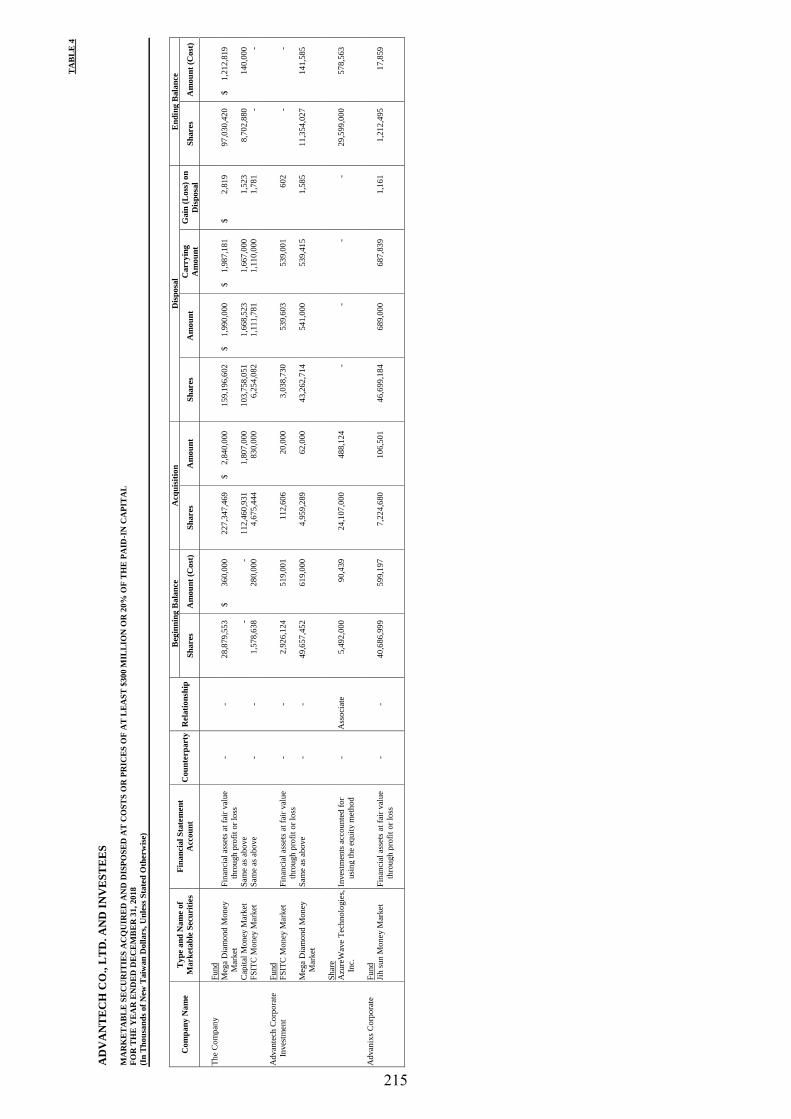
TA
BL
E 4
A
DV
AN
TE
CH
CO
., L
TD
. AN
D IN
VE
STE
ES
MA
RK
ET
AB
LE
SE
CU
RIT
IES
AC
QU
IRE
D A
ND
DIS
POSE
D A
T C
OST
S O
R P
RIC
ES
OF
AT
LE
AST
$30
0 M
ILL
ION
OR
20%
OF
TH
E P
AID
-IN
CA
PIT
AL
FO
R T
HE
YE
AR
EN
DE
D D
EC
EM
BE
R 3
1, 2
018
(In
Tho
usan
ds o
f New
Tai
wan
Dol
lars
, Unl
ess S
tate
d O
ther
wise
)
Com
pany
Nam
e T
ype
and
Nam
e of
M
arke
tabl
e Se
curi
ties
Fina
ncia
l Sta
tem
ent
Acc
ount
C
ount
erpa
rty
Rel
atio
nshi
p B
egin
ning
Bal
ance
A
cqui
sitio
n D
ispo
sal
End
ing
Bal
ance
Shar
es
Am
ount
(Cos
t)
Shar
es
Am
ount
Sh
ares
A
mou
nt
Car
ryin
g A
mou
nt
Gai
n (L
oss)
on
Dis
posa
l Sh
ares
A
mou
nt (C
ost)
Th
e C
ompa
ny
Fund
M
ega
Dia
mon
d M
oney
M
arke
t Fi
nanc
ial a
sset
s at f
air v
alue
th
roug
h pr
ofit
or lo
ss
- -
28
,879
,553
$
36
0,00
0
22
7,34
7,46
9
$
2,84
0,00
0
15
9,19
6,60
2
$
1,99
0,00
0
$
1,98
7,18
1
$
2,81
9
97
,030
,420
$
1,
212,
819
C
apita
l Mon
ey M
arke
t Sa
me
as a
bove
-
-
112,
460,
931
1,80
7,00
0
10
3,75
8,05
1
1,
668,
523
1,66
7,00
0
1,
523
8,70
2,88
0
14
0,00
0
FS
ITC
Mon
ey M
arke
t Sa
me
as a
bove
-
-
1,57
8,63
8
28
0,00
0
4,
675,
444
830,
000
6,25
4,08
2
1,
111,
781
1,11
0,00
0
1,
781
-
-
Adv
ante
ch C
orpo
rate
Fu
nd
Inve
stm
ent
FSIT
C M
oney
Mar
ket
Fina
ncia
l ass
ets a
t fai
r val
ue
thro
ugh
prof
it or
loss
-
-
2,92
6,12
4
51
9,00
1
11
2,60
6
20
,000
3,03
8,73
0
53
9,60
3
53
9,00
1
60
2
-
-
M
ega
Dia
mon
d M
oney
M
arke
t Sa
me
as a
bove
-
-
49,6
57,4
52
61
9,00
0
4,
959,
289
62,0
00
43
,262
,714
541,
000
539,
415
1,58
5
11
,354
,027
141,
585
Shar
e
A
zure
Wav
e Te
chno
logi
es,
Inc.
In
vest
men
ts a
ccou
nted
for
usin
g th
e eq
uity
met
hod
- A
ssoc
iate
5,49
2,00
0
90
,439
24,1
07,0
00
48
8,12
4
-
-
-
-
29
,599
,000
578,
563
A
dvan
ixs C
orpo
rate
Fu
nd
Jih
sun
Mon
ey M
arke
t Fi
nanc
ial a
sset
s at f
air v
alue
th
roug
h pr
ofit
or lo
ss
- -
40
,686
,999
599,
197
7,22
4,68
0
10
6,50
1
46
,699
,184
689,
000
687,
839
1,16
1
1,
212,
495
17,8
59
215

TA
BL
E 5
A
DV
AN
TE
CH
CO
., L
TD
. AN
D IN
VE
STE
ES
TO
TA
L P
UR
CH
ASE
S FR
OM
OR
SA
LE
S T
O R
ELA
TE
D P
AR
TIE
S A
MO
UN
TIN
G T
O A
T L
EA
ST $
100
MIL
LIO
N O
R 2
0% O
F T
HE
PA
ID-I
N C
API
TA
L
FOR
TH
E Y
EA
R E
ND
ED
DE
CE
MB
ER
31,
201
8 (I
n T
hous
ands
of N
ew T
aiw
an D
olla
rs, U
nles
s Sta
ted
Oth
erw
ise)
Buy
er
Rel
ated
Par
ty
Rel
atio
nshi
p T
rans
actio
n D
etai
ls A
bnor
mal
Tra
nsac
tion
Not
es/A
ccou
nts
Rec
eiva
ble
(Pay
able
) N
ote
Purc
hase
/ Sa
le
Am
ount
%
to
Tot
al
Paym
ent T
erm
s U
nit P
rice
Pa
ymen
t Ter
ms
End
ing
Bal
ance
%
to
Tot
al
The
Com
pany
A
AU
Su
bsid
iary
Sa
le
$
233,
477
0.
66
60-9
0 da
ys
Con
tract
pric
e N
o si
gnifi
cant
diff
eren
ce in
term
s for
rela
ted
parti
es
$
40,9
45
0.57
B
+B
Subs
idia
ry
Sale
152,
070
0.
43
45 d
ays a
fter m
onth
-end
C
ontra
ct p
rice
No
sign
ifica
nt d
iffer
ence
in te
rms f
or re
late
d pa
rties
19,0
51
0.26
A
EU
Subs
idia
ry
Sale
4,88
9,20
0
13.8
2 30
day
s afte
r mon
th-e
nd
Con
tract
pric
e N
o si
gnifi
cant
diff
eren
ce in
term
s for
rela
ted
parti
es
95
2,72
1
13.2
0
A
JP
Subs
idia
ry
Sale
905,
025
2.
56
60-9
0 da
ys
Con
tract
pric
e N
o si
gnifi
cant
diff
eren
ce in
term
s for
rela
ted
parti
es
15
4,81
4
2.14
A
CN
Su
bsid
iary
Sa
le
7,
382,
801
20
.87
45 d
ays a
fter m
onth
-end
C
ontra
ct p
rice
No
sign
ifica
nt d
iffer
ence
in te
rms f
or re
late
d pa
rties
1,49
2,60
6
20.6
8 N
ote
A
KR
Su
bsid
iary
Sa
le
99
7,56
6
2.82
60
day
s afte
r inv
oice
dat
e C
ontra
ct p
rice
No
sign
ifica
nt d
iffer
ence
in te
rms f
or re
late
d pa
rties
64,9
83
0.90
A
NA
Su
bsid
iary
Sa
le
9,
347,
710
26
.42
45 d
ays a
fter m
onth
-end
C
ontra
ct p
rice
No
sign
ifica
nt d
iffer
ence
in te
rms f
or re
late
d pa
rties
1,90
6,99
3
26.4
2
A
SG
Subs
idia
ry
Sale
276,
045
0.
78
60-9
0 da
ys
Con
tract
pric
e N
o si
gnifi
cant
diff
eren
ce in
term
s for
rela
ted
parti
es
53
,788
0.
75
Adv
anix
s Cor
p.
Subs
idia
ry
Sale
805,
007
2.
28
60-9
0 da
ys
Con
tract
pric
e N
o si
gnifi
cant
diff
eren
ce in
term
s for
rela
ted
parti
es
13
9,15
9
1.93
A
-DLo
G
Subs
idia
ry
Sale
608,
339
1.
72
30 d
ays a
fter i
nvoi
ce d
ate
Con
tract
pric
e N
o si
gnifi
cant
diff
eren
ce in
term
s for
rela
ted
parti
es
54
,615
0.
76
AIN
Su
bsid
iary
Sa
le
11
4,06
3
0.32
60
day
s afte
r mon
th-e
nd
Con
tract
pric
e N
o si
gnifi
cant
diff
eren
ce in
term
s for
rela
ted
parti
es
53
,791
0.
75
SIoT
(Cay
man
) Su
bsid
iary
Sa
le
32
0,26
0
0.91
U
sual
trad
e te
rms
Con
tract
pric
e N
o si
gnifi
cant
diff
eren
ce in
term
s for
rela
ted
parti
es
26
6,62
1
3.69
A
BR
Su
bsid
iary
Sa
le
12
1,74
5
0.34
90
day
s afte
r mon
th-e
nd
Con
tract
pric
e N
o si
gnifi
cant
diff
eren
ce in
term
s for
rela
ted
parti
es
24
,379
0.
34
AM
Y
Subs
idia
ry
Sale
139,
369
0.
39
45 d
ays a
fter m
onth
-end
C
ontra
ct p
rice
No
sign
ifica
nt d
iffer
ence
in te
rms f
or re
late
d pa
rties
11,0
28
0.15
A
KM
C Su
bsid
iary
Pu
rcha
se
(1
1,97
4,22
0)
(48.
41)
Usu
al tr
ade
term
s C
ontra
ct p
rice
No
sign
ifica
nt d
iffer
ence
in te
rms f
or re
late
d pa
rties
(1,5
33,4
44)
27.1
0
A
-DLo
G
Subs
idia
ry
Purc
hase
(181
,902
) (0
.74)
Usu
al tr
ade
term
s C
ontra
ct p
rice
No
sign
ifica
nt d
iffer
ence
in te
rms f
or re
late
d pa
rties
(20,
746)
0.
37
A
KM
C Th
e C
ompa
ny
Pare
nt c
ompa
ny
Sale
11,9
74,2
20
14.2
8 U
sual
trad
e te
rms
Con
tract
pric
e N
o si
gnifi
cant
diff
eren
ce in
term
s for
rela
ted
parti
es
1,
533,
444
94
.69
A
-DLo
G
The
Com
pany
Pa
rent
com
pany
Sa
le
18
1,90
2
58.0
6 U
sual
trad
e te
rms
Con
tract
pric
e N
o si
gnifi
cant
diff
eren
ce in
term
s for
rela
ted
parti
es
20
,746
12
.99
A
AU
Th
e C
ompa
ny
Pare
nt c
ompa
ny
Purc
hase
(233
,477
) (8
8.51
) 60
-90
days
C
ontra
ct p
rice
No
sign
ifica
nt d
iffer
ence
in te
rms f
or re
late
d pa
rties
(40,
945)
83
.71
B
+B
The
Com
pany
Pa
rent
com
pany
Pu
rcha
se
(1
52,0
70)
(18.
02)
45 d
ays a
fter m
onth
-end
C
ontra
ct p
rice
No
sign
ifica
nt d
iffer
ence
in te
rms f
or re
late
d pa
rties
(19,
051)
50
.77
A
EU
The
Com
pany
Pa
rent
com
pany
Pu
rcha
se
(4
,889
,200
) (7
4.34
) 30
day
s afte
r mon
th-e
nd
Con
tract
pric
e N
o si
gnifi
cant
diff
eren
ce in
term
s for
rela
ted
parti
es
(9
52,7
21)
64.6
8
AJP
Th
e C
ompa
ny
Pare
nt c
ompa
ny
Purc
hase
(905
,025
) (9
0.22
) 60
-90
days
C
ontra
ct p
rice
No
sign
ifica
nt d
iffer
ence
in te
rms f
or re
late
d pa
rties
(154
,814
) 92
.26
A
CN
Th
e C
ompa
ny
Pare
nt c
ompa
ny
Purc
hase
(7,3
82,8
01)
(77.
59)
45 d
ays a
fter m
onth
-end
C
ontra
ct p
rice
No
sign
ifica
nt d
iffer
ence
in te
rms f
or re
late
d pa
rties
(1,4
92,6
06)
83.6
9
AK
R
The
Com
pany
Pa
rent
com
pany
Pu
rcha
se
(9
97,5
66)
(62.
8)
60 d
ays a
fter i
nvoi
ce d
ate
Con
tract
pric
e N
o si
gnifi
cant
diff
eren
ce in
term
s for
rela
ted
parti
es
(6
4,98
3)
49.8
4
AN
A
The
Com
pany
Pa
rent
com
pany
Pu
rcha
se
(9
,347
,710
) (8
8.14
) 45
day
s afte
r mon
th-e
nd
Con
tract
pric
e N
o si
gnifi
cant
diff
eren
ce in
term
s for
rela
ted
parti
es
(1
,906
,993
) 84
.04
A
SG
The
Com
pany
Pa
rent
com
pany
Pu
rcha
se
(2
76,0
45)
(79.
42)
60-9
0 da
ys
Con
tract
pric
e N
o si
gnifi
cant
diff
eren
ce in
term
s for
rela
ted
parti
es
(5
3,78
8)
79.2
5
Adv
anix
s Cor
p.
The
Com
pany
Pa
rent
com
pany
Pu
rcha
se
(8
05,0
07)
(98.
71)
60-9
0 da
ys
Con
tract
pric
e N
o si
gnifi
cant
diff
eren
ce in
term
s for
rela
ted
parti
es
(1
39,1
59)
97.5
7
(Con
tinue
d)
216

Buy
er
Rel
ated
Par
ty
Rel
atio
nshi
p T
rans
actio
n D
etai
ls A
bnor
mal
Tra
nsac
tion
Not
es/A
ccou
nts
Rec
eiva
ble
(Pay
able
) N
ote
Purc
hase
/ Sa
le
Am
ount
%
to
Tot
al
Paym
ent T
erm
s U
nit P
rice
Pa
ymen
t Ter
ms
End
ing
Bal
ance
%
to
Tot
al
A-D
LoG
Th
e C
ompa
ny
Pare
nt c
ompa
ny
Purc
hase
$
(6
08,3
39)
(75.
41)
30 d
ays a
fter i
nvoi
ce d
ate
Con
tract
pric
e N
o si
gnifi
cant
diff
eren
ce in
term
s for
rela
ted
parti
es
$
(54,
615)
67
.49
A
IN
The
Com
pany
Pa
rent
com
pany
Pu
rcha
se
(1
14,0
63)
(92.
75)
60 d
ays a
fter i
nvoi
ce d
ate
Con
tract
pric
e N
o si
gnifi
cant
diff
eren
ce in
term
s for
rela
ted
parti
es
(5
3,79
1)
94.4
1
SIoT
(Cay
man
) Th
e C
ompa
ny
Pare
nt c
ompa
ny
Purc
hase
(320
,260
) (4
8.26
) U
sual
trad
e te
rms
Con
tract
pric
e N
o si
gnifi
cant
diff
eren
ce in
term
s for
rela
ted
parti
es
(2
66,6
21)
70.2
9
AB
R
The
Com
pany
Pa
rent
com
pany
Pu
rcha
se
(1
21,7
45)
(67.
12)
90 d
ays a
fter i
nvoi
ce d
ate
Con
tract
pric
e N
o si
gnifi
cant
diff
eren
ce in
term
s for
rela
ted
parti
es
(2
4,37
9)
89.2
9
AM
Y
The
Com
pany
Pa
rent
com
pany
Pu
rcha
se
(1
39,3
69)
(77.
71)
45 d
ays a
fter m
onth
-end
C
ontra
ct p
rice
No
sign
ifica
nt d
iffer
ence
in te
rms f
or re
late
d pa
rties
(11,
028)
100
.00
C
erm
ate
Shen
zhen
Cer
mat
e Te
chno
logi
es In
c.
Rel
ated
ent
erpr
ise
Sale
112,
581
42
.63
Usu
al tr
ade
term
s C
ontra
ct p
rice
No
sign
ifica
nt d
iffer
ence
in te
rms f
or re
late
d pa
rties
18,7
89
48.2
3
AK
MC
AC
N
Rel
ated
ent
erpr
ise
Sale
445,
324
3.
51
Usu
al tr
ade
term
s C
ontra
ct p
rice
No
sign
ifica
nt d
iffer
ence
in te
rms f
or re
late
d pa
rties
52,0
60
3.21
SI
oT(C
aym
an)
Rel
ated
ent
erpr
ise
Sale
510,
175
4.
02
Usu
al tr
ade
term
s C
ontra
ct p
rice
No
sign
ifica
nt d
iffer
ence
in te
rms f
or re
late
d pa
rties
125,
335
7.
74
LN
C
LNC
Don
g G
uan
Rel
ated
ent
erpr
ise
Sale
295,
203
68
.04
Usu
al tr
ade
term
s C
ontra
ct p
rice
No
sign
ifica
nt d
iffer
ence
in te
rms f
or re
late
d pa
rties
209,
533
93
.88
A
CN
A
iSC
R
elat
ed e
nter
pris
e Sa
le
17
1,78
7
1.59
U
sual
trad
e te
rms
Con
tract
pric
e N
o si
gnifi
cant
diff
eren
ce in
term
s for
rela
ted
parti
es
42
,659
1.
89
B
+B (C
Z)
AEU
R
elat
ed e
nter
pris
e Sa
le
24
6,65
5
60.8
0 U
sual
trad
e te
rms
Con
tract
pric
e N
o si
gnifi
cant
diff
eren
ce in
term
s for
rela
ted
parti
es
45
,091
10
0.00
APL
A
EU
Rel
ated
ent
erpr
ise
Sale
106,
733
97
.67
Usu
al tr
ade
term
s C
ontra
ct p
rice
No
sign
ifica
nt d
iffer
ence
in te
rms f
or re
late
d pa
rties
10,0
13
88.3
1
SIoT
(Cay
man
) A
EU
Rel
ated
ent
erpr
ise
Sale
211,
059
39
.78
Usu
al tr
ade
term
s C
ontra
ct p
rice
No
sign
ifica
nt d
iffer
ence
in te
rms f
or re
late
d pa
rties
85,0
87
34.8
8
A
NA
R
elat
ed e
nter
pris
e Sa
le
23
5,88
6
44.4
5 U
sual
trad
e te
rms
Con
tract
pric
e N
o si
gnifi
cant
diff
eren
ce in
term
s for
rela
ted
parti
es
12
5,73
7
25.7
8
Shen
zhen
Cer
mat
e Te
chno
logi
es In
c.
Cer
mat
e R
elat
ed e
nter
pris
e Pu
rcha
se
(1
12,5
81)
(38.
62)
Usu
al tr
ade
term
s C
ontra
ct p
rice
No
sign
ifica
nt d
iffer
ence
in te
rms f
or re
late
d pa
rties
(18,
789)
74
.84
AC
N
AK
MC
Rel
ated
ent
erpr
ise
Purc
hase
(445
,324
) (4
.68)
Usu
al tr
ade
term
s C
ontra
ct p
rice
No
sign
ifica
nt d
iffer
ence
in te
rms f
or re
late
d pa
rties
(52,
060)
2.
92
SI
oT (C
aym
an)
AK
MC
Rel
ated
ent
erpr
ise
Purc
hase
(510
,175
) (12
8.23
) U
sual
trad
e te
rms
Con
tract
pric
e N
o si
gnifi
cant
diff
eren
ce in
term
s for
rela
ted
parti
es
(1
25,3
35)
4.39
LNC
Don
g G
uan
LNC
R
elat
ed e
nter
pris
e Pu
rcha
se
(2
95,2
03)
(77.
47)
Usu
al tr
ade
term
s C
ontra
ct p
rice
No
sign
ifica
nt d
iffer
ence
in te
rms f
or re
late
d pa
rties
(209
,533
) 92
.32
A
iSC
A
CN
R
elat
ed e
nter
pris
e Pu
rcha
se
(1
71,7
87)
(61.
89)
Usu
al tr
ade
term
s C
ontra
ct p
rice
No
sign
ifica
nt d
iffer
ence
in te
rms f
or re
late
d pa
rties
(42,
659)
78
.96
A
EU
B+B
(CZ)
R
elat
ed e
nter
pris
e Pu
rcha
se
(2
46,6
55)
(4.4
3) U
sual
trad
e te
rms
Con
tract
pric
e N
o si
gnifi
cant
diff
eren
ce in
term
s for
rela
ted
parti
es
(4
5,09
1)
3.51
A
PL
Rel
ated
ent
erpr
ise
Purc
hase
(106
,733
) (1
.92)
Usu
al tr
ade
term
s C
ontra
ct p
rice
No
sign
ifica
nt d
iffer
ence
in te
rms f
or re
late
d pa
rties
(10,
013)
0.
78
SIoT
(Cay
man
) R
elat
ed e
nter
pris
e Pu
rcha
se
(2
11,0
59)
(3.7
9) U
sual
trad
e te
rms
Con
tract
pric
e N
o si
gnifi
cant
diff
eren
ce in
term
s for
rela
ted
parti
es
(8
5,08
7)
6.62
AN
A
SIoT
(Cay
man
) R
elat
ed e
nter
pris
e Pu
rcha
se
(2
35,8
86)
(2.2
2) U
sual
trad
e te
rms
Con
tract
pric
e N
o si
gnifi
cant
diff
eren
ce in
term
s for
rela
ted
parti
es
(1
25,7
37)
5.54
Not
e:
Unr
ealiz
ed g
ain
for t
he p
erio
d w
as $
2,88
3 th
ousa
nd.
(C
oncl
uded
)
217

TA
BL
E 6
A
DV
AN
TE
CH
CO
., L
TD
. AN
D IN
VE
STE
ES
RE
CE
IVA
BL
ES
FRO
M R
EL
AT
ED
PA
RT
IES
AM
OU
NT
ING
TO
AT
LEA
ST N
T$1
00 M
ILL
ION
OR
20%
OF
THE
PA
ID-I
N C
API
TA
L FO
R T
HE
YE
AR
EN
DE
D D
EC
EM
BE
R 3
1, 2
018
(In
Tho
usan
ds o
f New
Tai
wan
Dol
lars
, Unl
ess S
tate
d O
ther
wis
e)
Com
pany
Nam
e R
elat
ed P
arty
R
elat
ions
hip
End
ing
Bal
ance
T
urno
ver
Rat
e
Ove
rdue
A
mou
nts
Rec
eive
d in
Su
bseq
uent
Pe
riod
Allo
wan
ce fo
r Im
pair
men
t Los
s A
mou
nt
Act
ions
Tak
en
Th
e C
ompa
ny
AC
N
Subs
idia
ry
$
1,4
92,6
06
6.01
$
- -
$
61
7,13
5
$
-
A
EU
Subs
idia
ry
952,
721
4.
22
- -
463,
454
-
SI
oT (C
aym
an)
Subs
idia
ry
266,
621
4.
56
- -
124,
703
-
A
JP
Subs
idia
ry
154,
814
5.
91
- -
33,4
79
-
AK
MC
Subs
idia
ry
409,
917
N
ote
- -
173,
925
-
A
NA
Su
bsid
iary
1,
906,
993
0.
57
- -
860,
020
-
A
dvan
ixs C
orp.
Su
bsid
iary
13
9,15
9
5.76
-
-
12
2,29
0
-
AK
MC
The
Com
pany
Pa
rent
com
pany
1,
533,
444
9.
90
- -
1,06
7,27
1
-
LNC
LN
C D
ong
Gua
n R
elat
ed e
nter
pris
e
20
9,53
3
1.53
-
-
11
,323
-
SI
oT (C
aym
an)
AN
A
Rel
ated
ent
erpr
ise
125,
737
0.
65
- -
40,9
97
-
AK
MC
SIoT
(Cay
man
) R
elat
ed e
nter
pris
e
12
5,33
5
8.14
-
-
15
,866
-
N
ote:
Sa
les r
even
ue o
n m
ater
ials
del
iver
ed to
subc
ontra
ctor
s hav
e be
en e
limin
ated
from
con
solid
atio
n.
218

TA
BL
E 7
A
DV
AN
TE
CH
CO
., L
TD
. AN
D IN
VE
STE
ES
INFO
RM
AT
ION
ON
INV
EST
EE
S FO
R T
HE
YE
AR
EN
DE
D D
EC
EM
BE
R 3
1, 2
018
(In
Tho
usan
ds o
f New
Tai
wan
Dol
lars
/For
eign
Cur
renc
y, U
nles
s Sta
ted
Oth
erw
ise)
Inve
stor
Com
pany
In
vest
ee C
ompa
ny
Loc
atio
n M
ain
Bus
ines
ses a
nd P
rodu
cts
Inve
stm
ent A
mou
nt
Bal
ance
as o
f Dec
embe
r 31
, 201
8 N
et In
com
e (L
oss)
of t
he
Inve
stee
Inve
stm
ent
Gai
n (L
oss)
(N
ote
A)
Not
e D
ecem
ber
31,
2018
D
ecem
ber
31,
2017
Sh
ares
Pe
rcen
tage
of
Ow
ners
hip
Car
ryin
g V
alue
Th
e C
ompa
ny
AA
C (B
VI)
B
VI
Inve
stm
ent a
nd m
anag
emen
t ser
vice
$
2,
332,
397
$
1,00
0,20
7
29,6
23,8
34
100.
00
$
5,93
2,17
0 $
48
2,77
2 $
46
0,15
6 Su
bsid
iary
ATC
B
VI
Sale
of i
ndus
trial
aut
omat
ion
prod
ucts
998,
788
99
8,78
8
33,8
50,0
00
100.
00
3,
718,
200
31
0,45
1
313,
722
Subs
idia
ry
A
dvan
ixs C
orpo
rate
Ta
ipei
, Tai
wan
Pr
oduc
tion
and
sale
of i
ndus
trial
aut
omat
ion
prod
ucts
226,
000
48
6,00
0
36,0
00,0
00
100.
00
23
7,59
3
53,0
65
10
4,31
3 Su
bsid
iary
Adv
ante
ch C
orpo
rate
Inve
stm
ent
Taip
ei, T
aiw
an
Inve
stm
ent h
oldi
ng c
ompa
ny
1,
400,
000
1,
400,
000
15
0,00
0,00
0 10
0.00
1,59
0,32
5
39,8
30
39
,752
Su
bsid
iary
Axi
omte
k Ta
ipei
, Tai
wan
Pr
oduc
tion
and
sale
of i
ndus
trial
aut
omat
ion
prod
ucts
249,
059
24
9,05
9
20,5
37,9
84
25.7
6
619,
411
40
6,92
3
105,
097
Equi
ty-m
eth
inve
stee
Adv
anPO
S Ta
ipei
, Tai
wan
Pr
oduc
tion
and
sale
of P
OS
syst
em
26
6,19
2
460,
572
1,
000,
000
100.
00
29
7,29
6
(370
)
895
Subs
idia
ry (N
ote
A)
LN
C
Taic
hung
, Tai
wan
Pr
oduc
tion
and
sale
of m
achi
nes w
ith c
ompu
teriz
ed
num
eric
al c
ontro
l
304,
865
43
1,63
4
19,2
30,0
00
64.1
0
433,
078
4,
061
3,
069
Subs
idia
ry
Ja
n H
sian
g Ta
ipei
, Tai
wan
El
ectro
nic
parts
and
com
pone
nts m
anuf
actu
ring
3,
719
3,
719
65
5,50
0 28
.50
8,
010
54
54
Equi
ty-m
eth
inve
stee
(Not
e A
)
AM
X
Mex
ico
Sale
of i
ndus
trial
aut
omat
ion
prod
ucts
4,92
2
4,92
2
- 10
0.00
222
63
9
639
Subs
idia
ry (N
ote
A)
A
EUH
H
elm
ond,
the
Net
herla
nds
Inve
stm
ent a
nd m
anag
emen
t ser
vice
1,21
9,12
4
1,21
9,12
4
25,9
61,2
50
100.
00
90
0,79
8
101,
355
10
1,35
5 Su
bsid
iary
ASG
Te
chpl
ace,
Sin
gapo
re
Sale
of i
ndus
trial
aut
omat
ion
prod
ucts
27,1
34
27
,134
1,45
0,00
0 10
0.00
108,
015
18
,154
18,1
54
Subs
idia
ry (N
ote
A)
A
TH
Thai
land
Pr
oduc
tion
of c
ompu
ters
47,7
01
-
51
,000
51
.00
51
,353
6,18
4
2,39
4 Su
bsid
iary
(Not
e A
)
AA
U
Sydn
ey, A
ustra
lia
Sale
of i
ndus
trial
aut
omat
ion
prod
ucts
40,6
00
40
,600
500,
204
100.
00
36
,226
(4,7
29)
(4
,729
) Su
bsid
iary
(Not
e A
)
AJP
To
kyo,
Japa
n Sa
le o
f ind
ustri
al a
utom
atio
n pr
oduc
ts
15
,472
15,4
72
1,
200
100.
00
33
2,22
4
50,4
27
50
,427
Su
bsid
iary
(Not
e A
)
AM
Y
Mal
aysi
a Sa
le o
f ind
ustri
al a
utom
atio
n pr
oduc
ts
35,1
40
35
,140
2,00
0,00
0 10
0.00
68,4
99
16
,937
16,9
37
Subs
idia
ry (N
ote
A)
A
KR
Se
oul,
Kor
ea
Sale
of i
ndus
trial
aut
omat
ion
prod
ucts
73,3
55
73
,355
600,
000
100.
00
32
2,52
4
99,9
92
99
,992
Su
bsid
iary
AB
R
Sao
Paul
o, B
razi
l Sa
le o
f ind
ustri
al a
utom
atio
n pr
oduc
ts
43
,216
43,2
16
1,
794,
996
80.0
0
67,3
28
18
,354
14,6
83
Subs
idia
ry (N
ote
A)
A
dvan
tech
Inno
vativ
e D
esig
n C
o., L
td.
Taip
ei, T
aiw
an
Prod
uct d
esig
n
10,0
00
10
,000
1,00
0,00
0 10
0.00
10,0
66
25
25
Subs
idia
ry (N
ote
A)
A
iST
Taip
ei, T
aiw
an
Des
ign,
dev
elop
and
sale
of i
ntel
ligen
t ser
vice
s
81,8
37
15
7,91
5
10,0
00,0
00
100.
00
96
,183
458
45
8 Su
bsid
iary
(Not
e A
)
BEM
C
Del
awar
e, U
SA
Sale
of i
ndus
trial
net
wor
k co
mm
unic
atio
ns sy
stem
s
-
1,96
8,04
4
- -
-
-
-
Subs
idia
ry (N
ote
B)
B
+B
Del
awar
e, U
SA
Sale
of i
ndus
trial
net
wor
k co
mm
unic
atio
ns sy
stem
s
1,96
8,04
4
1,96
8,04
4
230,
647
60.0
0
1,95
1,77
2
12,3
67
4,
646
Subs
idia
ry (N
ote
B)
A
IN
Indi
a Sa
le o
f ind
ustri
al a
utom
atio
n pr
oduc
ts
19
,754
19,7
54
3,
999,
999
99.9
9
10,7
14
5,
249
5,
249
Subs
idia
ry (N
ote
A)
A
IMob
ile C
o., L
td.
Taip
ei, T
aiw
an
Des
ign
and
man
ufac
ture
of i
ndus
trial
mob
ile sy
stem
s
135,
000
13
5,00
0
13,5
00,0
00
45.0
0
65,0
12
(4
2,50
6)
(1
9,12
8) E
quity
-met
h in
vest
ee (N
ote
A)
A
KST
G
angw
on-d
o, K
orea
Pr
oduc
tion
and
sale
of i
ntel
ligen
t med
ical
dis
play
83,3
13
83
,313
69,7
40
36.0
0
(27,
036)
(48,
434)
(27,
036)
Sub
sidia
ry (N
ote
A)
W
inm
ate
Taip
ei, T
aiw
an
Embe
dded
Sys
tem
Mod
ules
540,
000
54
0,00
0
12,0
00,0
00
16.6
2
542,
761
8,
562
33
,812
Eq
uity
-met
h in
vest
ee (N
ote
A)
A
VN
H
anoi
, Vie
tnam
Sa
le o
f ind
ustri
al a
utom
atio
n pr
oduc
ts
76
,092
-
8,10
0 60
.00
76
,539
2,38
5
1,07
6 Su
bsid
iary
(Not
e A
)
Nip
pon
RA
D In
c.
Toky
o, Ja
pan
R&
D o
f IoT
inte
llige
nt sy
stem
251,
915
-
85
0,00
0 16
.08
25
2,96
7
38,2
77
1,
556
Equi
ty-m
eth
inve
stee
AR
U
Mos
cow
, Rus
sia
Prod
uctio
n an
d sa
le o
f ind
ustri
al a
utom
atio
n pr
oduc
ts
23
,822
-
500,
000
100.
00
21
,402
(655
)
(655
) Su
bsid
iary
(Not
e A
)
A
KR
A
KST
G
angw
on-d
o, K
orea
Pr
oduc
tion
and
sale
of i
ntel
ligen
t med
ical
dis
play
55,5
79
55
,579
22,0
23
24.0
0
-
(48,
434)
- Su
bsid
iary
(Not
e A
)
A
dvan
tech
Cor
pora
te In
vest
men
t C
erm
ate
Taip
ei, T
aiw
an
Man
ufac
turin
g of
ele
ctro
nic
parts
, com
pute
r, an
d pe
riphe
ral d
evic
es
71
,500
71,5
00
5,
500,
000
55.0
0
128,
046
33
,408
18,2
97
Subs
idia
ry
D
enen
g
Taic
hung
, Tai
wan
In
stal
lmen
t and
sale
of e
lect
roni
c co
mpo
nent
s and
so
ftwar
e
18,0
95
18
,095
658,
000
39.6
9
14,1
00
(3
,419
)
(1,3
57)
Equi
ty-m
eth
inve
stee
(Not
e A
)
C
DIB
Inno
vatio
n A
ccel
erat
or
Co.
, Ltd
. Ta
ipei
, Tai
wan
In
vest
men
t hol
ding
com
pany
150,
000
75
,000
7,50
0,00
0 17
.86
14
7,10
9
(30,
213)
(5,3
95)
Equi
ty-m
eth
inve
stee
(Not
e A
)
A
zure
Wav
e Te
chno
logi
es, I
nc.
Taip
ei, T
aiw
an
Wire
less
com
mun
icat
ion
and
digi
tal i
mag
e m
odul
e m
anuf
actu
ring
and
tradi
ng
57
8,56
3
-
27,8
10,0
00
18.4
2
534,
780
(1
18,4
27)
(1
6,32
3) E
quity
-met
h in
vest
ee (N
ote
A)
H
uan
Yan
, Jhi
h-Li
an C
o., L
td.
Taip
ei, T
aiw
an
Com
bina
tion
of w
ater
trea
tmen
t rel
ated
tech
nolo
gies
an
d In
tern
et o
f Thi
ngs a
pplic
atio
ns
5,
000
-
50
0,00
0 50
.00
4,
971
(5
8)
(2
9) S
ubsid
iary
(Not
e A
)
Y
un Y
an, W
u-Li
an C
o., L
td
Taip
ei, T
aiw
an
Indu
stria
l equ
ipm
ent N
etw
orki
ng in
Gre
ater
Chi
na
5,
000
-
50
0,00
0 50
.00
3,
066
(3
,868
)
(1,9
34)
Subs
idia
ry (N
ote
A)
N
ippo
n R
AD
To
kyo,
Japa
n R
&D
of I
oT in
telli
gent
syst
em
49
,733
-
154,
310
2.92
45,7
33
38
,277
- Eq
uity
-met
h in
vest
ee
i-L
ink
Co.
, Ltd
Ta
ichu
ng, T
aiw
an
Inte
llige
nt m
edic
al in
tegr
atio
n
10,0
67
-
1,
000,
000
25.0
0
9,40
7
(38,
020)
(660
) Eq
uity
-met
h in
vest
ee (N
ote
A)
D
otZe
ro C
o., L
td
Taic
hung
, Tai
wan
In
telli
gent
met
al p
roce
ssin
g in
tegr
atio
n
4,90
0
-
490,
000
49.0
0
4,62
9
(554
)
(271
) Eq
uity
-met
h in
vest
ee (N
ote
A)
M
ildex
Opt
ical
Inc.
K
aohs
iung
, Tai
wan
M
anuf
actu
ring
of e
lect
roni
c pa
rts
20
2,94
8
-
15,7
08,4
50
50.0
0
183,
210
(4
3,12
0)
(1
,724
) Eq
uity
-met
h in
vest
ee (N
ote
A)
A
TC
ATC
(HK
) H
ong
Kon
g In
vest
men
t and
man
agem
ent s
ervi
ce
1,
212,
730
1,
212,
730
57
,890
,679
10
0.00
3,78
0,77
6
355,
324
35
8,59
5 Su
bsid
iary
(C
ontin
ued)
219

Inve
stor
Com
pany
In
vest
ee C
ompa
ny
Loc
atio
n M
ain
Bus
ines
ses a
nd P
rodu
cts
Inve
stm
ent A
mou
nt
Bal
ance
as o
f Dec
embe
r 31
, 201
8 N
et In
com
e (L
oss)
of t
he
Inve
stee
Inve
stm
ent
Gai
n (L
oss)
(N
ote
A)
Not
e D
ecem
ber
31,
2018
D
ecem
ber
31,
2017
Sh
ares
Pe
rcen
tage
of
Ow
ners
hip
Car
ryin
g V
alue
A
AC
(BV
I)
AN
A
Sunn
yval
e, U
SA
Sale
and
fabr
icat
ion
of in
dust
rial a
utom
atio
n pr
oduc
ts
$ 50
4,17
9 $
50
4,17
9
10,9
52,6
06
100.
00
$
2,72
7,35
4 $
22
0,59
8 $
22
1,54
4 Su
bsid
iary
AA
C (H
K)
Hon
g K
ong
Inve
stm
ent a
nd m
anag
emen
t ser
vice
539,
146
53
9,14
6
15,2
30,0
01
100.
00
1,
893,
119
12
7,61
1
127,
222
Subs
idia
ry
SI
oT (C
aym
an)
Cay
man
D
esig
n, d
evel
opm
ent a
nd sa
le o
f IoT
inte
llige
nt
syst
em se
rvic
es
US$
50
,000
-
30,0
00,0
00
100.
00
1,
642,
558
13
6,66
6
121,
748
Subs
idia
ry (N
ote
A)
SIoT
(Cay
man
) A
-DLo
G
Mun
ich,
Ger
man
y D
esig
n, R
&D
and
sale
of i
ndus
trial
aut
omat
ion
vehi
cles
and
rela
ted
prod
ucts
522,
719
-
1
100.
00
54
1,84
7
81,5
12
22
,574
Su
bsid
iary
AN
A
BEM
C
Del
awar
e, U
SA
Sale
of i
ndus
trial
net
wor
k co
mm
unic
atio
ns sy
stem
s
-
1,32
8,00
4
- -
-
-
-
Subs
idia
ry
B
+B
Del
awar
e, U
SA
Sale
of i
ndus
trial
net
wor
k co
mm
unic
atio
ns sy
stem
s
1,32
8,00
4
-
153,
765
40.0
0
5,04
0
12,3
67
4,
947
Subs
idia
ry
AEU
H
AEU
Ei
ndho
ven,
The
Net
herla
nds
Sale
of i
ndus
trial
aut
omat
ion
prod
ucts
431,
963
43
1,96
3
32,3
15,2
15
100.
00
1,
035,
770
96
,894
96,8
94
Subs
idia
ry
A
PL
War
saw
, Pol
and
Sale
of i
ndus
trial
aut
omat
ion
prod
ucts
14,1
76
14
,176
6,35
0 10
0.00
31,7
31
4,
982
4,
982
Subs
idia
ry (N
ote
A)
AEU
A
-DLo
G
Mun
ich,
Ger
man
y D
esig
n, R
&D
and
sale
of i
ndus
trial
aut
omat
ion
vehi
cles
and
rela
ted
prod
ucts
-
553,
536
-
-
-
81,5
12
50
,684
Su
bsid
iary
ASG
A
TH
Thai
land
Pr
oduc
tion
of c
ompu
ters
7,53
7
7,53
7
49,0
00
49.0
0
50,4
12
6,
184
3,
060
Subs
idia
ry (N
ote
A)
A
ID
Indo
nesi
a Sa
le o
f ind
ustri
al a
utom
atio
n pr
oduc
ts
4,
797
4,
797
30
0,00
0 10
0.00
8,64
0
3,56
5
3,56
5 Su
bsid
iary
(Not
e A
)
C
erm
ate
Land
Mar
k B
VI
Gen
eral
inve
stm
ent
28
,200
28,2
00
97
2,28
4 10
0.00
109,
970
29
,488
28,8
05
Subs
idia
ry (N
ote
A)
LNC
B
ette
r Aut
o B
VI
Gen
eral
inve
stm
ent
24
4,61
5
244,
615
8,
556,
096
100.
00
36
,137
(13,
003)
(13,
127)
Sub
sidia
ry
Bet
ter A
uto
Fam
ous N
ow
BV
I G
ener
al in
vest
men
t U
S$
4,00
0 U
S$
4,00
0
1 10
0.00
28,8
75
(1
2,84
5)
(1
2,84
5) S
ubsid
iary
B
EMC
A
vtek
D
elaw
are,
USA
Sa
le o
f ind
ustri
al n
etw
ork
com
mun
icat
ions
syst
ems
-
US$
99
,850
- -
-
-
-
Subs
idia
ry (N
ote
A)
Avt
ek
B+B
D
elaw
are,
USA
Sa
le o
f ind
ustri
al n
etw
ork
com
mun
icat
ions
syst
ems
-
US$
99
,850
- -
-
-
-
Subs
idia
ry (N
ote
A)
B+B
B
BI
Irel
and
Sale
of i
ndus
trial
net
wor
k co
mm
unic
atio
ns sy
stem
s U
S$
39,4
81
US$
39
,481
- 10
0.00
103,
431
(1
4,93
6)
(1
4,93
6) S
ubsid
iary
IMC
D
elaw
are,
USA
Sa
le o
f ind
ustri
al n
etw
ork
com
mun
icat
ions
syst
ems
-
-
-
100.
00
-
-
-
Subs
idia
ry
BB
I B
&B
Ele
ctro
nics
D
elaw
are,
USA
Sa
le o
f ind
ustri
al n
etw
ork
com
mun
icat
ions
syst
ems
US$
1,
314
US$
1,
314
-
100.
00
-
-
-
Subs
idia
ry
B
+B (C
Z)
Cze
ch R
epub
lic
Man
ufac
turin
g au
tom
atio
n
-
-
- 99
.99
29
1,36
4
63,4
95
63
,495
Su
bsid
iary
Con
el A
utom
atio
n C
zech
Rep
ublic
Sa
le o
f ind
ustri
al n
etw
ork
com
mun
icat
ions
syst
ems
-
-
-
1.00
(85)
(15,
773)
(158
) Su
bsid
iary
B&
B D
MC
C
Dub
ai
Sale
of i
ndus
trial
net
wor
k co
mm
unic
atio
ns sy
stem
s
-
-
- 10
0.00
1,69
0
1,72
3
1,72
3 Su
bsid
iary
B
&B
Ele
ctro
nics
B
+B (C
Z)
Cze
ch R
epub
lic
Man
ufac
turin
g au
tom
atio
n
-
-
- 0.
01
-
63
,495
- Su
bsid
iary
B
+B (C
Z)
Con
el A
utom
atio
n C
zech
Rep
ublic
Sa
le o
f ind
ustri
al n
etw
ork
com
mun
icat
ions
syst
ems
-
-
-
99.0
0
(8,4
56)
(1
5,77
3)
(1
5,61
5) S
ubsid
iary
N
ote
A:
The
resp
ectiv
e en
tity
is a
n im
mat
eria
l sub
sidi
ary;
its f
inan
cial
stat
emen
ts h
ave
not b
een
audi
ted,
whi
ch d
oes n
ot re
sult
in a
sign
ifica
nt im
pact
on
the
Gro
up’s
con
solid
ated
fina
ncia
l sta
tem
ents
. N
ote
B:
Due
to o
rgan
izat
iona
l res
trict
ing,
BEM
C h
as b
een
clea
red
afte
r liq
uida
tion.
The
par
ent c
ompa
ny w
ill d
irect
ly h
old
B+B
. N
ote
C:
Ref
er to
Tab
le 8
for i
nves
tmen
ts in
mai
nlan
d C
hina
.
(Con
clud
ed)
220

TA
BL
E 8
A
DV
AN
TE
CH
CO
., L
TD
. AN
D IN
VE
STE
ES
INV
EST
ME
NT
S IN
MA
INL
AN
D C
HIN
A
FOR
TH
E Y
EA
R E
ND
ED
DE
CE
MB
ER
31,
201
8 (I
n T
hous
ands
of N
ew T
aiw
an D
olla
rs, U
nles
s Sta
ted
Oth
erw
ise)
Inve
stee
Com
pany
Nam
e M
ain
Bus
ines
ses a
nd
Prod
ucts
Tot
al A
mou
nt
of P
aid-
in
Cap
ital
Inve
stm
ent
Typ
e (e
.g.,
Dir
ect o
r In
dire
ct)
Acc
umul
ated
O
utflo
w o
f In
vest
men
t fr
om T
aiw
an
as o
f Ja
nuar
y 1,
201
8
Inve
stm
ent F
low
s A
ccum
ulat
ed
Out
flow
of
Inve
stm
ent
from
Tai
wan
as
of
Dec
embe
r 31
, 20
18
Net
Inco
me
(Los
s) o
f the
In
vest
ee
%
Ow
ners
hip
of
Dir
ect o
r In
dire
ct
Inve
stm
ent
Inve
stm
ent
Gai
n (L
oss)
(N
ote
A)
Car
ryin
g
Val
ue a
s of
Dec
embe
r 31
, 20
18
Acc
umul
ated
In
war
d R
emitt
ance
of
Ear
ning
s as o
f D
ecem
ber
31,
2018
Out
flow
In
flow
A
dvan
tech
Tec
hnol
ogy
(Chi
na)
Com
pany
Ltd
. (“A
KM
C”)
Pr
oduc
tion
and
sale
of
co
mpo
nent
s of
indu
stria
l aut
omat
ion
prod
ucts
US$
43
,750
thou
sand
(Not
e F)
Indi
rect
$
1,
145,
670
(U
S$
37,3
00
th
ousa
nd)
$
- $
-
$
1,14
5,67
0 (
US$
37
,300
thou
sand
)
$
365,
352
100
$
368,
623
$
3,78
0,77
6 $
-
B
eijin
g Y
an H
ua X
ing
Ye
Elec
troni
c Sc
ienc
e &
Te
chno
logy
Co.
, Ltd
. (“
AC
N”)
Sale
of i
ndus
trial
au
tom
atio
n pr
oduc
ts U
S$
4,23
0
thou
sand
In
dire
ct
16
3,77
2 (
US$
5,
332
th
ousa
nd)
-
-
16
3,77
2 (
US$
5,
332
th
ousa
nd)
13
7,41
8 10
0
136,
986
1,
203,
575
US$
11
,232
thou
sand
Sh
angh
ai A
dvan
tech
Inte
llige
nt
Serv
ices
Co.
, Ltd
. (“A
iSC
”)
Prod
uctio
n an
d sa
le o
f in
dust
rial a
utom
atio
n pr
oduc
ts
US$
8,
000
th
ousa
nd
Indi
rect
245,
720
(U
S$
8,00
0
thou
sand
)
-
-
24
5,72
0 (
US$
8,
000
th
ousa
nd)
(1
7,00
3)
100
(1
6,95
9)
66
3,66
2
-
X
i’an
Adv
ante
ch S
oftw
are
Ltd.
(“
AX
A”)
D
evel
opm
ent a
nd
prod
uctio
n of
so
ftwar
e pr
oduc
ts
US$
1,
000
th
ousa
nd
Indi
rect
(Not
e C)
-
-
(Not
e C)
13
100
13
(Not
e A
)
29,8
87
-
H
angz
hou
Adv
anto
fine
Aut
omat
ion
Tech
. Co.
, Ltd
. Pr
oces
sing
and
sale
of
in
dust
rial a
utom
atio
n pr
oduc
ts
RM
B
3,00
0
thou
sand
In
dire
ct
(N
ote
D)
-
-
(N
ote
D)
(3
20)
-
(320
)
(Not
e A
)
-
-
A
dvan
ixs K
un S
han
Cor
p.
Prod
uctio
n an
d sa
le o
f
indu
stria
l aut
omat
ion
prod
ucts
RM
B
99,5
15
th
ousa
nd
Indi
rect
(Not
e G
)
-
-
(Not
e G
)
- -
-
-
-
LN
C D
ong
Gua
n C
o., L
td.
Prod
uctio
n an
d sa
le o
f in
dust
rial a
utom
atio
n pr
oduc
ts
US$
4,
000
th
ousa
nd
Indi
rect
98,1
04
(U
S$
3,19
4
thou
sand
)
-
-
98
,104
(
US$
3,
194
th
ousa
nd)
(1
3,00
4)
100
(1
2,88
0)
28
,993
-
Sh
enzh
en C
erm
ate
Tech
nolo
gies
Inc.
Pr
oduc
tion
and
sale
of
H
uman
Mac
hine
In
terf
ace
RM
B
2,00
0
thou
sand
In
dire
ct
9,
460
(U
S$
308
th
ousa
nd)
-
-
9,
460
(U
S$
308
th
ousa
nd)
29
,348
90
27,0
95
80
,552
U
S$
717
th
ousa
nd
RM
B
1,74
3
thou
sand
(Con
tinue
d)
221

Inve
stee
Com
pany
Nam
e M
ain
Bus
ines
ses a
nd
Prod
ucts
Tot
al A
mou
nt
of P
aid-
in
Cap
ital
Inve
stm
ent
Typ
e (e
.g.,
Dir
ect o
r In
dire
ct)
Acc
umul
ated
O
utflo
w o
f In
vest
men
t fr
om T
aiw
an
as o
f Ja
nuar
y 1,
201
8
Inve
stm
ent F
low
s A
ccum
ulat
ed
Out
flow
of
Inve
stm
ent
from
Tai
wan
as
of
Dec
embe
r 31
, 20
18
Net
Inco
me
(Los
s) o
f the
In
vest
ee
%
Ow
ners
hip
of
Dir
ect o
r In
dire
ct
Inve
stm
ent
Inve
stm
ent
Gai
n (L
oss)
(N
ote
A)
Car
ryin
g
Val
ue a
s of
Dec
embe
r 31
, 20
18
Acc
umul
ated
In
war
d R
emitt
ance
of
Ear
ning
s as o
f D
ecem
ber
31,
2018
Out
flow
In
flow
C
erm
ate
Tech
nolo
gies
(S
hang
hai)
Inc.
Sa
le o
f Hum
an
Mac
hine
Inte
rfac
e
US$
52
0
thou
sand
In
dire
ct
$
17,5
69
(U
S$
572
th
ousa
nd)
$
- $
-
$
17,5
69
(U
S$
572
th
ousa
nd)
$
3,07
4 10
0 $
3,
074
(N
ote
A)
$
30,6
54
$
-
A
dvan
tech
Ser
vice
-IoT
(Sha
ngha
i) C
o., L
td.
Dev
elop
men
t, co
nsul
ting
and
serv
ices
in
inte
llige
nt
tech
nolo
gy
RM
B
15,0
00
th
ousa
nd
Indi
rect
(Not
e H
)
-
-
(Not
e H
)
(6,5
84)
100
(6
,584
)
(Not
e A
)
59,9
19
-
Sh
angh
ai Y
anlo
Co.
, Ltd
. R
etai
l of i
ntel
ligen
t te
chno
logy
R
MB
22
,000
thou
sand
O
ther
(Not
e I)
-
-
(N
ote
I)
(58)
45
(26)
(Not
e A
)
4,39
3
-
Acc
umul
ated
Inve
stm
ent i
n M
ainl
and
Chi
na a
s of
D
ecem
ber
31, 2
018
Inve
stm
ent A
mou
nts
A
utho
rize
d by
Inve
stm
ent
C
omm
issi
on, M
OE
A
Allo
wab
le L
imit
on In
vest
men
t
$1
,686
,438
(U
S$54
,906
thou
sand
) (N
ote
E)
$2,9
02,3
21
(US$
94,4
92 th
ousa
nd)
$17,
724,
352
(Not
e K
)
N
ote
A:
The
resp
ectiv
e en
tity
is a
n im
mat
eria
l sub
sidi
ary;
its f
inan
cial
stat
emen
ts h
ave
not b
een
audi
ted,
whi
ch d
oes n
ot re
sult
in a
sign
ifica
nt im
pact
on
the
finan
cial
stat
emen
ts.
Not
e B
: Th
e si
gnifi
cant
eve
nts,
pric
es, p
aym
ent t
erm
s and
unr
ealiz
ed g
ains
or l
osse
s gen
erat
ed o
n tra
ding
bet
wee
n th
e C
ompa
ny a
nd it
s in
vest
ees i
n M
ainl
and
Chi
na a
re d
escr
ibed
in T
able
s 5 a
nd 6
. N
ote
C:
Rem
ittan
ce b
y A
CN
. N
ote
D:
In th
e fir
st q
uarte
r of 2
018,
Han
gzho
u A
dvan
tofin
e A
utom
atio
n C
o., L
td. w
as li
quid
ated
. N
ote
E:
Incl
uded
is th
e ou
tflow
of U
S$20
0 th
ousa
nd o
n th
e in
vest
men
t in
Yan
Hua
(Gua
ng Z
hou
Bao
Shu
i Qu)
Co.
, Ltd
. loc
ated
in a
free
trad
e zo
ne in
Gua
ng Z
hou.
Whe
n th
is in
vest
ee w
as li
quid
ated
in S
epte
mbe
r 200
5, th
e ou
twar
d in
vest
men
t re
mitt
ance
cea
sed
upon
the
appr
oval
of t
he M
inis
try o
f Eco
nom
ic A
ffai
rs (M
OEA
). Fo
r eac
h fu
ture
cap
ital r
etur
n, th
e C
ompa
ny w
ill a
pply
to th
e M
OEA
for t
he a
ppro
val o
f the
retu
rn a
s wel
l as r
educ
e th
e ac
cum
ulat
ed in
vest
men
t am
ount
by
the
retu
rn a
mou
nt.
Not
e F:
Fo
r AK
MC
, the
re w
as a
cap
ital i
ncre
ase
of U
S$6,
450
thou
sand
out
of e
arni
ngs.
N
ote
G:
In th
e se
cond
qua
rter o
f 201
8, A
dvan
ixs K
un S
han
Cor
p. w
as a
cqui
red
by A
KM
C, A
dvan
ixs K
un S
han
Cor
p. w
as li
quid
ated
.
Not
e H
: R
emitt
ance
by
AA
C (B
VI)
and
AiS
C.
Not
e I:
Rem
ittan
ce b
y A
iSC
; AiS
C’s i
nves
tmen
ts in
ass
ocia
te a
ccou
nted
for u
sing
the
equi
ty m
etho
d.
Not
e J:
Th
e ex
chan
ge ra
te w
as U
S$1=
NT$
30.7
15 a
nd R
MB
1=N
T$4.
472.
N
ote
K:
The
max
imum
allo
wab
le li
mit
on in
vest
men
t was
at 6
0% o
f the
con
solid
ated
net
ass
et v
alue
of t
he C
ompa
ny.
(Con
clud
ed)
222
DECLARATION OF CONSOLIDATION OF FINANCIAL STATEMENTS OF AFFILIATES
The companies required to be included in the consolidated financial statements of affiliates in accordance
with the “Criteria Governing Preparation of Affiliation Reports, Consolidated Business Reports and
Consolidated Financial Statements of Affiliated Enterprises” for the year ended December 31, 2018 are
all the same as the companies required to be included in the consolidated financial statements of parent
and subsidiary companies as provided in International Financial Reporting Standard 10. Relevant
information that should be disclosed in the consolidated financial statements of affiliates has all been
disclosed in the consolidated financial statements of parent and subsidiary companies. Hence, we have
not prepared a separate set of consolidated financial statements of affiliates.
Very truly yours,
ADVANTECH CO., LTD.
By:
K. C. LIU Chairman
March 8, 2019
Attachment II. The consolidated financial statements of the parent and
subsidiary audited by the CPA in the most recent year
223

INDEPENDENT AUDITORS’ REPORT
The Board of Directors and Shareholders Advantech Co., Ltd.
Opinion
We have audited the accompanying consolidated financial statements of Advantech Co., Ltd. (the “Company”) and its subsidiaries (collectively referred to as the “Group”), which comprise the consolidated balance sheets as of December 31, 2018 and 2017, and the consolidated statements of comprehensive income, changes in equity and cash flows for the years then ended, and the notes to the consolidated financial statements, including a summary of significant accounting policies.
In our opinion, the accompanying consolidated financial statements present fairly, in all material respects, the consolidated financial position of the Group as of December 31, 2018 and 2017, and its consolidated financial performance and its consolidated cash flows for the years then ended in accordance with the Regulations Governing the Preparation of Financial Reports by Securities Issuers, and International Financial Reporting Standards (IFRS), International Accounting Standards (IAS), IFRIC Interpretations (IFRIC), and SIC Interpretations (SIC) endorsed and issued into effect by the Financial Supervisory Commission of the Republic of China.
Basis for Opinion
We conducted our audits in accordance with the Regulations Governing Auditing and Attestation of Financial Statements by Certified Public Accountants and auditing standards generally accepted in the Republic of China. Our responsibilities under those standards are further described in the Auditors’ Responsibilities for the Audit of the Consolidated Financial Statements section of our report. We are independent of the Group in accordance with The Norm of Professional Ethics for Certified Public Accountant of the Republic of China, and we have fulfilled our other ethical responsibilities in accordance with these requirements. We believe that the audit evidence we have obtained is sufficient and appropriate to provide a basis for our opinion.
Key Audit Matters
Key audit matters are those matters that, in our professional judgment, were of most significance in our audit of the consolidated financial statements for the year ended December 31, 2018. These matters were addressed in the context of our audit of the consolidated financial statements as a whole, and in forming our opinion thereon, and we do not provide a separate opinion on these matters.
Key audit matters on the consolidated financial statements for the year ended December 31, 2018 were as follows:
Assessment of Provisions for Inventory Write-downs
Inventories as of December 31, 2018 amounted to NT$7,557,820 thousand and accounted for 17% of the total assets in the Group’s consolidated financial statements, which represented a material percentage of the total assets.
224

The inventories of the Group are measured at the lower of cost or net realizable value and according to the ratios of possible impairment for aged inventories. Due to the rapid changes in the technological environment and the significant size and variety of inventories, after analyzing the structure of provisions for inventory valuation, we noticed that the provisions were generated from obsolescent inventories which were aged longer. We considered the evaluation of inventory write-downs of aged inventories as having a significant impact on the Group’s consolidated financial statements. Therefore, the assessment of provisions for inventory write-downs was deemed to be one of the key audit matters.
Our audit procedures performed in respect of the above area included the following:
1. We assessed and analyzed the Group’s policies for the inventory write-downs provisions and comparedthem with other competitors’ policies to affirm the reasonableness and consistency of application.
2. We understand the internal control, evaluated and tested the design and operating effectiveness of theinternal controls over the provisions for inventory write-downs.
3. We reviewed the historical inventory aging reports to trace the process for the usage and scrap of agedinventories in order to assess the reasonableness of percentages for recognizing aged inventories.
4. We verified the appropriateness of source data, parameters and logic used in the Group’s inventory aginganalysis reports.
Sales Revenue
Since the Group operates in the highly competitive industry, we determined that revenue recognition of the Group carries risk due to the demand for the growth of sales and the need to remain competitive in the industry. Hence, the Group’s sales revenue from several product lines and customers whose sales increased materially in numbers and percentages was considered as a key audit matter.
Our audit procedures performed in respect of sales revenue included the following:
1. We analyzed the trend of the industry, categories of revenue, product lines and customer categories for twoconsecutive years to confirm whether there were any abnormal situations or centralized trading whichmight put revenue recognition at risk.
2. We interviewed personnel who operates the control activities and reviewed related internal vouchers tounderstand the processes of internal controls related to revenue-recognition and evaluate the design,implementation, and operating effectiveness of internal controls over revenue recognition. Tested suchinternal controls to obtain sufficient and appropriate audit evidence of the effectiveness of key controls.
3. We obtained details of accounts, analyzed balances and confirmed or reconciled them with general ledgers;tested the reconciliation between detailed and general ledgers and traced the reconciliation to acquiresufficient and appropriate evidence.
4. We determined the appropriate methods of sampling and sample sizes and audited sales orders, packinglists and export declarations in order to evaluate whether the amount of revenue is recognized accuratelyand in accordance with the regulations for the preparation of financial reports.
5. We audited the records and vouchers of collections to evaluate whether the amounts of collections areaccurate and the payers of such collections and the recipients of the related orders are consistent in order toattest the reality of sales.
225

Other Matter We have also audited the parent company only financial statements of the Company as of and for the years ended December 31, 2018 and 2017 on which we have issued an unmodified opinion. Responsibilities of Management and Those Charged with Governance for the Consolidated Financial
Statements Management is responsible for the preparation and fair presentation of the consolidated financial statements in accordance with the Regulations Governing the Preparation of Financial Reports by Securities Issuers, and IFRS, IAS, IFRIC, and SIC endorsed and issued into effect by the Financial Supervisory Commission of the Republic of China, and for such internal control as management determines is necessary to enable the preparation of consolidated financial statements that are free from material misstatement, whether due to fraud or error. In preparing the consolidated financial statements, management is responsible for assessing the Group’s ability to continue as a going concern, disclosing, as applicable, matters related to going concern and using the going concern basis of accounting unless management either intends to liquidate the Group or to cease operations, or has no realistic alternative but to do so. Those charged with governance, including the audit committee, are responsible for overseeing the Group’s financial reporting process. Auditors’ Responsibilities for the Audit of the Consolidated Financial Statements Our objectives are to obtain reasonable assurance about whether the consolidated financial statements as a whole are free from material misstatement, whether due to fraud or error, and to issue an auditors’ report that includes our opinion. Reasonable assurance is a high level of assurance, but is not a guarantee that an audit conducted in accordance with the auditing standards generally accepted in the Republic of China will always detect a material misstatement when it exists. Misstatements can arise from fraud or error and are considered material if, individually or in the aggregate, they could reasonably be expected to influence the economic decisions of users taken on the basis of these consolidated financial statements. As part of an audit in accordance with the auditing standards generally accepted in the Republic of China, we exercise professional judgment and maintain professional skepticism throughout the audit. We also: 1. Identify and assess the risks of material misstatement of the consolidated financial statements, whether due
to fraud or error, design and perform audit procedures responsive to those risks, and obtain audit evidence that is sufficient and appropriate to provide a basis for our opinion. The risk of not detecting a material misstatement resulting from fraud is higher than for one resulting from error, as fraud may involve collusion, forgery, intentional omissions, misrepresentations, or the override of internal control.
2. Obtain an understanding of internal control relevant to the audit in order to design audit procedures that are
appropriate in the circumstances, but not for the purpose of expressing an opinion on the effectiveness of the Group’s internal control.
3. Evaluate the appropriateness of accounting policies used and the reasonableness of accounting estimates
and related disclosures made by management. 4. Conclude on the appropriateness of management’s use of the going concern basis of accounting and, based
on the audit evidence obtained, whether a material uncertainty exists related to events or conditions that may cast significant doubt on the Group’s ability to continue as a going concern. If we conclude that a material uncertainty exists, we are required to draw attention in our auditors’ report to the related disclosures in the consolidated financial statements or, if such disclosures are inadequate, to modify our opinion. Our conclusions are based on the audit evidence obtained up to the date of our auditors’ report. However, future events or conditions may cause the Group to cease to continue as a going concern.
226

5. Evaluate the overall presentation, structure and content of the consolidated financial statements, includingthe disclosures, and whether the consolidated financial statements represent the underlying transactions andevents in a manner that achieves fair presentation.
6. Obtain sufficient and appropriate audit evidence regarding the financial information of entities or businessactivities within the Group to express an opinion on the consolidated financial statements. We areresponsible for the direction, supervision, and performance of the group audit. We remain solelyresponsible for our audit opinion.
We communicate with those charged with governance regarding, among other matters, the planned scope and timing of the audit and significant audit findings, including any significant deficiencies in internal control that we identify during our audit.
We also provide those charged with governance with a statement that we have complied with relevant ethical requirements regarding independence, and to communicate with them all relationships and other matters that may reasonably be thought to bear on our independence, and where applicable, related safeguards.
From the matters communicated with those charged with governance, we determine those matters that were of most significance in the audit of the consolidated financial statements for the year ended December 31, 2018 and are therefore the key audit matters. We describe these matters in our auditors’ report unless law or regulation precludes public disclosure about the matter or when, in extremely rare circumstances, we determine that a matter should not be communicated in our report because the adverse consequences of doing so would reasonably be expected to outweigh the public interest benefits of such communication.
The engagement partners on the audit resulting in this independent auditors’ report are Jr-Shian Ke and Meng-Chieh Chiu.
Deloitte & Touche Taipei, Taiwan Republic of China
March 8, 2019
Notice to Readers
The accompanying consolidated financial statements are intended only to present the consolidated financial position, financial performance and cash flows in accordance with accounting principles and practices generally accepted in the Republic of China and not those of any other jurisdictions. The standards, procedures and practices to audit such consolidated financial statements are those generally applied in the Republic of China.
For the convenience of readers, the independent auditors’ report and the accompanying consolidated financial statements have been translated into English from the original Chinese version prepared and used in the Republic of China. If there is any conflict between the English version and the original Chinese version or any difference in the interpretation of the two versions, the Chinese-language independent auditors’ report and consolidated financial statements shall prevail.
227

ADVANTECH CO., LTD. AND SUBSIDIARIES
CONSOLIDATED BALANCE SHEETS DECEMBER 31, 2018 AND 2017 (In Thousands of New Taiwan Dollars)
2018 2017 ASSETS Amount % Amount %
CURRENT ASSETS Cash and cash equivalents (Notes 4 and 6) $ 6,633,161 15 $ 5,204,219 13 Financial assets at fair value through profit or loss - current (Notes 4, 7 and 33) 2,098,552 5 3,098,846 8 Available-for-sale financial assets - current (Notes 4, 10 and 33) - - 229,381 1 Financial assets at amortized cost - current (Notes 4, 9 and 33) 157,426 1 - - Debt investments with no active market - current (Notes 4, 12 and 35) - - 38,908 - Notes receivable (Notes 4 and 13) 1,461,404 3 1,255,781 3 Trade receivables (Notes 4 and 13) 6,870,878 16 6,596,030 16 Trade receivables from related parties (Note 34) 18,969 - 14,067 - Other receivables 45,956 - 75,298 - Inventories (Notes 4, 5 and 14) 7,557,820 17 6,242,251 15 Other current assets (Note 20) 522,407 1 445,791 1
Total current assets 25,366,573 58 23,200,572 57
NON-CURRENT ASSETS Available-for-sale financial assets - non-current (Notes 4, 10 and 33) - - 1,430,854 4 Financial assets at fair value through other comprehensive income - non-current (Notes 4, 8 and 33) 1,300,267 3 - - Financial assets measured at cost - non-current (Notes 4 and 11) - - 78,518 - Investments accounted for using the equity method (Notes 4 and 16) 2,431,522 6 1,349,735 3 Property, plant and equipment (Notes 4, 17 and 35) 9,782,781 22 9,967,332 24 Goodwill (Notes 4, 5 and 18) 2,840,001 6 2,727,549 7 Other intangible assets (Notes 4, 5 and 19) 1,095,899 2 1,124,407 3 Deferred tax assets (Notes 4 and 26) 501,260 1 398,441 1 Prepayments for business facilities 273,386 1 68,440 - Long-term prepayments for leases (Note 20) 297,665 1 312,708 1 Other non-current assets (Note 31) 47,718 - 45,213 -
Total non-current assets 18,570,499 42 17,503,197 43
TOTAL $ 43,937,072 100 $ 40,703,769 100
LIABILITIES AND EQUITY
CURRENT LIABILITIES Short-term borrowings (Note 21) $ 87,581 - $ 8,400 - Financial liabilities at fair value through profit or loss - current (Notes 4, 7 and 33) 6,139 - 6,226 - Notes payable and trade payables (Notes 4 and 34) 5,810,904 13 5,280,728 13 Other payables (Note 22) 3,662,199 8 3,624,710 9 Current tax liabilities (Notes 4 and 26) 1,611,886 4 1,269,165 3 Short-term warranty provisions 196,782 1 180,975 - Current portion of long-term borrowings (Note 21) 9,626 - - - Other current liabilities 761,473 2 676,457 2
Total current liabilities 12,146,590 28 11,046,661 27
NON-CURRENT LIABILITIES Long-term borrowings (Note 21) 45,784 - 113,717 - Deferred tax liabilities (Notes 4 and 26) 1,798,914 4 1,399,013 4 Net defined benefit liabilities (Notes 4 and 23) 255,545 1 237,225 1 Other non-current liabilities 149,653 - 146,713 -
Total non-current liabilities 2,249,896 5 1,896,668 5
Total liabilities 14,396,486 33 12,943,329 32
EQUITY ATTRIBUTABLE TO OWNERS OF THE COMPANY Share capital
Ordinary shares 6,982,275 16 6,970,325 17 Advance receipts for share capital 4,680 - 2,500 -
Total share capital 6,986,955 16 6,972,825 17 Capital surplus 7,073,348 16 6,554,842 16 Retained earnings
Legal reserve 5,655,613 13 5,039,962 13 Special reserve 369,655 1 85,204 - Unappropriated earnings 10,015,895 23 9,297,896 23
Total retained earnings 16,041,163 37 14,423,062 36 Other equity
Exchange differences on translation of foreign financial statements (475,245) (1) (463,479) (1) Unrealized gain on available-for-sale financial assets - - 93,824 - Unrealized gain on financial assets at fair value through other comprehensive income (324,254) (1) - - Other equity - unearned stock-based employee comprehensive 736 - - -
Total other equity (798,763) (2) (369,655) (1)
Total equity attributable to owners of the Company 29,302,703 67 27,581,074 68
NON-CONTROLLING INTERESTS 237,883 - 179,366 -
Total equity 29,540,586 67 27,760,440 68
TOTAL $ 43,937,072 100 $ 40,703,769 100
The accompanying notes are an integral part of the consolidated financial statements.
228

ADVANTECH CO., LTD. AND SUBSIDIARIES
CONSOLIDATED STATEMENTS OF COMPREHENSIVE INCOME FOR THE YEARS ENDED DECEMBER 31, 2018 AND 2017 (In Thousands of New Taiwan Dollars, Except Earnings Per Share)
2018 2017 Amount % Amount %
OPERATING REVENUE (Notes 4 and 34) Sales $ 47,495,030 97 $ 43,367,051 98 Other operating revenue 1,231,488 3 1,007,700 2
Total operating revenue 48,726,518 100 44,374,751 100
OPERATING COSTS (Notes 14, 23, 25 and 34) 30,063,070 62 26,993,793 61
GROSS PROFIT 18,663,448 38 17,380,958 39
OPERATING EXPENSES (Notes 23, 25 and 34) Selling and marketing expenses 4,774,069 10 4,400,803 10 General and administrative expenses 2,424,667 5 2,389,863 5 Research and development expenses 3,997,313 8 3,811,815 9
Total operating expenses 11,196,049 23 10,602,481 24
OPERATING PROFIT 7,467,399 15 6,778,477 15
NON-OPERATING INCOME Share of the profit of associates accounted for using
the equity method (Note 16) 95,635 - 218,651 1 Interest income 38,789 - 16,461 - Gains on disposal of property, plant and equipment 80,439 - 96,885 - Gains on disposal of investments 8,012 - 292,441 1 Foreign exchange gains (losses), net (Notes 25
and 36) 16,956 - (76,098) - Gains on financial instruments at fair value through
profit or loss (Note 7) 59,322 - 207,795 - Dividend income 106,315 - 122,220 - Other income (Note 34) 173,002 1 95,772 - Finance costs (Note 25) (4,685) - (12,117) - Losses on financial instruments at fair value through
profit or loss (Note 7) (39,710) - (84,658) - Impairment loss - - (112,120) - Other losses (6,985) - (10,166) -
Total non-operating income 527,090 1 755,066 2
PROFIT BEFORE INCOME TAX 7,994,489 16 7,533,543 17
INCOME TAX EXPENSES (Note 26) 1,677,741 3 1,384,254 3
NET PROFIT FOR THE YEAR 6,316,748 13 6,149,289 14 (Continued)
229

ADVANTECH CO., LTD. AND SUBSIDIARIES
CONSOLIDATED STATEMENTS OF COMPREHENSIVE INCOME FOR THE YEARS ENDED DECEMBER 31, 2018 AND 2017 (In Thousands of New Taiwan Dollars, Except Earnings Per Share)
2018 2017 Amount % Amount %
OTHER COMPREHENSIVE INCOME (LOSS) Items that will not be reclassified subsequently to
profit or loss (Notes 16, 23, 24 and 26): Remeasurement of defined benefit plans $ (20,858) - $ (23,905) - Share of the other comprehensive income (loss) of
associates accounted for using the equity method (14,942) - (1,306) -
Unrealized loss on investments in equity instruments as at fair value through other comprehensive income (445,333) (1) - -
Income tax related to items that will not be reclassified 6,316 - 4,064 -
Items that may be reclassified subsequently to profit or loss (Notes 16, 23, 24 and 26): Exchange differences on translation of foreign
financial statements (30,455) - (315,229) (1) Unrealized gains (losses) on available-for-sale
financial assets - - (18,605) - Share of the other comprehensive losses of
associates (11,074) - (6,919) - Income tax related to items that may be
reclassified subsequently to profit or loss 23,883 - 54,450 -
Other comprehensive loss for the year, net of income tax (492,463) (1) (307,450) (1)
TOTAL COMPREHENSIVE INCOME FOR THE YEAR $ 5,824,285 12 $ 5,841,839 13
NET PROFIT (LOSS) ATTRIBUTABLE TO: Owners of the Company $ 6,294,657 13 $ 6,156,516 14 Non-controlling interests 22,091 - (7,227) -
$ 6,316,748 13 $ 6,149,289 14
TOTAL COMPREHENSIVE INCOME (LOSS) ATTRIBUTABLE TO: Owners of the Company $ 5,807,959 12 $ 5,850,991 13 Non-controlling interests 16,326 - (9,152) -
$ 5,824,285 12 $ 5,841,839 13 (Continued)
230

ADVANTECH CO., LTD. AND SUBSIDIARIES
CONSOLIDATED STATEMENTS OF COMPREHENSIVE INCOME FOR THE YEARS ENDED DECEMBER 31, 2018 AND 2017 (In Thousands of New Taiwan Dollars, Except Earnings Per Share)
2018 2017 Amount % Amount %
EARNINGS PER SHARE (NEW TAIWAN DOLLARS; Note 27) Basic $ 9.02 $ 8.84 Diluted $ 8.93 $ 8.77
The accompanying notes are an integral part of the consolidated financial statements. (Concluded)
231
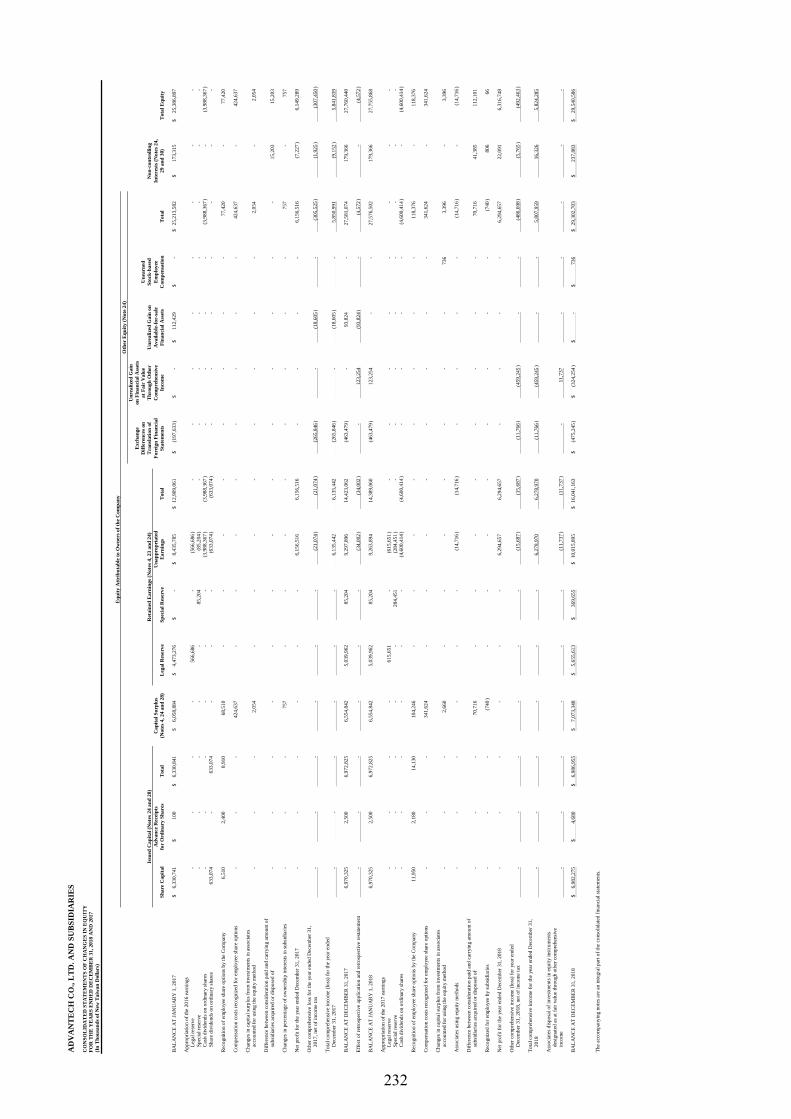
AD
VA
NT
EC
H C
O.,
LT
D. A
ND
SU
BSI
DIA
RIE
S C
ON
SOL
IDA
TE
D S
TA
TEM
EN
TS O
F C
HA
NG
ES
IN E
QU
ITY
FO
R T
HE
YEA
RS
EN
DE
D D
ECE
MB
ER
31,
201
8 A
ND
201
7 (I
n T
hous
ands
of N
ew T
aiw
an D
olla
rs)
Equ
ity A
ttrib
utab
le to
Ow
ners
of t
he C
ompa
ny
Oth
er E
quity
(Not
e 24
) U
nrea
lized
Gai
n E
xcha
nge
on
Fin
anci
al A
sset
s D
iffer
ence
s on
at F
air
Val
ue
Une
arne
d
Issu
ed C
apita
l (N
otes
24
and
28)
Ret
aine
d E
arni
ngs (
Not
es 4
, 23
and
24)
Tra
nsla
tion
of
Thr
ough
Oth
er
Unr
ealiz
ed G
ain
on
Stoc
k-ba
sed
N
on-c
ontr
ollin
g
Adv
ance
Rec
eipt
s C
apita
l Sur
plus
Una
ppro
pria
ted
Fo
reig
n Fi
nanc
ial
Com
preh
ensi
ve
Ava
ilabl
e-fo
r-sa
le
Em
ploy
ee
Inte
rest
s (N
otes
24,
Sh
are
Cap
ital
for
Ord
inar
y Sh
ares
T
otal
(N
otes
4, 2
4 an
d 28
) L
egal
Res
erve
Sp
ecia
l Res
erve
E
arni
ngs
Tot
al
Stat
emen
ts
Inco
me
Fi
nanc
ial A
sset
s C
ompe
nsat
ion
Tot
al
29 a
nd 3
0)
Tot
al E
quity
BA
LAN
CE
AT
JAN
UA
RY
1, 2
017
$
6,
330,
741
$
10
0
$
6,33
0,84
1
$
6,05
8,88
4
$
4,47
3,27
6
$
-
$
8,43
5,78
5
$
12,9
09,0
61
$
(1
97,6
33 )
$
-
$
11
2,42
9
$
-
$
25,2
13,5
82
$
17
3,31
5
$
25,3
86,8
97
App
ropr
iatio
n of
the
2016
ear
ning
s Le
gal r
eser
ve
- -
- -
566,
686
- (5
66,6
86 )
- -
- -
- -
- -
Spec
ial r
eser
ve
- -
- -
- 85
,204
(8
5,20
4 )
- -
- -
- -
- -
Cas
h di
vide
nds o
n or
dina
ry s
hare
s -
- -
- -
-
(3,9
88,3
67 )
(3
,988
,367
) -
- -
-
(3,9
88,3
67 )
- (3
,988
,367
) Sh
are
divi
dend
s on
ordi
nary
sha
res
633,
074
- 63
3,07
4 -
- -
(633
,074
) (6
33,0
74 )
- -
- -
- -
-
Rec
ogni
tion
of e
mpl
oyee
sha
re o
ptio
ns b
y th
e C
ompa
ny
6,51
0 2,
400
8,91
0 68
,510
-
- -
- -
- -
- 77
,420
-
77,4
20
Com
pens
atio
n co
sts r
ecog
nize
d fo
r em
ploy
ee s
hare
opt
ions
-
- -
424,
637
- -
- -
- -
- -
424,
637
- 42
4,63
7
Cha
nges
in c
apita
l sur
plus
from
inve
stm
ents
in a
ssoc
iate
s ac
coun
ted
for u
sing
the
equi
ty m
etho
d -
- -
2,05
4 -
- -
- -
- -
- 2,
054
- 2,
054
Diff
eren
ce b
etw
een
cons
ider
atio
n pa
id a
nd c
arry
ing
amou
nt o
f su
bsid
iarie
s acq
uire
d or
disp
osed
of
- -
- -
- -
- -
- -
- -
- 15
,203
15
,203
Cha
nges
in p
erce
ntag
e of
ow
ners
hip
inte
rest
s in
subs
idia
ries
- -
- 75
7 -
- -
- -
- -
- 75
7 -
757
Net
pro
fit fo
r the
yea
r end
ed D
ecem
ber 3
1, 2
017
- -
- -
- -
6,15
6,51
6 6,
156,
516
- -
- -
6,15
6,51
6 (7
,227
) 6,
149,
289
Oth
er c
ompr
ehen
sive
loss
for t
he y
ear e
nded
Dec
embe
r 31,
20
17, n
et o
f inc
ome
tax
- -
- -
- -
(21,
074 )
(2
1,07
4 )
(265
,846
) -
(18,
605 )
-
(305
,525
) (1
,925
) (3
07,4
50 )
Tota
l com
preh
ensi
ve in
com
e (lo
ss) f
or th
e ye
ar e
nded
D
ecem
ber 3
1, 2
017
- -
- -
- -
6,13
5,44
2 6,
135,
442
(265
,846
) -
(18,
605 )
-
5,85
0,99
1 (9
,152
) 5,
841,
839
BA
LAN
CE
AT
DEC
EMB
ER 3
1, 2
017
6,97
0,32
5 2,
500
6,97
2,82
5 6,
554,
842
5,03
9,96
2 85
,204
9,
297,
896
14,4
23,0
62
(463
,479
) -
93,8
24
-
27
,581
,074
17
9,36
6 27
,760
,440
Effe
ct o
f ret
rosp
ectiv
e ap
plic
atio
n an
d re
trosp
ectiv
e re
stat
emen
t -
- -
- -
- (3
4,00
2 )
(34,
002 )
-
123,
254
(93,
824 )
-
(4,5
72 )
- (4
,572
)
BA
LAN
CE
AT
JAN
UA
RY
1, 2
018
6,97
0,32
5 2,
500
6,97
2,82
5 6,
554,
842
5,03
9,96
2 85
,204
9,
263,
894
14,3
89,0
60
(463
,479
) 12
3,25
4 -
-
27
,576
,502
17
9,36
6 27
,755
,868
App
ropr
iatio
n of
the
2017
ear
ning
s Le
gal r
eser
ve
- -
- -
615,
651
- (6
15,6
51 )
- -
- -
- -
- -
Spec
ial r
eser
ve
- -
- -
- 28
4,45
1 (2
84,4
51 )
- -
- -
- -
- -
Cas
h di
vide
nds o
n or
dina
ry s
hare
s -
- -
- -
-
(4,6
00,4
14 )
(4
,600
,414
) -
- -
-
(4,6
00,4
14 )
- (4
,600
,414
)
Rec
ogni
tion
of e
mpl
oyee
sha
re o
ptio
ns b
y th
e C
ompa
ny
11,9
50
2,18
0 14
,130
10
4,24
6 -
- -
- -
- -
- 11
8,37
6 -
118,
376
Com
pens
atio
n co
sts r
ecog
nize
d fo
r em
ploy
ee s
hare
opt
ions
-
- -
341,
624
- -
- -
- -
- -
341,
624
- 34
1,62
4
Cha
nges
in c
apita
l sur
plus
from
inve
stm
ents
in a
ssoc
iate
s ac
coun
ted
for u
sing
the
equi
ty m
etho
d -
- -
2,66
0 -
- -
- -
- -
736
3,39
6 -
3,39
6
Ass
ocia
tes u
sing
equ
ity m
etho
ds
- -
- -
- -
(14,
716 )
(1
4,71
6 )
- -
- -
(14,
716 )
-
(14,
716 )
Diff
eren
ce b
etw
een
cons
ider
atio
n pa
id a
nd c
arry
ing
amou
nt o
f su
bsid
iarie
s acq
uire
d or
disp
osed
of
- -
- 70
,716
-
- -
- -
- -
- 70
,716
41
,385
11
2,10
1
Rec
ogni
zed
for e
mpl
oyee
by
subs
idia
ries
- -
- (7
40 )
- -
- -
- -
- -
(740
) 80
6 66
Net
pro
fit fo
r the
yea
r end
ed D
ecem
ber 3
1, 2
018
- -
- -
- -
6,29
4,65
7 6,
294,
657
- -
- -
6,29
4,65
7 22
,091
6,
316,
748
Oth
er c
ompr
ehen
sive
inco
me
(loss
) for
yea
r end
ed
Dec
embe
r 31,
201
8, n
et o
f inc
ome
tax
- -
- -
- -
(15,
687 )
(1
5,68
7 )
(11,
766 )
(4
59,2
45 )
- -
(486
,698
) (5
,765
) (4
92,4
63 )
Tota
l com
preh
ensi
ve in
com
e fo
r the
yea
r end
ed D
ecem
ber 3
1,
2018
-
- -
- -
- 6,
278,
970
6,27
8,97
0 (1
1,76
6 )
(459
,245
) -
- 5,
807,
959
16,3
26
5,82
4,28
5
Ass
ocia
tes d
ispos
al o
f inv
estm
ents
in e
quity
inst
rum
ents
de
sign
ated
as a
t fai
r val
ue th
roug
h ot
her c
ompr
ehen
sive
inco
me
- -
- -
- -
(11,
737 )
(1
1,73
7 )
- 11
,737
-
- -
- -
BA
LAN
CE
AT
DEC
EMB
ER 3
1, 2
018
$
6,
982,
275
$
4,
680
$
6,
986,
955
$
7,
073,
348
$
5,
655,
613
$
36
9,65
5
$
10,0
15,8
95
$
16
,041
,163
$
(475
,245
)
$
(324
,254
)
$
-
$
736
$
29
,302
,703
$
237,
883
$
29
,540
,586
The
acco
mpa
nyin
g no
tes a
re a
n in
tegr
al p
art o
f the
con
solid
ated
fina
ncia
l sta
tem
ents
.
232

ADVANTECH CO., LTD. AND SUBSIDIARIES
CONSOLIDATED STATEMENTS OF CASH FLOWS FOR THE YEARS ENDED DECEMBER 31, 2018 AND 2017 (In Thousands of New Taiwan Dollars)
2018 2017
CASH FLOWS FROM OPERATING ACTIVITIES Income before income tax $ 7,994,489 $ 7,533,543 Adjustments to reconcile profit (loss):
Depreciation expenses 567,706 587,293 Amortization expenses 165,406 228,062 Amortization expenses for prepayments of lease obligations 8,844 8,741 Impairment loss recognized (reversed) for trade receivables - 3,030 Expected loss on credit impairment 19,432 - Net gain on financial assets or liabilities at fair value through profit
or loss (19,612) (123,137) Compensation costs of employee share options 341,624 424,637 Finance costs 4,685 12,117 Interest income (38,789) (16,461) Dividend income (106,315) (122,220) Share of profit of associates accounted for using the equity method (95,635) (218,651) Gain on disposal of property, plant and equipment (80,439) (96,885) Gain on disposal of investments (8,012) (292,441) Impairment loss - 112,120
Changes in operating assets and liabilities Financial assets held for trading 967,642 (2,866,686) Notes receivable (205,623) (290,700) Trade receivables (278,370) (193,567) Trade receivables from related parties (4,902) (110) Other receivables 29,342 (61,523) Inventories (1,310,932) (614,558) Other current assets (76,001) 40,203 Notes payable and trade payables 510,358 270,599 Net defined benefit liabilities (2,538) 960 Other payables (3,165) (280,286) Short-term warranty provisions 15,807 13,853 Other current liabilities 84,143 15,583 Other non-current liabilities 2,940 5,115
Cash generated from operations 8,482,085 4,078,631 Interest received 38,789 16,461 Dividends received 106,315 122,220 Interest paid (3,093) (9,620) Income tax paid (1,198,350) (1,196,403)
Net cash generated from operating activities 7,425,746 3,011,289 (Continued)
233

ADVANTECH CO., LTD. AND SUBSIDIARIES
CONSOLIDATED STATEMENTS OF CASH FLOWS FOR THE YEARS ENDED DECEMBER 31, 2018 AND 2017 (In Thousands of New Taiwan Dollars)
2018 2017
CASH FLOWS FROM INVESTING ACTIVITIES Purchase of financial assets at fair value through other comprehensive
income $ (41,168) $ - Purchase of financial assets at amortized cost (116,998) - Purchase of available-for-sale financial assets - (6,589,478) Proceeds from sale of available-for-sale financial assets - 9,872,540 Proceeds from sale of debt investments with no active market - 26,485 Purchase of financial assets measured at cost - (77,333) Purchase of investments accounted for using the equity method (1,081,527) (615,000) Net cash flow on the acquisition of subsidiaries (60,322) (118,847) Dividends received from associates 146,250 75,026 Payments for property, plant and equipment (574,229) (533,741) Proceeds from disposal of property, plant and equipment 189,061 146,582 Decrease (increase) in refundable deposits (2,151) 6,858 Payments for intangible assets (111,209) (76,167) Decrease (increase) in prepayments for equipment (116,865) 12,820
Net cash generated from (used in) investing activities (1,769,158) 2,129,745
CASH FLOWS FROM FINANCING ACTIVITIES Decrease (increase) in short-term loans 79,481 (456,480) Repayments of long-term borrowings (54,245) (22,733) Increase in guarantee deposits received - 200 Payments of cash dividends (4,600,414) (3,988,367) Exercise of employee share options 118,376 77,420 Increase in non-controlling interests 104,910 757
Net cash used in financing activities (4,351,892) (4,389,203)
EFFECTS OF EXCHANGE RATE CHANGES ON THE BALANCE OF CASH HELD IN FOREIGN CURRENCIES 124,246 (185,189)
NET INCREASE IN CASH AND CASH EQUIVALENTS 1,428,942 566,642
CASH AND CASH EQUIVALENTS AT THE BEGINNING OF THE YEAR 5,204,219 4,637,577
CASH AND CASH EQUIVALENTS AT THE END OF THE YEAR $ 6,633,161 $ 5,204,219
The accompanying notes are an integral part of the consolidated financial statements. (Concluded)
234

ADVANTECH CO., LTD. AND SUBSIDIARIES
NOTES TO CONSOLIDATED FINANCIAL STATEMENTS FOR THE YEARS ENDED DECEMBER 31, 2018 AND 2017 (In Thousands of New Taiwan Dollars, Unless Stated Otherwise)
1. GENERAL INFORMATION
Advantech Co., Ltd. (the “Company”) is a listed company that was established in September 1981. Itmanufactures and sells embedded computing boards, industrial automation products and applied andindustrial computers.
The Company’s shares have been listed on the Taiwan Stock Exchange since December 1999.
To improve the entire operating efficiency of the Company and its subsidiaries (collectively referred to asthe “Group”), the Company’s board of directors resolved on June 30, 2009 to have a short-form mergerwith Advantech Investment and Management Service (“AIMS”). The effective merger date was July 30,2009. As the surviving entity, the Company assumed all assets and liabilities of AIMS. On June 26, 2014,the Company’s board of directors resolved to have a whale-minnow merger with Netstar Technology Co.,Ltd. (“Netstar”), an indirectly 95.51%-owned subsidiary through a wholly-owned subsidiary, AdvantechCorporate Investment. The effective merger date was July 27, 2014. As the surviving entity, the Companyassumed all assets and liabilities of Netstar.
The functional currency of the Company is the New Taiwan dollar.
2. APPROVAL OF FINANCIAL STATEMENTS
The consolidated financial statements were approved by the board of directors on March 8, 2019.
3. APPLICATION OF NEW, AMENDED AND REVISED STANDARDS AND INTERPRETATIONS
a. Initial application of the amendments to the Regulations Governing the Preparation of Financial Reportsby Securities Issuers and the International Financial Reporting Standards (IFRS), InternationalAccounting Standards (IAS), Interpretations of IFRS (IFRIC), and Interpretations of IAS (SIC)(collectively, the “IFRSs”) endorsed and issued into effect by FSC.
Except for the following, whenever applied, the initial application of the amendments to theRegulations Governing the Preparation of Financial Reports by Securities Issuers and the IFRSsendorsed and issued into effect by the FSC would not have any material impact on the Group’saccounting policies:
1) Annual Improvements to IFRSs 2014-2016 Cycle
Several standards, including IFRS 12 “Disclosure of Interests in Other Entities” and IAS 28“Investments in Associates and Joint Ventures,” were amended in this annual improvement.
235

The amendments to IAS 28 clarify that when the Group (a non-investment entity) applies the equity method to account for its investment in an associate that is an investment entity, the Group may elect to retain the fair value of the investment interests in subsidiaries of the investment entity associate. The election should be made separately for each investment entity associate, at the later of the date that (a) the investment entity associate is initially recognized, (b) the associate becomes an investment entity, or (c) the investment entity associate first becomes a parent.
2) IFRS 9 “Financial Instruments” and related amendments
IFRS 9 supersedes IAS 39 “Financial Instruments: Recognition and Measurement”, withconsequential amendments to IFRS 7 “Financial Instruments: Disclosures” and other standards.IFRS 9 sets out the requirements for classification, measurement and impairment of financial assetsand hedge accounting. Refer to Note 4 for information related to the relevant accounting policies.
Classification, measurement and impairment of financial assets
On the basis of the facts and circumstances that existed as at January 1, 2018, the Group hasperformed an assessment of the classification of recognized financial assets and has elected not torestate prior reporting periods.
The following table shows the original measurement categories and carrying amount under IAS 39and the new measurement categories and carrying amount under IFRS 9 for each class of theGroup’s financial assets and financial liabilities as at January 1, 2018.
Measurement Category Carrying Amount Financial Assets IAS 39 IFRS 9 IAS 39 IFRS 9 Remark
Cash and cash equivalents Loans and receivables Amortized cost $ 5,204,219 $ 5,204,219 - Derivatives Held for trading Mandatorily at fair value
through profit or loss (i.e. FVTPL)
5,084 5,084 -
Mutual funds Held for trading Mandatorily at FVTPL 2,794,858 2,794,858 - Equity securities Held for trading Mandatorily at FVTPL 101,325 101,325
Held for trading Fair value through other comprehensive income (i.e. FVTOCI) - equity instruments
197,579 197,579 a)
Available for sale Mandatorily at FVTPL 229,381 229,381 a) Available for sale FVTOCI - equity
instruments 1,430,854 1,430,854 a)
Financial assets measured at cost
FVTOCI - equity instruments
78,518 78,518 a)
Time deposits with original maturity of more than 3 months
Loans and receivables Amortized cost 38,908 38,908 b)
Notes receivable, trade receivables and other receivables
Loans and receivables Amortized cost 7,941,176 7,941,176 c)
236

Financial Assets
IAS 39 Carrying Amount
as of January 1,
2018 Reclassifi-
cations Remea-
surements
IFRS 9 Carrying Amount
as of January 1,
2018
Retained Earnings Effect on
January 1, 2018
Other Equity Effect on
January 1, 2018 Remark
FVTPL $ 3,098,846
Add: Reclassification from available-for-sale (IAS 39) required reclassification
Fair value option elected on January 1, 2018 - $ 229,381 - Less: Reclassification to FVTOCI - equity
instruments (IFRS 9) - (197,579 ) -
3,098,846 31,802 - $ 3,130,648 $ 87,115 $ (87,115 ) a)
FVTOCI
Equity instruments - Add: Reclassification from FVTPL (IAS 39)
(including fair value option revoked) - 197,579 -
Add: Reclassification from available-for-sale (IAS 39)
- 1,430,854 -
Add: Financial assets measured at cost (IAS 39)
- 78,518 -
- 1,706,951 - 1,706,951 (128,168 ) 128,168 a) Amortized cost
Add: Reclassification from loans and receivables (IAS 39)
- 13,184,303 - 13,184,303 - - b), c)
$ 3,098,846 $ 14,923,056 $ - $ 18,021,902 $ (41,053 ) $ 41,053
Financial Assets
IAS 39 Carrying Amount
as of January 1,
2018
Adjustments Arising from
Initial Application
IFRS 9 Carrying
Amount as of January 1,
2018
Retained Earnings Effect on
January 1, 2018
Other Equity
Effect on January 1,
2018 Remark
Investments accounted for using the equity method
$ 1,349,735 $ (4,572 ) $ 1,345,163 $ 7,051 $ (11,623 ) d)
a) The Group elected to classify all of its investments in equity securities previously classified asavailable-for-sale and at FVTPL under IAS 39 as at FVTPL and FVTOCI under IFRS 9. As aresult, the related other equity - unrealized gain (loss) on available-for-sale financial assets wasreclassified to retained earnings and to other equity - unrealized gain (loss) on financial assets atFVTOCI in the amount of $41,053 thousand.
Investments in unlisted shares previously measured at cost under IAS 39 have been designatedas at FVTOCI under IFRS 9 and were remeasured at fair value.
b) Debt investments previously classified as debt investments with no active market and measuredat amortized cost under IAS 39 were classified as measured at amortized cost with anassessment of expected credit losses under IFRS 9 because, on January 1, 2018, the contractualcash flows were solely payments of principal and interest on the principal outstanding, and theseinvestments were held within a business model whose objective is to collect contractual cashflows.
c) Notes receivable, trade receivables and other receivables that were previously classified as loansand receivables under IAS 39 were classified as measured at amortized cost with an assessmentof expected credit losses under IFRS 9.
d) As a result of retrospective application of IFRS 9 by associates, there was a decrease ininvestments accounted for using the equity method of $4,572 thousand, a decrease in otherequity - unrealized gain (loss) on financial assets at FVTOCI of $11,623 thousand and anincrease in retained earnings of $7,051 thousand on January 1, 2018.
237

3) IFRS 15 “Revenue from Contracts with Customers” and related amendments IFRS 15 establishes principles for recognizing revenue that apply to all contracts with customers, and supersedes IAS 18 “Revenue”, IAS 11 “Construction Contracts” and a number of revenue-related interpretations. Refer to Note 4 for the related disclosures. In identifying performance obligations, IFRS 15 and the related amendments require that a good or service is distinct if it is capable of being distinct (for example, the Group regularly sells it separately) and the promise to transfer it is distinct within the context of the contract (i.e. the nature of the promise in the contract is to transfer each good or service individually rather than to transfer a combined output). The Group provides service-type warranties in addition to assurance that its products comply with agreed-upon specifications. IFRS 15 requires such service to be considered as a performance obligation. Any transaction price allocated to a service-type warranty is recognized as revenue, and the related costs are recognized when such warranty service is performed. Under IFRS 15, the net effect of revenue recognized and consideration received and receivable is recognized as a contract asset or a contract liability. Prior to the application of IFRS 15, receivables and deferred revenue were recognized when revenue was recognized for the contract under IAS 18. The Group elects to retrospectively apply IFRS 15 to contracts that were not complete as of January 1, 2018 and recognize the cumulative effect of the change in retained earnings on January 1, 2018. For all contract modifications that occurred on or before December 31, 2017, the Group did not apply the requirements in IFRS 15 individually to each of the modifications, and the Group identified the performance obligations and determine and allocated transaction price in a manner that reflected the aggregate effect of all modifications that occurred on or before December 31, 2017. This reduced the complexity and cost of retrospective application and resulted in financial information that closely aligns with the financial information that would be available under IFRS 15 without the expedient.
4) Amendments to IAS 12 “Recognition of Deferred Tax Assets for Unrealized Losses” In determining whether to recognize a deferred tax asset, the Group should assess a deductible temporary difference in combination with all of its other deductible temporary differences, unless the tax law restricts the utilization of losses as deduction against income of a specific type, in which case, a deductible temporary difference is assessed in combination only with other deductible temporary differences of the appropriate type. The amendments also stipulate that, when determining whether to recognize a deferred tax asset, the estimate of probable future taxable profit may include some of the Group’s assets for more than their carrying amount if there is sufficient evidence that it is probable that the Group will achieve the higher amount, and that the estimate for future taxable profit should exclude tax deductions resulting from the reversal of deductible temporary differences. In assessing a deferred tax asset, the Group assumes it will recover the asset at its carrying amount when estimating probable future taxable profit. The Group applied the above amendments retrospectively in 2018.
238

5) IFRIC 22 “Foreign Currency Transactions and Advance Consideration” IAS 21 stipulated that a foreign currency transaction shall be recorded on initial recognition in the functional currency by applying to the foreign currency amount the spot exchange rate between the functional currency and the foreign currency at the date of the transaction. IFRIC 22 further explains that the date of the transaction is the date on which an entity recognizes a non-monetary asset or non-monetary liability from payment or receipt of advance consideration. If there are multiple payments or receipts in advance, the entity shall determine the date of the transaction for each payment or receipt of advance consideration. The Group applied IFRIC 22 prospectively to all assets, expenses and income recognized on or after January 1, 2018 within the scope of the Interpretation.
b. Amendments to the Regulations Governing the Preparation of Financial Reports by Securities Issuers
and the IFRSs endorsed by the FSC for application starting from 2019
New, Amended or Revised Standards and Interpretations (the “New IFRSs”)
Effective Date Announced by IASB (Note 1)
Annual Improvements to IFRSs 2015-2017 Cycle January 1, 2019 Amendments to IFRS 9 “Prepayment Features with Negative
Compensation” January 1, 2019 (Note 2)
IFRS 16 “Leases” January 1, 2019 Amendments to IAS 19 “Plan Amendment, Curtailment or
Settlement” January 1, 2019 (Note 3)
Amendments to IAS 28 “Long-term Interests in Associates and Joint Ventures”
January 1, 2019
IFRIC 23 “Uncertainty Over Income Tax Treatments” January 1, 2019 Note 1: Unless stated otherwise, the above New IFRSs are effective for annual periods beginning on
or after their respective effective dates. Note 2: The FSC permits the election for early adoption of the amendments starting from 2018. Note 3: The Group shall apply these amendments to plan amendments, curtailments or settlements
occurring on or after January 1, 2019. 1) IFRS 16 “Leases”
IFRS 16 sets out the accounting standards for leases that will supersede IAS 17, IFRIC 4 and a number of related interpretations. Definition of a lease Upon initial application of IFRS 16, the Group will elect to apply the guidance of IFRS 16 in determining whether contracts are, or contain, a lease only to contracts entered into (or changed) on or after January 1, 2019. Contracts identified as containing a lease under IAS 17 and IFRIC 4 will not be reassessed and will be accounted for in accordance with the transitional provisions under IFRS 16.
239

The Group as lessee Upon initial application of IFRS 16, the Group will recognize right-of-use assets and lease liabilities for all leases on the consolidated balance sheets except for those whose payments under low-value and short-term leases will be recognized as expenses on a straight-line basis. On the consolidated statements of comprehensive income, the Group will present the depreciation expense charged on right-of-use assets separately from the interest expense accrued on lease liabilities; interest is computed using the effective interest method. On the consolidated statements of cash flows, cash payments for the principal portion of lease liabilities will be classified within financing activities; cash payments for the interest portion will be classified within operating activities. Currently, payments under operating lease contracts, are recognized as expenses on a straight-line basis. Prepaid lease payment for acquiring land use right in China is recognized as long-term prepaid lease. Cash flows for operating leases are classified within operating activities on the consolidated statements of cash flows. The Group anticipates applying IFRS 16 retrospectively with the cumulative effect of the initial application of this standard recognized on January 1, 2019. Comparative information will not be restated. Lease liabilities will be recognized on January 1, 2019 for leases currently classified as operating leases with the application of IAS 17. Lease liabilities will be measured at the present value of the remaining lease payments, discounted using the lessee’s incremental borrowing rate on January 1, 2019. The Group will apply IAS 36 to all right-of-use assets. The Group expects to apply the following practical expedients: a) The Group will apply a single discount rate to a portfolio of leases with reasonably similar
characteristics to measure lease liabilities. b) The Group will account for those leases for which the lease term ends on or before December
31, 2019 as short-term leases. c) The Group will exclude initial direct costs from the measurement of right-of-use assets on
January 1, 2019. d) The Group will use hindsight, such as in determining lease terms, to measure lease liabilities. The Group as lessor The Group will not make any adjustments for leases in which it is a lessor and will account for those leases with the application of IFRS 16 starting from January 1, 2019. Anticipated impact on assets, liabilities and equity
Carrying Amount as of December 31,
2018
Adjustments Arising from
Initial Application
Adjusted Carrying
Amount as of January 1, 2019
Right-of-use assets $ - $ 683,787 $ 683,787 Total effect on assets $ - $ 683,787 $ 683,787 Lease liabilities - current $ - $ 38,165 $ 38,165 Lease liabilities - non-current - 645,622 645,622 Total effect on liabilities $ - $ 683,787 $ 683,787
240

2) IFRIC 23 “Uncertainty Over Income Tax Treatments”
IFRIC 23 clarifies that when there is uncertainty over income tax treatments, the Group should assume that the taxation authority will have full knowledge of all related information when making related examinations. If the Group concludes that it is probable that the taxation authority will accept an uncertain tax treatment, the Group should determine the taxable profit, tax bases, unused tax losses, unused tax credits or tax rates consistently with the tax treatments used or planned to be used in its income tax filings. If it is not probable that the taxation authority will accept an uncertain tax treatment, the Group should make estimates using either the most likely amount or the expected value of the tax treatment, depending on which method the Group expects to better predict the resolution of the uncertainty. The Group has to reassess its judgments and estimates if facts and circumstances change. Upon initial application of IFRIC 23, the Group will recognize the cumulative effect of retrospective application in retained earnings on January 1, 2019.
3) Amendments to IAS 28 “Long-term Interests in Associates and Joint Ventures” The amendments clarified that IFRS 9 shall be applied to account for other financial instruments in an associate to which the equity method is not applied. These included long-term interests that, in substance, form part of the Group’s net investment in an associate. Upon initial application of the above amendments, the Group will recognize the cumulative effect of retrospective application in retained earnings on January 1, 2019.
4) Amendments to IFRS 9 “Prepayment Features with Negative Compensation” IFRS 9 stipulated that if a contractual term of a financial asset permits the issuer (i.e. the debtor) to prepay a debt instrument or permits the holder (i.e. the creditor) to put a debt instrument back to the issuer before maturity and the prepayment amount substantially represents unpaid amounts of principal and interest on the principal amount outstanding, which may include reasonable compensation for early termination, the financial asset has contractual cash flows that are solely payments of principal and interest on the principal amount outstanding. The amendments further explained that reasonable compensation may be paid or received by either of the parties, i.e. a party may receive reasonable compensation when it chooses to terminate the contract early. Upon initial application of the above amendments, the Group will recognize the cumulative effect of retrospective application in retained earnings on January 1, 2019.
5) Annual Improvements to IFRSs 2015-2017 Cycle Several standards, including IFRS 3, IFRS 11, IAS 12 and IAS 23 “Borrowing Costs”, were amended in this annual improvement. IAS 23 was amended to clarify that, if any specific borrowing remains outstanding after the related asset is ready for its intended use or sale, the related borrowing costs shall be included in the calculation of the capitalization rate on general borrowings. Upon initial application of the above amendment, the related borrowing costs will be included in the calculation starting from 2019.
241

6) Amendments to IAS 19 “Plan Amendment, Curtailment or Settlement” The amendments stipulate that, if a plan amendment, curtailment or settlement occurs, the current service cost and the net interest for the remainder of the annual reporting period are determined using the actuarial assumptions used for the remeasurement of the net defined benefit liabilities (assets). In addition, the amendments clarify the effect of a plan amendment, curtailment or settlement on the requirements regarding the asset ceiling. The Group will apply the above amendment prospectively.
Except for the above impact, as of the date the financial statements were authorized for issue, the Company assesses the significant impact that the application of other standards and interpretations will have no significant influence on the Company’s financial position and financial performance.
c. New IFRSs in issue but not yet endorsed and issued into effect by the FSC
New IFRSs Effective Date
Announced by IASB (Note 1) Amendments to IFRS 3 “Definition of a Business” January 1, 2020 (Note 2) Amendments to IFRS 10 and IAS 28 “Sale or Contribution of Assets
between An Investor and Its Associate or Joint Venture” To be determined by IASB
IFRS 17 “Insurance Contracts” January 1, 2021 Amendments to IAS 1 and IAS 8 “Definition of Material” January 1, 2020 (Note 3) Note 1: Unless stated otherwise, the above New IFRSs are effective for annual periods beginning on
or after their respective effective dates. Note 2: The Group shall apply these amendments to business combinations for which the acquisition
date is on or after the beginning of the first annual reporting period beginning on or after January 1, 2020 and to asset acquisitions that occur on or after the beginning of that period.
Note 3: The Group shall apply these amendments prospectively for annual reporting periods
beginning on or after January 1, 2020. 1) Amendments to IFRS 10 and IAS 28 “Sale or Contribution of Assets between an Investor and its
Associate or Joint Venture” The amendments stipulate that, when the Group sells or contributes assets that constitute a business (as defined in IFRS 3) to an associate, the gain or loss resulting from the transaction is recognized in full. Also, when the Group loses control of a subsidiary that contains a business but retains significant influence or joint control, the gain or loss resulting from the transaction is recognized in full. Conversely, when the Group sells or contributes assets that do not constitute a business to an associate, the gain or loss resulting from the transaction is recognized only to the extent of the Group’s interest as an unrelated investor in the associate, i.e. the Group’s share of the gain or loss is eliminated. Also, when the Group loses control of a subsidiary that does not contain a business but retains significant influence over an associate, the gain or loss resulting from the transaction is recognized only to the extent of the Group’s interest as an unrelated investor in the associate, i.e. the Group’s share of the gain or loss is eliminated.
242

2) Amendments to IFRS 3 “Definition of a Business” The amendments clarify that, to be considered a business, an acquired set of activities and assets must include, at a minimum, an input and a substantive process applied to the input that together significantly contribute to the ability to create outputs. The amendments narrow the definitions of outputs by focusing on goods and services provided to customers, and the reference to an ability to reduce costs is removed. Moreover, the amendments remove the assessment of whether market participants are capable of replacing any missing inputs or processes and continuing to produce outputs. In addition, the amendments introduce an optional concentration test that permits a simplified assessment of whether an acquired set of activities and assets is not a business.
Except for the above impact, as of the date the consolidated financial statements were authorized for issue, the Group is continuously assessing the possible impact that the application of other standards and interpretations will have on the Group’s financial position and financial performance and will disclose the relevant impact when the assessment is completed.
4. SUMMARY OF SIGNIFICANT ACCOUNTING POLICIES a. Statement of compliance
The consolidated financial statements have been prepared in accordance with the Regulations Governing the Preparation of Financial Reports by Securities Issuers and IFRSs as endorsed and issued into effect by the FSC.
b. Basis of preparation
The consolidated financial statements have been prepared on the historical cost basis except for financial instruments which are measured at fair value and net defined benefit liabilities which are measured at the present value of the defined benefit obligation less the fair value of plan assets. The fair value measurements, which are grouped into Levels 1 to 3 based on the degree to which the fair value measurement inputs are observable and based on the significance of the inputs to the fair value measurement in its entirety, are described as follows: 1) Level 1 inputs are quoted prices (unadjusted) in active markets for identical assets or liabilities; 2) Level 2 inputs are inputs other than quoted prices included within Level 1 that are observable for an
asset or liability, either directly (i.e. as prices) or indirectly (i.e. derived from prices); and 3) Level 3 inputs are unobservable inputs for the asset or liability.
c. Classification of current and non-current assets and liabilities Current assets include: 1) Assets held primarily for the purpose of trading; 2) Assets expected to be realized within 12 months after the reporting period; and 3) Cash and cash equivalents unless the asset is restricted from being exchanged or used to settle a
liability for at least 12 months after the reporting period.
243

Current liabilities include: 1) Liabilities held primarily for the purpose of trading; 2) Liabilities due to be settled within 12 months after the reporting period; and 3) Liabilities for which the Group does not have an unconditional right to defer settlement for at least
12 months after the reporting period. Assets and liabilities that are not classified as current are classified as non-current.
d. Basis of consolidation The consolidated financial statements incorporate the financial statements of the Company and the entities controlled by the Company (i.e. its subsidiaries). Income and expenses of subsidiaries acquired or disposed of during the period are included in the consolidated statement of profit or loss and other comprehensive income from the effective dates of acquisitions up to the effective dates of disposals, as appropriate. When necessary, adjustments are made to the financial statements of subsidiaries to bring their accounting policies into line with those used by the Company. All intra-group transactions, balances, income and expenses are eliminated in full upon consolidation. Total comprehensive income of subsidiaries is attributed to the owners of the Company and to the non-controlling interests even if this results in the non-controlling interests having a deficit balance. Changes in the Group’s ownership interests in subsidiaries that do not result in the Group losing control over the subsidiaries are accounted for as equity transactions. The carrying amounts of the Group’s interests and the non-controlling interests are adjusted to reflect the changes in their relative interests in the subsidiaries. Any difference between the amount by which the non-controlling interests are adjusted and the fair value of the consideration paid or received is recognized directly in equity and attributed to the owners of the Company. See Note 15 and Table 7 and Table 8 for the detailed information of subsidiaries (including the percentage of ownership and main businesses).
e. Business combinations Acquisitions of businesses are accounted for using the acquisition method. Acquisition-related costs are generally recognized in profit or loss as they are incurred. Goodwill is measured as the excess of the sum of the consideration transferred, the amount of any non-controlling interests in the acquiree, and the fair value of the acquirer’s previously held equity interests in the acquiree over the net of the acquisition-date amounts of the identifiable assets acquired and the liabilities assumed. Non-controlling interests that are present ownership interests and entitle their holders to a proportionate share of the entity’s net assets in the event of liquidation may be initially measured either at fair value or at the non-controlling interests’ proportionate share of the recognized amounts of the acquiree’s identifiable net assets. The choice of the measurement basis is made on a transaction-by-transaction basis. Other types of non-controlling interests are measured at fair value. If the initial accounting for a business combination is incomplete by the end of the reporting period in which the combination occurs, the Group reports provisional amounts for the items for which the accounting is incomplete. Those provisional amounts are adjusted retrospectively during the measurement period, or additional assets or liabilities are recognized, to reflect new information obtained about facts and circumstances that existed as of the acquisition date that, if known, would have affected the amounts recognized as of that date.
244

f. Foreign currencies In preparing the financial statements of each individual group entity, transactions in currencies other than the entity’s functional currency (i.e. foreign currencies) are recognized at the rates of exchange prevailing at the dates of the transactions. At the end of each reporting period, monetary items denominated in foreign currencies are retranslated at the rates prevailing at that date. Exchange differences on monetary items arising from settlement or translation are recognized in profit or loss in the period in which they arise. Non-monetary items measured at fair value that are denominated in foreign currencies are retranslated at the rates prevailing at the date when the fair value was determined. Exchange differences arising from the retranslation of non-monetary items are included in profit or loss for the period except for exchange differences arising from the retranslation of non-monetary items in respect of which gains and losses are recognized directly in other comprehensive income, in which cases, the exchange differences are also recognized directly in other comprehensive income. Non-monetary items that are measured at historical cost in a foreign currency are translated using the exchange rate at the date of the transaction. For the purpose of presenting consolidated financial statements, the functional currencies of the group entities (including subsidiaries and associates that use currencies which are different from the currency of the Company) are translated into the presentation currency, the New Taiwan dollar, as follows: Assets and liabilities are translated at the exchange rates prevailing at the end of the reporting period; and income and expense items are translated at the average exchange rates for the period. The resulting currency translation differences are recognized in other comprehensive income (attributed to the owners of the Company and non-controlling interests as appropriate). Goodwill and fair value adjustments on identifiable assets and liabilities acquired arising from the acquisition of a foreign operation are treated as assets and liabilities of the foreign operation and translated at the rate of exchange prevailing at the end of each reporting period. Exchange differences arising are recognized in other comprehensive income.
g. Inventories Inventories consist of raw materials, supplies, finished goods and work in process and are stated at the lower of cost or net realizable value. Inventory write-downs are made by item, except where it may be appropriate to group similar or related items. The net realizable value is the estimated selling price of inventories less all estimated costs of completion and costs necessary to make the sale. Inventories are recorded at the weighted-average cost on the balance sheet date.
h. Investments in associates An associate is an entity over which the Group has significant influence. The Group uses the equity method to account for its investments in associates. Under the equity method, investments in an associate are initially recognized at cost and adjusted thereafter to recognize the Group’s share of the profit or loss and other comprehensive income of the associate. The Group also recognizes the changes in the Group’s share of the equity of associates. Any excess of the cost of acquisition over the Group’s share of the net fair value of the identifiable assets and liabilities of an associate at the date of acquisition is recognized as goodwill, which is included within the carrying amount of the investment and is not amortized. Any excess of the Group’s share of the net fair value of the identifiable assets and liabilities over the cost of acquisition, after reassessment, is recognized immediately in profit or loss.
245

When the Company subscribes for additional new shares of an associate at a percentage different from its existing ownership percentage, the resulting carrying amount of the investment differs from the amount of the Group’s proportionate interest in the associate. The Group records such a difference as an adjustment to investments with the corresponding amount charged or credited to capital surplus - changes in capital surplus from investments in associates accounted for using the equity method. If the Group’s ownership interest is reduced due to its additional subscription of the new shares of the associate, the proportionate amount of the gains or losses previously recognized in other comprehensive income in relation to that associate and is reclassified to profit or loss on the same basis as would be required if the investee had directly disposed of the related assets or liabilities. When the adjustment should be debited to capital surplus, but the capital surplus recognized from investments accounted for using the equity method is insufficient, the shortage is debited to retained earnings. When the Group’s share of losses of an associate equals or exceeds its interest in that associate (which includes any carrying amount of the investment accounted for using the equity method and long-term interests that, in substance, form part of the Group’s net investment in the associate), the Group discontinues recognizing its share of further losses. Additional losses and liabilities are recognized only to the extent that the Group has incurred legal obligations, or constructive obligations, or made payments on behalf of that associate. The entire carrying amount of an investment (including goodwill) is tested for impairment as a single asset by comparing its recoverable amount with its carrying amount. Any impairment loss recognized is not allocated to any asset, including goodwill, that forms part of the carrying amount of the investment. Any reversal of that impairment loss is recognized to the extent that the recoverable amount of the investment subsequently increases. The Group discontinues the use of the equity method from the date on which its investment ceases to be an associate. Any retained investment is measured at fair value at that date, and the fair value is regarded as the investment’s fair value on initial recognition as a financial asset. The difference between the previous carrying amount of the associate attributable to the retained interest and its fair value is included in the determination of the gain or loss on disposal of the associate. The Group accounts for all amounts previously recognized in other comprehensive income in relation to that associate on the same basis as would be required if that associate had directly disposed of the related assets or liabilities. When a group entity transacts with its associate, profits and losses resulting from the transactions with the associate are recognized in the Group’ consolidated financial statements only to the extent that interests in the associate are not related to the Group.
i. Property, plant and equipment Property, plant and equipment are measured at cost less accumulated depreciation and accumulated impairment loss. Property, plant and equipment in the course of construction are measured at cost less any recognized impairment loss. Cost includes professional fees and borrowing costs eligible for capitalization. Such assets are depreciated and classified to the appropriate categories of property, plant and equipment when completed and ready for their intended use. Freehold land is not depreciated. Depreciation of property, plant and equipment is recognized using the straight-line method. Each significant part is depreciated separately. The estimated useful lives, residual values and depreciation methods are reviewed at the end of each reporting period, with the effects of any changes in the estimates accounted for on a prospective basis.
246

On derecognition of an item of property, plant and equipment, the difference between the sales proceeds and the carrying amount of the asset is recognized in profit or loss.
j. Goodwill
Goodwill arising from the acquisition of a business is measured at cost as established at the date of acquisition of the business less accumulated impairment loss. For the purposes of impairment testing, goodwill is allocated to each of the Group’s cash-generating units or groups of cash-generating units (referred to as “cash-generating units”) that is expected to benefit from the synergies of the combination. A cash-generating unit to which goodwill has been allocated is tested for impairment annually or more frequently when there is an indication that the unit may be impaired, by comparing its carrying amount, including the attributed goodwill, with its recoverable amount. However, if the goodwill allocated to a cash-generating unit was acquired in a business combination during the current annual period, that unit shall be tested for impairment before the end of the current annual period. If the recoverable amount of the cash-generating unit is less than its carrying amount, the impairment loss is allocated first to reduce the carrying amount of any goodwill allocated to the unit and then pro rata to the other assets of the unit based on the carrying amount of each asset in the unit. Any impairment loss is recognized directly in profit or loss. Any impairment loss recognized for goodwill is not reversed in subsequent periods. If goodwill has been allocated to a cash-generating unit and the entity disposes of an operation within that unit, the goodwill associated with the operation which is disposed of is included in the carrying amount of the operation when determining the gain or loss on disposal and is measured on the basis of the relative values of the operation disposed of and the portion of the cash-generating unit retained.
k. Intangible assets 1) Intangible assets acquired separately
Intangible assets with finite useful lives that are acquired separately are initially measured at cost and subsequently measured at cost less accumulated amortization and accumulated impairment loss. Amortization is recognized on a straight-line basis. The estimated useful lives, residual values, and amortization methods are reviewed at the end of each reporting period, with the effect of any changes in the estimates accounted for on a prospective basis. Intangible assets with indefinite useful lives that are acquired separately are measured at cost less accumulated impairment loss.
2) Intangible assets acquired in a business combination Intangible assets acquired in a business combination and recognized separately from goodwill are initially recognized at their fair value at the acquisition date (which is regarded as their cost). Subsequent to initial recognition, they are measured on the same basis as intangible assets that are acquired separately.
3) Derecognition of intangible assets On derecognition of an intangible asset, the difference between the net disposal proceeds and the carrying amount of the asset is recognized in profit or loss.
247

l. Impairment of tangible and intangible assets other than goodwill At the end of each reporting period, the Group reviews the carrying amounts of its tangible and intangible assets, excluding goodwill, to determine whether there is any indication that those assets have suffered any impairment loss. If any such indication exists, the recoverable amount of the asset is estimated in order to determine the extent of the impairment loss. When it is not possible to estimate the recoverable amount of an individual asset, the Group estimates the recoverable amount of the cash-generating unit to which the asset belongs. Corporate assets are allocated to the individual cash-generating units on a reasonable and consistent basis of allocation. Intangible assets with indefinite useful lives and intangible assets not yet available for use are tested for impairment at least annually and whenever there is an indication that the assets may be impaired. The recoverable amount is the higher of fair value less costs to sell and value in use. If the recoverable amount of an asset or cash-generating unit is estimated to be less than its carrying amount, the carrying amount of the asset or cash-generating unit is reduced to its recoverable amount, with the resulting impairment loss recognized in profit or loss. When an impairment loss is subsequently reversed, the carrying amount of the corresponding asset or cash-generating unit is increased to the revised estimate of its recoverable amount, but only to the extent of the carrying amount that would have been determined had no impairment loss been recognized for the asset or cash-generating unit in prior years. A reversal of an impairment loss is recognized in profit or loss.
m. Financial instruments Financial assets and financial liabilities are recognized when a group entity becomes a party to the contractual provisions of the instruments. Financial assets and financial liabilities are initially measured at fair value. Transaction costs that are directly attributable to an acquisition or issuance of financial assets and financial liabilities (other than financial assets and financial liabilities at fair value through profit or loss) are added to or deducted from the fair value of the financial assets or financial liabilities, as appropriate, on initial recognition. Transaction costs directly attributable to the acquisition of financial assets or financial liabilities at fair value through profit or loss are recognized immediately in profit or loss. 1) Financial assets
All regular way purchases or sales of financial assets are recognized and derecognized on a trade date basis. a) Measurement categories
2018 Financial assets are classified into the following categories: Financial assets at FVTPL, financial assets at amortized cost and investments in debt instruments and equity instruments at FVTOCI. i. Financial assets at FVTPL
Financial assets are classified as at FVTPL when such a financial asset is mandatorily classified or designated as at FVTPL. Financial assets mandatorily classified as at FVTPL include investments in equity instruments which are not designated as at FVTOCI and debt instruments that do not meet the amortized cost criteria or the FVTOCI criteria.
248

Financial assets at FVTPL are subsequently measured at fair value, with any gains or losses arising on remeasurement recognized in profit or loss. The net gain or loss recognized in profit or loss any dividends or interest earned on such a financial asset. Fair value is determined in the manner described in Note 33.
ii. Financial assets at amortized cost
Financial assets that meet the following conditions are subsequently measured at amortized cost: i) The financial asset is held within a business model whose objective is to hold financial
assets in order to collect contractual cash flows; and ii) The contractual terms of the financial asset give rise on specified dates to cash flows
that are solely payments of principal and interest on the principal amount outstanding. Subsequent to initial recognition, financial assets at amortized cost, including cash and cash equivalents, and trade receivables at amortized cost, are measured at amortized cost, which equals the gross carrying amount determined using the effective interest method less any impairment loss. Exchange differences are recognized in profit or loss. Interest income is calculated by applying the effective interest rate to the gross carrying amount of such a financial asset, except for: i) Purchased or originated credit-impaired financial assets, for which interest income is
calculated by applying the credit-adjusted effective interest rate to the amortized cost of such financial assets; and
ii) Financial assets that are not credit-impaired on purchase or origination but have
subsequently become credit-impaired, for which interest income is calculated by applying the effective interest rate to the amortized cost of such financial assets in subsequent reporting periods.
Cash equivalents include time deposits with original maturities within 3 months from the date of acquisition, which are highly liquid, readily convertible to a known amount of cash and are subject to an insignificant risk of changes in value. These cash equivalents are held for the purpose of meeting short-term cash commitments.
iii. Investments in equity instruments at FVTOCI On initial recognition, the Group may make an irrevocable election to designate investments in equity instruments as at FVTOCI. Designation as at FVTOCI is not permitted if the equity investment is held for trading or if it is contingent consideration recognized by an acquirer in a business combination. Investments in equity instruments at FVTOCI are subsequently measured at fair value with gains and losses arising from changes in fair value recognized in other comprehensive income and accumulated in other equity. The cumulative gain or loss will not be reclassified to profit or loss on disposal of the equity investments; instead, it will be transferred to retained earnings. Dividends on these investments in equity instruments are recognized in profit or loss when the Group’s right to receive the dividends is established, unless the dividends clearly represent a recovery of part of the cost of the investment.
249

2017 Financial assets are classified into the following categories: Financial assets at fair value through profit or loss, available-for-sale financial assets, and loans and receivables. i. Financial assets at fair value through profit or loss
Financial assets are classified as at fair value through profit or loss when such financial assets are either held for trading or designated as at fair value through profit or loss. Financial assets at fair value through profit or loss are stated at fair value, with any gains or losses arising on remeasurement recognized in profit or loss. The net gain or loss recognized in profit or loss incorporates any dividend or interest earned on the financial asset. Fair value is determined in the manner described in Note 33.
ii. Available-for-sale financial assets
Available-for-sale financial assets are non-derivatives that are either designated as available-for-sale or are not classified as loans and receivables, held-to-maturity investments or financial assets at fair value through profit or loss. Available-for-sale financial assets are measured at fair value. Changes in the carrying amounts of available-for-sale monetary financial assets (relating to changes in foreign currency exchange rates, interest income calculated using the effective interest method and dividends on available-for-sale equity investments) are recognized in profit or loss. Other changes in the carrying amount of available-for-sale financial assets are recognized in other comprehensive income and will be reclassified to profit or loss when the investments are disposed of or are determined to be impaired. Dividends on available-for-sale equity instruments are recognized in profit or loss when the Group’s right to receive the dividends is established.
iii. Loans and receivables Loans and receivables (including trade receivables and cash and cash equivalent) are measured using the effective interest method at amortized cost less any impairment, except for short-term receivables when the effect of discounting is immaterial. Cash equivalents include time deposits with original maturities within 3 months from the date of acquisition, which are highly liquid, readily convertible to a known amount of cash and are subject to an insignificant risk of changes in value. These cash equivalents are held for the purpose of meeting short-term cash commitments.
b) Impairment of financial assets 2018 The Group recognizes a loss allowance for expected credit losses on financial assets at amortized cost (including trade receivables), investments in debt instruments that are measured at FVTOCI, lease receivables, as well as contract assets. The Group always recognizes lifetime expected credit losses (i.e. ECLs) for trade receivables. For all other financial instruments, the Group recognizes lifetime ECLs when there has been a significant increase in credit risk since initial recognition. If, on the other hand, the credit risk on a financial instrument has not increased significantly since initial recognition, the Group measures the loss allowance for that financial instrument at an amount equal to 12-month ECLs.
250

Expected credit losses reflect the weighted average of credit losses with the respective risks of default occurring as the weights. Lifetime ECLs represent the expected credit losses that will result from all possible default events over the expected life of a financial instrument. In contrast, 12-month ECLs represent the portion of lifetime ECLs that is expected to result from default events on a financial instrument that are possible within 12 months after the reporting date. The Group recognizes an impairment gain or loss in profit or loss for all financial instruments with a corresponding adjustment to their carrying amount through a loss allowance account, except for investments in debt instruments that are measured at FVTOCI, for which the loss allowance is recognized in other comprehensive income and does not reduce the carrying amount of such a financial asset. 2017 Financial assets, other than those at fair value through profit or loss, are assessed for indicators of impairment at the end of each reporting period. Financial assets are considered to be impaired when there is objective evidence, as a result of one or more events that occurred after the initial recognition of such financial asset, that the estimated future cash flows of the investment have been affected. Financial assets carried at amortized cost, such as trade receivables, are assessed for impairment on a collective basis even if they were assessed not to be impaired individually. Objective evidence of impairment for a portfolio of receivables could include the Group’s past experience with collecting payments, an increase in the number of delayed payments in the portfolio past the average credit period of 90 days, as well as observable changes in national or local economic conditions that correlate with defaults on receivables. For financial assets at amortized cost, the amount of the impairment loss recognized is the difference between the asset’s carrying amount and the present value of estimated future cash flows, discounted at the financial asset’s original effective interest rate. For financial assets at amortized cost, if, in a subsequent period, the amount of the impairment loss decreases and the decrease can be related objectively to an event occurring after the impairment was recognized, the previously recognized impairment loss is reversed through profit or loss to the extent that the carrying amount of the investment (at the date the impairment is reversed) does not exceed what the amortized cost would have been had the impairment not been recognized. For available-for-sale equity investments, a significant or prolonged decline in the fair value of the security below its cost is considered to be objective evidence of impairment. For all other financial assets, objective evidence of impairment could include significant financial difficulty of the issuer or counterparty, breach of contract, such as a default or delinquency in interest or principal payments, it becoming probable that the borrower will enter bankruptcy or financial re-organization, or the disappearance of an active market for that financial asset because of financial difficulties. When an available-for-sale financial asset is considered to be impaired, cumulative gains or losses previously recognized in other comprehensive income are reclassified to profit or loss in the period.
251

In respect of available-for-sale equity securities, impairment loss previously recognized in profit or loss is not reversed through profit or loss. Any increase in fair value subsequent to impairment is recognized in other comprehensive income. In respect of available-for-sale debt securities, impairment loss is subsequently reversed through profit or loss if an increase in the fair value of the investment can be objectively related to an event occurring after the recognition of the impairment loss. For financial assets measured at cost, the amount of the impairment loss is measured as the difference between such an asset’s carrying amount and the present value of its estimated future cash flows discounted at the current market rate of return for a similar financial asset. Such impairment loss will not be reversed in subsequent periods. The carrying amount of the financial asset is reduced by the impairment loss directly for all financial assets, with the exception of trade receivables, where the carrying amount is reduced through the use of an allowance account. When trade receivables are considered uncollectible, they are written off against the allowance account. Subsequent recoveries of amounts previously written off are credited against the allowance account. Changes in the carrying amount of the allowance account are recognized in profit or loss except for uncollectible trade receivables that are written off against the allowance account.
c) Derecognition of financial assets The Group derecognizes a financial asset only when the contractual rights to the cash flows from the asset expire or when it transfers the financial asset and substantially all the risks and rewards of ownership of the asset to another party. Before 2018, on derecognition of a financial asset in its entirety, the difference between the asset’s carrying amount and the sum of the consideration received and receivable and the cumulative gain or loss that had been recognized in other comprehensive income is recognized in profit or loss. Starting from 2018, on derecognition of a financial asset at amortized cost in its entirety, the difference between the asset’s carrying amount and the sum of the consideration received and receivable is recognized in profit or loss. On derecognition of an investment in an equity instrument at FVTOCI, the difference between the asset’s carrying amount and the sum of the consideration received and receivable is recognized in profit or loss, and the cumulative gain or loss that had been recognized in other comprehensive income is transferred directly to retained earnings, without recycling through profit or loss.
2) Equity instruments Debt and equity instruments issued by a group entity are classified as either financial liabilities or as equity in accordance with the substance of the contractual arrangements and the definitions of a financial liability and an equity instrument. Equity instruments issued by a group entity are recognized at the proceeds received, net of direct issue costs. The repurchase of the Company’s own equity instruments is recognized in and deducted directly from equity. No gain or loss is recognized in profit or loss on the purchase, sale, issuance or cancellation of the Company’s own equity instruments.
252

3) Financial liabilities a) Subsequent measurement
Except the following situations, all financial liabilities are measured at amortized cost using the effective interest method: Financial liabilities at fair value through profit or loss Financial liabilities are classified as at fair value through profit or loss when such financial liabilities are either held for trading or is designated as at fair value through profit or loss. Fair value is determined in the manner described in Note 33.
b) Derecognition of financial liabilities The difference between the carrying amount of a financial liability derecognized and the consideration paid, including any non-cash assets transferred or liabilities assumed, is recognized in profit or loss.
4) Derivative financial instruments The Group enters into forward contracts to manage its exposure to foreign exchange rate risks. Derivatives are initially recognized at fair value at the date the derivative contracts are entered into and are subsequently remeasured to their fair value at the end of each reporting period. The resulting gain or loss is recognized in profit or loss immediately unless the derivative is designated and effective as a hedging instrument, in which event, the timing of the recognition in profit or loss depends on the nature of the hedging relationship. When the fair value of a derivative financial instrument is positive, the derivative is recognized as a financial asset; when the fair value of a derivative financial instrument is negative, the derivative is recognized as a financial liability. Before 2018, derivatives embedded in non-derivative host contracts were treated as separate derivatives when they met the definition of a derivative; their risks and characteristics were not closely related to those of the host contracts; and the contracts were not measured at FVTPL. Starting from 2018, derivatives embedded in hybrid contracts that contain financial asset hosts that is within the scope of IFRS 9 are not separated; instead, the classification is determined in accordance with the entire hybrid contract. Derivatives embedded in non-derivative host contracts that are not financial assets that is within the scope of IFRS 9 (e.g. financial liabilities) are treated as separate derivatives when they meet the definition of a derivative; their risks and characteristics are not closely related to those of the host contracts; and the host contracts are not measured at FVTPL.
n. Provisions Provisions are measured at the best estimate of the discounted cash flows of the consideration required to settle the present obligation at the end of the reporting period, taking into account the risks and uncertainties surrounding the obligation. Provisions for the expected cost of warranty obligations are recognized at the date of sale of the relevant products at the best estimate by the management of the Company of the expenditures required to settle the Group’s obligations.
253

o. Revenue recognition 2018 Contracts applicable to IFRS 15 The Group identifies contracts with the customers, allocates transaction price to the performance obligations and recognizes revenue when the performance obligations are satisfied. For contracts where the period between the date when the Group transfers a promised good or service to a customer and the date on which the customer pays for that good or service is one year or less, the Group does not adjust the promised amount of consideration for the effects of a significant financing component. 1) Revenue from sale of goods
Revenue from sale of goods comes from sales of embedded computing boards, industrial automation products and applied and industrial computers. Sales of the above products are majorly recognized as revenue under contracts when the goods are shipped because it is the time when the customer has full discretion over the manner of distribution and the price to sell the goods, has the primary responsibility for sales to future customers and bears the risks of obsolescence. Trade receivables are recognized concurrently. The Group does not recognize revenue on materials delivered to subcontractors because this delivery does not involve a transfer of control.
2) Revenue from rendering services Revenue from rendering services comes from developing products and extended warranty services. Such revenue is recognized when services are provided.
Contracts prior to 2018 without retrospective application of IFRS 15 Revenue is measured at the fair value of the consideration received or receivable. Revenue is reduced for estimated customer returns, rebates and other similar allowances. Allowances for sales returns and liabilities for returns are recognized at the time of sale based on the seller’s reliable estimate of future returns and based on past experience and other relevant factors.
1) Sale of goods
Revenue from the sale of goods is recognized when all the following conditions are satisfied: a) The Group has transferred to the buyer the significant risks and rewards of ownership of the
goods; b) The Group retains neither continuing managerial involvement to the degree usually associated
with ownership nor effective control over the goods sold; c) The amount of revenue can be measured reliably; d) It is probable that the economic benefits associated with the transaction will flow to the Group;
and e) The costs incurred or to be incurred in respect of the transaction can be measured reliably.
The Group does not recognize sales revenue on materials delivered to subcontractors because this delivery does not involve a transfer of risks and rewards of the materials’ ownership.
254

2) Rendering of services
Service income is recognized when services are provided. Revenue from a contract to provide services is recognized with reference to the stage of completion of the contract.
3) Dividends and interest income Dividends income from investments is recognized when a shareholder’s right to receive payment has been established and provided that it is probable that the economic benefits will flow to the Group and that the amount of income can be measured reliably. Interest income from a financial asset is recognized when it is probable that the economic benefits will flow to the Group and the amount of income can be measured reliably. Interest income is accrued on a time basis by reference to the principal outstanding and at the applicable effective interest rate.
p. Leasing Leases are classified as finance leases whenever the terms of a lease transfer substantially all the risks and rewards of ownership to the lessee. All other leases are classified as operating leases. 1) The Group as lessor
Rental income from operating leases is recognized on a straight-line basis over the term of the relevant lease.
2) The Group as lessee Operating lease payments are recognized as expenses on a straight-line basis over the lease term.
q. Government grants Government grants are not recognized until there is reasonable assurance that the Group will comply with the conditions attached to them and that the grants will be received. Government grants are recognized in profit or loss on a systematic basis over the periods in which the Group recognizes as expenses the related costs for which the grants are intended to compensate. Government grants that are receivable as compensation for expenses or losses already incurred or for the purpose of giving immediate financial support to the Group with no future related costs are recognized in profit or loss in the period in which they become receivable.
r. Employee benefits 1) Short-term employee benefits
Liabilities recognized in respect of short-term employee benefits are measured at the undiscounted amount of the benefits expected to be paid in exchange for the related services.
2) Retirement benefits Payments to defined contribution retirement benefit plans are recognized as expenses when employees have rendered services entitling them to the contributions.
255

Defined benefit costs (including service cost, net interest and remeasurement) under defined benefit retirement benefit plans are determined using the projected unit credit method. Service cost (including current service cost and past service cost) and net interest on the net defined benefit liabilities (assets) are recognized as employee benefits expense in the period in which they occur or when the plan amendment or curtailment occurs. Remeasurement, comprising actuarial gains and losses, the effect of the changes to the asset ceiling and the return on plan assets (excluding interest), is recognized in other comprehensive income in the period in which it occurs. Remeasurement recognized in other comprehensive income is reflected immediately in retained earnings and will not be reclassified to profit or loss. Net defined benefit liabilities (assets) represent the actual deficit (surplus) in the Group’s defined benefit plans. Any surplus resulting from this calculation is limited to the present value of any refunds from the plans or reductions in future contributions to the plans.
s. Employee share options Employee share options granted to employee and others providing similar services. The fair value at the grant date of the employee share options is expensed on a straight-line basis over the vesting period, based on the Group’s best estimates of the number of shares or options that are expected to ultimately vest, with a corresponding increase in capital surplus - employee share options. It is recognized as an expense in full at the grant date if vested immediately. At the end of each reporting period, the Group revises its estimate of the number of employee share options expected to vest. The impact of the revision of the original estimates is recognized in profit or loss such that the cumulative expenses reflect the revised estimate, with a corresponding adjustment to capital surplus - employee share options.
t. Taxation
Income tax expense represents the sum of the tax currently payable and deferred tax. 1) Current tax
According to the Income Tax Law, an additional tax of unappropriated earnings is provided for as income tax in the year the shareholders approve to retain earnings. Adjustments of prior years’ tax liabilities are added to or deducted from the current year’s tax provision.
2) Deferred tax Deferred tax is recognized on temporary differences between the carrying amounts of assets and liabilities and the corresponding tax bases used in the computation of taxable profit. If a temporary difference arises from the initial recognition (other than in a business combination) of assets and liabilities in a transaction that affects neither the taxable profit nor the accounting profit, the resulting deferred tax asset or liability is not recognized. In addition, a deferred tax liability is not recognized on taxable temporary differences arising from the initial recognition of goodwill. Deferred tax liabilities are generally recognized for all taxable temporary differences. Deferred tax assets are generally recognized for all deductible temporary differences, unused loss carryforwards and unused tax credits for purchases of machinery, equipment and technology, research and development expenditures, and personnel training expenditures to the extent that it is probable that taxable profits will be available against which those deductible temporary differences can be utilized.
256

Deferred tax liabilities are recognized for taxable temporary differences associated with investments in subsidiaries and associates, except where the Group is able to control the reversal of the temporary difference and it is probable that the temporary difference will not reverse in the foreseeable future. Deferred tax assets arising from deductible temporary differences associated with such investments and interests are only recognized to the extent that it is probable that there will be sufficient taxable profits against which to utilize the benefits of the temporary differences and they are expected to reverse in the foreseeable future. The carrying amount of deferred tax assets is reviewed at the end of each reporting period and reduced to the extent that it is no longer probable that sufficient taxable profits will be available to allow all or part of the assets to be recovered. A previously unrecognized deferred tax asset is also reviewed at the end of each reporting period and recognized to the extent that it has become probable that future taxable profit will allow the deferred tax asset to be recovered. Deferred tax liabilities and assets are measured at the tax rates that are expected to apply in the period in which the liabilities are settled or the assets are realized, based on tax rates (and tax laws) that have been enacted or substantively enacted by the end of the reporting period. The measurement of deferred tax liabilities and assets reflects the tax consequences that would follow from the manner in which the Group expects, at the end of the reporting period, to recover or settle the carrying amount of its assets and liabilities.
3) Current and deferred taxes for the year Current and deferred taxes are recognized in profit or loss, except when they relate to items that are recognized in other comprehensive income or directly in equity, in which case, the current and deferred taxes are also recognized in other comprehensive income or directly in equity, respectively. Where current tax or deferred tax arises from the initial accounting for a business combination, the tax effect is included in the accounting for the business combination.
5. CRITICAL ACCOUNTING JUDGMENTS AND KEY SOURCES OF ESTIMATION
UNCERTAINTY In the application of the Group’s accounting policies, management is required to make judgments, estimates and assumptions about the carrying amounts of assets and liabilities that are not readily apparent from other sources. The estimates and associated assumptions are based on historical experience and other factors that are considered relevant. Actual results may differ from these estimates. The estimates and underlying assumptions are reviewed on an ongoing basis. Revisions to accounting estimates are recognized in the period in which the estimates are revised if the revisions affect only that period or in the period of the revisions and future periods if the revisions affect both current and future periods. a. Inventory write-downs
The net realizable value of inventories is the estimated selling price in the ordinary course of business less the estimated costs of completion and disposal. The estimation of net realizable value is based on current market conditions and historical experience with product sales of a similar nature. Changes in market conditions may have a material impact on the estimation of the net realizable value.
257

b. Significant influence over associates As Note 16 Investments accounted for using the equity method describes that several companies are associates of the Group although the Group only holds less than 20% of the voting power in each of these companies, and the Group has significant influence over these companies as it can obtain its representatives in the board of directors according to the investment contract.
c. Impairment of goodwill Determining whether goodwill is impaired requires an estimation of the value in use of the cash-generating units to which goodwill has been allocated. The calculation of the value in use requires management to estimate the future cash flows expected to arise from the cash-generating units and a suitable discount rate in order to calculate the present value. Where the actual future cash flows are less than expected, a material impairment loss may arise.
6. CASH AND CASH EQUIVALENTS December 31 2018 2017 Cash on hand $ 76,179 $ 70,453 Checking accounts and demand deposits 5,350,844 4,942,396 Cash equivalents (time deposits with original maturities less than
three months) 1,206,138 191,370 $ 6,633,161 $ 5,204,219 The market rate intervals of cash in bank, at the end of the reporting period were as follows: December 31 2018 2017 Demand deposits 0%-6.5% 0.0001%-6.9% Time deposits with original maturities of less than three months 1.0%-5.2% 1.35%-2.3%
7. FINANCIAL INSTRUMENTS AT FAIR VALUE THROUGH PROFIT OR LOSS
December 31 2018 2017 Financial assets at FVTPL - current Financial assets held for trading
Derivative financial assets (not under hedge accounting) Foreign exchange forward contracts $ - $ 5,084
Non-derivative financial assets Domestic quoted shares - 289,570 Foreign quoted shares - 9,334 Mutual funds - 2,794,858 - 3,098,846
(Continued)
258

December 31 2018 2017 Financial assets mandatorily classified as at FVTPL
Derivative financial assets (not under hedge accounting) Foreign exchange forward contracts $ 5,198 $ -
Non-derivative financial assets Domestic quoted shares 202,622 - Foreign quoted shares 5,270 - Mutual funds 1,885,462 -
2,098,552 - $ 2,098,552 $ 3,098,846 Financial liabilities at FVTPL - current Financial liabilities held for trading
Derivative financial liabilities (not under hedge accounting) Foreign exchange forward contracts $ - $ 6,226
Financial assets mandatorily classified as at FVTPL Derivative financial liabilities (not under hedge accounting)
Foreign exchange forward contracts 6,139 - $ 6,139 $ 6,226
(Concluded) At the end of the reporting period, outstanding foreign exchange forward contracts not under hedge accounting were as follows:
Currency Maturity Date Notional Amount (In Thousands)
December 31, 2018 Sell EUR/NTD 2019.01-2019.04 EUR12,600/NTD448,286 EUR/USD 2019.01-2019.02 EUR400/USD459 JPY/NTD 2019.01-2019.05 JPY380,000/NTD104,301 RMB/NTD 2019.01-2019.04 RMB67,000/NTD295,236 December 31, 2017 Sell EUR/NTD 2018.01-2018.05 EUR14,000/NTD499,225 EUR/USD 2018.01-2018.04 EUR1,500/USD1,805 JPY/NTD 2018.01-2018.05 JPY500,000/NTD134,549 RMB/NTD 2018.01-2018.03 RMB77,000/NTD346,212 The Group entered into foreign exchange forward contracts during the years ended December 31, 2018 and 2017 to manage exposures due to exchange rate fluctuations of foreign-currency denominated assets and liabilities. Because these contracts did not meet the criteria for hedge effectiveness, they were not subject to hedge accounting.
259

8. FINANCIAL ASSETS AT FAIR VALUE THROUGH OTHER COMPREHENSIVE INCOME - 2018
December 31,
2018 Non-current Investments in equity instruments at FVTOCI $ 1,300,267 Investments in equity instruments at FVTOCI:
December 31,
2018 Non-current Domestic investments
Listed shares and emerging market shares Ordinary shares - ASUSTek Computer Inc. $ 955,001 Ordinary shares - Allied Circuit Co., Ltd. 226,501
Unlisted shares Ordinary shares - BroadTec System Inc. 3,879 Ordinary shares - BiosenseTek Corp. - Ordinary shares - Juguar Technology 4,743 Ordinary shares - Taiwan DSC PV Ltd. -
1,190,124 Foreign investments
Shanghai Shangchuang Xinwei Investment Management Co., Ltd. 107,328 JamaPro Co., Ltd. 2,815
110,143 $ 1,300,267 These investments in equity instruments are not held for trading. Instead, they are held for medium to long-term strategic purposes. Accordingly, the management elected to designate these investments in equity instruments as at FVTOCI as they believe that recognizing short-term fluctuations in these investments’ fair value in profit or loss would not be consistent with the Group’s strategy of holding these investments for long-term purposes. These investments in equity instruments were classified as available-for-sale under IAS 39. Refer to Notes 3, 10 and 11 for information related to their reclassification and comparative information for 2017.
9. FINANCIAL ASSETS AT AMORTIZED COST - 2018
December 31,
2018 Current Domestic investments
Time deposits with original maturity of more than 3 months $ 157,426
260

The market interest rates of the time deposits with original maturities of more than three months were 0.2%-2.3%. The time deposits with original maturities of more than 3 months were classified as debt investments with no active market under IAS 39. Refer to Notes 3 and 12 for information related to their reclassification and comparative information for 2017.
10. AVAILABLE-FOR-SALE FINANCIAL ASSETS - 2017
December 31,
2017 Current Domestic investments
Quoted shares $ 219,000 Foreign investments
Quoted shares 10,381 $ 229,381 Non-current Domestic investments
Quoted shares $ 1,419,479 Unlisted shares 11,375
$ 1,430,854
11. FINANCIAL ASSETS MEASURED AT COST - 2017
December 31,
2017 Non-current Private equity $ 78,518 Classified according to financial asset measurement categories
Available-for-sale financial assets $ 78,518 The Group measured the private equity with the costs at the end of the reporting period, because there was a significant range of reasonable estimates for fair values and the probability for each estimate cannot be assessed reasonably. Therefore, the management of the Group determined that the fair value of the private equity was not reliably measured.
261

12. DEBT INVESTMENTS WITH NO ACTIVE MARKET- 2017
December 31,
2017 Time deposits with original maturities of more than three months $ 38,908 The market interest rates of the time deposits with original maturities of more than three months were 1.00%-2.30% per annum as of December 31, 2017. For information on pledged debt investments with no active market, refer to Note 35.
13. NOTES RECEIVABLE AND TRADE RECEIVABLES
December 31 2018 2017 Notes receivable - operating $ 1,461,404 $ 1,255,781 Trade receivables At amortized cost
Gross carrying amount $ 6,958,369 $ 6,686,485 Less: Allowance for impairment loss (87,491) (90,455)
$ 6,870,878 $ 6,596,030 Trade Receivables For the year ended December 31, 2018 At amortized cost The average credit period of the sales of goods was 30-90 days. No interest was charged on trade receivables. In order to minimize credit risk, the management of the Group has delegated a team responsible for determining credit limits, credit approvals and other monitoring procedures to ensure that follow-up action is taken to recover overdue debts. In addition, the Group reviews the recoverable amount of each individual trade debt at the end of the reporting period to ensure that adequate allowance is made for possible irrecoverable amounts. In this regard, the management believes the Group’s credit risk was significantly reduced. The Group applies the simplified approach to providing for expected credit losses prescribed by IFRS 9, which permits the use of a lifetime expected loss provision for all trade receivables. The expected credit losses on trade receivables are estimated using a provision matrix by reference to past default experience of the debtor and an analysis of the debtor’s current financial positions, adjusted for general economic conditions of the industry in which the debtors operate and an assessment of both the current as well as the forecast direction of economic conditions at the reporting date. As the Group’s historical credit loss experience does not show significantly different loss patterns for different customer segments, the provision for loss allowance based on past due status is not further distinguished according to the Group’s different customer base. The Group writes off a trade receivable when there is information indicating that the debtor is in severe financial difficulty and there is no realistic prospect of recovery of the receivable, e.g. when the debtor has been placed under liquidation, or when the trade receivables are over 1 year past due, whichever occurs earlier. For trade receivables that have been proposed a full amount of impairment loss, the Group
262

continues to engage in enforcement activity to attempt to recover the receivables due. Where recoveries are made, these are recognized in profit or loss. The following table details the loss allowance of trade receivables based on the Group’s provision matrix. December 31, 2018
Not Past Due Less than 90
Days 90 to 180
Days 180 to 360
Days Over 360
Days Total Expected credit loss rate 0.41% 0.14% 31.39% 69.02% 100% % Gross carrying amount $ 5,358,360 $ 1,488,386 $ 53,879 $ 34,029 $ 23,715 $ 6,958,369 Loss allowance (Lifetime ECL) (21,319) (2,056) (16,913) (23,488) (23,715) (87,491) Amortized cost $ 5,337,041 $ 1,486,330 $ 36,966 $ 10,541 $ - $ 6,870,878 The movements of the loss allowance of trade receivables were as follows:
For the Year Ended
December 31, 2018
Balance at January 1, 2018 - per IAS 39 $ 90,455 Adjustment on initial application of IFRS 9 - Balance at January 1, 2018 - per IFRS 9 90,455 Add: Net remeasurement of loss allowance 19,432 Less: Amounts written off* (21,605) Foreign exchange gains and losses (791) Balance at December 31, 2018 $ 87,491 * The Group wrote off trade receivables and related loss allowance of $21,605 thousand due to the fact
that the customers’ trade receivables have been aged more than 2 years and the legal attest letters were served without receivables collected.
For the year ended December 31, 2017 The Group applied the same credit policy in 2018 and 2017. The Group recognized an allowance for impairment loss of 100% against all receivables over 1 year because historical experience was that receivables that are past due beyond 1 year were not recoverable. Allowance for impairment loss was recognized against trade receivables between 91 days and 1 year based on estimated irrecoverable amounts determined by reference to past default experience of the counterparties and an analysis of their current financial position. For some trade receivables balances that were past due at the end of the reporting period, the Group did not recognize an allowance for impairment loss, because there was no significant change in credit quality and the amounts were still considered recoverable. The Group did not hold any collateral or other credit enhancements for these balances.
263

The aging of receivables was as follows:
December 31,
2017 Not overdue $ 5,663,891 Overdue
1 to 90 days 924,551 91 to 360 days 64,669 Over 360 days 33,374
$ 6,686,485 The above aging schedule was based on the number of past due days from the end of the credit term. The aging of receivables that were past due date but not impaired was as follows:
December 31,
2017 1 to 30 days $ 763,822 31 to 60 days 117,935 61 to 90 days 42,794 $ 924,551 The above aging schedule was based on the number of past due days from the end of the credit term. The movements of the allowance for doubtful trade receivables were as follows:
Individually Assessed for Impairment
Collectively Assessed for Impairment Total
Balance at January 1, 2017 $ 13,686 $ 87,668 $ 101,354 Add: Impairment losses recognized on
receivables 185 2,845 3,030 Less: Amounts written off during the period as
uncollectible (12,158) (1,575) (13,733) Impairment losses recognized from business
combination - 37 37 Foreign exchange translation gains and losses - (233) (233) Balance at December 31, 2017 $ 1,713 $ 88,742 $ 90,455
264

14. INVENTORIES December 31 2018 2017 Raw materials $ 3,773,265 $ 3,122,276 Work in process 1,533,978 1,235,097 Finished goods 1,531,644 1,335,817 Inventories in transit 718,933 549,061 $ 7,557,820 $ 6,242,251 The costs of inventories recognized as costs of goods sold for the years ended December 31, 2018 and 2017 were $29,631,016 thousand and $26,610,027 thousand, respectively. The costs of inventories decreased by $630,341 thousand and $577,528 thousand as of December 31, 2018 and 2017, respectively, when stated at the lower of cost or net realizable value.
15. SUBSIDIARIES Subsidiaries included in the consolidated financial statements. The entities included in the consolidated statements are listed below.
% of Ownership December 31
Investor Investee Nature of Activities 2018 2017 Remark The Company AAC (BVI) Investment and management service 100.00 100.00 ATC Sale of industrial automation products 100.00 100.00 Advanixs Corporation Production and sale of industrial automation
products 100.00 100.00
Advantech Corporate Investment Investment holding company 100.00 100.00 AEUH Investment and management services 100.00 100.00 ASG Sale of industrial automation products 100.00 100.00 a AAU Sale of industrial automation products 100.00 100.00 a AJP Sale of industrial automation products 100.00 100.00 a AMY Sale of industrial automation products 100.00 100.00 a AKR Sale of industrial automation products 100.00 100.00 a ABR Sale of industrial automation products 80.00 80.00 a AIN Sale of industrial automation products 99.99 99.99 a AdvanPOS Production and sale of POS systems 100.00 100.00 a LNC Production and sale of machines with
computerized numerical controls 64.10 81.17 l
AMX Sale of industrial automation products 100.00 100.00 a Advantech Innovative Design Co.,
Ltd. Product design 100.00 100.00 a
BEMC Sale of industrial network communications systems
- 60.00 m
B+B Sale of industrial network communications systems
60.00 - m
AiST Design, develop and sale of intelligent service 100.00 100.00 a AKST Production and sale of intelligent medical
displays 76.00 36.00 a, b
ATH Production of computers 51.00 - a, c AVN Sale of industrial automation products 60.00 - a, g ARU Production and sales of industrial automation
products 100.00 - a, n
AKR AKST Production and sale of intelligent medical displays
24.00 24.00 a, b
(Continued)
265

% of Ownership December 31
Investor Investee Nature of Activities 2018 2017 Remark Advantech
Corporate Cermate Manufacturing of electronic parts, computer,
and peripheral devices 55.00 55.00
Investment Huan Yan, Jhih-Lian Co., Ltd. Service plan for combination of related technologies of water treatment and applications of Internet of Things
50.00 - a, d
Yun Yan, Wu-Lian Co., Ltd. Industrial equipment Networking in Greater China
50.00 - a, d
ATC ATC (HK) Investment and management services 100.00 100.00 ATC (HK) AKMC Production and sale of components of
industrial automation products 100.00 100.00
Advanixs Kun Shan Corp. Production and sale of industrial automation products
- 100.00 i
AAC (BVI) ANA Sale and fabrication of industrial automation products
100.00 100.00
AAC (HK) Investment and management service 100.00 100.00 SIoT (Cayman) Design, development and sale of IoT
intelligent system service 100.00 - a, h
ANA BEMC Sale of industrial network communications - 40.00 m B+B Sale of industrial network communications 40.00 - m AAC (HK) ACN Sale of industrial automation products 100.00 100.00 AiSC Production and sale of industrial automation
products 100.00 100.00
AXA Development and production of software products
- 100.00 a, e
SIoT (Cayman) SIoT (China) Technology development consulting and services in the field of intelligent technology
99.00 - a, h
A-DLoG Design, R&D and sale of industrial automation vehicles and related products
100.00 - j
ACN Hangzhou Advantofine Automation Co., Ltd.
Processing and sale of industrial automation products
- 100.00 a, f
AXA Development and production of software products
100.00 - a, e
AiSC SIoT (China) Technology development consulting and services in the field of intelligent technology
- 100.00 k
AEUH AEU Sale of industrial automation products 100.00 100.00 APL Sale of industrial automation products 100.00 100.00 a AEU A-DLoG Design, R&D and sale of industrial
automation vehicles and related products - 100.00 j
ASG ATH Production of computers 49.00 51.00 a, c AID Sale of industrial automation products 100.00 100.00 a Cermate Land Mark General investment 100.00 100.00 a Land Mark Cermate (Shanghai) Sale of industrial electronic equipment 100.00 100.00 a Cermate (Shenzhen) Production of LCD touch panel, USB cable,
and industrial computer 90.00 90.00
LNC Better Auto General investment 100.00 100.00 Better Auto Famous Now General investment 100.00 100.00 Famous Now LNC Dong Guan Co., Ltd. Production and sale of industrial automation
products 100.00 100.00
BEMC Avtek General investment - 100.00 o Avtek B+B General investment - 100.00 o B+B BBI Sale of industrial network communications
systems 100.00 100.00
Quatech Sale of industrial network communications systems
- 100.00 o
IMC Sale of industrial network communications systems
100.00 100.00
BBI B&B Electronics Sale of industrial network communications systems
100.00 100.00
B+B (CZ) Manufacturing of cellular and automation solutions
99.99 99.99
Conel Automation Sale of industrial network communications systems
1.00 1.00
B&B DMCC Sale of industrial network communications systems
100.00 100.00
B&B Electronics B+B (CZ) Manufacturing of cellular and automation solutions
0.01 0.01
B+B (CZ) Conel Automation Sale of industrial network communications systems
99.00 99.00
(Concluded)
266

Remark a: Not significant subsidiaries and their financial statements had not been audited. Management of
the Group believes that there would not be material impacts had the financial statements of these subsidiaries been audited.
Remark b: In the first quarter of 2017, the Group acquired 60% of the equity of AKST with an acquisition
of 24% and 36% of AKST’s equity by the Company and AKR, respectively. In the fourth quarter of 2018, the Company acquired 40% of the equity of AKST, which led the Company’s equity investment in AKST increase from 36% to 76%.
Remark c: In the first quarter of 2018, the Group acquired 49% of the equity of ATH, which led the
Group’s equity investment in ATH increase from 51% to 100%. After the Group increased capital and adjusted its investment structure in ATH, the Company and ASG held 51% and 49% of the equity of ATH, respectively.
Remark d: In the first quarter of 2018, Advantech Corporate Investment founded Huan Yan, Jhih-Lian
Co., Ltd. and Yun Yan, Wu-Lian Co., Ltd. and acquired 50% of the equity in each of these subsidiaries.
Remark e: In the first quarter of 2018, the Group adjusted its investment structure and ACN directly held
100% of the equity of AXA. Remark f: In the first quarter of 2018, Hangzhou Advantofine Automation Co., Ltd. was liquidated. Remark g: In the second quarter of 2018, the Group acquired 60% of the equity of AVN. Remark h: In the second quarter of 2018, the Group founded SIoT (Cayman) and SIoT (China). Remark i: In the second quarter of 2018, Advanixs Kun Shan Corp. were merged by AKMC. Advanixs
Kun Shan Corp. ceased to exist and is currently carrying out liquidation procedures. Remark j: In the third quarter of 2018, the Group adjusted its investment structure and SIoT (Cayman)
acquired 100% shares of the equity of A-DloG. Remark k: In the third quarter of 2018, AiSC invested SIoT (China) and held 1% of the equity of SIoT
(China). Remark l: In the first and the third quarters of 2018, the Group sold 1.11% and 15.96% of the equity of
LNC, which led the Group’s equity investment in LNC to decrease from 81.17% to 64.10%. Remark m: In the fourth quarter of 2018, the Group adjusted its investment structure, and BEMC was
liquidated. The Company directly holds B+B at the moment. Remark n: In the fourth quarter of 2018, the Group founded ARU. Remark o: In the fourth quarter of 2018, Avtek and Quatech were in the process of liquidation.
267

16. INVESTMENTS ACCOUNTED FOR USING THE EQUITY METHOD Investments in Associates December 31 2018 2017 Associates that are not individually material Listed companies
Axiomtek Co., Ltd. (“Axiomtek”) $ 619,411 $ 622,604 Winmate Inc. (“Winmate”) 542,761 544,960 AzureWare Technologies, Inc. (“AzureWare”) 534,780 - Nippon RAD Inc. (Nippon RAD) 298,700 - Mildex Optical Inc. (“Mildex”) 183,210 -
Unlisted companies AIMobile Co., Ltd. (“AIMobile”) 65,012 84,140 Deneng Scientific Research Co., Ltd. (“Deneng”) 14,100 15,457 Jan Hsiang Electronics Co., Ltd. (“Jan Hsiang”) 8,010 10,447 CDIB Innovation Accelerator Co., Ltd. (“CDIB”) 147,109 72,127 DotZero Co., Ltd. (“DotZero”) 4,629 - iLink Co., Ltd. (“iLink”) 9,407 - Shanghai Yanle Co., Ltd. (“Yanle”) 4,393 - $ 2,431,522 $ 1,349,735
In the fourth quarters of 2017, the Group paid cash $540,000 thousand for 16.62% of the equity of Winmate. The Group had significant influence over Winmate. In the first quarter of 2018, the Group subscribed for 19.65% of the equity of AzureWave Technologies, Inc. through a private placement with the approval of the board of directors. The Group has significant influence over AzureWave Technologies, Inc. In the second quarter of 2018, the Group paid cash of $299,960 thousand for 19% equity of Nippon RAD. The Group had significant influence over Nippon RAD with the approval of the broad of directors. In the second quarter of 2018, the Group paid cash of $10,067 thousand for 25% equity of iLink Co., Ltd. The Group had significant influence over iLink Co., Ltd. In the third quarter of 2018, the Group paid cash of $4,392 thousand for 45% equity of Shanghai Yanle Co., Ltd. The Group had significant influence over Shanghai Yanle Co., Ltd. In the third quarter of 2018, the Group paid cash of $4,900 thousand for a 49% equity of DotZero Co., Ltd. The Group had significant influence over DotZero Co., Ltd. In the fourth quarter of 2018, the Group paid cash of $202,948 thousand for a 15% equity of Mildex Optical Inc. The Group had significant influence over Mildex Optical Inc. In response to the application of IFRS 9 in 2018, Winmate and Axiomtek applied retroactively on January 1, 2018 and the Group recognized related changes according to ratio of shareholding and thus increased its retained earnings by $7,051 thousand and decreased unrealized gain on financial assets at fair value through other comprehensive income by $11,623 thousand.
268

Aggregate information of associates that are not individually material For the Year Ended December 31 2018 2017 The Group’s share of:
Profit from continuing operations $ 95,635 $ 218,651 Other comprehensive income (loss) (26,016) (8,225) Total comprehensive income (loss) for the year $ 69,619 $ 210,426
Except for financial statements of Axiomtek and Nippon RAD which have been audited or reviewed, investments were accounted for using the equity method and the share of profit or loss and other comprehensive income of those investments were calculated based on financial statements which have not been audited. Management believes there is no material impact on the equity method accounting or the calculation of the share of profit or loss and other comprehensive income from the financial statements of above companies which have not been audited.
17. PROPERTY, PLANT AND EQUIPMENT Freehold Land Buildings Equipment
Office Equipment Other Facilities
Construction in Progress Total
Cost Balance at January 1, 2017 $ 2,948,580 $ 7,080,989 $ 1,631,738 $ 862,409 $ 1,605,230 $ 43,289 $ 14,172,235 Additions - 196,264 48,483 60,256 143,068 85,670 533,741 Disposals (22,017 ) (13,424 ) (120,407 ) (93,374 ) (46,807 ) (1,387 ) (297,416 ) Acquisitions through business
combinations 29,007 44,460 24,903 6,163 4,952 - 109,485 Reclassifications - 6,716 55,809 6,002 39,873 (123,521 ) (15,121 ) Effect of foreign currency exchange
differences (11,590 ) (40,459 ) (5,601 ) (10,833 ) (16,734 ) 206 (85,011 ) Balance at December 31, 2017 $ 2,943,980 $ 7,274,546 $ 1,634,925 $ 830,623 $ 1,729,582 $ 4,257 $ 14,417,913 Accumulated depreciation and impairment Balance at January 1, 2017 $ - $ 1,228,673 $ 1,155,669 $ 644,435 $ 1,053,622 $ - $ 4,082,399 Depreciation expenses - 193,563 115,809 86,120 191,801 - 587,293 Disposals - (5,741 ) (111,114 ) (85,344 ) (45,520 ) - (247,719 ) Acquisitions through business
combinations - 741 15,453 4,671 3,948 - 24,813 Reclassifications - 5,295 5,571 7,724 1,506 - 20,096 Impairment losses - - 7,183 1,031 542 - 8,756 Effect of foreign currency exchange
differences - (7,835 ) (2,077 ) (7,393 ) (7,752 ) - (25,057 ) Balance at December 31, 2017 $ - $ 1,414,696 $ 1,186,494 $ 651,244 $ 1,198,147 $ - $ 4,450,581 Carrying amounts at December 31, 2017 $ 2,943,980 $ 5,859,850 $ 448,431 $ 179,379 $ 531,435 $ 4,257 $ 9,967,332 Cost Balance at January 1, 2018 $ 2,943,980 $ 7,274,546 $ 1,634,925 $ 830,623 $ 1,729,582 $ 4,257 $ 14,417,913 Additions - 18,769 166,934 88,061 158,409 180,634 612,807 Disposals (15,930 ) (54,831 ) (92,652 ) (46,949 ) (59,958 ) (7,287 ) (277,607 ) Acquisitions through business
combinations - - 57 524 1,483 - 2,064 Reclassifications - - 14,212 (19,262 ) (76,318 ) (170,403 ) (251,771 ) Effect of foreign currency exchange
differences 6,077 (42,752 ) (13,540 ) (2,976 ) (9,935 ) (4,716 ) (67,842 ) Balance at December 31, 2018 $ 2,934,127 $ 7,195,732 $ 1,709,936 $ 850,021 $ 1,743,263 $ 2,485 $ 14,435,564 Accumulated depreciation and impairment Balance at January 1, 2018 $ - $ 1,414,696 $ 1,186,494 $ 651,244 $ 1,198,147 $ - $ 4,450,581 Depreciation expenses - 199,740 110,418 75,835 181,713 - 567,706 Disposals - (7,147 ) (65,293 ) (44,304 ) (52,241 ) - (168,985 ) Acquisitions through business
combinations - - 5 151 738 - 894 Reclassifications - - (50,630 ) (26,094 ) (86,966 ) - (163,690 ) Effect of foreign currency exchange
differences - (16,007 ) (8,381 ) (2,086 ) (7,249 ) - (33,723 ) Balance at December 31, 2018 $ - $ 1,591,282 $ 1,172,613 $ 654,746 $ 1,234,142 $ - $ 4,652,783 Carrying amounts at December 31, 2018 $ 2,934,127 $ 5,604,450 $ 537,323 $ 195,275 $ 509,121 $ 2,485 $ 9,782,781
269

As a result of the actual sales growth post the business combination of AKST, a subsidiary of the Company, missed expectations, AKST had continuous losses for the year ended December 31, 2017. In addition, the future operations of AKST are not forecasted to be optimistic. Hence, the future cash flows are estimated to decrease. The Company carried out a review of the recoverable amount of that related assets and determined that the carrying amount exceeded the recoverable amount. The review led to the recognition of an impairment loss of $8,756 thousand, which was recognized in other gains and losses for the year ended December 31, 2017. The above items of property, plant and equipment are depreciated on a straight-line basis over the estimated useful lives as follows: Buildings
Main buildings 20-60 years Electronic equipment 5 years Engineering systems 5 years
Equipment 2-8 years Office equipment 2-8 years Other facilities 2-10 years Property, plant and equipment pledged as collateral for borrowings are set out in Note 35.
18. GOODWILL
For the Year Ended December 31 2018 2017 Cost Balance at January 1 $ 2,828,958 $ 2,845,831 Additional amounts recognized from business combinations
occurring during the year (Note 29) 65,207 79,713 Adjustments for goodwill after acquisition (Note 29) - 18,075 Effect of foreign currency exchange differences 43,624 (114,661) Balance at December 31 $ 2,937,789 $ 2,828,958 Accumulated impairment losses Balance at January 1 $ (101,409) $ - Impairment losses recognized during the year - (97,788) Effect of foreign currency exchange differences 3,621 (3,621) Balance at December 31 $ (97,788) $ (101,409) Carry amount at December 31 $ 2,840,001 $ 2,727,549 The Group acquired AKST in January 2017. In the second quarter of 2017, after obtaining the audited financial statements of AKST for the year ended December 31, 2016, the Group paid the remaining installment of US$600 thousand and adjusted the goodwill on the acquisition based on those audited financial statements. The actual sales growth post the business combination of AKST, a subsidiary of the Company, did not turn out as expected; AKST had continuous losses for the year ended December 31, 2017. An impairment loss for goodwill amounted to $97,788 thousand and was recognized for the year ended December 31, 2017.
270

19. OTHER INTANGIBLE ASSETS
Trademarks Client
Relationships Technology
Licenses Others Total Cost Balance at January 1, 2017 $ 525,656 $ 522,604 $ 435,473 $ 617,967 $ 2,101,700 Additions - - - 77,986 77,986 Disposals - - - (211,991) (211,991) Acquisitions through business combinations - - - 9,921 9,921 Effect of foreign currency exchange
differences (31,152) (26,027) (20,595) (37,243) (115,017)
Balance at December 31, 2017 $ 494,504 $ 496,577 $ 414,878 $ 456,640 $ 1,862,599 Accumulated amortization and impairment Balance at January 1, 2017 $ - $ 124,345 $ 186,118 $ 473,797 $ 784,260 Amortization expenses - 29,259 58,825 139,978 228,062 Disposals - - - (211,707) (211,707) Impairment losses recognized - - - 5,576 5,576 Effect of foreign currency exchange
differences - 2,936 (2,642) (68,293) (67,999)
Balance at December 31, 2017 $ - $ 156,540 $ 242,301 $ 339,351 $ 738,192
Carrying amounts at December 31, 2017 $ 494,504 $ 340,037 $ 172,577 $ 117,289 $ 1,124,407 Cost Balance at January 1, 2018 $ 494,504 $ 496,577 $ 414,878 $ 456,640 $ 1,862,599 Additions - - - 111,209 111,209 Disposals - - - (20,427) (20,427) Acquisitions through business combinations - - - 70 70 Effect of foreign currency exchange
differences 12,543 10,886 8,721 5,566 37,716 Balance at December 31, 2018 $ 507,047 $ 507,463 $ 423,599 $ 553,058 $ 1,991,167 Accumulated amortization and impairment Balance at January 1, 2018 $ - $ 156,540 $ 242,301 $ 339,351 $ 738,192 Amortization expenses - 29,147 43,708 92,551 165,406 Disposals - - - (20,427) (20,427) Effect of foreign currency exchange
differences - 1,649 4,003 6,445 12,097 Balance at December 31, 2018 $ - $ 187,336 $ 290,012 $ 417,920 $ 895,268 Carrying amounts at December 31, 2018 $ 507,047 $ 320,127 $ 133,587 $ 135,138 $ 1,095,899 Other intangible assets were amortized on a straight-line basis over their estimated useful lives as follows: Customers relationships 4-15 years Technology licenses 5-8 years Others 1-5 years The actual sales growth post the business combination of AKST, a subsidiary of the Company, did not turn out as expected; AKST had continuous losses for the year ended December 31, 2017. An impairment loss for intangible assets amounted to $5,576 thousand and was recognized for the year ended December 31, 2017.
271

20. PREPAYMENTS FOR LEASES December 31 2018 2017 Current assets (included in other current assets) $ 8,673 $ 8,854 Non-current assets 297,665 312,708 $ 306,338 $ 321,562 Lease prepayments are for the Group’s land-use right in mainland China.
21. BORROWINGS
a. Short-term borrowings December 31 2018 2017 Secured borrowings
Bank loans $ - $ 8,400 Unsecured borrowings
Line of credit borrowings 87,581 - $ 87,581 $ 8,400 The weighted average effective interest rates on bank loans was 1.38%-3.15% and 2.87% per annum as of December 31, 2018 and 2017, respectively.
b. Long-term borrowings December 31 2018 2017 Secured borrowings Bank loans $ - $ 50,258 Other loans 55,410 63,459 55,410 113,717 Less: Current portions (9,626) - Long-term borrowings $ 45,784 $ 113,717 The long-term borrowings are borrowings of the subsidiary AKST. The effective interest rate of line of secured borrowings was 1.60%-2.75% per annum as of December 31, 2017. Other borrowings are loans from the government. As of December 31, 2017, the effective interest rate was 2.91%-3.16% per annum. With demand of borrowings, the Group pledged time deposits, freehold land and buildings refer to Note 35.
272

22. OTHER LIABILITIES December 31 2018 2017 Other payables
Payables for salaries or bonuses $ 2,143,770 $ 2,324,441 Payables for employee benefits 207,175 180,617 Payables for royalties 107,409 118,347 Others (Note) 1,203,845 1,001,305 $ 3,662,199 $ 3,624,710
Note: Including marketing expenses and freight expenses.
23. RETIREMENT BENEFIT PLANS
a. Defined contribution plans
The Company and its domestic subsidiaries of the Group adopted a pension plan under the Labor Pension Act (the “LPA”), which is a state-managed defined contribution plan. Under the LPA, an entity makes monthly contributions to employees’ individual pension accounts at 6% of monthly salaries and wages. For certain subsidiaries with a few or no employees, they have not established a set of policies for employee retirement and therefore not recognized related retirement expenses. Except for those aforementioned subsidiaries, the rest of overseas subsidiaries recognized retirement expenses when making contribution to the retirement plan in accordance with local laws.
b. Defined benefit plans The defined benefit plan adopted by the Company and Cermate of the Group in accordance with the Labor Standards Law, is operated by the government of the ROC. Pension benefits are calculated on the basis of the length of service and average monthly salaries of the six months before retirement. The Company and Cermate Technologies Inc. each contribute amounts equal to 2% of total monthly salaries and wages to a pension fund administered by pension fund monitoring committees. Pension contributions are deposited in the Bank of Taiwan in the committees’ name. Before the end of each year, the Group assesses the balance in the pension fund. If the amount of the balance in the pension fund is inadequate to pay retirement benefits for employees who conform to retirement requirements in the next year, the Group is required to fund the difference in one appropriation that should be made before the end of March of the next year. The pension fund is managed by the Bureau of Labor Funds, Ministry of Labor (“the Bureau”); the Group has no right to influence the investment policy and strategy.
273

The amounts included in the consolidated balance sheets in respect of the Group’s defined benefit plans were as follows: December 31 2018 2017 Present value of defined benefit obligation $ 394,616 $ 373,581 Fair value of plan assets (139,071) (136,356) Deficit 255,545 237,225 Net defined benefit liabilities $ 255,545 $ 237,225 Movements in net defined benefit liabilities were as follows:
Present Value of the Defined
Benefit Obligation
Fair Value of the Plan Assets
Net Defined Benefit
Liabilities (Assets)
Balance at January 1, 2017 $ 347,702 $ (135,342) $ 212,360 Service cost
Current service cost 2,137 - 2,137 Past service cost 4,589 - 4,589 Net interest expense (income) 4,787 (1,920) 2,867
Recognized in profit or loss 11,513 (1,920) 9,593 Remeasurement
Return on plan assets (excluding amounts included in net interest) - 542 542
Actuarial loss Changes in demographic assumptions 20,380 - 20,380 Experience adjustments 2,983 - 2,983
Recognized in other comprehensive income 23,363 542 23,905 Contributions from the employer - (8,633) (8,633) Benefits paid (8,997) 8,997 - Balance at December 31, 2017 373,581 (136,356) 237,225 Service cost
Current service cost 2,400 - 2,400 Net interest expense (income) 5,143 (1,893) 3,250
Recognized in profit or loss 7,543 (1,893) 5,650 Remeasurement
Return on plan assets (excluding amounts included in net interest) - (3,673) (3,673)
Actuarial gain or loss Changes in demographic assumptions 6,812 - 6,812 Changes in financial assumptions 11,527 - 11,527 Experience adjustments 6,192 - 6,192
Recognized in other comprehensive income 24,531 (3,673) 20,858 Contributions from the employer - (8,188) (8,188) Benefits paid (11,039) 11,039 - Balance at December 31, 2018 $ 394,616 $ (139,071) $ 255,545
274

An analysis by function of the amounts recognized in profit or loss in respect of the defined benefit plans is as follows: For the Year Ended December 31 2018 2017 Operating costs $ 1,372 $ 1,192 Selling and marketing expenses 905 1,464 General and administrative expenses 1,436 1,452 Research and development expenses 1,937 5,485 $ 5,650 $ 9,593 Through the defined benefit plans under the Labor Standards Law, the Group is exposed to the following risks: 1) Investment risk: The plan assets are invested in domestic and foreign equity and debt securities,
bank deposits, etc. The investment is conducted at the discretion of the Bureau or under the mandated management. However, in accordance with relevant regulations, the return generated by plan assets should not be below the interest rate for a 2-year time deposit with local banks.
2) Interest risk: A decrease in the bond interest rate will increase the present value of the defined
benefit obligation; however, this will be partially offset by an increase in the return on the plan’s debt investments.
3) Salary risk: The present value of the defined benefit obligation is calculated by reference to the
future salaries of plan participants. As such, an increase in the salary of the plan participants will increase the present value of the defined benefit obligation.
The actuarial valuations of the present value of the defined benefit obligation were carried out by qualified actuaries. The significant assumptions used for the purposes of the actuarial valuations were as follows: December 31 2018 2017 Discount rate(s) 1.125%-1.375% 1.375%-1.500% Expected rate(s) of salary increase 3.000%-3.250% 3.000%-3.250% If possible reasonable change in each of the significant actuarial assumptions will occur and all other assumptions will remain constant, the present value of the defined benefit obligation would increase (decrease) as follows: December 31 2018 2017 Discount rate(s)
0.25% increase $ (11,723) $ (11,389) 0.25% decrease $ 12,218 $ 11,878
Expected rate(s) of salary increase 0.25% increase $ 11,770 $ 11,472 0.25% decrease $ (11,358) $ (11,062)
The sensitivity analysis presented above may not be representative of the actual change in the present value of the defined benefit obligation as it is unlikely that the change in assumptions would occur in isolation of one another as some of the assumptions may be correlated.
275
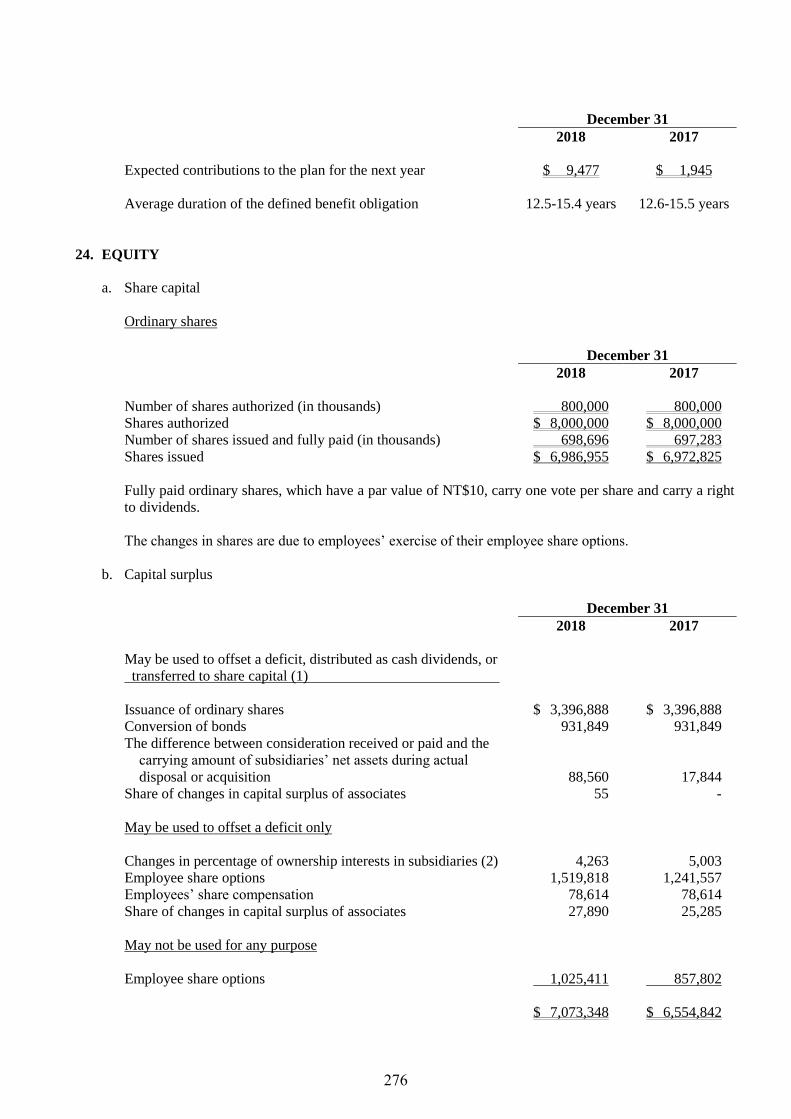
December 31 2018 2017 Expected contributions to the plan for the next year $ 9,477 $ 1,945 Average duration of the defined benefit obligation 12.5-15.4 years 12.6-15.5 years
24. EQUITY
a. Share capital
Ordinary shares December 31 2018 2017 Number of shares authorized (in thousands) 800,000 800,000 Shares authorized $ 8,000,000 $ 8,000,000 Number of shares issued and fully paid (in thousands) 698,696 697,283 Shares issued $ 6,986,955 $ 6,972,825 Fully paid ordinary shares, which have a par value of NT$10, carry one vote per share and carry a right to dividends. The changes in shares are due to employees’ exercise of their employee share options.
b. Capital surplus
December 31 2018 2017 May be used to offset a deficit, distributed as cash dividends, or transferred to share capital (1) Issuance of ordinary shares $ 3,396,888 $ 3,396,888 Conversion of bonds 931,849 931,849 The difference between consideration received or paid and the
carrying amount of subsidiaries’ net assets during actual disposal or acquisition 88,560 17,844
Share of changes in capital surplus of associates 55 - May be used to offset a deficit only Changes in percentage of ownership interests in subsidiaries (2) 4,263 5,003 Employee share options 1,519,818 1,241,557 Employees’ share compensation 78,614 78,614 Share of changes in capital surplus of associates 27,890 25,285 May not be used for any purpose Employee share options 1,025,411 857,802 $ 7,073,348 $ 6,554,842
276

1) Such capital surplus may be used to offset a deficit; in addition, when the Company has no deficit, such capital surplus may be distributed as cash dividends or transferred to share capital (limited to a certain percentage of the Company’s capital surplus and to once a year).
2) Such capital surplus arises from the effect of changes in ownership interest in a subsidiary resulting
from equity transactions other than actual disposal or acquisition, or from changes in capital surplus of subsidiaries accounted for by using equity method.
c. Retained earnings and dividends policy
Under the dividends policy as set forth in the amended Articles, where the Company made profit in a fiscal year, the profit shall be first utilized for paying taxes, offsetting losses of previous years, setting aside as legal reserve 10% of the remaining profit, setting aside or reversing special reserve in accordance with the laws and regulations, and then any remaining profit together with any undistributed retained earnings shall be used by the Company’s board of directors as the basis for proposing a distribution plan, which should be resolved in the shareholders’ meeting for the distribution of dividends and bonuses to shareholders. For the policies on the distribution of employees’ compensation and remuneration of directors after amendment, refer to employees’ compensation and remuneration of directors in Note 25, d. The Company operates in an industry related to computers, and its business related to network servers is new but with significant potential for growth. Thus, in formulating its dividends policy, the Company takes into account the overall business and industry conditions and trends, its objective of enhancing the shareholders’ long-term interests, and the sustainability of the Company’s growth. The policy also requires that share dividends be less than 75% of total dividends to retain internally generated cash within the Company in order to finance future capital expenditures and working capital requirements. An appropriation of earnings to a legal reserve should be made until the legal reserve equals the Company’s paid-in capital. The legal reserve may be used to offset deficits. If the Company has no deficit and the legal reserve has exceeded 25% of the Company’s paid-in capital, the excess may be transferred to capital or distributed in cash. Items referred to under Rule No. 1010012865 and Rule No. 1010047490 issued by the FSC and in the directive titled “Questions and Answers for Special Reserves Appropriated Following Adoption of IFRSs” should be appropriated to or reversed from a special reserve by the Company. The appropriation of earnings for 2017 and 2016 have been approved in the shareholders’ meetings on May 24, 2018 and May 26, 2017, respectively, were as follows:
Appropriation of Earnings Dividends Per Share
(NT$)
For the Year Ended
December 31 For the Year Ended
December 31 2017 2016 2017 2016 Legal reserve $ 615,651 $ 566,686 $ - $ - Special reserve 284,451 85,204 - - Cash dividends 4,600,414 3,988,367 6.6 6.3 Share dividends - 633,074 - 1.0
277

The appropriations of earnings for 2018, which have been proposed by the Company’s board of directors on March 8, 2019. The appropriations and dividends per share were as follows:
Appropriation
of Earnings Dividends Per Share (NT$)
Legal reserve $ 629,466 $ - Special reserve 429,108 - Cash dividends 4,751,129 6.8 The appropriations of earnings for 2018 are subject to the resolution of the shareholders in their meeting to be held on May 28, 2019.
d. Special reserves
For the Year Ended December 31 2018 2017 Beginning at January 1 $ 85,204 $ - Appropriations in respect of Debits to other equity items 284,451 85,204 Balance at December 31 $ 369,655 $ 85,204
e. Other equity items
1) Exchange differences on translating the financial statements of foreign operations
For the Year Ended December 31 2018 2017 Balance at January 1 $ (463,479) $ (197,633) Effect of change in tax rate 16,752 - Recognized during the period
Exchange differences arising on translating the financial statements of foreign entities (19,659) (260,103) Share of those of associates accounted for using the equity method (8,859) (5,743)
Other comprehensive income recognized for the period (11,766) (265,846) Balance at December 31 $ (475,245) $ (463,479)
2) Unrealized gain (loss) from available-for-sale financial assets
Balance at January 1, 2017 $ 112,429 Recognized during the period
Unrealized gain arising on revaluation of available-for-sale financial assets 163,398 Share from subsidiaries accounted for using the equity method (16,927)
Reclassification adjustment Disposal of available-for-sale financial assets (165,076)
Other comprehensive income recognized for the period (18,605) Balance at December 31, 2017 93,824 Adjustment on initial application of IFRS 9 (93,824) Balance at January 1, per IFRS 9 $ -
278

3) Unrealized gain or loss on Financial Assets at FVTOCI
For the Year Ended
December 31, 2018
Balance at January 1 per IAS 39 $ - Adjustment on initial application of IFRS 9 123,254 Balance at January 1 per IFRS 9 123,254 Recognized during the period
Unrealized loss - equity instruments (445,333) Share of those of associates accounted for using the equity method (13,912)
Other comprehensive income recognized for the period (459,245) Cumulative unrealized gain (loss) of equity instruments transferred to retained
earnings due to disposal 11,737 Balance at December 31 $ (324,254)
4) Unearned employee benefits compensation
For the Year Ended
December 31, 2018
Balance at January 1 $ - Share from associates accounted for using the equity method 736 Balance at December 31 $ 736
f. Non-controlling interests
For the Year Ended December 31 2018 2017 Balance at January 1 $ 179,366 $ 173,315 Share of profit (loss) for the year 22,091 (7,227) Other comprehensive income during the year
Exchange difference on translation of foreign financial statements (5,880) (1,852)
Remeasurement on defined benefit plans 115 (73) Non-controlling interests arising from decreasing investment
in subsidiaries (Note 30) 56,829 - Non-controlling interests arising from increasing investment in
subsidiaries (Note 30) (22,701) - Non-controlling interests arising from acquisition of subsidiary,
AKST (Note 29) - 15,203 Non-controlling interests arising from acquisition of subsidiary,
AVN (Note 29) 7,257 - Employees’ holding outstanding vest share option related
non-controlling interests issued by subsidiaries 806 - Balance at December 31 $ 237,883 $ 179,366
279

25. NET PROFIT FROM CONTINUING OPERATIONS
a. Finance costs
For the Year Ended December 31 2018 2017 Interest on bank loans $ 2,237 $ 7,193 Others 2,448 4,924 $ 4,685 $ 12,117
b. Depreciation and amortization For the Year Ended December 31 2018 2017 An analysis of depreciation by function
Operating costs $ 151,782 $ 148,165 Operating expenses 415,924 439,128
$ 567,706 $ 587,293 An analysis of amortization by function
Operating costs $ 831 $ 5,011 Selling and marketing expenses 292 196 General and administrative expenses 131,465 191,842 Research and development expenses 32,818 31,013
$ 165,406 $ 228,062
c. Employee benefits expense
For the Year Ended December 31 2018 2017 Short-term benefits $ 8,319,973 $ 7,913,000 Post-employment benefits
Defined contribution plans 316,488 284,432 Defined benefit plans (Note 23) 5,650 9,593
322,138 294,025 Share-based payments
Equity-settled 341,624 424,637 Other employee benefits 736,112 604,702 Total employee benefits expense $ 9,719,847 $ 9,236,364 An analysis of employee benefits expense by function
Operating costs $ 2,076,967 $ 2,052,280 Operating expenses 7,642,880 7,184,084
$ 9,719,847 $ 9,236,364
280

d. Employees’ compensation and remuneration of directors
According to the Articles of Incorporation of the Company, the Company accrued employees’ compensation at the rates of no less than 5% and remuneration of directors at the rates of no higher than 1%, of net profit before income tax, employees’ compensation, and remuneration of directors. The employees’ compensation and remuneration of directors for the years ended December 31, 2018 and 2017, which have been approved by the Company’s board of directors on March 8, 2019 and March 2, 2018, respectively, were as follows:
For the Year Ended December 31 2018 2017 Employees’ compensation $ 275,000 $ 273,000 Remuneration of directors 10,600 10,600 If there is a change in the amounts after the annual consolidated financial statements are authorized for issue, the differences are recorded as a change in the accounting estimate. There is no difference between the actual amounts of employees’ compensation and remuneration of directors paid and the amounts recognized in the consolidated financial statements for the years ended December 31, 2017 and 2016. Information on the employees’ compensation and remuneration of directors resolved by the Company’s board of directors in 2019 and 2018 is available at the Market Observation Post System website of the Taiwan Stock Exchange.
e. Gain or loss on foreign currency exchange For the Year Ended December 31 2018 2017 Foreign exchange gains $ 1,088,910 $ 871,608 Foreign exchange losses (1,071,954) (947,706) Net losses $ 16,956 $ (76,098)
26. INCOME TAXES
a. Major components of tax expense recognized in profit or loss
For the Year Ended December 31 2018 2017 Current tax
In respect of the current year $ 1,540,532 $ 1,284,064 Income tax on unappropriated earnings 64,158 37,047 Adjustments for prior year (254,230) (3,954)
1,350,460 1,317,157 Deferred tax
In respect of the current year 143,835 15,786 Adjustments to deferred tax attributable to changes in tax rates
and laws 183,446 51,311 327,281 67,097 Income tax expense recognized in profit or loss $ 1,677,741 $ 1,384,254
281

A reconciliation of accounting profit and income tax expense is as follows: For the Year Ended December 31 2018 2017 Profit before tax from continuing operations $ 7,994,489 $ 7,533,543 Income tax expense calculated at the statutory rate 1,923,694 1,691,459 Nondeductible expenses in determining taxable income 713 544 Tax-exempt income (83,676) (264,323) Income tax on unappropriated earnings 64,158 37,047 Land value increment tax 4,562 7,733 Investment credits in the current year (158,726) (86,891) Loss carryforwards in the current year (260) (7,859) Unrecognized deductible temporary differences (1,137) 11,174 Adjustments for prior years’ tax (254,230) (3,954) Effect of tax rate changes 183,446 - Others (803) (676) Income tax expense recognized in profit or loss $ 1,677,741 $ 1,384,254
In 2017, the applicable corporate income tax rate used by the group entities in the ROC is 17%. However, the Income Tax Act in the ROC was amended in 2018, and the corporate income tax rate was adjusted from 17% to 20%, effective in 2018. In addition, the rate of the corporate surtax applicable to the 2018 unappropriated earnings will be reduced from 10% to 5% while the applicable tax rate used by subsidiaries in China is 25%, except for subsidiaries qualified for 15% preferential tax rate for Hi-Tech Industries. Tax rates used by other group entities operating in other jurisdictions are based on the tax laws in those jurisdictions. As the status of the 2019 appropriations of earnings is uncertain, the potential income tax consequences of 5% income tax rate of the 2018 unappropriated earnings are not reliably determinable.
b. Income tax recognized in other comprehensive income For the Year Ended December 31 2018 2017 Deferred tax Effect of change in tax rate $ (18,897) $ - In respect of the current year
Translation of foreign operations (4,171) (54,450) Remeasurement on defined benefit plans (7,131) (4,064) $ (30,199) $ (58,514)
c. Current tax liabilities
December 31 2018 2017 Current tax liabilities
Income tax payable $ 1,611,886 $ 1,269,165
282

d. Deferred tax assets and liabilities The movements of deferred tax assets and deferred tax liabilities were as follows: For the year ended December 31, 2018
Opening Balance
Recognized in Profit or Loss
Recognized in Other
Compre- hensive Income
Closing Balance
Deferred tax assets Temporary differences
Unrealized gross profit $ 75,876 $ 60,150 $ - $ 136,026 Unrealized loss on inventory write-downs 49,176 24,939 - 74,115 Exchange differences on translation of foreign
financial statements 95,080 - 23,883 118,963 Loss carryforwards 45,472 53 - 45,525 Defined benefit obligation 15,423 2,294 - 17,717 Unrealized exchange losses (gains) 3,007 (2,447) - 560 Unrealized warranty liabilities 24,072 1,221 - 25,293 Remeasurement of defined benefit plans 15,544 - 6,915 22,459 Allowance for impaired receivables 4,504 (690) - 3,814 Sales allowance - 3,090 3,090 Others 70,287 (16,589) - 53,698
$ 398,441 $ 72,021 $ 30,798 $ 501,260 Deferred tax liabilities Temporary differences
Undistributed earnings of subsidiaries $ 1,170,423 $ 418,232 $ - $ 1,588,655 Remeasurement of defined benefit plans 3,391 - 599 3,990 Financial assets -FVTPL - 87 87 Exchange differences arising on translating of the
financial statements of foreign entities 12,853 (9,177) - 3,676 Unrealized exchange gains 384 2,196 - 2,580 Property, plant and equipment 5,849 (696) - 5,153 Intangible assets and goodwill 205,258 (11,436) - 193,822 Others 855 96 - 951
$ 1,399,013 $ 399,302 $ 599 $ 1,798,914 For the year ended December 31, 2017
Opening Balance
Recognized in Profit or Loss
Recognized in Other
Compre- hensive Income
Business Combination
Closing Balance
Deferred tax assets Temporary differences
Unrealized gross profit $ 44,996 $ 30,880 $ - $ - $ 75,876 Unrealized loss on inventory
write-downs 74,052 (24,876) - - 49,176 Exchange differences arising on
translating of the financial statements of foreign entities 45,115 (4,485) 54,450 - 95,080
Loss carryforwards 88,481 (43,009) - - 45,472 Defined benefit obligation 16,524 (1,101) - - 15,423
(Continued)
283

Opening Balance
Recognized in Profit or Loss
Recognized in Other
Compre- hensive Income
Business Combination
Closing Balance
Unrealized exchange losses (gains) $ 1,615 $ 1,392 $ - $ - $ 3,007 Unrealized warranty liabilities 20,618 3,454 - - 24,072 Remeasurement of defined benefit
plans 11,544 (64) 4,064 - 15,544 Allowance for impaired receivables 436 4,068 - - 4,504 Others 65,775 305 - 4,207 70,287
$ 369,156 $ (33,436) $ 58,514 $ 4,207 $ 398,441 Deferred tax liabilities Temporary differences
Undistributed earnings of subsidiaries $ 990,571 $ 179,852 $ - $ - $ 1,170,423 Remeasurement of defined benefit
plans 3,646 (255) - - 3,391 Exchange differences arising on
translating of the financial statements of foreign entities - 12,853 - - 12,853
Unrealized exchange losses (gains) 2,827 (2,443) - - 384 Property, plant and equipment 9,783 (3,934) - - 5,849 Intangible assets and goodwill 355,416 (150,158) - - 205,258 Others 444 (2,254) - 2,665 855
$ 1,362,687 $ 33,661 $ - $ 2,665 $ 1,399,013
(Concluded)
e. Unused loss carryforwards for which no deferred tax assets have been recognized in the consolidated balance sheets
December 31 2018 2017 Loss carryforwards
Expire in 2024 $ - $ 3,056 Expire in 2026 20,415 24,165 $ 20,415 $ 27,221
f. Information about unused investment credits
As of December 31, 2018, investment tax credits comprised:
Laws and Statutes Tax Credit Source
Remaining Creditable
Amount Expiry Year
Statute for Upgrading Industries Research and development
expenditures $ 1,459 2020
g. Income tax assessments
The Company’s tax returns through 2014 have been assessed by the tax authorities.
284

27. EARNINGS PER SHARE Unit: NT$ Per Share
For the Year Ended December 31 2018 2017 Basic earnings per share $ 9.02 $ 8.84 Diluted earnings per share $ 8.93 $ 8.77 The earnings and weighted average number of ordinary shares outstanding in the computation of earnings per share were as follows: Net Profit for the Year For the Year Ended December 31 2018 2017 Earnings used in the computation of basic earnings per share $ 6,294,657 $ 6,156,516 Earnings used in the computation of diluted earnings per share $ 6,294,657 $ 6,156,516 Weighted Average Number of Ordinary Shares Outstanding (In Thousand Shares) For the Year Ended December 31 2018 2017 Weighted average number of ordinary shares in computation of basic
earnings per share 697,744 696,802 Effect of potentially dilutive ordinary shares:
Employee share options 5,797 3,949 Employees’ compensation 1,501 1,479
Weighted average number of ordinary shares used in the
computation of diluted earnings per share 705,042 702,230 If the Group offered to settle compensation paid to employees in cash or shares, the Group assumed the entire amount of the compensation will be settled in shares and the resulting potential shares were included in the weighted average number of shares outstanding used in the computation of diluted earnings per share, as the effect is dilutive. Such dilutive effect of the potential shares is included in the computation of diluted earnings per share until the number of shares to be distributed to employees is resolved in the following year.
28. SHARE-BASED PAYMENT ARRANGEMENTS Qualified employees of the Company and its subsidiaries were granted 8,000 options in 2018, 6,500 options in 2016 and 5,000 options in 2014. Each option entitles the holder to subscribe for one thousand ordinary shares of the Company. The holders of these shares include employees whom meet certain criteria set by the Company, from both domestic and overseas subsidiaries in which the Company directly or indirectly invests over 50%. Options issued in 2018, 2016 and 2014 are all valid for six years. All are exercisable at certain percentages after the second anniversary year from the grant date. The exercise prices granted in 2018 was the share price on the exercise date; the exercise prices of those granted in 2016 and 2014 were both NT$100 per share. For any subsequent changes in the Company’s capital surplus, the exercise price and the number of options will be adjusted accordingly.
285

Information on employee share options was as follows: For the Year Ended December 31 2018 2017
Number of Options (In Thousands)
Weighted- average Exercise
Price (NT$)
Number of Options (In Thousands)
Weighted- average Exercise
Price (NT$) Balance at January 1 9,378 $ 95.15 10,269 $ 98.20 Options granted 8,000 202.50 - - Options exercised (1,413) 83.78 (891) 86.89 Balance at December 31 15,965 143.64 9,378 95.15 Options exercisable, end of year 7,965 84.53 2,878 84.20 Weighted-average fair value of
options granted (NT$) $ 49.15 $ - The weighted-average share price at the date of exercise of share options for the years ended December 31, 2018 and 2017 were from NT$196 to NT$226 and from NT$204 to NT$266, respectively. Information about outstanding options as of December 31, 2018 and 2017 was as follows: For the Year Ended December 31 2018 2017
Exercise Price
(NT$)
Weighted- average
Remaining Contractual Life (Years)
Exercise Price (NT$)
Weighted- average
Remaining Contractual Life (Years)
Issuance in 2018 $ 202.5 5.58 $ - - Issuance in 2016 85.6 3.45 88.5 4.45 Issuance in 2014 81.5 1.63 84.2 2.63 Options granted were priced using the Black-Scholes pricing model and the inputs to the model were as follows: 2018 2017 2015 Grant-date share price (NT$) $202.5 $235 $239.5 Exercise price (NT$) $202.5 $100 $100 Expected volatility 28.42%-28.73% 31.42%-32.48% 28.18%-29.19% Expected life (in years) 4-4.5 4-5.5 4-5.5 Expected dividends yield 0% 0% 0% Risk-free interest rate 0.67%-0.69% 0.52%-0.65% 1.07%-1.30% Expected volatility was based on the historical share price volatility over the past 5 years. Compensation costs recognized were $341,624 thousand and $424,637 thousand for the years ended December 31, 2018 and 2017, respectively.
286

Qualified employees of the subsidiary, LNC, were granted 108 options in May 2018 and 1,092 options in June 2017. Each option entitles the holder to subscribe for one thousand ordinary shares of the Company. The holders of these shares include employees whom meet certain criteria set by the subsidiary, LNC. The options granted are valid for 5 years and exercisable at certain percentages after the one anniversary from the grant date. Information on employee share options was as follows: 2018 2017
Employee Share Options
Number of Options (In Thousands)
Weighted- average Exercise
Price (NT$)
Number of Options (In Thousands)
Weighted- average Exercise
Price (NT$) Balance at January 1 980 $ 20 - $ - Options granted 108 20 1,092 20 Options exercised (274) - (112) - Balance at December 31 814 20 980 20 Options exercisable, end of the year - - Weighted-average fair value of
options granted (NT$) $ 2.17 $ 2.07 Information about outstanding options as of December 31, 2018 was as follows: December 31 2018 2017
Employee Share Options Exercise Price
(NT$)
Weighted- average
Remaining Contractual Life (Years)
Exercise Price (NT$)
Weighted- average
Remaining Contractual Life (Years)
Issuance in 2018 $ 20 3.53 $ - - Issuance in 2017 20 2.42 20 3.42 Options granted were priced using the Black-Scholes pricing model, and the inputs to the model were as follows: 2018 2017 Grant-date share valuation (NT$) $17.29 $16.11 Exercise price (NT$) $20 $20 Expected volatility 21.36%-25.43% 25.6%-29.45% Expected life (in years) 2.5-4 2.5-4 Expected dividend yield 1.04 - Risk-free interest rate 0.60%-0.67% 0.64%-0.74% In August 2018, the Company modified all of its outstanding options. The valid life was adjusted from 4 to 5 years. The incremental fair values of NT$0.38 in June 2017 and NT$0.34 in May 2018 will be recognized as expenses in the rest of each of their vesting period within 2.42 and 3.33 years. LNC used the inputs noted above to measure the fair value of the old and new options.
287

Issuance in 2018
Before
Adjustment After
Adjustment Grant-date share valuation (NT$) $17.86 $17.86 Exercise price (NT$) $20 $20 Expected volatility 20.04%-23.67% 21.57%-24.70% Expected life (in years) 2.17-3.67 2.67-4.17 Expected dividend yield 1.01 1.01 Risk-free interest rate 0.57%-0.65% 0.61%-0.67% Issuance in 2017
Before
Adjustment After
Adjustment Grant-date share valuation (NT$) $17.86 $17.86 Exercise price (NT$) $20 $20 Expected volatility 19.35%-21.61% 19.89%-23.34% Expected life (in years) 1.38-2.76 1.88-3.26 Expected dividend yield - - Risk-free interest rate 0.49%-0.61% 0.54%-0.64%
29. BUSINESS COMBINATIONS
a. Subsidiaries acquired
Principal Activity Date of
Acquisition
Proportion of Voting Equity
Interests Acquired (%)
Consideration Transferred
Kostec Co., Ltd.
(“AKST”) Production and sale of
intelligent medical display
January 20, 2017 60 $ 120,592
Advantech Vietnam Technology Company Limited (AVN)
Sales of industrial computer
June 6, 2018 60 $ 76,092
The Group’s market strategy is to develop R&D technology of global medical displays. The Group acquired 60% of the share equity of Kostec Co., Ltd. (“AKST”) to expand its global intelligent medical market. The Group acquired 60% of the shares of Advantech Vietnam Technology Company Limited (AVN) in order to expand its industrial automation products sales in theVietnam market.
b. Consideration transferred
AVN AKST Cash $ 76,092 $ 120,592 Contingent consideration arrangement (2), (3) - 30,420 $ 76,092 $ 151,012
288

1) The Group acquired 60% in AVN in the second quarter of the year ended 2018. 2) The Group acquired 60% equity in AKST with a partial payment of $102,517 thousand in the first
quarter of the year ended December 31, 2017. Subsequently, after obtaining the audited financial statements of AKST for the year ended December 31, 2016, the Group made an additional payment of $18,075 thousand (US$600 thousand) for the full amount of the investment. In addition, the Group adjusted the goodwill based on the identifiable net assets and liabilities in AKST’s audited financial statements.
3) Under a contingent consideration arrangement, the Group is required to pay the seller an additional
US$500 thousand in 2017 and 2018, respectively, if AKST’s revenue exceeds the agreed amount.
c. Assets acquired and liabilities assumed at the dates of acquisitions
AVN AKST Current assets
Cash and cash equivalents $ 15,770 $ 1,745 Trade receivables 16,701 20,426 Inventories 4,637 30,457 Debt investments with no active market - current - 54,324 Other current assets 615 2,877
Non-current assets Plant and equipment 1,170 84,672 Intangible assets 70 9,921 Deferred tax assets - 4,207 Other non-current assets 354 926
Current liabilities Short-term borrowings - (8,100) Trade and other payables (20,302) (26,748) Current portion of long-term borrowings - (22,733) Other current liabilities (873) (1,646)
Non-current liabilities Long-term borrowings - (109,656) Deferred tax liabilities - (2,665)
$ 18,142 $ 38,007
d. Non-controlling interests
The non-controlling interest (40% ownership interest in AVN and AKST) recognized at the acquisition date was measured by reference to the identifiable net assets of the non-controlling interest and amounted to $7,257 thousand and $15,203 thousand for each.
e. Goodwill recognized on acquisitions
AVN AKST Consideration transferred $ 76,092 $ 120,592 Less: Fair value of identifiable net assets acquired (10,885) (22,804) Goodwill recognized on acquisitions $ 65,207 $ 97,788
289
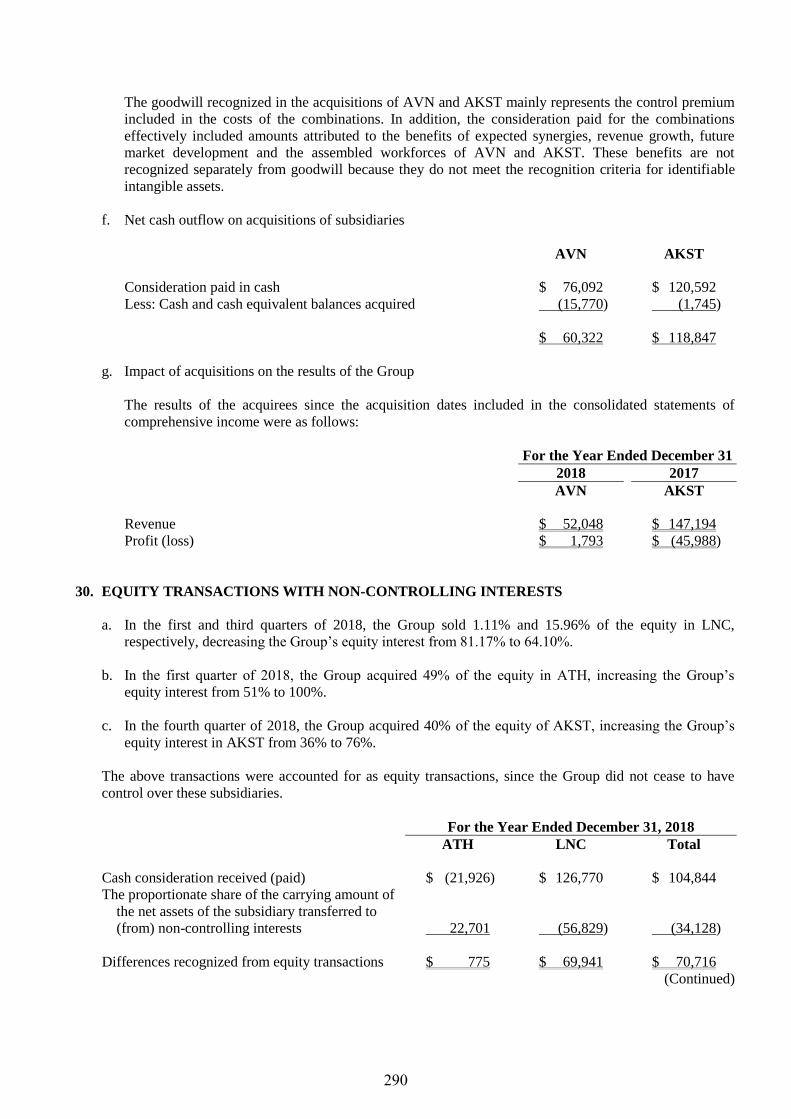
The goodwill recognized in the acquisitions of AVN and AKST mainly represents the control premium included in the costs of the combinations. In addition, the consideration paid for the combinations effectively included amounts attributed to the benefits of expected synergies, revenue growth, future market development and the assembled workforces of AVN and AKST. These benefits are not recognized separately from goodwill because they do not meet the recognition criteria for identifiable intangible assets.
f. Net cash outflow on acquisitions of subsidiaries
AVN AKST Consideration paid in cash $ 76,092 $ 120,592 Less: Cash and cash equivalent balances acquired (15,770) (1,745) $ 60,322 $ 118,847
g. Impact of acquisitions on the results of the Group
The results of the acquirees since the acquisition dates included in the consolidated statements of comprehensive income were as follows: For the Year Ended December 31 2018 2017 AVN AKST Revenue $ 52,048 $ 147,194 Profit (loss) $ 1,793 $ (45,988)
30. EQUITY TRANSACTIONS WITH NON-CONTROLLING INTERESTS a. In the first and third quarters of 2018, the Group sold 1.11% and 15.96% of the equity in LNC,
respectively, decreasing the Group’s equity interest from 81.17% to 64.10%. b. In the first quarter of 2018, the Group acquired 49% of the equity in ATH, increasing the Group’s
equity interest from 51% to 100%. c. In the fourth quarter of 2018, the Group acquired 40% of the equity of AKST, increasing the Group’s
equity interest in AKST from 36% to 76%.
The above transactions were accounted for as equity transactions, since the Group did not cease to have control over these subsidiaries. For the Year Ended December 31, 2018 ATH LNC Total Cash consideration received (paid) $ (21,926) $ 126,770 $ 104,844 The proportionate share of the carrying amount of
the net assets of the subsidiary transferred to (from) non-controlling interests 22,701 (56,829) (34,128)
Differences recognized from equity transactions $ 775 $ 69,941 $ 70,716
(Continued)
290

For the Year Ended December 31, 2018 ATH LNC Total Line items adjusted for equity transactions Capital surplus - difference between
consideration received or paid and carrying amount of the subsidiaries’ net assets during actual disposal or acquisition $ 775 $ 69,941 $ 70,716
(Concluded)
31. OPERATING LEASE ARRANGEMENTS The Group as Lessee Lease arrangements The Group leased offices in the U.S.A., Europe and Japan from third parties; the lease contracts, which will end between 2012 and 2017, are renewable upon expiry. As of December 31, 2018 and 2017, refundable deposits (recognized as other non-current assets) for the operating leases were $36,303 thousand and $25,812 thousand, respectively. Recognized as expenses For the Year Ended December 31 2018 2017 Rental expenses $ 186,068 $ 147,187
32. CAPITAL MANAGEMENT The Group manages its capital to ensure that entities in the Group will be able to continue as going concerns while maximizing the return to stakeholders through the optimization of the debt and equity balance. The Group’s overall strategy remains unchanged in both 2018 and 2017. The capital structure of the Group consists of net debt (borrowings offset by cash and cash equivalents) and equity of the Group (comprising issued capital, reserves, retained earnings, other equity, and non-controlling interests). The Group is not subject to any externally imposed capital requirements. Key management personnel of the Group review the capital structure on a quarterly basis. As part of this review, the key management personnel consider the cost of capital and the risks associated with each class of capital. Based on recommendations of the key management personnel, in order to balance the overall capital structure, the Group may adjust the amount of dividends paid to shareholders, the number of new shares issued, and the amount of new debt issued.
291
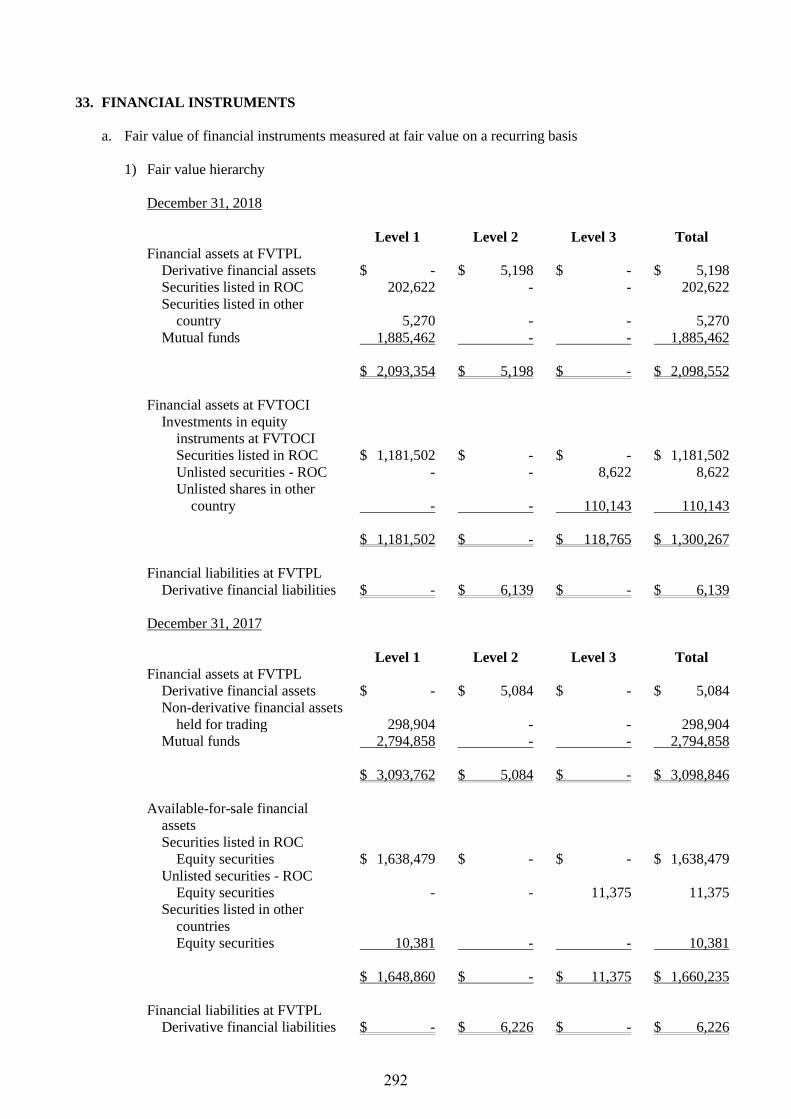
33. FINANCIAL INSTRUMENTS a. Fair value of financial instruments measured at fair value on a recurring basis
1) Fair value hierarchy
December 31, 2018 Level 1 Level 2 Level 3 Total Financial assets at FVTPL
Derivative financial assets $ - $ 5,198 $ - $ 5,198 Securities listed in ROC 202,622 - - 202,622 Securities listed in other
country 5,270 - - 5,270 Mutual funds 1,885,462 - - 1,885,462
$ 2,093,354 $ 5,198 $ - $ 2,098,552 Financial assets at FVTOCI
Investments in equity instruments at FVTOCI Securities listed in ROC $ 1,181,502 $ - $ - $ 1,181,502 Unlisted securities - ROC - - 8,622 8,622 Unlisted shares in other
country - - 110,143 110,143 $ 1,181,502 $ - $ 118,765 $ 1,300,267 Financial liabilities at FVTPL
Derivative financial liabilities $ - $ 6,139 $ - $ 6,139 December 31, 2017 Level 1 Level 2 Level 3 Total Financial assets at FVTPL
Derivative financial assets $ - $ 5,084 $ - $ 5,084 Non-derivative financial assets
held for trading 298,904 - - 298,904 Mutual funds 2,794,858 - - 2,794,858
$ 3,093,762 $ 5,084 $ - $ 3,098,846 Available-for-sale financial
assets Securities listed in ROC
Equity securities $ 1,638,479 $ - $ - $ 1,638,479 Unlisted securities - ROC
Equity securities - - 11,375 11,375 Securities listed in other
countries Equity securities 10,381 - - 10,381
$ 1,648,860 $ - $ 11,375 $ 1,660,235 Financial liabilities at FVTPL
Derivative financial liabilities $ - $ 6,226 $ - $ 6,226
292

There were no transfers between Levels 1 and 2 in the current and prior periods.
2) Reconciliation of Level 3 fair value measurements of financial instruments For the year ended December 31, 2018
Financial Assets at Fair Value Through Other Comprehensive
Income
Equity
Instruments Total Financial assets Balance at January 1, 2018 $ - $ - Reclassification 89,893 89,893 Recognized in other comprehensive income 28,872 28,872 Balance at December 31, 2018 $ 118,765 $ 118,765 For the year ended December 31, 2017
Available-for-sale Financial
Assets
Equity
Instruments Total Financial assets Balance at January 1, 2017 $ 9,375 $ 9,375 Purchase 2,000 2,000 Balance at December 31, 2017 $ 11,375 $ 11,375
3) Valuation techniques and inputs applied for Level 2 fair value measurement Derivatives held by the Group were foreign currency forward contracts, whose fair values were calculated using discounted cash flow. Future cash flows are estimated based on observable forward exchange rates at the end of the reporting period and contract forward rates, discounted at a rate that reflects the credit risk of various counterparties.
4) Valuation techniques and inputs applied for Level 3 fair value measurement
The fair values of unlisted equity securities - ROC were using income approach. In this approach, the discounted cash flow method was used to capture the present value of the expected future economic benefits to be derived from the ownership of these investees.
293

b. Categories of financial instruments December 31 2018 2017 Financial assets Fair value through profit or loss (FVTPL)
Held for trading $ - $ 303,988 Designated as at FVTPL - 2,794,858 Mandatorily at FVTPL 2,098,552 -
Loans and receivables (Note 1) - 13,184,303 Available-for-sale financial assets (Note 2) - 1,738,753 Financial assets at amortized cost (Note 3) 15,187,794 - Financial assets at FVTOCI equity instrument 1,300,267 - Financial liabilities Fair value through profit or loss (FVTPL)
Held for trading - 6,226 Mandatorily at FVTPL 6,139 -
Measured at amortized cost (Note 4) 9,616,094 9,027,555 Note 1: The balances included loans and receivables measured at amortized cost, which comprise cash
and cash equivalents, debt investments with no active market - current, notes receivable, trade receivables, trade receivables from related parties and other receivables.
Note 2: The balances include the carrying amount of available-for-sale financial assets measured at
cost. Note 3: The balances included financial assets measured at amortized cost, which comprise cash and
cash equivalents, financial assets at amortized cost - current, notes receivable, trade receivables, trade receivables from related parties, and other receivables.
Note 4: The balances included financial liabilities measured at amortized cost, which comprise
short-term borrowings, notes payable and trade payables, other payables, current portion of long-term borrowings and long-term borrowings.
c. Financial risk management objectives and policies
The Group’s major financial instruments included equity investments, trade receivables, trade payables, and borrowings. The Group’s Corporate Treasury function provides services to the business, coordinates access to domestic and international financial markets, monitors and manages the financial risks relating to the operations of the Group through internal risk reports which analyze exposures by degree and magnitude of risks. These risks include market risk (including foreign currency risk, interest rate risk and other price risk), credit risk, and liquidity risk. The Group sought to minimize the effects of these risks by using derivative financial instruments to hedge risk exposures. The use of financial derivatives was governed by the Group’s policies approved by the board of directors, which provided written principles on foreign exchange risk, interest rate risk, credit risk, the use of financial derivatives and non-derivative financial instruments, and the investment of excess liquidity. Compliance with policies and exposure limits was reviewed by the internal auditors on a continuous basis. The Group did not enter into or trade financial instruments, including derivative financial instruments, for speculative purposes.
294

The Corporate Treasury function reports quarterly to the board of directors on the Group’s current derivative instrument management. 1) Market risk
The Group’s activities exposed it primarily to financial risks of changes in foreign currency exchange rates (see (a) below) and interest rates (see (b) below). The Group entered into a variety of derivative financial instruments to manage its exposure to foreign currency risk. There had been no change to the Group’s exposure to market risks or the manner in which these risks were managed and measured. a) Foreign currency risk
The Group undertook operating activities and investment of foreign operations denominated in foreign currencies, which exposed it to foreign currency risk. The Group manages the risk that fluctuations in foreign currency could have on foreign-currency denominated assets and future cash flow by using forward exchange contracts, which allow the Group to mitigate but not fully eliminate the effect. The maturities of the Company’s forward exchange contracts were less than six months and these contracts did not meet the criteria for hedge accounting. The carrying amounts of the Group’s foreign currency denominated monetary assets and monetary liabilities (including those eliminated on consolidation) are set out in Note 36. As for the carrying amounts of derivatives exposing to foreign currency risk at the end of the reporting period, refer to Note 7. Sensitivity analysis The Group was mainly exposed to the U.S. dollar, Euro and Renminbi. The following table details the Group’s sensitivity to a 5% increase in the New Taiwan dollar (i.e. the functional currency) against the relevant foreign currencies. The sensitivity rate used when reporting foreign currency risk internally to key management personnel and representing management’s assessment of the reasonably possible change in foreign exchange rates is 5%. The sensitivity analysis included only outstanding foreign currency denominated monetary items and foreign currency exchange forward contracts designated as cash flow hedges, and adjusts their translation at the end of the reporting period for a 5% change in exchange rates. The range of the sensitivity analysis included cash and cash equivalents, trade receivables and trade payables. A positive number below indicates an increase in pre-tax profit associated with the New Taiwan dollar weakening 5% against the relevant currency. For a 5% strengthening of the New Taiwan dollar against the relevant currency, there would be an equal and opposite impact on pre-tax profit, and the balances below would be negative. U.S. Dollar Impact Euro Impact Renminbi Impact
For the Year Ended
December 31 For the Year Ended
December 31 For the Year Ended
December 31 2018 2017 2018 2017 2018 2017 Profit or loss $ 86,067 $ 108,887 $ 48,477 $ 57,967 $ 40,381 $ 23,642 (Note 1) (Note 1) (Note 2) (Note 2) (Note 3) (Note 3) Note 1: This was mainly attributable to the exposure outstanding on U.S. dollar-denominated
cash, trade receivables, and trade payables, which were not hedged at the end of the reporting period.
295

Note 2: This was mainly attributable to the exposure outstanding on Euro-denominated cash, trade receivables, and trade payables, which were not hedged at the end of the reporting period.
Note 3: This was mainly attributable to the exposure outstanding on Renminbi-denominated
cash, trade receivables and trade payables, which were not hedged at the end of the reporting period.
b) Interest rate risk
The Group’s floating-rate bank savings and borrowings are exposed to risk of changes in interest rates. The Group does not operate hedging instruments for interest rates. The Group’s management monitors fluctuations in market interest rates regularly. If it is needed, the management might perform necessary procedures for significant interest rate risks to control the risks from fluctuations in market interest rates. The Group’s fixed-rate bank deposits and borrowings are exposed to fair value interest rate risk; however, the only fixed-rate bank deposits expected risk is insignificant. The carrying amount of the Group’s financial assets and financial liabilities with exposure to interest rates at the end of the reporting period were as follows: December 31 2018 2017 Fair value interest rate risk
Financial assets $ 1,363,564 $ 230,278 Financial liabilities - 42,698
Cash flow interest rate risk Financial assets 4,527,415 4,452,477 Financial liabilities 142,991 79,419
Sensitivity analysis The sensitivity analyses below were determined based on the Group’s exposure to interest rates for non-derivative instruments at the end of the reporting period. For floating rate liabilities, the analysis was prepared assuming the amount of the liability outstanding at the end of the reporting period was outstanding for the whole year. A 50-basis point increase or decrease was used when reporting interest rate risk internally to key management personnel and represents management’s assessment of the reasonably possible change in interest rates. If interest rates had been 50 basis points higher and all other variables were held constant, the Group’s pre-tax profit for the years ended December 31, 2018 and 2017 would have increased by $21,922 thousand and $21,865 thousand, respectively. Had interest rates been 50 basis points lower for the same years, the Group’s pre-tax profit would have decreased by the same respective amounts. The source of the negative effects would have been mainly the floating-interest rates on bank savings.
c) Other price risk
The Group was exposed to equity price risk through its investments in listed equity securities. The Group manages this exposure by maintaining a portfolio of investments with different risks. The Group’s equity price risk was mainly concentrated on equity instruments trading in the Taiwan Stock Exchange.
296

Sensitivity analysis The sensitivity analyses below were determined based on the exposure to equity price risks at the end of the reporting period. If equity prices had been 1% higher, pre-tax profits for the years ended December 31, 2018 would have increased by $2,079 thousand, as a result of changes in the fair value of held-for-trading investments and the pre-tax other comprehensive income for the years ended December 31, 2018 and 2017 would have increased by $13,002 thousand, as a result of changes in fair value of financial assets at fair value through other comprehensive income. Had equity prices been 1% lower for the same years, the pre-tax profit and other comprehensive income for would have decreased by the same respective amounts. If equity prices had been 1% higher, pre-tax profits for the years ended December 31, 2017 would have increased by $2,989 thousand as a result of the changes in fair value of held-for-trading investments, and the pre-tax other comprehensive income for the years ended December 31, 2017 would have increased by $16,602 thousand as a result of the changes in fair value of available-for-sale investments. Had equity prices been 1% lower for the same period, the pre-tax profit and other comprehensive income would have decreased by the same respective amounts. The Group had lower sensitivity toward equity prices mainly because it disposed of partial shares in 2017.
2) Credit risk
Credit risk refers to the risk that counterparty will default on its contractual obligations resulting in financial loss to the Group. As at the end of the reporting period, the Group’s maximum exposure to credit risk which would cause a financial loss to the Group due to failure of counterparties to discharge an obligation provided by the Group could arise from the carrying amount of the respective recognized financial assets as stated in the balance sheets. In order to minimize credit risk, the management of the Group has delegated a team responsible for determining credit limits, credit approvals and other monitoring procedures to ensure that follow-up action is taken to recover overdue debts. In addition, the Group reviews the recoverable amount of each individual trade debt at the end of the reporting period to ensure that adequate allowance are made for irrecoverable amounts. In this regard, the management believes the Group’s credit risk as significantly reduced. Trade receivables consisted of a large number of customers, spread across diverse industries and geographical areas and, thus, no concentration of credit risk was observed.
3) Liquidity risk The Group manages liquidity risk by monitoring and maintaining a level of cash and cash equivalents deemed adequate to finance the Group’s operations and mitigate the effects of fluctuations in cash flows. In addition, management monitors the utilization of bank borrowings and ensures compliance with loan covenants. The Group relies on bank borrowings as a significant source of liquidity. The Group had available unutilized short-term bank loan facilities set out in section (c) below.
297

Ultimate responsibility for liquidity risk management rests with the board of directors, which has built an appropriate liquidity risk management framework for the Group’s short, medium and long-term funding and liquidity management requirements. The Group manages liquidity risk by maintaining adequate reserves and continuously monitoring forecast and actual cash flows as well as matching the maturity profiles of financial assets and liabilities. a) Liquidity and interest risk rate tables for non-derivative financial liabilities
The following table details the Group’s remaining contractual maturity for its non-derivative financial liabilities with agreed repayment periods. The tables had been drawn up based on the undiscounted cash flows of financial liabilities from the earliest date on which the Group can be required to pay. The tables included both interest and principal cash flows. Specifically, bank loans with a repayment on demand clause were included in the earliest time band regardless of the probability of the banks choosing to exercise their rights. The maturity dates for other non-derivative financial liabilities were based on agreed repayment dates. To the extent that interest flows are at floating rate, the undiscounted amounts was derived from the interest rate curve at the end of the reporting period. December 31, 2018
On Demand or Less than 1 Month 1-3 Months
Over 3 Months to
1 Year Over 1 Year-
5 Years Non-derivative financial liabilities Non-interest bearing $ 7,036,567 $ 1,601,148 $ 835,388 $ - Variable interest rate
liabilities 337 20,649 70,407 67,039 $ 7,036,904 $ 1,621,797 $ 905,795 $ 67,039 December 31, 2017
On Demand or Less than 1 Month 1-3 Months
Over 3 Months to
1 Year Over 1 Year-
5 Years Non-derivative financial liabilities Non-interest bearing $ 6,683,438 $ 1,170,810 $ 1,051,190 $ - Variable interest rate
liabilities 192 8,777 1,543 86,001 Fixed interest rate
liabilities 66 132 592 43,280 $ 6,683,696 $ 1,179,719 $ 1,053,325 $ 129,281 The amounts included above for variable interest rate instruments for non-derivative financial assets and liabilities were subject to change if changes in variable interest rates differ from those estimates of interest rates determined at the end of the reporting period.
298

b) Liquidity and interest risk rate table for derivative financial liabilities
The following tables detailed the Group’s liquidity analysis for its derivative financial instruments. The tables were based on the undiscounted contractual net cash inflows and outflows on derivative instruments that require gross settlement. December 31, 2018
On Demand or Less than 1 Month 1-3 Months
Over 3 Months to 1 Year Total
Gross settled Foreign exchange
forward contracts Inflows $ 245,998 $ 410,248 $ 205,677 $ 861,923 Outflows 245,440 410,296 207,128 862,864
$ 558 $ (48) $ (1,451) $ (941) December 31, 2017
On Demand or Less than 1 Month 1-3 Months
Over 3 Months to 1 Year Total
Gross settled Foreign exchange
forward contracts Inflows $ 264,246 $ 488,029 $ 281,423 $ 1,033,698 Outflows 263,570 489,905 281,365 1,034,840
$ 676 $ (1,876) $ 58 $ (1,142)
c) Financing facilities
December 31 2018 2017 Unsecured bank overdraft facilities, reviewed annually
and payable on demand Amount used $ 67,581 $ - Amount unused 3,955,919 4,034,100 $ 4,023,500 $ 4,034,100
Secured bank overdraft facilities Amount used $ 55,410 $ 122,117
299

34. TRANSACTIONS WITH RELATED PARTIES Balances and transactions between the Company and its subsidiaries, which are related parties of the Company, have been eliminated on consolidation and are not disclosed in this note. Details of transactions between the Group and other related parties are disclosed below. a. Names and categories of related parties
Name Related Party Category Axiomtek Co., Ltd. Associate AIMobile Co., Ltd. Associate Deneng Scientific Research Co., Ltd. Associate Jan Hsiang Electronics Co., Ltd. Associate Winmate Inc. Associate AzureWave Technologies, Inc. Associate i-Link Co., Ltd. Associate Mildex Optical Inc. Associate Nippon RAD Inc. Associate Advantech Foundation Other related party K&M Investment Co., Ltd. Other related party AIDC Investment Corp. Other related party Ke Chang Liu Other related party (chairman’s second immediate family) Li Ting Huang Other related party (spouse of chairman’s second
immediate family) b. Sales of goods
For the Year Ended December 31 Related Party Category/Name 2018 2017 Associates $ 109,246 $ 64,487
c. Purchases of goods
For the Year Ended December 31 Related Party Category/Name 2018 2017 Associates $ 148,410 $ 66,871
d. Receivables from related parties (excluding loans to related parties)
Related Party December 31
Line Item Category/Name 2018 2017 Trade receivables from related parties Associates $ 18,969 $ 14,067 The outstanding trade receivables from related parties are unsecured. For the years ended December 31, 2018 and 2017, no impairment loss was recognized for trade receivables from related parties.
e. Payables to related parties (excluding loans from related parties)
Related Party December 31
Line Item Category/Name 2018 2017 Trade payables Associates $ 27,653 $ 19,499
300

The outstanding trade payables to related parties are unsecured.
f. Acquisitions of property, plant and equipment
Purchase Price For the Year Ended December 31
Related Party Category/Name 2018 2017 Associates $ - $ 8,381
g. Disposal of property, plant and equipment
Proceeds Gain (Loss) on Disposal
For the Year Ended
December 31 For the Year Ended
December 31 Related Party Category/Name 2018 2017 2018 2017 Other related parties $ - $ 74,397 $ - $ 66,531
h. Other transactions with related parties
Operating Expenses For the Year Ended December 31
Related Party Category/Name 2018 2017 Research and development expenses
Associates $ 11,672 $ 23,709 Research and development expenses incurred between the Group and its associates were charged according to the agreed remuneration and payment terms on the contracts. For the rest of transactions with related parties, since normal payment terms with related parties were not stipulated, the payment terms were based on mutual agreement. Other Income For the Year Ended December 31
Related Party Category/Name 2018 2017 Rental income
Other related parties $ 60 $ 60 Other
Other related parties $ 2,702 $ 2,702 Lease contracts formed between the Group and its associates were based on market rental prices and had normal payment terms. Revenue contracts for technical services formed between the Company and its associates were based on market prices and had payment terms on the contracts. For the rest of transactions with related parties, since normal payment terms with related parties were not stipulated, the payment terms were based on mutual agreement.
301

i. Compensation of key management personnel
For the Year Ended December 31 2018 2017 Short-term employee benefits $ 45,159 $ 46,617 Post-employment benefits 199 201 Share-based payments 32,568 9,653 $ 77,926 $ 56,471 The remuneration of directors and key executives was determined by the remuneration committee based on the performance of individuals and market trends.
35. ASSETS PLEDGED AS COLLATERAL OR FOR SECURITY
The following assets of AKST were provided as collateral for bank borrowings: December 31 2018 2017 Pledge deposits (recognized as debt investments with no active
market) $ - $ 29,982 Property, plant and equipment 67,068 69,552 $ 67,068 $ 99,534
36. SIGNIFICANT ASSETS AND LIABILITIES DENOMINATED IN FOREIGN CURRENCIES The group entities’ significant financial assets and liabilities denominated in foreign currencies aggregated by the foreign currencies other than functional currencies and the related exchange rates between foreign currencies and respective functional currencies were as follows: December 31, 2018
Unit: In Thousands for Currencies, Except Exchange Rates
Foreign
Currencies Exchange Rate Carrying Amount
Financial assets Monetary items
USD $ 211,836 30.715 (USD:NTD) $ 6,506,543 RMB 493,302 4.472 (RMB:NTD) 2,206,044 EUR 24,059 35.200 (EUR:NTD) 846,877 USD 15,998 6.8683 (USD:RMB) 491,378 $ 10,050,842
(Continued)
302

Foreign
Currencies Exchange Rate Carrying Amount
Financial liabilities Monetary items
USD $ 142,257 30.715 (USD:NTD) $ 4,369,424 RMB 246,686 4.472 (RMB:NTD) 1,103,178 USD 29,534 6.8683 (USD:RMB) 907,135 $ 6,379,737
(Concluded) December 31, 2017
Unit: In Thousands for Currencies, Except Exchange Rates
Foreign
Currencies Exchange Rate Carrying Amount
Financial assets Monetary items
USD $ 204,045 29.760 (USD:NTD) $ 6,072,379 RMB 370,046 4.5650 (RMB:NTD) 1,689,260 EUR 32,336 35.5770 (EUR:NTD) 1,150,192 USD 18,340 6.5192 (USD:RMB) 545,801 $ 9,457,632
Financial liabilities Monetary items
USD 120,900 29.760 (USD:NTD) $ 3,597,984 RMB 190,006 4.5650 (RMB:NTD) 867,377 USD 28,310 6.5192 (USD:RMB) 842,512 $ 5,307,873
For the years ended December 31, 2018 and 2017, realized and unrealized net foreign exchange gains (losses) were $16,956 thousand and $(76,098) thousand, respectively. It is impractical to disclose net foreign exchange gains (losses) by each significant foreign currency due to the variety of the foreign currency transactions and functional currencies of the group entities.
37. SEPARATELY DISCLOSED ITEMS a. Information about significant transactions and b. information on investees:
1) Financing provided to others. (Table 1) 2) Endorsement/guarantee provided. (Table 2) 3) Marketable securities held. (Table 3)
303

4) Marketable securities acquired and disposed of at costs or prices of at least NT$300 million or 20%
of the paid-in capital. (Table 4) 5) Acquisition of individual real estate at costs of at least NT$300 million or 20% of the paid-in
capital. (None) 6) Disposal of individual real estate at prices of at least NT$300 million or 20% of the paid-in capital.
(None) 7) Total purchases from or sales to related parties amounting to at least NT$100 million or 20% of the
paid-in capital. (Table 5) 8) Receivables from related parties amounting to at least NT$100 million or 20% of the paid-in
capital. (Table 6) 9) Trading in derivative instruments. (Notes 7 and 33) 10) Significant transactions between the Company and subsidiaries. (Table 10) 11) Name, locations, and other information of investees. (Table 7) 12) Organization chart. (Table 9)
c. Information on investments in mainland China 1) Information on any investee company in mainland China, showing the name, principal business
activities, paid-in capital, method of investment, inward and outward remittance of funds, ownership percentage, net income of investees, investment income or loss, carrying amount of the investment at the end of the period, repatriations of investment income, and limit on the amount of investment in the mainland China area. (Table 8)
2) Any of the following significant transactions with investee companies in mainland China, either
directly or indirectly through a third party, their prices, payment terms, and unrealized gains or losses. (Tables 1, 5 and 6)
38. SEGMENT INFORMATION
Information reported to the chief operating decision maker (“CODM”) for the purpose of resource allocation and assessment of segment performance focuses on the types of goods or services delivered or provided. The Group’s segment information which is disclosed is as follows:
Industrial internet of things services (IIoT): Focus on the market of industry internet-of-things;
Embedded board and design-in services (EIoT): Provide services involving embedded boards, systems and peripheral hardware and software;
Allied design manufacture services (Allied DMS): Including Networks and Communications, data
acquisition and control, and provide the customized collaboration designs and services;
Intelligent services (SIoT): Provide services involving digital logistic, digital healthcare and intelligent retail;
Global customer services (AGS &APS): Global repair, technical support and warranty services.
304

The CODM considers each service as a separate operating segment. But for financial statements presentation purposes, these individual operating segments have been aggregated into a single operating segment, taking into account the following factors: a. These operating segments have similar long-term gross profit margins; and b. The nature of the products and production processes are similar. Segment Revenue and Results The following was an analysis of the Group’s revenue and results from continuing operations by reportable segment:
Industrial Internet of
Thing Services (IIoT)
Embedded Boards and Design-in Services (EIoT)
Allied Design Manufacture
Services (Allied DMS)
Intelligent Services (SIoT)
Global Customer Services
(AGS &APS) Others Total For the year ended December 31, 2018 Revenue from external customers $ 16,653,946 $ 13,253,892 $ 8,099,529 $ 4,373,806 $ 6,333,069 $ 12,276 $ 48,726,518 Inter-segment revenue - - - - - - - Segment revenue $ 16,653,946 $ 13,253,892 $ 8,099,529 $ 4,373,806 $ 6,333,069 $ 12,276 48,726,518 Eliminations $ - $ - $ - $ - $ - $ - - Consolidated revenue - - - - - - - Segment income $ 3,667,801 $ 2,162,092 $ 1,226,964 $ 260,715 $ 713,496 $ (5,196 ) 8,025,872 Other revenue 318,106 Other unamortized expense (558,473 ) Other income and expense 118,034 Finance costs (4,685 ) Share of profits of associates accounted for using
the equity method 95,635 Profit before tax (continuing operations) $ 7,994,489 For the year ended December 31, 2017 Revenue from external customers $ 14,763,233 $ 11,906,429 $ 9,005,011 $ 3,092,256 $ 5,543,311 $ 64,511 $ 44,374,751 Inter-segment revenue - - - - - - - Segment revenue $ 14,763,233 $ 11,906,429 $ 9,005,011 $ 3,092,256 $ 5,543,311 $ 64,511 44,374,751 Eliminations $ - $ - $ - $ - $ - $ - - Consolidated revenue - - - - - - 44,374,751 Segment income $ 3,137,326 $ 1,970,685 $ 1,426,348 $ (67,163 ) $ 696,162 $ (994 ) 7,162,364 Other revenue 234,453 Other unamortized expense (383,887 ) Other income and expense 314,079 Finance costs (12,117 ) Share of profits of associates accounted for using
the equity method 218,651 Profit before tax (continuing operations) $ 7,533,543
Segment profit represented the profit before tax earned by each segment without allocation of central administration costs and directors’ and supervisors’ salaries, share of profits of associates, gain recognized on the disposal of interest in former associates, rental revenue, interest income, gain or loss on disposal of property, plant and equipment, gains or losses on disposal of financial instruments, exchange gains or losses, valuation gains or losses on financial instruments, finance costs and income tax expense. This was the measure reported to the chief operating decision maker for the purpose of resource allocation and assessment of segment performance. Revenue from Major Products and Services The following is an analysis of the Group’s revenue from continuing operations from its major products and services. For the Year Ended December 31 2018 2017 Embedded boards and Chassis $ 21,354,713 $ 20,973,947 Industrial computer and industrial control 21,099,031 17,896,638 After-sales service and others 6,272,774 5,504,166 $ 48,726,518 $ 44,374,751
305

Geographical Information The Group’s revenue from continuing operations from external customers by location of operations and information about its non-current assets by location of assets are detailed below.
Revenue from
External Customers Non-current Assets For the Year Ended December 31 For the Year Ended December 31 2018 2017 2018 2017 Taiwan $ 3,600,680 $ 3,454,198 $ 7,763,053 $ 7,837,025 Asia 20,014,992 18,696,453 3,156,225 2,746,244 USA 14,211,217 13,277,208 2,992,980 2,984,579 Europe 8,485,831 7,170,151 421,419 674,970 Others 2,413,798 1,776,741 3,773 2,831 $ 48,726,518 $ 44,374,751 $ 14,337,450 $ 14,245,649 Non-current assets exclude financial instruments and deferred tax assets. Information about Major Customers No customers contributed 10% or more to the Group’s revenue for both years ended December 31, 2018 and 2017.
306

TA
BLE
1
AD
VA
NT
EC
H C
O.,
LT
D. A
ND
SU
BSI
DIA
RIE
S FI
NA
NC
ING
PR
OV
IDE
D T
O O
THE
RS
FOR
TH
E Y
EA
R E
ND
ED
DE
CE
MB
ER
31,
201
8 (I
n T
hous
ands
of N
ew T
aiw
an D
olla
rs, U
nles
s Sta
ted
Oth
erw
ise)
No.
(N
ote
A)
Len
der
Bor
row
er
Fina
ncia
l Sta
tem
ent
Acc
ount
R
elat
ed
Part
ies
Cre
dit L
ine
(Not
e D
) A
ctua
l Bor
row
ing
Inte
rest
R
ate
(%)
Nat
ure
of
Fina
ncin
g
Bus
ines
s T
rans
actio
n A
mou
nt
Rea
sons
for
Shor
t-ter
m
Fina
ncin
g
Allo
wan
ce fo
r Im
pair
men
t Los
s
Col
late
ral
Fina
ncin
g L
imit
for
Eac
h Bo
rrow
er
Agg
rega
te
Fina
ncin
g L
imits
H
ighe
st B
alan
ce fo
r th
e ye
ar
End
ing
Bala
nce
End
ing
Bala
nce
Item
V
alue
1
B+B
(CZ)
C
onel
Aut
omat
ion
Trad
e re
ceiv
able
s - re
late
d pa
rties
Y
es
$
17
,184
(CZK
12
,000
th
ousa
nd )
$
16
,392
(CZK
12
,000
th
ousa
nd )
$
16
,392
(CZK
12
,000
th
ousa
nd )
2 Sh
ort-t
erm
fin
anci
ng
$
-
Fina
ncin
g ne
ed
$
-
Non
e N
one
$
11
6,54
5
(N
ote
C)
$
11
6,54
5
(N
ote
C)
2
B+B
(CZ)
C
onel
Aut
omat
ion
Trad
e re
ceiv
able
s - re
late
d pa
rties
Y
es
6,83
0
(CZK
5,
000
thou
sand
)
6,83
0
(CZK
5,
000
thou
sand
)
6,83
0
(CZK
5,
000
thou
sand
)
2 Sh
ort-t
erm
fin
anci
ng
- Fi
nanc
ing
need
-
Non
e N
one
116,
545
(Not
e C
)
11
6,54
5
(N
ote
C)
3
LNC
LN
C D
ong
Gua
n Tr
ade
rece
ivab
les -
rela
ted
parti
es
Yes
30
,000
30
,000
-
- Sh
ort-t
erm
fin
anci
ng
- Fi
nanc
ing
need
-
Non
e N
one
32,3
08
(Not
e D
)
12
9,23
2
(N
ote
D)
4
B+B
(CZ)
C
onel
Aut
omat
ion
Trad
e re
ceiv
able
s - re
late
d pa
rties
Y
es
4,09
8
(CZK
3,
000
thou
sand
)
4,09
8
(CZK
3,
000
thou
sand
)
4,09
8
(CZK
3,
000
thou
sand
)
2 Sh
ort-t
erm
fin
anci
ng
- Fi
nanc
ing
need
-
Non
e N
one
116,
545
(Not
e C
)
11
6,54
5
(N
ote
C)
N
ote
A:
Inve
stee
com
pani
es a
re n
umbe
red
sequ
entia
lly fr
om 1
. N
ote
B:
The
exch
ange
rate
s as o
f Dec
embe
r 31,
201
8 w
ere
CZK
1=N
T$1.
366.
N
ote
C:
The
finan
cing
lim
it fo
r eac
h bo
rrow
er a
nd fo
r the
agg
rega
te fi
nanc
ing
wer
e bo
th 4
0%, o
f the
B+B
(CZ)
’s n
et a
sset
val
ues,
and
wer
e su
perv
ised
by
the
Com
pany
. N
ote
D:
The
finan
cing
lim
it fo
r eac
h bo
rrow
er a
nd fo
r the
agg
rega
te fi
nanc
ing
wer
e 10
% a
nd 4
0%, r
espe
ctiv
ely,
of t
he L
NC
’s n
et a
sset
val
ues.
Not
e E:
Th
e m
axim
um b
alan
ce fo
r the
yea
r and
end
ing
bala
nce
are
appr
oved
by
the
boar
d of
dire
ctor
s of f
inan
cier
s.
Not
e F:
A
ll in
terc
ompa
ny fi
nanc
ing
has b
een
elim
inat
ed fr
om c
onso
lidat
ion.
307

TA
BL
E 2
A
DV
AN
TE
CH
CO
., L
TD
. AN
D S
UB
SID
IAR
IES
EN
DO
RSE
ME
NT
/GU
AR
AN
TE
E P
RO
VID
ED
FO
R T
HE
YE
AR
EN
DE
D D
EC
EM
BE
R 3
1, 2
018
(In
Tho
usan
ds o
f New
Tai
wan
Dol
lars
, Unl
ess S
tate
d O
ther
wis
e)
No.
E
ndor
ser/
G
uara
ntor
End
orse
e/G
uara
ntee
Lim
its o
n E
ndor
sem
ent/
Gua
rant
ee
Giv
en o
n B
ehal
f of
Eac
h Pa
rty
(Not
e A
)
Max
imum
A
mou
nt
End
orse
d/
Gua
rant
eed
Dur
ing
the
Yea
r
Out
stan
ding
E
ndor
sem
ent/
Gua
rant
ee a
t th
e E
nd o
f the
Y
ear
Act
ual
Bor
row
ing
Am
ount
Am
ount
E
ndor
sed/
G
uara
ntee
d by
C
olla
tera
ls
Rat
io o
f A
ccum
ulat
ed
End
orse
men
t/ G
uara
ntee
to
Net
Equ
ity in
L
ates
t Fi
nanc
ial
Stat
emen
ts
(%)
Max
imum
C
olla
tera
l/ G
uara
ntee
A
mou
nts
Allo
wab
le
(Not
e B
)
End
orse
men
t/ G
uara
ntee
G
iven
by
Pare
nt o
n B
ehal
f of
Subs
idia
ries
End
orse
men
t/ G
uara
ntee
G
iven
by
Subs
idia
ries
on
Beh
alf o
f Pa
rent
End
orse
men
t/ G
uara
ntee
G
iven
on
Beh
alf o
f C
ompa
nies
in
Mai
nlan
d C
hina
Nam
e R
elat
ions
hip
0 Th
e C
ompa
ny
AN
A
Subs
idia
ry
$
2,93
0,27
0
$
928,
650
(US$
30
,000
thou
sand
)
$
921,
450
(US$
30
,000
thou
sand
)
$
- $
-
3.14
$
8,
790,
811
Y
N
N
B+B
Su
bsid
iary
2,93
0,27
0
30
8,00
2 (U
S$
9,95
0
thou
sand
)
30
5,61
4 (U
S$
9,95
0
thou
sand
)
-
-
1.04
8,79
0,81
1 Y
N
N
B+B
(CZ)
Su
bsid
iary
2,93
0,27
0
1,
548
(US$
50
thou
sand
)
1,
536
(US$
50
thou
sand
)
-
-
0.01
8,79
0,81
1 Y
N
N
AK
ST
Subs
idia
ry
2,
930,
270
123,
820
(US$
4,
000
th
ousa
nd)
12
2,86
0 (U
S$
4,00
0
thou
sand
)
67
,581
- 0.
42
8,
790,
811
Y
N
N
AV
N
Subs
idia
ry
2,
930,
270
30,9
55
(US$
1,
000
th
ousa
nd)
30
,715
(U
S$
1,00
0
thou
sand
)
-
-
0.10
8,79
0,81
1 Y
N
N
AK
MC
Subs
idia
ry
2,
930,
270
185,
730
(US$
6,
000
th
ousa
nd)
18
4,29
0 (U
S$
6,00
0
thou
sand
)
-
-
0.63
8,79
0,81
1 Y
N
Y
Adv
anix
s Cor
p.
Subs
idia
ry
2,
930,
270
49,5
28
(US$
1,
600
th
ousa
nd)
49
,144
(U
S$
1,60
0
thou
sand
)
-
-
0.17
8,79
0,81
1 Y
N
N
Cer
mat
e Su
bsid
iary
2,93
0,27
0
30
,955
(U
S$
1,00
0
thou
sand
)
30
,715
(U
S$
1,00
0
thou
sand
)
-
-
0.10
8,79
0,81
1 Y
N
N
AiS
T Su
bsid
iary
2,93
0,27
0
4,
643
(US$
15
0
thou
sand
)
4,
607
(US$
15
0
thou
sand
)
-
-
0.02
8,79
0,81
1 Y
N
N
Adv
anPO
S Su
bsid
iary
2,93
0,27
0
30
,955
(U
S$
1,00
0
thou
sand
)
30
,715
(U
S$
1,00
0
thou
sand
)
-
-
0.10
8,79
0,81
1 Y
N
N
(Con
tinue
d)
308

No.
E
ndor
ser/
G
uara
ntor
End
orse
e/G
uara
ntee
Lim
its o
n E
ndor
sem
ent/
Gua
rant
ee
Giv
en o
n B
ehal
f of
Eac
h Pa
rty
(Not
e A
)
Max
imum
A
mou
nt
End
orse
d/
Gua
rant
eed
Dur
ing
the
Yea
r
Out
stan
ding
E
ndor
sem
ent/
Gua
rant
ee a
t th
e E
nd o
f the
Y
ear
Act
ual
Bor
row
ing
Am
ount
Am
ount
E
ndor
sed/
G
uara
ntee
d by
C
olla
tera
ls
Rat
io o
f A
ccum
ulat
ed
End
orse
men
t/ G
uara
ntee
to
Net
Equ
ity in
L
ates
t Fi
nanc
ial
Stat
emen
ts
(%)
Max
imum
C
olla
tera
l/ G
uara
ntee
A
mou
nts
Allo
wab
le
(Not
e B
)
End
orse
men
t/ G
uara
ntee
G
iven
by
Pare
nt o
n B
ehal
f of
Subs
idia
ries
End
orse
men
t/ G
uara
ntee
G
iven
by
Subs
idia
ries
on
Beh
alf o
f Pa
rent
End
orse
men
t/ G
uara
ntee
G
iven
on
Beh
alf o
f C
ompa
nies
in
Mai
nlan
d C
hina
Nam
e R
elat
ions
hip
A-D
LoG
Su
bsid
iary
$
2,
930,
270
$
35,8
90
(EU
R
1,00
0
thou
sand
)
$
35,2
00
(EU
R
1,00
0
thou
sand
)
$
- $
-
0.12
8,79
0,81
1 Y
N
N
AB
R
Subs
idia
ry
2,
930,
270
46
,433
(U
S$
1,50
0
thou
sand
)
46
,073
(U
S$
1,50
0
thou
sand
)
-
-
0.16
8,79
0,81
1 Y
N
N
AA
U
Subs
idia
ry
2,
930,
270
6,
191
(US$
20
0
thou
sand
)
6,
143
(US$
20
0
thou
sand
)
-
-
0.02
8,79
0,81
1 Y
N
N
AK
R
Subs
idia
ry
2,
930,
270
1,
548
(US$
50
thou
sand
)
1,
536
(US$
50
thou
sand
)
-
-
0.01
8,79
0,81
1 Y
N
N
Shen
zhen
Cer
mat
e Te
chno
logi
es In
c.
Subs
idia
ry
2,
930,
270
17
,025
(U
S$
550
th
ousa
nd)
16
,893
(U
S$
550
th
ousa
nd)
-
-
0.06
8,79
0,81
1 Y
N
Y
ATJ
B
usin
ess
rela
tions
hip
2,
930,
270
27
8,00
0 (J
PY 1
,000
,000
thou
sand
)
27
8,00
0 (J
PY 1
,000
,000
thou
sand
)
-
-
0.95
8,79
0,81
1 N
N
N
Not
e A
: Th
e lim
it on
end
orse
men
ts o
r gua
rant
ees p
rovi
ded
on b
ehal
f of t
he re
spec
tive
party
is 1
0% o
f the
Com
pany
’s n
et a
sset
val
ue.
Not
e B
: Th
e m
axim
um c
olla
tera
l or g
uara
ntee
am
ount
allo
wab
le is
30%
of t
he C
ompa
ny’s
net
ass
et v
alue
. N
ote
C:
The
exch
ange
rate
s as o
f Dec
embe
r 31,
201
8 w
ere
US$
1=N
T$30
.715
, EU
R1=
NT$
35.2
0 an
d JP
Y1=
NT$
0.27
8.
Not
e D
: Th
e la
test
net
equ
ity is
from
the
Gro
up’s
con
solid
ated
fina
ncia
l sta
tem
ents
for t
he y
ear e
nded
Dec
embe
r 31,
201
8.
(C
oncl
uded
)
309

TA
BL
E 3
A
DV
AN
TE
CH
CO
., L
TD
. AN
D S
UB
SID
IAR
IES
MA
RK
ET
AB
LE
SE
CU
RIT
IES
HE
LD
FO
R T
HE
YE
AR
EN
DE
D D
EC
EM
BE
R 3
1, 2
018
(In
Tho
usan
ds o
f New
Tai
wan
Dol
lars
, Unl
ess S
tate
d O
ther
wis
e)
Hol
ding
Com
pany
Nam
e T
ype
and
Nam
e of
Mar
keta
ble
Secu
ritie
s (N
ote
E)
Rel
atio
nshi
p w
ith
the
Hol
ding
C
ompa
ny
Fina
ncia
l Sta
tem
ent A
ccou
nt
Dec
embe
r 31
, 201
8 N
ote
Num
ber
of
Shar
es
Car
ryin
g A
mou
nt
Perc
enta
ge o
f O
wne
rshi
p (%
) Fa
ir V
alue
Th
e C
ompa
ny
Stoc
k
A
SUST
ek C
ompu
ter I
nc.
- Fi
nanc
ial a
sset
s at f
air v
alue
thro
ugh
othe
r co
mpr
ehen
sive
inco
me
or lo
ss -
non-
curr
ent
4,73
9,46
1
$ 95
5,00
1 0.
64
$
955,
001
Not
e A
A
llied
Circ
uit C
o., L
td.
-
1,20
0,00
0
73
,440
2.
41
73,4
40
Not
e A
Fu
nd
Meg
a D
iam
ond
Mon
ey M
arke
t -
Fina
ncia
l ass
ets a
t fai
r val
ue th
roug
h pr
ofit
or
loss
- cu
rren
t
97,
030,
420
1,21
5,00
5 -
1,21
5,00
5 N
ote
B
C
apita
l Mon
ey M
arke
t -
8,
702,
880
140,
209
-
14
0,20
9 N
ote
B
Adv
ante
ch C
orpo
rate
Inve
stm
ent
Shar
e
H
waC
om S
yste
m In
c.
- Fi
nanc
ial a
sset
s at f
air v
alue
thro
ugh
prof
it or
lo
ss -
curr
ent
5,17
5,00
0
60
,806
5.
00
60,8
06
Not
e A
Ph
ison
Ele
ctro
nics
Cor
pora
tion
-
622,
000
141,
816
0.32
14
1,81
6 N
ote
A
C
onte
c -
15
,500
5,
270
0.23
5,
270
Not
e A
Alli
ed C
ircui
t Co.
, Ltd
. -
Fina
ncia
l ass
ets a
t fai
r val
ue th
roug
h ot
her
com
preh
ensi
ve in
com
e or
loss
- no
n-cu
rren
t
2,
501,
000
153,
061
5.03
15
3,06
1 N
ote
A
B
road
Tec
Syst
em In
c.
-
225,
000
3,87
9 7.
50
3,87
9 N
ote
C
Bio
sens
eTek
Cor
p.
-
37,5
00
- 1.
79
- N
ote
C
Jugu
ar T
echn
olog
y -
50
0,00
0
4,
743
16.6
7
4,
743
Not
e C
Ta
iwan
DSC
PV
Ltd
., -
16
0,00
0
-
3.20
-
Not
e C
Fund
M
ega
Dia
mon
d M
oney
Mar
ket
- Fi
nanc
ial a
sset
s at f
air v
alue
thro
ugh
prof
it or
lo
ss -
curr
ent
1
1,35
4,02
7
14
2,17
4 -
142,
174
Not
e B
A
dvan
ixs C
orpo
rate
Fu
nd
Jih
Sun
Mon
ey M
arke
t -
1,
212,
495
17,9
37
-
17
,937
N
ote
B
Meg
a D
iam
ond
Mon
ey M
arke
t -
9,
243,
362
115,
744
-
11
5,74
4 N
ote
B
AiS
T Fu
nd
Jih
Sun
Mon
ey M
arke
t -
1,
243,
566
18,3
97
-
18
,397
N
ote
B
(Con
tinue
d)
310

Hol
ding
Com
pany
Nam
e T
ype
and
Nam
e of
Mar
keta
ble
Secu
ritie
s (N
ote
E)
Rel
atio
nshi
p w
ith
the
Hol
ding
C
ompa
ny
Fina
ncia
l Sta
tem
ent A
ccou
nt
Dec
embe
r 31
, 201
8 N
ote
Num
ber
of
Shar
es
Car
ryin
g A
mou
nt
Perc
enta
ge o
f O
wne
rshi
p (%
) Fa
ir V
alue
A
dvan
POS
Fund
M
ega
Dia
mon
d M
oney
Mar
ket
- Fi
nanc
ial a
sset
s at f
air v
alue
thro
ugh
prof
it or
lo
ss -
curr
ent
1,13
9,98
9
$ 14
,275
-
$
14,2
75
Not
e B
A
dvan
tech
Inno
vativ
e D
esig
n C
o., L
td.
Fund
C
apita
l Mon
ey M
arke
t -
62
8,61
3
10
,127
-
10,1
27
Not
e B
C
erm
ate
Fund
M
ega
Dia
mon
d M
oney
Mar
ket
-
1,76
6,48
4
22
,120
-
22,1
20
Not
e B
SI
oT (C
aym
an)
Fund
FS
ITC
Mon
ey M
arke
t -
97
5,83
1
17
3,82
1 -
173,
821
Not
e B
A
iSC
Fu
nd
Shan
ghai
Sha
ngch
uang
Xin
wei
Inve
stm
ent
Man
agem
ent C
o., L
td.
- Fi
nanc
ial a
sset
s at f
air v
alue
thro
ugh
othe
r co
mpr
ehen
sive
inco
me
or lo
ss
-
10
7,32
8 9.
14
107,
328
Not
e C
Ja
ma
Pro
Co.
, Ltd
. -
58
3,30
0
2,
815
10.0
0
2,
815
Not
e C
H
uan
Yan
, Jhi
h-Li
an C
o., L
td.
Fund
FS
ITC
Mon
ey M
arke
t -
Fina
ncia
l ass
ets a
t fai
r val
ue th
roug
h pr
ofit
or
loss
- cu
rren
t
33
,258
5,
924
-
5,
924
Not
e B
Y
un Y
an, W
u-Li
an C
o., L
td.
Fund
FS
ITC
Mon
ey M
arke
t -
54
,616
9,
729
-
9,
729
Not
e B
N
ote
A:
Mar
ket v
alue
was
bas
ed o
n th
e cl
osin
g pr
ice
on D
ecem
ber 3
1, 2
018.
N
ote
B:
Mar
ket v
alue
was
bas
ed o
n th
e ne
t ass
et v
alue
s of t
he o
pen-
ende
d m
utua
l fun
ds o
n D
ecem
ber 3
1, 2
018.
N
ote
C:
The
fair
valu
es a
re e
stim
ated
from
the
late
st n
et e
quity
from
the
finan
cial
stat
emen
ts.
N
ote
D:
Secu
ritie
s com
pris
e sh
ares
, ben
efic
iary
cer
tific
ates
, and
secu
ritie
s der
ived
from
the
shar
es a
nd b
enef
icia
ry c
ertif
icat
es u
nder
IFR
S 9
“Fin
anci
al In
stru
men
ts”.
(Con
clud
ed)
311

TA
BL
E 4
A
DV
AN
TE
CH
CO
., L
TD
. AN
D S
UB
SID
IAR
IES
MA
RK
ET
AB
LE
SE
CU
RIT
IES
AC
QU
IRE
D A
ND
DIS
POSE
D A
T C
OST
S O
R P
RIC
ES
OF
AT
LE
AST
$30
0 M
ILL
ION
OR
20%
OF
TH
E P
AID
-IN
CA
PIT
AL
FO
R T
HE
YE
AR
EN
DE
D D
EC
EM
BE
R 3
1, 2
018
(In
Tho
usan
ds o
f New
Tai
wan
Dol
lars
, Unl
ess S
tate
d O
ther
wise
)
Com
pany
Nam
e T
ype
and
Nam
e of
M
arke
tabl
e Se
curi
ties
Fina
ncia
l Sta
tem
ent
Acc
ount
C
ount
erpa
rty
Rel
atio
nshi
p B
egin
ning
Bal
ance
A
cqui
sitio
n D
ispo
sal
End
ing
Bal
ance
Shar
es
Am
ount
(Cos
t)
Shar
es
Am
ount
Sh
ares
A
mou
nt
Car
ryin
g A
mou
nt
Gai
n (L
oss)
on
Dis
posa
l Sh
ares
A
mou
nt (C
ost)
Th
e C
ompa
ny
Fund
M
ega
Dia
mon
d M
oney
M
arke
t Fi
nanc
ial a
sset
s at f
air v
alue
th
roug
h pr
ofit
or lo
ss
- -
28
,879
,553
$
36
0,00
0
227,
347,
469
$
2,84
0,00
0
159,
196,
602
$
1,99
0,00
0 $
1,
987,
181
$
2,81
9
97,0
30,4
20
$
1,21
2,81
9
C
apita
l Mon
ey M
arke
t Sa
me
as a
bove
-
-
112,
460,
931
1,
807,
000
10
3,75
8,05
1
1,66
8,52
3
1,66
7,00
0
1,52
3
8,70
2,88
0
140,
000
FS
ITC
Mon
ey M
arke
t Sa
me
as a
bove
-
-
1,57
8,63
8
280,
000
4,
675,
444
83
0,00
0
6,25
4,08
2
1,11
1,78
1
1,11
0,00
0
1,78
1
-
-
Adv
ante
ch C
orpo
rate
Fu
nd
Inve
stm
ent
FSIT
C M
oney
Mar
ket
Fina
ncia
l ass
ets a
t fai
r val
ue
thro
ugh
prof
it or
loss
-
-
2,92
6,12
4
519,
001
11
2,60
6
20,0
00
3,
038,
730
53
9,60
3
539,
001
60
2
-
-
M
ega
Dia
mon
d M
oney
M
arke
t Sa
me
as a
bove
-
-
49,6
57,4
52
61
9,00
0
4,95
9,28
9
62,0
00
43
,262
,714
541,
000
53
9,41
5
1,58
5
11,3
54,0
27
14
1,58
5
Shar
e
A
zure
Wav
e Te
chno
logi
es,
Inc.
In
vest
men
ts a
ccou
nted
for
usin
g th
e eq
uity
met
hod
- A
ssoc
iate
5,49
2,00
0
90,4
39
24
,107
,000
488,
124
-
-
-
-
29
,599
,000
578,
563
A
dvan
ixs C
orpo
rate
Fu
nd
Jih
sun
Mon
ey M
arke
t Fi
nanc
ial a
sset
s at f
air v
alue
th
roug
h pr
ofit
or lo
ss
- -
40
,686
,999
599,
197
7,
224,
680
10
6,50
1
46,6
99,1
84
68
9,00
0
687,
839
1,
161
1,
212,
495
17
,859
312

TA
BL
E 5
A
DV
AN
TE
CH
CO
., L
TD
. AN
D S
UB
SID
IAR
IES
TO
TA
L P
UR
CH
ASE
S FR
OM
OR
SA
LE
S T
O R
ELA
TE
D P
AR
TIE
S A
MO
UN
TIN
G T
O A
T L
EA
ST $
100
MIL
LIO
N O
R 2
0% O
F T
HE
PA
ID-I
N C
API
TA
L
FOR
TH
E Y
EA
R E
ND
ED
DE
CE
MB
ER
31,
201
8 (I
n T
hous
ands
of N
ew T
aiw
an D
olla
rs, U
nles
s Sta
ted
Oth
erw
ise)
Buy
er
Rel
ated
Par
ty
Rel
atio
nshi
p T
rans
actio
n D
etai
ls A
bnor
mal
Tra
nsac
tion
Not
es/A
ccou
nts
Rec
eiva
ble
(Pay
able
) N
ote
Purc
hase
/ Sa
le
Am
ount
%
to
Tot
al
Paym
ent T
erm
s U
nit P
rice
Pa
ymen
t Ter
ms
End
ing
Bal
ance
%
to
Tot
al
The
Com
pany
A
AU
Su
bsid
iary
Sa
le
$
233,
477
0.
66
60-9
0 da
ys
Con
tract
pric
e N
o si
gnifi
cant
diff
eren
ce in
term
s for
rela
ted
parti
es
$
40,9
45
0.57
B
+B
Subs
idia
ry
Sale
152,
070
0.
43
45 d
ays a
fter m
onth
-end
C
ontra
ct p
rice
No
sign
ifica
nt d
iffer
ence
in te
rms f
or re
late
d pa
rties
19,0
51
0.26
A
EU
Subs
idia
ry
Sale
4,88
9,20
0
13.8
2 30
day
s afte
r mon
th-e
nd
Con
tract
pric
e N
o si
gnifi
cant
diff
eren
ce in
term
s for
rela
ted
parti
es
95
2,72
1
13.2
0
A
JP
Subs
idia
ry
Sale
905,
025
2.
56
60-9
0 da
ys
Con
tract
pric
e N
o si
gnifi
cant
diff
eren
ce in
term
s for
rela
ted
parti
es
15
4,81
4
2.14
A
CN
Su
bsid
iary
Sa
le
7,
382,
801
20
.87
45 d
ays a
fter m
onth
-end
C
ontra
ct p
rice
No
sign
ifica
nt d
iffer
ence
in te
rms f
or re
late
d pa
rties
1,49
2,60
6
20.6
8 N
ote
A
A
KR
Su
bsid
iary
Sa
le
99
7,56
6
2.82
60
day
s afte
r inv
oice
dat
e C
ontra
ct p
rice
No
sign
ifica
nt d
iffer
ence
in te
rms f
or re
late
d pa
rties
64,9
83
0.90
A
NA
Su
bsid
iary
Sa
le
9,
347,
710
26
.42
45 d
ays a
fter m
onth
-end
C
ontra
ct p
rice
No
sign
ifica
nt d
iffer
ence
in te
rms f
or re
late
d pa
rties
1,90
6,99
3
26.4
2
A
SG
Subs
idia
ry
Sale
276,
045
0.
78
60-9
0 da
ys
Con
tract
pric
e N
o si
gnifi
cant
diff
eren
ce in
term
s for
rela
ted
parti
es
53
,788
0.
75
Adv
anix
s Cor
p.
Subs
idia
ry
Sale
805,
007
2.
28
60-9
0 da
ys
Con
tract
pric
e N
o si
gnifi
cant
diff
eren
ce in
term
s for
rela
ted
parti
es
13
9,15
9
1.93
A
-DLo
G
Subs
idia
ry
Sale
608,
339
1.
72
30 d
ays a
fter i
nvoi
ce d
ate
Con
tract
pric
e N
o si
gnifi
cant
diff
eren
ce in
term
s for
rela
ted
parti
es
54
,615
0.
76
AIN
Su
bsid
iary
Sa
le
11
4,06
3
0.32
60
day
s afte
r mon
th-e
nd
Con
tract
pric
e N
o si
gnifi
cant
diff
eren
ce in
term
s for
rela
ted
parti
es
53
,791
0.
75
SIoT
(Cay
man
) Su
bsid
iary
Sa
le
32
0,26
0
0.91
U
sual
trad
e te
rms
Con
tract
pric
e N
o si
gnifi
cant
diff
eren
ce in
term
s for
rela
ted
parti
es
26
6,62
1
3.69
A
BR
Su
bsid
iary
Sa
le
12
1,74
5
0.34
90
day
s afte
r mon
th-e
nd
Con
tract
pric
e N
o si
gnifi
cant
diff
eren
ce in
term
s for
rela
ted
parti
es
24
,379
0.
34
AM
Y
Subs
idia
ry
Sale
139,
369
0.
39
45 d
ays a
fter m
onth
-end
C
ontra
ct p
rice
No
sign
ifica
nt d
iffer
ence
in te
rms f
or re
late
d pa
rties
11,0
28
0.15
A
KM
C Su
bsid
iary
Pu
rcha
se
(1
1,97
4,22
0)
(48.
41)
Usu
al tr
ade
term
s C
ontra
ct p
rice
No
sign
ifica
nt d
iffer
ence
in te
rms f
or re
late
d pa
rties
(1,5
33,4
44)
27.1
0
A
-DLo
G
Subs
idia
ry
Purc
hase
(181
,902
) (0
.74)
Usu
al tr
ade
term
s C
ontra
ct p
rice
No
sign
ifica
nt d
iffer
ence
in te
rms f
or re
late
d pa
rties
(20,
746)
0.
37
A
KM
C Th
e C
ompa
ny
Pare
nt c
ompa
ny
Sale
11,9
74,2
20
14.2
8 U
sual
trad
e te
rms
Con
tract
pric
e N
o si
gnifi
cant
diff
eren
ce in
term
s for
rela
ted
parti
es
1,
533,
444
94
.69
A
-DLo
G
The
Com
pany
Pa
rent
com
pany
Sa
le
18
1,90
2
58.0
6 U
sual
trad
e te
rms
Con
tract
pric
e N
o si
gnifi
cant
diff
eren
ce in
term
s for
rela
ted
parti
es
20
,746
12
.99
A
AU
Th
e C
ompa
ny
Pare
nt c
ompa
ny
Purc
hase
(233
,477
) (8
8.51
) 60
-90
days
C
ontra
ct p
rice
No
sign
ifica
nt d
iffer
ence
in te
rms f
or re
late
d pa
rties
(40,
945)
83
.71
B
+B
The
Com
pany
Pa
rent
com
pany
Pu
rcha
se
(1
52,0
70)
(18.
02)
45 d
ays a
fter m
onth
-end
C
ontra
ct p
rice
No
sign
ifica
nt d
iffer
ence
in te
rms f
or re
late
d pa
rties
(19,
051)
50
.77
A
EU
The
Com
pany
Pa
rent
com
pany
Pu
rcha
se
(4
,889
,200
) (7
4.34
) 30
day
s afte
r mon
th-e
nd
Con
tract
pric
e N
o si
gnifi
cant
diff
eren
ce in
term
s for
rela
ted
parti
es
(9
52,7
21)
64.6
8
AJP
Th
e C
ompa
ny
Pare
nt c
ompa
ny
Purc
hase
(905
,025
) (9
0.22
) 60
-90
days
C
ontra
ct p
rice
No
sign
ifica
nt d
iffer
ence
in te
rms f
or re
late
d pa
rties
(154
,814
) 92
.26
A
CN
Th
e C
ompa
ny
Pare
nt c
ompa
ny
Purc
hase
(7,3
82,8
01)
(77.
59)
45 d
ays a
fter m
onth
-end
C
ontra
ct p
rice
No
sign
ifica
nt d
iffer
ence
in te
rms f
or re
late
d pa
rties
(1,4
92,6
06)
83.6
9
AK
R
The
Com
pany
Pa
rent
com
pany
Pu
rcha
se
(9
97,5
66)
(62.
8)
60 d
ays a
fter i
nvoi
ce d
ate
Con
tract
pric
e N
o si
gnifi
cant
diff
eren
ce in
term
s for
rela
ted
parti
es
(6
4,98
3)
49.8
4
AN
A
The
Com
pany
Pa
rent
com
pany
Pu
rcha
se
(9
,347
,710
) (8
8.14
) 45
day
s afte
r mon
th-e
nd
Con
tract
pric
e N
o si
gnifi
cant
diff
eren
ce in
term
s for
rela
ted
parti
es
(1
,906
,993
) 84
.04
A
SG
The
Com
pany
Pa
rent
com
pany
Pu
rcha
se
(2
76,0
45)
(79.
42)
60-9
0 da
ys
Con
tract
pric
e N
o si
gnifi
cant
diff
eren
ce in
term
s for
rela
ted
parti
es
(5
3,78
8)
79.2
5
Adv
anix
s Cor
p.
The
Com
pany
Pa
rent
com
pany
Pu
rcha
se
(8
05,0
07)
(98.
71)
60-9
0 da
ys
Con
tract
pric
e N
o si
gnifi
cant
diff
eren
ce in
term
s for
rela
ted
parti
es
(1
39,1
59)
97.5
7
(Con
tinue
d)
313

Buy
er
Rel
ated
Par
ty
Rel
atio
nshi
p T
rans
actio
n D
etai
ls A
bnor
mal
Tra
nsac
tion
Not
es/A
ccou
nts
Rec
eiva
ble
(Pay
able
) N
ote
Purc
hase
/ Sa
le
Am
ount
%
to
Tot
al
Paym
ent T
erm
s U
nit P
rice
Pa
ymen
t Ter
ms
End
ing
Bal
ance
%
to
Tot
al
A-D
LoG
Th
e C
ompa
ny
Pare
nt c
ompa
ny
Purc
hase
$
(6
08,3
39)
(75.
41)
30 d
ays a
fter i
nvoi
ce d
ate
Con
tract
pric
e N
o si
gnifi
cant
diff
eren
ce in
term
s for
rela
ted
parti
es
$
(54,
615)
67
.49
A
IN
The
Com
pany
Pa
rent
com
pany
Pu
rcha
se
(1
14,0
63)
(92.
75)
60 d
ays a
fter i
nvoi
ce d
ate
Con
tract
pric
e N
o si
gnifi
cant
diff
eren
ce in
term
s for
rela
ted
parti
es
(5
3,79
1)
94.4
1
SIoT
(Cay
man
) Th
e C
ompa
ny
Pare
nt c
ompa
ny
Purc
hase
(320
,260
) (4
8.26
) U
sual
trad
e te
rms
Con
tract
pric
e N
o si
gnifi
cant
diff
eren
ce in
term
s for
rela
ted
parti
es
(2
66,6
21)
70.2
9
AB
R
The
Com
pany
Pa
rent
com
pany
Pu
rcha
se
(1
21,7
45)
(67.
12)
90 d
ays a
fter i
nvoi
ce d
ate
Con
tract
pric
e N
o si
gnifi
cant
diff
eren
ce in
term
s for
rela
ted
parti
es
(2
4,37
9)
89.2
9
AM
Y
The
Com
pany
Pa
rent
com
pany
Pu
rcha
se
(1
39,3
69)
(77.
71)
45 d
ays a
fter m
onth
-end
C
ontra
ct p
rice
No
sign
ifica
nt d
iffer
ence
in te
rms f
or re
late
d pa
rties
(11,
028)
100
.00
C
erm
ate
Shen
zhen
Cer
mat
e Te
chno
logi
es In
c.
Rel
ated
ent
erpr
ise
Sale
112,
581
42
.63
Usu
al tr
ade
term
s C
ontra
ct p
rice
No
sign
ifica
nt d
iffer
ence
in te
rms f
or re
late
d pa
rties
18,7
89
48.2
3
AK
MC
AC
N
Rel
ated
ent
erpr
ise
Sale
445,
324
3.
51
Usu
al tr
ade
term
s C
ontra
ct p
rice
No
sign
ifica
nt d
iffer
ence
in te
rms f
or re
late
d pa
rties
52,0
60
3.21
SI
oT (C
aym
an)
Rel
ated
ent
erpr
ise
Sale
510,
175
4.
02
Usu
al tr
ade
term
s C
ontra
ct p
rice
No
sign
ifica
nt d
iffer
ence
in te
rms f
or re
late
d pa
rties
125,
335
7.
74
LN
C
LNC
Don
g G
uan
Rel
ated
ent
erpr
ise
Sale
295,
203
68
.04
Usu
al tr
ade
term
s C
ontra
ct p
rice
No
sign
ifica
nt d
iffer
ence
in te
rms f
or re
late
d pa
rties
209,
533
93
.88
A
CN
A
iSC
R
elat
ed e
nter
pris
e Sa
le
17
1,78
7
1.59
U
sual
trad
e te
rms
Con
tract
pric
e N
o si
gnifi
cant
diff
eren
ce in
term
s for
rela
ted
parti
es
42
,659
1.
89
B
+B (C
Z)
AEU
R
elat
ed e
nter
pris
e Sa
le
24
6,65
5
60.8
0 U
sual
trad
e te
rms
Con
tract
pric
e N
o si
gnifi
cant
diff
eren
ce in
term
s for
rela
ted
parti
es
45
,091
10
0.00
APL
A
EU
Rel
ated
ent
erpr
ise
Sale
106,
733
97
.67
Usu
al tr
ade
term
s C
ontra
ct p
rice
No
sign
ifica
nt d
iffer
ence
in te
rms f
or re
late
d pa
rties
10,0
13
88.3
1
SIoT
(Cay
man
) A
EU
Rel
ated
ent
erpr
ise
Sale
211,
059
39
.78
Usu
al tr
ade
term
s C
ontra
ct p
rice
No
sign
ifica
nt d
iffer
ence
in te
rms f
or re
late
d pa
rties
85,0
87
34.8
8
A
NA
R
elat
ed e
nter
pris
e Sa
le
23
5,88
6
44.4
5 U
sual
trad
e te
rms
Con
tract
pric
e N
o si
gnifi
cant
diff
eren
ce in
term
s for
rela
ted
parti
es
12
5,73
7
25.7
8
Shen
zhen
Cer
mat
e Te
chno
logi
es In
c.
Cer
mat
e R
elat
ed e
nter
pris
e Pu
rcha
se
(1
12,5
81)
(38.
62)
Usu
al tr
ade
term
s C
ontra
ct p
rice
No
sign
ifica
nt d
iffer
ence
in te
rms f
or re
late
d pa
rties
(18,
789)
74
.84
AC
N
AK
MC
Rel
ated
ent
erpr
ise
Purc
hase
(445
,324
) (4
.68)
Usu
al tr
ade
term
s C
ontra
ct p
rice
No
sign
ifica
nt d
iffer
ence
in te
rms f
or re
late
d pa
rties
(52,
060)
2.
92
SI
oT (C
aym
an)
AK
MC
Rel
ated
ent
erpr
ise
Purc
hase
(510
,175
) (12
8.23
) U
sual
trad
e te
rms
Con
tract
pric
e N
o si
gnifi
cant
diff
eren
ce in
term
s for
rela
ted
parti
es
(1
25,3
35)
4.39
LNC
Don
g G
uan
LNC
R
elat
ed e
nter
pris
e Pu
rcha
se
(2
95,2
03)
(77.
47)
Usu
al tr
ade
term
s C
ontra
ct p
rice
No
sign
ifica
nt d
iffer
ence
in te
rms f
or re
late
d pa
rties
(209
,533
) 92
.32
A
iSC
A
CN
R
elat
ed e
nter
pris
e Pu
rcha
se
(1
71,7
87)
(61.
89)
Usu
al tr
ade
term
s C
ontra
ct p
rice
No
sign
ifica
nt d
iffer
ence
in te
rms f
or re
late
d pa
rties
(42,
659)
78
.96
A
EU
B+B
(CZ)
R
elat
ed e
nter
pris
e Pu
rcha
se
(2
46,6
55)
(4.4
3) U
sual
trad
e te
rms
Con
tract
pric
e N
o si
gnifi
cant
diff
eren
ce in
term
s for
rela
ted
parti
es
(4
5,09
1)
3.51
A
PL
Rel
ated
ent
erpr
ise
Purc
hase
(106
,733
) (1
.92)
Usu
al tr
ade
term
s C
ontra
ct p
rice
No
sign
ifica
nt d
iffer
ence
in te
rms f
or re
late
d pa
rties
(10,
013)
0.
78
SIoT
(Cay
man
) R
elat
ed e
nter
pris
e Pu
rcha
se
(2
11,0
59)
(3.7
9) U
sual
trad
e te
rms
Con
tract
pric
e N
o si
gnifi
cant
diff
eren
ce in
term
s for
rela
ted
parti
es
(8
5,08
7)
6.62
AN
A
SIoT
(Cay
man
) R
elat
ed e
nter
pris
e Pu
rcha
se
(2
35,8
86)
(2.2
2) U
sual
trad
e te
rms
Con
tract
pric
e N
o si
gnifi
cant
diff
eren
ce in
term
s for
rela
ted
parti
es
(1
25,7
37)
5.54
Not
e A
: U
nrea
lized
gai
n fo
r the
per
iod
was
$2,
883
thou
sand
. N
ote
B:
All
inte
rcom
pany
gai
ns a
nd lo
sses
from
inve
stm
ent h
ave
been
elim
inat
ed fr
om c
onso
lidat
ion.
(Con
clud
ed)
314

TA
BL
E 6
A
DV
AN
TE
CH
CO
., L
TD
. AN
D S
UB
SID
IAR
IES
RE
CE
IVA
BL
ES
FRO
M R
EL
AT
ED
PA
RT
IES
AM
OU
NT
ING
TO
AT
LEA
ST N
T$1
00 M
ILL
ION
OR
20%
OF
THE
PA
ID-I
N C
API
TA
L FO
R T
HE
YE
AR
EN
DE
D D
EC
EM
BE
R 3
1, 2
018
(In
Tho
usan
ds o
f New
Tai
wan
Dol
lars
, Unl
ess S
tate
d O
ther
wis
e)
Com
pany
Nam
e R
elat
ed P
arty
R
elat
ions
hip
End
ing
Bal
ance
(N
ote
A)
Tur
nove
r R
ate
Ove
rdue
A
mou
nts
Rec
eive
d in
Su
bseq
uent
Pe
riod
Allo
wan
ce fo
r Im
pair
men
t Los
s A
mou
nt
Act
ions
Tak
en
Th
e C
ompa
ny
AC
N
Subs
idia
ry
$
1,4
92,6
06
6.01
$
- -
$
61
7,13
5
$
-
AEU
Su
bsid
iary
95
2,72
1 4.
22
- -
463,
454
-
SIoT
(Cay
man
) Su
bsid
iary
26
6,62
1 4.
56
- -
124,
703
-
AJP
Su
bsid
iary
15
4,81
4 5.
91
- -
33,4
79
-
AK
MC
Subs
idia
ry
409,
917
Not
e 1
- -
173,
925
-
AN
A
Subs
idia
ry
1,90
6,99
3 0.
57
- -
860,
020
-
Adv
anix
s Cor
p.
Subs
idia
ry
139,
159
5.76
-
-
12
2,29
0
-
A
KM
C Th
e C
ompa
ny
Pare
nt c
ompa
ny
1,53
3,44
4 9.
90
- -
1,06
7,27
1
-
LN
C
LNC
Don
g G
uan
Rel
ated
ent
erpr
ise
209,
533
1.53
-
-
11
,323
-
SI
oT (C
aym
an)
AN
A
Rel
ated
ent
erpr
ise
125,
737
0.65
-
-
40
,997
-
A
KM
C SI
oT (C
aym
an)
Rel
ated
ent
erpr
ise
125,
335
8.14
-
-
15
,866
-
N
ote
A:
Sale
s rev
enue
on
mat
eria
ls d
eliv
ered
to su
bcon
tract
ors h
ave
been
elim
inat
ed fr
om c
onso
lidat
ion.
N
ote
B:
All
inte
rcom
pany
gai
ns a
nd lo
sses
from
inve
stm
ent h
ave
been
elim
inat
ed fr
om c
onso
lidat
ion.
315

TA
BL
E 7
A
DV
AN
TE
CH
CO
., L
TD
. AN
D S
UB
SID
IAR
IES
INFO
RM
AT
ION
ON
INV
EST
EE
S FO
R T
HE
YE
AR
EN
DE
D D
EC
EM
BE
R 3
1, 2
018
(In
Tho
usan
ds o
f New
Tai
wan
Dol
lars
/For
eign
Cur
renc
y, U
nles
s Sta
ted
Oth
erw
ise)
Inve
stor
Com
pany
In
vest
ee C
ompa
ny
Loc
atio
n M
ain
Bus
ines
ses a
nd P
rodu
cts
Inve
stm
ent A
mou
nt
Bal
ance
as o
f Dec
embe
r 31
, 201
8 N
et In
com
e (L
oss)
of t
he
Inve
stee
Inve
stm
ent
Gai
n (L
oss)
(N
ote
A)
Not
e D
ecem
ber
31,
2018
D
ecem
ber
31,
2017
Sh
ares
Pe
rcen
tage
of
Ow
ners
hip
Car
ryin
g V
alue
Th
e C
ompa
ny
AA
C (B
VI)
B
VI
Inve
stm
ent a
nd m
anag
emen
t ser
vice
$
2,
332,
397
$
1,00
0,20
7
29,6
23,8
34
100.
00
$
5,93
2,17
0 $
48
2,77
2 $
46
0,15
6 Su
bsid
iary
ATC
B
VI
Sale
of i
ndus
trial
aut
omat
ion
prod
ucts
998,
788
99
8,78
8
33,8
50,0
00
100.
00
3,
718,
200
31
0,45
1
313,
722
Subs
idia
ry
A
dvan
ixs C
orpo
rate
Ta
ipei
, Tai
wan
Pr
oduc
tion
and
sale
of i
ndus
trial
aut
omat
ion
prod
ucts
226,
000
48
6,00
0
36,0
00,0
00
100.
00
23
7,59
3
53,0
65
10
4,31
3 Su
bsid
iary
Adv
ante
ch C
orpo
rate
Inve
stm
ent
Taip
ei, T
aiw
an
Inve
stm
ent h
oldi
ng c
ompa
ny
1,
400,
000
1,
400,
000
15
0,00
0,00
0 10
0.00
1,59
0,32
5
39,8
30
39
,752
Su
bsid
iary
Axi
omte
k Ta
ipei
, Tai
wan
Pr
oduc
tion
and
sale
of i
ndus
trial
aut
omat
ion
prod
ucts
249,
059
24
9,05
9
20,5
37,9
84
25.7
6
619,
411
40
6,92
3
105,
097
Equi
ty-m
eth
inve
stee
Adv
anPO
S Ta
ipei
, Tai
wan
Pr
oduc
tion
and
sale
of P
OS
syst
em
26
6,19
2
460,
572
1,
000,
000
100.
00
29
7,29
6
(370
)
895
Subs
idia
ry (N
ote
A)
LN
C
Taic
hung
, Tai
wan
Pr
oduc
tion
and
sale
of m
achi
nes w
ith c
ompu
teriz
ed
num
eric
al c
ontro
l
304,
865
43
1,63
4
19,2
30,0
00
64.1
0
433,
078
4,
061
3,
069
Subs
idia
ry
Ja
n H
sian
g Ta
ipei
, Tai
wan
El
ectro
nic
parts
and
com
pone
nts m
anuf
actu
ring
3,
719
3,
719
65
5,50
0 28
.50
8,
010
54
54
Equi
ty-m
eth
inve
stee
(Not
e A
)
AM
X
Mex
ico
Sale
of i
ndus
trial
aut
omat
ion
prod
ucts
4,92
2
4,92
2
- 10
0.00
222
63
9
639
Subs
idia
ry (N
ote
A)
A
EUH
H
elm
ond,
the
Net
herla
nds
Inve
stm
ent a
nd m
anag
emen
t ser
vice
1,21
9,12
4
1,21
9,12
4
25,9
61,2
50
100.
00
90
0,79
8
101,
355
10
1,35
5 Su
bsid
iary
ASG
Te
chpl
ace,
Sin
gapo
re
Sale
of i
ndus
trial
aut
omat
ion
prod
ucts
27,1
34
27
,134
1,45
0,00
0 10
0.00
108,
015
18
,154
18,1
54
Subs
idia
ry (N
ote
A)
A
TH
Thai
land
Pr
oduc
tion
of c
ompu
ters
47,7
01
-
51
,000
51
.00
51
,353
6,18
4
2,39
4 Su
bsid
iary
(Not
e A
)
AA
U
Sydn
ey, A
ustra
lia
Sale
of i
ndus
trial
aut
omat
ion
prod
ucts
40,6
00
40
,600
500,
204
100.
00
36
,226
(4,7
29)
(4
,729
) Su
bsid
iary
(Not
e A
)
AJP
To
kyo,
Japa
n Sa
le o
f ind
ustri
al a
utom
atio
n pr
oduc
ts
15
,472
15,4
72
1,
200
100.
00
33
2,22
4
50,4
27
50
,427
Su
bsid
iary
(Not
e A
)
AM
Y
Mal
aysi
a Sa
le o
f ind
ustri
al a
utom
atio
n pr
oduc
ts
35
,140
35,1
40
2,
000,
000
100.
00
68
,499
16,9
37
16
,937
Su
bsid
iary
(Not
e A
)
AK
R
Seou
l, K
orea
Sa
le o
f ind
ustri
al a
utom
atio
n pr
oduc
ts
73
,355
73,3
55
60
0,00
0 10
0.00
322,
524
99
,992
99,9
92
Subs
idia
ry
A
BR
Sa
o Pa
ulo,
Bra
zil
Sale
of i
ndus
trial
aut
omat
ion
prod
ucts
43,2
16
43
,216
1,79
4,99
6 80
.00
67
,328
18,3
54
14
,683
Su
bsid
iary
(Not
e A
)
Adv
ante
ch In
nova
tive
Des
ign
Co.
, Ltd
. Ta
ipei
, Tai
wan
Pr
oduc
t des
ign
10
,000
10,0
00
1,
000,
000
100.
00
10
,066
25
25
Su
bsid
iary
(Not
e A
)
A
iST
Taip
ei, T
aiw
an
Des
ign,
dev
elop
and
sale
of i
ntel
ligen
t ser
vice
s
81,8
37
15
7,91
5
10,0
00,0
00
100.
00
96
,183
458
45
8 Su
bsid
iary
(Not
e A
)
BEM
C
Del
awar
e, U
SA
Sale
of i
ndus
trial
net
wor
k co
mm
unic
atio
ns sy
stem
s
-
1,96
8,04
4
- -
-
-
-
Subs
idia
ry (N
ote
B)
B
+B
Del
awar
e, U
SA
Sale
of i
ndus
trial
net
wor
k co
mm
unic
atio
ns sy
stem
s
1,96
8,04
4
1,96
8,04
4
230,
647
60.0
0
1,95
1,77
2
12,3
67
4,
646
Subs
idia
ry (N
ote
B)
A
IN
Indi
a Sa
le o
f ind
ustri
al a
utom
atio
n pr
oduc
ts
19
,754
19,7
54
3,
999,
999
99.9
9
10,7
14
5,
249
5,
249
Subs
idia
ry (N
ote
A)
A
IMob
ile C
o., L
td.
Taip
ei, T
aiw
an
Des
ign
and
man
ufac
ture
of i
ndus
trial
mob
ile sy
stem
s
135,
000
13
5,00
0
13,5
00,0
00
45.0
0
65,0
12
(4
2,50
6)
(1
9,12
8) E
quity
-met
h in
vest
ee (N
ote
A)
A
KST
G
angw
on-d
o, K
orea
Pr
oduc
tion
and
sale
of i
ntel
ligen
t med
ical
dis
play
83,3
13
83
,313
69,7
40
36.0
0
(27,
036)
(48,
434)
(27,
036)
Sub
sidia
ry (N
ote
A)
W
inm
ate
Taip
ei, T
aiw
an
Embe
dded
Sys
tem
Mod
ules
540,
000
54
0,00
0
12,0
00,0
00
16.6
2
542,
761
8,
562
33
,812
Eq
uity
-met
h in
vest
ee (N
ote
A)
A
VN
H
anoi
, Vie
tnam
Sa
le o
f ind
ustri
al a
utom
atio
n pr
oduc
ts
76
,092
-
8,10
0 60
.00
76
,539
2,38
5
1,07
6 Su
bsid
iary
(Not
e A
)
Nip
pon
RA
D In
c.
Toky
o, Ja
pan
R&
D o
f IoT
inte
llige
nt sy
stem
251,
915
-
85
0,00
0 16
.08
25
2,96
7
38,2
77
1,
556
Equi
ty-m
eth
inve
stee
AR
U
Mos
cow
, Rus
sia
Prod
uctio
n an
d sa
le o
f ind
ustri
al a
utom
atio
n pr
oduc
ts
23
,822
-
500,
000
100.
00
21
,402
(655
)
(655
) Su
bsid
iary
(Not
e A
)
A
KR
A
KST
G
angw
on-d
o, K
orea
Pr
oduc
tion
and
sale
of i
ntel
ligen
t med
ical
dis
play
55,5
79
55
,579
22,0
23
24.0
0
-
(48,
434)
- Su
bsid
iary
(Not
e A
)
A
dvan
tech
Cor
pora
te In
vest
men
t C
erm
ate
Taip
ei, T
aiw
an
Man
ufac
turin
g of
ele
ctro
nic
parts
, com
pute
r, an
d pe
riphe
ral d
evic
es
71
,500
71,5
00
5,
500,
000
55.0
0
128,
046
33
,408
18,2
97
Subs
idia
ry
D
enen
g
Taic
hung
, Tai
wan
In
stal
lmen
t and
sale
of e
lect
roni
c co
mpo
nent
s and
so
ftwar
e
18,0
95
18
,095
658,
000
39.6
9
14,1
00
(3
,419
)
(1,3
57)
Equi
ty-m
eth
inve
stee
(Not
e A
)
C
DIB
Inno
vatio
n A
ccel
erat
or
Co.
, Ltd
. Ta
ipei
, Tai
wan
In
vest
men
t hol
ding
com
pany
150,
000
75
,000
7,50
0,00
0 17
.86
14
7,10
9
(30,
213)
(5,3
95)
Equi
ty-m
eth
inve
stee
(Not
e A
)
A
zure
Wav
e Te
chno
logi
es, I
nc.
Taip
ei, T
aiw
an
Wire
less
com
mun
icat
ion
and
digi
tal i
mag
e m
odul
e m
anuf
actu
ring
and
tradi
ng
57
8,56
3
-
27,8
10,0
00
18.4
2
534,
780
(1
18,4
27)
(1
6,32
3) E
quity
-met
h in
vest
ee (N
ote
A)
H
uan
Yan
, Jhi
h-Li
an C
o., L
td.
Taip
ei, T
aiw
an
Com
bina
tion
of w
ater
trea
tmen
t rel
ated
tech
nolo
gies
an
d In
tern
et o
f Thi
ngs a
pplic
atio
ns
5,
000
-
50
0,00
0 50
.00
4,
971
(5
8)
(2
9) S
ubsid
iary
(Not
e A
)
Y
un Y
an, W
u-Li
an C
o., L
td
Taip
ei, T
aiw
an
Indu
stria
l equ
ipm
ent N
etw
orki
ng in
Gre
ater
Chi
na
5,
000
-
50
0,00
0 50
.00
3,
066
(3
,868
)
(1,9
34)
Subs
idia
ry (N
ote
A)
N
ippo
n R
AD
To
kyo,
Japa
n R
&D
of I
oT in
telli
gent
syst
em
49
,733
-
154,
310
2.92
45,7
33
38
,277
- Eq
uity
-met
h in
vest
ee
i-L
ink
Co.
, Ltd
Ta
ichu
ng, T
aiw
an
Inte
llige
nt m
edic
al in
tegr
atio
n
10,0
67
-
1,
000,
000
25.0
0
9,40
7
(38,
020)
(660
) Eq
uity
-met
h in
vest
ee (N
ote
A)
D
otZe
ro C
o., L
td
Taic
hung
, Tai
wan
In
telli
gent
met
al p
roce
ssin
g in
tegr
atio
n
4,90
0
-
490,
000
49.0
0
4,62
9
(554
)
(271
) Eq
uity
-met
h in
vest
ee (N
ote
A)
M
ildex
Opt
ical
Inc.
K
aohs
iung
, Tai
wan
M
anuf
actu
ring
of e
lect
roni
c pa
rts
20
2,94
8
-
15,7
08,4
50
15.0
0
183,
210
(4
3,12
0)
(1
,724
) Eq
uity
-met
h in
vest
ee (N
ote
A)
A
TC
ATC
(HK
) H
ong
Kon
g In
vest
men
t and
man
agem
ent s
ervi
ce
1,
212,
730
1,
212,
730
57
,890
,679
10
0.00
3,78
0,77
6
355,
324
35
8,59
5 Su
bsid
iary
(C
ontin
ued)
316

Inve
stor
Com
pany
In
vest
ee C
ompa
ny
Loc
atio
n M
ain
Bus
ines
ses a
nd P
rodu
cts
Inve
stm
ent A
mou
nt
Bal
ance
as o
f Dec
embe
r 31
, 201
8 N
et In
com
e (L
oss)
of t
he
Inve
stee
Inve
stm
ent
Gai
n (L
oss)
(N
ote
A)
Not
e D
ecem
ber
31,
2018
D
ecem
ber
31,
2017
Sh
ares
Pe
rcen
tage
of
Ow
ners
hip
Car
ryin
g V
alue
A
AC
(BV
I)
AN
A
Sunn
yval
e, U
SA
Sale
and
fabr
icat
ion
of in
dust
rial a
utom
atio
n pr
oduc
ts
$ 50
4,17
9 $
50
4,17
9
10,9
52,6
06
100.
00
$
2,72
7,35
4 $
22
0,59
8 $
22
1,54
4 Su
bsid
iary
AA
C (H
K)
Hon
g K
ong
Inve
stm
ent a
nd m
anag
emen
t ser
vice
539,
146
53
9,14
6
15,2
30,0
01
100.
00
1,
893,
119
12
7,61
1
127,
222
Subs
idia
ry
SI
oT (C
aym
an)
Cay
man
D
esig
n, d
evel
opm
ent a
nd sa
le o
f IoT
inte
llige
nt
syst
em se
rvic
es
US$
50
,000
-
30,0
00,0
00
100.
00
1,
642,
558
13
6,66
6
121,
748
Subs
idia
ry (N
ote
A)
SIoT
(Cay
man
) A
-DLo
G
Mun
ich,
Ger
man
y D
esig
n, R
&D
and
sale
of i
ndus
trial
aut
omat
ion
vehi
cles
and
rela
ted
prod
ucts
522,
719
-
1
100.
00
54
1,84
7
81,5
12
22
,574
Su
bsid
iary
AN
A
BEM
C
Del
awar
e, U
SA
Sale
of i
ndus
trial
net
wor
k co
mm
unic
atio
ns sy
stem
s
-
1,32
8,00
4
- -
-
-
-
Subs
idia
ry
B
+B
Del
awar
e, U
SA
Sale
of i
ndus
trial
net
wor
k co
mm
unic
atio
ns sy
stem
s
1,32
8,00
4
-
153,
765
40.0
0
5,04
0
12,3
67
4,
947
Subs
idia
ry
AEU
H
AEU
Ei
ndho
ven,
The
Net
herla
nds
Sale
of i
ndus
trial
aut
omat
ion
prod
ucts
431,
963
43
1,96
3
32,3
15,2
15
100.
00
1,
035,
770
96
,894
96,8
94
Subs
idia
ry
A
PL
War
saw
, Pol
and
Sale
of i
ndus
trial
aut
omat
ion
prod
ucts
14,1
76
14
,176
6,35
0 10
0.00
31,7
31
4,
982
4,
982
Subs
idia
ry (N
ote
A)
AEU
A
-DLo
G
Mun
ich,
Ger
man
y D
esig
n, R
&D
and
sale
of i
ndus
trial
aut
omat
ion
vehi
cles
and
rela
ted
prod
ucts
-
553,
536
-
-
-
81,5
12
50
,684
Su
bsid
iary
ASG
A
TH
Thai
land
Pr
oduc
tion
of c
ompu
ters
7,53
7
7,53
7
49,0
00
49.0
0
50,4
12
6,
184
3,
060
Subs
idia
ry (N
ote
A)
A
ID
Indo
nesi
a Sa
le o
f ind
ustri
al a
utom
atio
n pr
oduc
ts
4,
797
4,
797
30
0,00
0 10
0.00
8,64
0
3,56
5
3,56
5 Su
bsid
iary
(Not
e A
)
C
erm
ate
Land
Mar
k B
VI
Gen
eral
inve
stm
ent
28
,200
28,2
00
97
2,28
4 10
0.00
109,
970
29
,488
28,8
05
Subs
idia
ry (N
ote
A)
LNC
B
ette
r Aut
o B
VI
Gen
eral
inve
stm
ent
24
4,61
5
244,
615
8,
556,
096
100.
00
36
,137
(13,
003)
(13,
127)
Sub
sidia
ry
Bet
ter A
uto
Fam
ous N
ow
BV
I G
ener
al in
vest
men
t U
S$
4,00
0 U
S$
4,00
0
1 10
0.00
28,8
75
(1
2,84
5)
(1
2,84
5) S
ubsid
iary
B
EMC
A
vtek
D
elaw
are,
USA
Sa
le o
f ind
ustri
al n
etw
ork
com
mun
icat
ions
syst
ems
-
US$
99
,850
- -
-
-
-
Subs
idia
ry (N
ote
A a
nd B
)
A
vtek
B
+B
Del
awar
e, U
SA
Sale
of i
ndus
trial
net
wor
k co
mm
unic
atio
ns sy
stem
s
- U
S$
99,8
50
-
-
-
-
- Su
bsid
iary
(Not
e A
and
B)
B+B
B
BI
Irel
and
Sale
of i
ndus
trial
net
wor
k co
mm
unic
atio
ns sy
stem
s U
S$
39,4
81
US$
39
,481
- 10
0.00
103,
431
(1
4,93
6)
(1
4,93
6) S
ubsid
iary
IMC
D
elaw
are,
USA
Sa
le o
f ind
ustri
al n
etw
ork
com
mun
icat
ions
syst
ems
-
-
-
100.
00
-
-
-
Subs
idia
ry
BB
I B
&B
Ele
ctro
nics
D
elaw
are,
USA
Sa
le o
f ind
ustri
al n
etw
ork
com
mun
icat
ions
syst
ems
US$
1,
314
US$
1,
314
-
100.
00
-
-
-
Subs
idia
ry
B
+B (C
Z)
Cze
ch R
epub
lic
Man
ufac
turin
g au
tom
atio
n
-
-
- 99
.99
29
1,36
4
63,4
95
63
,495
Su
bsid
iary
Con
el A
utom
atio
n C
zech
Rep
ublic
Sa
le o
f ind
ustri
al n
etw
ork
com
mun
icat
ions
syst
ems
-
-
-
1.00
(85)
(15,
773)
(158
) Su
bsid
iary
B&
B D
MC
C
Dub
ai
Sale
of i
ndus
trial
net
wor
k co
mm
unic
atio
ns sy
stem
s
-
-
- 10
0.00
1,69
0
1,72
3
1,72
3 Su
bsid
iary
B
&B
Ele
ctro
nics
B
+B (C
Z)
Cze
ch R
epub
lic
Man
ufac
turin
g au
tom
atio
n
-
-
- 0.
01
-
63
,495
- Su
bsid
iary
B
+B (C
Z)
Con
el A
utom
atio
n C
zech
Rep
ublic
Sa
le o
f ind
ustri
al n
etw
ork
com
mun
icat
ions
syst
ems
-
-
-
99.0
0
(8,4
56)
(1
5,77
3)
(1
5,61
5) S
ubsid
iary
N
ote
A:
The
resp
ectiv
e en
tity
is a
n im
mat
eria
l sub
sidi
ary;
its f
inan
cial
stat
emen
ts h
ave
not b
een
audi
ted,
whi
ch d
oes n
ot re
sult
in a
sign
ifica
nt im
pact
on
the
Gro
up’s
con
solid
ated
fina
ncia
l sta
tem
ents
. N
ote
B:
Due
to o
rgan
izat
iona
l res
trict
ing,
BEM
C h
as b
een
clea
red
afte
r liq
uida
tion.
The
par
ent c
ompa
ny w
ill d
irect
ly h
old
B+B
. N
ote
C:
All
inte
rcom
pany
gai
ns a
nd lo
sses
from
inve
stm
ent h
ave
been
elim
inat
ed fr
om c
onso
lidat
ion.
N
ote
D:
Ref
er to
Tab
le 8
for i
nves
tmen
ts in
mai
nlan
d C
hina
.
(Con
clud
ed)
317

TA
BL
E 8
A
DV
AN
TE
CH
CO
., L
TD
. AN
D S
UB
SID
IAR
IES
INV
EST
ME
NT
S IN
MA
INL
AN
D C
HIN
A
FOR
TH
E Y
EA
R E
ND
ED
DE
CE
MB
ER
31,
201
8 (I
n T
hous
ands
of N
ew T
aiw
an D
olla
rs, U
nles
s Sta
ted
Oth
erw
ise)
Inve
stee
Com
pany
Nam
e M
ain
Bus
ines
ses a
nd
Prod
ucts
Tot
al A
mou
nt
of P
aid-
in
Cap
ital
Inve
stm
ent
Typ
e (e
.g.,
Dir
ect o
r In
dire
ct)
Acc
umul
ated
O
utflo
w o
f In
vest
men
t fr
om T
aiw
an
as o
f Ja
nuar
y 1,
201
8
Inve
stm
ent F
low
s A
ccum
ulat
ed
Out
flow
of
Inve
stm
ent
from
Tai
wan
as
of
Dec
embe
r 31
, 20
18
Net
Inco
me
(Los
s) o
f the
In
vest
ee
%
Ow
ners
hip
of
Dir
ect o
r In
dire
ct
Inve
stm
ent
Inve
stm
ent
Gai
n (L
oss)
(N
ote
A)
Car
ryin
g
Val
ue a
s of
Dec
embe
r 31
, 20
18
Acc
umul
ated
In
war
d R
emitt
ance
of
Ear
ning
s as o
f D
ecem
ber
31,
2018
Out
flow
In
flow
A
dvan
tech
Tec
hnol
ogy
(Chi
na)
Com
pany
Ltd
. (“A
KM
C”)
Pr
oduc
tion
and
sale
of
co
mpo
nent
s of
indu
stria
l aut
omat
ion
prod
ucts
US$
43
,750
thou
sand
(Not
e F)
Indi
rect
$
1,
145,
670
(U
S$
37,3
00
th
ousa
nd)
$
- $
-
$
1,14
5,67
0 (
US$
37
,300
thou
sand
)
$
365,
352
100
$
368,
623
$
3,78
0,77
6 $
-
B
eijin
g Y
an H
ua X
ing
Ye
Elec
troni
c Sc
ienc
e &
Te
chno
logy
Co.
, Ltd
. (“
AC
N”)
Sale
of i
ndus
trial
au
tom
atio
n pr
oduc
ts U
S$
4,23
0
thou
sand
In
dire
ct
16
3,77
2 (
US$
5,
332
th
ousa
nd)
-
-
16
3,77
2 (
US$
5,
332
th
ousa
nd)
13
7,41
8 10
0
136,
986
1,
203,
575
US$
11
,232
thou
sand
Sh
angh
ai A
dvan
tech
Inte
llige
nt
Serv
ices
Co.
, Ltd
. (“A
iSC
”)
Prod
uctio
n an
d sa
le o
f in
dust
rial a
utom
atio
n pr
oduc
ts
US$
8,
000
th
ousa
nd
Indi
rect
245,
720
(U
S$
8,00
0
thou
sand
)
-
-
24
5,72
0 (
US$
8,
000
th
ousa
nd)
(1
7,00
3)
100
(1
6,95
9)
66
3,66
2
-
X
i’an
Adv
ante
ch S
oftw
are
Ltd.
(“
AX
A”)
D
evel
opm
ent a
nd
prod
uctio
n of
so
ftwar
e pr
oduc
ts
US$
1,
000
th
ousa
nd
Indi
rect
(Not
e C)
-
-
(Not
e C)
13
100
13
(Not
e A
)
29,8
87
-
H
angz
hou
Adv
anto
fine
Aut
omat
ion
Tech
. Co.
, Ltd
. Pr
oces
sing
and
sale
of
in
dust
rial a
utom
atio
n pr
oduc
ts
RM
B
3,00
0
thou
sand
In
dire
ct
(N
ote
D)
-
-
(N
ote
D)
(3
20)
-
(320
)
(Not
e A
)
-
-
A
dvan
ixs K
un S
han
Cor
p.
Prod
uctio
n an
d sa
le o
f
indu
stria
l aut
omat
ion
prod
ucts
RM
B
99,5
15
th
ousa
nd
Indi
rect
(Not
e G
)
-
-
(Not
e G
)
- -
-
-
-
LN
C D
ong
Gua
n C
o., L
td.
Prod
uctio
n an
d sa
le o
f in
dust
rial a
utom
atio
n pr
oduc
ts
US$
4,
000
th
ousa
nd
Indi
rect
98,1
04
(U
S$
3,19
4
thou
sand
)
-
-
98
,104
(
US$
3,
194
th
ousa
nd)
(1
3,00
4)
100
(1
2,88
0)
28
,993
-
Sh
enzh
en C
erm
ate
Tech
nolo
gies
Inc.
Pr
oduc
tion
and
sale
of
H
uman
Mac
hine
In
terf
ace
RM
B
2,00
0
thou
sand
In
dire
ct
9,
460
(U
S$
308
th
ousa
nd)
-
-
9,
460
(U
S$
308
th
ousa
nd)
29
,348
90
27,0
95
80
,552
U
S$
717
th
ousa
nd
RM
B
1,74
3
thou
sand
)
(Con
tinue
d)
318

Inve
stee
Com
pany
Nam
e M
ain
Bus
ines
ses a
nd
Prod
ucts
Tot
al A
mou
nt
of P
aid-
in
Cap
ital
Inve
stm
ent
Typ
e (e
.g.,
Dir
ect o
r In
dire
ct)
Acc
umul
ated
O
utflo
w o
f In
vest
men
t fr
om T
aiw
an
as o
f Ja
nuar
y 1,
201
8
Inve
stm
ent F
low
s A
ccum
ulat
ed
Out
flow
of
Inve
stm
ent
from
Tai
wan
as
of
Dec
embe
r 31
, 20
18
Net
Inco
me
(Los
s) o
f the
In
vest
ee
%
Ow
ners
hip
of
Dir
ect o
r In
dire
ct
Inve
stm
ent
Inve
stm
ent
Gai
n (L
oss)
(N
ote
A)
Car
ryin
g
Val
ue a
s of
Dec
embe
r 31
, 20
18
Acc
umul
ated
In
war
d R
emitt
ance
of
Ear
ning
s as o
f D
ecem
ber
31,
2018
Out
flow
In
flow
C
erm
ate
Tech
nolo
gies
(S
hang
hai)
Inc.
(“C
erm
ate
Shan
ghai
”)
Sale
of H
uman
M
achi
ne In
terf
ace
U
S$
520
th
ousa
nd
Indi
rect
$
17
,569
(
US$
57
2
thou
sand
)
$
- $
-
$
17,5
69
(U
S$
572
th
ousa
nd)
$
3,07
4 10
0 $
3,
074
(N
ote
A)
$
30,6
54
$
-
A
dvan
tech
Ser
vice
-IoT
(Sha
ngha
i) C
o., L
td. (
“Sio
T (C
hina
)”)
Dev
elop
men
t, co
nsul
ting
and
serv
ices
in
inte
llige
nt
tech
nolo
gy
RM
B
15,0
00
th
ousa
nd
Indi
rect
(Not
e H
)
-
-
(Not
e H
)
(6,5
84)
100
(6
,584
)
(Not
e A
)
59,9
19
-
Sh
angh
ai Y
anlo
Co.
, Ltd
. (“
Yan
lo”)
R
etai
l of i
ntel
ligen
t te
chno
logy
R
MB
22
,000
thou
sand
O
ther
(Not
e I)
-
-
(N
ote
I)
(58)
45
(26)
(Not
e A
)
4,39
3
-
Acc
umul
ated
Inve
stm
ent i
n M
ainl
and
Chi
na a
s of
D
ecem
ber
31, 2
018
Inve
stm
ent A
mou
nts
A
utho
rize
d by
Inve
stm
ent
C
omm
issi
on, M
OE
A
Allo
wab
le L
imit
on In
vest
men
t
$1
,686
,438
(U
S$54
,906
thou
sand
) (N
ote
E)
$2,9
02,3
21
(US$
94,4
92 th
ousa
nd)
$17,
724,
352
(Not
e K
)
N
ote
A:
The
resp
ectiv
e en
tity
is a
n im
mat
eria
l sub
sidi
ary;
its f
inan
cial
stat
emen
ts h
ave
not b
een
audi
ted,
whi
ch d
oes n
ot re
sult
in a
sign
ifica
nt im
pact
on
the
Gro
up’s
con
solid
ated
fina
ncia
l sta
tem
ents
. N
ote
B:
The
sign
ifica
nt e
vent
s, pr
ices
, pay
men
t ter
ms a
nd u
nrea
lized
gai
ns o
r los
ses g
ener
ated
on
tradi
ng b
etw
een
the
Com
pany
and
its i
nves
tees
in M
ainl
and
Chi
na a
re d
escr
ibed
in T
able
s 5 a
nd 6
. N
ote
C:
Rem
ittan
ce b
y A
CN
. N
ote
D:
In th
e fir
st q
uarte
r of 2
018,
Han
gzho
u A
dvan
tofin
e A
utom
atio
n C
o., L
td. w
as li
quid
ated
. N
ote
E:
Incl
uded
is th
e ou
tflow
of U
S$20
0 th
ousa
nd o
n th
e in
vest
men
t in
Yan
Hua
(Gua
ng Z
hou
Bao
Shu
i Qu)
Co.
, Ltd
. loc
ated
in a
free
trad
e zo
ne in
Gua
ng Z
hou.
Whe
n th
is in
vest
ee w
as li
quid
ated
in S
epte
mbe
r 200
5, th
e ou
twar
d in
vest
men
t re
mitt
ance
cea
sed
upon
the
appr
oval
of t
he M
inis
try o
f Eco
nom
ic A
ffai
rs (M
OEA
). Fo
r eac
h fu
ture
cap
ital r
etur
n, th
e C
ompa
ny w
ill a
pply
to th
e M
OEA
for t
he a
ppro
val o
f the
retu
rn a
s wel
l as r
educ
e th
e ac
cum
ulat
ed in
vest
men
t am
ount
by
the
retu
rn a
mou
nt.
Not
e F:
Fo
r AK
MC
, the
re w
as a
cap
ital i
ncre
ase
of U
S$6,
450
thou
sand
out
of e
arni
ngs.
N
ote
G:
In th
e se
cond
qua
rter o
f 201
8, A
dvan
ixs K
un S
han
Cor
p. w
as a
cqui
red
by A
KM
C, A
dvan
ixs K
un S
han
Cor
p. w
as li
quid
ated
.
Not
e H
: R
emitt
ance
by
AA
C (B
VI)
and
AiS
C.
Not
e I:
Rem
ittan
ce b
y A
iSC
; AiS
C’s i
nves
tmen
ts in
ass
ocia
te a
ccou
nted
for u
sing
the
equi
ty m
etho
d.
Not
e J:
Th
e ex
chan
ge ra
te w
as U
S$1=
NT$
30.7
15 a
nd R
MB
1=N
T$4.
472.
(C
ontin
ued)
319

Not
e K
: Th
e m
axim
um a
llow
able
lim
it on
inve
stm
ent w
as a
t 60%
of t
he c
onso
lidat
ed n
et a
sset
val
ue o
f the
Com
pany
. N
ote
L:
All
inte
rcom
pany
gai
ns a
nd lo
sses
from
inve
stm
ent h
ave
been
elim
inat
ed fr
om c
onso
lidat
ion.
(Con
clud
ed)
320

TABLE 9 ADVANTECH CO., LTD. AND SUBSIDIARIES ORGANIZATION CHART DECEMBER 31, 2018 AND 2017 Intercompany relationships and percentages of ownership as of December 31, 2018 are shown below:
(Continued)
Advantech Co., Ltd.
(the Company)
Advantech Technology (China) Company Ltd. (“AKMC”)
B&B SmartWorx DMCC (“B&B DMCC”)
Advantech B+B SmartWorx s.r.o. CZ (“B+B (CZ)”)
B&B Electronics Holdings LLC (“B&B Electronics”)
Xi’an Advantech Software Ltd. (“AXA”)
DLOG Gesellschaft für elektronische Datentechnik mbH
(“A-DLoG”)
Landmark Co., Ltd. (“Landmark”)
Cermate Technologies (Shanghai) Inc.
(“Cermate (Shanghai)”)
Shenzhen Cermate Technologies Inc.
(“Cermate (Shenzhen)”)
Conel Automation s.r.o. CZ (“Conel Automation”)
100% Advantech Australia Pty Ltd. (“AAU”)
B+B SmartWorx Inc. (“B+B”) 60%
Advantech Brasil Ltd (“ABR”)
100%
40%
0.01%
99%
B+B SmartWorx Limited (“BBI”)
B&B IMC. LLC (“IMC”) 100%
100%
99.99%
100%
Advantech Electronics, S. De R.L. De C.V. (“AMX”)
100% 100% 100% Advantech Technology Co., Ltd. (“ATC”)
100%
100% Advantech Europe Holding B.V. (“AEUH”)
100% Advantech KR Co., Ltd. (“AKR”)
100% Advantech Co., Singapore Pte, Ltd.
(“ASG”)
Advantech Europe B.V. (“AEU”)
Advantech Poland Sp z o.o. (“APL”)
100% 100%
100%
100% Advantech Intelligent Service (“AiST”)
HK Advantech Technology Co., Ltd. ATC (HK)
Advantech Corporate Investment 55% Cermate Technologies Inc. (“Cermate”)
100%
100%
90%
Advantech Innovative Design Co., Ltd. 100%
80%
1%
100%
100%
100%
49% Advantech Corporation (Thailand) Co., Ltd. (“ATH”)
Advantech International, PT. (“AID”) 100%
100%
100%
100% Advantech Automation Corp. (HK)
Limited (“AAC (HK)”)
100%
100%
100%
Advantech Automation Corp. (BVI) (“AAC (BVI”))
Advantech Corp. (“ANA”)
Beijing Yan Hua Xing Ye Electronic Science & Technology Co., Ltd. (“ACN”)
Shanghai Advantech Intelligent Services Co., Ltd. (“AiSC”)
Yun Yan, Wu-Lian Co., Ltd.
100% Advanixs Corp.
100% Advantech Co. Malaysia Sdn. Bhd (“AMY”)
100% AdvanPOS Technology Co., Ltd. (“AdvanPOS”)
Advantech Industrial Computing India Private Limited (“AIN”)
99.99%
Huan Yan, Jhih-Lian Co., Ltd. 50%
50%
100% Advantech Japan Co., Ltd. (“AJP”)
76% Advantech Kostec Co., Ltd.
(“AKST”) Advantech Kostec Co., Ltd. (“AKST”)
Advantech Service IoT Holding Ltd. (“SIoT Cayman”)
Advantech Service-IoT (Shanghai) Co., Ltd.
(“SIoT China”) 99%
100% 64.10% LNC Technology Co., Ltd. (“LNC”) Better Auto Holdings Limited (“Better Auto”)
100% Famous Now Limited
(“Famous Now”)
LNC Dong Guan Co., Ltd
100% Advantech Corporation (Thailand) Co., Ltd. (“ATH”)
51%
60% Advantech Vietnam Technology Company Limited (“AVN”)
24%
1%
100% Advantech Technology Limited Liability Company (ARU)
321

Intercompany relationships and percentages of ownership as of December 31, 2017 are shown below:
(Concluded)
Advantech Technology (China) Company Ltd. (AKMC)
B&B SmartWorx DMCC (B&B DMCC)
Advantech B+B SmartWorx s.r.o. CZ (B+B (CZ))
B&B Electronics Holdings LLC (B&B Electronics)
Hangzhou Advantofine Automation Tech. Co., Ltd.
DLOG Gesellschaft für elektronische Datentechnik mbH
(A-DLoG)
Landmark Co., Ltd. (Landmark)
Cermate Technologies (Shanghai) Inc.
(Cermate (Shanghai))
Shenzhen Cermate Technologies Inc.
(Cermate (Shenzhen))
Conel Automation s.r.o. CZ (Conel Automation)
Advanixs Kun Shan Corp. (formerly Yeh-Chiang
Technology Kun Shan Co., Ltd.)
24%
100% Advantech Australia Pty Ltd. (AAU)
BEMC Holdings Corporation (BEMC)
Avtek Corporation (Avtek)
60%
Advantech Brasil Ltd (ABR)
100%
B+B SmartWorx Inc. (B+B)
40%
0.01%
99%Quatech, LLC (Quatech)
B+B SmartWorx Limited (BBI)
B&B IMC. LLC (IMC) 100%
100%
99.99%
100%
Advantech Co., Ltd.
(the Company)
Advantech Electronics, S. De R.L. De C.V. (AMX)
100% 100% 100% Advantech Technology Co., Ltd. (ATC)
100%
100% Advantech Europe Holding B.V. (AEUH)
100% Advantech KR Co., Ltd. (AKR)
100% Advantech Co., Singapore Pte, Ltd. (ASG)
Advantech Europe B.V. (AEU)
Advantech Poland Sp z o.o. (APL)
100% 100%
100%
100% Advantech Intelligent Service (AiST)
100% Advantech Japan Co., Ltd. (AJP)
HK Advantech Technology Co., Ltd. ATC (HK)
Advantech Corporate Investment 55% Cermate Technologies Inc. (Cermate)
100%
100%
90%
Advantech Innovative Design Co., Ltd. 100%
80%
100% 1%
100%
100%
100%
100%
100%
51% Advantech Corporation (Thailand) Co., Ltd. (ATH)
Advantech International, PT. (AID) 100%
100%
100%
100% Advantech Automation Corp. (HK)
Limited (AAC (HK))
100%
100%
100%
Advantech Automation Corp. (BVI) (AAC (BVI))
Advantech Corp. (ANA)
Beijing Yan Hua Xing Ye Electronic Science & Technology Co., Ltd. (ACN)
Shanghai Advantech Intelligent Services Co., Ltd. (AiSC)
Xi’an Advantech Software Ltd. (AXA)
100% Advanixs Corp.
100% Advantech Co. Malaysia Sdn. Bhd (AMY)
100%81.17%
100%
Advantech-LNC Technology Co., Ltd. (ALNC)
AdvanPOS Technology Co., Ltd. (AdvanPOS)
Better Auto Holdings Limited (Better Auto)
Advantech Industrial Computing India Private Limited (AIN)
99.99%
100% Famous Now Limited
(Famous Now)
Advantech LNC Dong Guan Co., Ltd.
100%
36% Kostec Co., Ltd.
(AKST) 24%
Kostec Co., Ltd.
322

TA
BL
E 1
0 A
DV
AN
TE
CH
CO
., L
TD
. AN
D S
UB
SID
IAR
IES
SIG
NIF
ICA
NT
TR
AN
SAC
TIO
NS
BE
TW
EE
N A
DV
AN
TE
CH
CO
., L
TD
. AN
D S
UB
SID
IAR
IES
FOR
TH
E Y
EA
R E
ND
ED
DE
CE
MB
ER
31,
201
8 (I
n T
hous
ands
of N
ew T
aiw
an D
olla
rs, U
nles
s Sta
ted
Oth
erw
ise)
N
umbe
r (N
ote
A)
Com
pany
Nam
e C
ount
erpa
rty
Flow
of
Tra
nsac
tion
(Not
es B
and
D)
Tra
nsac
tion
Det
ails
Fina
ncia
l Sta
tem
ent A
ccou
nt
Am
ount
Pa
ymen
t Ter
ms
% o
f Con
solid
ated
A
sset
s/R
even
ue
(Not
e C
)
0
The
Com
pany
A
AC
(HK
) 1
Oth
er re
ceiv
able
s fro
m re
late
d pa
rties
$
48
45
day
s EO
M
-
A
AU
1
Sale
s rev
enue
233,
477
Nor
mal
-
AA
U
1 R
ecei
vabl
es fr
om re
late
d pa
rties
40,9
45
60-9
0 da
ys
-
A
AU
1
Oth
er re
venu
e
2,37
2 N
orm
al
-
A
AU
1
Oth
er re
ceiv
able
s fro
m re
late
d pa
rties
1,01
2 60
-90
days
-
AB
R
1 Sa
les r
even
ue
12
1,74
5 N
orm
al
-
A
BR
1
Rec
eiva
bles
from
rela
ted
parti
es
24
,379
90
day
s EO
M
-
A
BR
1
Oth
er re
venu
e
3,64
1 N
orm
al
-
A
BR
1
Oth
er re
ceiv
able
s fro
m re
late
d pa
rties
961
90 d
ays E
OM
-
AC
N
1 R
ecei
vabl
es fr
om re
late
d pa
rties
1,49
2,60
6 45
day
s EO
M
3
A
CN
1
Oth
er re
ceiv
able
s fro
m re
late
d pa
rties
92
45 d
ays E
OM
-
AC
N
1 Sa
les r
even
ue
7,
382,
801
Nor
mal
15
A
-DLo
G
1 Sa
les r
even
ue
60
8,33
9 N
orm
al
10
A-D
LoG
1
Rec
eiva
bles
from
rela
ted
parti
es
54
,615
30
day
s afte
r inv
oice
dat
e -
A-D
LoG
1
Oth
er re
venu
e
4,26
5 N
orm
al
-
A
-DLo
G
1 O
ther
rece
ivab
les f
rom
rela
ted
parti
es
1,
850
30 d
ays a
fter i
nvoi
ce d
ate
-
A
EU
1 Sa
les r
even
ue
4,
889,
200
Nor
mal
10
A
EU
1 R
ecei
vabl
es fr
om re
late
d pa
rties
952,
721
30 d
ays E
OM
2
AEU
1
Oth
er re
venu
e
28,9
41
Nor
mal
-
AEU
1
Oth
er re
ceiv
able
s fro
m re
late
d pa
rties
10,1
76
30 d
ays E
OM
-
AID
1
Sale
s rev
enue
23,7
31
Nor
mal
-
AID
1
Rec
eiva
bles
from
rela
ted
parti
es
3,
350
45 d
ays a
fter i
nvoi
ce d
ate
-
A
ID
1 O
ther
rece
ivab
les f
rom
rela
ted
parti
es
15
1 45
day
s afte
r inv
oice
dat
e -
AID
1
Oth
er re
venu
e
1,27
9 N
orm
al
-
A
IN
1 Sa
les r
even
ue
11
4,06
3 N
orm
al
-
A
IN
1 R
ecei
vabl
es fr
om re
late
d pa
rties
53,7
91
60 d
ays E
OM
-
AIN
1
Oth
er re
venu
e
64
Nor
mal
-
AIN
1
Oth
er re
ceiv
able
s fro
m re
late
d pa
rties
38
60 d
ays E
OM
-
AiS
C
1 Sa
les r
even
ue
59
,358
N
orm
al
-
A
JP
1 Sa
les r
even
ue
90
5,02
5 N
orm
al
2
A
JP
1 R
ecei
vabl
es fr
om re
late
d pa
rties
154,
814
60-9
0 da
ys
-
A
JP
1 O
ther
reve
nue
6,
493
Nor
mal
-
AJP
1
Oth
er re
ceiv
able
s fro
m re
late
d pa
rties
1,47
7 60
-90
days
-
(Con
tinue
d)
323

Num
ber
(Not
e A
) C
ompa
ny N
ame
Cou
nter
part
y Fl
ow o
f T
rans
actio
n (N
otes
B a
nd D
)
Tra
nsac
tion
Det
ails
Fina
ncia
l Sta
tem
ent A
ccou
nt
Am
ount
Pa
ymen
t Ter
ms
% o
f Con
solid
ated
A
sset
s/R
even
ue
(Not
e C
)
A
KM
C
1 R
ecei
vabl
es fr
om re
late
d pa
rties
$
40
9,91
7 45
day
s EO
M
1
A
KM
C
1 O
ther
rece
ivab
les f
rom
rela
ted
parti
es
44
45
day
s EO
M
-
A
KR
1
Sale
s rev
enue
997,
566
Nor
mal
2
AK
R
1 R
ecei
vabl
es fr
om re
late
d pa
rties
64,9
83
60 d
ays a
fter i
nvoi
ce d
ate
-
A
KR
1
Oth
er re
venu
e
8,83
9 N
orm
al
-
A
KR
1
Oth
er re
ceiv
able
s fro
m re
late
d pa
rties
2,37
4 60
day
s afte
r inv
oice
dat
e -
AK
ST
1 Sa
les r
even
ue
21
,224
30
day
s EO
M
-
A
MX
1
Oth
er re
venu
e
5,97
5 N
orm
al
-
A
MY
1
Sale
s rev
enue
139,
369
Nor
mal
-
AM
Y
1 R
ecei
vabl
es fr
om re
late
d pa
rties
11,0
28
45 d
ays E
OM
-
AM
Y
1 O
ther
reve
nue
1,
887
Nor
mal
-
AM
Y
1 O
ther
rece
ivab
les f
rom
rela
ted
parti
es
36
9 45
day
s EO
M
-
A
NA
1
Rec
eiva
bles
from
rela
ted
parti
es
1,
906,
993
45 d
ays E
OM
4
AN
A
1 O
ther
reve
nue
38
,798
N
orm
al
-
A
NA
1
Oth
er re
ceiv
able
s fro
m re
late
d pa
rties
14,5
16
45 d
ays E
OM
-
AN
A
1 Sa
les r
even
ue
9,
347,
710
Nor
mal
19
A
PL
1 Sa
les r
even
ue
18
,137
N
orm
al
-
A
PL
1 R
ecei
vabl
es fr
om re
late
d pa
rties
1,61
8 45
day
s EO
M
-
A
SG
1 Sa
les r
even
ue
27
6,04
5 N
orm
al
1
A
SG
1 R
ecei
vabl
es fr
om re
late
d pa
rties
53,7
88
60-9
0 da
ys
-
A
SG
1 O
ther
reve
nue
2,
586
Nor
mal
-
ASG
1
Oth
er re
ceiv
able
s fro
m re
late
d pa
rties
1,00
8 60
-90
days
-
ATH
1
Sale
s rev
enue
58,5
01
Nor
mal
-
ATH
1
Rec
eiva
bles
from
rela
ted
parti
es
5,
155
30 d
ays a
fter i
nvoi
ce d
ate
-
A
TH
1 O
ther
reve
nue
1,
753
Nor
mal
-
ATH
1
Oth
er re
ceiv
able
s fro
m re
late
d pa
rties
292
30 d
ays a
fter i
nvoi
ce d
ate
-
A
VN
1
Rec
eiva
bles
from
rela
ted
parti
es
6,
311
45 d
ays E
OM
-
AV
N
1 Sa
les r
even
ue
21
,375
N
orm
al
-
A
VN
1
Oth
er re
ceiv
able
s fro
m re
late
d pa
rties
8 45
day
s EO
M
-
B
+B
1 Sa
les r
even
ue
15
2,07
0 N
orm
al
-
B
+B
1 R
ecei
vabl
es fr
om re
late
d pa
rties
19,0
51
60 d
ays E
OM
-
B+B
1
Oth
er re
venu
e
5,80
1 N
orm
al
-
B
+B
1 O
ther
rece
ivab
les f
rom
rela
ted
parti
es
1,
607
60 d
ays E
OM
-
B+B
(CZ)
1
Sale
s rev
enue
164
Nor
mal
-
B+B
(CZ)
1
Oth
er re
venu
e
311
Nor
mal
-
B+B
(CZ)
1
Oth
er re
ceiv
able
s fro
m re
late
d pa
rties
154
60 d
ays E
OM
-
BB
I 1
Oth
er re
venu
e
348
Nor
mal
-
BB
I 1
Oth
er re
ceiv
able
s fro
m re
late
d pa
rties
154
45 d
ays a
fter i
nvoi
ce d
ate
-
SI
oT (C
aym
an)
1 Sa
les r
even
ue
32
0,26
0 N
orm
al
-
SI
oT (C
aym
an)
1 R
ecei
vabl
es fr
om re
late
d pa
rties
266,
621
30 d
ays E
OM
1
(Con
tinue
d)
324

Num
ber
(Not
e A
) C
ompa
ny N
ame
Cou
nter
part
y Fl
ow o
f T
rans
actio
n (N
otes
B a
nd D
)
Tra
nsac
tion
Det
ails
Fina
ncia
l Sta
tem
ent A
ccou
nt
Am
ount
Pa
ymen
t Ter
ms
% o
f Con
solid
ated
A
sset
s/R
even
ue
(Not
e C
)
C
erm
ate
Tech
nolo
gies
Inc.
1
Oth
er re
venu
e $
1,
200
Nor
mal
-
Cer
mat
e Te
chno
logi
es In
c.
1 Sa
les r
even
ue
4
Nor
mal
-
Cer
mat
e Te
chno
logi
es In
c.
1 O
ther
rece
ivab
les f
rom
rela
ted
parti
es
21
0 30
day
s EO
M
-
A
dvan
tech
Cor
pora
te In
vest
men
t 1
Ren
tal r
even
ue
36
N
orm
al
-
A
dvan
sus C
orp.
1
Sale
s rev
enue
805,
007
Nor
mal
2
Adv
ansu
s Cor
p.
1 R
ecei
vabl
es fr
om re
late
d pa
rties
139,
159
60-9
0 da
ys
-
A
dvan
sus C
orp.
1
Ren
tal r
even
ue
3,
000
Nor
mal
-
Adv
ansu
s Cor
p.
1 O
ther
rece
ivab
les f
rom
rela
ted
parti
es
2,
582
60-9
0 da
ys
-
LN
C
1 O
ther
reve
nue
1,
600
Nor
mal
-
LNC
1
Oth
er re
ceiv
able
s fro
m re
late
d pa
rties
440
60-9
0 da
ys E
OM
-
LNC
1
Rec
eiva
bles
from
rela
ted
parti
es
1,
456
60-9
0 da
ys E
OM
-
LNC
1
Sale
s rev
enue
3,95
7 N
orm
al
-
1
AA
C (H
K)
The
Com
pany
2
Oth
er re
ceiv
able
s fro
m re
late
d pa
rties
2,03
3 45
day
s EO
M
-
Th
e C
ompa
ny
2 O
ther
reve
nue
7,
910
Nor
mal
-
2 A
AU
Th
e C
ompa
ny
2 R
ecei
vabl
es fr
om re
late
d pa
rties
15
60-9
0 da
ys
-
Th
e C
ompa
ny
2 Sa
les r
even
ue
43
9 N
orm
al
-
3
AB
R
The
Com
pany
2
Rec
eiva
bles
from
rela
ted
parti
es
67
8 30
day
s afte
r inv
oice
dat
e -
The
Com
pany
2
Sale
s rev
enue
175
Nor
mal
-
4 A
CN
A
EU
3 R
ecei
vabl
es fr
om re
late
d pa
rties
1,53
8 30
day
s EO
M
-
A
EU
3 Sa
les r
even
ue
13
,018
N
orm
al
-
A
iSC
3
Sale
s rev
enue
171,
787
Nor
mal
-
AiS
C
3 R
ecei
vabl
es fr
om re
late
d pa
rties
42,6
59
Imm
edia
te p
aym
ent
-
A
KM
C
3 Sa
les r
even
ue
29
,142
N
orm
al
-
A
KM
C
3 R
ecei
vabl
es fr
om re
late
d pa
rties
6,67
6 60
-90
days
-
AK
R
3 R
ecei
vabl
es fr
om re
late
d pa
rties
43
45 d
ays E
OM
-
AK
R
3 Sa
les r
even
ue
77
N
orm
al
-
A
NA
3
Rec
eiva
bles
from
rela
ted
parti
es
63
30
day
s EO
M
-
A
NA
3
Sale
s rev
enue
690
Nor
mal
-
AX
A
3 O
ther
rece
ivab
les f
rom
rela
ted
parti
es
61
60
day
s EO
M
-
SI
oT (C
hina
) 3
Rec
eiva
bles
from
rela
ted
parti
es
63
,094
30
day
s EO
M
-
SI
oT (C
hina
) 3
Sale
s rev
enue
25,9
02
Nor
mal
-
The
Com
pany
2
Rec
eiva
bles
from
rela
ted
parti
es
5,
109
30 d
ays E
OM
-
The
Com
pany
2
Sale
s rev
enue
6,82
9 N
orm
al
-
Th
e C
ompa
ny
2 O
ther
reve
nue
28
,464
N
orm
al
-
5
AD
L A
-DLo
G
3 R
ecei
vabl
es fr
om re
late
d pa
rties
4,98
8 N
orm
al
-
Th
e C
ompa
ny
2 O
ther
rece
ivab
les f
rom
rela
ted
parti
es
36
,568
30
day
s afte
r inv
oice
dat
e -
The
Com
pany
2
Sale
s rev
enue
51,1
98
Nor
mal
-
(Con
tinue
d)
325

Num
ber
(Not
e A
) C
ompa
ny N
ame
Cou
nter
part
y Fl
ow o
f T
rans
actio
n (N
otes
B a
nd D
)
Tra
nsac
tion
Det
ails
Fina
ncia
l Sta
tem
ent A
ccou
nt
Am
ount
Pa
ymen
t Ter
ms
% o
f Con
solid
ated
A
sset
s/R
even
ue
(Not
e C
)
6
A-D
LoG
A
AU
3
Rec
eiva
bles
from
rela
ted
parti
es
$
7 30
day
s afte
r inv
oice
dat
e -
AA
U
3 Sa
les r
even
ue
1,
132
Nor
mal
-
AEU
3
Rec
eiva
bles
from
rela
ted
parti
es
4
30 d
ays u
pon
deliv
ery
-
A
EU
3 O
ther
reve
nue
2,
353
Nor
mal
-
AEU
3
Sale
s rev
enue
2,42
1 N
orm
al
-
A
EU
3 O
ther
rece
ivab
les f
rom
rela
ted
parti
es
38
3 30
day
s EO
M
-
A
KM
C
3 R
ecei
vabl
es fr
om re
late
d pa
rties
96
60 d
ays a
fter i
nvoi
ce d
ate
-
A
KM
C
3 Sa
les r
even
ue
70
6 N
orm
al
-
A
KR
3
Sale
s rev
enue
1,31
9 N
orm
al
-
A
KR
3
Rec
eiva
bles
from
rela
ted
parti
es
79
60
day
s EO
M
-
A
NA
3
Rec
eiva
bles
from
rela
ted
parti
es
1,
089
30 d
ays a
fter i
nvoi
ce d
ate
-
A
NA
3
Sale
s rev
enue
38,8
32
Nor
mal
-
APL
3
Sale
s rev
enue
1,19
9 N
orm
al
-
Th
e C
ompa
ny
2 O
ther
reve
nue
12
9 N
orm
al
-
Th
e C
ompa
ny
2 Sa
les r
even
ue
18
1,90
2 N
orm
al
-
Th
e C
ompa
ny
2 R
ecei
vabl
es fr
om re
late
d pa
rties
20,7
46
30 d
ays a
fter i
nvoi
ce d
ate
-
Th
e C
ompa
ny
2 O
ther
rece
ivab
les f
rom
rela
ted
parti
es
13
,672
60
day
s EO
M
-
7
AEU
A
AU
3
Rec
eiva
bles
from
rela
ted
parti
es
4
30 d
ays E
OM
-
AA
U
3 Sa
les r
even
ue
4
Nor
mal
-
AC
N
3 R
ecei
vabl
es fr
om re
late
d pa
rties
7 30
day
s afte
r inv
oice
dat
e -
AC
N
3 Sa
les r
even
ue
48
N
orm
al
-
A
-DLo
G
3 Sa
les r
even
ue
62
,019
N
orm
al
-
A
-DLo
G
3 R
ecei
vabl
es fr
om re
late
d pa
rties
1,77
6 30
day
s upo
n de
liver
y -
AIN
3
Sale
s rev
enue
19
Nor
mal
-
AIN
3
Rec
eiva
bles
from
rela
ted
parti
es
14
45
day
s EO
M
-
A
ID
3 Sa
les r
even
ue
31
N
orm
al
-
A
JP
3 Sa
les r
even
ue
12
9 N
orm
al
-
A
KM
C
3 Sa
les r
even
ue
10
0 N
orm
al
-
A
KM
C
3 R
ecei
vabl
es fr
om re
late
d pa
rties
106
30 d
ays E
OM
-
AK
R
3 Sa
les r
even
ue
67
6 N
orm
al
-
A
KR
3
Rec
eiva
bles
from
rela
ted
parti
es
52
30
day
s afte
r inv
oice
dat
e -
AN
A
3 Sa
les r
even
ue
7,
658
Nor
mal
-
AN
A
3 R
ecei
vabl
es fr
om re
late
d pa
rties
97
30 d
ays a
fter i
nvoi
ce d
ate
-
A
PL
3 Sa
les r
even
ue
4,
689
Nor
mal
-
APL
3
Rec
eiva
bles
from
rela
ted
parti
es
44
8 30
day
s afte
r inv
oice
dat
e -
B+B
3
Rec
eiva
bles
from
rela
ted
parti
es
35
45
day
s EO
M
-
B
BI
3 Sa
les r
even
ue
87
1 N
orm
al
-
B
BI
3 R
ecei
vabl
es fr
om re
late
d pa
rties
152
30 d
ays a
fter i
nvoi
ce d
ate
-
Th
e C
ompa
ny
2 Sa
les r
even
ue
27
,134
N
orm
al
-
Th
e C
ompa
ny
2 R
ecei
vabl
es fr
om re
late
d pa
rties
3,16
5 30
day
s EO
M
-
Th
e C
ompa
ny
2 O
ther
reve
nue
18
N
orm
al
-
(C
ontin
ued)
326

Num
ber
(Not
e A
) C
ompa
ny N
ame
Cou
nter
part
y Fl
ow o
f T
rans
actio
n (N
otes
B a
nd D
)
Tra
nsac
tion
Det
ails
Fina
ncia
l Sta
tem
ent A
ccou
nt
Am
ount
Pa
ymen
t Ter
ms
% o
f Con
solid
ated
A
sset
s/R
even
ue
(Not
e C
)
10
A
ID
ASG
3
Rec
eiva
bles
from
rela
ted
parti
es
$
399
45 d
ays a
fter i
nvoi
ce d
ate
-
A
SG
3 O
ther
reve
nue
4,
291
Nor
mal
-
11
AIN
Th
e C
ompa
ny
2 R
ecei
vabl
es fr
om re
late
d pa
rties
430
60 d
ays E
OM
-
12
AiS
C
AA
C (H
K)
3 O
ther
rece
ivab
les f
rom
rela
ted
parti
es
4,
488
90 d
ays
-
A
CN
3
Oth
er re
ceiv
able
s fro
m re
late
d pa
rties
34,4
54
Imm
edia
te p
aym
ent
-
A
CN
3
Sale
s rev
enue
8,23
9 N
orm
al
-
A
CN
3
Ren
tal r
even
ue
5,
975
Nor
mal
-
AC
N
3 R
ecei
vabl
es fr
om re
late
d pa
rties
2 Im
med
iate
pay
men
t -
AK
MC
3
Sale
s rev
enue
198
Nor
mal
-
SIoT
(Chi
na)
3 R
ecei
vabl
es fr
om re
late
d pa
rties
823
30 d
ays E
OM
-
SIoT
(Chi
na)
3 Sa
les r
even
ue
1,
183
Nor
mal
-
The
Com
pany
2
Rec
eiva
bles
from
rela
ted
parti
es
1,
094
45 d
ays E
OM
-
14
AJP
A
CN
3
Sale
s rev
enue
81
Nor
mal
-
AC
N
3 R
ecei
vabl
es fr
om re
late
d pa
rties
62
45 d
ays E
OM
-
AK
MC
3
Sale
s rev
enue
16,0
94
Nor
mal
-
AK
MC
3
Oth
er re
ceiv
able
s fro
m re
late
d pa
rties
2,91
4 60
day
s EO
M
-
Th
e C
ompa
ny
2 R
ecei
vabl
es fr
om re
late
d pa
rties
516
60-9
0 da
ys
-
Th
e C
ompa
ny
2 Sa
les r
even
ue
1,
161
Nor
mal
-
The
Com
pany
2
Oth
er re
venu
e
70
Nor
mal
-
15
AK
MC
A
CN
3
Sale
s rev
enue
445,
324
Nor
mal
1
AC
N
3 R
ecei
vabl
es fr
om re
late
d pa
rties
52,0
60
60-9
0 da
ys
-
A
CN
3
Ren
tal r
even
ue
3,
595
Nor
mal
-
Adv
ansu
s Cor
p.
3 R
ecei
vabl
es fr
om re
late
d pa
rties
554
30 d
ays E
OM
-
Adv
ansu
s Cor
p.
3 Sa
les r
even
ue
3,
704
Nor
mal
-
AEU
3
Sale
s rev
enue
6,19
4 N
orm
al
-
A
EU
3 R
ecei
vabl
es fr
om re
late
d pa
rties
627
30 d
ays a
fter i
nvoi
ce d
ate
-
A
iSC
3
Sale
s rev
enue
11,6
31
Nor
mal
-
AiS
C
3 R
ecei
vabl
es fr
om re
late
d pa
rties
491
Imm
edia
te p
aym
ent
-
A
KST
3
Rec
eiva
bles
from
rela
ted
parti
es
44
,243
30
day
s EO
M
-
A
KST
3
Sale
s rev
enue
89,3
80
Nor
mal
-
AN
A
3 Sa
les r
even
ue
3,
643
Nor
mal
-
AN
A
3 R
ecei
vabl
es fr
om re
late
d pa
rties
313
60-9
0 da
ys
-
SI
oT (C
hina
) 3
Rec
eiva
bles
from
rela
ted
parti
es
6,
542
30 d
ays E
OM
-
SIoT
(Chi
na)
3 Sa
les r
even
ue
12
,039
N
orm
al
-
SI
oT (C
aym
an)
3 R
ecei
vabl
es fr
om re
late
d pa
rties
125,
335
30 d
ays E
OM
-
SIoT
(Cay
man
) 3
Sale
s rev
enue
510,
175
Nor
mal
1
(Con
tinue
d)
327

Num
ber
(Not
e A
) C
ompa
ny N
ame
Cou
nter
part
y Fl
ow o
f T
rans
actio
n (N
otes
B a
nd D
)
Tra
nsac
tion
Det
ails
Fina
ncia
l Sta
tem
ent A
ccou
nt
Am
ount
Pa
ymen
t Ter
ms
% o
f Con
solid
ated
A
sset
s/R
even
ue
(Not
e C
)
Th
e C
ompa
ny
2 Sa
les r
even
ue
$
11,9
74,2
20
Nor
mal
25
Th
e C
ompa
ny
2 R
ecei
vabl
es fr
om re
late
d pa
rties
1,53
3,44
4 60
day
s EO
M
3
C
erm
ate
Tech
nolo
gies
Inc.
3
Rec
eiva
bles
from
rela
ted
parti
es
18
0 60
day
s EO
M
-
C
erm
ate
Tech
nolo
gies
Inc.
3
Sale
s rev
enue
678
Nor
mal
-
Cer
mat
e (S
henz
hen)
3
Rec
eiva
bles
from
rela
ted
parti
es
4,
015
60 d
ays E
OM
-
Cer
mat
e (S
henz
hen)
3
Sale
s rev
enue
36,1
53
Nor
mal
-
16
AK
R
AK
ST
3 Sa
les r
even
ue
18
,370
N
orm
al
-
A
JP
3 Sa
les r
even
ue
88
N
orm
al
-
A
SG
3 Sa
les r
even
ue
4
Nor
mal
-
AV
N
3 R
ecei
vabl
es fr
om re
late
d pa
rties
94
30 d
ays E
OM
-
AV
N
3 Sa
les r
even
ue
27
0 N
orm
al
-
Th
e C
ompa
ny
2 R
ecei
vabl
es fr
om re
late
d pa
rties
468
90 d
ays E
OM
-
The
Com
pany
2
Sale
s rev
enue
590
Nor
mal
-
The
Com
pany
2
Oth
er re
venu
e
866
Nor
mal
-
17
AK
ST
AEU
3
Sale
s rev
enue
8,54
8 N
orm
al
-
A
KM
C
3 Sa
les r
even
ue
8,
446
Nor
mal
-
AK
MC
3
Rec
eiva
bles
from
rela
ted
parti
es
89
5 30
day
s EO
M
-
A
KR
3
Rec
eiva
bles
from
rela
ted
parti
es
88
0 30
day
s EO
M
-
A
KR
3
Sale
s rev
enue
800
Nor
mal
-
AN
A
3 Sa
les r
even
ue
8,
260
Nor
mal
-
The
Com
pany
2
Rec
eiva
bles
from
rela
ted
parti
es
5,
474
30 d
ays E
OM
-
The
Com
pany
2
Sale
s rev
enue
7,02
2 N
orm
al
-
18
A
MX
Th
e C
ompa
ny
2 O
ther
reve
nue
5,
975
Nor
mal
-
19
AM
Y
ATH
3
Sale
s rev
enue
51
Nor
mal
-
The
Com
pany
2
Rec
eiva
bles
from
rela
ted
parti
es
21
5 45
day
s EO
M
-
20
A
NA
A
AU
3
Rec
eiva
bles
from
rela
ted
parti
es
14
60
day
s afte
r inv
oice
dat
e -
AA
U
3 Sa
les r
even
ue
46
N
orm
al
-
A
-DLo
G
3 Sa
les r
even
ue
9
Nor
mal
-
AEU
3
Rec
eiva
bles
from
rela
ted
parti
es
4,
862
60-9
0 da
ys
-
A
ID
3 Sa
les r
even
ue
9
Nor
mal
-
AIN
3
Rec
eiva
bles
from
rela
ted
parti
es
58
30
day
s afte
r inv
oice
dat
e -
AIN
3
Sale
s rev
enue
57
Nor
mal
-
AK
MC
3
Rec
eiva
bles
from
rela
ted
parti
es
90
6 30
day
s EO
M
-
A
KR
3
Sale
s rev
enue
2,19
8 N
orm
al
-
A
SG
3 Sa
les r
even
ue
22
N
orm
al
-
B
+B
3 R
enta
l rev
enue
145
Nor
mal
-
B+B
3
Rec
eiva
bles
from
rela
ted
parti
es
73
0 60
-90
days
-
(Con
tinue
d)
328

Num
ber
(Not
e A
) C
ompa
ny N
ame
Cou
nter
part
y Fl
ow o
f T
rans
actio
n (N
otes
B a
nd D
)
Tra
nsac
tion
Det
ails
Fina
ncia
l Sta
tem
ent A
ccou
nt
Am
ount
Pa
ymen
t Ter
ms
% o
f Con
solid
ated
A
sset
s/R
even
ue
(Not
e C
)
B
+B
3 Sa
les r
even
ue
$
6,12
8 N
orm
al
-
B
+B (C
Z)
3 Sa
les r
even
ue
1,
157
Nor
mal
-
The
Com
pany
2
Sale
s rev
enue
85,2
36
Nor
mal
-
The
Com
pany
2
Rec
eiva
bles
from
rela
ted
parti
es
57
,612
45
day
s EO
M
-
Th
e C
ompa
ny
2 O
ther
reve
nue
99
7 N
orm
al
-
22
A
PL
A-D
LoG
3
Rec
eiva
bles
from
rela
ted
parti
es
1,
405
30 d
ays a
fter i
nvoi
ce d
ate
-
A
EU
3 Sa
les r
even
ue
10
6,73
3 N
orm
al
-
A
EU
3 R
ecei
vabl
es fr
om re
late
d pa
rties
10,0
13
30 d
ays a
fter i
nvoi
ce d
ate
-
Th
e C
ompa
ny
2 R
ecei
vabl
es fr
om re
late
d pa
rties
446
30 d
ays a
fter i
nvoi
ce d
ate
-
Th
e C
ompa
ny
2 O
ther
reve
nue
48
2 N
orm
al
-
23
A
SG
AID
3
Sale
s rev
enue
34
Nor
mal
-
AK
R
3 Sa
les r
even
ue
41
N
orm
al
-
A
MY
3
Sale
s rev
enue
8,51
3 N
orm
al
-
A
MY
3
Rec
eiva
bles
from
rela
ted
parti
es
12
6 30
day
s EO
M
-
A
TH
3 Sa
les r
even
ue
6,
618
Nor
mal
-
ATH
3
Oth
er re
venu
e
1,62
8 N
orm
al
-
A
TH
3 R
ecei
vabl
es fr
om re
late
d pa
rties
51
30 d
ays E
OM
-
The
Com
pany
2
Sale
s rev
enue
5 N
orm
al
-
Th
e C
ompa
ny
2 R
ecei
vabl
es fr
om re
late
d pa
rties
211
60-9
0 da
ys
-
Th
e C
ompa
ny
2 O
ther
reve
nue
70
2 N
orm
al
-
25
A
TH
ASG
3
Oth
er re
venu
e
4 N
orm
al
-
Th
e C
ompa
ny
2 Sa
les r
even
ue
5
Nor
mal
-
26
AU
K
The
Com
pany
2
Sale
s rev
enue
68,5
24
Nor
mal
-
27
AV
N
The
Com
pany
2
Sale
s rev
enue
487
Nor
mal
-
AK
R
3 Sa
les r
even
ue
31
N
orm
al
-
28
A
XA
A
CN
3
Oth
er re
ceiv
able
s fro
m re
late
d pa
rties
8,94
4 30
day
s EO
M
-
A
CN
3
Oth
er re
venu
e
822
Nor
mal
-
29
B+B
A
EU
3 Sa
les r
even
ue
69
,133
N
orm
al
-
A
EU
3 R
ecei
vabl
es fr
om re
late
d pa
rties
9,73
6 90
day
s EO
M
-
A
EU
3 Sa
les r
even
ue
13
,987
N
orm
al
-
A
KM
C
3 Sa
les r
even
ue
75
N
orm
al
-
A
NA
3
Rec
eiva
bles
from
rela
ted
parti
es
86
7 30
day
s EO
M
-
B
BI
3 O
ther
reve
nue
8,
614
Nor
mal
-
BB
I 3
Rec
eiva
bles
from
rela
ted
parti
es
1,
258
45 d
ays E
OM
-
(Con
tinue
d)
329

Num
ber
(Not
e A
) C
ompa
ny N
ame
Cou
nter
part
y Fl
ow o
f T
rans
actio
n (N
otes
B a
nd D
)
Tra
nsac
tion
Det
ails
Fina
ncia
l Sta
tem
ent A
ccou
nt
Am
ount
Pa
ymen
t Ter
ms
% o
f Con
solid
ated
A
sset
s/R
even
ue
(Not
e C
)
Th
e C
ompa
ny
2 Sa
les r
even
ue
$
90,5
76
Nor
mal
-
The
Com
pany
2
Rec
eiva
bles
from
rela
ted
parti
es
19
,241
90
day
s EO
M
-
30
B
+B (C
Z)
AEU
3
Sale
s rev
enue
246,
655
Nor
mal
1
AEU
3
Rec
eiva
bles
from
rela
ted
parti
es
45
,091
45
day
s EO
M
-
A
EU
3 O
ther
reve
nue
4,
493
Nor
mal
-
AEU
3
Oth
er re
ceiv
able
s fro
m re
late
d pa
rties
1,08
9 45
day
s EO
M
-
B
+B
3 Sa
les r
even
ue
40
,154
N
orm
al
-
B
+B
3 R
ecei
vabl
es fr
om re
late
d pa
rties
1,45
2 45
day
s EO
M
-
C
onel
Aut
omat
ion
3 O
ther
reve
nue
1,
108
45 d
ays E
OM
-
Con
el A
utom
atio
n 3
Oth
er re
ceiv
able
s fro
m re
late
d pa
rties
229
45 d
ays E
OM
-
Con
el A
utom
atio
n 3
Sale
s rev
enue
84
Nor
mal
-
Con
el A
utom
atio
n 3
Inte
rest
reve
nue
11
7 N
orm
al
-
C
onel
Aut
omat
ion
3 R
ecei
vabl
es fr
om re
late
d pa
rties
20
45 d
ays E
OM
-
The
Com
pany
2
Sale
s rev
enue
48,0
36
Nor
mal
-
The
Com
pany
2
Rec
eiva
bles
from
rela
ted
parti
es
4,
591
45 d
ays E
OM
-
The
Com
pany
2
Oth
er re
venu
e
39
Nor
mal
-
31
BB
I A
EU
3 Sa
les r
even
ue
56
,264
N
orm
al
-
A
EU
3 R
ecei
vabl
es fr
om re
late
d pa
rties
12,6
12
60 d
ays a
fter i
nvoi
ce d
ate
-
B
+B
3 Sa
les r
even
ue
8,
068
Nor
mal
-
B+B
3
Rec
eiva
bles
from
rela
ted
parti
es
10
,459
60
day
s afte
r inv
oice
dat
e -
B+B
3
Oth
er re
venu
e
34,4
98
Nor
mal
-
The
Com
pany
2
Sale
s rev
enue
5,70
9 N
orm
al
-
Th
e C
ompa
ny
2 R
ecei
vabl
es fr
om re
late
d pa
rties
5,62
8 60
day
s afte
r inv
oice
dat
e -
34
DM
CC
Th
e C
ompa
ny
2 O
ther
rece
ivab
les f
rom
rela
ted
parti
es
2,
310
Imm
edia
te p
aym
ent
-
Th
e C
ompa
ny
2 O
ther
reve
nue
5,
351
Nor
mal
-
35
SIoT
(CN
) A
CN
3
Sale
s rev
enue
1,64
9 N
orm
al
-
A
iSC
3
Rec
eiva
bles
from
rela
ted
parti
es
5,
790
60 d
ays E
OM
-
AiS
C
3 Sa
les r
even
ue
7,
733
Nor
mal
-
AEU
3
Rec
eiva
bles
from
rela
ted
parti
es
85
,087
45
day
s EO
M
-
A
EU
3 Sa
les r
even
ue
21
1,05
9 N
orm
al
-
A
NA
3
Rec
eiva
bles
from
rela
ted
parti
es
12
5,73
7 30
day
s EO
M
-
A
NA
3
Sale
s rev
enue
235,
886
Nor
mal
-
SIoT
(Chi
na)
3 R
ecei
vabl
es fr
om re
late
d pa
rties
8,89
7 60
day
s EO
M
-
A
CN
3
Rec
eiva
bles
from
rela
ted
parti
es
14
1 60
day
s EO
M
-
SI
oT (C
hina
) 3
Sale
s rev
enue
15,8
70
Nor
mal
-
38
Cer
mat
e (S
hang
hai)
Cer
mat
e (S
henz
hen)
3
Sale
s rev
enue
1,04
9 N
orm
al
-
(C
ontin
ued)
330

Num
ber
(Not
e A
) C
ompa
ny N
ame
Cou
nter
part
y Fl
ow o
f T
rans
actio
n (N
otes
B a
nd D
)
Tra
nsac
tion
Det
ails
Fina
ncia
l Sta
tem
ent A
ccou
nt
Am
ount
Pa
ymen
t Ter
ms
% o
f Con
solid
ated
A
sset
s/R
even
ue
(Not
e C
)
39
C
erm
ate
Tech
nolo
gies
Inc.
A
KM
C
3 Sa
les r
even
ue
$
6,52
7 N
orm
al
-
A
KM
C
3 R
ecei
vabl
es fr
om re
late
d pa
rties
8 60
day
s EO
M
-
Th
e C
ompa
ny
2 Sa
les r
even
ue
4,
345
Nor
mal
-
The
Com
pany
2
Rec
eiva
bles
from
rela
ted
parti
es
69
9 30
-60
days
-
The
Com
pany
2
Oth
er re
venu
e
164
Nor
mal
-
Cer
mat
e (S
henz
hen)
3
Rec
eiva
bles
from
rela
ted
parti
es
18
,789
30
day
s EO
M
-
C
erm
ate
(She
nzhe
n)
3 Sa
les r
even
ue
11
2,58
1 N
orm
al
-
LN
C
3 Sa
les r
even
ue
25
N
orm
al
-
40
C
erm
ate
(She
nzhe
n)
AC
N
3 Sa
les r
even
ue
11
N
orm
al
-
A
KM
C
3 Sa
les r
even
ue
52
,308
N
orm
al
-
A
KM
C
3 R
ecei
vabl
es fr
om re
late
d pa
rties
5,10
2 40
day
s EO
M
-
C
erm
ate
(Sha
ngha
i) 3
Sale
s rev
enue
35,2
20
Nor
mal
-
Cer
mat
e Te
chno
logi
es In
c.
3 Sa
les r
even
ue
33
,388
N
orm
al
-
C
erm
ate
Tech
nolo
gies
Inc.
3
Rec
eiva
bles
from
rela
ted
parti
es
6,
872
60 d
ays E
OM
-
41
Adv
ansu
s Cor
p.
AK
MC
3
Sale
s rev
enue
343
Nor
mal
-
The
Com
pany
2
Sale
s rev
enue
7,73
0 N
orm
al
-
Th
e C
ompa
ny
2 R
ecei
vabl
es fr
om re
late
d pa
rties
605
60-9
0 da
ys
-
C
erm
ate
Tech
nolo
gies
Inc.
3
Sale
s rev
enue
461
Nor
mal
-
42
LNC
Th
e C
ompa
ny
2 O
ther
reve
nue
74
N
orm
al
-
Th
e C
ompa
ny
2 R
ecei
vabl
es fr
om re
late
d pa
rties
861
60 d
ays E
OM
-
The
Com
pany
2
Ren
tal r
even
ue
1,
009
Nor
mal
-
The
Com
pany
2
Sale
s rev
enue
3,26
6 N
orm
al
-
LN
C D
ong
Gua
n C
o., L
td.
3 R
ecei
vabl
es fr
om re
late
d pa
rties
209,
533
90 d
ays E
OM
-
LNC
Don
g G
uan
Co.
, Ltd
. 3
Sale
s rev
enue
295,
203
Nor
mal
1
Not
e A
: Th
e pa
rent
com
pany
and
its s
ubsi
diar
ies a
re n
umbe
red
as fo
llow
s:
1.
A
dvan
tech
Co.
, Ltd
. is n
umbe
red
“0”.
2.
Su
bsid
iarie
s are
num
bere
d fr
om “
1” o
nwar
d.
Not
e B
: Th
e flo
w o
f rel
ated
-par
ty tr
ansa
ctio
ns is
as f
ollo
ws:
1.
From
the
pare
nt c
ompa
ny to
its s
ubsi
diar
y.
2.
From
the
subs
idia
ry to
its p
aren
t com
pany
. 3.
B
etw
een
subs
idia
ries.
Not
e C
: Fo
r ass
ets
and
liabi
litie
s, am
ount
s ar
e sh
own
as a
per
cent
age
of th
e G
roup
’s c
onso
lidat
ed to
tal a
sset
s as
of D
ecem
ber 3
1, 2
018,
whi
le re
venu
e, c
osts
and
exp
ense
s ar
e sh
own
as a
per
cent
age
of th
e G
roup
’s c
onso
lidat
ed to
tal o
pera
ting
reve
nue
for t
he y
ear e
nded
Dec
embe
r 31,
201
8.
Not
e D
: A
ll in
terc
ompa
ny tr
ansa
ctio
ns h
ave
been
elim
inat
ed fr
om c
onso
lidat
ion.
(Con
clud
ed)
331

Enabling an Intelligent Planet
Advantech Co., Ltd.
K.C. Liu , Chairman
