table of contents - food standards australia new …€¦ · web viewvitamin b12 deficiency occurs...
TRANSCRIPT

Issues PaperMandatory Fortification with Folic Acid
April 2007
Page 1

Table of Contents
Purpose of this Issues Paper.......................................................................................3
Chapter 1: Summary of FSANZ’s Approach to the Review Request.....................6
Chapter 2: Options for Addressing Neural Tube Defects (NTDs)...........................9
Chapter 3: Safety and Effectiveness of Mandatory Fortification...........................11
Chapter 4: Dietary Intake Assessments..............................................................17
Chapter 5: Issues specific to Mandatory Fortification of Bread-Making Flour......22
Chapter 6: Costs Associated with Mandatory Fortification...................................27
Chapter 7: Informing Consumers.........................................................................32
Chapter 8: Implementation and Transition...........................................................36
Chapter 9: Monitoring, Communication and Education........................................38
References ………………………………………………………………………………39
Attachment 1: Additional information on Safety and Effectiveness...........................40
Attachment 2: Dietary Intake Assessments..............................................................63
Attachment 3: Report - Mandatory Folic Acid Fortification of Bread-Making Flour in ……………… Australia……………………………………………………………………96
Page 2

Purpose of this Issues Paper
A. Purpose
In May 2004, the Australia and New Zealand Food Regulation Ministerial Council (the Ministerial Council) asked Food Standards Australia New Zealand (FSANZ) to investigate mandatory fortification with folic acid as a possible means of reducing the incidence of neural tube defects (NTDs), which are serious birth defects.
FSANZ released an Initial Assessment Report for Proposal P295 – Consideration of Mandatory Fortification with Folic Acid in October 2004 and presented four options: maintenance of the status quo; extension of permissions for voluntary folic acid fortification; mandatory folic acid fortification; and increased health promotion and education strategies to increase folate intakes.
In December 2004, FSANZ sought advice from the Food Regulation Standing Committee (FRSC) on whether mandatory fortification is the most effective public health strategy as FSANZ considered that this issue was more appropriately addressed by FRSC and the Ministerial Council. This issue was considered by the Ministerial Council who sought advice from the Australian Health Ministers’ Advisory Council (AHMAC).
An expert panel was then convened by AHMAC to advise on the most effective public health strategy for addressing NTDs. The expert panel advised Health Ministers that mandatory fortification represents “the most effective public health strategy for increasing folate intake where safety can be assured and there is a demonstrated need”.
Health Ministers then referred this advice to the Ministerial Council who asked FSANZ to progress mandatory fortification with folic acid as a matter of priority taking into account safety and cost effectiveness.
In October 2006, the Ministerial Council considered FSANZ’s Final Assessment Report which proposed mandatory fortification of bread at 80-180 µg of folic acid per 100 grams of bread. At the time, the Ministerial Council sought a First Review of the Proposal.
As part of the Review, FSANZ was tasked with examining and providing further advice on a range of issues relating to the mandatory fortification proposal. FSANZ was given six months to report back to the Ministerial Council.
Under the FSANZ legislation (Food Standards Australia New Zealand Act 1991) (the FSANZ Act), FSANZ must prepare a response to the Ministerial Council but is not required to undertake any consultation in the course of doing so.
However, given the importance of this issue (and the high level of stakeholder interest) FSANZ considered that it would be valuable to hold forums with
Page 3

stakeholders to explain the proposed approach (this occurred in February and March 2007) and also to release an Issues Paper to seek further stakeholder input.
Page 4
The purpose of this Issues Paper, therefore, is to:
outline FSANZ’s preliminary findings in relation to some key aspects of the Review; and
seek further stakeholder feedback on key issues.
It is important to note that this Issues Paper does not address every issue raised in the Review and is not intended to be read as a draft of the First Review Report – rather the purpose of this Paper is to draw out some of the key issues and seek stakeholder feedback on them.
Similarly, the Issues Paper does not detail every issue that has been raised by stakeholders through the forums held by FSANZ. However FSANZ assures stakeholders that each of the issues raised has been taken into account and FSANZ appreciates the documents and other materials that have also been provided by a number of stakeholders.
B. Opportunity for Comment
Comments received will assist FSANZ in the preparation of the First Review Report for Proposal P295. Consultation does not normally occur in the development of a response to a request for a First Review and FSANZ appreciates that the period available for comment on this Issues Paper is very limited. The First Review Report will be made available to the public after FSANZ’s decision has been notified to the Ministerial Council.
You can access the Issues paper on the following webpage:
http://www.foodstandards.gov.au/standardsdevelopment/documentsforpublicco868.cfm.
While FSANZ accepts submissions in hard copy to our offices, it is more convenient and quicker to receive submissions electronically through the FSANZ website using the Standards Development tab, then through Documents for Public Comment, then the ‘How to make a submission’ button. Note that for the mandatory field ‘For assessment report number’; please enter the word ‘P295’. Alternatively, submissions can be sent directly to: [email protected].
Hard copy submissions only should be clearly marked ‘Proposal P295’ and sent to:
Standards Management OfficerFood Standards Australia New ZealandPO Box 7186CANBERRA BC ACT 2610Australia
Page 5
Questions relating to making submissions can be directed to the Standards Management Officer at the above address or by emailing [email protected].
Please note, the closing date for written comments is 6pm (Canberra time), Wednesday 18 April 2007. Comments received after this deadline may not be considered.
C. Next Steps
Following consideration of the matters raised by stakeholders, FSANZ will submit a First Review Report to the Ministerial Council. This will be considered by the FSANZ Board (by the deadline of 7 May 2007) before being provided to the Ministerial Council. Once the Ministerial Council has been notified the First Review Report will be published on the FSANZ website.
Page 6

Chapter 1: FSANZ’s Approach to the Review Request
Since receiving the Review request in November 2006, FSANZ has worked intensively to develop responses to the issues raised. FSANZ has also sought external, independent expert assistance on a number of the issues.
The Review request does contain a number of separate issues to be addressed. Some of these appear inconsistent with other elements of the review request, for example, undertaking a review of options to address NTDs whilst being asked to re-consider mandatory fortification of bread-making flour1 in Australia. FSANZ’s approach therefore seeks to address each issue separately rather than attempt to reconcile any apparent inconsistencies.
The following is a summary of the key inputs into this process.
i) Options for addressing NTDs
In December 2006, FSANZ engaged Professor Leonie Segal, Division of Health Sciences, University of South Australia2, to assess the cost-effectiveness of a number of intervention options for reducing the incidence of NTDs. This Report was unavailable for inclusion in this Issues Paper. However it will be made available for comment as soon as possible.
ii) Assessment of scientific literature
The Final Assessment prepared by FSANZ included detailed information about both the effectiveness and the safety of fortification. Since Final Assessment a number of new papers have been published in relation to both of these issues.
FSANZ thoroughly reviewed each of these new papers and a summary of each, along with the key findings, is included in Attachment 1.
In addition to FSANZ’s review of the literature, papers and articles referred to by participants during the consultation have been followed up by FSANZ.
FSANZ also reconvened the Folate Scientific Advisory Group3 to review and provide feedback on the updated assessment and discussions have been held with relevant people in the US regarding the effectiveness and safety of mandatory fortification in their country.
1 In this paper the term bread-making flour is used interchangeable with ‘flour for making bread’. 2 Formerly of the Centre of Health Economics, Monash University.3 This group consists of clinicians and public health nutritionists with expertise in epidemiology and/or folate nutrition.
Page 7

iii) Dietary intake assessments
The following dietary intake assessments have been undertaken to address some of the issues raised in the Review request:
Baseline estimate: the current folic acid concentrations in foods were revised based on new data collected in 2006 on folic acid content and the proportion of foods within each category that were fortified. All dietary intake assessments conducted for the First Review used these new baseline values as a starting point.
Mandatory fortification estimate: for Australia, dietary intake assessments for the First Review were conducted using ‘wheat flour for making bread’ as the food vehicle for mandatory folic acid fortification, for New Zealand, the food vehicle remained unchanged from Final Assessment – ‘all bread’.
Extended voluntary estimate: based on two scenarios with an extension of current permissions to dairy products; one with a moderate increase in uptake of voluntary permissions, one with a ‘top end’ or maximum expected uptake of permissions.
Naturally occurring folate and DFE intake estimates: the current dietary intakes of folate (from naturally occurring sources only) and of Dietary Folate Equivalents (DFEs)4 and predicted increase in DFE intakes on mandatory fortification.
In addition, Dr Mike DiNovi, an international expert in dietary exposure assessments from the US Food and Drug Administration, recently reviewed all FSANZ dietary intake/exposure assessment principles and modelling. The folic acid intake assessments from the Final Assessment were also peer reviewed by Dr Philippe Verger, an external international expert from the National Institute for Agricultural Research (INRA), Paris, France.
Further details on the dietary intake assessments undertaken are at Attachment 2.
iv) Examination of the milling industry and the practical implications of requiring the addition of folic acid to bread-making flour in Australia
An independent consultant, Gerard McMullen, GP McMullen Consulting (McMullen), was engaged in December 2006 to consult with industry on the technical and compliance issues associated with the fortification. At Final Assessment it was proposed that bread be fortified in both Australia and New Zealand. This outcomes-based approach left the decision to industry on the point in the production chain at which folic acid was to be added. This approach was chosen on the assumption that economic self-interest would ensure that the addition occurred at the most cost-effective point given the circumstances of the different segments of the industry in the two countries. However the Review Request required FSANZ to consider mandating the fortification of flour used in bread-making in Australia while retaining the outcomes-based approach of requiring fortification of bread in New Zealand. Therefore the focus of the report by McMullen was on the mandatory fortification of bread-making flour in Australia. The key results of his findings are included in Chapter 4 Dietary Folate Equivalent (g DFE)= (g food folate) + (g folic acid x 1.67).
Page 8

6 of this Paper and his full report on ‘Mandatory folic acid Fortification of Bread-making Flour in Australia’ is at Attachment 3).
FSANZ also engaged an international consultant, Quentin Johnson5, to review McMullen’s report and also to provide advice on overseas experience with mandatory folic acid fortification of flour.
In addition, the Flour Millers Council of Australia (FMCA) also commissioned an independent report6 examining the technical feasibility and cost implications for the Australian milling industry. This information has been considered by FSANZ’s consultants and has also informed the consideration of costs associated with mandatory fortification of bread-making flour.
v) Analysis of costs
In order to identify and verify the costs of fortification at the milling stage in Australia and of bread in New Zealand, FSANZ consulted further with industry in Australia and New Zealand and sought their advice regarding these costs. Through Gerard McMullen’s consultation with industry revised cost estimates were developed. The FMCA report also provided information on costs.
FSANZ also surveyed all Australian jurisdictions to gain information about enforcement strategies and costs.
vi) Targeted consultations with stakeholders
FSANZ held a series of targeted meetings with industry, jurisdictions, public health and consumer organisations in February and early March 2007. Australian and New Zealand industry and jurisdictions attended interactive workshops, and two teleconferences were also held with public health and consumer organisations to discuss the review and relevant issues.
Strongly held views on mandatory folic acid fortification were expressed by stakeholders during consultations. Industry continued to strongly oppose mandatory fortification, favouring voluntary fortification and a well designed and resourced education campaign as a means of increasing folic acid intakes. Views were polarised amongst public health organisations with some strongly supporting mandatory fortification and others questioning the safety and need.
The issues arising from consultations have been addressed where appropriate in this Issues Paper. Issues which have been previously raised and discussed in the Final Assessment Report have not been included.
5 QUICAN Inc. Rockwood, Canada, March 2007.6 Richard Eliott, Milling Consulting Service Pty Ltd, February 2007.
Page 9

Chapter 2: Options for addressing NTDs
A. Context
NTDs are a group of birth defects, which arise during the development of the brain and spinal cord in utero and are estimated to affect between 300-350 pregnancies in Australia per year and between 70-75 pregnancies in New Zealand.
The actual number of affected pregnancies is difficult to estimate accurately because of the unknown number of NTD-affected foetuses which are miscarried and the variable quality of data on elected terminations due to an NTD diagnosis. Both these issues affect estimates of the prevalence of NTD-affected pregnancies and different recording practices in various countries can make inter-country comparisons difficult. Despite these limitations, the available data indicate that NTD rates (including terminations) in Australia (1.32/1,000 births) are higher than NTD rates in comparable countries with existing mandatory fortification (Canada (0.58-1.17/1,000 births) and the United States (US) (0.76/1,000 births) or in countries considering mandatory fortification (United Kingdom (UK) (0.57-0.99/1,000 births).
There are limited data on the prevalence of NTDs in various sub-groups of the Australian and New Zealand populations. The incidence of NTDs among Indigenous populations in Western Australia is reported to be nearly double that of thenon-Indigenous population (Bower et al., 2004). There are no comparable data from the Northern Territory. NTD rates in Maori and Pacific Islander populations in New Zealand are similar to, or slightly lower than, those of the non-Maori population (NZMoH, 2003). There are no data on NTD rates among different socio-economic groups in Australia and New Zealand, however, folic acid supplement use is reported to be lower among less educated women and this may affect the NTD rate among this population sub-group.
The mechanism by which folate reduces the risk of NTDs remains uncertain (Pitkin, 2007). Despite this, there is strong evidence from both cohort studies and randomised controlled trials that increased folic acid intake at doses ranging from 400-4,000 µg/day and a related increase in folate status reduces the risk of occurrence and recurrence of a pregnancy affected with an NTD (MRC Vitamin Study, 1991; Czeizel and Dudas, 1992; Berry et al., 1999; Lumley et al., 2001).
B. Folate recommendations
The National Health and Medical Research Council (NHMRC) and the New Zealand Ministry of Health (2006) recommend that ‘women capable of, or planning, pregnancies should consume additional folic acid as a supplement or in the form of fortified foods at a level of 400 µg/day folic acid for at least one month before and three months after conception, in addition to consuming food folate from a varied diet’.
Page 10

It is important to note that this recommendation relates to 400 µg/day folic acid during the peri-conceptional period. Although public health strategies have advised women to increase their intake of foods high in natural folate, this strategy has never been tested in a trial so its efficacy in reducing NTDs is uncertain (Green and Green, 20057).
C. Issues to be addressed
One element of the Ministerial Council Review request required FSANZ to undertake a review of options for addressing NTDs through increasing folic acid intakes, including extensions to voluntary permissions and increasing health promotion and education.
D. Approach adopted by FSANZ
In December 2006, FSANZ engaged Professor Leonie Segal, Division of Health Sciences, University of South Australia, to assess the cost-effectiveness of a number of intervention options for reducing NTDs incidence.
Professor Segal’s report is available as a separate document. (see Attachment 4).
The draft report has been peer reviewed by an expert from the Centre for Health Economics Research and Evaluation at the University of Technology, Sydney. Aspects of the report relating to the interpretation of scientific studies on the relationship between naturally occurring folate and neural tube defects, the interpretation of data relating to dietary intake of naturally occurring folate and the effectiveness of interventions based on supplement promotion will also be peer reviewed by an expert in folate nutrition.
7 FSANZ commissioned report available at www.foodstandards.gov.au
Page 11

Chapter 3: Effectiveness and safety of mandatory fortification
At a glance:Effectiveness
Voluntary fortification of the food supply and promotion of supplements have contributed to reducing the incidence of NTDs in Australia and New Zealand.
Based on current consumption patterns of bread in the target population, mandatory fortification at the level recommended by FSANZ is expected to further reduce the number of NTD-affected pregnancies by 14-49 in Australia and by4-14 in New Zealand each year.
Mandatory fortification has significantly reduced the incidence of NTDs in the US and Canada.
A reported fall in supplement use in the US may have contributed to recent falls in folate status in the target population, although the folate status is still well above the pre-fortification level.
Safety
A small number of young children may exceed the upper level of intake (UL8) for folate for their age but no child approaches the margin of safety margin built into the UL (i.e. five times the UL).
Excluding intake from supplements, no person aged 70 years and over is expected to exceed the UL.
New Zealand women consuming an 800 µg folic acid supplement (the dose recommended by the New Zealand Ministry of Health) are at increased risk of exceeding the UL.
There is no evidence to date of increased risk of cancer, miscarriage, twinning or a decline in cognitive function from mandatory folic acid fortification.
There remain, however, some scientific uncertainties and for these reasons FSANZ has adopted a conservative approach to mandatory fortification.
The Folate Scientific Advisory Group convened by FSANZ has reviewed the updated risk assessment and agrees with FSANZ’s conclusions.
8 The UL is the ‘highest average daily nutrient intake level likely to pose no adverse health effects to almost all individuals in the general population’ (NHMRC and NZMoH, 2006).
Page 12

A. Issues to be addressed
The Ministerial Council review request suggested that FSANZ further examine the effectiveness and safety of mandatory fortification. In particular, FSANZ was asked to further consider the potential for excesses or imbalances in population sub-groups along with the risk of any adverse health effects (such as risks associated with the masking of B12 deficiency).
B. Approach adopted by FSANZ
The Final Assessment prepared by FSANZ included detailed information about both the effectiveness and safety of mandatory fortification. However, since Final Assessment a number of new papers have been published in relation to both of these issues.
FSANZ thoroughly reviewed each of these new papers and a summary of each, along with the key findings, is included in Attachment 1.
FSANZ’s assessment of effectiveness and safety was based on the revised dietary intake assessments as detailed in Chapter 4 (and Attachment 2).
FSANZ also reconvened the Folate Scientific Advisory Group9 to review and provide feedback on the updated assessment and discussions have been held with relevant people in the US regarding the effectiveness and safety of mandatory fortification in their country.
C. Summary of findings – Effectiveness
(i) Impact of folic acid supplements and voluntary fortification on NTD rates in Australia and New Zealand
At Final Assessment, FSANZ concluded that alternative strategies to increase folic acid intakes such as the promotion and use of folic acid supplements by women of child-bearing age and voluntary fortification (introduced in 1995) have contributed to falls in the rate of NTDs of between 10-30% in Australian states with good quality data on pregnancy terminations.
Despite this, reported use of supplements peri-conceptionally and at the right dose among women of child-bearing age is relatively low in Australia and New Zealand, particularly among younger women and women with unplanned pregnancies (see Attachment 1).
9 This group consists of clinicians and public health nutritionists with expertise in epidemiology and/or folate nutrition.
Page 13

(ii) Effectiveness of mandatory folic acid fortification in the US and Canada
Mandatory folic acid fortification in the US and Canada is making a substantial contribution to increasing folic acid intakes among women of child-bearing age and this has contributed to the substantial fall in NTD rates previously reported. Recent evidence in the US, however, indicates that increases in folic acid intake may not be occurring across all population sub-groups.
Early in 2007, the US reported a fall in folate status among women of child-bearing age of 16% over the period 1999-2000 to 2003-2004; although the folate status of the target group is still well above the level reported prior to the introduction of mandatory fortification in 1998 (Figure 1).
Figure 1: Changes in folate status among women of child-bearing age in the US – pre and post mandatory fortification
Several plausible explanations for the decline were given. Most important, is evidence of a fall in supplement use by the target population. This is of particular concern for Australia and New Zealand if mandatory fortification is introduced and highlights the need for ongoing promotion and monitoring of supplement use.
Page 14
Serum folate (ng/mL) over time NHANES surveys, women aged 15-44 yrs, 10th, 50th & 90th centiles
0369
121518212427
1988-94 1999-00 99-00a 01-02a 03-04a
seru
m fo
late
, ng/
mL
All women Non pregnant women

(iii) Expected effectiveness of mandatory folic acid fortification in Australia and New Zealand
FSANZ has investigated potential changes in bread consumption patterns from a variety of different data sources and concludes that the proportion of women consuming bread and the amount consumed across different age and income groups is similar to that reported in the 1995 and 1997 national nutrition surveys in Australia and New Zealand.
As a result, mandatory fortification of bread-making flour in Australia and bread in New Zealand is estimated to reduce the number of NTD-affected pregnancies by 14-49 (or up to 14%) in Australia and by 4-14 (or up to 20%) in New Zealand. This expected outcome is unchanged from that reported at Final Assessment.
D. Summary of findings – Safety
(i) Excessive intakes
Existing voluntary fortification permissions and the proposed mandatory fortification together will contribute on average about 200 µg of folic acid per day to the target group in Australia and New Zealand, assuming no significant changes to foods that are currently voluntarily fortified. FSANZ has estimated that this is the maximum increase in average folic acid intakes that can be achieved with fortification strategies without resulting in too many people, particularly young children, exceeding the UL.
In Australia, FSANZ has estimated that about 9%10 of 2-3 year olds will exceed the UL based on intake of foods that are voluntarily fortified and the proposed mandatory fortification of flour – it excludes folic acid intake from supplements. The adult UL for folate (1,000 µg/day as folic acid) is based on minimising the risk of masking the neurological effects associated with vitamin B12 deficiency. While there are other potential health risks from high doses of folic acid (see next section), the UL is not relevant to any other disease or condition except the risk of masking the diagnosis of vitamin B12 deficiency.
Vitamin B12 deficiency is fairly common in the elderly due to malabsorption of the vitamin – it is rarely caused by inadequate dietary intakes. The adult UL has been extrapolated to children and adjusted to reflect their lower body weight. The UL includes a fivefold safety margin – i.e. it is one-fifth the level at which vitamin B12 masking is likely to occur. While it would be preferable for no child to exceed the UL, no child approaches a level of intake five times higher than the UL for their age. Among adults, the proportion likely to exceed the UL from mandatory fortification in Australia or New Zealand is very low: 0-<1%. No-one aged 70 years and over is expected to exceed the UL (95th percentile of intake in this age group is about 460 µg per day).
10 This proportion is higher than previously published at Final Assessment (6%) because intakes from voluntarily fortified foods have been adjusted upwards to account for new market share data and the number of foods assumed to contain bread-making flour has increased slightly.
Page 15

Similar to the dietary intake assessment undertaken at Final Assessment, FSANZ has re-estimated folic acid intakes from fortified foods and two supplement doses for women aged 16-44 years in Australia (200 and 500 µg) and in New Zealand (200 and 800 µg). Only New Zealand women who consume a daily 800 µg supplement (the dose recommended by the New Zealand Ministry of Health) would be at risk of exceeding the UL.
ii) Potential health risks
Cancer
FSANZ’s review of the epidemiological literature on folate and cancer undertaken at Final Assessment (see Attachment 6 of the Final Assessment Report) concluded that there was no increase in cancer risk from the increase in folic acid intakes likely from mandatory fortification.
Papers published since Final Assessment covering the potential risk or benefit of colorectal cancer, prostate cancer, stomach cancer and breast cancer from increased dietary folate or supplemental folic acid do not change FSANZ’s earlier conclusion that increased folate or folic acid intake does not increase or reduce cancer risk.
The recently released report from the UK ‘Folate and disease prevention’ (SACN, 2006a) also concluded that ‘the evidence for an association between folic acid and increased or reduced cancer risk in humans is equivocal. No randomised controlled trials designed to investigate the relationship between folic acid and cancer incidence have yet been reported’.
Twinning
Similar to that reported at Final Assessment, there is no significant evidence of increased risk of twinning as a result of the expected increases in folic acid intake from mandatory fortification.
Cognitive function
Similar to that reported at Final Assessment, the additional evidence does not support an association between folate intake and cognitive function. The recently reported results from the National Health and Nutrition Examination Survey in the US linking increased cognitive decline with a low vitamin B12 status and high folate status are unusual and suggestive of a B12/folic acid interaction, but a cross-sectional study does not indicate a causal relationship. The results do, however, highlight the need for ongoing monitoring of B12 status among older people bearing in mind that a low B12 status is not always evident in haematological analysis and neurological symptoms may be the only clinical manifestation of B12 deficiency.
Page 16
Miscarriage
FSANZ did not report the potential increased risk of miscarriage from increased folic acid intake at Final Assessment but this was raised as an issue during the First Review consultations.
Based on a review of three randomised trials that examined miscarriage as an outcome of folate supplementation and results from a large scale intervention study in China and a Swedish case control study, there is no increased risk of miscarriage from the increases in folic acid intake expected from mandatory fortification.
Other potential health risks
At Final Assessment, FSANZ addressed other potential health risks from increases in folic acid intake including: impact on the gene pool and unmetabolised folic acid circulating in the blood. Both of these potential risks were also addressed in the UK report. Both reports concluded that there is insufficient evidence linking increased folic acid intake, particularly over the long term, to negative health outcomes from these conditions.
Page 17

Chapter 4: Dietary intake assessments
At a glance: Bread is a staple food consumed regularly and widely by women of child-bearing
age.
We examined other foods as potential food vehicles but found that they reached a smaller proportion of the target group or contributed a higher proportion of food consumption of young children; or that it is not technically feasible to fortify them.
The mean population folic acid intakes for the voluntary scenarios considered were lower that those achieved by mandatory fortification.
Although available food consumption data are 12 years old, these are the most recent record of diets of individuals. We have validated the data through other more recent data sources. This gives us confidence that our intake assessments provide the best possible estimates.
Our approach to dietary intake assessments generally and the more specific folic acid estimates have been peer reviewed by international experts.
The differences between the folic acid intake assessments for Australian and New Zealand children seems to be largely the result of different methodological approaches.
A. Issues to be addressed
In the First Review request, a number of issues were raised that related to dietary intake assessments for folic acid. These are outlined below and a summary response to each issue provided.
B. Approach adopted by FSANZ
The new work undertaken for the First Review assumed that, as previously, the overall aim of any fortification program is to ensure that folic acid intakes are maximised for the target group whilst minimising intakes for all population groups that exceed the UL. Further details of the dietary intake assessments undertaken to underpin each response are provided at Attachment 2, with Section A describing the approach taken and Section B the results.
Page 18

C. Summary of findings
i) Fortification vehicle for the addition of folic acid to the food supply - bread-making flour as the food vehicle for Australia and retaining the option of bread as the food vehicle in New Zealand.
The dietary intake assessment undertaken for the First Review reflects these options which the First Review request required FSANZ to consider. The proposed option of adding 200 g11 folic acid/100 g wheat flour for bread-making purposes for Australia and 135 g folic acid/100 g bread for New Zealand results in the same outcome for total folic acid intakes in both countries as that presented previously at Final Assessment for the target group of women of child-bearing age (see Attachment 2, Sections 3, 7.2, 7.3).
ii) Potential benefit of extending voluntary fortification as an alternative to mandatory fortification.
One of the elements of the First Review Request was a requirement to undertake a review of options for increasing folic acid intakes. One of these options is the increased use of voluntary fortification permissions by the food industry. Discussions with the food industry resulted in two new extended voluntary permission scenarios being developed involving higher levels of uptake of permissions across a broader range of food groups.
Results from these two scenarios and the voluntary fortification scenario previously presented at Final Assessment indicate that mean population folic acid intakes for all three voluntary scenarios would be lower that those achieved by mandatory fortification. The uncertainty of the outcome in relation to folic acid intakes is also greater under a voluntary scheme because of the unknown factor of how consumers will actually behave when given a choice of whether to eat a fortified or unfortified food product or not (see Attachment 2, Section 7.2).
iii) Assessment of folic acid intakes across all population subgroups in terms of excesses or imbalances.
FSANZ has estimated the intake of naturally occurring folate and dietary folate equivalents (DFEs)12 as well as folic acid intakes by general population groups within Australia and New Zealand to determine the impact on population groups other than the target group (women aged 16-44 years) from folic acid fortification.
11 This is the residual level expected in the fortified flour in the final food as consumed (bread and bread products).12 Dietary Folate Equivalent (g DFE)= (g food folate) + (g folic acid x 1.67).
Page 19

Under the mandatory fortifications scenarios modelled at the First Review, the mean folic acid intakes for the target group were > 200 g folic acid/day, with an increase in 100 μg/day for Australia and 140 μg/day for New Zealand women of child-bearing age compared to baseline intakes. The current uptake of voluntary permissions to add folic acid were included in the baseline estimates (see Attachment 2, Section 7.2.1). A supplement would still be required for this group to reach their target intake of 400 μg/day to prevent NTDs for both the mandatory and voluntary scenarios (see Attachment 2, Section 7.2.2).
A low proportion of all population groups exceeded the UL of intake for folic acid under the mandatory scenario (see Attachment 2, Section 7.2.3). For an extension of voluntary permissions, FSANZ is unable to predict how consumers may actually behave in relation to consuming fortified products, however, an individual consumer who always consumes the fortified products may achieve higher folic acid intakes than under the mandatory option, and may also potentially be more at risk of exceeding the UL (see Attachment 2, Section 7.2.3).
In relation to folate intakes, FSANZ sought to establish which population groups were currently meeting their Estimate Average Requirement (EAR) for DFEs, whether any were falling short of the NHMRC recommendations, and whether mandatory fortification could be effective in addressing inadequate DFE intakes. Currently, 7% of the Australian population (aged 2 years and over) and 50% of the New Zealand population (aged 15 years and over) are estimated to have DFE intakes below their EAR. A comparison between the dietary folate concentration data available for Australia and New Zealand indicates that there are differences in dietary folate concentrations between Australian and New Zealand foods. In addition, New Zealand and Australia have different uptakes of voluntary folic acid fortification. Both of these factors may contribute to the differences between the Australian and New Zealand estimated DFEs intakes.The outcome under the proposed mandatory option is that the proportion of people with DFE intakes below their EAR would be reduced to 1% Australian population and 4% New Zealand population (see Attachment 2, Section 7.4).
iv) Whether bread and bread products are the best food vehicle
At the start of the proposal to consider mandatory fortification with folic acid, FSANZ considered suitable food vehicles for fortification. The initial criteria being that the food had to be regularly and consistently consumed by a large proportion of the target group in all socio-economic groups and that it was technically feasible to fortify the food. Foods considered as potential food vehicles included milks (full and reduced fat), fruit juices, breakfast cereals, yoghurts and soy beverage as well as bread and bread products. Milk and milk products and bread and bread products best met the initial criteria (See Attachment 2, Section 4.2, Figure 6).
On further investigation of the 1995 data, reduced or low fat milks were considered as a potential vehicle as well as bread because a higher proportion of women in the target group consumed these milks than children aged 2-3 years (target group - 36% reduced/low fat; children 2-3 years - 10% reduced/low fat.
Page 20

However, more recent data indicate that a higher proportion of all population groups now consume reduced/low fat milks, and as milk forms a much larger component of young children’s diets relative to adults the mandatory fortification of reduced fat milk was considered likely to cause excessive folic acid intakes for this population group. It was also noted that current dietary advice for children aged 2 years and over is to consume reduced fat not full fat milk (NHMRC Dietary Guidelines for Children and Adolescents in Australia, 2003; Ministry of Health Food and Nutrition Guidelines for Healthy Children Aged 2-12 years: a background paper, 1997). See Attachment 2, Section 4.2 for more details. v) Whether the food consumption data used in the dietary intake
assessments reflect current food consumption patterns
To accurately estimate the impact of fortification on folic acid intakes, individual records of food habits are required. The most recent surveys on food consumption patterns at national level that report individual people’s consumption patterns are the 1995 NNS for Australia, the 1997 NNS for New Zealand adults over 15 years and the 2002 NNS for New Zealand children aged 5-14 years. FSANZ recognises that one of the limitations of these survey data is that food consumption patterns may have changed since the date of the survey and new foods introduced into the market.
FSANZ uses more up-to-date information on consumers’ food consumption patterns to validate the 1995 and 1997 NNS data, for example, the proportion of people reporting consuming bread and milk was checked using the Australian Dairy Corporation Survey conducted in 2002, the Roy Morgan Single Source Survey (2001-2006) and the Young Australians Survey (2004-2006). The proportion of people reporting consuming bread (80-85%) and overall amount consumed across different age and income groups appears to be similar now to that reported in 1995 and 1997 (See Attachment 2, Section 3).
Broad trends in sales by volume and value of bread and other food categories are tracked by use of industry publications, such as the annual Retail World’s Australasia Grocery Report. These data are of limited use to estimate changes at an individual level but are useful to estimate the market share of leading brands within any given food category. Recent changes in fortification levels in foods were accounted for by using recent folic acid analyses of foods and adjusting the folic acid concentration level assigned to foods in the dietary intake assessment by using a market weighted value, that takes the current proportion of fortified to unfortified product in each food category into account. The methodology of using market weighted folic acid concentrations in foods (from the Final Assessment Report on folic acid intake assessments) was peer reviewed by Dr Philippe Verger, the external international expert from France (see Attachment 2, Sections.3.3, 3.4, 6.3).
Page 21

vi) Differences between estimated folic acid intakes for young children submitted by the New Zealand government higher than those predicted for Australian children of a similar age
The main differences between the two assessments were that the New Zealand childrens’ assessment used a single day of data only whereas the Australian assessment used a second day adjustment; the age groups were slightly different (aged 5-8 years) compared to Australia (aged 4-8 years); and the New Zealand data were weighted according to the expected proportion of Maori and Pacific Islander groups.
The use of a single day un-adjusted methodology for the New Zealand childrens’ assessment may account for a significant proportion of the differences in results. Generally the distribution of intakes for a one day survey is expected to be wider than that using an adjustment for a second day of intake as the latter aims to better represent ‘usual’ intake over time. Using the second day adjustment for the Australian children decreased the proportion of children exceeding the UL from 9% to 3%. The impact of the age difference or population weighting is not known. It is recognised that food consumption patterns may have changed between 1995 and 2002 and that these changes may account for some differences (see Attachment 2, Section 7.3).
vii) Adequacy of the procedures for undertaking dietary intake assessments
FSANZ procedures and the computer program DIAMOND used to undertake dietary intake assessments are continuously being updated and enhanced. International developments are also monitored by FSANZ and incorporated in our procedures where relevant to ensure that FSANZ continues to employ best practice. Dr Mike DiNovi, an international expert in dietary exposure assessments from the US Food and Drug Administration, recently reviewed all FSANZ dietary intake/exposure assessment principles and modelling procedures and the supporting systems. The conclusions from the peer reviewer were overall very positive in terms of the FSANZ dietary modelling capability, expertise of staff and that the methodologies used by FSANZ being consistent with international best practice (see Attachment 2, Section 3.1).
The Final Assessment Report on folic acid intake assessments was also peer reviewed by an external international expert from France, Dr Philippe Verger, and comments made incorporated into the dietary intake estimates undertaken for the First Review report. For example, an assessment of the impact on consumers who avoid or select the fortified product where voluntary permissions exist is now included (see Attachment 2, Section 6).
Page 22

Chapter 5: Issues specific to mandatory fortification of bread-making flour in Australia
At a glance:In Australia it is proposed that:
the mandatory fortification Standard apply to ‘wheat flour for making bread’ and that the current mandatory requirements for the addition of thiamin will need to be made consistent with this.
the prescribed range for mandatory folic acid fortification be 200 – 300 µg of folic acid per 100 g of bread-making flour to achieve 200 µg of folic acid in the flour consumed as bread.
improved fortification equipment and quality assurance in mills will be required in order to meet any mandatory fortification standard.
A. Context
In July 2006, at Draft Assessment, FSANZ proposed the mandatory fortification of bread-making flour in Australia and New Zealand with 2.3 – 2.8 mg of folic acid per kg of flour (230 – 280 µg folic acid per 100 gm flour).
FSANZ was guided by successful experiences in the US and Canada in selecting flour as an effective and technically feasible food vehicle for fortification. The fortification of bread-making flour was also consistent with the existing mandatory requirement to fortify bread-making flour with thiamin, in Australia.
Following public submissions and further targeted consultation, industry expressed concerns about the high degree of impost, citing the inability of industry to fortify bread-making flour within the required parameters. The fortification of bread-making flour was considered particularly problematic for New Zealand, who did not have any fortification infrastructure in place.
At Final Assessment in October 2006, FSANZ refined the approach to specifically require mandatory fortification of bread as the final food consumed at 80-180 µg of folic acid per 100 grams of bread. This would allow bread manufacturers to choose the method of addition of folic acid to bread.
Page 23
B. Issues to be addressed
As part of the review, the Ministerial Council has asked FSANZ to:
re-consider the mandatory fortification of bread-making flour in Australia; and
develop a mandatory fortification food standard which allows New Zealand to maintain the fortification of bread, while allowing the fortification of bread-making flour in Australia. This change was requested because of technical, compliance and cost issues relating to the fortification of bread in Australia.
C. FSANZ approach to the issue
In order to address the issues detailed above, FSANZ:
contracted GP McMullen Consulting (McMullen) to undertake an investigation of the Australian milling industry, and current practice in the fortification of bread-making flour in Australia. Industry was asked their view on effective compliance with the mandatory folic acid fortification standard as proposed at Draft Assessment. Potential difficulties and barriers to effective implementation of the standard were then identified, and are addressed; and
sought advice on overseas experience with fortification from an international fortification and milling consultant, Quentin Johnson13.
The final report from McMullen is at Attachment 3. The following provides an overview of the key outcomes of this report. In addition, the Flour Millers’ Council of Australia (FMCA) commissioned an independent report14 examining the technical feasibility and cost implications for the Australian milling industry. This information has been considered by FSANZ’s consultants and has also informed the consideration of costs associated with mandatory fortification of bread-making flour (see Chapter 6).
D. Bread-making flour in Australia
As part of McMullen’s investigation into Australian milling operations, the industry was consulted on their understanding of what type of flour constituted ‘bread-making flour’.
The main flour produced by Australian mills is ‘Bakers flour’ milled from wheat grain. ‘Bakers flour’ is pre-dominantly used for bread-making, and is also commonly used in a wide range of other products, such as muffins, bread crumbs, crumpets, scones and pikelets.
13 Quentin Johnson, QUICAN Inc., March 2007. 14 Richard Eliott, Milling Consulting Service Pty Ltd, February 2007.
Page 24
The majority of bread is made from wheat flour; although a range of other cereals and grains may be used in some types of bread e.g. barley, rye and triticale. The total of these other grains milled in Australia is estimated at less than 10%.
Industry noted that requiring fortification of other milled cereals would create difficulty in determining which flours should or shouldn’t be fortified and increase the need for flour segregation. These factors, and the resulting operational complexity, would have cost implications. It is for these reasons that FSANZ is proposing that flour milled from grains other than wheat be excluded from mandatory fortification given the practical difficulties for industry.
It is therefore intended that only ‘flour used for bread-making that comes from the cereal grain wheat’ be captured by the mandatory standard for folic acid fortification. For consistency FSANZ intends to also amend the existing mandatory standard for thiamin to clarify ‘flour for making bread’ as being ‘wheat flour for making bread’. FSANZ understands that this is what currently occurs in practice.
The milling industry has however raised concerns regarding their inability as a supplier to monitor the end use of ‘wheat flour for bread-making’. ‘Bakers flour’ is used predominately for bread-making and millers might therefore be expected to have some understanding of the flour end use. However where this may not be clear, millers will need to indicate that flour has been fortified and the end user will therefore be informed and can ensure that other products containing fortified flour (through voluntary permissions) are labelled appropriately.
E. Fortification infrastructure of flour milling in Australia
Currently, flour for bread-making is required to contain no less than 6.4 mg/kg of thiamin in Australia. In addition, voluntary permissions for cereal flours allow the addition of other micronutrients e.g. folic acid and iron. Millers usually add more nutrient, or ‘overage’15, to ensure compliance with these regulations.
McMullen reports that crude feeders are typically used to fortify flour with thiamin or folic acid, whereby a feeder discharges a vitamin premix at a predetermined rate adjusted to the flour flow rate. The equipment used is relatively crude and the level of monitoring could be described as minimal in many mills. Little or no sampling and testing of thiamin currently occurs. Mills rely on external commercial laboratories to test samples, which may be tested randomly, every week, or six monthly. Overages may be up to 30% in small to medium mills, and may be over 100% on some occasions.
15 Overages are defined as ‘the practice whereby manufacturers add more vitamins and minerals to account for losses during processing and storage’.
Page 25

i) Industry requirements with mandatory fortification
At Draft Assessment, FSANZ proposed the addition of folic acid at the level of 230 -280 μg/100 g of flour. Industry has raised concerns about their ability to meet this range citing a need for significant upgrades to their current milling operations in terms of equipment and processes. Industry has provided projected costings for these upgrades (see Chapter 6).
McMullen reports that based on international experience there is feeder equipment available which can be installed and operated based on existing mill operations that will enable industry to fortify flour with the required range of folic acid fortification. This will however, require a greater degree of control over the feeding rate and ability to detect changes in delivery rate than currently exists, in order to achieve compliance within the proposed range. Overseas experience indicates that mills can be retrofitted with feeders and feedback mechanisms which detect changes in the flour flow rate and folic acid feeding rate quite easily.
In addition, McMullen notes the following two concerns raised by industry:
obligations under their procedures and quality systems to meet the proposed regulatory limits; and
future legal liability should any food safety issues arise and it has been shown that the required range has not been met.
McMullen highlights the importance of enforcement agencies working with industry to constructively address issues in relation to fortification of bread-making flour when they arise. He also outlines a number of suggested actions to assist industry in their compliance with the proposed mandatory standard. Further discussion on the proposed approach to addressing these actions in relation to enforcement and implementation is provided at Chapter 6.
As previously discussed at Draft Assessment, FSANZ has sought advice from the Australian Government Solicitor who has advised that millers would be protected from liability where they have complied with a mandatory standard as defined in the Trade Practices Act 1974.
ii) Fortification range
On the basis of the advice received, FSANZ is proposing a prescribed range of fortification for the mandatory folic acid standard. In order to fortify bread-making flour at residual levels of 200 µg of folic acid per 100 g of bread-making flour in the final food, the range should take into account inherent variability in the fortification process and folic acid baking losses (estimated at 20%).
A tolerance level of + 20% is proposed by McMullen, who reports this would be a reasonable allowance based on discussions with industry. This range would allow for the use of feeders to be retrofitted to existing mills (both large and small) without the need for blending systems as proposed by the Eliott report.
Page 26
This range will provide greater flexibility for compliance, compared with the + 10% tolerance included in the fortification range proposed at Draft Assessment.
Therefore, FSANZ proposes that should mandatory fortification be endorsed by the Ministerial Council, a prescribed range for mandatory folic acid fortification of 200 – 300 µg of folic acid per 100 g bread-making flour be implemented. This range accounts for the average folic acid losses on baking of 20% (i.e. nutrient equivalent of 200 µg with 20% losses is 250 µg), and allows for a + 20% accuracy in fortification during the milling process.
Based on international milling practices and quantitative testing of fortified flour the revised range is considered to be achievable using current international fortification practices.
Page 27

Chapter 6: Costs associated with mandatory fortification
At a glance: Two scenarios are presented for the compliance costs for the Australian industry:
- low cost: where millers install new equipment to feed folic acid into the flourstream and undertake regular testing; and
- high cost: based on industry advice that the fortification range would require highfrequency analytical testing and major amendments and additions to theirproduction capabilities.
The low cost scenario is considered realistic by the consultants engaged by FSANZ who base this view on current international practices and outcomes.
Industry compliance costs for New Zealand are unchanged from Final Assessment.
A survey of all Australian jurisdictions indicated significantly lower enforcement costs than reported at Final Assessment. New Zealand enforcement costs remained unchanged.
A. Issues to be addressed
As part of the First Review request, FSANZ was asked to look at the cost methodology both in terms of compliance costs to industry and also enforcement costs to jurisdictions.
The approach adopted by FSANZ, and the results of the further analysis, are described in the following parts.
B. Industry compliance costs
i) Australia
In consultation with industry, FSANZ has revised some costs for the Australian industry of mandatory fortification of bread-making flour with folic acid.
The changes to the costs result from FSANZ amending the cost estimate for equipment and industry, represented by the FMCA, proposing significantly higher costs of equipment and analytical testing. These cost measures are presented in the following table.
Page 28

Table 1: Industry Compliance Costs Australia(folic acid fortification in bread-making flour)
Australia(folic acid fortification of bread-making flour)
NZ(folic acid fortification of bread)
Low case16 High case17 Mid case
(A$m) (A$m) (NZ$m)
Upfront CostsLabelling 2.486 2.486 0.436Packaging write-off 4.000 4.000 0.500Equipment 1.400 22.100 0.080Total upfront costs 7.886 28.586 1.013
OngoingPremix (incl. folic acid) 0.164 1.787Analytical Testing 0.673 11.91418 2.25319
Administration 0.187 0.187 0.109Clean Out Mill 0.035 0.035Total ongoing costs 1.059 12.135 4.150
The major differences in Australian costs relate to equipment and testing.
In relation to equipment:
the low end costs are based on replacement of existing feeders by new micro-feeders that can accurately deliver the prescribed range of folic acid and thiamin into the flour stream. No other equipment is necessary (Cost: up to $50,000 per mill and $1.4 million for all Australian industry).
the high end costs are based on the advice from industry that the narrow fortification range requires real time analytical testing and holding of batches of flour until cleared (Cost: up to $1 million per mill and $22.1 million for all Australian industry). Industry advises that these conditions require substantial modification to production systems and new equipment and facilities including:
- new micro-feeders and modification to dosing systems (all 28 mills);- new premix plants for 2 (out of 28) mills;- new folic acid testing equipment (all mills), new laboratory facilities (19
mills), new staff and training;- new storage bins capable of holding 32 hours production;- new returns areas (13 mills); and- production re-design, modification and re-build (in some cases) to facilitate
re-processing of non-compliant flour.
16 FSANZ cost measures with amended equipment costs.17 FMCA cost measures, with higher equipment and analytical testing costs.18 This figure includes costs of folic acid and premix as well as analytical testing.19 New Zealand industry has indicated that this is a minimum based on their expectations of enforcement activity.
Page 29
In relation to analytical testing:
the low end costs are based on millers sampling and testing at least 2 times per month. Samples would be sent to external laboratories. Testing would not disrupt the continuous 24 hour production of flour and no on-site holding while awaiting test results would be required. Discussions with jurisdictions indicate that a low level of testing for enforcement purposes would be appropriate to meet compliance requirements; and
the high end costs are based on industry estimates of millers sampling and testing 2–4 times per hour. Testing would occur onsite, at each miller’s laboratory, and take 9–10 hours. Industry has indicated that for some sites this would necessitate building and staffing a 24 hour laboratory. Each batch of flour would also be held in storage until cleared. This is based on industry’s expectations in relation to the compliance requirements of jurisdictions along with their own quality assurance requirements.
The flour milling industry, represented by the Flour Millers Council of Australia (FMCA), indicated that the specified range for fortification would have serious implications for the milling process. To meet the requirement of fortifying within a lower and upper limit, the FMCA indicated that each batch of flour would have to be tested and stored at the mill until the test results showed it to be within specification. This would require millers to invest in new storage facilities, new analytical testing facilities, premix manufacturing facilities, re-configuring production systems including returns areas and capable of mixing back any out-of-specification batches. The FMCA have also indicated that this impost is likely to result in the closure of a number of the smaller mills.
International perspective
Flour millers in South Africa, Asia, the Pacific and North America routinely fortify bread-making flour with additives including minerals, vitamins and folic acid, through micro-feeders of volumetric or gravimetric design, and at a cost of between $5,000 to $30,000 per mill.
Both McMullen and Johnson indicated that the systems proposed by FMCA appear to be unnecessary based on international practice. Although fortification in these countries requires industry to meet minimum requirements rather than a range as proposed for Australia and New Zealand, outcomes achieved in practice indicate that the equipment used can deliver the proposed range.
FSANZ concludes that a realistic response of flour millers to a mandatory fortification standard would reflect current international fortification practices, that the high case is improbable while the low case would be the most likely and realistic outcome.
Page 30

ii) New Zealand
The costs to New Zealand industry of fortifying bread with folic acid are unchanged from those costs presented at Final Assessment. Industry has confirmed this is the case but has noted that the analytical testing costs are a minimum and are dependent on the level of testing needed to meet the requirements of the New Zealand Food Safety Authority (NZFSA).
C. Enforcement and Compliance costs
At Final Assessment, FSANZ estimated the enforcement costs based on a sample of jurisdictions. In order to improve the rigour of this estimate, FSANZ undertook a survey of all Australian jurisdictions to determine the total cost of enforcing a mandatory standard that would require bread-making flour to be fortified with folic acid.
The survey collected information on key enforcement activities: training staff; raising awareness of industry; auditing flour millers; auditing labels on packaged bread; administration; and complaints. The jurisdictions provided specific data about the level of resources required to undertake each activity, as well as indicating whether these costs would be an upfront expense or ongoing each year. They also reported their strategic approach to enforcing the mandatory standard.
All Australian jurisdictions responded to the survey. The data was collected using the methodology of the Business Cost Calculator.
Australian jurisdictions indicated that auditing flour mills was the most important element in their enforcement strategy. They adopted a fairly consistent approach, with half proposing to audit millers once a year and the other half proposing to audit twice a year.
Jurisdictions indicated that auditing could include sampling bread-making flour at the mill and/or an audit of quality assurance records. The jurisdictions indicated a diverse approach to issues such as training and complaints handling.
FSANZ did not seek data on the enforcement costs of fortification of bread because the NZFSA had already provided this information.
The total costs of enforcing a mandatory standard in Australia and New Zealand were reported to be very low, as indicated in the following table.
Page 31
Table 2: Jurisdictional costs of enforcementAustralia
(enforcing fortification of folic acid in bakers flour)
New Zealand(enforcing fortification of
folic acid in bread)(A$) (NZ$)
Upfront CostsTraining & awareness 27,169 7,920
Ongoing CostsTraining & awareness 2,400Auditing content 74,391Auditing labels 19,017 80,000Administration 13,604 1,320Complaints 14,324Enforcement 4,780Total Ongoing Costs 121,336 88,500
Industry has highlighted the importance of consistent enforcement approaches between jurisdictions.
FSANZ has raised this issue with the jurisdictions and as a result, it has been agreed that a pilot survey be organised to develop a nationally consistent approach (within Australia) to assessing compliance with and enforcement of standards for the mandatory fortification of the food supply with nutrients, such as folic acid or iodine. The pilot will involve an audit type survey with an analytical component to be trialled on thiamin levels in bread-making flour and resultant products.
Informal feedback from the jurisdictions indicates that relevant food industry businesses in Australia would likely be visited once or twice a year to assess compliance with a mandatory standard for the addition of folic acid to wheat flour for bread-making. In this case, the food industry would not be expected to hold flour or flour based products back for testing of nutrient levels prior to dispatch, rather it is expected that over time they would gain the experience of knowing what needs to be done to obtain the required outcome.
Page 32

Chapter 7: Informing Consumers
At a glance:
Current exemptions from labelling provisions that apply to unpackaged breads should remain in place and that the declaration of folic acid as an ingredient in mandatorily fortified bread is not required on unlabelled bread.
There should be no requirement for the mandatory declaration of folic acid in the Nutrition Information Panel of mandatorily fortified bread.
It is proposed that foods (i.e. bread in New Zealand and bread-making flour and products containing bread-making flour in Australia) represented as ‘organic’ will be exempted from mandatory folic acid fortification.
A. Issues to be addressed
The Ministerial Council has requested FSANZ to examine a number of issues which relate broadly to the issue of ensuring that consumers are informed. These include the:
labelling provisions for foods requiring mandatory fortification with folic acid on the grounds of providing adequate information to enable informed choice. The two outstanding labelling issues noted in the Review Request are as follows:
- as unpackaged breads are exempt from general labelling requirements, there is no mechanism to inform consumers of the presence of folic acid in these breads; and
- there is no requirement for the inclusion of the quantity of folate in the nutrition information panel (NIP) on folic acid fortified foods, unless a manufacturer chooses to make a claim about the folate in their product, and again no mechanism to inform consumers of the amount of folic acid in these breads.
issues arising from the fortification of ‘organic’ and ‘natural’ representations on bread fortified with folic acid in relation to fair trading legislation.
B. Labelling
Under existing requirements in the Food Standards Code (the Code), the following products are not subject to requirements for listing ingredients on the label:
unpackaged foods; food made and packaged on the premises from which it is sold; and
Page 33

food packaged in the presence of the purchaser.
Suppliers of foods for retail sale that meet the exemptions listed above are not required to provide ingredient listing, (except in the case of mandatory declarations of certain ingredients) or a NIP to consumers, and the Code does not include provisions that entitle consumers to obtain this information.
Packaged bread is required to include folic acid in the ingredient listing. Retail bread and bread products that are sold packaged are estimated at approximately 70% in Australia, and approximately 80% in New Zealand.
FSANZ considers that the current exemptions from the labelling provisions that apply to unpackaged breads remain in place and that declaration of folic acid as an ingredient in these unlabelled breads is not required. This is consistent with the approach for mandatory fortification of thiamin in bread-making flour in Australia.
C. Nutrition information Panel
Standard 1.2.8 of the Code prescribes the nutrients that are to be declared in the nutrition information panel (NIP). Folate is not one of these mandatory nutrients. Voluntary declaration of folate in the NIP would be considered to be a nutrition claim. Such claims are only permitted when the food contains at least 10% of the recommended dietary intake (RDI) for folate, per reference quantity of the food. This equates to at least 20 µg of dietary folate per 50 g of bread.
FSANZ considers that there should be no requirement for mandatory declaration of folic acid in the NIP of products mandatorily fortified with folic acid because:
the objective of mandatory fortification is to increase total folate intake in peri-conceptional women and to reduce the incidence of NTDs; it is not to provide a means for individuals to calculate folate intake to determine the need for supplementation, and not to act as a replacement for folic acid supplementation for women of child-bearing age;
unless it was required that the declaration in the NIP was for folic acid only, a declaration in the NIP would not be useful to consumers because it would be declared in the form of folate (naturally occurring folate plus the added folic acid). Without knowing their entire daily intake of folic acid including from other sources, as well has having some technical knowledge, consumers would be unable to calculate their need for additional folic acid supplementation; and
mandating the declaration of folate in the NIP would impose costs on the suppliers of bread, including analysis to determine the level of naturally occurring folate and initial relabelling.
Page 34

D. Nutrition and Health Claims
While the review request did not require FSANZ to consider health claims relating to folic acid, this issue has been raised by industry who have noted that if bread-making flour (or bread in New Zealand) is required to be fortified then industry should be able to make claims about folic acid.
FSANZ does not propose making recommendations in relation to health claims in associated with this proposal for mandatory fortification with folic acid. However, FSANZ is currently reviewing the health claims requirements under Proposal P293 – Nutrition, Health and Related Claims.
E. Fortification in relation to ’organic’ and ‘natural’ foods
The New Zealand Commerce Commission (NZCC) had advised that in terms of the Fair Trading Act ('FTA'), the ability of manufacturers of bread products to label products as 'organic' or 'natural' is` likely to be affected by mandatory folic acid fortification.
The NZCC and the Australian Competition and Consumer Commission (ACCC) have provided further advice on the status of products which are labelled ’organic‘ and ’natural‘ under mandatory fortification, and the respective fair trading and trades practices legislation of New Zealand and Australia.
i) ‘Organic’
With regard to organic representations of foods, it is the opinion of the NZCC and the ACCC that the use of the term 'organic' in relation to foods fortified with folic acid (without clear and meaningful qualification) may mislead consumers into believing that the product is the result of organic processes and thus may risk breaching the New Zealand Fair Trading Act 1986 or the Trade Practices Act 1974.
Australia and New Zealand have a number of national organic certification bodies20, none of which have identical standards. Organic standards however generally do not currently allow synthetically produced substances into organic production systems, and vitamins and minerals are generally not permitted.
It is the opinion of the NZCC and ACCC that consumers are likely to expect that foods labeled ‘organic’, or ‘certified organic’ have ingredients derived from living organisms without the use of chemical fertilizers and/or pesticides, and would not contain synthetic vitamins such as folic acid.
As a result, FSANZ is proposing that foods (i.e. bread in New Zealand and bread-making flour and products containing bread-making flour in Australia) represented as organic be exempted from mandatory folic acid fortification.
20 Seven organic certification organisations in Australia, http://organic.com.au/certify/au/, and three in New Zealand http://www.organicsnewzealand.org.nz/organic_certification.htm
Page 35

ii) ‘Natural’
With regard to the use of ’natural’ claims, both the ACCC and NZCC consider this implies that the product is made of natural ingredients, i.e. ingredients nature has produced, not man made or interfered with by man. Folic acid is not a natural ingredient, therefore ’all natural‘ claims for foods containing folic acid could not be used, although the product may be labeled as ‘contains natural ingredients’. Care must still however be taken when labeling a product as ‘contains natural ingredients’ to avoid providing the impression that all of the ingredients in the product are natural.
Given that consumers may view what is ‘natural’ differently to manufacturers and food technologists, making it difficult to classify foods and ingredients, FSANZ is not considering an exemption from mandatory fortification for bread represented as ‘all natural’. Unlike ‘organic’ foods which can be defined by adherence to an organic certification system, there are no certification criteria for ‘all natural’ foods. Manufacturers may however label foods using ’natural ingredients‘, and add additional qualifications in order to produce a label which is unlikely to mislead the consumer.
Page 36

Chapter 8: Implementation and transition
A. Issues to be addressed
While the Ministerial Council did not expressly request FSANZ to consider the issue of implementation and transition, this issue was raised by stakeholders during the consultations that have informed this Issues Paper. FSANZ therefore considers that it is important to discuss the transitional period for implementation of the draft mandatory fortification standard in Australia and New Zealand.
B. Transition period
A transition time for the implementation of a draft standard allowing for the fortification of bread-making flour in Australia, and bread in New Zealand has yet to be determined.
The proposed draft variations to the code as presented at Final Assessment proposed a transition period of 15 months from gazettal. This was extended from 12 months proposed at Draft Assessment, as it was anticipated that a proposal for mandatory iodine fortification (Proposal P230) would be implemented simultaneously.
Industry estimates for the implementation period for mandatory folic acid fortification ranged from as little as six months to over four years. McMullen recommends a lead-time of one to two years should be sufficient for industry to fully comply with folic acid regulations.
i) Implementation of folic acid fortification of bread-making flour in Australia
Fortification of bread-making flour with folic acid will require the milling industry to upgrade existing fortification equipment and systems, in order to achieve the level of precision required by the proposed mandatory standard for folic acid. This is likely to necessitate a different solution and mill set up for each flour mill, due to the individual variation between flour mills.
The transition time must therefore allow industry sufficient time to plan and upgrade fortification operations in each mill, and to develop the quality assurance procedures which meet compliance and enforcement requirements.
ii) Interaction with proposal relating to mandatory fortification with iodine
Proposal P230 – Consideration of Mandatory Fortification with Iodine, is expected to be completed during 2007, and proposes the mandatory replacement of salt with iodised salt in bread. Should the mandatory iodine standard be agreed, ideally the implementation of the two standards would align to minimise costs to industry.
Page 37

FSANZ therefore proposes a transition period of two years for folic acid should mandatory fortification be introduced.
C. Industry assistance
Should the Ministerial Council decide to adopt mandatory fortification, FSANZ will (in association with industry) develop an implementation guide on the proposed Standard for dissemination through the milling and baking industry professional and training associations in Australia and New Zealand.
Page 38
Chapter 9: Monitoring, communication and education
A. Issues to be addressed
The First Review request noted the importance of monitoring, communication and education. FSANZ has also consistently made this point.
B. Monitoring
Monitoring and review is a fundamental component of any mandatory or expanded voluntary fortification program to enable assessment of changes in folic acid intakes, blood status as well as expected health outcomes (NTD rates) and unexpected outcomes (potential for adverse health effects).
The responsibility for establishing and funding a monitoring system to assess the impact of a mandatory or expanded voluntary fortification on the population extends beyond FSANZ’s responsibilities under the FSANZ Act and requires involvement of health and regulatory agencies at a Commonwealth, State and Territory level in Australia and the New Zealand Government.
In October 2006 recommendations were made to the Ministerial Council (by a Food Regulation Standing Committee (FRSC) sub-group) on a bi-national monitoring system for folic acid for Australia and New Zealand. Subsequently, the FRSC has agreed to seek AHMAC advice on a monitoring framework and that the framework for monitoring impact of folic acid fortification be integrated with other existing and proposed nutrition and health outcome monitoring systems.
B. Communication and education
If mandatory fortification of folic acid is adopted, this is only one strategy in NTD prevention, and other strategies will continue to be important including the existing voluntary folic acid fortification of other foods, the promotion of folic acid supplements and education for women of child-bearing age.
Another critical aspect of any mandatory fortification program is communication and education. If the proposed mandatory standard for folic acid fortification is agreed, FSANZ will implement an education program focused on educating people about the new standard (particularly industry).
FSANZ does, however, note that if the desired outcomes are to be achieved, a broader on-going education initiative will be desirable and there will be a wide range of organisations with a role to play.
Page 39
References
Attachment 1: Additional information on effectiveness and safety
1. Effectiveness of the proposed mandatory fortification
Situation at Final Assessment
Public health strategies to increase folic acid intake include: the promotion of folic acid supplements to women of child-bearing age, voluntary fortification and mandatory fortification. Women are also advised to increase their intake of foods high in natural folate although this strategy to reduce NTD incidence has never been tested in a trial and so its efficacy is uncertain (Green and Green, 200521).
Folic acid supplements have been promoted in Australia and New Zealand since the early 1990s. Despite strategies to increase awareness and use of folic acid supplements by women of child-bearing age, reported use at the appropriate time (peri-conceptionally) and in the recommended dose (400 µg per day) is relatively low – less than one in three women who had had a liveborn baby (Bower et al., 2005). Approximately 40% of all pregnancies in Australia are unplanned (Bower et al., 2005; Watson et al., 2006; Conlin et al., 2006b) with evidence of a higher proportion (>50%) in New Zealand (Schader and Corwin, 1999) and this is likely to be contributing to the low uptake of folic acid supplements among women of child-bearing age.
Voluntary folic acid fortification of selected foods has been permitted in Australia and New Zealand since 1995. While a range of foods can be fortified, breakfast cereals and breads make up the majority of currently fortified foods. Voluntary fortification is estimated to have increased mean daily folic acid intakes among the target population by 108 µg in Australia and by 62 µg in New Zealand22. Median intakes in both countries are much lower, suggesting that some women are consuming larger amounts of fortified foods whereas the majority are consuming low amounts.
Both folic acid supplements and voluntary fortification are likely to have contributed to increases in folate status in Australia (Metz et al., 2002; Hickling et al., 2005) and falls in reported NTD rates in some states in Australia (South Australia, Western Australia and Victoria) of between 10-30% since the mid 1990s (Lancaster and Hurst, 2001; Bower, 2003; Victorian Perinatal Data Collection Unit, 2005).
FSANZ has estimated that mandatory fortification of bread-making flour23 (200 µg/100 g flour in the final product) will further increase mean daily folic acid intakes (i.e. in addition to current folic acid intakes from voluntary fortification) by 100 µg 21 FSANZ commissioned report available at www.foodstandards.gov.au22 FSANZ estimates of the contribution of voluntary fortification have increased slightly from those reported at final assessment due to updated market share data.23 The Review requested that FSANZ consider a standard for bread-making flour in Australia and bread in New Zealand. At Final Assessment the standard referred to bread in both countries.
Page 40

among women of child-bearing age in Australia. Mandatory fortification of bread (135 µg/100 g bread) in New Zealand is estimated to increase mean daily intakes among the target population by 136 µg. These increases in intake are estimated to further reduce the number of NTD-affected pregnancies by 14-49 (or up to 14%) in Australia and by 4-14 (or up to 20%) in New Zealand.
The expected reductions in NTDs are lower than has been achieved in the US and Canada. In the US, the reduction in NTDs is associated with a mean increase in folic acid intakes among women of child-bearing age of about 200 µg/day following the introduction of mandatory folic acid fortification – although an increase of 100 µg/day was predicted (Choumenkovitch et al., 2002). The US aimed for a 50% fall in NTDs but achieved about 26% in the period 1995-96 to 1999-00 (USCDC, 2004); although this is likely to be an under-estimate because of poor case ascertainment rates.
Papers published since Final Assessment
Folic acid supplement use
A 2005 Adelaide study reported that just 30% of a sample of 304 pregnant women complied with the recommendations for folic acid supplement use (both timing and dose) (this is a similar proportion to the earlier study reported by Bower et al. (2005)) and 27% took no folic acid supplements at all (Conlin et al., 2006a).
A small New Zealand study involving just over 100 women aged 17-44 years who had just given birth found that among women who planned their pregnancy, 53% used folic acid before conception. The use of folic acid supplements by women who had not planned their pregnancy or were younger (<25 years) was much lower (about 10%) (Dobson et al., 2006). Neither dose nor duration of peri-conceptional folic acid supplementation was considered in the study, although the authors noted that the main folic acid supplement available for sale in New Zealand contains a daily dose of 800 µg.
The March of Dimes Foundation24 reported that between 1995 and 2005, there was a modest increase in folic acid supplement use among non-pregnant women in the US (from 25% to 31%) but the majority of women aged 18-45 years, particularly younger women (18-24 years) those with less education (less than high school) and those with lower household incomes do not take folic acid supplements daily (Green-Raleigh et al., 2006).
International folate/folic acid intakes and NTD rates
In an international assessment of surveillance systems between 1988 and 1998 in Australia, Europe, the UK, Canada and the US there was a statistically significant downward trend in NTDs in seven out of the 13 registers – Victoria, Western Australia, Canada, two in the U.S, Dublin and Northern Netherlands (Botto et al., 2006). Only the US and Canada have implemented mandatory fortification and Australia has implemented voluntary fortification.
24 The March of Dimes Foundation was established in the United States more than 80 years ago to improve the health of babies by preventing birth defects, premature birth, and infant mortality.
Page 41

A regional French study25 reported no discernible change in NTD rates between the period 1988-1992 and 1996-2002 despite recommendations implemented in the mid 1990s to increase folic acid supplement use (400 µg per day during the peri-conceptional period) to reduce NTDs rates (Stoll et al., 2006). However, there was no description about the extent to which the recommendation has been adopted by women.
In Canada, an assessment of the dietary folate intake26 (using three days of weighed food records) among 62 highly educated pregnant and lactating women following mandatory fortification found that about 2 in 3 of the pregnant women in the sample would meet the recommended folate intake from dietary sources alone. During pregnancy, average intake from naturally occurring folate was estimated to be 337 µg per day and folic acid from fortified foods 132 µg per day. Without mandatory folic acid fortification just 2% of the women would meet the folate recommendations (Sherwood et al., 2006).
Trends in the US
In the US, a comparison of two NHANES27 surveys (pre fortification 1988-1994 and post fortification 1999-2000), indicated an increase in the proportion of women aged 15-44 years exceeding 400 µg per day of folate from all food sources including fortified foods (from 26% to 38%), although the target of 50% consuming the recommended level had not been reached (Bentley et al., 2006b). Of particular note, however, was a decline in the proportion of women of child-bearing age who reported taking folic acid supplements28.
Despite overall increases in folic acid intake in the US since mandatory fortification was introduced there remain significant ethnic differences in total folate intake (Bentley et al., 2006a) and this is reflected in significant differences in plasma concentrations of total homocysteine, with non-Hispanic blacks having a higher concentration than non-Hispanic whites or Hispanic populations based on an age-adjusted comparison (Ganji and Kafai, 2006).
While folic acid intakes are estimated to have increased in the years immediately following the introduction of mandatory fortification in the US and this led to improvements in folate status (discussed in more detail in Attachment 4 of the Final Assessment report) and reductions in NTDs, the USCDC (2007b) recently reported a statistically significant decline in median serum folate concentrations of 16% between 1999-2000 and 2003-2004 among women aged 15-44 years. It is important to note, however, that the folate status of women of child-bearing age is still well above the level reported prior to mandatory fortification (median of 4.8 ng/mL among all women aged 15-44 years in the 1988-94 NHANES survey (USCDC, 2000) compared with 10.6 ng/mL among non-pregnant women aged 15-44 years in the 2003-04 NHANES survey (USCDC, 2007a).
25 France does not have mandatory folic acid fortification but does allow voluntary fortification of breakfast cereals.26 Includes naturally-occurring folate and folic acid in fortified foods.27 US National Health and Nutrition Examination Surveys.28 Folic acid supplement use was based on use over a one month period.
Page 42

As the recently reported fall in folate status contradicts earlier trends, various explanations for the decline were considered by the authors including: changes in supplement usage (the authors reported no evidence of this, although the paper by Bentley et al. (2006c) indicates that this has occurred29); a fall in consumption of naturally-occurring folate rich foods (limited evidence of this); changes in the amount of folic acid added to fortified foods (some evidence for this); and increases in the prevalence of risk factors for lower folate status such as obesity (there is limited evidence of this among women, see Ogden et al. (2006)). In addition, low carbohydrate diets were popular several years ago in the US and this may also have contributed to the decline.
The USCDC report did not mention potential changes in voluntary fortification practices. In addition to mandatory fortification in the US, folic acid can be voluntarily added to breakfast cereals at levels not to exceed 400 µg per serve and meal replacement products at levels not to exceed 400 µg per serve (for use once per day) and 200 µg per serve (for use twice per day). As there is no systematic program to assess voluntary fortification in the US it is unknown to what extent there have been changes in the numbers of voluntarily fortified foods or in the levels of folic acid added to these foods.
Implications of the new findings
Additional papers considering folic acid supplement use reaffirm earlier findings that few pregnant women use supplements at the correct time and dose, particularly younger women and women with unplanned pregnancies.
Mandatory fortification in the US and Canada is making a substantial contribution to increasing folic acid intakes among women of child-bearing age and this has contributed to the substantial fall in NTD rates previously reported. Evidence in the US, however, indicates that increases in intake may not be occurring across all population sub-groups.
Important among the new findings is the reported fall in folate status among women of child-bearing age in the US since 1999-2000. Although several plausible explanations for the decline are given, a possible fall in supplement use by the target population in the US is of particular concern for Australia and New Zealand if mandatory fortification is introduced.
29 The greater fall in the 90th centile of serum folate levels (Figure 1) over the period 1999-00 to 2003-04 compared with the fall in median levels also suggests that a fall in supplement intake is contributing to the overall decline.
Page 43
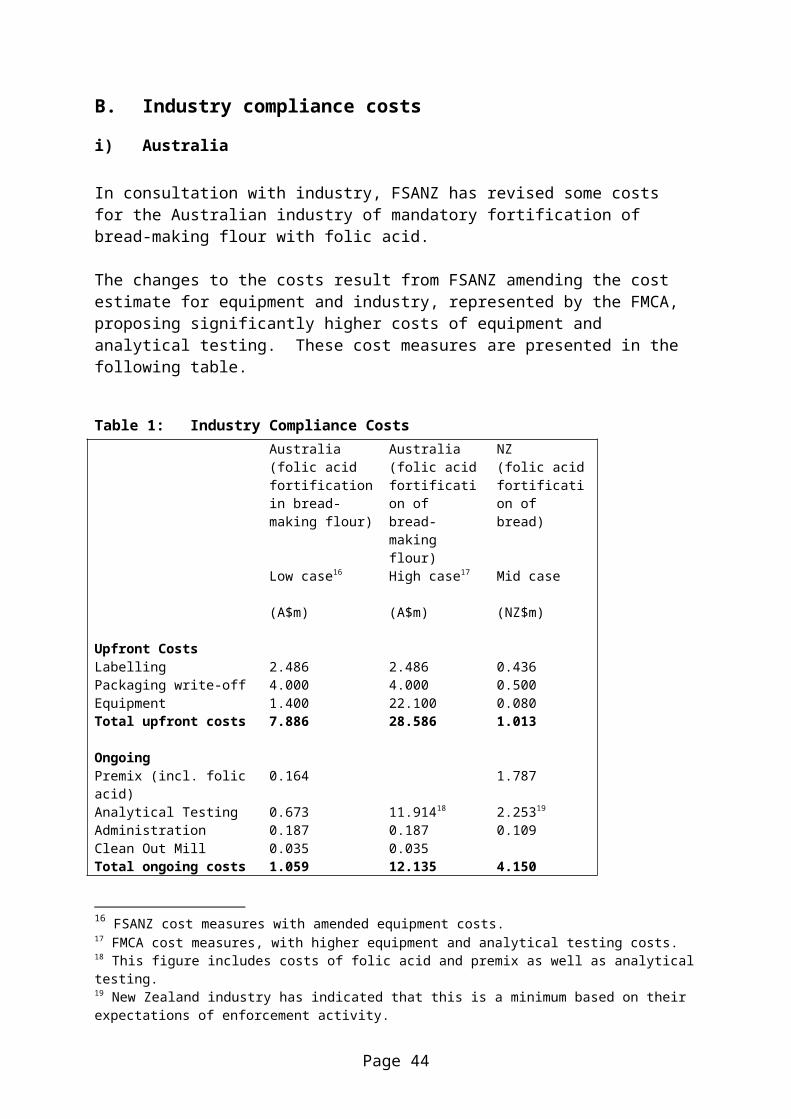
2. Safety of the proposed mandatory fortification
Excessive intakes
Population models
Existing voluntary fortification permissions and the proposed mandatory fortification together will contribute on average about 208 µg of folic acid per day to the target group in Australia (based on 200 µg of folic acid/100 g flour in the final food) and 198 µg per day in New Zealand (based on 135 µg of folic acid/100 g bread), assuming no significant changes to foods that are currently voluntarily fortified. FSANZ has estimated that this is the maximum increase in average folic acid intakes that can be achieved with fortification strategies without resulting in too many people, particularly young children, exceeding the upper level of intake (UL30).
FSANZ used the UL for folate as the cutpoint to assess excessive intakes of folic acid among various population sub-groups following mandatory fortification (Table 2). The proportion of children exceeding the UL in Australia, particularly very young children aged 2-3 years, is about 9%31 with this proportion decreasing with increasing age. It is worth noting that the UL is derived from a small number of case studies in the elderly. The level used in these studies was divided by five to yield a value for adults then extrapolated to children on a body weight basis. While it would be preferable for no child to exceed the UL, no child approaches a level of intake five times higher than the UL for their age. Intake assessments conducted external to FSANZ indicate that a higher proportion of New Zealand children aged 5-14 years would exceed the UL compared with Australian children of the same age. FSANZ has assessed the reason for the difference and concluded that it is most likely due to different methodologies32 rather than a real disparity in intakes. Among adults, the proportion likely to exceed the UL from mandatory fortification in Australia or New Zealand is very low: 0-<1%.
Evidence suggests that folic acid intakes up to 1,000 µg per day (the adult UL for folic acid) are not associated with delayed diagnosis of vitamin B12 deficiency in older people. Vitamin B12 deficiency occurs most commonly in older people due to malabsorption of vitamin B12 in food or pernicious anaemia – it is rarely caused by inadequate dietary intakes. The ULs for younger age groups were set on a relative body weight basis. No-one aged 70 years and over is expected to exceed the UL of 1,000 µg of folic acid per day from diet alone.
30 The UL is the ‘highest average daily nutrient intake level likely to pose no adverse health effects to almost all individuals in the general population’ (NHMRC and NZMoH, 2006). 31 This proportion is higher than previously published at final assessment (6%) because intakes from voluntarily fortified foods have been adjusted upwards to account for new market share data and the number of foods assumed to contain bread-making flour has increased slightly.32 The methodology used to assess folic acid intake among New Zealand children used a single day adjusted method and the data were population weighted whereas FSANZ used a two-day adjusted method without any population weighting to assess intakes among Australian children. The latter method minimises day-to-day variation in intakes thus narrowing the range of very low and very high individual intakes. The folic acid concentrations and foods assumed to be fortified were similar between Australia and New Zealand.
Page 44

Table 2: Per cent of Australian and New Zealand respondents with folic acid intakes above the UL at baseline (voluntary fortification) and after mandatory fortification*
Population Group
Revised baseline
(Voluntary fortification)
200 g folic acid /100 g flour in the final product
(Voluntary + mandatory fortification)
Australia
2-3 years 1 9
4-8 years <1 4
9-13 years <1 2
14-18 years <1 2
19-29 years <1 <1
30-49 years <1 <1
50-69 years <1 <1
70+ years 0 0
Women aged 16-44 years <1 <1
New Zealand**
135 g folic acid/100 g bread
15-18 years 0 <1
19-29 years 0 <1
30-49 years <1 <1
50-59 years 0 <1
70+ years 0 0
Women aged 16-44 years <1 <1
* Per cent exceeding the UL excludes folic acid intakes from supplements.** Data from the New Zealand national nutrition survey is only available for ages 15 years and over.
Similar to the dietary modelling undertaken at final assessment, FSANZ has re-estimated folic acid intakes from fortified foods and two supplement doses in Australia (200 µg and 500 µg) and two in New Zealand (200 µg and 800 µg) for women aged 16-44 years (Table 3). The estimated mean intakes are higher than published at FAR because intakes from voluntarily fortified foods have been adjusted upwards to account for new market share data and the number of foods assumed to contain bread-making flour has been increased. Despite these increases in mean intake, only New Zealand women who consume a daily 800 µg supplement (46%) would be at risk of exceeding the UL, although the majority of these do not exceed the UL by more than 200 µg (based on 95th percentile of intake of 1,159 µg). These estimates are based on every New Zealand woman of child-bearing age consuming a daily 800 µg dose of folic acid.
Page 45
Table 3: Estimated folic acid intakes among women of child-bearing age* in Australia and New Zealand from mandatory fortification** and supplements***
Mean intake Proportion above the UL
Australia 200 µg 500 µg 200 µg 500 µg
Revised baseline 308 608 <1 2
Mandatory + voluntary 408 708 <1 4
New Zealand 200 µg 800 µg 200 µg 800 µg
Revised baseline 262 862 <1 10
Mandatory + voluntary 402 1,002 <1 46
* Women aged 16-44 years.** Based on a level of fortification of 200 µg of folic acid/100 g flour in the final food in Australia and 135 µg of folic acid/100 g bread in New Zealand.*** Assumes all respondents in the survey consume folic acid supplements at the doses specified.
Potential individual intakes
FSANZ has undertaken additional dietary modelling for the Review to assess potentially excessive intakes among consumers who always choose a voluntarily fortified product in addition to mandatory fortification (Table 4). This scenario results in further increases in intakes at the 95th percentile compared with the mandatory plus voluntary fortification proposal in Australia but less so in New Zealand because of the greater number of voluntarily fortified products in Australia. In particular, young children who always consume the voluntarily fortified food brands (as a result of their parent’s purchasing behaviour) would be more likely to exceed the UL for their age group33.
Although this scenario is unlikely to affect many individuals it does illustrate the effect of a particular type of consumer behaviour. This scenario assumes that the current voluntary fortification practices remain unchanged, however, were they to change then folic acid intakes among the ‘always chooses’ consumers would also change – highlighting the unpredictability of voluntary fortification.
33 This model is based on individual choices hence it is not appropriate to report the proportion in a particular age group who exceed the UL.
Page 46

Table 4: Comparison of 95th percentile folic acid intakes
Population Group UL
Revised baseline
Voluntary fortification
Voluntary + mandatory fortification
Mandatory fortification + ‘always chooses’ voluntarily
fortified foods
Australia
2-3 years 300 232 338 384
4-8 years 400 282 388 464
9-13 years 600 367 495 588
14-18 years 800 378 566 634
19-29 years 1,000 365 585 629
30-49 years 1,000 342 516 552
50-69 years 1,000 368 480 533
70+ years 1,000 357 456 495
Women aged 16-44 years 800-1,000 283 407 455
New Zealand*
15-18 years 800 195 485 500
19-29 years 1,000 194 447 461
30-49 years 1,000 223 460 469
50-59 years 1,000 238 438 448
70+ years 1,000 187 367 379
Women aged 16-44 years 800-1,000 190 359 369
* Data from the New Zealand national nutrition survey is only available for ages 15 years and over.
Excessive intakes in the US
In the US there is no commitment to ongoing monitoring (Rosenberg, 2005), hence the potential safety issues from high intakes, particularly among the non target population, has not been assessed (Rader and Schneeman, 2006). Despite the lack of systematic monitoring, there have been several reports of foods containing much higher amounts of folic acid than the regulated level (Lewis et al., 1999; Rader et al., 2000; Choumenkovitch et al., 2002) and considerable increases in high serum folate concentrations among children under six of age and the elderly (Pfeiffer et al., 2005).
Letter to the NHMRC
FSANZ wrote to the NHMRC in October 2006 suggesting that a review of the UL might be appropriate, because of doubts about the relevance to children of a UL based on studies in the elderly and because there are no other apparent adverse health effects from higher levels of folic acid.
Page 47

In response, the NHMRC advised that there was not a strong case to reassess the UL recommendations for folate at this time because of the potential to ‘precipitate or exacerbate the neurological damage associated with vitamin B12 deficiency’ (not the masking of early detection of vitamin B12 deficiency) which is irreversible and the uncertainty of the prevalence of this deficiency in younger age groups. The NHMRC also advised of their intention to review these recommendations in 2010.
Other potential health risks
FSANZ’s review of the epidemiological literature on folate and cancer undertaken at final assessment (see Attachment 6 of the Final Assessment report) concluded that there was no increase in cancer risk from the increase in folic acid intakes likely from mandatory fortification. The recently released report from the United Kingdom ‘Folate and disease prevention’ (SACN, 2006b) also concluded that ‘the evidence for an association between folic acid and increased or reduced cancer risk in humans is equivocal. No randomised controlled trials (RCTs) designed to investigate the relationship between folic acid and cancer incidence have yet been reported’. The report did, however, highlight concerns about a possible relationship between folic acid fortification and increased progression of colorectal cancer.
FSANZ’s final assessment report stated that there was no evidence of an interaction with anti-epileptic drugs at the levels of folic acid intake likely from mandatory fortification.
FSANZ addressed other potential health risks from increases in folic acid intake in its final assessment report including: multiple births, impact on the gene pool and unmetabolised folic acid circulating in the blood. Each of these was also addressed in the U.K. report. Both reports concluded that there is insufficient evidence linking increased folic acid intake, particularly over the long term, to deleterious health outcomes from these conditions. More recently, Lucock (2006a), reiterated his earlier concerns (Lucock and Yates, 2005) about long term exposure to unmetabolised folic acid as a result of mandatory fortification34 as well as several other potential risks (the majority of which have already been addressed in this or in earlier FSANZ assessment reports).
In response to the potential health risks and uncertainties (outlined in greater detail at final assessment), FSANZ has adopted a conservative approach to mandatory fortification.
34 The absorption and biotransformation of synthetic folic acid into 5 methyl tetrahydrofolate is saturated at doses of about 400 µg. Doses above this lead to synthetic folic acid circulating in the blood (Lucock, 2006b).
Page 48

Papers published since Final Assessment
Cancer
Several papers have been published on folate/folic acid intake and cancer since final assessment. These are summarised in Table 5.
Colorectal cancer
Results from the Melbourne Colorectal Cancer Study involving cancer cases diagnosed between 1980 and 1981 (i.e. pre voluntary fortification) indicated that the second and third quintiles of folate intake were protective against rectal cancer but not colon cancer, however, there was a non-significant increased risk of colorectal cancer at the highest level of folate consumption (Kune and Watson, 2006). The highest quintile of folate intake was between 419 and 1,367 µg per day although this is likely to be a significant over-estimate as dietary intake was assessed by a food frequency questionnaire containing over 500 items.
In the United Kingdom Colorectal Adenoma Prevention (UKCAP) trial, a multicenter, double-blind, RCT, Hubner et al. (2006a) reported a significant reduction in risk of colorectal adenoma recurrence among folate-treated (folic acid alone or folic acid and aspirin) patients with specific gene polymorphisms. Overall though, folic acid did not reduce the risk of colorectal cancer (RR 1.08 95% CI 0.82-1.42). This paper was a substudy, however, and included slightly more than 50% of the study population. The paper reporting the folic acid data for the full trial population has been submitted for publication (J. Barron personal communication, 2007). FSANZ is aware of two US trials examining the effect of folic acid on recurrence of colonic adenoma that have been completed but which have not yet published their results.
Prostate cancer
Recent analysis of a cohort of over 27,000 male smokers in Finland found no association between folate intake (assessed with a dietary history questionnaire) and prostate cancer risk (Weinstein et al., 2006b). However, as smoking is inversely associated with folate status, the authors concluded that for protection against prostate cancer, smokers may require higher folate intakes than was observed in their study.
Stomach cancer
In the Swedish Mammography Cohort, Larsson et al. (2006b) reported no association between dietary folate intake (assessed with a food frequency questionnaire and validated via four 1-week weighed diet records among a sub-sample of women) and stomach cancer among over 61,000 women. A sub-analysis including total folate intake (i.e. folate from foods and dietary supplements) also found no increased risk, although the authors acknowledge that the much smaller sample size in the sub-analysis may have been too small to detect an association.
Page 49

Breast cancer
In a meta-analysis involving 14 case-control studies and nine prospective studies, Larsson et al. (2007b) reported mixed results for folate and breast cancer risk. Analysis of the case-control studies indicated a statistically significant 20% reduction in risk from an increase of 200 µg/day of dietary folate (folate from foods only, not supplements) but the prospective studies did not support any association for either dietary folate or total folate. In addition, several studies supported a reduced risk of breast cancer among women with moderate to high alcohol consumption from an adequate to high folate intake.
Similar results were obtained by Lewis et al. (2006b) in their meta-analysis of folate intakes or levels and breast cancer risk. The case-control studies (14 identified) showed a significant reduction in breast cancer risk (among all women combined and among pre menopausal women) but the cohort studies (11 identified) did not.
Page 50

Table 5: Summary of results from recently published studies investigating folate and cancer
Study (Reference)
Study design Exposure variables Outcome variables Results(95% CI)
UKCAP trial (Hubner et al., 2006b)
Multicenter, randomised, double-blind, placebo-controlled trial of 546 genotyped patients with mean age of 57 years with earlier colorectal adenoma removal; 3 years or earlier follow up
Folic acid supplements (500 µg daily) and aspirin
Colorectal adenoma All patients exposed to folic acidRR 1.08 (0.82-1.42)N.B. This is a sub-analysis on just one half of the randomised subjects; full study results have not yet been published.
Melbourne Colorectal Cancer Study (Kune and Watson 2006)
Case control study of 715 cases (identified between 1980 and 1981) and 727 controls with mean age of 57 years; food intake assessed by 587 item FFQ
Dietary folate intake Colorectal cancer Folate intake (Colorectal cancer (adjusted model))1st Q: (UL of intake 246 µg/d) 1.0 (reference);2nd Q: (UL of intake 297 µg/d) OR 0.76 (0.53, 1.08);3rd Q: (UL of intake 347 µg/d) OR 0.71 (0.50, 1.02);4th Q: (UL of intake 419 µg/d) OR 0.75 (0.51, 1.10);5th Q: (UL of intake 1,367 µg/d) OR 1.24 (0.81, 1.89)
ATBC Cancer Prevention Study (Weinstein et al., 2006a)
Cohort study nested in a placebo-controlled trial of 29,133 men aged 50-69 years
Dietary folate and folic acid from supplements
Prostate cancer Folate intake1st Q: (<=283 µg/d) 1.0 (reference);2nd Q: (>283 µg/d and <=313 µg/d) RR 0.91 (0.77, 1.09);3rd Q: (>313 µg/d and <=341 µg/d) RR 1.00 (0.84, 1.19);4th Q: (>341 µg/d and <=378 µg/d) RR 0.95 (0.80, 1.13);5th Q: (>378 µg/d) RR 0.96 (0.81, 1.15)
Swedish Mammography Cohort (Larsson et al., 2006a)
Population-based prospective cohort of 61,433 women; food intake assessed by FFQ; 18 years of follow up
Dietary folate Stomach cancer Hazard ratio comparing the highest with lowest level of:- dietary folate intake 1.04 (0.61-1.86); and- dietary folate + supplements 0.88 (0.40-1.93)
Page 51

Table 5: Summary of results from recently published studies investigating folate and cancer (continued)
Study (Reference)
Study design Exposure variables Outcome variables Results(95% CI)
Larsson et al. (2007a)
Meta-analysis:9 Prospective studies14 Case control studies
Dietary folate intake (folate from foods only)Total folate intake (Folate from foods and supplements)Serum or plasma folate levels
Breast cancer incidence or mortality
200 µg/day incrementsCohort studies– dietary folate: pooled estimate 0.97 (0.88, 1.07)– total folate: pooled estimate 1.01 (0.97, 1.05)Case-control studies – dietary folate: pooled estimate 0.80 (0.72, 0.89)– total folate: pooled estimate 0.93 (0.81, 1.07)
Lewis et al. (2006a)
Meta-analysis:11 Cohort studies14 Case control studies
Folate intakeSerum folate levels
Breast cancer 100 µg/day incrementsCohort studies– dietary folate: pooled estimate 0.99 (0.98, 1.01)– dietary folate, pre-menopausal: pooled estimate 1.01 (0.98, 1.04)Case-control studies – dietary folate: pooled estimate 0.91 (0.87, 0.96)– dietary folate, pre-menopausal: pooled estimate 0.87 (0.78, 0.97)
Page 52
Twinning
In a summary of the evidence (including both supplement and fortification studies), Levy and Blickstein (2006) did not find a cause-effect relationship between folic acid intake and increased twinning rates although the authors acknowledge that the data are frequently flawed by lack of adjustment for maternal age and fertility treatments. More recently, in a prospective cohort study of 602 women undergoing fertility treatment in Scotland, high folate status increased the likelihood of twin births after multiple embryo transfer among women likely to have a livebirth35 but not the likelihood of a successful pregnancy (Haggarty et al., 2006b).
In a systematic review of folic acid and risk of twinning the authors reported no significant increases in twinning rates (Muggli and Halliday, 2007). The review included studies which accounted for fertility treatments. This work was commissioned by FSANZ and the results reported at final assessment.
Cognitive function
Several papers have been published on folate/folic acid intake and cognitive function since final assessment. These are summarised in Table 6.
Randomised controlled trials
In a randomised, double-blind, placebo controlled trial involving 195 older persons with mild vitamin B12 deficiency, 400 µg of folic acid in combination with 1,000 µg of vitamin B12 did not improve cognitive function after 24 weeks, despite significant improvements in B12 status among those in the treatment groups (Eussen et al., 2006b). These results are similar to the results reported by McMahon et al. (2006a) after a two year follow up period (referred to in the final assessment report).
In the Folic Acid and Carotid Intima-media Thickness (FACIT) trial, Durga et al. (2007b) reported a significant improvement in cognitive function after three years among the group taking a daily 800 µg folic acid supplement. It is worth noting, however, that participants were selected into the FACIT trial on the basis of their high plasma total homocysteine. As a result, serum folate concentrations increased by nearly 600% over the duration of the trial.
Cohort studies
In a follow up study of nearly 1,000 men and women aged 65 years or more before fortification was implemented, Luchsinger et al. (2007a) reported a significantly reduced risk of Alzheimer Disease (AD) among participants in the highest quartile of folate intake (>= 488 µg per day).
35 Haggarty et al. (2006a) postulate that women with the MTHFR genotype are more likely to produce good quality embryos and thus a livebirth, although the associated increase in livebirths was not observed in this study.
Page 53

Those who developed AD were on average three years older, had less education and were more likely to have diabetes and heart disease than those who didn’t develop AD – these factors may explain some of the results seen in this observational study.
Analysis of data from the Nurses Health study found that among older women, high levels of plasma folate or vitamin B12 were not associated with better or worse cognitive function (Kang et al., 2006b). High folate and high B12 status was initially associated with better cognitive performance but the association did not hold over time (four years). The authors did not compare high folate levels and low B12 with other nutrient states – as was done in the Morris et al. (2007) study (see below).
Cross sectional studies
A paper by Morris et al. (2007b) using data from the 1999-2000 US National Health and Nutrition Examination Survey (NHANES) on nearly 1,500 older people (average age 70 years) reported that while a low vitamin B12 status was associated with a significantly increased risk of anaemia and cognitive impairment (as might be expected); the prevalence was greatest in those with high serum folate status compared to participants with normal B12 and folate status.
Systematic reviews
A systematic review of 14 randomised trials by Balk et al. (2007) concluded that there was inadequate evidence that folic acid supplements influenced cognitive function – either positively or negatively.
Page 54

Table 6: Summary of results from recently published studies investigating folate and cognitive function
Study (Reference) Study design Exposure variables Outcome variables Results(95% CI)
FACIT trial (Durga et al., 2007a)
Randomised, double blind, placebo controlled trial of 818 men and women (mean age = 60 years) followed up for 3 years
Daily 800 µg folic acid supplement
Domains of cognitive function that decline with age
Global cognitive function: folic acid vs placebo (cognitive change attributed to folic acid, mean difference) 0.050 (0.004-0.096)P value for trend: 0.033
Netherlands (Eussen et al., 2006a)
Randomised, double blind, placebo controlled trial of 195 men and women (mean age = 83 years) living independently or in care followed up for 24 weeks
Daily 1,000 µg vitamin B12
Daily 400 µg folic acid supplement + 1,000 µg vitamin B12
Domains of cognitive function
Significant improvement in memory among the placebo group and vitamin B12 group (p=0.0036), but not the folic acid + vitamin B12 group and placebo.There were no other significant differences in cognitive function between the folic acid + B12 group and placebo.
Dunedin, NZ (McMahon et al., 2006b)
Randomised, double-blind, placebo-controlled, clinical trial of 276 men and women (mean age = 74 years) followed up for 2 years
Daily 1,000 µg of 1-5-methyltetrahydrofolate + 500 µg vitamin B12 + 10 mg vitamin B6
8 tests of cognitive function
Combined standard deviation score for the difference between treatment and controls:-0.11 (-0.22-0.0) i.e cognitive function was marginally worse with vitamins than with placebo
US (Luchsinger et al., 2007b)
Longitudinal cohort study of 965 healthy men and women aged 65+ years followed up for a mean period of 6.1 years
Total dietary and supplement intake of folate, vitamin B6 and B12 assessed via a semi-quantitative food frequency questionnaire
Incidence of Alzheimer Disease (AD)
Quartile of folate intake and risk of AD:1st Q: 1.0 (reference);2nd Q: 0.9 (0.6, 1.3);3rd Q: 0.7 (0.5, 1.1);4th Q: 0.5 (0.3, 0.9)P value for trend: 0.02
Page 55

Table 6: Summary of results from recently published studies investigating folate and cognitive function (continued)
Study (Reference) Study design Exposure variables Outcome variables Results(95% CI)
Nurses Health Study (Kang et al., 2006a)
635 women aged 70+ years, 3 repeated tests over 4 years
Quartiles of plasma folate and vitamin B12 levels
Tests of cognitive decline
Mean difference in cognitive performance (global score, multivariate adjusted) over 4 years by quartiles of:Plasma folate1st Q: 0 (reference);2nd Q: -0.01 (-0.06, 0.04);3rd Q: 0.00 (-0.04, 0.05);4th Q: -0.02 (-0.06, 0.03)Plasma vitamin B121st Q: 0 (reference);2nd Q: -0.01 (-0.06, 0.03);3rd Q: -0.01 (-0.06, 0.03);4th Q: 0.00 (0.05, 0.05)
NHANES (Morris et al., 2007a)
1,459 participants (mean age = 70 years) in the 1999-2002 National Health and Nutrition Examination Survey
Serum folate as a continuous variableLow vitamin B12 status (serum B12 <148 pmol/L or serum methylmalonic acid >210 nmol/L)
Cognitive functionAnaemia
Cognitive impairment:normal folate, normal B12 status: 1.0 (reference);high folate, normal B12 status: 0.5 (0.2, 0.96)normal folate, low B12 status: 1.6 (0.95, 2.8)high folate, low B12 status: 4.9 (2.6, 9.2)
Page 56

Implications of the new findings
Papers published since final assessment do not change FSANZ’s earlier conclusion that increased folic acid intake does not increase or reduce cancer risk (based on relative risks close to one in RCTs and in the meta-analyses for breast cancer).
There is no significant evidence of increased risk of twinning as a result of the expected increases in folic acid intake from mandatory fortification.
Similar to that reported at final assessment, the additional evidence does not support an association between folate intake and cognitive function although the RCT by Durga et al. (2007c) is suggestive of a protective effect among individuals with an elevated homocysteine status after several years of folic acid supplementation.
In Australia, based on data from the Blue Mountains Eye Study, nearly 23% of study participants had low serum B12 levels (<185 pmols/L) (Flood et al., 2006). More recent analysis of these data indicate that those with the highest quintile of folate intake (from diet and supplements) had significantly higher serum B12 levels (Flood and Mitchell, 2007) indicating that in this population high folate intake is not associated with increased likelihood of low serum B12 levels. While the NHANES results linking increased cognitive decline with a low vitamin B12 status and high folate status are unusual and suggestive of a B12/folic acid interaction, a cross-sectional study such as NHANES does not indicate a causal relationship. The results do, however, highlight the need for ongoing monitoring of B12 status among older people bearing in mind that a low B12 status is not always evident in haematological analysis and neurological symptoms may be the only clinical manifestation of B12 deficiency.
Spontaneous abortion
One issue not considered at Final Assessment but which has been raised in the first review consultations, is the potential increased risk of spontaneous abortion (or miscarriage) from increased folic acid intake.
Based on a review of three randomised trials that reported miscarriage as an outcome of folate supplementation (MRC Vitamin Study 1991; Kirke et al., 1992; Czeizel et al., 1994), Lumley et al. (2001) found no evidence of an increase in risk (RR 1.12, 95% CI 0.98, 1.29). There have been no new data from randomised trials since this review but supporting evidence from other types of studies has been published.
Data from a large scale intervention study in China found no evidence of an increase in spontaneous abortion rates among women taking a daily supplement of 400 µg of folic acid before and throughout early pregnancy compared with women who had not taken a supplement (Risk ratio 1.03, 95% CI 0.89, 1.20) (Gindler et al., 2001). In a Swedish case control study, George et al. (2006) reported that high plasma folate levels (>= 14.0 nmol/L) were associated with an increased risk of miscarriage compared with those in the reference range for folate status (5.0-8.9 nmol/L) (Odds ratio (OR) 2.2, 95% CI 1.0, 4.9).
Page 57

This association, however, did not hold when women taking a folic acid supplement (<1% of the sample) were excluded from the analysis (OR 1.5, 95% CI 0.5, 4.3). Supplement users were significantly older than non-supplement users and the authors acknowledged that there may be other (unmeasured) factors contributing to the different outcomes between these two groups.
Based on this evidence, there is no increased risk of spontaneous abortion from the increases in folic acid intake expected from mandatory fortification.
58

References
59

Attachment 2: Dietary Intake Assessments
1. Dietary intake assessments undertaken
At First Review, the following dietary intake assessments were undertaken to address some of the issues raised relating to dietary intake assessments:
Baseline estimate: the current folic acid concentrations in foods were revised based on new data collected in 2006 on folic acid content and the proportion of foods within each category that were fortified. All dietary intake assessments conducted for the First Review used these new baseline values as a starting point.
Mandatory fortification estimate: for Australia, dietary intake assessments for the First Review were conducted using ‘wheat flour for making bread’ as the food vehicle for mandatory folic acid fortification, for New Zealand, the food vehicle remained unchanged from Final Assessment – ‘all bread’.
Extended voluntary estimate: based on two scenarios with an extension of current permissions to dairy products; one with a moderate increase in uptake of voluntary permissions, one with a ‘top end’ or maximum expected uptake of permissions.
Naturally occurring folate and DFE intake estimates: the current dietary intakes of folate (from naturally occurring sources only) and of Dietary Folate Equivalents (DFEs)1 and predicted increase in DFE intakes on mandatory fortification.
An overview of the dietary intake assessments conducted for the First Review can be found in Figure 1, with Figure 2, Figure 3 and Figure 4 providing additional details for mandatory fortification, voluntary fortification and DFE intake estimates, respectively36
The approach take to dietary intake assessments for the First Review is outlined in Section A below and the results presented in Section B.
36 Dietary Folate Equivalent (g DFE)= (g food folate) + (g folic acid x 1.67).
60

Figure 1: Overview of the dietary modelling approach used for the First Review for Australia and New Zealand
61
1. Consider the issues arising from the First Review request
2. Determine the options to investigate plus additional information required
3a. ‘Mandatory fortification’To estimate folic acid intakes based on mandatory fortification of flour (Australia)/bread (NZ) with folic acid and current level of voluntarily folic acid fortified foods.
3b. ‘Extended voluntary fortification’To estimate folic acid intakes based on extended voluntary folic acid fortification of foods
3c. ‘Intakes of naturally occurring folate and dietary folate equivalents (DFEs)’To estimate intakes of naturally occurring folate and DFEs based on current level of voluntarily folic acid fortified foods and predicted DFE intakes for the mandatory fortification option.

Figure 2: Dietary modelling approach used for the First Review for Australia and New Zealand for mandatory fortification
62
1. Select food vehiclea. Australia - ‘wheat flour for making bread’b. New Zealand – ‘All bread’
2. Select the type of modelNutrient Intake Model with adjustment for second day nutrient intakes
4. Determine scenarios to model
4a. ‘Baseline’ (revised) Folic acid intakes based on current level of voluntary fortification.
4b. ‘First review’Folic acid intakes base on current uptake by industry of voluntary folic acid permissions (excluding bread) + mandatory fortification of ‘wheat flour for making bread’ with folic acid at 200 µg/100 g flour for Australia and ‘all bread’ at 135 μg folic acid/100 g bread for New Zealand.
5. Estimate dietary folic acid intakes for baseline, First Review Scenario for each population group specifiedDietary Intake = folic acid concentration x food consumption amount from National Nutrition Surveys
6. Compare estimated dietary folic acid intakes for baseline, First Review Scenario for group with target intake for folic acid and all groups with Upper Level of intake
3. Select population groups to assessTarget group: women of child-bearing age (16-44 years)Other groups: age and gender groups specified in NHMRC document on Nutrient Reference values
7. Assess food consumption patterns for consumers with low and high quintile intakes of folic acid – (See Attachment 5).

Figure 3: Dietary modelling approach used for the First Review for Australia and New Zealand for extended voluntary fortification
63
1. Select the type of modelNutrient Intake Model with adjustment for second day nutrient intakes
3. Determine scenarios to model
3b. ‘Initial industry proposal (FAR)’
Folic acid intakes for extended voluntary fortification as proposed by industry at FAR.
3c. ‘Moderate uptake permissions’Folic acid intakes for a moderate increase in voluntary fortification including low/reduced fat milks & yoghurts.
4. Estimate dietary folic acid intakes for baseline, 3 scenarios for each population group specified Dietary Intake = folic acid concentration x food consumption amount from National Nutrition Surveys
5. Compare estimated dietary folic acid intakes for baseline, 3 Scenarios for group with target intake for folic acid and all groups with Upper Level of intake
2. Select population groups to assessTarget group: women of child-bearing age (16-44 years)Other groups: age and gender groups specified in NHMRC document on Nutrient Reference values
3d. ‘Higher uptake permissions’Folic acid intakes for a ‘top end’ predicted increase in voluntary fortification including low/reduced fat milks & yoghurts.
3a. ‘Baseline’ (revised) Folic acid intakes based on current level of voluntary fortification.
Figure 4: Dietary modelling approach used for the First Review for Australia and New Zealand for consideration of intakes of naturally occurring folate and DFEs (naturally occurring folate and folic acid)
1. Select the type of modelNutrient Intake Model with adjustment for second day nutrient intakes
3. Determine scenarios to model
3a. ‘Baseline’Naturally occurring folate intakes and DFE intakes (naturally occurring folate and folic acid, taking account of current level of voluntary fortification with folic acid).
3b. ‘Mandatory fortification’DFE intakes under mandatory fortification option
4. Estimate dietary folate intakes and DFE intakes for baseline and mandatory option for population groups specifiedDietary Intake = nutrient concentration x food consumption amount from National Nutrition Surveys
5. Compare estimated dietary folate intakes and DFE intakes for baseline and mandatory option for each population group with the Estimated Average Requirements (EARs)
2. Select population groups to assessTarget group: women of child-bearing age (16-44 years)Other groups: age and gender groups specified in NHMRC document on Nutrient Reference values
64

Section A: The approach to dietary intake assessments for folic acid and dietary folate equivalents
2 Estimating nutrient intakes
2.1 Nutrient intakes
Dietary folic acid intakes were estimated by combining usual patterns of food consumption, as derived from National Nutrition Survey (NNS) data, with current levels of fortification based on the uptake of voluntary fortification permissions by industry and either the proposed levels of folic acid in foods if mandatory folic acid fortification were to be introduced or the extended uptake of voluntary permissions. Dietary folate and DFEs intakes were estimated combining usual patterns of food consumption, as derived from NNS data, with current levels of folate and DFEs, and those proposed under the mandatory option. All intake estimates were adjusted using second day records to better estimate ‘usual’ patterns of consumption. The use of folic acid supplements by the target group was also considered. FSANZ procedures and the computer program DIAMOND used to undertake dietary intake/exposure assessments are continuously being updated and enhanced. International developments are also monitored by FSANZ and incorporated in our procedures where relevant to ensure that FSANZ continues to employ best practice.
Dr Mike DiNovi, an international expert in dietary exposure assessments from the US Food and Drug Administration, recently reviewed all FSANZ dietary exposure assessment principles and modelling procedures and the supporting systems. The conclusions from the peer reviewer were overall very positive in terms of the FSANZ dietary modelling capability, expertise of staff and that the methodologies used by FSANZ being consistent with international best practice. The peer reviewer prepared a report on his findings which included some recommendations to enhance FSANZ capabilities further. A strategy had been put in place to deal with the recommendations.
The Final Assessment Report on folic acid intake assessments was also peer reviewed by an external international expert from France37 and comments made incorporated into the dietary intake estimates undertaken for the First Review report. For example, an assessment of the impact on a consumer who avoid or select the fortified product where a choice is possible is now included in the First Review report (see Section 5).
2.2 Food consumption data
The dietary survey data used were derived from the 1995 National Nutrition Survey (NNS) from Australia that surveyed 13,858 people aged 2 years and above, and the 1997 New Zealand NNS that surveyed 4,636 people aged 15 years and above.
37 Dr Philippe Verger, Directeur de l'Unité INRA (French National Institute for Agricultural. Research), Paris, France
65

Folic acid intake estimates undertaken by the LINZ unit from the University of Otago used the 2002 National Children’s Nutrition Survey (CNS) that surveyed 3,275 New Zealand children aged 5-14 years. Like the 1995 and 1997 NNSs, the 2002 CNS was also conducted using a 24 hour recall methodology. Further details about the dietary survey data and procedures for dietary intake estimates can be found in Attachment 7 of Final Assessment report for P295 – Consideration of Mandatory Fortification with Folic Acid.
2.3 Folic acid concentration data
Baseline folic acid concentration data for voluntarily fortified foods has been revised following Final Assessment for Australia and New Zealand, based on new data recently becoming available to FSANZ. For a detailed discussion on the data sources, please refer to the Attachment 7 of Final Assessment report for P295 – Consideration of Mandatory Fortification with Folic Acid.
2.4 DFEs concentration data
Dietary folate concentration data were derived from the recent Key Foods Program (KFP) and other recently commissioned analytical programs. The KFP generates up to date information on nutrient levels in the most significant foods in the diets of Australian children. Additionally, where the food is a major contributor to nutrient intake, variation in nutrient levels in these foods may be assessed. These data were used with the folic acid concentration data to derive DFE concentrations for each food.
3. Changes in food consumption patterns over time
Dietary modelling based on 1995 or 1997 NNS food consumption data provides the best estimate of actual consumption of a food and the resulting estimated dietary intake of a nutrient for the population. However, it should be noted that the NNS data does have its limitations. These limitations relate to the age of the data and the changes in eating patterns that may have occurred since the data were collected. Generally, consumption of the broad categories of staple foods such as fruit, vegetables, meat, dairy products and cereal products, which make up the majority of most people’s diet, is unlikely to have changed markedly since 1995/1997 (Cook et al., 2001). However, in the dietary intake assessments for voluntary fortification proposals, the folic acid concentrations of foods consumed in the NNSs have been modified to take account of some changes in food consumption where foods now consumed were not available at the time of the survey (e.g. formulated beverages, ready to drink teas).
66

Potential changes in bread consumption since 1995 and 1997 are important to assess as it is the selected food vehicle for the mandatory fortification proposal. FSANZ has undertaken research to find other sources of more recent food consumption data to validate the NNS data. It should be noted that it is difficult to directly compare the data from all sources given the different survey methodologies used, differences in the ways that breads are defined between the different surveys, age groups, foods included in the assessments etc.
Broad trends in sales by volume and value of bread and other food categories are tracked by use of industry publications, such as the annual Retail World’s Australasia Grocery Guide (Flanagan, 2006). However these data indicate food sold at a national level only and not food consumed, so are of limited use to estimate changes at an individual level that can then be used to estimate nutrient intake changes. These data are useful however to ‘market weight’ folic acid concentrations according to the market share of leading brands within any given food category, where required.
More recent food consumption data for individual consumers were available from the Single Source and Young Australian Survey (Roy Morgan, 2006a; Roy Morgan, 2006b), the Australian Dairy Corporation Survey (ADC) (Australian Dairy Corporation, 2003), Newspoll survey in Australia (George Weston Submission, 2006) and a UMR survey from New Zealand (NZFSA submission, 2006), as discussed in the FAR report. It is recognised that the type of bread being consumed may vary over time, for example, more focaccia may be consumed now than in the 1995 and 1997 NNS. However, despite these changes within the whole bread category, the proportion of people reporting consuming bread (80-85%) and overall amount consumed across different age and income groups appears to be similar now to that reported in 1995 and 1997.
4 Food vehicles
4.1 Food vehicles for First Review
At First Review, FSANZ was asked to review the fortification vehicle selected with a view to mandating flour for bread-making as the food vehicle for Australia to minimise the regulatory burden on industry and regulators. For New Zealand, the mandatory fortification food vehicle remained as ‘all bread’ in the First Review.
To determine the range of foods that would be likely to contain added folic acid, it was necessary to determine which foods contain ‘wheat flour for making bread’ (Australia only) and ‘all bread’ (New Zealand only). In Australia, flour for ‘bread-making’ must contain added thiamin. For the purposes of estimating folic acid intakes, foods were assumed to contain ‘wheat flour for making bread’ if Australian products were labelled as containing added thiamin. Following consultation with the food industry, it was also determined that croissants contain wheat flour for bread-making’. For the purpose of estimating folic acid intakes for New Zealand, foods were assumed to be a ‘bread’ if they contain cereal flour, were yeast leavened and were baked (Figure 5a and Figure 5b below).
67

Figure 5: Definition of folic acid fortified foods for dietary modelling purposes
a. AustraliaWheat flour for making bread:Includes all white and wholemeal wheat flour used as an ingredient in commercially produced plain, fancy, sweet and flat breads and bread rolls, English-style muffins, crumpets, scones, pancakes, pikelets, crepes, yeast donuts, pizza bases, croissants and breadcrumb containing products.
b. New ZealandAll Bread : Includes all yeast-containing plain white, white high fibre, wholemeal, grain and rye bread loaves and rolls that are baked; yeast-containing flat breads that are baked (e.g. pita bread, naan bread); focaccia; bagels (white, wholemeal, sweet); topped breads and rolls (e.g. cheese and bacon rolls); English muffins (white, white high fibre, grain, wholemeal and fruit); sweet buns; fruit breads and rolls; and breadcrumbs.
Excludes steamed breads; breads cooked by frying (e.g. puri/poori); yeast-free breads (e.g. chapatti, tortilla); gluten-free breads; doughnuts; pizzas and pizza bases; scones; pancakes, pikelets and crepes; crumpets; and bread mixes intended for home use.
4.2 Why breads/ wheat flour for making bread?
At the start of the Proposal P295 – Consideration of Mandatory Fortification with Folic Acid FSANZ considered suitable food vehicles for fortification, the initial criteria being that the food had to be consumed by a large proportion of the target group in all socio-economic groups and that is was technically feasible to fortify the food. The proportion of different population groups consuming milks (full and reduced fat), fruit juices, breakfast cereals, yoghurts and soy beverage were examined during the initial investigations as well as bread and bread products. There is no food that is consumed by the target group only and not consumed by other population groups. From the NNS publication “National Nutrition Survey Foods Eaten Australia 1995” (McLennan and Podger, 1999), data indicate that those food groups consumed by a large proportion of women of child-bearing age are also those consumed by a large proportion of young children (aged 2-3 years), as shown in Figure 6.
Some foods consumed by a large proportion of the target group were not suitable for fortification for technical reasons, for example fruit, vegetables, meat and their products. Other foods, such as milk and breakfast cereals, were consumed by the target group but also in relatively greater amounts by younger children so were they to be mandated to be fortified could potentially place younger children at risk of excessive folic acid intakes.
68

Foods such as fruit juices, yoghurts and soy beverages were not consumed by a high enough proportion of the target group to consider them as effective food vehicles for mandatory fortification. Two food groups were however further investigated, bread and bread products and milk and milk products.
Figure 6:Proportion of 2-3 year old Australian children consuming various foods, as reported
in the 1995 Australian National Nutrition Survey
0 10 20 30 40 50 60 70 80 90 100
Water
Vegetable products & dishes
Meat, poultry & game products & dishes
Fruit products & dishes
Fats & oils
Non-alcoholic beverages
Skim fat milk
Low fat milk
Reduced fat milk
Dairy milk**
Regular breads & rolls
Cereals & cereal products*
Food
Gro
up
Percent of population group consuming
Proportion of Australian women aged 16-44 years consuming various foods, as reported in the 1995 Australian National Nutrition Survey
0 10 20 30 40 50 60 70 80 90 100
Fruit products & dishes
Meat, poultry & game products & dishes
Fats & oils
Water
Skim milk
Low fat milk
Reduced fat milk
Full fat milk
Dairy milk**
Vegetable products & dishes
Regular breads & rolls
Cereals & cereal products*
Non-alcoholic beverages
Food
Gro
up
Percent of population group consuming
Note: * Cereal and cereal products include regular breads and rolls and other bread products, breakfast cereals, pasta, rice and flour. ** Dairy milk includes full fat, reduced, low fat and skim milk
These figures are for foods reported as consumed in the NNS and do not take account of consumption of these foods in recipes e.g. milk used in custard.
69
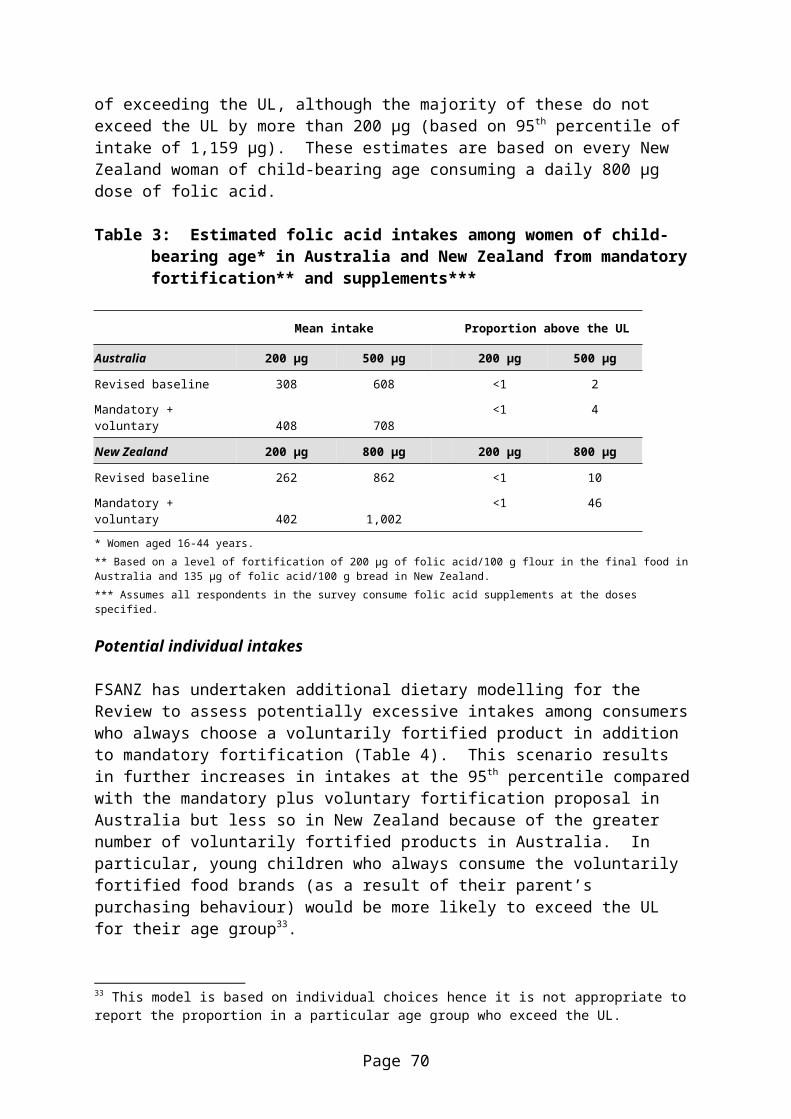
Fortifying flour with folic acid, in this case bread-making flour, is consistent with international experience of mandatory fortification to reduce the incidence of NTDs. Bread-making flour is an effective and technically feasible food vehicle for mandatory folic acid fortification and bread-making flour (as bread and bread products) is a staple food consumed widely, consistently and regularly by the target population of women of child-bearing age across different socio-economic sub groups (as discussed previously in the Draft Assessment report, DAR, and the FAR). In addition, Australia’s experience with mandatory thiamin fortification provides an opportunity to extend the use of existing infrastructure to the mandatory addition of folic acid to bread-making flour. In the NNSs aproximately 85% of Australian and 83% of New Zealand women of child-bearing age consumed bread-based foods, as defined previously. Regular breads and rolls were consumed by 70-81% of women of child-bearing age and by 85% by young children (aged 2-3 years).
Dairy milk and products were identified as potential food vehicles as they were consumed by at least 50% of the target group (women of child-bearing age) and it was technically feasible to add folic acid. Eighty two percent of women of child-bearing age consumed dairy milk and 90% of children aged 2-3 years. The proportions of women of child-bearing age and children aged 2-3 years who consumed full fat and reduced/low fat milks and yoghurts were further investigated. In the 1995 NNS a greater proportion of women aged 16-44 years (36%) consumed reduced/low fat milks in comparison to children aged 2-3 years (9%) while a greater proportion of children aged 2-3 years (83%) consumed full fat milk in comparison to women aged 16-44 years (56%). Further detail can be found in Figure 6 below. Hence it would appear from the 1995 data that reduced or low fat milks could be a more effective food vehicle for the target group than all milk or full fat milk.
Figure 6: Percentage of Australian children aged 2-3 years and Australian women aged 16-44 years consuming different types of milks (1995 NNS)
0
10
20
30
40
50
60
70
80
90
100
All dairy Full fat dairy Reduced fat dairy
Milk type
% o
f per
sons
con
sum
ing
2-3 year old children16-44 year old females
70

More recent data from the ADC on milk production and sales, the ADC Food Consumption Survey and the Roy Morgan Single Source Survey were also assessed as the retail data on milk sales indicated that there had been a trend towards a decrease in full fat milk sales and an increase in reduced fat/low fat milk sales since 1995. For example, the Roy Morgan Survey data for 2006 (respondents aged 14 years and over) indicate that 82% target group reporting consuming milk in the last 7 days, with 42% consuming low or no fat milk and 48% consuming full fat milk (some women may have consumed both milk types). These data confirm that for this age group a higher proportion of people reported consuming low /reduced fat milk than that reported in the 1995 NNS (36%). FSANZ is also aware that in the light of concerns about obesity, current dietary advice for children aged 2 years and over (National Health and Medical Research Council (NHMRC), 2001) is that reduced fat milks are suitable for these younger children. Hence FSANZ considered that reduced fat/low fat milk was less suitable as a food vehicle than bread because milk forms a higher proportion of a young child’s diet than an adult and the trend toward consuming reduced fat milk at a younger age would increase the potential risk of excessive folic acid intakes for the 2-3 years and 4-8 year age groups were these milks to be mandatorily fortified.
In the 1995 NNS, less than 20% of women aged 16-44 years and children aged 2-3 years reported consuming yoghurts, irrespective of the fat content of the yoghurt. Similar proportions of these two population groups consumed reduced/low fat yoghurts, while a greater proportion of children aged 2-3 years consumed full fat yoghurt in comparison to women aged 16-44 years. Although more recent retail sales data and that from the ADC and Roy Morgan surveys indicate the proportion of people consuming yogurt has increased since 1995, it is still less than 40% for the target group but higher for the young children (up to 70%) so that again there would be a risk of excessive folic acid intakes for these latter age groups were yoghurt to be mandatorily fortified.
5 Consumer choice and behaviour
For the mandatory and extended voluntary scenarios, a number of models were investigated. These are based on different patterns of consumer behaviour and are outlined below.
5.1 Market share model (or population estimate)
This model aims to represent folic acid/ folate/ DFEs intakes for the average consumer i.e. reflects the typical patterns of intakes over time for a whole population or population sub-group. A limitation of the market share model is that it only gives an estimate of population intakes over time. It can not estimate individual behaviour or estimate folic acid intakes for individuals due to the use of weighted mean folic acid concentration values.
Weighted mean folic acid concentration levels were assigned to each food to reflect the current or predicted market share for fortified and unfortified products within each food category.
71

If a fortified version of a food was not specifically identified within the NNS, but it is known that a significant proportion of the food category in the market place is now fortified with folic acid, a folic acid concentration was assigned to the food, and weighted to reflect the proportion of the market for that food that is now believed to be fortified. It is important to note that some foods in the NNSs were described as being folate fortified (e.g. certain breakfast cereals), therefore market weighted folic acid concentrations were not applied to these foods.
For example, the Australian NNS does not distinguish between the consumption of folic acid fortified white bread and unfortified white bread. The market share for folic acid fortified bread in Australia was estimated at 16% of all breads, based on sales information for a major bakery retail chain (Bakers Delight, 2006). A value representing 16% of the analysed or labelled concentration of folic acid in fortified breads was assigned to all white breads. Based on available information, fortification of breads with folic acid does not appear to be as common in New Zealand as in Australia so different market weights were assigned.
5.2 Consumer behaviour model (or individual choices model)
The voluntary permission to fortify some foods with folic acid presents the grocery buyer with a choice, to avoid or positively select these foods according to the needs of their household. To reflect the potential differences in individual consumer behaviour two options were investigated for these foods:
(a) where it was assumed that an individual always avoids the products that contain folic acid; and
(b) where it was assumed that an individual always select the products that contain folic acid.
This choice was given for the foods reported as consumed in the NNS that did not have a sufficiently detailed description to determine whether the food was folic acid fortified or not, yet it is known that there are fortified foods currently in the market place. The model is limited as a consumer behaviour model as it was assumed that respondents ate as reported in the 1995 survey and did not change or substitute one kind of food for another. For example, it is important to note that some foods in the NNSs were described as being fortified (e.g. breakfast cereals), therefore the above options for consumer choice were not applied to these foods. The consumer behaviour models assess folic acid/ DFEs intake for individuals only based on folic acid/ DFEs concentrations in certain foods. Where mean dietary folic acid intakes or DFEs intakes have been presented as a range, the lower bound represents option (a) and the upper bound represents option (b).
A limitation of this model type is that it is not a population estimate but rather gives the top and bottom ends of a range of possible intakes for individual consumers how behave in certain ways because it is not known how respondents in the NNS would actually have behaved had they been presented with a choice of products.
72

5.3 Comparison of concentration data used in different models
As discussed in Section 6.1, the folic acid concentrations in foods were weighted for the ‘market share’ model to take into account current and predicted market share of fortified versus unfortified products. For the ‘consumer behaviour’ models two different folic acid concentrations were used: option (a) where it is assumed that individuals always avoid the products that contain folic acid; and option (b) where it is assumed that individuals always select the products that contain folic acid. Figure 8 outlines how folic acid concentrations were calculated to be assigned to one food for the ‘market share’ and ‘consumer behaviour’ models.
Figure 7: Derivation of ‘Market share model’ and ‘Consumer behaviour model’ folic acid concentrations
Example: Fruit Juice
Currently, 30% of juice on the market contains folic acid at 30 μg folic acid/100 g
Market share model folic acid concentration:Folic acid concentration = folic acid concentration in fortified juice x market share
= 30 μg folic acid/100 g x 30%= 9 µg/100 g
Consumer behaviour model folic acid concentrations:
a) Consumer avoids fortified productsFolic acid concentration = 0 µg/100 g
b) Consumer selects fortified productsFolic acid concentration = 30 µg/100 g
A summary of the scenarios and model types conducted for the First Review can be found in Table 1 overpage.
73

Table 1: Summary of scenarios examined for the First Review
Matrix Of Models Baseline (revised) Voluntary Fortification Mandatory Fortification
Initial industry proposal (FAR)
Moderate increase in uptake of permissions
Higher increase in uptake of
permissionsMarket share model
Consumer behaviour model –avoids fortified product where possible
Consumer behaviour model –selects fortified product where possible
74
Section B: Results of dietary intake assessments for folic acid and dietary folate equivalents
6 Results
The overall aim of any fortification program is to ensure that folic acid intakes are maximised for the target group whilst minimising intakes for all population groups that exceed the upper level of intake (UL). The estimated dietary folic acid intakes under the mandatory proposal for Australia and New Zealand at First Review gave equivalent outcomes to those presented at Final Assessment.
6.1 Revised ‘Baseline’ dietary folic acid intakes
Revising the ‘Baseline’ folic acid concentrations (due to the availability of new concentration data) resulted in an increase in estimated mean folic acid intakes for each population group assessed by FSANZ. For the target group of women aged 16-44 years, mean dietary folic acid intakes increased by 13 µg/day for Australia and 4 µg/day for New Zealand.
6.2 Comparison between mandatory and voluntary fortification scenarios
6.2.1 Estimated mean dietary folic acid intakes
Comparisons between estimated mean dietary folic acid intakes under ‘Baseline’, mandatory and voluntary fortification scenarios are presented in Figure 8a and Figure 8b below. In Figure 8a and Figure 8b; the lower and upper ends of the range of mean dietary folic acid intakes represent the results from the ‘consumer behaviour’ model – the lower bound indicates folic acid intakes for an individual who always avoids the products that contain folic acid; the upper bound indicates folic acid intakes for an individual who always select the products that contain folic acid. The results from the ‘market share’ model are indicated by the black line within the range of estimated dietary folic acid intakes, and are representative of mean population intakes over a period of time.
This document predominantly focuses on comparisons between ‘market share’ model results. Mean estimated folic acid intakes based on the ‘market share’ models for each scenario were higher for the mandatory scenario (>200 µg/day) than all the voluntary scenarios (<160 µg/day), though folic acid intakes from voluntary permissions do increase as expected as the level of uptake of permission increases and number of foods with permissions increases.

The ‘consumer behaviour’ model range of results between the lower and upper bound give an indication of the uncertainty of the outcome of a mandatory or extended voluntary approach for estimated folic acid intakes.
76
Predicted folic acid intakes are more “uncertain” for voluntary fortifications scenarios (industry proposal at FAR, moderate and higher uptake) than mandatory fortification scenarios. The differences in potential ranges of intakes between baseline and mandatory scenarios and mandatory and voluntary scenarios indicate that bread and bread products make a significant contribution to total folic acid intakes. By mandating or fixing the level of folic acid in wheat flour for bread-making or bread, the choice for consumers is limited for that one type of food but the certainty of outcome of fortification increases considerably.
Current levels of voluntary fortification result in baseline folic acid intakes of 108 μg/day for the target group of women of child-bearing age (16-44 years) in Australia, 62 μg/day for those in New Zealand. The increase in estimated mean dietary folic acid intakes for these Australian and New Zealand women from ‘Baseline’ intake to the ‘First Review’ mandatory fortification scenario was 100 μg/day for Australia and 140 μg/day for New Zealand. The increase in estimated mean dietary folic acid intakes for Australian and New Zealand women of child-bearing age (16-44 years); from ‘Baseline’ to the various voluntary fortification options ranged from 7-45 µg/day for Australia and 35-74 µg/day for New Zealand. The ‘consumer behaviour’ model results indicate that for an individual who eats large amounts of the fortified foods and goes out of their way to select the fortified version wherever there is a choice then higher folic acid intakes can be achieved. However it is considered the number of consumers who would actually behave in this way on a regular basis is likely to be small.

Figure 8: Estimated mean dietary folic acid intakes for women aged 16-44 years for Australia and New Zealand
a. Australia
0 20 40 60 80 100 120 140 160 180 200 220 240 260 280 300 320
Baseline
Mandatory (200 ug/100 g flour)
Industry proposal (FAR)
Moderate proposal
Higher proposal
Scen
ario
Mean dietary folic acid intakes (ug/day)
78
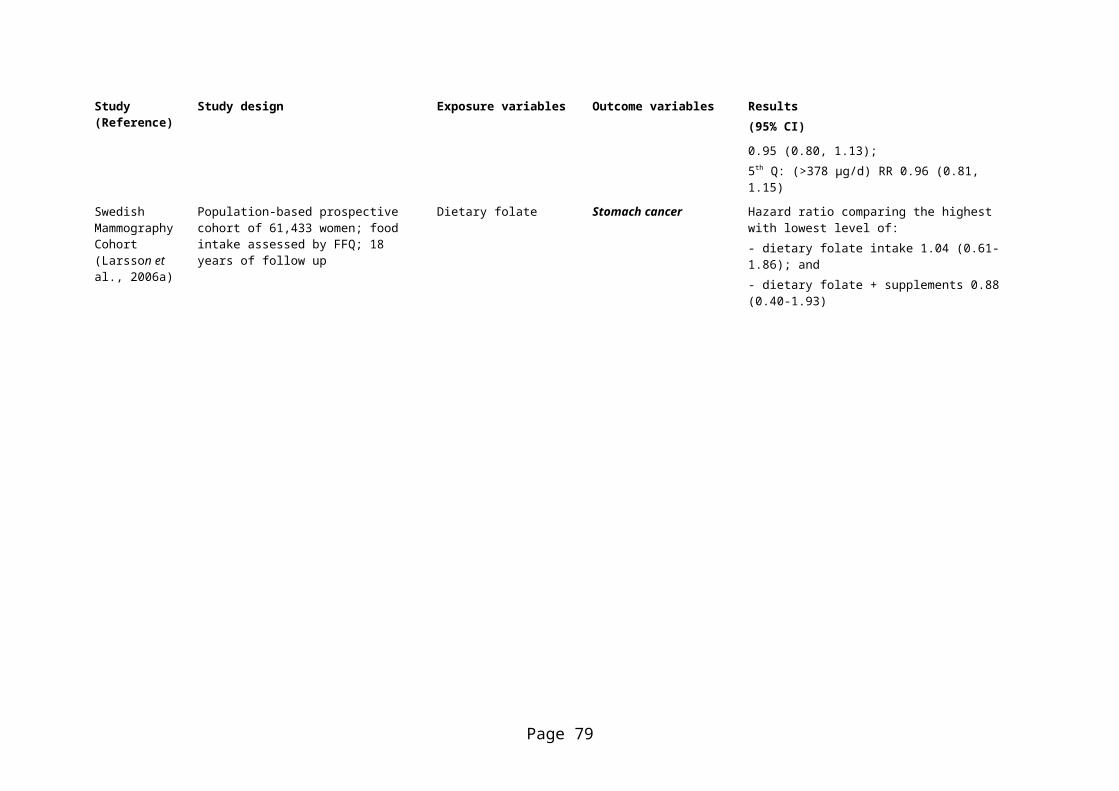
b. New Zealand
0 20 40 60 80 100 120 140 160 180 200 220 240 260 280 300 320
Baseline
Mandatory (135 ug/100 g bread)
Industry proposal (FAR)
Moderate proposal
Higher proposal
Scen
ario
Mean dietary folic acid intakes (ug/day)
6.2.2 Comparison of estimated dietary folic acid intakes with the 400 µg/day target for women aged 16-44 years
The results indicate that, without the consumption of folic acid supplements, around 5% of Australian and 3% of New Zealand women of child-bearing age met the recommended 400 μg of folic acid per day under all scenarios (mandatory and voluntary).
When a 200 μg folic acid per day supplement was considered in conjunction with mandatory fortification, approximately 40% of Australian and New Zealand women of child-bearing age were estimated to meet the recommended amount of folic acid. When a 200 μg folic acid per day supplement was considered under baseline and the three increased voluntary fortification scenarios, between 4% and 21% of Australian and New Zealand women of child-bearing age were estimated to meet the recommended intake of folic acid.
If a 500 μg or 800 μg folic acid supplement were to be consumed by all women of child-bearing age, irrespective of voluntary or mandatory fortification, 100% of women of child-bearing age would meet the recommended daily amount of folic acid.
79
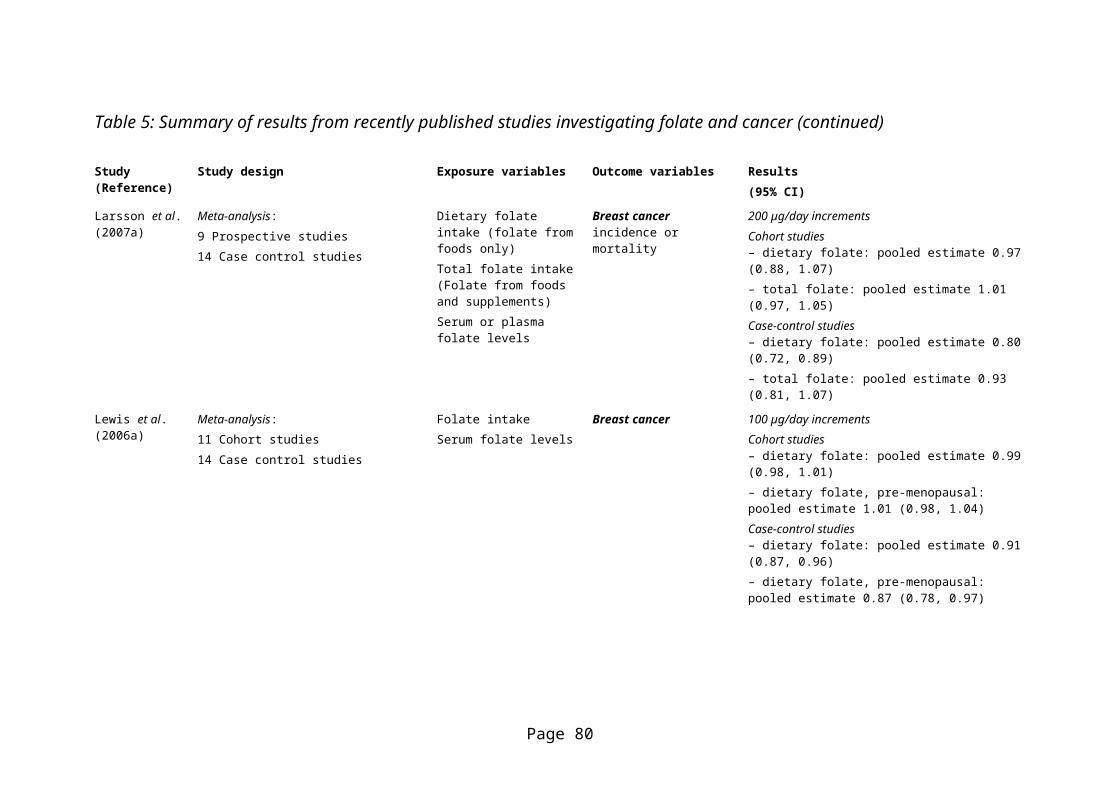
6.2.3 Proportion of population groups with estimated folic acid intakes above the Upper Level (UL)
Less than 1% of Australian and New Zealand women aged 16-44 years had dietary folic acid intakes that exceeded the UL under baseline, mandatory and all three increased voluntary fortification scenarios. For Australia, the ‘market share’ model results indicate that respondents aged 2-3 years and 4-8 years were the most likely of the non-target groups to have intakes exceeding the UL under all scenarios. For 2-3 year old children, 2-4% were expected to exceed the UL under voluntary fortification and 9% under mandatory fortification. For 4-8 year old children, 1-2% are expected to exceed the UL under voluntary fortification and 4% under mandatory fortification.
When consumption of supplements was considered for the target group, the proportion of respondents aged 16-44 years exceeding the UL increased as the concentration of folic acid in the supplement increased. There was no change in the proportion of the Australian target population exceeding the UL with a folic acid supplement of 200 µg per day from baseline to mandatory and the three voluntary fortification scenarios. With a 500 µg supplement, the proportion of the Australian target population exceeding the UL increases slightly from 1% to 2% under the three voluntary fortification scenarios, and from 1% to 3% under the mandatory fortification scenario.
There is minimal change in the proportion of the New Zealand target population exceeding the UL with a folic acid supplement of 200 μg per day for all scenarios assessed. In New Zealand, supplements containing 800 g of folic acid are available. If all New Zealand women of child-bearing age consumed this supplement, a high proportion of New Zealand women were likely to exceed the UL under both voluntary (14-22%) and mandatory fortification (42%).
80
Figure 9: Percentage of Australian and New Zealand women aged 16-44 years with dietary folic acid intakes above the UL
0
10
20
30
40
50
60
70
80
90
100
Industry proposed increase(FAR)
Moderate proposed increase Higher proposed increase
Baseline Mandatory Voluntary
Scenario
% p
opul
atio
n w
ith e
stim
ated
die
tary
folic
aci
d in
take
s >U
L
Australia With 200 ug supplement
Australia With 500 ug supplement
New Zealand With 200 ug supplement
New Zealand With 800 ug supplement
One of the potential concerns with extended voluntary permissions for folic acid fortification is that an individual consumer who always selects the product containing folic acid may in fact consume an excessive amount of folic acid if they also consume high amounts of the fortified foods i.e. high folic acid consumer, as intakes tend to be higher than for a mandatory scenario at the top end of the range. Assessment of the 95th percentile folic acid intake for this consumer model indicates that intakes in the target group may exceed the UL from food alone, and were these products also always consumed by children in the household, their intakes were also more likely to exceed the UL than for a mandatory scenario.
6.3 Analysis of New Zealand 2002 National Children’s Nutrition Survey data
FSANZ does not currently hold food consumption data for New Zealand children aged 2-14 years from the 2002 National Children’s Nutrition Survey (CNS). The New Zealand Food Safety Authority (NZFSA) commissioned the University of Otago (LINZ Applied Research Unit) to undertake a dietary intake assessment for children aged 5-14 years, based on data from the 2002 New Zealand Children’s Nutrition Survey. The results for the proportion of children exceeding the upper level (UL) for folic acid for the proposed mandatory fortification of bread were submitted to the Ministerial Council in October 2006 at the same time as the FAR and were higher than those reported for Australian children at FAR for the same age group.
81

As part of the First Review FSANZ assessed the difference between the proportion of New Zealand children and Australian children exceeding the upper limit. To do this FSANZ analysed the dietary intake data from LINZ, specifically:
1. the methodology;2. folic acid concentrations; and 3. foods assumed to be fortified.
A summary of the methodologies used for the FSANZ and LINZ assessments for Australian and New Zealand children are outlined in Figure 10 below.
Figure 10: Summary of the methodologies used for the FSANZ and LINZ assessments of folic acid intakes in children for Australia and New Zealand
University of Otago (LINZ Applied Research Unit)
FSANZ
Methodology 1. Single day un-adjusted model
2. Population weighted
1.Two day adjusted model2.Not population weighted
Folic acid concentrations
Similar
Foods assumed to be fortified
Similar but foods coded slightly differently to the 1995 NNS
Other differences 1. Two different population groups – 4-8 years for Australia; 5-8 years for New Zealand.
2. Uptake of voluntary fortification permissions is different between the countries.
3. Potentially different food consumption patterns between the countries.
In both the FSANZ and the LINZ assessments, the mandatory folic acid fortification concentrations used and the foods assumed to be fortified were similar. However, the methodologies for the two studies were different. The methodology used by the University of Otago (LINZ Applied Research Unit) was a single day un-adjusted method and the methodology used by FSANZ was a two-day adjusted method. Using a single day of food consumption data can result in a broader distribution of folic acid intakes and, potentially, a higher estimated proportion of the population group with intakes above the UL which overestimates the level of risk to the population group. Adjusted nutrient intakes better reflect ‘usual’ daily nutrient intakes (see Appendix 1: How were the estimated dietary intakes estimated in Attachment 7a of the FAR). However, it is important to note that there are limitations in comparing the results from the
82

FSANZ assessment and the LINZ assessment since different age groups were investigated (4-8 years, for Australia; 5-8 years for New Zealand). FSANZ investigated whether using a single day un-adjusted modelling method for 4-8 year old Australian children would explain the difference between Australian and New Zealand children. These data are presented in Table 2 below. It was concluded that using a single day un-adjusted methodology may account for some of the differences in results as using for the second day adjustment for the Australian children decreased the proportion of children exceeding the UL from 9% to 3%.
In the 2002 New Zealand Children’s Nutrition Survey, there was over-sampling of the Maori and Pacific Islander population groups. Population weighting was therefore used by LINZ in their assessment to make the survey sample better reflect the New Zealand children population so that conclusions could be drawn about New Zealand children in general. The 1995 Australian National Nutrition Survey did not require weighting in order to make comments about the folic acid intakes of Australian children. The impact of weighting on the differences in results in unknown.
There is evidence from the dietary modelling conducted by FSANZ using the 1995 and 1997 NNSs that New Zealand estimated dietary folic acid intakes for adults were lower than those for Australia. This difference could be due to different food consumption patterns and/or lower levels of uptake of voluntary fortification permissions. It would be expected that similar food consumption patterns would be found for the younger children in New Zealand, however it is possible that changes in food consumption from 1995-97 through to 2002 may account for some differences in the estimated folic acid intakes. FSANZ will be in a position to use the 2002 CNS data in DIAMOND later in 2007, so can rerun these estimates at that time.
83
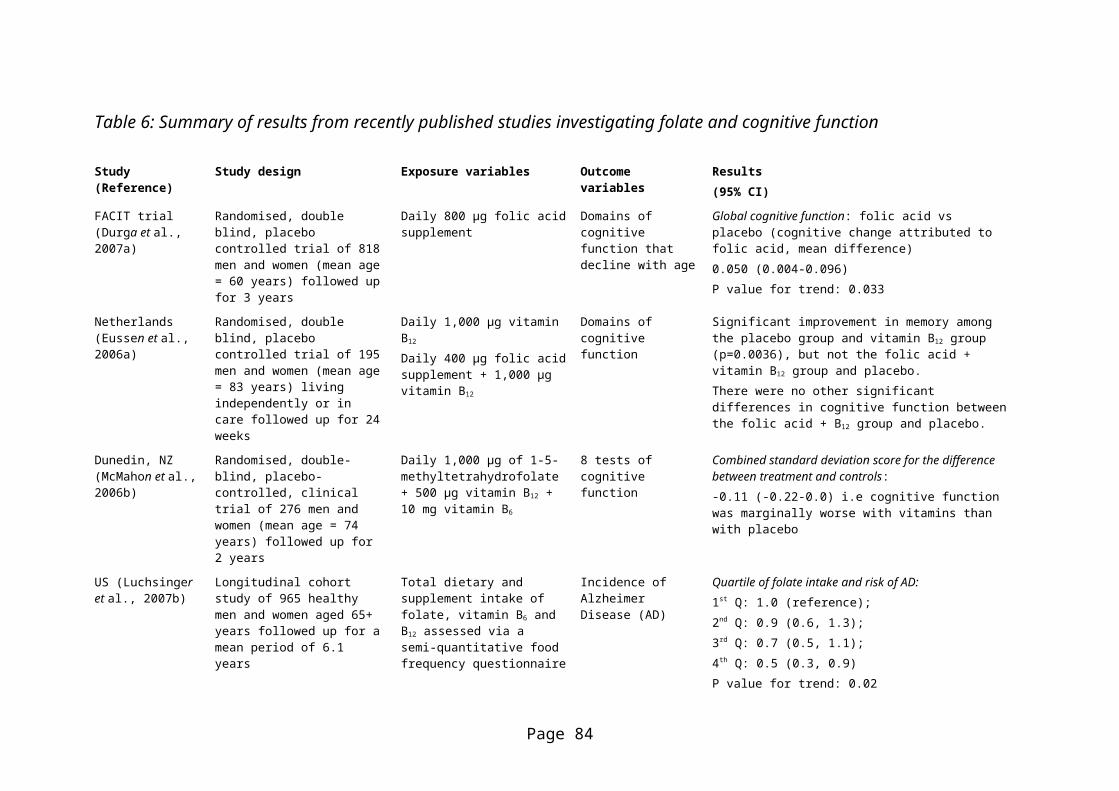
Table 2: Comparison between proportion of Australian children aged 4-8 years and New Zealand children aged 5-8 years exceeding the UL using different dietary intake methodologies (single day unadjusted versus two day adjusted models) for the mandatory fortification scenario of 135 µg folic acid /100 g bread
Gender
% above UL New Zealand (LINZ data)
Australia (FSANZ FAR)
Australia (FSANZ FAR)
Single day un-adjusted model
Two day adjusted model
Single day un-adjusted model
5-8yrs 4-8yrs 4-8yrsAll 3 9Males 13.8 5 7Females 8.2
<12
6.4 Dietary folate and DFEs
For Australians aged 2 years and above, based on the 1995 NNS food consumption data and updated DFE concentration data that assumed current levels of voluntary fortification (weighted means), 7% of the population had estimated DFE intakes below the EAR. Approximately 10-11% of adults aged 30 years and above had DFE intakes below the EAR.
For New Zealanders aged 15 years and above, based on 1997 NNS food consumption data and updated DFE concentration data that assumed current levels of voluntary fortification (weighted means), 50% of the population had estimated DFE intakes below the EAR. This indicates that there may be a significant proportion of the New Zealand population with inadequate intakes of DFEs. The difference between Australian and New Zealand estimated DFE intakes is likely due to the current lower uptake of voluntary permissions in New Zealand.
Mandatory fortification of ‘wheat flour for making bread’ reduced the proportion of the Australian population aged 2 years and above with estimated DFE intakes below the EAR from 7% to 1%. Mandatory fortification of ‘all bread’ reduced the proportion of the New Zealand population aged 15 years and above with estimated DFE intakes below the EAR from 50% to 4%.
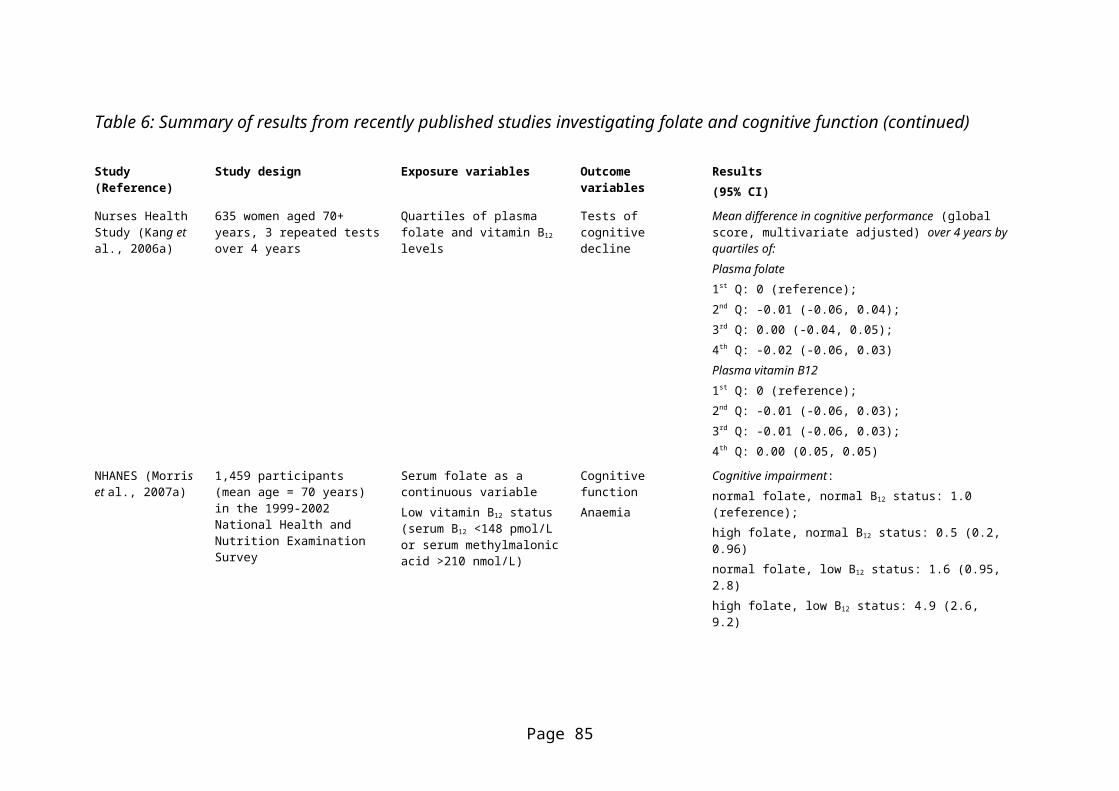
7. References
85
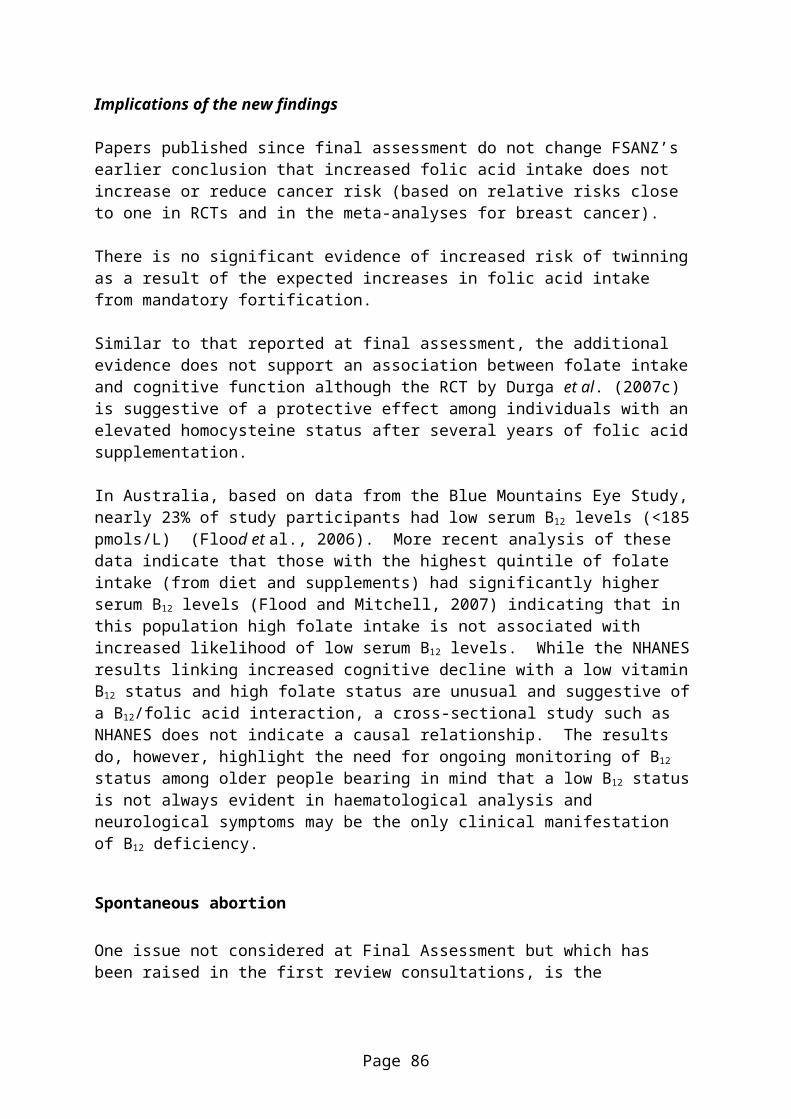
Attachment 3: Report- Mandatory folic acid fortification of bread-making flour in Australia
Please see separate document.
86