table of contents - kentucky educational … park: time, distance, and speed © ket, 2009 table of...
TRANSCRIPT

HORSE PARK: Time, Distance, and Speed © KET, 2009
TABLE OF CONTENTSClick on a title to go directly to the handout.
Handout 1: Measurement OriginsHands-on activity using proportional reasoning to compare standardized and non-standardized measurements
Handout 2: Horse HeightProblems involving standard measurement for horses and proportional reasoning
Handout 3: Video Matching and ReviewAn activity to use with the video “Greetings from the Kentucky Horse Park”
Handout 4: “At the Track”An activity to accompany the “At the Track” online interactive, including data charts and graphing data, to help students understand the direct vs. inverse pro-portions involved in time, speed, and distance
Handout 5: Practice “At the Track”Additional practice compiling data and creating graphs depicting the proportional relationships between speed and distance and speed and time
Handout 6: Everyday ProportionsWord problems requiring the students to apply their knowledge of the proportional relationships among speed, distance, and time to real-life situations
The Road to Proportional Reasoning: Kentucky Horse Park HandoutsSCALE CITY

HORSE PARK: Time, Distance, and Speed © KET, 2009
Name: Date:
HORSE PARK: HANDOUT 1Measurement Origins
The following chart lists measurements based on the human body that became standard measurements. Measure your-self and compare your dimensions to the standard measurement.
Type of Measurement Legendary Origins My Measurement Standardized FormCubit (ancient measure-ment)
Elbow to tip of middle finger
17 to 22 inches or 43.18 to 55.88 cm
Foot Human foot 12 inches or 30.48 cm
Hand(horse measurement)
Width of hand or height of fist
4 inches or 10.16 cm
InchWidth of man’s thumb at base of nail
1/12 of foot or 25.4 mil-limeters
Standard vs. Non-standard Measurement: Feet
• Estimate the length of your classroom in standardized feet. Then use a ruler, yardstick, or measuring tape to check your estimate. Fill in the standardized length of your classroom in feet and inches in the chart below.
• Use the data in the chart above to fill in your foot’s length. Based on that measurement and the length of the room in standardized feet, use proportional reasoning to determine how long the room is in your feet. Check your calculation by counting how many heel-to-toe steps it takes you to pace off the length of the room. Enter the length of the room in your feet in the chart and record the difference between the standard-ized and non-standardized measures.
Measurement Standardized Non-standardized(my foot’s length in inches)
Difference between measurements
Foot 12 inches (1 foot)
Length of classroom

HORSE PARK: Time, Distance, and Speed © KET, 2009
Measurement Origins
Standard vs. Non-standard Measurement: Hands
• Estimate the height of your desk or table in hands (4-inch measurements) from the writing surface to the floor. Check your estimate using a ruler, yardstick, or measuring tape. Fill in the standardized height of your desk in hands in the chart below. Use decimals for parts of hands.
• Use the data in the first chart to fill in your own hand measurement (your fist’s width). Based on that measure-ment and the height of your desk in standardized hands, use proportional reasoning to determine how high the desk is in your hands. Check your calculation by counting how many widths of your fist it is from the floor to the writing surface. Enter the height of the desk in your hands in the chart and record the difference in the standardized and non-standardized measures.
Measurement Standardized Non-standardized(my fist’s length in inches)
Difference between measurements
Hand 4 inches (1 hand)
Height of desk

HORSE PARK: Time, Distance, and Speed © KET, 2009
Name: Date:
Horse HeightHORSE PARK: HANDOUT 2
Horses are measured in hands. A hand is 4 inches tall, or about 10 centimeters. The highest point of the horse is called the poll. But a horse is not measured from the ground to the poll—it is measured from the ground to the withers, the midpoint of its shoulders at the highest point on its back, just in front of the saddle and behind the neck.
If a horse is 16.2 hands, it doesn’t mean the horse is 16 and two-tenths hands tall. The dot is a period and the “2” means 2 inches.
So the horse is actually 16 hands, 2 inches or 66 inches high.
withers
1. If a horse is 70 inches tall, how many hands tall is it? (Hint: Remember, 15.1 means 15 hands and one inch, 15.2 means 15 and two inches, and 15.3 means 15 and three inches. The next measurement up is 16 hands, since one hand equals four inches.)
2. Gabe thinks his horse is 22.2 hands tall. The world’s tallest horse is 84 inches tall. Could Gabe’s horse really be that tall? (Hint: Remember, 22.2 means 22 hands and 2 inches.)
3. Carrie’s fist is 3 1/2 inches wide. Her horse is 18 of Carrie’s hands high. What would you estimate that height to be in standard hands when one hand equals 4 inches? Compute the horse’s exact height in hands and record both your original estimate and your computation.
4. The world’s smallest horse, Thumbelina, is 17 1/2 inches tall or 4.375 hands tall (using decimals). As hands are mea-sured, Thumbelina’s height would be between 4.1 and 4.2 hands. One hand is 10.16 centimeters. How tall is Thumbe-lina in centimeters?
5. At the district horse show, the height limit for the pony class is 14.2 hands (that is, 14 hands, 2 inches). Taller horses are in the horse class. Charlotte’s horse is 59 inches tall. Will she be in the pony or horse class?
6. The world’s smallest horse is 17 1/2 inches tall. The world’s tallest horse is 7 feet high. What is the ratio of the heights of the tallest to the smallest?
7. Eleven of Kelli’s walking strides equal 1 running stride for Man o’ War. If it takes Kelli 500 walking strides to go a quarter of a mile, how many running strides would Man o’ War take to travel a quarter of a mile? Round to the nearest stride.

HORSE PARK: Time, Distance, and Speed © KET, 2009
Horse HeightKEY: HORSE PARK: HANDOUT 2
1. If a horse is 70 inches tall, how many hands tall is it? (Hint: Remember, 15.1 means 15 hands and one inch, 15.2 means 15 and two inches, and 15.3 means 15 and three inches. The next measurement up is 16 hands, since one hand equals four inches.)70 ÷ 4 = 17 and 2 inches. The horse is 17.2 hands.
2. Gabe thinks his horse is 22.2 hands tall. The world’s tallest horse is 84 inches tall. Could Gabe’s horse really be that tall? (Hint: Remember, 22.2 means 22 hands and 2 inches.)No, 22.2 hands is 90 inches or 7 1/2 feet tall. The world’s tallest horse is 21 hands tall or 7 feet. (22 × 4 = 88 plus 2 inches = 90; 84 ÷ 4 = 21 hands)
3. Carrie’s fist is 3 1/2 inches wide. Her horse is 18 of Carrie’s hands high. What would you estimate that height to be in standard hands when one hand equals 4 inches? Compute the horse’s exact height in hands and record both your original estimate and your computation.Since Carrie’s hand is seven-eighths of a standard hand, the height of her horse in standard hands would be seven-eighths of 18. Students might estimate that that would be between 15 and 16 hands. Computation shows that Carrie’s horse is 15.3 hands tall. (3.5 × 18 = 63 inches; 63 ÷ 4 =15 hands and three inches. )
4. The world’s smallest horse, Thumbelina, is 17 1/2 inches tall or 4.375 hands tall (using decimals). As hands are mea-sured, Thumbelina’s height would be between 4.1 and 4.2 hands. One hand is 10.16 centimeters. How tall is Thumbe-lina in centimeters?Thumbelina is 44.45 centimeters. (4.375 × 10.16 = 44.45)
5. At the district horse show, the height limit for the pony class is 14.2 hands (that is, 14 hands, 2 inches). Taller horses are in the horse class. Charlotte’s horse is 59 inches tall. Will she be in the pony or horse class?She’ll be in the horse class. Fifty-nine inches is greater than the 58-inch limit (14.2 = 14 hands 2 inches or 14 ×4 = 56 + 2 inches = 58 inches).
6. The world’s smallest horse is 17 1/2 inches tall. The world’s tallest horse is 7 feet high. What is the ratio of the heights of the tallest to the smallest? 7 x 12/17.5 = 84/17.5 or 4.8 to 1 or 4.8:1 (There are many other ways this ratio could be expressed.)
7. Eleven of Kelli’s walking strides equal 1 running stride for Man o’ War. If it takes Kelli 500 walking strides to go a quarter of a mile, how many running strides would Man o’ War take to travel a quarter of a mile? Round to the nearest stride.45 strides (500 ÷ 11 =45.4545)

HORSE PARK: Time, Distance, and Speed © KET, 2009
Name: Date:
HORSE PARK: HANDOUT 3Video Matching and Review
Pay attention to the video “Greetings from the Kentucky Horse Park,” so you can correctly match the word to the definition.
1. Albion
2. hand
3. withers
4. American Quarter Horse
5. Man o’ War
6. 28 feet
7. Arabian horse
8. Seabiscuit
A. Weighs about 900 pounds
B. The measurement of horses
C. Won 95 percent of races
D. Can run as fast as a car, 55 mph
E. Man o’ War’s grandson
F. Weighs two thousand pounds
G. Seven times greater than Kelli’s running stride
H. The highest point of a horse’s shoulder
My favorite horse on the video was because

HORSE PARK: Time, Distance, and Speed © KET, 2009
Video Matching and ReviewKEY: HORSE PARK: HANDOUT 3
1. F, 2. B, 3. H, 4. D, 5. C, 6. G, 7. A, 8. E
Excerpts from “Greetings from the Kentucky Horse Park” script:
“This one—named ALBION—weighs 2,000 pounds and is about 17 hands high.”
“One hand equals approximately four inches. And a horse is measured from his WITHERS, the highest point of his shoulder.”
“This graceful Arabian still WEIGHS ABOUT 900 POUNDS.”
“AMERICAN QUARTER HORSES excel at sprinting short distances. Some have been clocked at fifty-five miles per hour—as fast as a car!”
“MAN O’ WAR won twenty of twenty-one races.”
“His gait or stride was an incredible 28 FEET.”
“It takes Kelli ELEVEN walking strides to equal Man o’ War’s one. And if she’s running…she still can’t compete. Even at a gallop, she needs SEVEN strides to travel those twenty-eight feet.”
“SEABISCUIT was Man o’ War’s grandson.”

HORSE PARK: Time, Distance, and Speed © KET, 2009
Name: Date:
HORSE PARK: HANDOUT 4“At the Track”
Complete the chart of distance and time as you race the runners in the “At the Track” interactive. Calculate the speed from information in either column one or column two. Remember that speed is equal to distance divided by time.
Runner Distance for 60 sec. (miles)
Time for 1 mile (seconds)
Speed (mph)
1. Man o’ War
2. Seabiscuit
3. Secretariat
4. Cheetah
5. Lily
6. Roger Bannister
Sort the runners by rate, from slowest to fastest.
Runner Distance for 60 sec. (miles)
Time for 1 mile (seconds)
Speed (mph)
1. As the speed of the runner increases, what happens to the distance the runner travels in a set amount of time?
2. Is this a direct proportion or an inverse proportion? How do you know?

HORSE PARK: Time, Distance, and Speed © KET, 2009
“At the Track”
3. Use the data from the chart to sketch the graph of distance vs. speed for Lily, Roger Bannister, Man o’ War, and the cheetah (Man o’ War’s speed is so close to that of Seabiscuit and Secretariat that it would be difficult to plot the horses separately on this scale.) Plot the speed on the x-axis and the distance on the y-axis.
4. As the speed of the runner increases, what happens to the time the runner takes to travel a set distance?
5. Is this a direct or an inverse proportion? How do you know?

HORSE PARK: Time, Distance, and Speed © KET, 2009
“At the Track”
6. Use the data to sketch the graph of time vs. speed for Lily, Roger Bannister, Man o’ War, and the cheetah. Put time on the y-axis and speed on the x-axis.
7. Describe how the appearance of the graphs of distance vs. speed and time vs. speed differ. How do you know whether the graph shows a direct or an inverse proportion?

HORSE PARK: Time, Distance, and Speed © KET, 2009
“At the Track”KEY: HORSE PARK: HANDOUT 4
Complete the chart of distance and time as you race the runners. Calculate the speed from information in either col-umn one or column two. Remember that speed is equal to distance divided by time.
Runner Distance for 60 sec. (miles)
Time for 1 mile (seconds)
Speed (mph)
1. Man o’ War 0.619 97 37.1
2. Seabiscuit 0.588 102 35.3
3. Secretariat 0.632 95 37.9
4. Cheetah 1 60 60
5. Lily 0.125 480 7.5
6. Roger Bannister 0.250 240 15
Sort the runners by rate, from slowest to fastest
Runner Distance for 60 sec. (miles)
Time for 1 mile (seconds)
Speed (mph)
5. Lily 0.125 480 7.5
6. Roger Bannister 0.250 240 15
2. Seabiscuit 0.588 102 35.3
1. Man o’ War 0.619 97 37.1
3. Secretaria 0.632 95 37.9
4. Cheetah 1 60 60
1. As the speed of the runner increases, what happens to the distance the runner travels in a set amount of time? It increases.
2. Is this a direct proportion or an inverse proportion? How do you know?This is a direct proportion. When the speed increases, the distance traveled in a set amount of time increases, too. Students may observe that Lily’s speed is half of Roger Bannister’s and her distance is also half of Roger Bannister’s. The cheetah runs four times as fast as Roger Bannister, and he goes four times as far.

HORSE PARK: Time, Distance, and Speed © KET, 2009
KEY: “At the Track”
3. Use the data from the chart to sketch the graph of distance vs. speed for Lily, Roger Bannister, Man o’ War, and the cheetah (Man o’ War’s speed is so close to that of Seabiscuit and Secretariat that it would be difficult to plot the horses separately on this scale.) Plot the speed on the x-axis and the distance on the y-axis.
Lily l
Roger Bannister H
Man o' War n
Cheetah Y
1.0
0.8
0.6
0.4
0.2
0 15 30 45 60 75
Distance(miles)
Speed (mph)
Note to Teacher: This handout only requires students to sketch the graph. Their sketch should be of a straight line connecting the four dots some-thing like the example above, with an indication that they considered how each of the speeds and distances relate to one another spatially. If you want, you could have them create a more elaborate and properly labeled graph on graph paper that would reflect more exacting decisions about scale and how to subdivide the x and y axes.
4. As the speed of the runner increases, what happens to the time the runner takes to travel a set distance?The time decreases.
5. Is this a direct or an inverse proportion? How do you know?This is an inverse proportion. As the speed increases, the time it takes to travel the same distance decreases.
l
H
n
Y

HORSE PARK: Time, Distance, and Speed © KET, 2009
KEY: “At the Track”
6. Use the data to sketch the graph of time vs. speed for Lily, Roger Bannister, Man o’ War, and the cheetah. Put time on the y-axis and speed on the x-axis.
7. Describe how the appearance of the graphs of distance vs. speed and time vs. speed differ. How do you know whether the graph shows a direct or an inverse proportion?The x and y value in Distance vs. Speed both increase steadily relative to one another, indicating that they are directly pro-portional. They form a straight line originating in 0. The graph of Time vs. Speed is a smooth L-shaped curve in which the x-value increases as the y value decreases. This indicates that the two values are indirectly proportional.
Lily l
Roger Bannister H
Man o’ War n
Cheetah Y
600
500
400
300
200
100
0 15 30 45 60 75
Teacher Tip:This handout only requires students to sketch the graph. Their sketch should be of a curved line connecting the four dots something like the example above, with an indication that they considered how each of the speeds and times relate to one another spatially. If you want, you could have them create a more elaborate and properly labeled graph on graph paper that would reflect more exacting decisions about scale and how to subdivide the x and y axes.
l
H
nY

HORSE PARK: Time, Distance, and Speed © KET, 2009
Name: Date:
HORSE PARK: HANDOUT 5Practice “At the Track”
Here are speeds of various modes of transportation. Calculate the time it would take to travel 60 miles. Express your answers in fractions.
Modes of Transportation
Mode of Transportation
Speed(mph)
Time(hours)
Distance(miles)
Commuter plane 240 mph 60
High speed train 120 mph 60
Car 60 mph 60
Motor bike 45 mph 60
Electric bike 15 mph 60
Personal transporter 10 mph 60
Kick scooter 6 mph 60
1. What happens to time as speed increases?
2. The speed of the electric bike is 1/4 the speed of the car. What is the ratio of the electric bike’s travel time to the car’s travel time?
3. The speed of the personal transporter is 1/6 the speed of the car. What is the ratio of the personal transporter’s time to the car’s time?
4. Speed times time equals distance. How does this formula indicate that speed and time are inversely proportional to each other?
HORSE PARK: Time, Distance, and Speed © KET, 2009
Practice “At the Track”5. Sketch a graph of the data from “Modes of Transportation” with speed on the x-axis and time on the y-axis.
6. A local organization is raising money for a skate park. Participants accept pledges based on the number of laps they run around the track between 10:00 and 11:00 on Saturday. Four times around the track is one mile.
Runner Number of Laps Total Miles Speed (mph)
Fred 32 laps
Roderick 30 laps
Samuel 28 laps
Kelly 24 laps
Will 20 laps
Jacob 16 laps
Moses 8 laps
Job 4 laps
Totals 162 laps

HORSE PARK: Time, Distance, and Speed © KET, 2009
Practice “At the Track”
7. Sketch a graph of the data from the chart of skate park fundraisers with speed on the x-axis and distance on the y-axis.
8. How do you know that speed and distance are in direct proportion?

HORSE PARK: Time, Distance, and Speed © KET, 2009
Practice “At the Track”KEY: HORSE PARK: HANDOUT 5
Here are speeds of various modes of transportation. Calculate the time it would take to travel 60 miles. Express your answers in fractions.
Modes of Transportation
Mode of Transportation
Speed(mph)
Time(hours)
Distance(miles)
Commuter plane 240 mph 1/4 hour 60
High speed train 120 mph 1/2 hour 60
Car 60 mph 1 hour 60
Motor bike 45 mph 1 1/3 hours 60
Electric bike 15 mph 4 hours 60
Personal transporter 10 mph 6 hours 60
Kick scooter 6 mph 10 hours 60
1. What happens to time as speed increases? Time decreases as speed increases. They are inversely proportional.
2. The speed of the electric bike is 1/4 the speed of the car. What is the ratio of the electric bike’s travel time to the car’s travel time?4:1
3. The speed of the personal transporter is 1/6 the speed of the car. What is the ratio of the personal transporter’s time to the car’s time?6:1
4. Speed times time equals distance. How does this formula indicate that speed and time are inversely proportional to each other?If speed = x and time =y, x • y will equal a constant, which is the distance traveled. This formula is how inverse proportions are expressed (x • y = k). Speed and time are related variables. As speed increases, the travel time decreases. The higher your speed, the shorter the time it takes you to travel a set distance.
5. Sketch a graph of the data from “Modes of Transportation” with speed on the x-axis and time on the y-axis. The x-axis should be labeled “Speed (mph).” The y-axis should be labeled “Time (hours).” As the x value increases, the y value decreases. As the y value increases, the x value becomes small. The graph looks like a capital letter L with a smooth curve connecting the points and no point crossing the x or y-axis.
If you want, you could have students create a more elaborate and properly labeled graph on graph paper that would reflect more exacting decisions about scale and how to subdivide the x and y axes.

HORSE PARK: Time, Distance, and Speed © KET, 2009
KEY: Practice “At the Track”
6. A local organization is raising money for a skate park. Participants accept pledges based on the number of laps they run around the track between 10:00 and 11:00 on Saturday. Four times around the track is one mile.
Runner Number of Laps Total Miles Speed (mph)
Fred 32 laps 8 miles 8 mph
Roderick 30 laps 7.5 miles 7.5 mph
Samuel 28 laps 7 miles 7 mph
Kelly 24 laps 6 miles 6 mph
Will 20 laps 5 miles 5 mph
Jacob 16 laps 4 miles 4 mph
Moses 8 laps 2 miles 2 mph
Job 4 laps 1 mile 1 mph
Totals 162 laps 30.5 miles
7. Draw a simple graph that illustrates the relationship between distance and speed. Use laps and speed.The graph should show speed (mph) on the x-axis and distance (miles) on the y-axis. As x increases, y increases steadily to create a straight line going up at an angle from 0 degrees.
Teacher Tip: If you want, you could have students create a more elaborate and properly labeled graph on graph paper that would reflect more exacting decisions about scale and how to subdivide the x and y axes.
8. How do you know that speed and distance are a direct proportion?Speed = distance/timeSpeed × time = distanceDistance/speed = timeThe distance and the speed both increase proportionally. The faster you go, the farther you will go in a set period of time. Direct proportions are expressed as x/y =k.

HORSE PARK: Time, Distance, and Speed © KET, 2009
Name: Date:
HORSE PARK: HANDOUT 6Everyday Proportions
1. Chelsea finished the 5K race in 30 minutes. There are 3.1 miles in a 5 kilometer race. What is her speed in mph?
2. Henry’s family is traveling 600 miles on vacation. There are four drivers in his family, and each will drive 150 miles of the 600-mile journey. Express your answer in decimals, rounded to the nearest hundredth place.
Driver Average Speed (mph) Distance (miles) Time (hours)
Father 70 150
Mother 65 150
Older sister 60 150
Grandpa 55 150
A. Based on the information given, determine how long it will take the family to travel 600 miles.
B. Looking at the relationship of speed and time, what indicates there is an inverse proportion?
3. A trucking company requires its drivers to average 65 mph on the highway. If a trucker drives for 5 hours, what would be the total distance he travels?
4. The school bus travels the 40-mph speed limit on the curvy road to the wildlife reserve. A tractor in front of the bus travels at 8 mph. If the tractor is only on the road for 2 miles, how many minutes will the tractor be on the road?
5. Carson, who is in elementary school, walks 1/3 as fast as his teenage brother runs. His teenage brother finishes the 2-mile run/walk in 12 minutes. Carson is walking the same 2-mile run/walk. What will Carson’s time be?
HORSE PARK: Time, Distance, and Speed © KET, 2009
Everyday Proportions
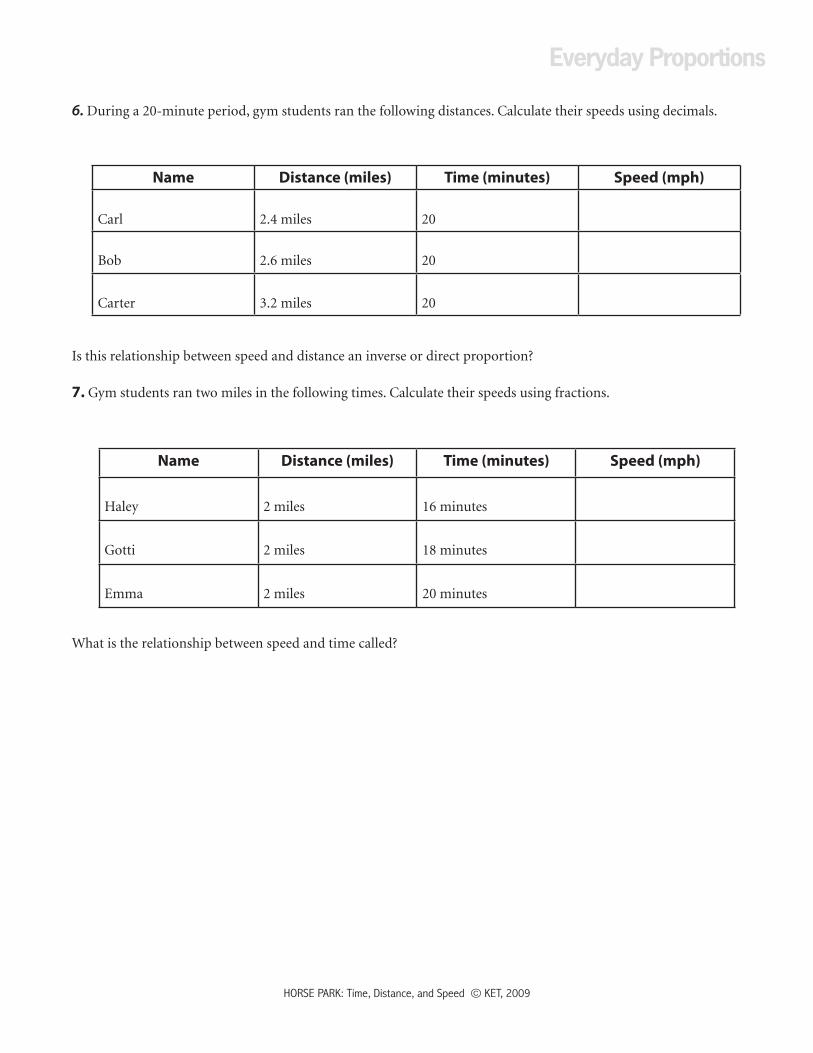
6. During a 20-minute period, gym students ran the following distances. Calculate their speeds using decimals.
Name Distance (miles) Time (minutes) Speed (mph)
Carl 2.4 miles 20
Bob 2.6 miles 20
Carter 3.2 miles 20
Is this relationship between speed and distance an inverse or direct proportion?
7. Gym students ran two miles in the following times. Calculate their speeds using fractions.
Name Distance (miles) Time (minutes) Speed (mph)
Haley 2 miles 16 minutes
Gotti 2 miles 18 minutes
Emma 2 miles 20 minutes
What is the relationship between speed and time called?

HORSE PARK: Time, Distance, and Speed © KET, 2009
Everyday ProportionsKEY: HORSE PARK: HANDOUT 6
1. Chelsea finished the 5K race in 30 minutes. There are 3.1 miles in a 5 kilometer race. What is her speed in mph?6.2 mph
2. Henry’s family is traveling 600 miles on vacation. There are four drivers in his family, and each will drive 150 miles of the 600-mile journey. Express your answer in decimals, rounded to the nearest hundredth place.
Driver Average Speed (mph) Distance (miles) Time (hours)Father 70 150 2.14 hours
Mother 65 150 2.31 hours
Older sister 60 150 2.5 hours
Grandpa 55 150 2.73 hours
A. Based on the information given, determine how long it will take the family to travel 600 miles.9.68 hours
B. Looking at the relationship of speed and time, what indicates there is an inverse proportion?Speed times time always equals the constant distance of 150 miles. As speed decreases, the amount of time increases proportionally.
3. A trucking company requires its drivers to average 65 mph on the highway. If a trucker drives for 5 hours, what would be the total distance he travels?325 miles
4. The school bus travels the 40-mph speed limit on the curvy road to the wildlife reserve. A tractor in front of the bus travels at 8 mph. If the tractor is only on the road for 2 miles, how many minutes will the tractor be on the road?2/8 = 1/4—the part of an hour the tractor will be on the road. 1/4 of 60 minutes = 1515 minutes
5. Carson, who is in elementary school, walks 1/3 as fast as his teenage brother runs. His teenage brother finishes the 2-mile run/walk in 12 minutes. Carson is walking the same 2-mile run/walk. What will Carson’s time be?36 minutes
6. During a 20-minute period, gym students ran the following distances. Calculate their speeds using decimals.
Name Distance (miles) Time (minutes) Speed (mph)Carl 2.4 miles 20 7.2
Bob 2.6 miles 20 7.8
Carter 3.2 miles 20 9.6
Is this relationship between speed and distance an inverse or direct proportion?A direct proportion

HORSE PARK: Time, Distance, and Speed © KET, 2009
KEY: Everyday Proportions7. Gym students ran two miles in the following times. Calculate their speeds using fractions.
What is the relationship between speed and time called?An inverse proportion
Name Distance (miles) Time (minutes) Speed (mph)
Haley 2 miles 16 minutes 7 1/2
Gotti 2 miles 18 minutes 6 2/3
Emma 2 miles 20 minutes 6