table of contents message from the editor · 2016-04-14 · average moisture % 10.1 4.4 5.3...
TRANSCRIPT
Department of Primary Industry and Fisheries GPO Box 3000 Darwin NT 0801 Phone: (08) 8999 2214
ISSN 1320-727X Editorial team: Arthur Cameron Paige Richter
Table of Contents Message from the Editor ............ 1 Ord Update ................................. 2 Kununurra Soils Workshop Summary 2015 ........................... 4 NR Maps ..................................... 5 Fodder Beet Demonstration at Katherine 2014 ........................... 6 Fertiliser responses of native pastures ...................................... 8 Neem ........................................ 10 Live Cattle Exports via Darwin Port – March 2015 .................... 12
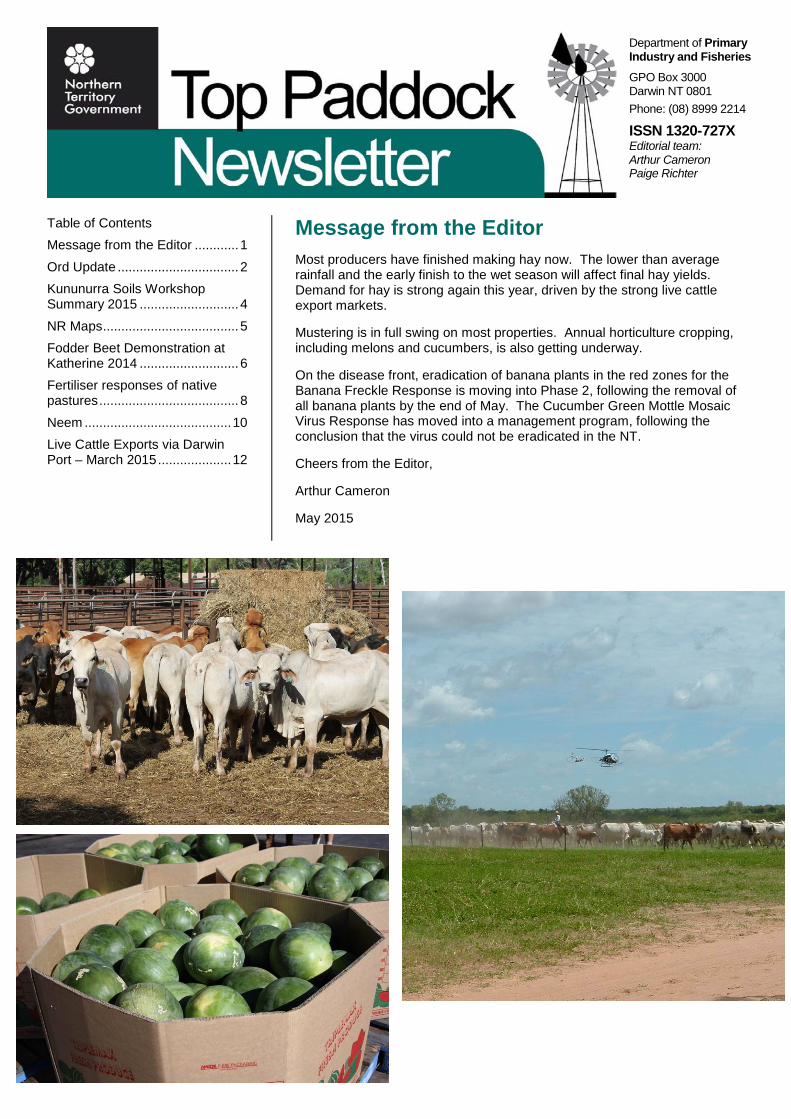
Message from the Editor Most producers have finished making hay now. The lower than average rainfall and the early finish to the wet season will affect final hay yields. Demand for hay is strong again this year, driven by the strong live cattle export markets.
Mustering is in full swing on most properties. Annual horticulture cropping, including melons and cucumbers, is also getting underway.
On the disease front, eradication of banana plants in the red zones for the Banana Freckle Response is moving into Phase 2, following the removal of all banana plants by the end of May. The Cucumber Green Mottle Mosaic Virus Response has moved into a management program, following the conclusion that the virus could not be eradicated in the NT.
Cheers from the Editor,
Arthur Cameron
May 2015
Ord Update, May 2015 Lorraine Corowa, Director Ord Development Unit, Darwin
On 23 November 2012 the Ord Development Project was awarded Major Project status.
The project, which is the first agricultural development in the Northern Territory to achieve Major Project Status, is coordinated by the Department of Primary Industry and Fisheries.
The opportunity to expand the Ord River Irrigation Scheme into the Northern Territory has been made possible by the investment of the Western Australia and Australian Governments in irrigation channels, roads and supporting social infrastructure in the East Kimberley region. More information can be found on the Department of State Development, WA Government website.
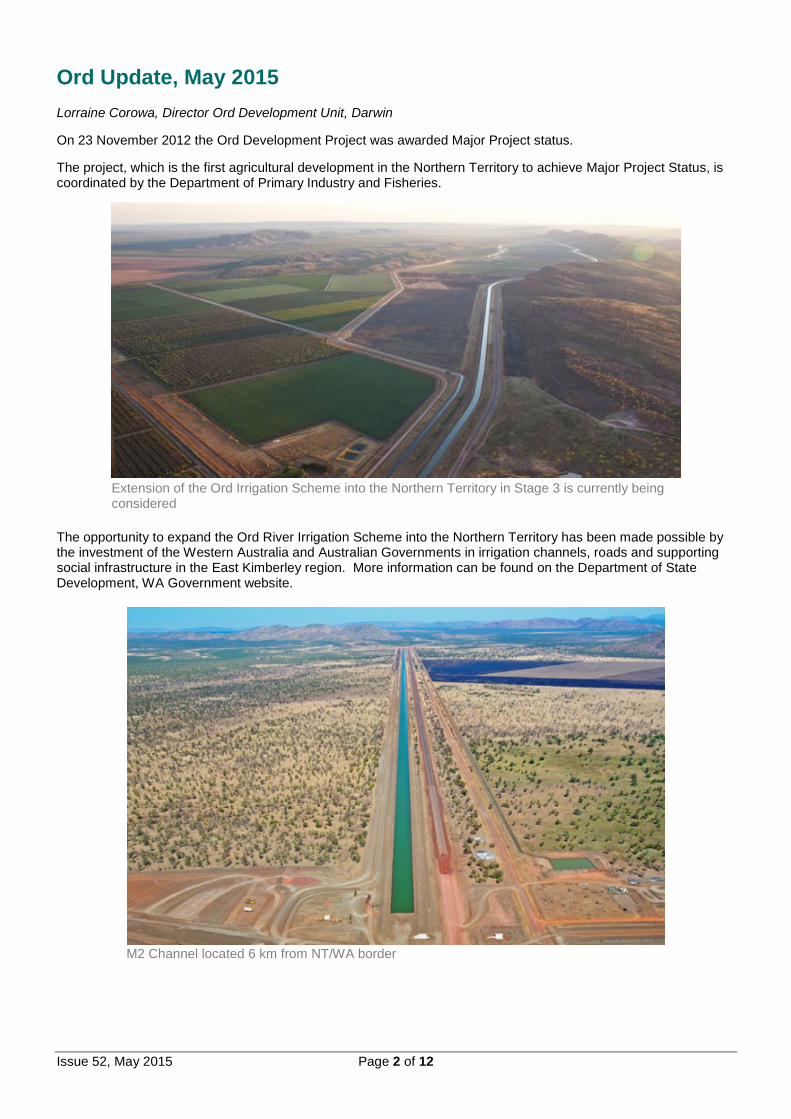
Extension of the Ord Irrigation Scheme into the Northern Territory in Stage 3 is currently being considered
M2 Channel located 6 km from NT/WA border
Issue 52, May 2015 Page 2 of 12

The areas for development in the Northern Territory include land in the Knox Plain and Keep River areas adjoining the WA/NT border.
To contact Lorraine Corowa please email: [email protected]
Updates
• A cross border legislation and operations study has been completed and a final review of the study is being undertaken to examine the recommendations.
• The NT Government is in productive negotiations with the Native Title holders regarding a small area of Ord Stage 3 (approximately 1,800 hectares) on the Knox Plain.
Issue 52, May 2015 Page 3 of 12

Soil gas emissions are trapped in chambers and samples are taken for analysis; Action on the Ground 2013
Soil gas sampling in cover crops at Coastal Plains Research Farm; Action on the Ground, Feb 2015
Kununurra Soils Workshop Summary 2015 Paige Richter, Technical Officer, Darwin
Greenhouse gas emissions were at the forefront at the Kununurra Soils Workshop, held on 12 March at the Frank Wise Institute in Kununurra WA. The workshop was hosted by Living Farm, an independent consultancy, in partnership with the Northern Territory Department of Primary Industry and Fisheries (DPIF) and the Department of Agriculture and Food Western Australia (DAFWA). Focus was on the movement of nitrogen and carbon through the soil during cropping periods, and how these elements could be used more effectively. Presentations were made by Andrew Wherrett (Living Farm), Stuart Smith (DPIF) and Frank D’Emden (Precision Agronomics Australia).
Andrew covered the basics of the nitrogen and carbon cycles, highlighting the potential for reducing nitrous oxide gas emissions from the soil during intensive farming. Nitrous oxide is a greenhouse gas with 296 times the global warming potential of carbon dioxide. Emission rates are accelerated in the warm, wet soils of northern Australia, particularly in regions of intensive farming around Kununurra, and horticultural regions around Darwin and Katherine. Although some nitrous oxide emissions are unavoidable, farmers can manage them.
There are several projects working on ways to reduce nitrous oxide emissions in agriculture across Australia as part of the Carbon Farming Futures ‘Action on the Ground’ Commonwealth initiative. Stuart discussed the Northern Territory’s involvement in this program, with research being carried out at several sites in the NT, including the Berrimah Agricultural Research Centre, Coastal Plains Research Farm, Katherine Research Station, and numerous commercial farms in the Darwin, Katherine and Kununurra regions. The NT projects aim to reduce nitrous oxide emissions and increase soil carbon through more efficient nitrogen fertiliser use in vegetable, hay and melon crops. Cover crop trials focusing on the best way to trap nitrogen during periods when melons and vegetables are not grown have been conducted in the wet season. The project began in 2012 and will continue until 2017.
The workshop also featured an unmanned aerial vehicle (drone) demonstration. This was presented by Precision Agronomics Australia (PAA), a WA consultancy business that specialises in precision farming practices. Frank discussed different ways PAA can help farmers to enhance profits and production gains through use of variable rate technology. This technology uses integrated software systems to vary the rate of seeding and chemical application across different areas of paddocks, allowing for precise site-specific application designed to improve crop productivity. Frank demonstrated how farmers can also use airborne imagery through drone mounted near infrared cameras to acquire crop biomass information during the growing season.
A summary of NT DPIF’s involvement in Action on the Ground can be viewed at: http://www.nt.gov.au/d/Primary_Industry/index.cfm?newscat1=&newscat2=&header=Action%20on%20the%20Ground#
Issue 52, May 2015 Page 4 of 12

NR Maps program focused on an aerial image of the Douglas Daly region
NR Maps The Department of Land Resource Management has made it easier for people to find valuable natural resource information through its latest version of NR Maps.
The new Natural Resource (NR) Maps web mapping system can be found via www.nrmaps.nt.gov.au and is a great tool to help you obtain natural resource spatial data.
Features of the new version include:
• Using latest web mapping technologies and improved hardware setup • Downloading of some natural resource Geographic Information System (GIS) data • Better user interface, data grid frame, map image resolution, and printing facilities • Quick search for land parcels and water bores • More tools such as buffering, selection, redlining and improved searching • NT aerial photography background is now available to the public • More natural resources GIS layers and map products • Includes some Bureau of Meteorology’s Geofabric GIS layers • Incorporates NT Department of Mines and Energy selected GIS layers including geoscience, geophysics
and mining titles • Incorporates land information GIS layers from the NT Department of Lands Planning and the Environment
The new system is part of an integrated NT Natural Resource Management information system that is accessible to internal/external clients and offers improved access to natural resource information.
It is the web mapping interface to DLRM business systems such as the Land Development Comment Information System, Water Licensing Application System, Weeds and Bushfire Monitoring Systems and many more to come in the future.
Assistance in the use of the new system is available by calling DLRM Spatial Data and Mapping Unit at various locations.
Darwin: Katherine: Alice Springs: Athina Pascoe-Bell Ph: (08) 8999 3470
Caroline Green Ph: (08) 8973 8843
Anna Sheridan Ph: (08) 8951 9216
Jerry Kuo Ph: (08) 8999 4579
Ross Ocampo Ph: (08) 8999 3602
Issue 52, May 2015 Page 5 of 12

Fodder beet establishment; 5 Sept 2014
Fodder Beet Demonstration at Katherine 2014 Grant Cutler, Senior Technical Officer, Katherine Arthur Cameron, Principal Pastures and Extension Officer, Darwin
Fodder beet (Beta vulgaris subspecies vulgaris) is a biennial plant with a large root. It has been used as a fodder in Europe for hundreds of years.
A preliminary demonstration to determine the suitability of Fodder beet as a dry season fodder in the Katherine District was planted at Katherine Research Station (KRS) on 6 August 2014.
The variety planted was SF Brigadier, which has a high yield potential and is very palatable. The seed was supplied by Seed Force from New Zealand.
Four 200 square metre bays in the netted area at KRS were planted, two with coated seed and two with uncoated seed.
Prior to planting the bays had been cultivated, sprayed with glyphosate to kill emerged seedlings and fertilisers (150 kg/ha of DAP and 100 kg/ha of Muriate of Potash) had been incorporated into the soil.
For best results, Fodder beet should be planted early in the dry season into a moist fine seedbed with a precision planter. This did not happen with this planting. The planting was delayed by a number of external factors. The soil was dry on 6 August because of problems with the irrigation system, and there were some Cavalcade (Centrosema pascuorum) and Sabi grass (Urochloa mosambicensis) seedlings present. The bays were scarified twice with diamond harrows before planting. The seed was planted with a precision lettuce planter borrowed from local producer Matt Dennis. This lettuce planter was configured for planting beds, so the seed was planted in 2 beds of 4 rows at about 40 cm spacing in each bay.
The bays were irrigated for 1 hour after planting and 45 minutes later that day. The bays were irrigated for 30 minutes twice daily for the next 4 days, and for 45 minutes daily for the remainder of the demonstration. The sugar beet performance was not limited by moisture.
Establishment was fair to good. There was no obvious difference in establishment between the coated and uncoated seed. Weeds which emerged after planting were mainly Cavalcade and Sabi grass. The bays were sprayed with Verdict at 250 ml/ha. This gave good control of the Sabi grass. As Cavalcade has not been found as a weed in fodder beet previously, there was no herbicide option for control. The Cavalcade was competing strongly with the Fodder beet in November. Taller weeds were hand weeded from the bays.
Issue 52, May 2015 Page 6 of 12

A healthy Fodder beet; 18 Sept 2014
The Fodder beet plants grew well, but tended to wilt during the hotter afternoons.
In mid-October, caterpillars Cluster caterpillar (Spodoptera litura), Heliothis (Helicoverpa sp) and Beet webworm (Spoladea recurvalis) were starting to attack the Fodder beet leaves. The Fodder beet had been completely defoliated by mid-November.
Six randomly selected well-grown Fodder beet plants were harvested on 10 November, divided into tops and beets, weighed and dried at 60oC. After 24 hours of drying, the beets were still quite moist. They were sliced into sections to allow them to dry properly.
While slicing the beets, it was obvious that some of the beets had been infected with a root rot. There were black streaks though some of the beets. The taproots of some of the plants in the field had also rotted. No other disease problems were noticed in the Fodder beets.
The average and ranges of Fresh weight, Dry weight and Moisture content of the SF Brigadier tops, beets and whole plants are presented in the Table below.
Measurement Tops Beets Total Average Fresh Weight (g) 524 2769 3292 Fresh Weight range (g) 308 - 717 1553 - 3499 2113 - 4216 Average Dry Weight (g) 53 121 174 Dry Weight range (g) 26 - 91 83 - 153 124 - 211 Average Moisture % 10.1 4.4 5.3 Moisture % Range 5.0 – 13.9 3.4 – 5.4 4.0 – 6.5 Assuming a recommended plant population of 80,000 plants per hectare, this plant size yield equates to dry matter yields of 4.2 t/ha of tops and 9.7 t/ha of beets with a total yield of 13.9 t/ha. This yield is lower than the predicted yield of 20 to 40 t/ha for a number of good reasons. The yield in this demonstration was reduced by the late sowing and shorter than expected growing season, the competition from weeds, the damage by insects and possibly heat stress late in the dry season.
The fodder beets produced this 13.9 t/ha yield in 52 days after the establishment period, at a rate of 267.7 kg/ha/day. With a mid-April sowing, and harvest in mid-September, at that growth rate, SF Brigadier fodder beets could potentially produce dry matter yields of between 30 and 40 t/ha over a 138 day growing period.
Some of the tops, and beets cut into sections were provided to cattle in an adjacent paddock at KRS. The cattle readily ate the fodder beet tops, but only one animal ate a portion of a beet.
The conclusion from this demonstration is that SF Brigadier fodder beet is capable of growing well and producing good yields of dry matter under irrigation in the dry season at Katherine. More work will need to be conducted on the agronomy of the crop and to determine how to control Cavalcade in fodder beet crops. How the crop is used also needs to be considered. The crop can be grazed in the field or harvested and stored for later use. Storage may be a problem in the hot humid climate of the Top End. The value of the fodder beet as a feed, and the economics of production would need to be evaluated before Fodder beet could be recommended as a viable option for Top End producers.
Issue 52, May 2015 Page 7 of 12

Fertiliser responses of native pastures Arthur Cameron, Principal Pastures and Extension Agronomist, Darwin
I am regularly asked about the value of fertilising native pastures to improve productivity. There has been no recent work on the subject because of an evaluation conducted at Katherine by CSIRO between 1956 and 1959. This work was reported by Mike Norman in 1966.
The native pasture was typical for a Tippera soil, the major components being a mixture of Golden beard grass (Chrysopogon fallax), Kangaroo grass (Themeda triandra) and Plume sorghum (Sorghum plumosum).
Nutrients were applied to native pastures as Ammonium sulphate (Sulphate of ammonia) as the nitrogen (N) source and Superphosphate as a phosphorus (P) source. Both of these fertilisers however also supply significant amounts of sulphur (S). The fertilisers were applied over 3 years at all combinations of nil, low and high rates (9 treatments in total).
The fertilisers applied to the native pastures over the 3 years1956 – 1959 are presented in Table 1 below.
Table 1 Fertilisers applied (kg/ha) Year Ammonium sulphate Superphosphate
N S P S Low High Low High Low High Low High
1 37.8 74.8 52.4 88 16.5 33.0 18.5 37.0 2 37.8 74.8 52.4 88 8.3 16.6 9.2 18.5 3 37.8 74.8 52.4 88 8.3 16.6 9.2 18.5 Total 113.4 224.4 157.2 264 33.1 65.2 36.9 74 Average 37.8 74.8 52.4 88 11.0 21.7 12.3 24.7 These fertiliser mixes were not balanced. The amount of sulphur applied was too high compared to the nitrogen and phosphorus, but as the sulphur was not limiting, it was unlikely to have influenced the nutrient responses of the native grasses.
The average yields of the 9 treatments are presented in Table 2 below.
Table 2 Pasture yields of all fertiliser treatments Treatment Average Fertiliser applied Kg/ha/yr Average Dry matter yield Kg/ha
N P S 0 N 0 P 0 0 0 2195 0 N Low P 0 11 64.7 2296 0 N High P 0 21.7 24.7 2542 Low N 0 P 37.8 0 52.4 2408 Low N Low P 37.8 11 64.7 3136 Low N High P 37.8 21.7 77.1 3505 High N 0 P 74.8 0 88 2273 High N Low P 74.8 11 100.3 3136 High N High P 74.8 21.4 112.7 4502 The results show that there was little response to the nitrogen and sulphur in the absence of phosphorus, and to phosphorus and sulphur in the absence of nitrogen. Highest yields were achieved with the highest level of both fertilisers applied.
Issue 52, May 2015 Page 8 of 12

Typical native pasture growing on Tippera soil of the Katherine region, NT
At the fertiliser levels applied in the work reported by Norman, an introduced grass would be expected to yield the amounts in the table below (Cameron 2008).
Table 3 Expected introduced grass pasture yields with the fertilisers applied to the native pastures Treatment Average Fertiliser applied Kg/ha Expected Dry matter yield for an
introduced grass Kg/ha N P S 0 0 0 0 N/A 0 N Low P + S 0 11 64.7 4000 Low fertiliser 37.8 11 64.7 5200 High Fertiliser 74.8 21.7 112.7 6700 (N/A: introduced grasses are generally grown with at least some basal P and S fertiliser)
While the High fertiliser treatment applied to the native grasses doubled the yield of the pasture, the yield is only similar to that expected from an introduced grass without nitrogen fertiliser.
Norman concluded that the application of fertilisers to native pastures is inefficient, that recovery of the fertilisers is low and increases in nutrient yields were low.
Norman reported that the native grasses responded differently to the fertilisers. The Plume sorghum responded positively and independently to both of the fertilisers. The Kangaroo grass was favoured by a balanced nutrient supply. The Golden beard grass did not respond to either fertiliser.
References: Cameron A. G. (2008). Fertilisers for Grass Pastures. DPIF Agnote E60
Norman M. J. T. (1966). Katherine Research Station 1956-64: A Review of Published Work. CSIRO Division of Land Research Technical Paper No. 28
Issue 52, May 2015 Page 9 of 12

Neem Draft Weed Management Plan
Neem is a fast growing tree that is rapidly establishing along Top End waterways including the Katherine River. Its high levels of seed production, extensive root systems and ability to regrow from suckers have enabled it to aggressively compete with native plants, even in healthy, intact environments.
Since the declaration of neem in July 2014 as a Class B (growth and spread to be controlled) and Class C (not to be introduced to the NT) weed, lots of neem control has already been undertaken across a range of land tenures and some exciting partnerships are starting to take shape to control priority infestations. Some great examples of proactive approach towards the control of neem include:
• The Heytesbury Cattle Company’s Victoria River Downs Station has treated a large infestation along 8 km of the Victoria River. They have calculated that the initial control has cost a whopping $24 000 per kilometre stretch of the river with an additional 10 km still to receive initial treatments and follow up due to the number of seedlings that have germinated following control.
Treated neem on the Victoria River Downs Station
Neem seedling
Issue 52, May 2015 Page 10 of 12
• The Roper River Landcare Group’s Mangarrayi Rangers, working in partnership with the Jilkminggan Remote Jobs Communities Program team, have controlled thousands of seedlings around and outside the Jilkminggan community. Discussions are currently underway to set up a similar partnership with the township of Mataranka and other communities.
• Crown land around Katherine has also had a strategic control program implemented, targeting initially the larger and more accessible infestations. It is estimated that approximately 75% of plants have been treated this year. Further initial control measures and follow up treatments will continue.
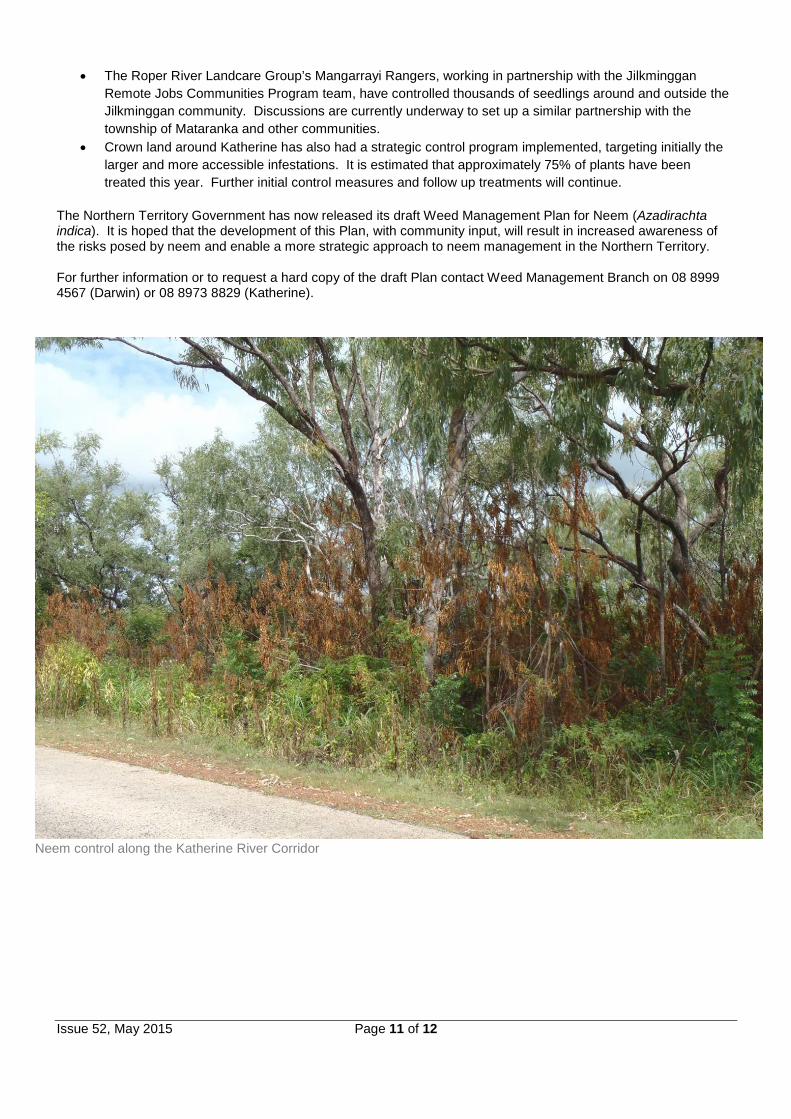
The Northern Territory Government has now released its draft Weed Management Plan for Neem (Azadirachta indica). It is hoped that the development of this Plan, with community input, will result in increased awareness of the risks posed by neem and enable a more strategic approach to neem management in the Northern Territory.
For further information or to request a hard copy of the draft Plan contact Weed Management Branch on 08 8999 4567 (Darwin) or 08 8973 8829 (Katherine).
Neem control along the Katherine River Corridor
Issue 52, May 2015 Page 11 of 12
DEPARTMENT OF PRIMARY INDUSTRY AND FISHERIES
Pastoral Market Update
Live Cattle Exports via Darwin Port – April 2015 Figures are for cattle exported through the Port of Darwin only; some NT cattle are exported through interstate ports.
Destination
ALL CATTLE (including from interstate) NT CATTLE (estimate)
2013 2014 2014 to 30/4/14
YTD to 30/4/15 April Last
month Difference 2013 2014 2014 to 30/4/14
YTD to 30/4/15 April Last
month Difference
BRUNEI 4,043 4,925 2078 1,029 0 0 0 4,043 4,925 2,078 0 0 0 0 INDONESIA 282,022 386,183 111,922 122,206 61,922 22,418 39,504 243,978 251,232 67,934 50,896 20,577 9,436 11,141
PHILIPPINES 22,403 16,080 2,173 8,482 5,400 3,082 2,318 15,063 11,221 2,173 3,091 1,794 1,297 497 SABAH 0 0 0 0 0 0 0 0 0 0 0 0 0 0
SARAWAK 800 0 0 300 0 0 0 800 0 0 0 0 0 0 W-MALAYSIA 14,952 22,309 4,696 270 0 0 0 12,094 15,708 4,696 218 0 0 0
VIETNAM 35,396 64,461 6,706 27,966 2,783 17,041 -14,258 32,806 41,391 6,706 15,236 925 7,173 -6,248 EGYPT 0 0 0 0 0 0 0 0 0 0 0 0 0 0
THAILAND 0 0 0 2,305 0 1,381 -1,381 0 0 0 1,097 0 581 -581
TOTAL 359,616 493,958 127,575 162,558 70,105 43,922 26,183 308,784 324,477 83,587 70,538 23,296 18,487 4,809
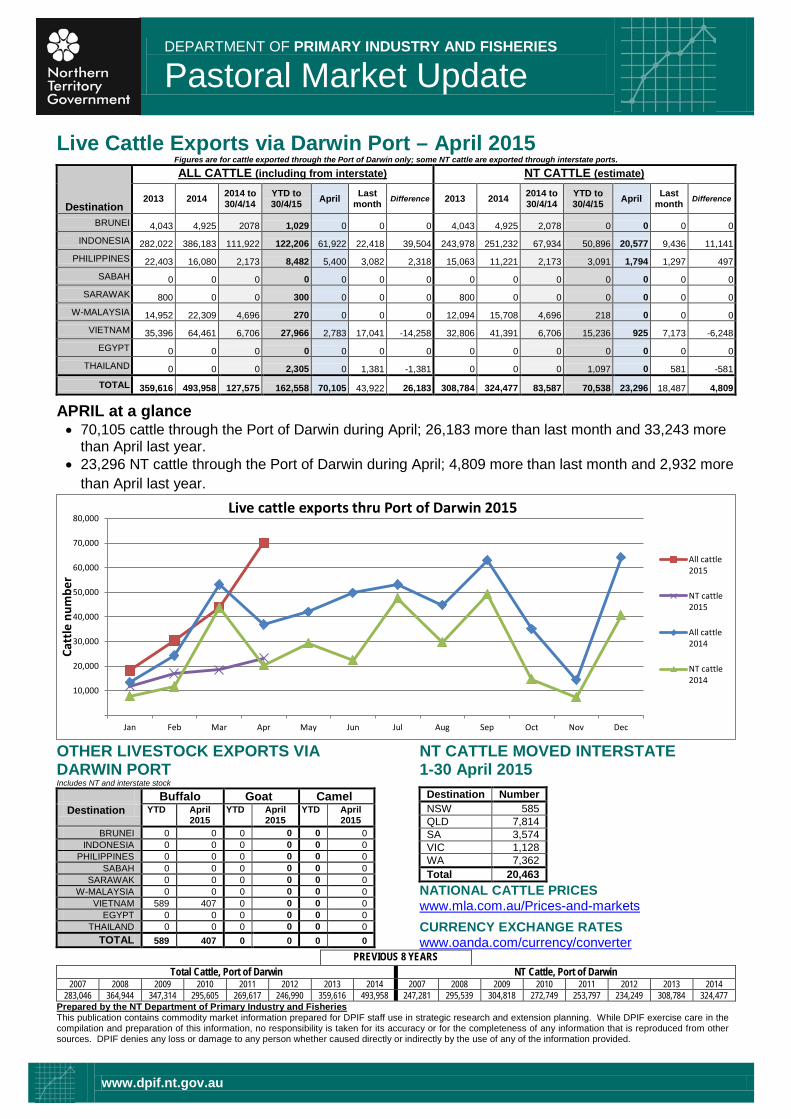
APRIL at a glance • 70,105 cattle through the Port of Darwin during April; 26,183 more than last month and 33,243 more
than April last year. • 23,296 NT cattle through the Port of Darwin during April; 4,809 more than last month and 2,932 more
than April last year.
OTHER LIVESTOCK EXPORTS VIA DARWIN PORT Includes NT and interstate stock
Buffalo Goat Camel Destination YTD April
2015 YTD April
2015 YTD April
2015 BRUNEI 0 0 0 0 0 0
INDONESIA 0 0 0 0 0 0 PHILIPPINES 0 0 0 0 0 0
SABAH 0 0 0 0 0 0 SARAWAK 0 0 0 0 0 0
W-MALAYSIA 0 0 0 0 0 0 VIETNAM 589 407 0 0 0 0
EGYPT 0 0 0 0 0 0 THAILAND 0 0 0 0 0 0
TOTAL 589 407 0 0 0 0
NT CATTLE MOVED INTERSTATE 1-30 April 2015
Destination Number NSW 585 QLD 7,814 SA 3,574 VIC 1,128 WA 7,362 Total 20,463
NATIONAL CATTLE PRICES www.mla.com.au/Prices-and-markets
CURRENCY EXCHANGE RATES www.oanda.com/currency/converter
PREVIOUS 8 YEARS Total Cattle, Port of Darwin NT Cattle, Port of Darwin
2007 2008 2009 2010 2011 2012 2013 2014 2007 2008 2009 2010 2011 2012 2013 2014 283,046 364,944 347,314 295,605 269,617 246,990 359,616 493,958 247,281 295,539 304,818 272,749 253,797 234,249 308,784 324,477
Prepared by the NT Department of Primary Industry and Fisheries This publication contains commodity market information prepared for DPIF staff use in strategic research and extension planning. While DPIF exercise care in the compilation and preparation of this information, no responsibility is taken for its accuracy or for the completeness of any information that is reproduced from other sources. DPIF denies any loss or damage to any person whether caused directly or indirectly by the use of any of the information provided.
10,000
20,000
30,000
40,000
50,000
60,000
70,000
80,000
Jan Feb Mar Apr May Jun Jul Aug Sep Oct Nov Dec
Catt
le n
umbe
r
Live cattle exports thru Port of Darwin 2015
All cattle2015
NT cattle2015
All cattle2014
NT cattle2014
www.dpif.nt.gov.au