table of contents recent releases - the kitware … · recent releases ... paraview 5.1 brought the...
TRANSCRIPT

Issue 24 •
Editor's Note ............................................................................... 1
Recent Releases ......................................................................... 1
Extending ModelBuilder for Post-processing Simulations ...... 3
Developing a Virtual Simulator for Laparoscopic Surgery ....... 6
Introducing SlicerAstro: A Visualization Tool for Hydrogen in Galaxies ................................................................................ 10
Ray-traced Rendering Revisited .............................................. 14
Kitware News ............................................................................ 17
PARAVIEW 5.1ParaView 5.1 brought the process of ray tracing to the open-source application for data analysis and visualization. This process utilizes the OSPRay library from Intel. The latest release also brought the capability to render picture-in-picture visualizations to ParaView.
On top of new rendering capabilities, ParaView gained several new filters with the release. A new collection of filters interpolates point clouds to line, plane, and regular volume meshes, including smoothed-particle hydrodynmics (SPH) interpolation. Another filter efficiently resamples large unstructured grids to generate regular grids.
In other news, the 5.1 release refactored the zero-copy infrastructure in ParaView to pass data arrays with arbitrary memory layouts to ParaView Catalyst. As a result, ParaView uses less overhead when it accesses the arrays in filters. The release also refactored three-dimensional (3D) widgets so that applications can more efficiently employ them.
With additional improvements, ParaView gained new functionality. For example, the release made it possible to simultaneously look at multiple blocks in composite data sets. The release also made it possible to rename views.
ParaView visualizes streamlines around an engine. (Altair Engineering and FluiDyna GmbH)
TABLE OF CONTENTS RECENT RELEASES
Issue 38 • July 2016
Over the past few months, we have welcomed many new team members! To make room, we are expanding our office space in Carrboro, North Carolina. The new space will include comfortable seating that promotes collaboration. It will also have a foosball table, several themed conference rooms, an area to store bicycles, and standing and walking workstations.
To give back to the communities that surround our growing offices, we participated in and hosted multiple drives this summer. In June, we arranged a book drive to benefit Captain Youth and Family Services. Along with books, we donated recyclable bottles and cans to help the organization raise support for its programs. We also opened our doors to the American Red Cross for a blood drive.
In keeping with tradition, we enjoyed outdoor festivities with family and friends at our company picnics, which took place earlier this month. For our annual T-shirt design, however, we tried something new. We set aside our tie- dyeing skills and drew inspiration from coloring books. We truly had a blast, as we expressed our creativity with fabric markers. For pictures from our summer activities, please visit our blog at https://blog.kitware.com.
EDITOR'S NOTE

2
Further changes to ParaView established a welcome screen that contains links to resources. These resources include the two-page “ParaView Getting Started Guide” and example visualizations. For more information on using ParaView and downloading version 5.1, please refer to http://www.paraview.org.
CMAKE 3.6Earlier this summer, CMake 3.6 became available to the software development community. With the 3.6 release, the Visual Studio 14 2015 generator obtained experimental support for the Clang/C2 toolset. In addition, the list() command received a FILTER sub-command, which filters list elements by regular expression.
The release also added a variable that informs the try_compile()command to build a static library instead of an executable. The variable, CMAKE_TRY_COMPILE_TARGET_TYPE, applies to cross-compiling toolchains that cannot link binaries without custom flags or scripts.
In addition, the release introduced the <LANG>_CLANG_TIDY target property and the CMAKE_<LANG>_CLANG_TIDY vari-able. Together, the property and variable tell the Makefile and Ninja generators to run clang-tidy as well as the compilers for C and CXX languages.
In other introductions, the release launched the GIT_SHALLOW 1 option for the ExternalProject module. With this option, the module can make a shallow clone of a Git repository. The module also gained the abilities to recursively initialize Git sub-modules and to initialize new sub-modules when CMake updates. Another module, InstallRequiredSystemLibraries, gained the ability to enable the app-local deployment of Windows Universal C Runtime (CRT) libraries with Visual Studio 2015. To learn more about the InstallRequiredSystemLibraries module and to try it out in the latest version of CMake, please visit https://www.cmake.org/download.
ITK 4.10On behalf of the Insight Segmentation and Registration Toolkit (ITK) community, Kitware released ITK 4.10. The release added a remote module that allows ITK to align two projection images of a patient. The release also presented a major update to the internal Vision Numerics Library (VNL) in ITK. In addition to this update, version 4.10 made the interface of wrapper classes more Pythonic, and it allowed Windows builds to process images over four gigabytes by default.
To download ITK 4.10.0, please go to https://www.itk.org.
ParaView visualizes a planetary gearbox. (Altair Engineering and FluiDyna GmbH)

3
EXTENDING MODELBUILDER FOR POST-PROCESSING SIMULATIONS
Bob O'Bara, Yuman Yuan, John Tourtellott, Chris Harris (Kitware)
Advanced simulation workflows often require the applica-tion of several tools to aid in constructing geometric domains, in generating meshes, in modeling simulation information such as boundary conditions and material properties, in employing numerical solvers, and in post-processing results. Such application forces engineers and scientists to generate appropriate input files, understand different command-line tools, and develop code. In addition, many engineers and scientists need to access to high-performance computational resources. As the July 2015 issue of the “Kitware Source” [3] describes, a team of developers at Kitware created the Computational Model Builder (CMB) framework [1] and the ModelBuilder application [2] to remove many of the obsta-cles that engineers and scientists face when they employ advanced simulation workflows.
ModelBuilder can create or load geometric domains, interface with various meshing technologies, model the information that simulations require, and generate—and in some cases, submit—the necessary files to run the simulations. However, to post-process results, ModelBuilder needs to access func-tionality from an additional tool such as ParaView. As part of a Phase I Department of Energy Small Business Innovation Research project to support multiphysics workflows for par-ticle accelerator simulations, the team created a prototype of a custom version of ModelBuilder that completes the
simulation workflow cycle. This version of ModelBuilder exposes some of the underlying post-processing capabilities that the ParaView architecture provides.
To test the new capabilities, the team modeled two elec-tromagnetic workflows that have roots in the Omega3P module in the Advanced Computational Electromagnetics 3D Parallel (ACE3P) system at the SLAC National Accelerator Laboratory. For the tests, ModelBuilder generated a pillbox model and a crab cavity model. This article presents the results from the tests.
ADDING MULTIPLE RENDER VIEWSThe latest major release of ModelBuilder is version 4.0. This version provides a single three-dimensional (3D) view that displays geometric domains and meshes. In order to support additional post-processing functionality, ModelBuilder needed a second 3D view. The development team created this second view for ModelBuilder to use not only to post-process results but to enable side-by-side comparison of geometric domains and their respective analysis meshes.
Since only one view can be active at any time, the Info, Properties, and ColorMap components in the prototype user interface (UI) update to reflect the active source in the active view. The eyeball icons in the pipeline tree view also update
The prototype UI in ModelBuilder shows a scalar field color map of an electric field.

4
to show the visibility status of the sources and filters in the active view.
The development team also added a camera link between the two render views. This link allows ModelBuilder to exhibit the same camera setup in both views when changes occur in one view or the other.
ACCESSING POST-PROCESSING CAPABILITIESParaView is an open-source platform for analyzing and visualizing data [4]. It serves as the underlying founda-tion of CMB. To expose the functionality of ParaView in ModelBuilder, the development team added a Post Processing panel to the prototype UI. These capabilities allow ModelBuilder to display mesh readers and filters in a manner that is identical to the pipeline browser in ParaView.
The Post Processing panel in the ModelBuilder prototype contains Properties, Display, and View components. The Properties component exposes parameters for the readers and filters, the Display component controls properties for the mesh representations, and the View component cus-tomizes the visualizations. For example, the View section changes the background color.
The ModelBuilder prototype exposes the Properties component in the Post Processing panel.
In future efforts, the team aims to further extend ModelBuilder to support more views to analyze post- processed results. These views are available in ParaView and include Chart view, Histogram view, and Spreadsheet view.
The team also looks to extend the Properties component to support additional filters.
TESTING NEW CAPABILITIESTo test the capabilities of the prototype with distinct and relevant examples of particle accelerator simulations, the development team selected two models.
The first model is the Gaussian pillbox. The Gaussian pillbox is a simple model that scientists use to perform electromag-netic accelerator simulations. The model contains a central cylinder, which makes up its geometry and represents the accelerator cavity. The model also contains two cylindrical beam pipes. During simulation, the central cylinder becomes excited. A charged particle beam enters the cylinder from the end of the upstream beam pipe. The particle beam accelerates along the cylinder, and exits at the end of the downstream beam pipe.
The second model is a crab cavity model for the high- luminosity Large Hadron Collider (LHC) [5]. This model offers a more complex and realistic example. In particle colliders such as the high-luminosity LHC, two particle beams with opposing charges travel in different directions. They gener-ally come toward each other at an angle, which reduces the chance that they will collide. The introduction of a crabbing scheme increases luminosity and rotates the beams so that they meet head-on.
The crab cavity model consists of a square tank and two rigid deflecting poles. During simulation, the model attaches to a fundamental power coupler. A radio-frequency power source drives power into the cavity, and dampers remove unwanted higher-order modes.
As part of the tests, ModelBuilder defined the pillbox model and the crab cavity model on both Linux and Mac OS desktops. ModelBuilder then submitted the simulations to run on Edison and Cori supercomputers at the National Energy Research Scientific Computing Center (NERSC). Once ModelBuilder received the results, it visualized them in its 3D views.
ModelBuilder prepares the crab cavity example by editing simulation attributes.

5
ModelBuilder executes a slice operation through the crab cavity model and visualizes the magnitude of the
electric field.
ModelBuilder performs glyphing on the pillbox model.
With the capabilities that the development team added, ModelBuilder took less time to define the simulations and offered more visual feedback. For example, ModelBuilder displayed the model geometries as the application assigned material and boundary condition information. The capa-bilities also streamlined the process of submitting simulation jobs to the NERSC supercomputers.
CUSTOMIZING MODELBUILDERBeyond high-energy particle accelerator workflows, the team has developed workflows in CMB for hydrology and nuclear energy. The team has also developed workflows for casting and modeling muliscale materials. To further tailor ModelBuilder to specific workflows, Kitware offers consult-ing and support services. Kitware also provides training courses on CMB and ModelBuilder. For more information, please e-mail [email protected].
ACKNOWLEDGEMENTTests on the ModelBuilder prototype implemented ACE3P and Omega3P from the SLAC National Accelerator Laboratory. Kitware would like to thank the SLAC National Accelerator Laboratory for its support throughout the development of the ModelBuilder application.
This material is based upon work supported by the U.S. Department of Energy, Office of Science, Office of Acquisition and Assistance, under Award Number DE-SC0013884. This report was prepared as an account of work sponsored by
an agency of the United States Government. Neither the United States Government nor any agency thereof, nor any of their employees, makes any warranty, express or implied, or assumes any legal liability or responsibility for the accuracy, completeness, or usefulness of any information, apparatus, product, or process disclosed, or represents that its use would not infringe privately owned rights. Reference herein to any specific commercial product, process, or service by trade name, trademark, manufacturer, or otherwise does not necessarily constitute or imply its endorsement, recom-mendation, or favoring by the United States Government or any agency thereof. The views and opinions of authors expressed herein do not necessarily state or reflect those of the United States Government or any agency thereof.
REFERENCES[1] Kitware, Inc. "ModelBuilder." http://www.computational
modelbuilder.org/modelbuilder.[2] Kitware, Inc. “Introducing the Computational Model Builder.” http://www.computationalmodelbuilder.org.[3] Thompson, David, Bob O’Bara, and Yumin Yuan.
“Representing Geometric Models with SMTK.” Kitware Source, October 14, 2015. https://blog.kitware.com/ representing-geometric-models-with-smtk.
[4] Kitware, Inc. “Welcome to ParaView.” http://www.paraview.org.[5] Li, Zenghai, J. R. Delayen, S. U. De Silva, HyeKyoung Park,
and R. G. Olave, “FPC and Hi‐Pass Filter HOM Coupler Design for the RF Dipole Crab Cavity for the LHC HiLumi Upgrade.” Paper presented at the sixth International Particle Accelerator Conference, Richmond, Virginia, May 3‐8, 2015.
Bob O'Bara is an assistant director of scien-tific computing at Kitware. His main areas of interest are geometric modeling, mesh gen-eration, model and mesh visualization, and general scientific visualization.
Yumin Yuan is a staff research and develop-ment engineer on the scientific computing team at Kitware. He is the main software architect of the suite of CMB applications that model, mesh, analyze, and visualize geometries.
John Tourtellot is a senior research and development engineer at Kitware. His areas of focus in scientific computing include digital map visualization and user-interface design.
Chris Harris is a staff research and develop-ment engineer who joined Kitware in 2011. Throughout his career, his efforts have per-tained to high-performance, mission-critical systems.

6
DEVELOPING A VIRTUAL SIMULATOR FOR LAPAROSCOPIC SURGERY
Andinet Enquobahrie, Sreekanth Arikatla (Kitware)
This article reports on a project to develop a virtual simulator to train residents and evaluate their skills, as they perform virtual procedures in laparoscopic surgery. Kitware leads this project in partnership with top research universi-ties and a small business.
Minimally invasive surgery, such as laparoscopic surgery, has revolutionized surgical treatment. Performing laparo-scopic surgery, however, comes with a steep learning curve and calls for extensive training. To teach and evaluate the cognitive and psychomotor aspects that are unique to lapa-roscopic surgery, a joint committee of Society of American Gastrointestinal and Endoscopic Surgeons (SAGES) members and American College of Surgeons (ACS) members created the Fundamentals of Laparoscopic Surgery (FLS) program. The FLS program has a high-stakes cognitive-and-skill-assessment component. For this component, trainees utilize a mechanical training toolbox to perform five tasks. These tasks require trainees to transfer objects onto pegs, cut precise patterns, complete loop ligation, suture with an extracorporeal knot, and suture with an intracorporeal knot, respectively.
While the mechanical training toolbox can help evaluate skills in laparoscopic surgery, SAGES personnel must hand-score the test materials to determine how well residents perform tasks. This requirement lengthens the time it takes to provide feedback to trainees, which adds large costs to the certification program and subjectivity to the overall scores. In addition to hand-scoring the tests, SAGES person-nel must replace the materials after every use.
To overcome the drawbacks of the mechanical training toolbox, Rensselaer Polytechnic Institute (RPI) developed a simulator, which it named Virtual Basic Laparoscopic Skill Trainer (VBLaST) [1]. In 2015, Kitware received funding from the National Institute of Biomedical Imaging and Bioengineering (NIBIB) of the National Institutes of Health (NIH) to work in close collaboration with RPI, Buffalo General Medical Center at the University of Buffalo, and SimQuest to extend and improve VBLaST. Andinet Enquobahrie, Ph.D, MBA, assistant director of medical computing at Kitware, leads the project.
This article provides background information on VBLaST [2]and describes accomplishments from the first year of the project. The article also discusses plans for efforts to develop and test VBLaST. These efforts will optimize the effective-ness of the simulator and allow SAGES personnel to better educate and evaluate trainees.
The mechanical training toolbox exhibits the peg-transfer task. (RPI)
WORKING TO REPLACE THE MECHANICALTRAINING TOOLBOXProfessor Suvranu De guided the creation of VBLaST at RPI under a Research Project Grant from the NIH (R01 EB010037) [3]. As the following images depict, VBLaST virtualizes all five tasks of the mechanical training toolbox through the use of advanced interactive, multimodal simulation technology.
VBLaST simulates a task that involves sutures. (RPI)

7
VBLaST simulates loop ligation. (RPI)
VBLaST simulates bimanual peg transfer. (RPI)
VBLaST simulates the pattern-cutting task. (RPI)
VBLaST replaces the test materials of the mechanical toolbox with virtually simulated objects. Trainees perform the FLS program tasks with actual laparoscopic instruments, which connect to haptic devices. The hardware interface of VBLaST tracks the motions of the instruments, and physics-based algorithms accurately simulate the interaction between the virtual instruments and the objects in the scene in real time. As this interaction occurs, VBLaST displays realistic visuals and provides appropriate haptic feedback. VBLaST also logs real-time performance data such as instrument motion, path length, and total time.
The VBLaST prototype facilitates the development of a train-ing and certification platform, and it serves to validate the virtual FLS concept. For the NIH project, Kitware and collabo-rators are working to extend and improve this prototype so that they can deploy it in teaching hospitals and testing centers in clinical settings. The goals of the project are to incorporate two new tasks into VBLaST (camera navigation and cannulation), to build a robust haptic interface, and to improve the overall quality of the VBLaST software.
EMPLOYING A SIMULATOR FOR CAMERANAVIGATIONThe team has already worked to develop a camera- navigation simulator in VBLaST. The camera-navigation simulator trains residents to master the use of laparoscopic cameras in operating rooms to improve their spatial aware-ness and positional accuracy. As the below image illustrates, the simulator arranges targets in a circle and overlays a marker pattern on the camera lens. Trainees must match the pattern with each target. Trainees can manipulate the position and orientation of the camera through movement, rotation, and articulation.
The camera navigation simulator in VBLaST presents
trainees with six targets.
For the camera-navigation task, a trainee aligns a marker with the red target.

8
VBLaST incorporates camera scopes with angles of either zero, 30, or 45 degrees. The camera scope in this image has
an angle of 30 degrees.
The development team chose the Visualization Toolkit (VTK) as the rendering engine for the simulator. The team also developed an automated scoring mechanism. The mecha-nism bases scores on the accuracy of the positional and angular alignment of the marker.
DESIGNING A NEW HARDWARE INTERFACEThe team also designed a new interface with haptic devices to improve the experimental hardware in VBLaST. SimQuest led the design of this hardware interface. To create the new interface, SimQuest added linkages and attachments to commercially available Novint Falcon haptic devices, which have update rates of up to 2,500 hertz. The additions helped to improve the workspace of VBLaST and facilitate the use of laparoscopic tool handles. The additions also helped to extend the force capability of VBLaST to a range of 3.4 newtons to 12 newtons.
The new-and-improved interface allows for seven degrees of freedom: three in movement, three in rotation, and one in the open-close movement of the laparoscopic tools. The team has integrated this interface with the peg-transfer task and will test it at the University of Buffalo.
The new haptic device for VBLaST provides trainees with a more realistic environment.
BUILDING A HIGH-QUALITY SOFTWAREINFRASTRUCTUREGraduate students at RPI helped to develop the original VBLaST software. To prepare the software for commercial use at clinical facilities, the Kitware team improved the software process, streamlined the build process, adopted resource management tools, and incorporated best practices into VBLaST software development. As part of the effort, the team rolled out revision control systems and adopted a high-quality software development workflow. This workflow includes a stringent testing suite; a continuous integration system that employs CMake, CTest, and CDash; a Web-based code review system; and a protocol to accept patches into the main code repository. The team established this software infrastructure to facilitate remote collaboration between members.
ENHANCING VBLASTThe project is off to a great start, and the team has several tasks planned for the second year. The following offers a high-level summary of upcoming tasks.
Continuing to Develop Virtual Simulation EnvironmentsThe team will obtain feedback from clinical collaborators on the camera-navigation simulator. The team will then finalize the development of the simulator and prepare it for statisti-cal validation. During the first half of the second year, the team will also develop capabilities for a cannulation task.
Creating an Automated Scoring SystemThe team will develop a novel automated system to score trainees based on the simulation data that VBLaST records. Such data includes various metrics that are common to the FLS tasks like path length, jerk analysis, and total time. For the knot-tying tasks, the team will develop algorithms to precisely measure the tightness and placement of the knots. The algorithms will use force measurements to determine the circumferences of the knots and compare the knots with pre-defined thresholds.
The team will develop additional metrics for camera naviga-tion that measure hand steadiness and spatial awareness. The VBLaST software will use the recorded metrics to arrive at the final scores, and it will not require any manual intervention.
Improving the Haptics Hardware DesignCurrently, the haptics hardware can render forces in addi-tion to torques about three Cartesian axes. The team will test this hardware to see if it can meet the needs of VBLaST in terms of haptic fidelity. The team will also ensure that the hardware is production-ready with regard to ease of use, robustness, manufacturability, and cost.
Conducting Extensive Validation StudiesThe team has already started to collect feedback and to evaluate the face, content, and construct validity of VBLaST.

9
To further evaluate VBLaST, members of the department of surgery at the University of Buffalo will conduct a study under the supervision of Dr. Steven Schwaitzberg. Dr. Schwaitzberg is a professor in and the chairman of the department. The study will measure the effectiveness of VBLaST to train and assess surgical residents, as they perform virtual laparoscopic surgery.
Dr. Schwaitzberg evaluates the simulator at Buffalo General Medical Center.
A member of Buffalo General Medical Center tests VBLaST.
SUMMARYThe project focuses on the development of a virtual FLS platform to accelerate laparoscopic surgical education and evaluation. The work offers just one example of how Kitware partners with top research universities and technology com-panies to build powerful platforms for surgical training and certification through the use of open-source solutions.
To learn more about medical computing expertise at Kitware, please go to http://www.kitware.com/solutions/medical imaging/medicalimaging.html. To find out how Kitware can tailor its solutions to meet research and educational needs, please contact [email protected].
ACKNOWLEDGEMENTThe authors would like to acknowledge the following members of the project: Suvranu De, Woojin Ahn, Trudi Qi, and Karthik Panneerselvam from RPI; Ryan Beasley and Tim Kelliher from SimQuest; and Steven Schwaitzberg, Lora Cavuoto, and Nargis Hossian from the University of Buffalo.
Research reported in this publication was supported by the National Institute Of Biomedical Imaging And Bioengineering of the National Institutes of Health under Award Number R44EB019802. The content is solely the responsibility of the authors and does not necessarily represent the official views of the National Institutes of Health.
REFERENCES[1] Arikatla, Venkata Sreekanth, Ganesh Sankaranarayanan,
Woojin Ahn, Amine Chellali, Caroline G. L. Cao, and Suvranu De. “Development and Validation of VBLaST-PT© : A Virtual Peg Transfer Simulator.” Studies in Health Technology and Informatics 184 (2013): 24-30.
[2] Lee, Jason, Woojin Ahn, and Suvranu De. “Development of Extracorporeal Suturing Simulation in Virtual Basic Laparoscopic Skill Trainer (VBLaST),” Studies in Health Technology and Informatics 196 (2014) 245-247.
[3] Chellali, Amine, Woojin Ahn, Ganesh Sankaranarayanan, Jeff Flinn, Steven D. Schwaitzberg, Daniel B. Jones, Suvranu De, and Caroline G. L. Cao. “Preliminary Evaluation of the Pattern Cutting and the Ligating Loop Virtual Laparoscopic Trainers.” Surgical Endoscopy 29 (2015) 815-821.
Andinet Enquobahrie is an assistant director of medical computing at Kitware. As a subject matter expert, he is responsible for the technical contribution and management of projects that involve image-guided inter-vention and surgical simulation.
Sreekanth Arikatla is a senior research and development engineer at Kitware. His inter-ests include numerical methods, computational mechanics, computer graph-ics, and virtual surgery.
Correction: SALOME: An Open-source Simulation Platform Integrating ParaViewIn an April 2016 article on SALOME, the "Kitware Source" named Yannick Fournier as an author of "In-Situ visualiza-tion in fluid mechanics using Catalyst: a case study for Code Saturne” and a member of a team that performed a study on the use of in situ visualization techniques. The correct name is Yvan Fournier, not Yannick Fournier.

10
RAY-TRACED RENDERING REVISITED
David DeMarle, Ken Martin (Kitware), Carson Brownlee, Jefferson Amstutz (Intel)
For years, applications that employ the Visualization Toolkit (VTK) have used OpenGL almost exclusively to draw scenes. OpenGL rasterizes polygons onto pixels. Rasterization serves as the most commonly used rendering algorithm today. Alternatives to rasterization exist, and these alternatives have their own merits. Such alternatives include ray tracing. Ray tracing offers built-in effects, such as translucency and reflectance, as well as performance that scales logarithmi-cally with geometric complexity. Intel® and Kitware have recently completed a project that tightly integrates ray tracing with VTK. The result, which will first appear in VTK 7.1 and already appears in ParaView 5.1, adds the Intel® OSPRay ray-tracing engine to VTK.
BACKGROUNDOne reason why rasterization is prevalent in the field of scientific visualization is that, until recently, ray tracing per-formed too slowly to interactively explore data that changes frequently. To render data, ray tracers first spatially sort it through an O(n) operation. OSPRay, which has highly opti-mized the sort, can process over a hundred million polygons per second. Once ray tracers sort the data, they employ a faster O(log N) search operation in which the frame rate is largely independent of the scene size. This search opera-tion optimizes interactive rendering performance on central processing units (CPUs) and scales up to the limits of system memory.
For the ray-tracing engine in VTK, the development team chose the OSPRay ray tracer. OSPRay is an open-source, scalable, and portable ray-tracing engine that produces high-performance, high-fidelity visualizations on Intel® CPUs. OSPRay provides a powerful, fast, and easy-to-use rendering library. The library runs well on everything from laptops, to workstations, to distributed compute nodes in high-performance computing (HPC) systems. In addition, OSPRay enables applications that combine interactive surface- and volume-based visualizations.
OSPRay takes advantage of the inherent parallelism found in ray tracing. It maps data onto single instruction, multiple data (SIMD) vector units through the process of vectoriza-tion and onto multiple compute cores through the process of multithreading. To vectorize shading operations, OSPRay employs the Intel® Single program, multiple data Program Compiler (ISPC). ISPC abstracts away specific vector sizes from various instruction sets such as Streaming SIMD Extensions (SSE), Advanced Vector Extensions (AVX), and AVX-512. To perform multithreading, OSPRay takes advan-
tage of Threading Building Blocks (TBB) from Intel®. TBB is a highly optimized library that implements a sophisticated task-stealing system to balance rendering workloads across all available cores. Together, ISPC and TBB allow OSPRay to use all of the available compute power found in Intel® CPU hardware. This compute power optimizes rendering performance.
An image of a synthetic data set demonstrates ambient occlusion.
OSPRay rendered the data set and scaled the implicit cylinders
within ParaView.
Recently, the Texas Advanced Computing Center (TACC) connected VTK to OSPRay within the pvOSPRay ParaView plug-in. Like the pvManta ParaView plug-in, the core of pvOSPRay consists of a set of concrete VTK rendering sub-classes. These subclasses use a new underlying rendering application programming interface (API).
The pvOSPRay plug-in is somewhat similar to the OpenGL 2 backend, with which users can compile VTK to get a new a set of updated OpenGL interface classes. Unlike in OpenGL 2, in pvOSPRay, the class names are distinct from their OpenGL 1 counterparts. As a result, applications can simultaneously use OpenGL classes and ray-tracing classes. Nevertheless, to use pvOSPRay, the application code must be changed. In addition, pvOSPRay does not permit two sets of rendering subclasses to share a rendering state.
To address these issues and to better realize the capabilities of OSPRay within ParaView and other VTK-enabled appli-cations, Intel® and Kitware more tightly integrated the core of the pvOSPRay plug-in with VTK. To make it easier for application writers to use OSPRay, VTK delivers the new code in an optional module instead of in an external reposi-tory. Regression tests evaluate the module with the rest of the toolkit.

11
VTK renders with OpenGL (left) and OSPRay (right).
Now, instead of having a set of subclasses, VTK auto-matically instantiates the right helper classes. The vtkRenderPass class is responsible for the instantiations. This encapsulation makes it trivial to use OSPRay in appli-cations, and it allows applications to swap back and forth between ray-tracing and rasterizing images at runtime.
GUIDE TO OSPRAY IN VTKThe Rendering/OSPRay sub-directory or "Module" of the master branch of VTK houses the source code for the new OSPRay interface. The first step to make use of the interface is to activate the vtkRenderingOSPRay module in CMake. Note that VTK requires OSPRay version 0.10.0 or newer. This requirement implies the utilization of C++11 settings to compile the toolkit. Once VTK compiles, OSPRay-related regression tests can run in the toolkit. Rendering/OSPRay/Testing houses the source code for these tests. The following code demonstrates how VTK implements ray tracing:
#include "vtkOSPRayPass.h"
...
vtkOSPRayPass* osprayPass = vtkOSPRayPass::New();
...
if (useOSPRay)
{
renderer->SetPass(osprayPass);
}
else
{
renderer->SetPass(NULL);
}
The interface in VTK remains the same regardless of whether the toolkit uses the legacy OpenGL rendering backend or
the new OpenGL 2 backend. VTK can quickly swap between rasterizing and rendering images. VTK takes less than two-hundredths of a second to draw the dragon model from Stanford University on a laptop, and it takes less than four- hundredths of a second to draw the Lucy model from Stanford University on a laptop.
For complex scenes with hundreds of millions of primitives, it may take a few seconds for OSPRay to create its acceleration structures on the first swap. Subsequent swaps, however, take very little time, as osprayPass maintains an internal scene-graph representation in-between swaps. In addition, on every render, VTK reuses the unchanged parts of the rep-resentation from the previous frame.
By default, the appearance of the scene with OSPRay looks very similar to the appearance of the scene with OpenGL. As TestOSPRayRenderMesh demonstrates, the new backend preserves standard VTK rendering options as much as pos-sible. These options include surface, wire-frame, and points representations; colors; color mapping; and lighting, texture, and geometric transformations. Nevertheless, ray-traced images will be distinct from rasterized images.
As with the pvManta plug-in, OSPRay draws lines and points as cylinders and spheres. The use of a world-space sizing heuristic that is one-thousandth of the diagonal of an object produces images that are close to what the use of vtkProperty::LineWidth and PixelSize default settings for OpenGL produce. The selection of different rendering options can further adjust the sizes. OSPRay can scale all points and lines to constant sizes. OSPRay can also now scale spheres and cylinders according to point-aligned scalar quantities. A transfer function can optionally map scalar values. The following code applies a ray-tracing point-scaling function:

12
mapperInfo = mapper->GetInformation();
mapperInfo->Set(
vtkOSPRayActorNode::ENABLE_SCALING(), 1);
mapperInfo->Set(
vtkOSPRayActorNode::SCALE_ARRAY_NAME(),
"name of a scalar array");
vtkPiecewiseFunction *scaleFunction =
vtkPiecewiseFunction::New();
scaleFunction->AddPoint(0.0, 0.0);
scaleFunction->AddPoint(0.1, 2.0);
...
mapperInfo->Set(
vtkOSPRayActorNode::SCALE_FUNCTION(),
scaleFunction);
Interaction is particularly fast with a single sample and without advanced rendering effects. The use of advanced settings improve the image quality but slow render times. Advanced settings include the number of anti-aliasing samples per pixel, the number of ambient-occlusion shading samples, and the number of alpha-blending render stages. The below code provides an example:
rendererInfo = renderer->GetInformation();
if (realTimeRender)
{
rendererInfo->Set(
vtkOSPRayRendererNode::SAMPLES_PER_PIXEL(), 1);
rendererInfo->Set(
vtkOSPRayRendererNode::AMBIENT_SAMPLES(), 0);
rendererInfo->Set(
vtkOSPRayRendererNode::MAX_FRAMES(), 1);
}
else
{
rendererInfo->Set(
vtkOSPRayRendererNode::SAMPLES_PER_PIXEL(), 4);
rendererInfo->Set(
vtkOSPRayRendererNode::AMBIENT_SAMPLES(), 4);
rendererInfo->Set(
vtkOSPRayRendererNode::MAX_FRAMES(), 2);
}
In OSPRay, the use of space-sorting acceleration structures eliminates unnecessary intersection tests. Above a certain ratio of scene primitives to image resolution, the frame rate for camera motion will exceed the frame rate for OpenGL rasterization. That is to say, the frame rate of the ray tracer depends on the number of pixels in a scene. The frame rate of the rasterizer, however, depends on the number of primi-tives in the scene. Therefore, above a certain number of polygons, the ray tracer will render images faster.
renderer GL2
35
1.28
15.2
3.52
34.2
1.90
14.6
4.09
34.16
3.70
7.81
18.1
17.4
37.8
15.1
147
21.0
13.9
8.80
53.5
13.3
13.1
17.4
32.7
18.8
100 100200
3570
GL2 GL2OSPRay OSPRay OSPRay
Image SIze 1280x720 1920x1080
# polygons (millions)
Quadro K5200
12 Core 2.4Ghz i7
12 Core 2.4Ghz i7
12 Core 2.4Ghz i7
Quadro K5200
Quadro K5200
GeForce GE 650M
GeForce GE 650M
GeForce GE 650M
4 core 2.7Ghz i7
4 core 2.7Ghz i7
4 core 2.7Ghz i7
# polygons (millions)
hardware
hardware
Frame 0 (sec)
Frame 0 (sec)
Frame n+1 (fps)
Frame n+1 (fps)
Results from the manyspheres.py benchmark in ParaView on two machines compare frame times for OpenGL and OSPRay, as screen resolution and data resolution double.
Aesthetics are important too, especially for showcase-type images and movies. OSPRay can support ambient occlusion lighting queries to effectively convey the meso-scale struc-ture of complex objects. With ambient occlusion, features like internal cavities stand out much more clearly. These features appear darker than outward-facing regions, which acquire more light.
The VTK development team is working to bring photo-realistic rendering capabilities to VTK. To accomplish this, the team is exposing the path-tracing option in OSPRay and adding controls to define the shape, color, and placement of advanced light sources.
IMPLEMENTATIONOverall, VTK now offers a more complete separation of rendering state and rendering implementation than of Rendering/Core classes and Rendering/OpenGL* classes. The separation makes it possible to swap in different render-ing backends at runtime at minimal cost.
A new vtkRenderPass class manages the process of swapping backends. During the process, render passes take over responsibility for or augment the standard rendering pipeline of VTK. The standard pipeline asks rendering classes in the Rendering/SceneGraph module (e.g., vtkRenderer, vtkCamera, vtkLight, vtkActor, vtkVolume, and vtkMapper) to traverse the connected hierarchy, while they make OpenGL calls that cor-respond to the internal rendering state. The Rendering/SceneGraph module provides a new standard for examining the rendering state in VTK and executing arbitrary opera-tions on it. At the moment, the module contains operations that construct the scene graph, update the scene graph to reflect the core rendering state, and make calls to draw the scene graph, respectively. The module hands off the details of the operations to subclasses such as the Rendering/OSPRay subclasses.

13
CONCLUSIONThe new OSPRay-VTK interface streamlines the steps it takes to obtain ray-traced imagery from VTK. Especially for point sprite visualizations, OSPRay brings a new level of visual fidelity to VTK. The new fast, scalable, software-based rendering engine in VTK is important for many HPC-class machines as well.
The development team is actively working to bring the volume-rendering capability of OSPRay to the new Rendering/SceneGraph module. As mentioned above, the team is also working to expose the high-fidelity path-tracing option in OSPRay within the new VTK framework.
OSPRay has opened up many doors. It allows VTK to implic-itly draw spheres and cylinders. In the future, it will also enable VTK to directly render isosurfaces and constructive solid geometry data, which will reduce the need for inter-mediary mesh representations. Finally, the ability to make very fast ray queries within VTK has great potential to aid data-processing filters that do not have close relations to rendering.
ACKNOWLEDGEMENTThis work is part of the Intel® Software Defined Visualization initiative. Learn more at http://www.sdvis.org.
David DeMarle is a staff research and devel-opment engineer at Kitware, where he contributes to both ParaView and VTK. He teaches professional development and train-ing courses for these product applications.
Ken Martin is chairman and chief financial officer of Kitware. He is a developer of VTK and a coauthor of the textbook "The Visualization Toolkit: An Object Oriented Approach to Computer Graphics."
Carson Brownlee is a member of the research and engineering group that develops the OSPRay ray-tracing framework at Intel®. He focuses on large-scale interactive ray tracing. He has worked on various ray-tracing implementations in major scientific visual-
ization packages.
Jefferson Amstutz is a part of the Software Defined Visualization team at Intel®. He mainly contributes to the OSPRay project. His research interests focus on multi-hit ray-traversal algorithms and applications. He also enjoys the lifelong journey of learning
to express code that is suitable for human consumption.
A prototype of a new version of ParaView generates a path-traced OSPRay rendering of a data set, which pertains to
magnetic reconnection.

14
INTRODUCING SLICERASTRO: A VISUALIZATION TOOL FOR HYDROGEN IN GALAXIESDavide Punzo, Thijs van der Hulst (Kapteyn Astronomical Institute), Jos B.T.M. Roerdink (Johann Bernoulli Institute of Mathematics and Computer Science), Jean-Christophe Fillion-Robin (Kitware)
Upcoming neutral hydrogen (HI) surveys will deliver large data sets, in which daily data-flow will reach one terabyte. One of these surveys, Apertif [1], will provide informa-tion about HI in and around hundreds of thousands of galaxies. To find and charac-terize HI objects, automated processing methods must
use all of the three-dimensional (3D) information (two positional dimensions and one spectral dimension) that the surveys make available. Three-dimensional visualization is essential to the qualitative and quantitative human inspec-tion of results from automated source-finding and analysis pipelines [2].
SlicerAstro [3,4] is an extension of 3D Slicer [5] that aims to provide astronomers with a powerful and interactive visual-ization environment. In this environment, astronomers can analyze complex sources that automated pipelines such as SoFiA [6] find. These sources include interacting galaxies, tidal tails, HI filaments, and stripped galaxies.
An exhaustive review of open-source 3D visualization packages [2] led to the choice of 3D Slicer as the preferred platform for the development of SlicerAstro. The factors behind this choice include the following:
• 3D Slicer is an open-source platform with a Berkeley Software Distribution (BSD) license, which allows for free utilization of the software.
• The software has a flexible environment for code
development and collaboration.
• 3D Slicer has adequate documentation for both
developers and users.
• The 3D Slicer software has a number of active developers.
• The 3D Slicer interface already implements numerous quantitative features.
In addition, the medical visualization tools that 3D Slicer implements suit the needs of astronomical applications. For example, 3D Slicer optimizes the display layout and the process of navigating through data for parallel two-dimen-sional visualizations (e.g., movies of channel maps).
THREE-DIMENSIONAL INSPECTION OF HI IN GALAXIESThe following example uses an observation of the WEIN069 galaxy in the Perseus-Pisces supercluster filament. The example shows in detail the character of a radio emission of HI in and around the galaxy. The example also illustrates the benefits of 3D data visualization.
In the following image, a 3D view displays the HI distribu-tion and the kinematics of WEIN069. The view provides an immediate summary of the structures in the data that pertain to space and velocity. The view confirms that the structures are coherent in all three dimensions. Two spatial dimensions (right ascension, α, and declination, δ) measure the projection of HI onto the sky. The radial velocity dimen-sion measures the velocity of HI along the line of sight.
Well-resolved optical and HI emissions come from a face-on galaxy.
SlicerAstro displays a module that introduces the software.

15
SlicerAstro generates a volume rendering of a galaxy in the
Perseus-Pisces supercluster filament. The different colors highlight
various intensity levels in the data. Grey, green, blue, and red
correspond to three, eight, 15, and 20 times the root mean square
noise, respectively. A video of the volume rendering is available at
https://youtu.be/yLjW9nbdO8g.
In this case, two main components are visible. The first com-ponent is a central body. This body illustrates the regularly rotating disk of the galaxy. Three-dimensional warping results from the projected rotation of the disk. The second component is a tail of unsettled gas that results from tidal interaction with another galaxy. The tail relates to the rotat-ing disk in terms of space and velocity.
The 3D structure of the HI data is difficult to interpret for several reasons. The third axis of the data cube measures frequency. It is possible to convert frequency into velocity with the Doppler formula. The following image shows a galaxy with velocity components 1, 2, and 3 along the line of sight. The projection of the velocities along the line of sight and the corresponding Doppler shifts account for the observation of these components at different frequencies. For a given projection on the sky of a galaxy, geometric properties determine the precise projection of the velocity components, which dictate the kinematic information of the observation. Such properties include the inclination and the position angle of the semi-major axis as well as the distri-bution of gas along the line of sight. The projection of the velocity components of a rotating system then determines the 3D shape that SlicerAstro visualizes.
While SlicerAstro facilitates the analysis of typical HI data sets, astronomers still require training to interpret the 3D struc-ture of the data and to get acquainted with the SlicerAstro tool itself. During this training process, interactivity is a key factor because it allows flexible viewing of the data.
A schematic image shows a rotating galaxy. In the bottom-left
corner, the image displays the profile of a schematic line along the
line of sight.
CURRENT STATUS OF SLICERASTROSlicerAstro is an open-source project that is currently avail-able in the extensions manager of 3D Slicer. Although SlicerAstro is still under development, it already offers several stable features for the qualitative visualization and inspection of HI in galaxies. For example, SlicerAstro can import and save astronomical data in the Flexible Image Transport System (FITS) format [7]. SlicerAstro loads such data as AstroVolume data structures. These structures store 3D astronomical images, FITS headers, and information from the astronomical world coordinate system (WCS) [8,9].
SlicerAstro loads a FITS file.
SlicerAstro also displays quantitative information such as coordinate values and axes for two-dimensional views using the WCS.
SlicerAstro illustrates the astronomical WCS.
In addition, SlicerAstro optimizes interactive smoothing for HI data [10] that runs on multi-core CPUs, OpenMPs, graphi-cal processing units, and OpenGL.
16
SlicerAstro implements a module for smoothing data.
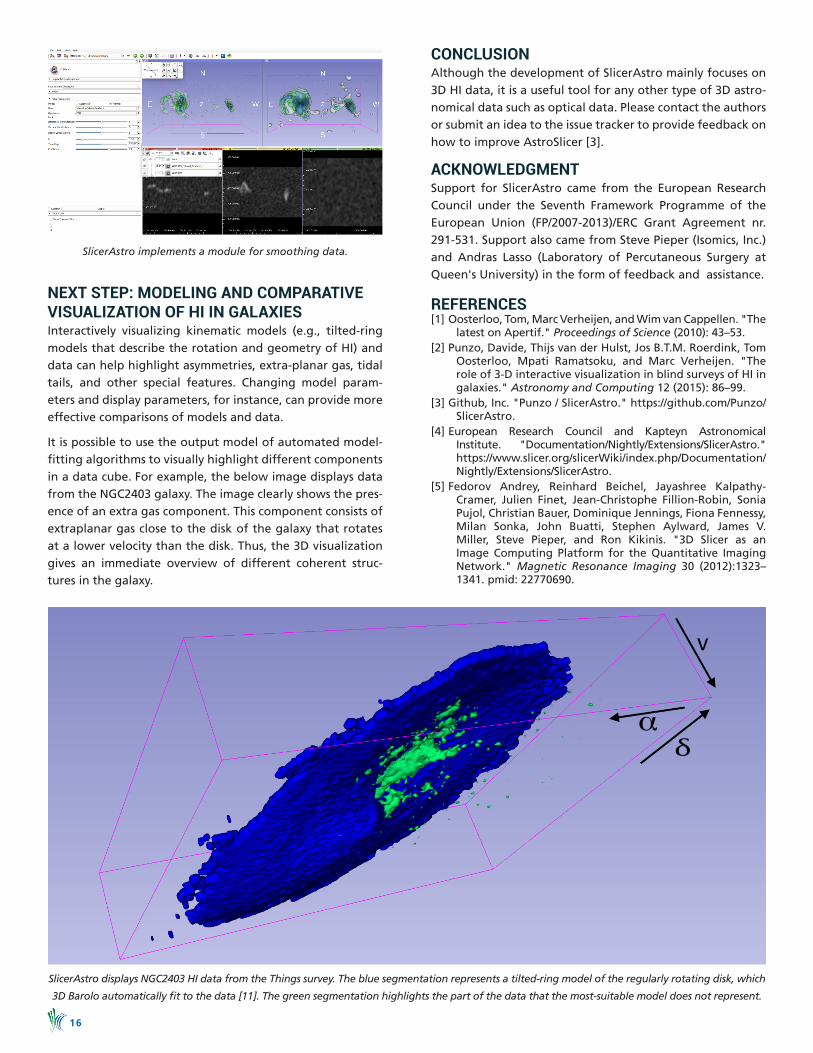
NEXT STEP: MODELING AND COMPARATIVE VISUALIZATION OF HI IN GALAXIESInteractively visualizing kinematic models (e.g., tilted-ring models that describe the rotation and geometry of HI) and data can help highlight asymmetries, extra-planar gas, tidal tails, and other special features. Changing model param-eters and display parameters, for instance, can provide more effective comparisons of models and data.
It is possible to use the output model of automated model-fitting algorithms to visually highlight different components in a data cube. For example, the below image displays data from the NGC2403 galaxy. The image clearly shows the pres-ence of an extra gas component. This component consists of extraplanar gas close to the disk of the galaxy that rotates at a lower velocity than the disk. Thus, the 3D visualization gives an immediate overview of different coherent struc-tures in the galaxy.
CONCLUSIONAlthough the development of SlicerAstro mainly focuses on 3D HI data, it is a useful tool for any other type of 3D astro-nomical data such as optical data. Please contact the authors or submit an idea to the issue tracker to provide feedback on how to improve AstroSlicer [3].
ACKNOWLEDGMENTSupport for SlicerAstro came from the European Research Council under the Seventh Framework Programme of the European Union (FP/2007-2013)/ERC Grant Agreement nr. 291-531. Support also came from Steve Pieper (Isomics, Inc.) and Andras Lasso (Laboratory of Percutaneous Surgery at Queen's University) in the form of feedback and assistance.
REFERENCES[1] Oosterloo, Tom, Marc Verheijen, and Wim van Cappellen. "The
latest on Apertif." Proceedings of Science (2010): 43–53.[2] Punzo, Davide, Thijs van der Hulst, Jos B.T.M. Roerdink, Tom
Oosterloo, Mpati Ramatsoku, and Marc Verheijen. "The role of 3-D interactive visualization in blind surveys of HI in galaxies." Astronomy and Computing 12 (2015): 86–99.
[3] Github, Inc. "Punzo / SlicerAstro." https://github.com/Punzo/SlicerAstro.
[4] European Research Council and Kapteyn Astronomical Institute. "Documentation/Nightly/Extensions/SlicerAstro." https://www.slicer.org/slicerWiki/index.php/Documentation/Nightly/Extensions/SlicerAstro.
[5] Fedorov Andrey, Reinhard Beichel, Jayashree Kalpathy-Cramer, Julien Finet, Jean-Christophe Fillion-Robin, Sonia Pujol, Christian Bauer, Dominique Jennings, Fiona Fennessy, Milan Sonka, John Buatti, Stephen Aylward, James V. Miller, Steve Pieper, and Ron Kikinis. "3D Slicer as an Image Computing Platform for the Quantitative Imaging Network." Magnetic Resonance Imaging 30 (2012):1323–1341. pmid: 22770690.
SlicerAstro displays NGC2403 HI data from the Things survey. The blue segmentation represents a tilted-ring model of the regularly rotating disk, which
3D Barolo automatically fit to the data [11]. The green segmentation highlights the part of the data that the most-suitable model does not represent.

17
[6] Serra, Paolo, Tobias Westmeier, Nadine Giese, Russell Jurek, Lars Flöer, Attila Popping, Benjamin Winkel, Thijs van der Hulst, Martin Meyer, Bärbel S. Koribalski, Lister Staveley- Smith, and Hélène Courtois. "SOFIA: a flexible source finder for 3D spectral line data." Monthly Notices of the Royal Astronomical Society 448 (2015): 1922–1929.
[7] Pence, William D., Lucio Chiappetti, Clive G. Page, Richard Allen Shaw, and Elizabeth Stobie. "Definition of the Flexible Image Transport System (FITS), version 3.0." Astronomy and Astrophysics 524 (2010): A42.
[8] Calabretta, Mark Raymond, and E. W. Greisen. "Representations of celestial coordinates in FITS." Astronomy and Astrophysics 395 (2002): 1077–1122.[9] Greisen, E.W., Mark Raymond Calabretta, Francisco Gabriel Valdes, and Stephen L. Allen. "Representations of spectral coordinates in FITS." Astronomy and Astrophysics 446 (2006): 747–771. [10] Punzo, Davide, Thijs van der Hulst, and Jos B. T. M. Roerdink."Finding faint HI structure in and around galaxies: scraping the barrel." Paper submitted to Astronomy and Computing, 2016.[11] Di Teodoro, Enrico, and Filippo Fraternali. "3D BAROLO: a new 3D algorithm to derive rotation curves of galaxies." Monthly Notices of the Royal Astronomical Society 451 (2015): 3021–3033.
Davide Punzo is a doctoral student at the Kapteyn Astronomical Institute of the University of Groningen. His research inter-ests not only include the domains of technology, computational sciences, and visualization, but they include the applica-
tions of these domains in astronomy.
Thijs van der Hulst is a professor in radio astronomy at the Kapteyn Astronomical Institute of the University of Groningen. His expertise is in the structure and evolution of galaxies, with special focus on the relation of the interstellar gas component to star
formation and the buildup of stellar mass in galaxies.
Jos B.T.M. Roerdink received a Doctor of Philosophy in Theoretical Physics from Utrecht University in 1983. He currently is a professor and the director at the Johann Bernoulli Institute for Mathematics and Computer Science of the University of
Groningen. There, he holds a chair in scientific visualization and computer graphics.
Jean-Christophe Fillion-Robin is a technical expert and the lead developer of 3D Slicer at Kitware. He is also the lead developer of 3D Slicer for the National Alliance for Medical Image Computing (NA-MIC) community. As such, he developed the infrastructure for 3D
Slicer extensions and worked on the port of 3D Slicer to Qt. He also co-created the open-source Common Toolkit (CTK).
KITWARE NEWS
CONFERENCE SEEKS PROPOSALSIn a post on the Kitware blog, Stephen Aylward, the senior director of operations – North Carolina at Kitware and an International Symposium on Biomedical Imaging (ISBI) grand challenges chair, advocated for teams to submit proposals for grand challenges for ISBI. The grand challenges aim to advance the field of medical image analysis. Kitware has helped to coordinate the solicitation and the execution of proposals for several years. Aylward noted that the chairs will accept proposal submissions until September 15, 2016.
Among other areas of interest, proposals can address the pursuit of new ideas for challenges, the repetition of previous challenges, or the contribution of data. For more information on the proposal-submission process, please read “ISBI 2017: Call for Challenge Proposals” at https://blog.kitware.com/isbi-2017-call-for-challenge-proposals.
KITWARE RUNNERS FINISH IN TOP 10On May 19, 2016, members of Kitware participated in the CDPHP® Workforce Team Challenge. The challenge con-sisted of a 3.5-mile course. Over 8,000 people gathered in the Governor Nelson A. Rockefeller Empire State Plaza in Albany, New York, for the event.
For the challenge, Jake Stookey, Matt Turek, Bill Hoffman, and Jacob Becker once again represented Kitware in the "Male Team" category. With a time of 1:28:55, they improved their placement from last year and came in 10th. Over 550 teams registered in the category.
Members of Kitware congregate by the Erastus Corning Tower as
they wait for the start of the challenge.

18
PROJECT AIMS TO MAKE BIG STRIDES IN DATA MANAGEMENTKitware announced plans to kick off development on a Phase II Department of Energy (DOE) Small Business Innovation Research project to simplify Big Data management. For the project, Kitware looks to extend GoBig, its open-source soft-ware system that provides Big Data analysts with access to a range of computing resources through a unified interface.
“The computational power of the current technological landscape is unprecedented, and Big Data is more complex than ever,” Jeff Baumes, an assistant director of scien-tific computing at Kitware, said. “GoBig offers analysts in academic, governmental, and commercial settings with a flexible and extensible solution for managing Big Data.”
GoBig enables analysts to employ today’s most advanced tools and libraries, yet it does not require that analysts learn several programming languages. The modular design of the system streamlines installation and significantly reduces the costs that come with maintaining multiple computing envi-ronments.
“GoBig is a self-contained system, so it is easy to set up and configure,” Baumes said. “In addition, as GoBig is open source, it does not impose licensing fees.”
GoBig leverages high-performance computing (HPC) and high-throughput computing (HTC) resources, and it builds on components of the Resonant environment. These compo-nents include Girder, which provides GoBig with accesses to data from multiple storage systems, and Romanesco, which allows GoBig to manage workflows with different program-ming languages and computing engines.
“With GoBig, analysts no longer need to stick to just one type of data across their respective workflows,” Baumes said. “They are free to harness the power of multiple systems regardless of whether or not these systems share a common technology stack.”
During Phase I, the development team at Kitware created the GoBig code repository, which is available on GitHub. The team also tested the GoBig system on use cases in climate analysis and business intelligence. These tests demonstrated the successful execution of GoBig as an end-to-end system.
For Phase II, the team will equip GoBig to deploy on the Web. The team will also integrate new technologies with GoBig such as ParaViewWeb, which can run parallel visualization jobs. This integration will widen the scope of GoBig to fields such as simulation and modeling.
“The performance of GoBig is encouraging,” Baumes said. “We found that a major advantage of the system is that it uses both HPC and HTC resources, as some scenarios may favor one type of resource over the other.”
In developing GoBig through open practices, Kitware is furthering its commitment to promote collaboration and scientific discovery. Since 1998, Kitware has created and supported open-source solutions including CMake, the Visualization Toolkit (VTK), ParaView, and the Insight Segmentation and Registration Toolkit (ITK).
This material is based upon work supported by the U.S. Department of Energy, Office of Science, Office of Acquisition & Assistance, under Award Number DE-SC0013252. This report was prepared as an account of work sponsored by an agency of the United States Government. Neither the
The workflow interface in GoBig combines tasks for different computing architectures. In this case, GoBig writes a word-count frequency in Scala with Spark, and it writes a bar plot in R.
threshold
column Bar plot image
label
Scala word count

19
United States Government nor any agency thereof, nor any of their employees, makes any warranty, express or implied, or assumes any legal liability or responsibility for the accuracy, completeness, or usefulness of any information, apparatus, product, or process disclosed, or represents that its use would not infringe privately owned rights. Reference herein to any specific commercial product, process, or service by trade name, trademark, manufacturer, or otherwise does not necessarily constitute or imply its endorsement, recom-mendation, or favoring by the United States Government or any agency thereof. The views and opinions of authors expressed herein do not necessarily state or reflect those of the United States Government or any agency thereof.
COLLABORATOR PRESENTS JOINT WORK ONIN SITU METHODSE. Wes Bethel from Lawrence Berkeley National Laboratory presented a paper at EuroVis 2016 that Andrew Bauer, Berk Geveci, and Patrick O’Leary from Kitware co-wrote. The paper details how in situ methods can aid in extreme-scale high-performance computing.
Bethel discussed the paper in the session on distributed visualization on June 8, 2016. To familiarize EuroVis attend-ees with the paper, Kitware published the abstract to the work at https://blog.kitware.com/paper-on-in-situ-methods-accepted-for-publication.
This work was supported by the Director, Office of Science, Office of Advanced Scientific Computing Research, of the U.S. Department of Energy under Contract No. DE-SC0012387, through the grant “Scalable Analysis Methods and In Situ Infrastructure for Extreme Scale Knowledge Discovery,” program manager Dr. Lucy Nowell.
KITWARE RANKS ON INTERNSHIPS LISTThe “Albany Business Review” published “The List: Internships,” which includes Kitware. The list organizes companies by the number of interns they welcomed in 2015. Kitware tied for 17th on the 2016 list with Daily Gazette Co. Inc. With plans to continue to recruit throughout 2016, Kitware looks to add more interns to work alongside experts and gain hands-on experience. Interns help perform founda-tional research and develop technology across five solution areas: high-performance computing and visualization, com-puter vision, medical computing, data and analytics, and quality software process.
To apply to intern at Kitware, please submit a resume and a cover letter through the online portal on the Kitware employment website at http://jobs.kitware.com.
MEDICAL IMAGING CONFERENCE COMMITTEE REVEALS PLANS FOR 2017The planning committee for the 25th Information Processing in Medical Imaging (IPMI) conference recently released details on the event. Stephen Aylward, the senior director of operations – North Carolina at Kitware, is a chair on the
committee. On the Kitware blog, he addressed plans for the event as well as deadlines for registering and submitting papers.
Appalachian State University in Boone, North Carolina, will host the conference, which will begin on June 25, 2017. Topics of discussion will include research in data visualiza-tion, image-guided surgery, and computational physiology. Following the conclusion of the conference, "Information Processing in Medical Imaging" will feature work from paper and poster presentations.
The last day to register papers is December 10, 2016. For more paper-related dates, please read "Information Processing in Medical Imaging 2017: Call for Papers" at https://blog.kitware.com/information-processing-in-medical-imaging-2017-call-for-papers.
KITWARE WELCOMES NEW TEAM MEMBERSThis year, Kitware has expanded its teams in Clifton Park, New York; Carrboro, North Carolina; and Lyon, France. Kitware continues to seek talented, motivated, and creative individuals to join in its mission to develop and deliver cutting-edge software products and services using advanced software quality methods and technologies.
Kitware employees enjoy an award-winning work envi-ronment that empowers them to pursue their passions. In addition to an excellent workplace, Kitware offers com-prehensive benefits including flexible hours; a computer hardware budget; health, vision, dental, and life insurance; short- and long-term disability insurance; immigration- and visa-processing services; a relocation bonus; tuition reimbursement; and a generous compensation plan. For descriptions of available positions, please see http://jobs.kitware.com/opportunities.html.
Libby Rose and Matt Burnham, who Kitware welcomed in May, join in camaraderie at Kitware headquarters.

20
Contributors: Jefferson Amstutz, Sreekanth Arikatla, Lisa Avila, Carson Brownlee, David DeMarle, Jean-Christophe Fillion-Robin, Andinet Enquobahrie, Chris Harris, Ken Martin, Bob O'Bara, Davide Punzo, Jos B.T.M. Roerdink, John Tourtellot, Thijs van der Hulst, and Yumin Yuan
Graphic Design: Steve Jordan
Editor: Sandy McKenzie
This work is licensed under an Attribution 4.0 International (CC BY 4.0) License.
Kitware, ParaView, CMake, KiwiViewer, and VolView are registered trademarks of Kitware, Inc. All other trademarks are property of their respective owners.
In addition to providing readers with updates on Kitware product development and news pertinent to the open source community, the "Kitware Source" delivers basic information on recent releases, upcoming changes, and technical articles related to Kitware open-source projects.
For an up-to-date list of Kitware projects and to learn about areas into which the company is expanding, please visit the open source pages on the website at http://www.kitware.com/opensource/provensolutions.html.
A digital version of the "Kitware Source" is available in a blog format at http://www.kitware.com/source.
Kitware would like to encourage members of its active developer community to contribute to the "Kitware Source." Contributions may include a technical article that describes an enhancement made to a Kitware open-source project or successes/lessons learned via developing a product built on one or more Kitware open-source projects. The "Kitware Source" is published by Kitware, Inc., Clifton Park, New York.
Doruk ÖztürkDoruk brought expertise in hydrology and geographic information systems to the Clifton Park office. He has prior experience building applications that utilize remote-sensing techniques and historical weather data.
Matt BurnhamMatt started as a part-time annotation specialist for the computer vision team. Before he joined Kitware, Matt served as a solo practitioner hearing representative at the Department of Labor.
Haocheng LiuHaocheng became a member of the scientific computing team in Clifton Park. In May, he received his Master of Science in Mechanical Engineering from Carnegie Mellon University.
Mayeul ChassgnardMayeul began an internship in Carrboro. Mayeul focuses on computer science, mathematics, electronics, and signal pro-cessing at CPE Lyon.
Nicolas VuailleNicolas joined the Kitware team in Lyon. He previously worked for Laboratoire Bordelais de Recherche en Informatique, where his efforts focused on software development for http://www.i-score.org.
The following team members joined Kitware in May, June, and July.
Aron HelserAron became a member of the scientific computing team in Carrboro. Among his past efforts, Aron worked to develop and commercialize nanoManipulator at the University of North Carolina at Chapel Hill.
Libby RoseLibby came to Kitware as a business development repre-sentative. Libby’s background includes technical writing, business analysis, and quality assurance.
Florian ChevassuFlorian joined the Lyon office in June. He has expertise in C++ and experience in the development of libraries that apply to thermodynamics and financial risk.
Michael FoglemanMichael arrived at Kitware in June as part of the scientific computing team. His research interests include computer graphics, data analysis, and visualization.
Maëliss Jallais Maëliss embarked on a one-year internship in Carrboro. As a student at École Supérieure de Chimie Physique Électronique de Lyon (CPE Lyon), Maëliss studies digital sciences.