table of contents - small business consulting, franchise...
TRANSCRIPT
©Angel Business Advisors, Inc. Page 2 of 38
Table of Contents
1. Executive Summary .................................................................................................................................. 4
1.1 Business Overview .............................................................................................................................. 4
1.2 Business Model ................................................................................................................................... 4
1.3 Market Analysis ................................................................................................................................... 4
1.4 Financial Projections ........................................................................................................................... 5
1.5 Financial Needs ................................................................................................................................... 5
1.6 Debt Repayment Plan ......................................................................................................................... 5
2. Business Overview ................................................................................................................................... 6
2.1 Vision and Goals .................................................................................................................................. 6
2.2 Business Location ................................................................................................................................ 6
2.3 Ownership Structure ........................................................................................................................... 7
2.4 Current State ....................................................................................................................................... 7
3. Business Model......................................................................................................................................... 8
3.1 Overview ............................................................................................................................................. 8
3.2 Revenue Model ................................................................................................................................... 8
3.3 Cost Model ........................................................................................................................................ 12
4. Market Analysis ...................................................................................................................................... 14
4.1 Industry / Market Overview .............................................................................................................. 14
4.2 Demographics ................................................................................................................................... 14
4.3 Competitive Analysis ......................................................................................................................... 15
5. Marketing Plan ....................................................................................................................................... 18
5.1 SWOT Analysis ................................................................................................................................... 18
5.2 Market Segments .............................................................................................................................. 19
5.3 Marketing Strategy ........................................................................................................................... 20
6. Management Team ................................................................................................................................ 22
6.1 Management ..................................................................................................................................... 22
6.2 Personnel .......................................................................................................................................... 22
7. Financial Plan .......................................................................................................................................... 23
©Angel Business Advisors, Inc. Page 3 of 38
7.1 Revenue Projections ......................................................................................................................... 23
7.2 Expense Analysis ............................................................................................................................... 24
7.3 Startup Expense ................................................................................................................................ 25
7.4 Capital Expense ................................................................................................................................. 27
7.5 Profit and Loss Statement ................................................................................................................. 27
7.6 Balance Sheet .................................................................................................................................... 28
7.7 Cash Flow Analysis ............................................................................................................................ 29
8. Use of Funds ........................................................................................................................................... 31
8.1 Use of Funds ...................................................................................................................................... 31
9. Debt Repayment Plan ............................................................................................................................ 32
9.1 Debt Repayment Plan ....................................................................................................................... 32
10. Appendix ............................................................................................................................................... 33
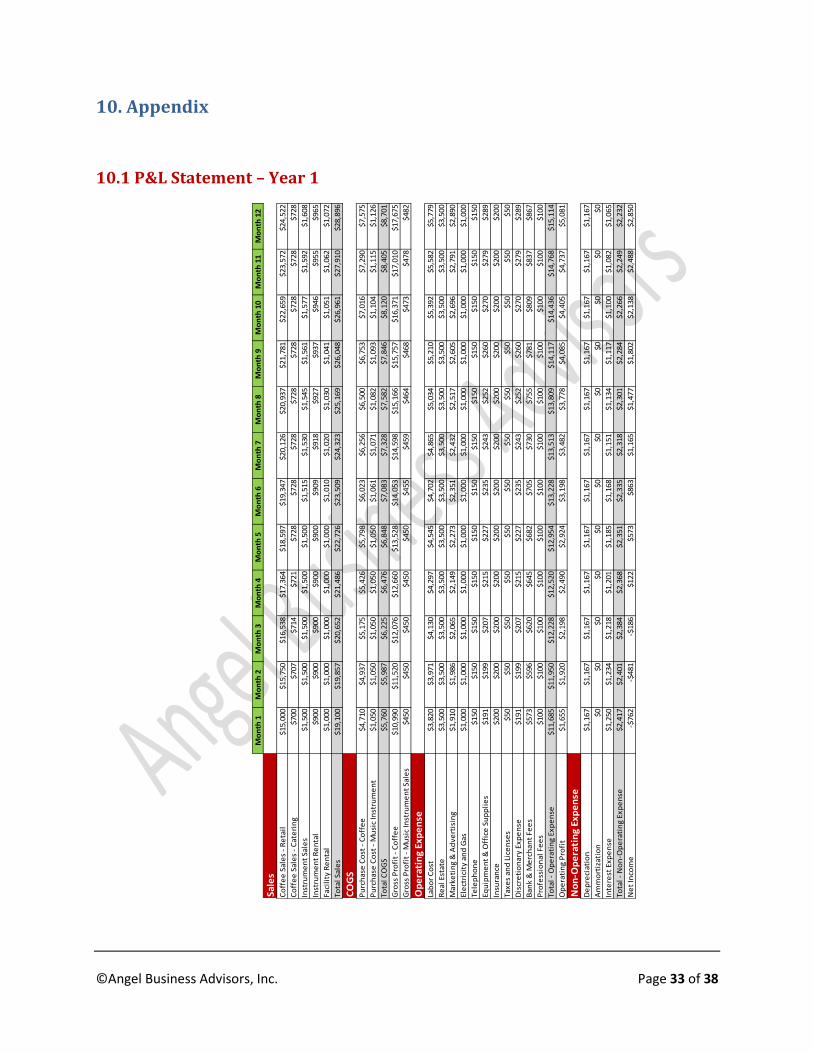
10.1 P&L Statement – Year 1 .................................................................................................................. 33
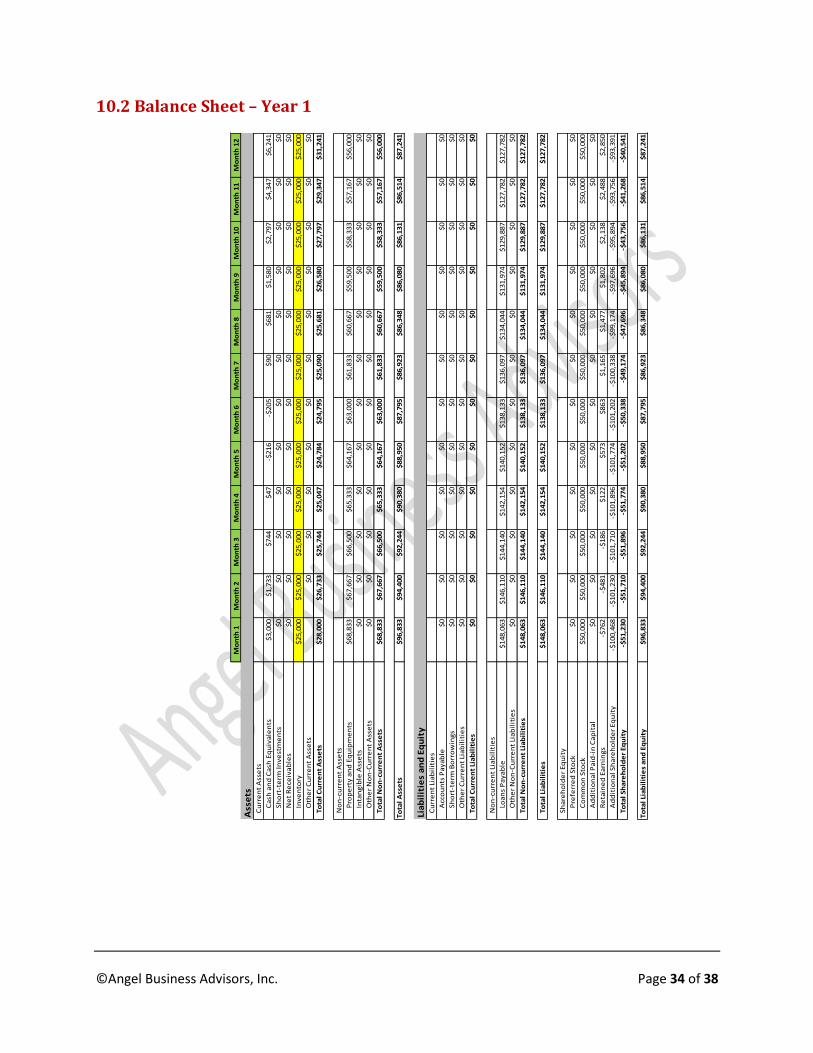
10.2 Balance Sheet – Year 1 .................................................................................................................... 34
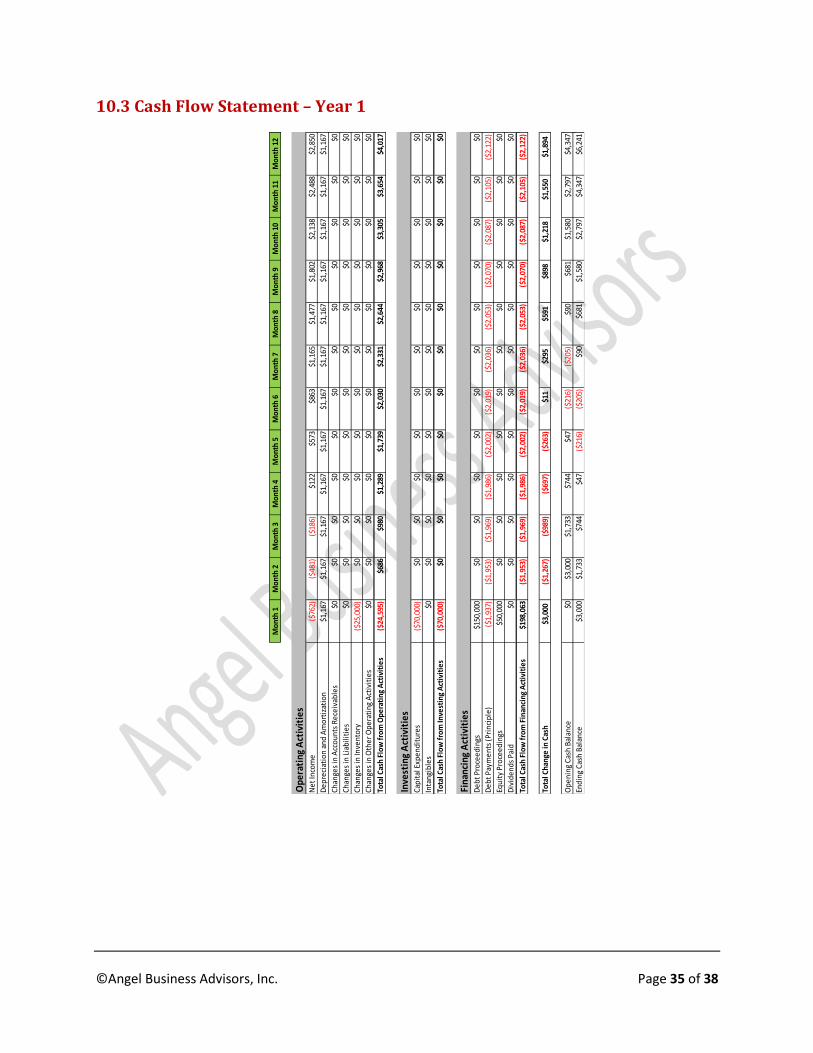
10.3 Cash Flow Statement – Year 1 ........................................................................................................ 35
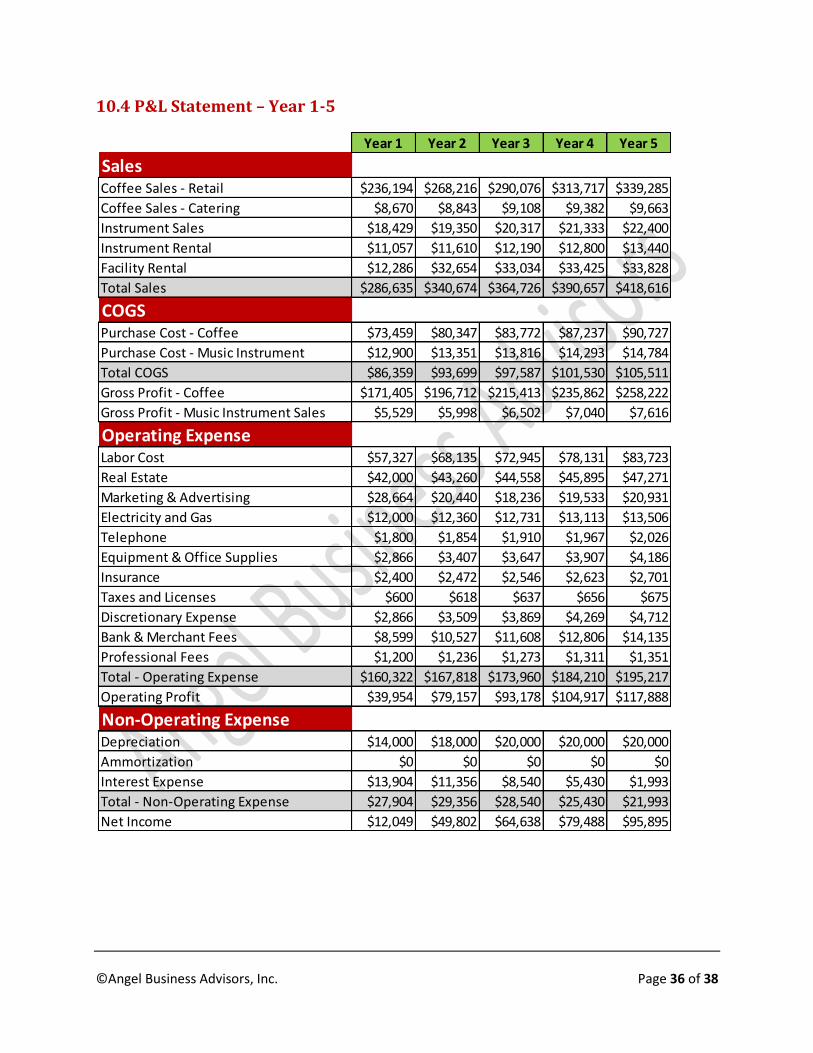
10.4 P&L Statement – Year 1-5 ............................................................................................................... 36
10.5 Balance Sheet – Year 1-5................................................................................................................. 37
10.6 Cash Flow Statement – Year 1-5 ..................................................................................................... 38
©Angel Business Advisors, Inc. Page 4 of 38
1. Executive Summary
1.1 Business Overview
ABC Café & Music is a unique retail concept to be introduced in the vibrant, music loving
city of ZZZ, Michigan . It combines the passion for music and coffee to bring a community place
where coffee and music connoisseurs come together to learn, enjoy and share music over a nice
cup of java. Our goal is to be the place that comes to people’s mind when they are thinking of
relaxing with friends and other music lovers while enjoying coffee and pastries with them.
We are currently in the process of establishing the corporation and expect to receive the
documentation in the next 15 days. We are also working towards finalizing the lease agreements
for the physical location at XYZ Street in ZZZ. ABC Café & Music will be set up as a C-
corporation owned by John Doe and will be organized in the state of Michigan.
1.2 Business Model
Our business model is built upon leveraging complementary nature of the coffee and
music business. The revenue model is composed of three groups of revenue streams – 1) coffee
retail and catering, 2) music instrument sales and rental and 3) Facility rental for music lessons
and recording studio. The coffee segment will generate the largest share of revenue. It will also
act as a catalyst to introduce music store to the potential new customers. We plan to ramp up
facility rental segment slowly over 2nd year of operation.
We plan to combine our brick-and-mortar business with the web site where we intend to
attract customers with music related news and services. It will also have an E-commerce store
that will sell music instruments as well as provide rental services.
The complementary nature of our business model will allow us to distribute overhead
cost over larger number of revenue segments; which will help us achieve higher profit margin
compared to peers.
Our estimate for overall operating margin is 14% in the first year increasing to 28% in
year 5 as our sales increase, allowing us to take advantage of economies of scale.
1.3 Market Analysis
According to Specialty Coffee Association of America (SCAA), there are more than 150
million coffee consumers in U.S. that spend more than $18 billion in various types of coffee
drinks every year. Specialty coffee sales is increasing by 20% per year and currently accounts for
nearly 8% of the U.S. coffee market.
The music instrument is a fairly large business segment. It recorded $7.5 billion in sales
in 2007 according to National Association of Music Merchants (NAMM). The industry has
grown 18% in the last 10 years.
©Angel Business Advisors, Inc. Page 5 of 38
In addition, the music instrument rental business has flourished recently with more and
more children participating in the music programs in their schools and private lessons requiring
the rental of the instruments on an ongoing basis.
The city of ZZZ, where the business will be located, has a population of 183,000
according to 2010 U.S. Census Bureau. There are approx. 67,000 households, and 24,000
families residing in the city. The median income for a household in the city is $46,299 and the
median income for a family is $71,293. The city is part of AAA Metropolitan area that includes
the city of AAA as well as number of affluent suburbs in Wayne, Oakland, Macomb, Washtenaw,
Lapeer, St. Clair and Livingston counties. The total population covering these six counties as
part of AAA Metro is more than 5 million.
1.4 Financial Projections
Our estimate shows that the monthly sales will increase from $19,100 in month 1 to
$28,900 in month 12. Our operating profit will increase from $1,655 in month 1 to $5,081 in
month 12; while net profit will increase from loss of $762 in month 1 to profit of $2,850 in
month 12.
We expect to increase sales from $286,000 year 1 to $418,600 in year 5; while operating
profit will increase from $40,000 in year 1 to $118,000 in year 5. Net profit will improve from
$12,000 in year 1 to $96,000 in year 5.
Our plan is to have positive operating cash flow from the first month 1; while achieving
positive net cash flow by month 6. Our operating cash flow will increase from $400 in 1st month
to $4,000 in month 12. The first year operating cash flow will be $26,000 increasing to
$116,000 in year 5.
1.5 Financial Needs
We are requesting $150,000in loan amount to be repaid over 5 years. We will also
contribute $50,000 in equity contribution bringing the total funding from all sources to
$20,000. The table also shows that we intend to use $70,000 from these funds towards capital
expenditure in year 1 and $25,000 for start-up inventory. The remaining amount of $105,000
will be used for working capital.
1.6 Debt Repayment Plan
We intend to repay the entire $150,000 in debt over 5 years. As shown in the cash flow
statements we will have sufficient cash flow after taking care of operating expenses to service the
debt. Assuming 10% fixed interest rate the total interest payment will be $41,223 over 5 years.
©Angel Business Advisors, Inc. Page 6 of 38
2. Business Overview
2.1 Vision and Goals
Our vision at ABC Café & Music is to be the premium meeting spot in ZZZ where coffee
and music connoisseurs come together to learn, enjoy and share music over a nice cup of java.
We want to be the place that comes to people’s mind when they are thinking of relaxing with
friends and other music lovers while enjoying coffee and pastries with them.
We have laid out several principles in support of this vision that will help us to be
successful in the coming years. The principles are as follows:
1. We will aim to match and exceed Starbucks in terms of the quality of our coffee. The
coffee connoisseurs will think of ABC Café & Music in the same regard as they do
Starbucks.
2. Our love of music will show up in everything we do at ABC Café & Music. We will do all
we can to help fellow music lovers in ZZZ and beyond.
3. We will provide a comfortable venue and meeting place for music lovers so that they will
be able to find and meet other musicians.
4. Our employees will be musicians in their own right. We will make ABC Café & Music a
place where employees will come to work not only for money; but for their love of music.
2.2 Business Location
ABC Café & Music will be located at XYZ Street in ZZZ. The building we are looking to
lease is ideal to utilize as a café / music place. The building has 2,200 square feet in usable area
and covers 2 floors.
In addition to the physical location, we are in the process of building a web site where
customers can browse through large selection of musical instruments and purchase or rent them
right from the web site. The web site will also be a repository for music related information;
which will act as catalyst to bring new customers not only for music instruments; but also to our
physical café for coffee.
ZZZ and surrounding area has a vibrant community of people that enjoy music and who
like to relax and chat over a nice cup of coffee. Even though there are several coffee shops as well
as music schools in the area, a unique concept like ABC Café & Music can provide an ambient
atmosphere. Our market research has received number of positive comments from the
community.
©Angel Business Advisors, Inc. Page 7 of 38
2.3 Ownership Structure
ABC Café & Music will be set up as a C-corporation owned by John Doe and will be
organized in the state of Michigan. We are currently in the process of establishing the
corporation and expect to receive the documentation in the next 15 days.
2.4 Current State
We are currently working diligently to put all pieces together with the goal of starting the
business in February, 2010. The following outlines some of the activities that are ongoing
towards our goal.
We are in the process of negotiating a lease with the landlord for the building located at
XYZ Street, ZZZ, 99999.
We are working on setting up a web site where we will start selling and renting music
instruments. The expected completion date for the web site is December 15, 2010.
We have applied for business license with the state of Michigan and have filed paper
work with IRS and other relevant federal and state agencies to register the business.
We have been talking to couple of potential key employees and expect to get them on
board a month before the business open date.
©Angel Business Advisors, Inc. Page 8 of 38
3. Business Model
3.1 Overview
Our business model is built upon leveraging complementary nature of the coffee and
music business. By providing convenience of enjoying the music to customers; while they are
enjoying their coffee we plan to attract loyal customer base that will keep coming to our store. In
addition, the location we plan to lease has a perfect setup for offering additional music related
services not found in other locations. We plan to offer services such as music instrument sales
and rental, live music entertainment and facility rental for music lessons and meetings.
We also plan to combine our brick-and-mortar business with the web site where we
intend to attract customers with music related news and services. We also plan to set up an E-
commerce store that will sell music instruments as well as provide rental services. Our
background and passion for music will help us create a community for music lovers through
blog, news and discussion groups.
3.2 Revenue Model
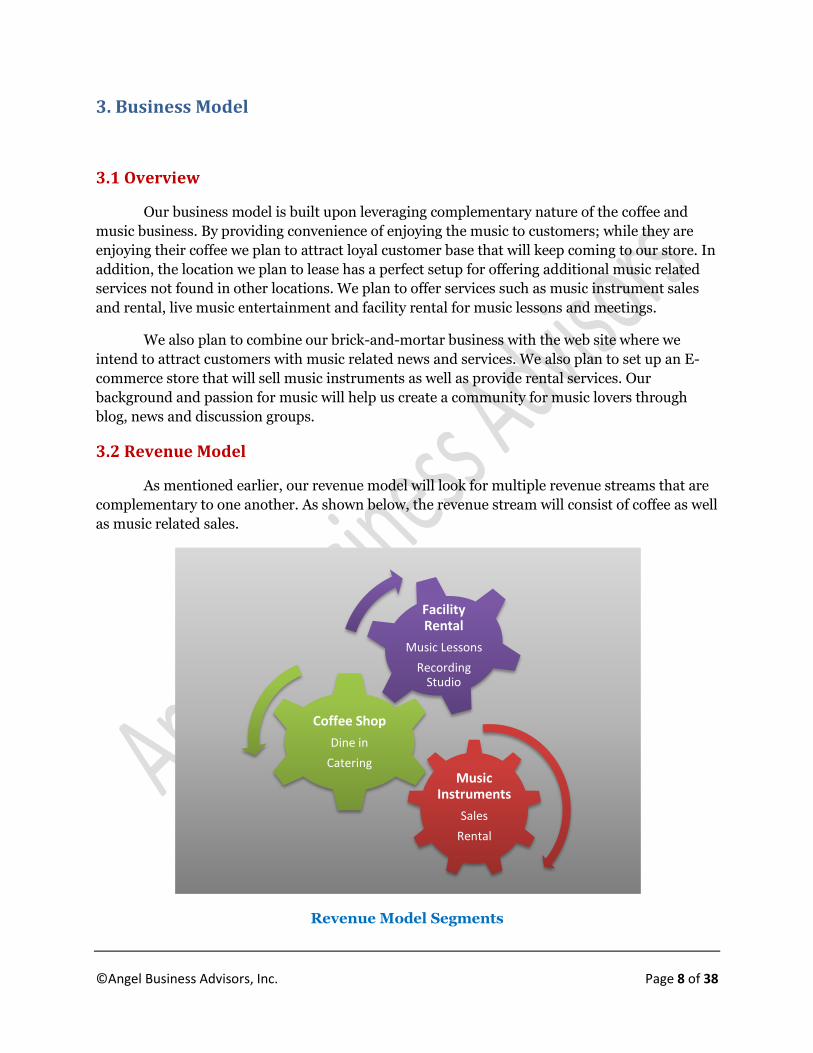
As mentioned earlier, our revenue model will look for multiple revenue streams that are
complementary to one another. As shown below, the revenue stream will consist of coffee as well
as music related sales.
Revenue Model Segments
Music Instruments
Sales
Rental
Coffee Shop
Dine in
Catering
Facility Rental
Music Lessons
Recording Studio
©Angel Business Advisors, Inc. Page 9 of 38
These revenue Segments are described in detail in the following sections.
1. Coffee Shop – This revenue segment is expected to generate the largest share of
revenue in the early years. Once the music instrument segment is established, the
percent of revenue from coffee shop will be reduced. The coffee shop will generate
revenue from the sales of coffee and associated products. We intend to carry large
selection of premium coffee and pastries in an environment that is inviting to group of
people who want to engage in laid-back conversation. In addition, we will seek catering
orders from the businesses that are located in the vicinity. To source our coffee supply we
have entered into licensing agreement with Java Days – a premium coffee vendor.
2. Music Instrument – We plan to carry a limited selection of music instruments and
accessories that will be available for sale and rental. For the rental business, we have
entered into revenue sharing agreement with a music instrument vendor XYZ that will
enable us to reduce our working capital investment in the instruments, while still be able
to rent large selection of music instruments. We have also entered into agreement with a
vendor that will enable us to drop-ship the instruments upon receiving orders from
customers. The sale and rental of music instruments will be carried out both in our
physical location as well as from the web site.
3. Facility Rental – This is the third and smallest cog of our revenue model that will be
enabled by the facility that is ideally suited for this. The coffee shop has couple of rooms
where we plan to establish classrooms for music lessons. This room will also serve as a
meeting room for various purposes. We also plan to establish a recording studio at a later
date that can be rented for music recordings.
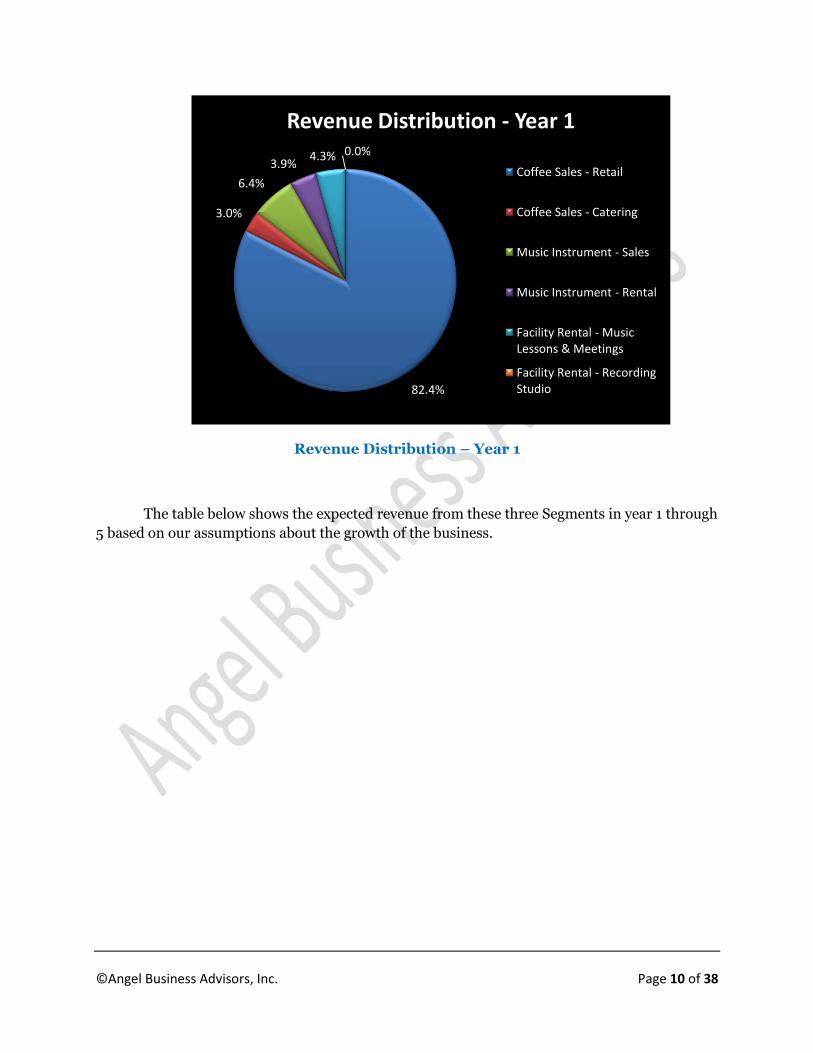
The chart below shows the approximate revenue distribution amongst these three Segments
in year 1.
©Angel Business Advisors, Inc. Page 10 of 38
Revenue Distribution – Year 1
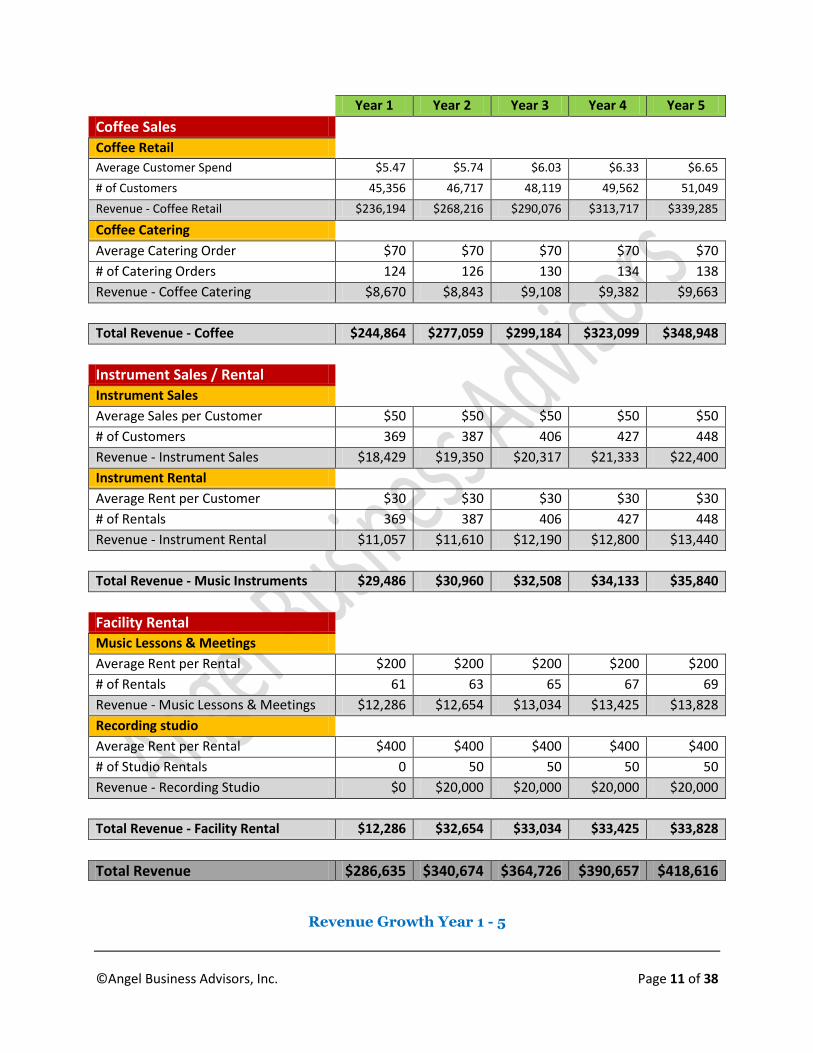
The table below shows the expected revenue from these three Segments in year 1 through
5 based on our assumptions about the growth of the business.
82.4%
3.0%
6.4%
3.9%4.3% 0.0%
Revenue Distribution - Year 1
Coffee Sales - Retail
Coffee Sales - Catering
Music Instrument - Sales
Music Instrument - Rental
Facility Rental - Music Lessons & Meetings
Facility Rental - Recording Studio
©Angel Business Advisors, Inc. Page 11 of 38
Year 1 Year 2 Year 3 Year 4 Year 5
Coffee Sales
Coffee Retail
Average Customer Spend $5.47 $5.74 $6.03 $6.33 $6.65
# of Customers 45,356 46,717 48,119 49,562 51,049
Revenue - Coffee Retail $236,194 $268,216 $290,076 $313,717 $339,285
Coffee Catering
Average Catering Order $70 $70 $70 $70 $70
# of Catering Orders 124 126 130 134 138
Revenue - Coffee Catering $8,670 $8,843 $9,108 $9,382 $9,663
Total Revenue - Coffee $244,864 $277,059 $299,184 $323,099 $348,948
Instrument Sales / Rental
Instrument Sales
Average Sales per Customer $50 $50 $50 $50 $50
# of Customers 369 387 406 427 448
Revenue - Instrument Sales $18,429 $19,350 $20,317 $21,333 $22,400
Instrument Rental
Average Rent per Customer $30 $30 $30 $30 $30
# of Rentals 369 387 406 427 448
Revenue - Instrument Rental $11,057 $11,610 $12,190 $12,800 $13,440
Total Revenue - Music Instruments $29,486 $30,960 $32,508 $34,133 $35,840
Facility Rental
Music Lessons & Meetings
Average Rent per Rental $200 $200 $200 $200 $200
# of Rentals 61 63 65 67 69
Revenue - Music Lessons & Meetings $12,286 $12,654 $13,034 $13,425 $13,828
Recording studio
Average Rent per Rental $400 $400 $400 $400 $400
# of Studio Rentals 0 50 50 50 50
Revenue - Recording Studio $0 $20,000 $20,000 $20,000 $20,000
Total Revenue - Facility Rental $12,286 $32,654 $33,034 $33,425 $33,828
Total Revenue $286,635 $340,674 $364,726 $390,657 $418,616
Revenue Growth Year 1 - 5
©Angel Business Advisors, Inc. Page 12 of 38
3.3 Cost Model
The complementary nature of our business model allows us to distribute overhead cost
over larger number of revenue segments; which will help us achieve higher profit margin
compared to peers. For example, the building we plan to lease can be utilized for multiple
purposes including coffee shop, music instrument showroom and rental facility.
The paragraphs below describe the primary cost drivers for these three revenue
segments and how we plan to minimize the expenses leading to higher profit margin.
1. Coffee Shop – The primary cost driver for coffee shop is the Cost of Goods Sold
(COGS). Our estimates show that the gross margin for the coffee shop will be approx.
70%. The next largest cost component for coffee shop will be labor cost; which we
estimate to be 25%. We will be able to reduce other components of operating expense by
leveraging them with other revenue segments including music instrument sale / rental
and facility rental.
2. Music Instruments – Due to our novel arrangement with the music instrument
vendor we will be able to keep COGS for music instrument segment considerably low.
We have arranged drop-ship arrangement with the instrument distributor that will
enable us to reduce the inventory carrying cost and will necessitate lower working
capital. We have also entered into revenue sharing arrangement with the distributor for
the rental segment of our business that will enable us to rent the instruments with
virtually zero carrying cost.
3. Facility Rental – The building we plan to lease has a layout that is ideal for conducting
music lessons and meetings. This enables us to use this facility for rental without
increasing our cost considerably. The primary cost for this segment of the business will
be building maintenance cost that will be shared over all revenue segments.
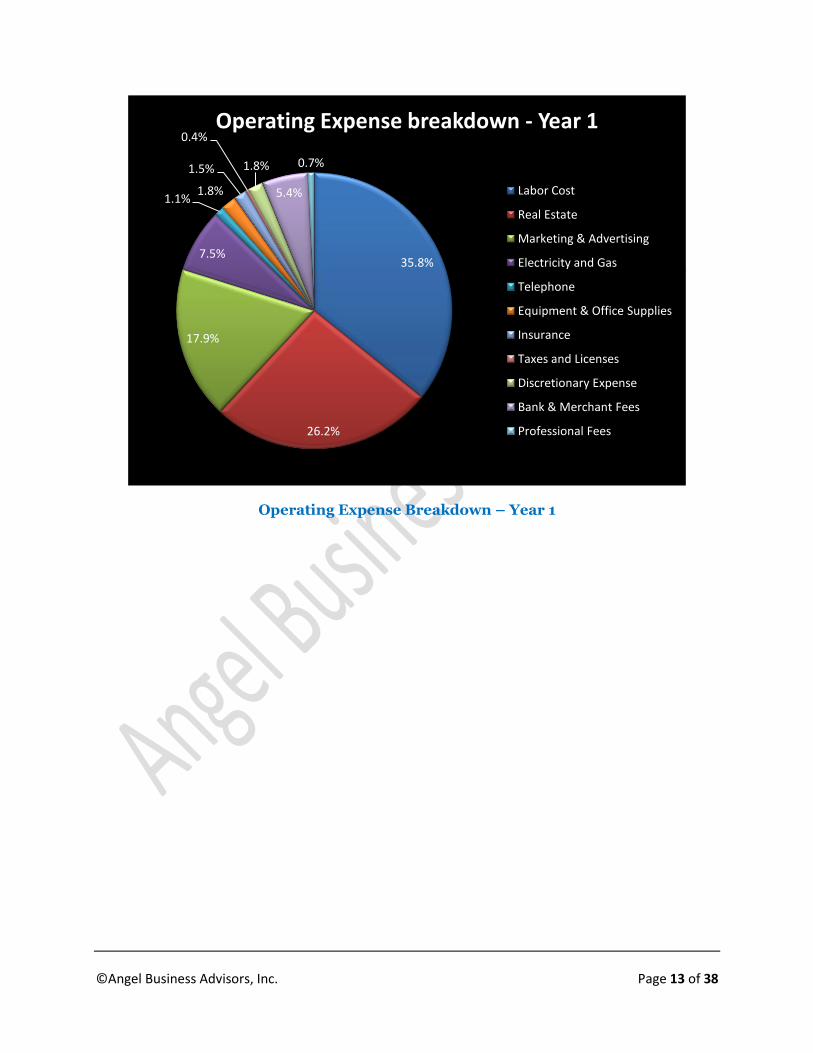
The chart below shows the overall cost distribution spread amongst all three revenue
segments.
©Angel Business Advisors, Inc. Page 13 of 38
Operating Expense Breakdown – Year 1
35.8%
26.2%
17.9%
7.5%
1.1%1.8%
1.5%
0.4%
1.8%
5.4%
0.7%
Operating Expense breakdown - Year 1
Labor Cost
Real Estate
Marketing & Advertising
Electricity and Gas
Telephone
Equipment & Office Supplies
Insurance
Taxes and Licenses
Discretionary Expense
Bank & Merchant Fees
Professional Fees
©Angel Business Advisors, Inc. Page 14 of 38
4. Market Analysis
4.1 Industry / Market Overview
Music Instruments
The music instrument is a fairly large business segment. It recorded $7.5 billion in sales
in 2007 according to National Association of Music Merchants (NAMM) (1). The industry has
grown 18% in the last 10 years. The growth has slowed to 1% in the last 3-4 years as a result of
economic downturn.
In addition, the music instrument rental business has flourished recently with more and
more children participating in the music programs in their schools and private lessons requiring
the rental of the instruments on an ongoing basis. The music rental business provides a steady,
recurring revenue stream that can continue for number of years once signed.
The music instrument business is fairly stable and recession-resistant due to popularity
of music with people of all ages and parents’ desire to teach their children music at an early age.
It is not uncommon to find families willing to spend several hundred dollars per month on
music lessons and instrument purchase / rental.
According to NAMM / Gallup poll, 52% of U.S. Households own at least one musical
instrument; while 40% of households own two or more. More than 41% of students going to
school participate in school instrumental music programs resulting in constant need to purchase
and rent music instruments.
Coffee Shop
According to Specialty Coffee Association of America (SCAA), there are more than 150
million coffee consumers in U.S. that spend more than $18 billion in various types of coffee
drinks every year. Specialty coffee sales is increasing by 20% per year and currently accounts for
nearly 8% of the U.S. coffee market. Coffee shops make up the fastest growing part of the
restaurant business, checking in with a 7% annual growth rate! Nationwide, there are more than
45,000 coffee shops with the largest concentration in Seattle, Manhattan and San Francisco.
The popularity of coffee products worldwide is almost astonishing. It has a universal
appeal to people of different income levels, ethnicities, and religions. US coffee drinkers
consume approximately 3.1 cups per day on average. On average, coffee drinkers will spend
$164.71 per year on coffee.
4.2 Demographics
The city of ZZZ, where the business will be located, has a population of 183,000
according to 2010 U.S. Census Bureau. There are approx. 67,000 households, and 24,000
©Angel Business Advisors, Inc. Page 15 of 38
families residing in the city. Out of the 67,000 households, 23% have children under the age of
18 living with them. The median income for a household in the city is $46,299 and the median
income for a family is $71,293. There are 16,500 pupils enrolled in ZZZ Public schools covering
21 elementary schools.
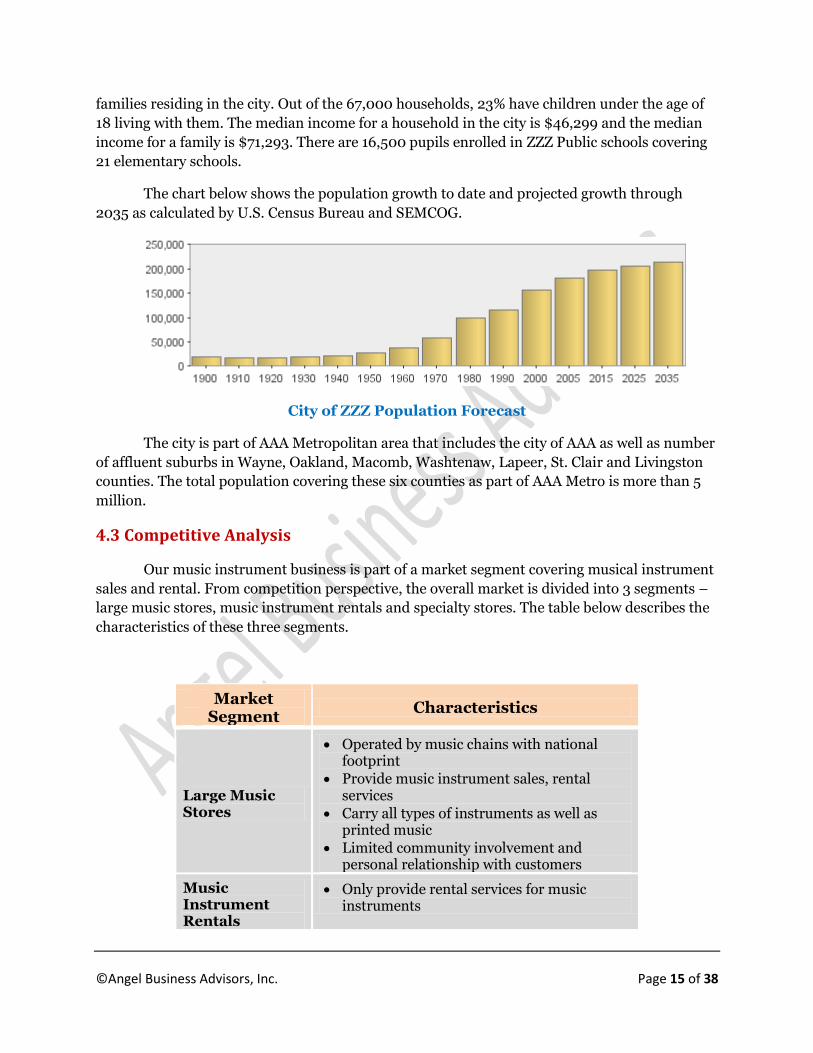
The chart below shows the population growth to date and projected growth through
2035 as calculated by U.S. Census Bureau and SEMCOG.
City of ZZZ Population Forecast
The city is part of AAA Metropolitan area that includes the city of AAA as well as number
of affluent suburbs in Wayne, Oakland, Macomb, Washtenaw, Lapeer, St. Clair and Livingston
counties. The total population covering these six counties as part of AAA Metro is more than 5
million.
4.3 Competitive Analysis
Our music instrument business is part of a market segment covering musical instrument
sales and rental. From competition perspective, the overall market is divided into 3 segments –
large music stores, music instrument rentals and specialty stores. The table below describes the
characteristics of these three segments.
Market Segment
Characteristics
Large Music Stores
Operated by music chains with national footprint
Provide music instrument sales, rental services
Carry all types of instruments as well as printed music
Limited community involvement and personal relationship with customers
Music Instrument Rentals
Only provide rental services for music instruments
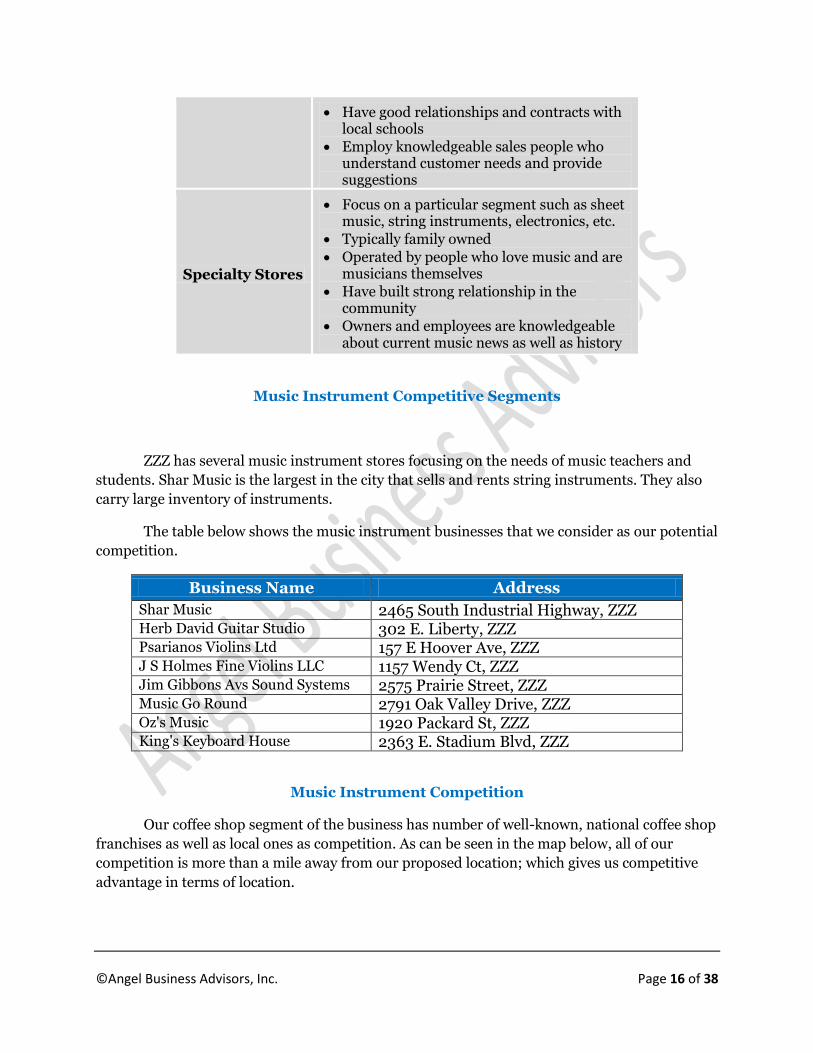
©Angel Business Advisors, Inc. Page 16 of 38
Have good relationships and contracts with local schools
Employ knowledgeable sales people who understand customer needs and provide suggestions
Specialty Stores
Focus on a particular segment such as sheet music, string instruments, electronics, etc.
Typically family owned
Operated by people who love music and are musicians themselves
Have built strong relationship in the community
Owners and employees are knowledgeable about current music news as well as history
Music Instrument Competitive Segments
ZZZ has several music instrument stores focusing on the needs of music teachers and
students. Shar Music is the largest in the city that sells and rents string instruments. They also
carry large inventory of instruments.
The table below shows the music instrument businesses that we consider as our potential
competition.
Business Name Address
Shar Music 2465 South Industrial Highway, ZZZ Herb David Guitar Studio 302 E. Liberty, ZZZ Psarianos Violins Ltd 157 E Hoover Ave, ZZZ J S Holmes Fine Violins LLC 1157 Wendy Ct, ZZZ Jim Gibbons Avs Sound Systems 2575 Prairie Street, ZZZ Music Go Round 2791 Oak Valley Drive, ZZZ Oz's Music 1920 Packard St, ZZZ King's Keyboard House 2363 E. Stadium Blvd, ZZZ
Music Instrument Competition
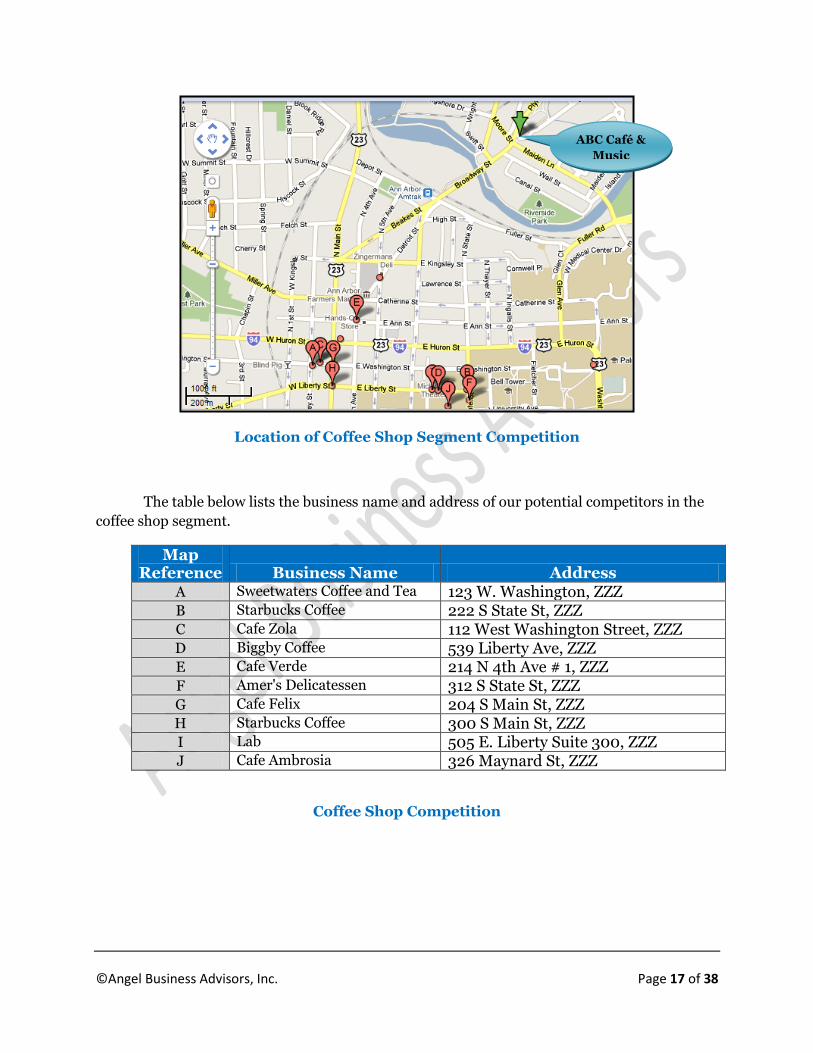
Our coffee shop segment of the business has number of well-known, national coffee shop
franchises as well as local ones as competition. As can be seen in the map below, all of our
competition is more than a mile away from our proposed location; which gives us competitive
advantage in terms of location.
©Angel Business Advisors, Inc. Page 17 of 38
Location of Coffee Shop Segment Competition
The table below lists the business name and address of our potential competitors in the
coffee shop segment.
Map Reference Business Name Address
A Sweetwaters Coffee and Tea 123 W. Washington, ZZZ
B Starbucks Coffee 222 S State St, ZZZ C Cafe Zola 112 West Washington Street, ZZZ D Biggby Coffee 539 Liberty Ave, ZZZ E Cafe Verde 214 N 4th Ave # 1, ZZZ F Amer's Delicatessen 312 S State St, ZZZ G Cafe Felix 204 S Main St, ZZZ H Starbucks Coffee 300 S Main St, ZZZ I Lab 505 E. Liberty Suite 300, ZZZ J Cafe Ambrosia 326 Maynard St, ZZZ
Coffee Shop Competition
ABC Café &
Music
©Angel Business Advisors, Inc. Page 18 of 38
5. Marketing Plan
5.1 SWOT Analysis
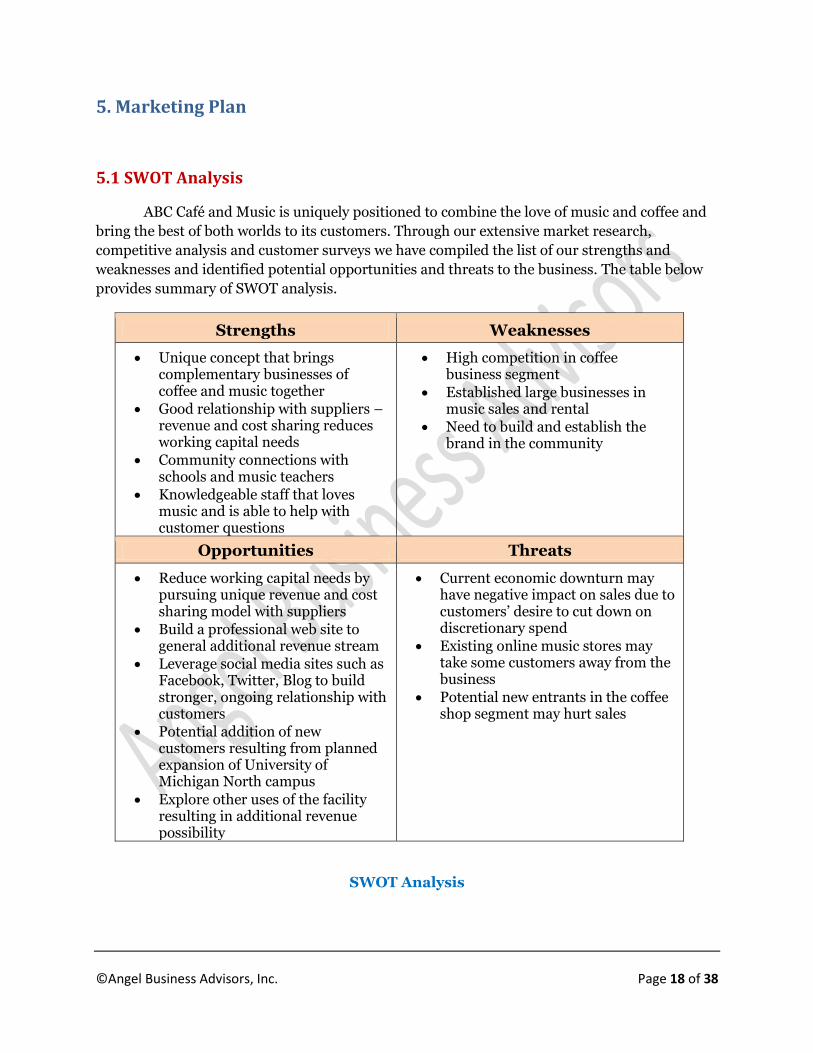
ABC Café and Music is uniquely positioned to combine the love of music and coffee and
bring the best of both worlds to its customers. Through our extensive market research,
competitive analysis and customer surveys we have compiled the list of our strengths and
weaknesses and identified potential opportunities and threats to the business. The table below
provides summary of SWOT analysis.
Strengths Weaknesses
Unique concept that brings complementary businesses of coffee and music together
Good relationship with suppliers – revenue and cost sharing reduces working capital needs
Community connections with schools and music teachers
Knowledgeable staff that loves music and is able to help with customer questions
High competition in coffee business segment
Established large businesses in music sales and rental
Need to build and establish the brand in the community
Opportunities Threats
Reduce working capital needs by pursuing unique revenue and cost sharing model with suppliers
Build a professional web site to general additional revenue stream
Leverage social media sites such as Facebook, Twitter, Blog to build stronger, ongoing relationship with customers
Potential addition of new customers resulting from planned expansion of University of Michigan North campus
Explore other uses of the facility resulting in additional revenue possibility
Current economic downturn may have negative impact on sales due to customers’ desire to cut down on discretionary spend
Existing online music stores may take some customers away from the business
Potential new entrants in the coffee shop segment may hurt sales
SWOT Analysis
©Angel Business Advisors, Inc. Page 19 of 38
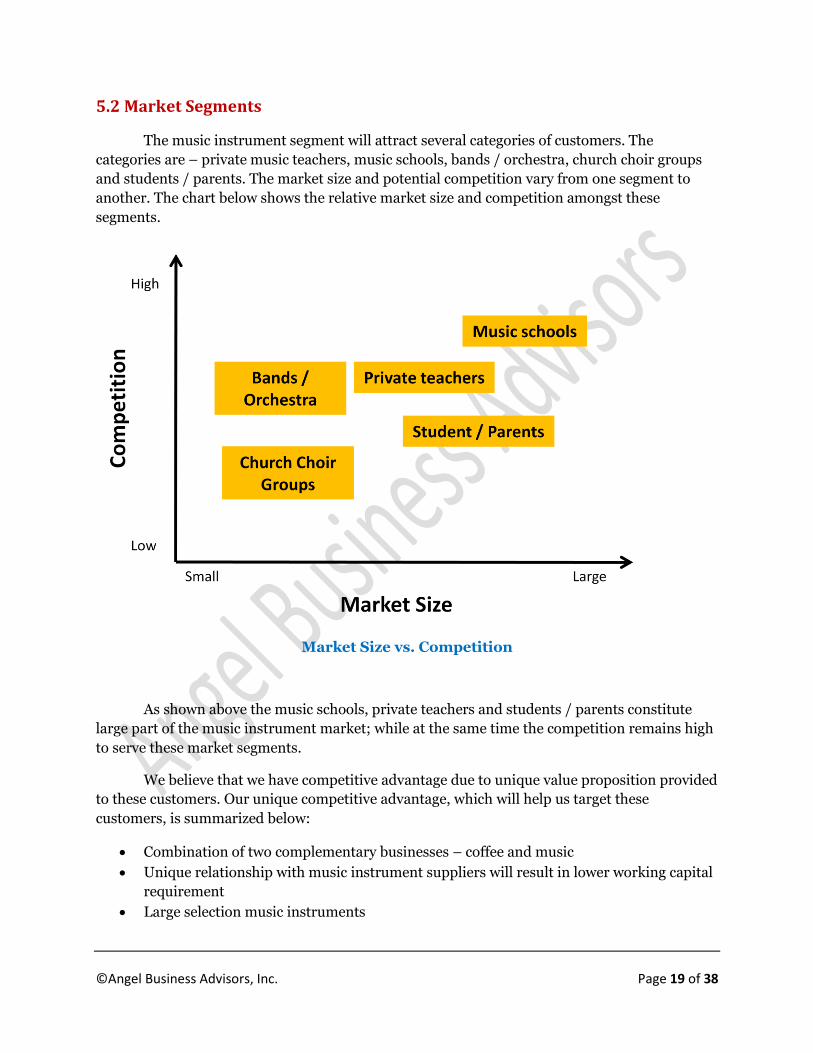
5.2 Market Segments
The music instrument segment will attract several categories of customers. The
categories are – private music teachers, music schools, bands / orchestra, church choir groups
and students / parents. The market size and potential competition vary from one segment to
another. The chart below shows the relative market size and competition amongst these
segments.
Market Size vs. Competition
As shown above the music schools, private teachers and students / parents constitute
large part of the music instrument market; while at the same time the competition remains high
to serve these market segments.
We believe that we have competitive advantage due to unique value proposition provided
to these customers. Our unique competitive advantage, which will help us target these
customers, is summarized below:
Combination of two complementary businesses – coffee and music
Unique relationship with music instrument suppliers will result in lower working capital
requirement
Large selection music instruments
©Angel Business Advisors, Inc. Page 20 of 38
Knowledgeable staff that itself is music and coffee connoisseur
Ability to cross-leverage customer base of three different business segments – coffee
shop, music instrument and facility rental
Lower overhead cost as a result of spreading the cost over multiple revenue segments
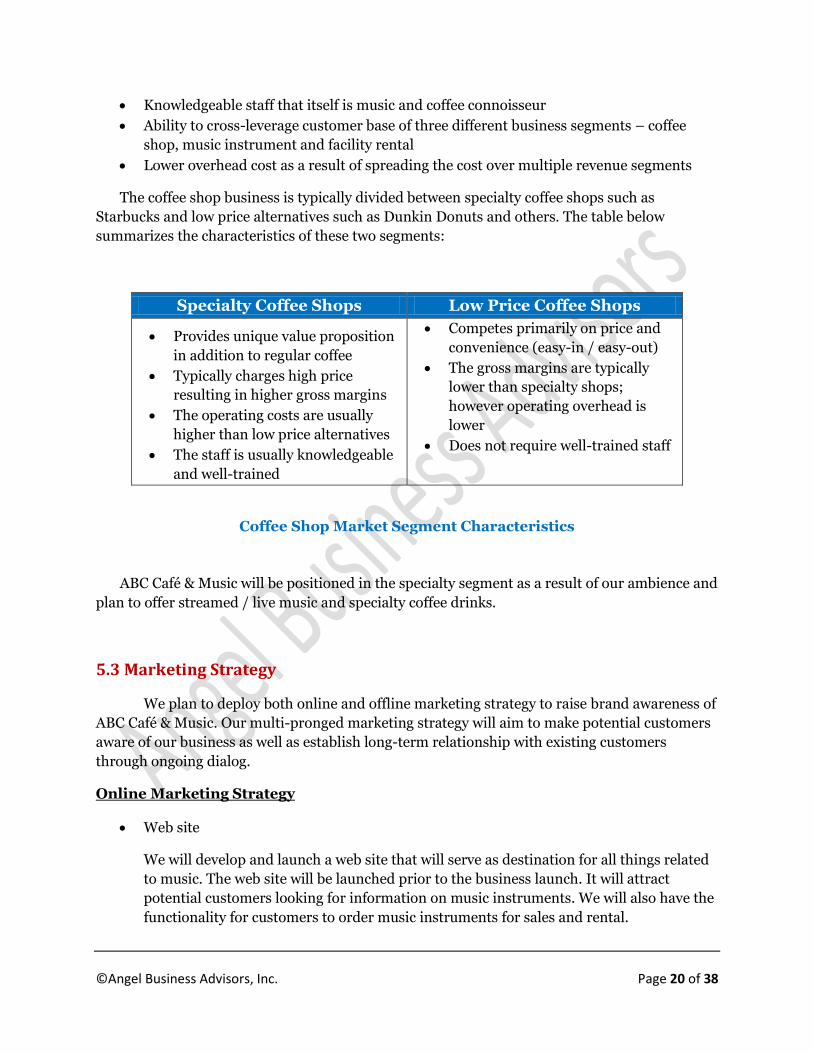
The coffee shop business is typically divided between specialty coffee shops such as
Starbucks and low price alternatives such as Dunkin Donuts and others. The table below
summarizes the characteristics of these two segments:
Specialty Coffee Shops Low Price Coffee Shops
Provides unique value proposition
in addition to regular coffee
Typically charges high price
resulting in higher gross margins
The operating costs are usually
higher than low price alternatives
The staff is usually knowledgeable
and well-trained
Competes primarily on price and
convenience (easy-in / easy-out)
The gross margins are typically
lower than specialty shops;
however operating overhead is
lower
Does not require well-trained staff
Coffee Shop Market Segment Characteristics
ABC Café & Music will be positioned in the specialty segment as a result of our ambience and
plan to offer streamed / live music and specialty coffee drinks.
5.3 Marketing Strategy
We plan to deploy both online and offline marketing strategy to raise brand awareness of
ABC Café & Music. Our multi-pronged marketing strategy will aim to make potential customers
aware of our business as well as establish long-term relationship with existing customers
through ongoing dialog.
Online Marketing Strategy
Web site
We will develop and launch a web site that will serve as destination for all things related
to music. The web site will be launched prior to the business launch. It will attract
potential customers looking for information on music instruments. We will also have the
functionality for customers to order music instruments for sales and rental.
©Angel Business Advisors, Inc. Page 21 of 38
Social Media
The emergence of social media sites such as Facebook and Twitter have fundamentally
changed the way businesses interact with their customers. These sites provide an
opportunity for businesses to establish an ongoing, two-way dialog with customers. We
plan to take full advantage of these social media sites by establishing presence on
Facebook, Twitter, Myspace and other sites. Our knowledge and passion for music will
be a natural fit for social media communication.
Blog
Similar to social media sites mentioned above, blogs afford an opportunity to establish
our business as a go-to place for music information and demonstrate our expertise to the
potential customers. At the same time, the periodic update of information on the blog
encourages users to visit our web site more frequently; which will help build deep, long-
term relationship with our customers.
Offline Marketing Strategy
Community Partnerships
We will establish partnership with music schools, churches and private music teachers
by offering them avenue for information on our web site. We also plan to enter into
group purchasing arrangement with them by which the students / members can get
discounts. Our facility rental provides another opportunity to bring members from these
organizations to our premises for meetings and seminars leading to future sales.
Local Advertisement
In the initial phase of the business we will run Grand Opening advertisements in the
local newspapers and magazines. We will also place pamphlets and other informative
material at locations that are likely to attract our target customers of music and coffee
lovers. In addition, our own coffee shop provides a unique opportunity to showcase the
music side of business to potential customers.
Event Sponsorships
ZZZ has a vibrant music community that has music concerts and related events
scheduled throughout the year. The Hill Auditorium at University of Michigan hosts
well-known classical music composers on a periodic basis. We will sponsor some of these
prominent as well as less well-known events all year to get our name in front of large
number of potential customers.
©Angel Business Advisors, Inc. Page 22 of 38
6. Management Team
6.1 Management
The ABC Café & Music will be owned and led by John Doe who is an avid music lover
himself. Professionally, John has extensive experience in helping small and large corporations
with their ERP and retail management systems. John has worked for more than 20 years
implementing and administering complex business ERP systems for number of global
corporations. He has solid understanding of all aspects of retail business including inventory
management, sales forecasting and planning, marketing among others. He will be able to utilize
his experience in this business to streamline business operations and improve sales.
In addition, John is passionate about music since his childhood. He has played
percussion instruments in school bands and symphonies throughout his career. He has been
organizing jam sessions with other music loving colleagues on a weekly basis for the last 3 years.
Recently, he created a web site for musicians in the tri-county area to meet and play music
together.
6.2 Personnel
The management will be assisted by a full-time manager. We plan to hire a manager,
who has extensive experience in managing large-scale retail operations.
In addition, we will carefully screen employees to work in the coffee shop and music
store to ensure that they have the passion and knowledge about coffee and music.
We are currently in the process of hiring couple of key employees, including full-time
manager who will be on board prior to the launch of our business.
©Angel Business Advisors, Inc. Page 23 of 38
7. Financial Plan
7.1 Revenue Projections
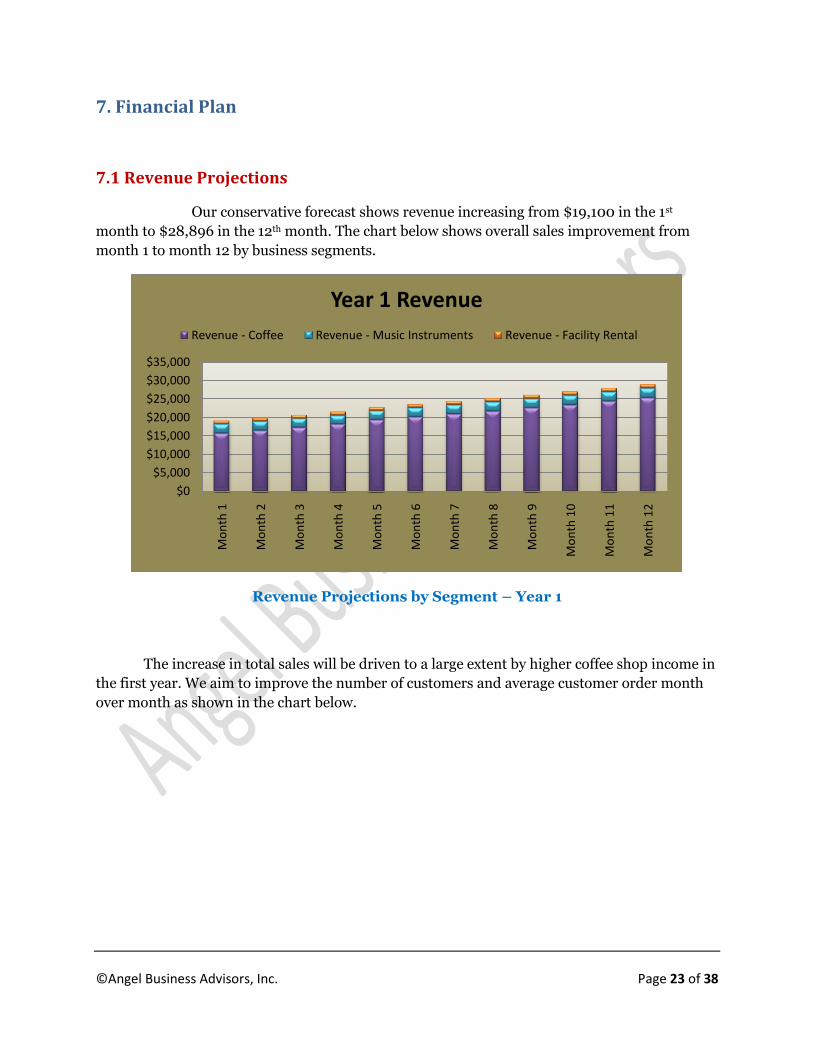
Our conservative forecast shows revenue increasing from $19,100 in the 1st
month to $28,896 in the 12th month. The chart below shows overall sales improvement from
month 1 to month 12 by business segments.
Revenue Projections by Segment – Year 1
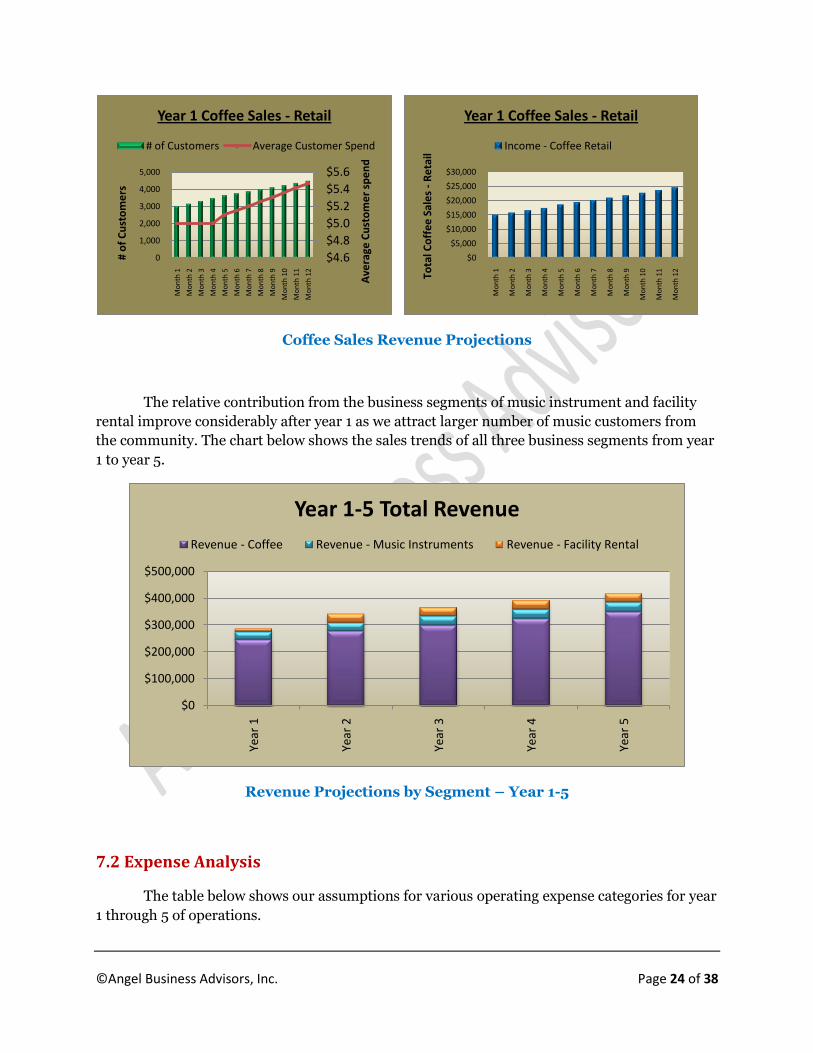
The increase in total sales will be driven to a large extent by higher coffee shop income in
the first year. We aim to improve the number of customers and average customer order month
over month as shown in the chart below.
$0
$5,000
$10,000
$15,000
$20,000
$25,000
$30,000
$35,000
Mo
nth
1
Mo
nth
2
Mo
nth
3
Mo
nth
4
Mo
nth
5
Mo
nth
6
Mo
nth
7
Mo
nth
8
Mo
nth
9
Mo
nth
10
Mo
nth
11
Mo
nth
12
Year 1 Revenue
Revenue - Coffee Revenue - Music Instruments Revenue - Facility Rental
©Angel Business Advisors, Inc. Page 24 of 38
Coffee Sales Revenue Projections
The relative contribution from the business segments of music instrument and facility
rental improve considerably after year 1 as we attract larger number of music customers from
the community. The chart below shows the sales trends of all three business segments from year
1 to year 5.
Revenue Projections by Segment – Year 1-5
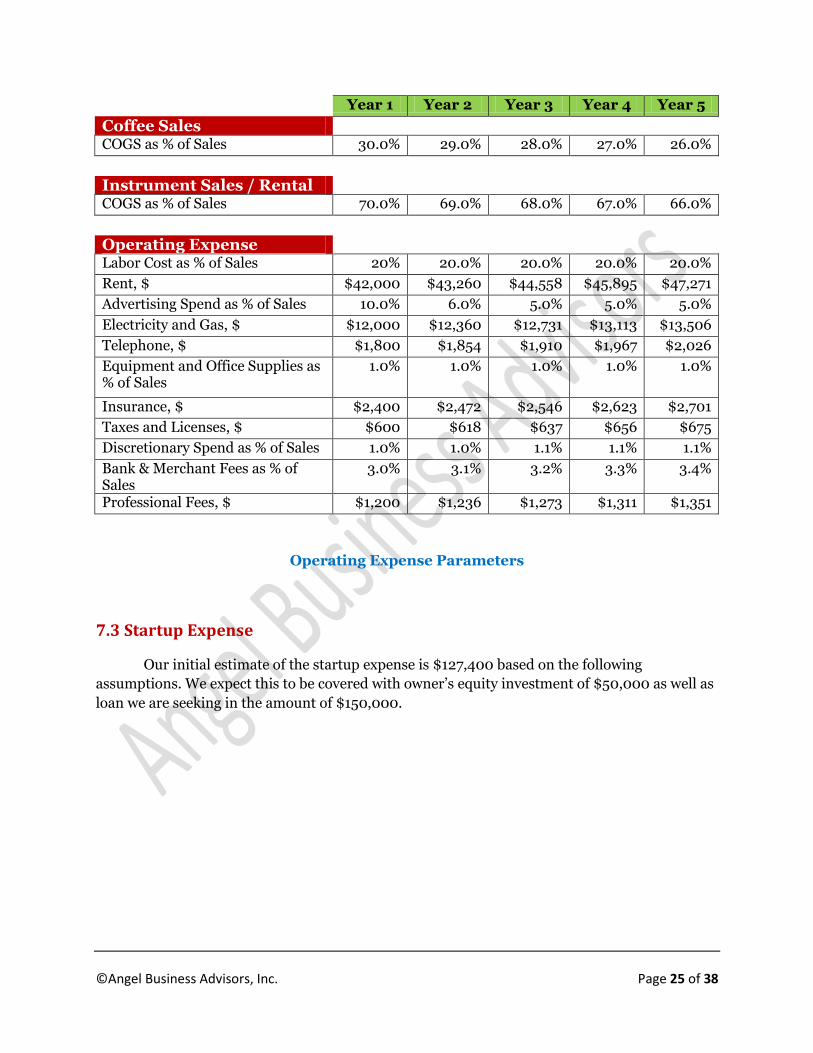
7.2 Expense Analysis
The table below shows our assumptions for various operating expense categories for year
1 through 5 of operations.
$4.6
$4.8
$5.0
$5.2
$5.4
$5.6
0
1,000
2,000
3,000
4,000
5,000M
on
th 1
Mo
nth
2
Mo
nth
3
Mo
nth
4
Mo
nth
5
Mo
nth
6
Mo
nth
7
Mo
nth
8
Mo
nth
9
Mo
nth
10
Mo
nth
11
Mo
nth
12
Ave
rage
Cu
sto
me
r sp
en
d
# o
f C
ust
om
ers
Year 1 Coffee Sales - Retail
# of Customers Average Customer Spend
$0
$5,000
$10,000
$15,000
$20,000
$25,000
$30,000
Mo
nth
1
Mo
nth
2
Mo
nth
3
Mo
nth
4
Mo
nth
5
Mo
nth
6
Mo
nth
7
Mo
nth
8
Mo
nth
9
Mo
nth
10
Mo
nth
11
Mo
nth
12
Tota
l Co
ffe
e S
ale
s -
Re
tail
Year 1 Coffee Sales - Retail
Income - Coffee Retail
$0
$100,000
$200,000
$300,000
$400,000
$500,000
Year
1
Year
2
Year
3
Year
4
Year
5
Year 1-5 Total Revenue
Revenue - Coffee Revenue - Music Instruments Revenue - Facility Rental
©Angel Business Advisors, Inc. Page 25 of 38
Year 1 Year 2 Year 3 Year 4 Year 5
Coffee Sales
COGS as % of Sales 30.0% 29.0% 28.0% 27.0% 26.0%
Instrument Sales / Rental
COGS as % of Sales 70.0% 69.0% 68.0% 67.0% 66.0%
Operating Expense
Labor Cost as % of Sales 20% 20.0% 20.0% 20.0% 20.0%
Rent, $ $42,000 $43,260 $44,558 $45,895 $47,271
Advertising Spend as % of Sales 10.0% 6.0% 5.0% 5.0% 5.0%
Electricity and Gas, $ $12,000 $12,360 $12,731 $13,113 $13,506
Telephone, $ $1,800 $1,854 $1,910 $1,967 $2,026
Equipment and Office Supplies as % of Sales
1.0% 1.0% 1.0% 1.0% 1.0%
Insurance, $ $2,400 $2,472 $2,546 $2,623 $2,701
Taxes and Licenses, $ $600 $618 $637 $656 $675
Discretionary Spend as % of Sales 1.0% 1.0% 1.1% 1.1% 1.1%
Bank & Merchant Fees as % of Sales
3.0% 3.1% 3.2% 3.3% 3.4%
Professional Fees, $ $1,200 $1,236 $1,273 $1,311 $1,351
Operating Expense Parameters
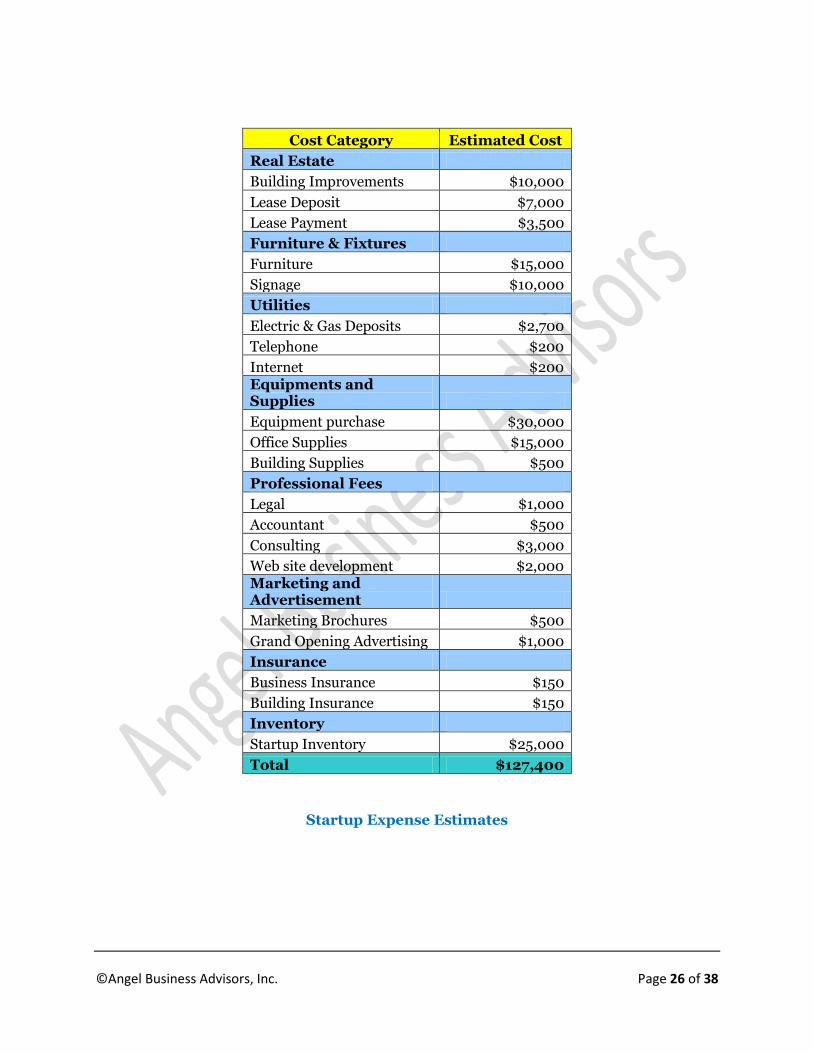
7.3 Startup Expense
Our initial estimate of the startup expense is $127,400 based on the following
assumptions. We expect this to be covered with owner’s equity investment of $50,000 as well as
loan we are seeking in the amount of $150,000.
©Angel Business Advisors, Inc. Page 26 of 38
Cost Category Estimated Cost
Real Estate
Building Improvements $10,000
Lease Deposit $7,000
Lease Payment $3,500
Furniture & Fixtures
Furniture $15,000
Signage $10,000
Utilities
Electric & Gas Deposits $2,700
Telephone $200
Internet $200 Equipments and Supplies
Equipment purchase $30,000
Office Supplies $15,000
Building Supplies $500
Professional Fees
Legal $1,000
Accountant $500
Consulting $3,000
Web site development $2,000 Marketing and Advertisement
Marketing Brochures $500
Grand Opening Advertising $1,000
Insurance
Business Insurance $150
Building Insurance $150
Inventory
Startup Inventory $25,000
Total $127,400
Startup Expense Estimates
©Angel Business Advisors, Inc. Page 27 of 38
7.4 Capital Expense
Of the $127,400 in startup expense we estimate that $70,000 will be for capital purchase
as shown below. The table also shows that we intend to spend additional $20,000 in year 2 and
$10,000 in year 3 towards capital purchase in terms of leasehold improvements and furniture /
fixtures.
Category Year 1 Year 2 Year 3
Leasehold Improvements $10,000 $10,000 $0
Furniture / Fixtures $15,000 $10,000 $10,000
Equipments $30,000 $0 $0
Computers, POS $15,000 $0 $0
Total $70,000 $20,000 $10,000
Capital Expense Estimates
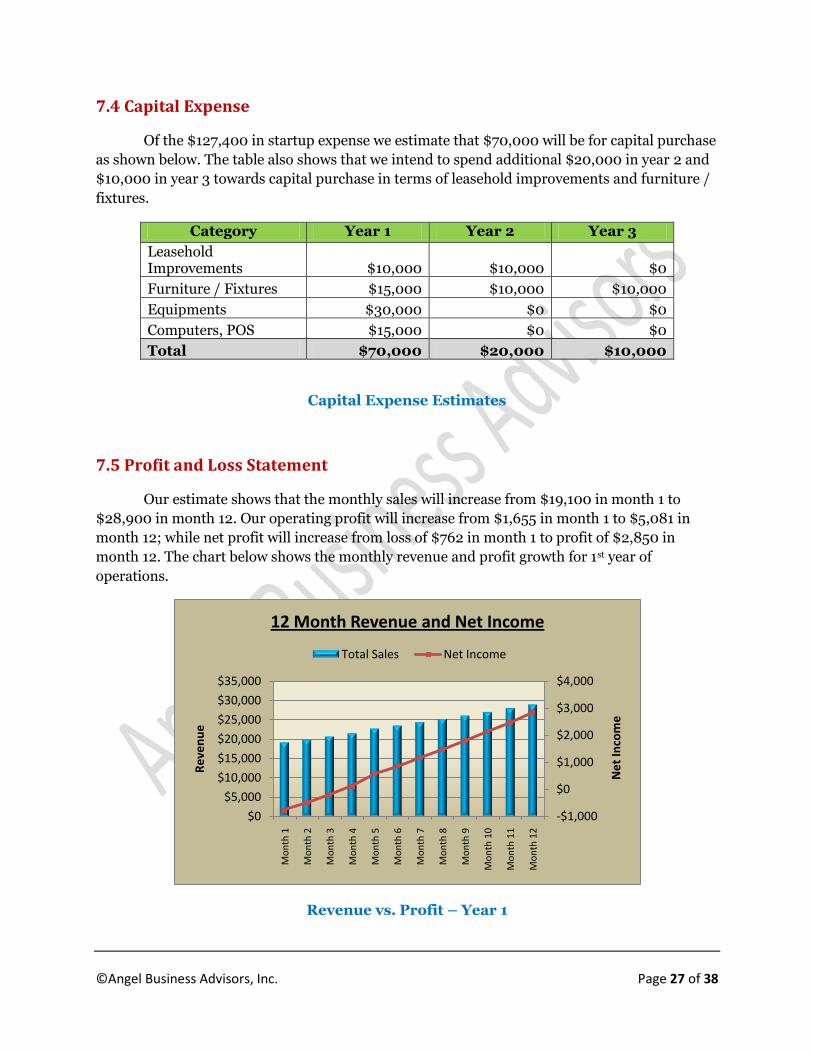
7.5 Profit and Loss Statement
Our estimate shows that the monthly sales will increase from $19,100 in month 1 to
$28,900 in month 12. Our operating profit will increase from $1,655 in month 1 to $5,081 in
month 12; while net profit will increase from loss of $762 in month 1 to profit of $2,850 in
month 12. The chart below shows the monthly revenue and profit growth for 1st year of
operations.
Revenue vs. Profit – Year 1
-$1,000
$0
$1,000
$2,000
$3,000
$4,000
$0
$5,000
$10,000
$15,000
$20,000
$25,000
$30,000
$35,000
Mo
nth
1
Mo
nth
2
Mo
nth
3
Mo
nth
4
Mo
nth
5
Mo
nth
6
Mo
nth
7
Mo
nth
8
Mo
nth
9
Mo
nth
10
Mo
nth
11
Mo
nth
12
Ne
t In
com
e
Re
ven
ue
12 Month Revenue and Net Income
Total Sales Net Income
©Angel Business Advisors, Inc. Page 28 of 38
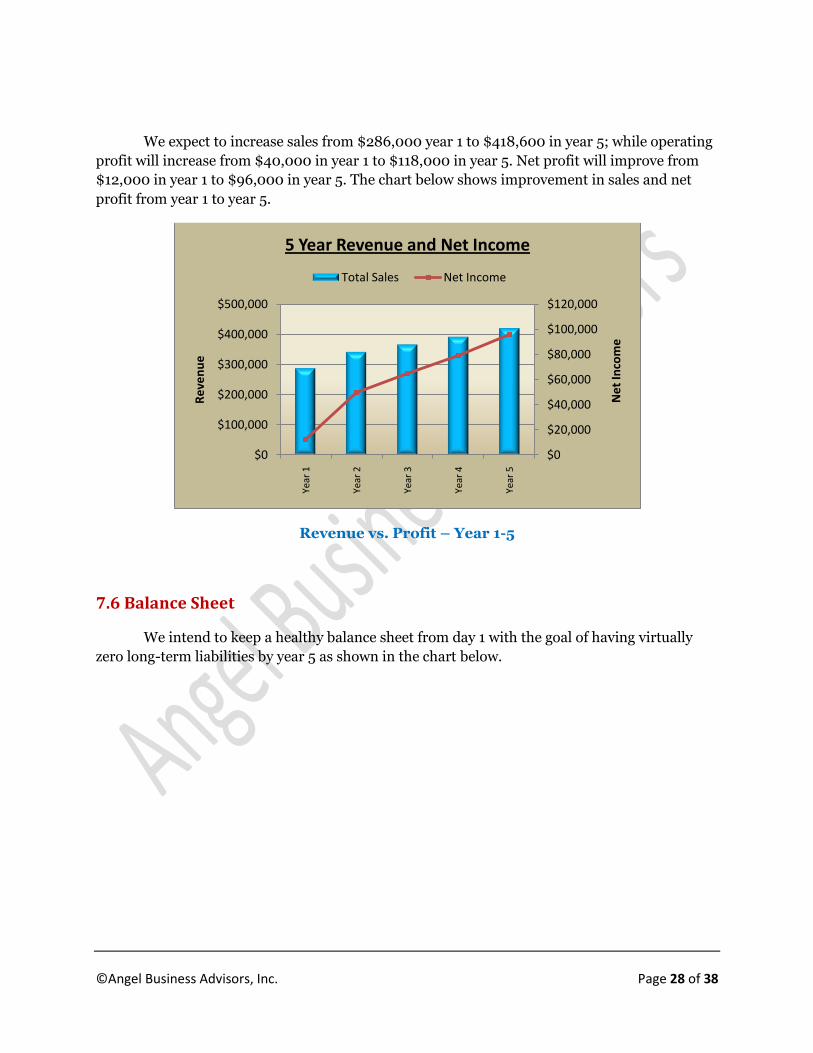
We expect to increase sales from $286,000 year 1 to $418,600 in year 5; while operating
profit will increase from $40,000 in year 1 to $118,000 in year 5. Net profit will improve from
$12,000 in year 1 to $96,000 in year 5. The chart below shows improvement in sales and net
profit from year 1 to year 5.
Revenue vs. Profit – Year 1-5
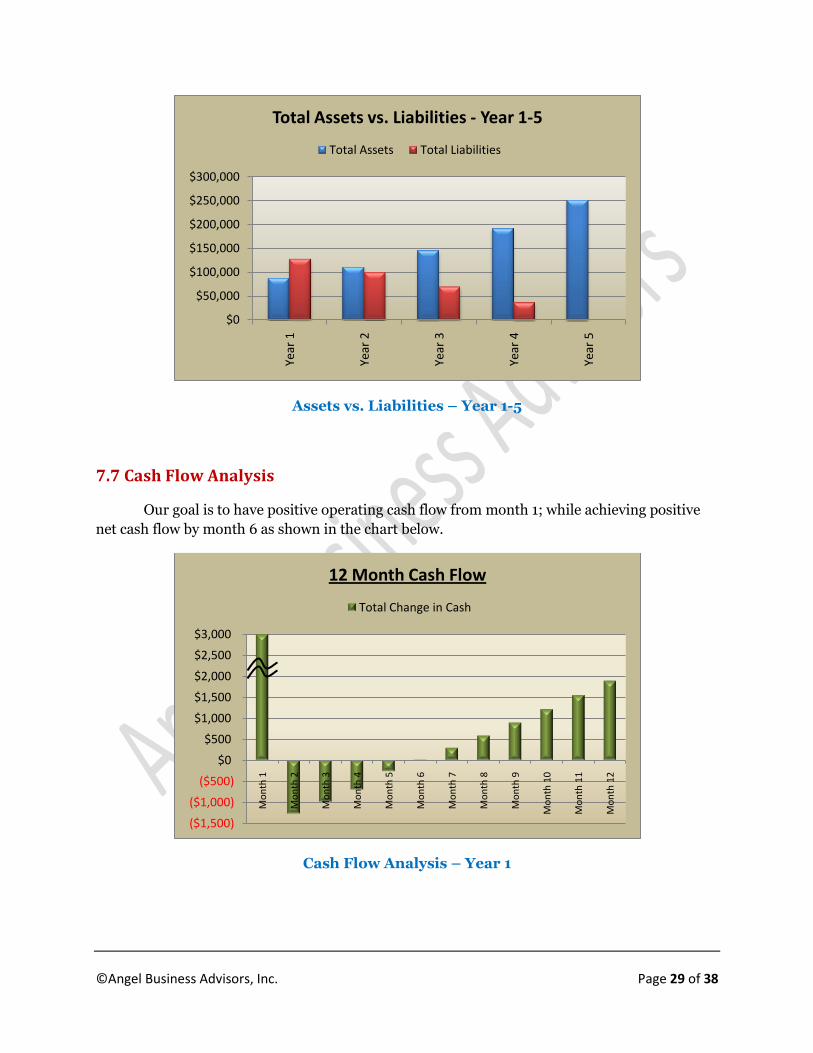
7.6 Balance Sheet
We intend to keep a healthy balance sheet from day 1 with the goal of having virtually
zero long-term liabilities by year 5 as shown in the chart below.
$0
$20,000
$40,000
$60,000
$80,000
$100,000
$120,000
$0
$100,000
$200,000
$300,000
$400,000
$500,000Ye
ar 1
Year
2
Year
3
Year
4
Year
5
Ne
t In
com
e
Re
ven
ue
5 Year Revenue and Net Income
Total Sales Net Income
©Angel Business Advisors, Inc. Page 29 of 38
Assets vs. Liabilities – Year 1-5
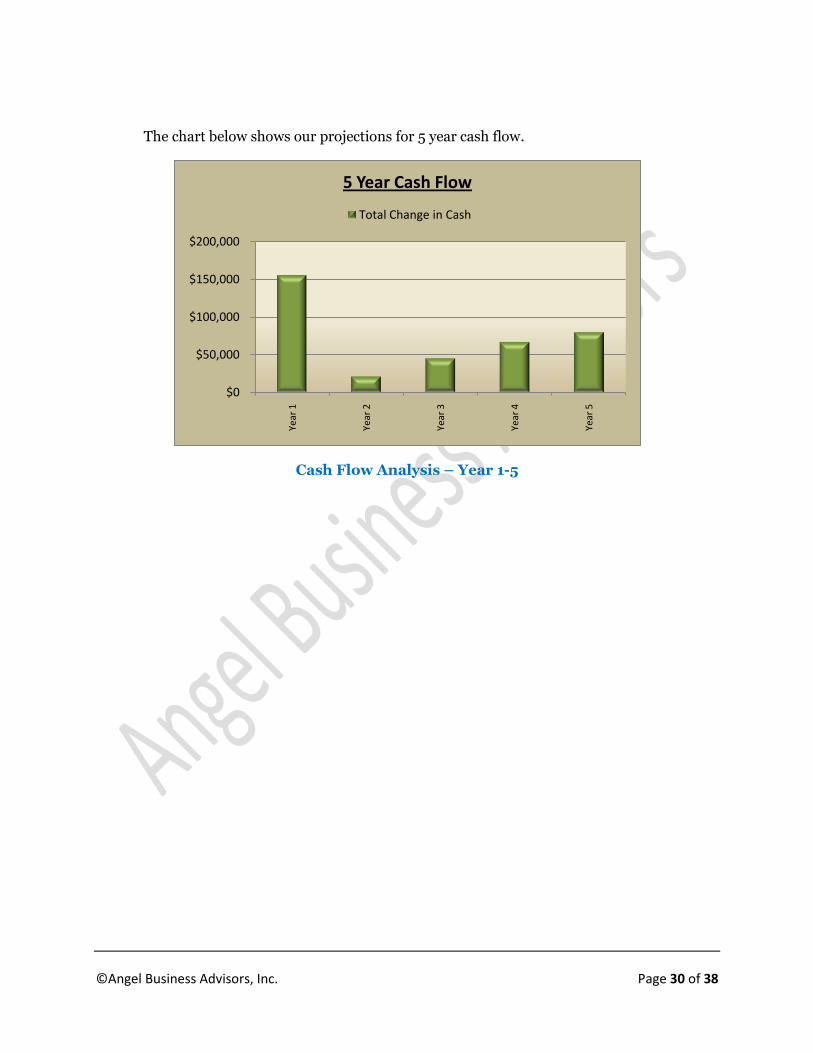
7.7 Cash Flow Analysis
Our goal is to have positive operating cash flow from month 1; while achieving positive
net cash flow by month 6 as shown in the chart below.
Cash Flow Analysis – Year 1
$0
$50,000
$100,000
$150,000
$200,000
$250,000
$300,000
Year
1
Year
2
Year
3
Year
4
Year
5
Total Assets vs. Liabilities - Year 1-5
Total Assets Total Liabilities
($1,500)
($1,000)
($500)
$0
$500
$1,000
$1,500
$2,000
$2,500
$3,000
Mo
nth
1
Mo
nth
2
Mo
nth
3
Mo
nth
4
Mo
nth
5
Mo
nth
6
Mo
nth
7
Mo
nth
8
Mo
nth
9
Mo
nth
10
Mo
nth
11
Mo
nth
12
12 Month Cash Flow
Total Change in Cash
©Angel Business Advisors, Inc. Page 30 of 38
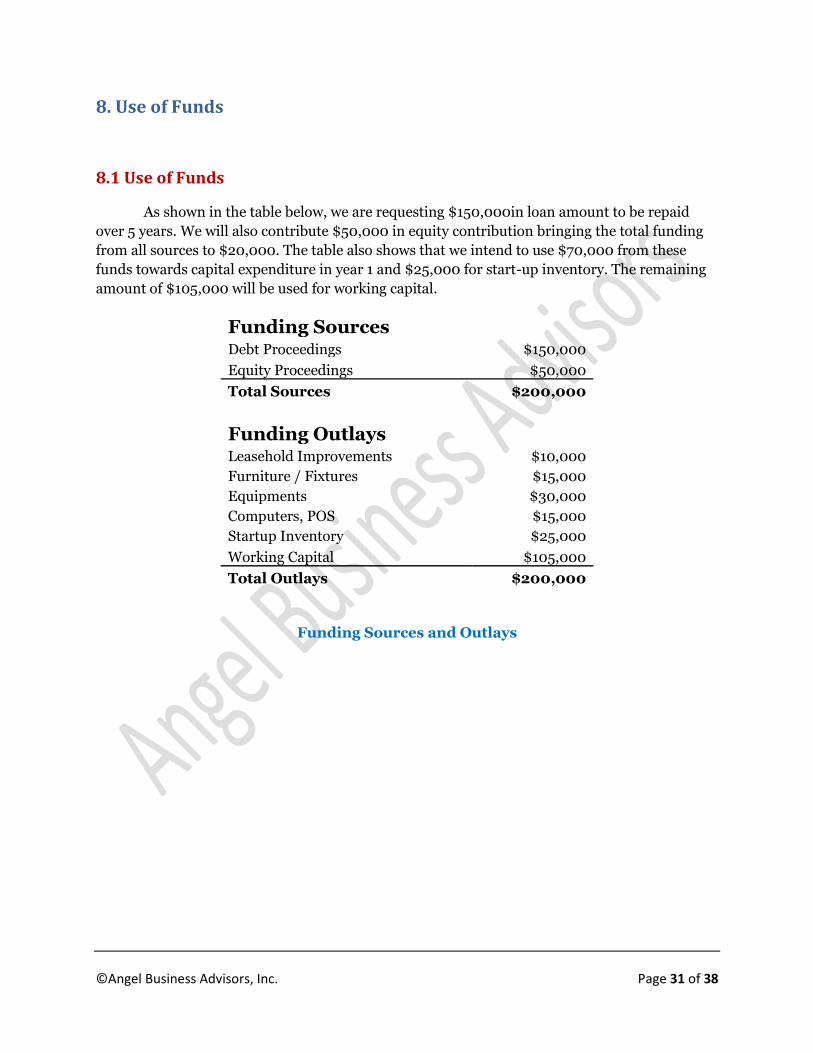
The chart below shows our projections for 5 year cash flow.
Cash Flow Analysis – Year 1-5
$0
$50,000
$100,000
$150,000
$200,000
Year
1
Year
2
Year
3
Year
4
Year
5
5 Year Cash Flow
Total Change in Cash
©Angel Business Advisors, Inc. Page 31 of 38
8. Use of Funds
8.1 Use of Funds
As shown in the table below, we are requesting $150,000in loan amount to be repaid
over 5 years. We will also contribute $50,000 in equity contribution bringing the total funding
from all sources to $20,000. The table also shows that we intend to use $70,000 from these
funds towards capital expenditure in year 1 and $25,000 for start-up inventory. The remaining
amount of $105,000 will be used for working capital.
Funding Sources Debt Proceedings $150,000
Equity Proceedings $50,000
Total Sources $200,000
Funding Outlays Leasehold Improvements $10,000
Furniture / Fixtures $15,000
Equipments $30,000
Computers, POS $15,000
Startup Inventory $25,000
Working Capital $105,000
Total Outlays $200,000
Funding Sources and Outlays
©Angel Business Advisors, Inc. Page 32 of 38
9. Debt Repayment Plan
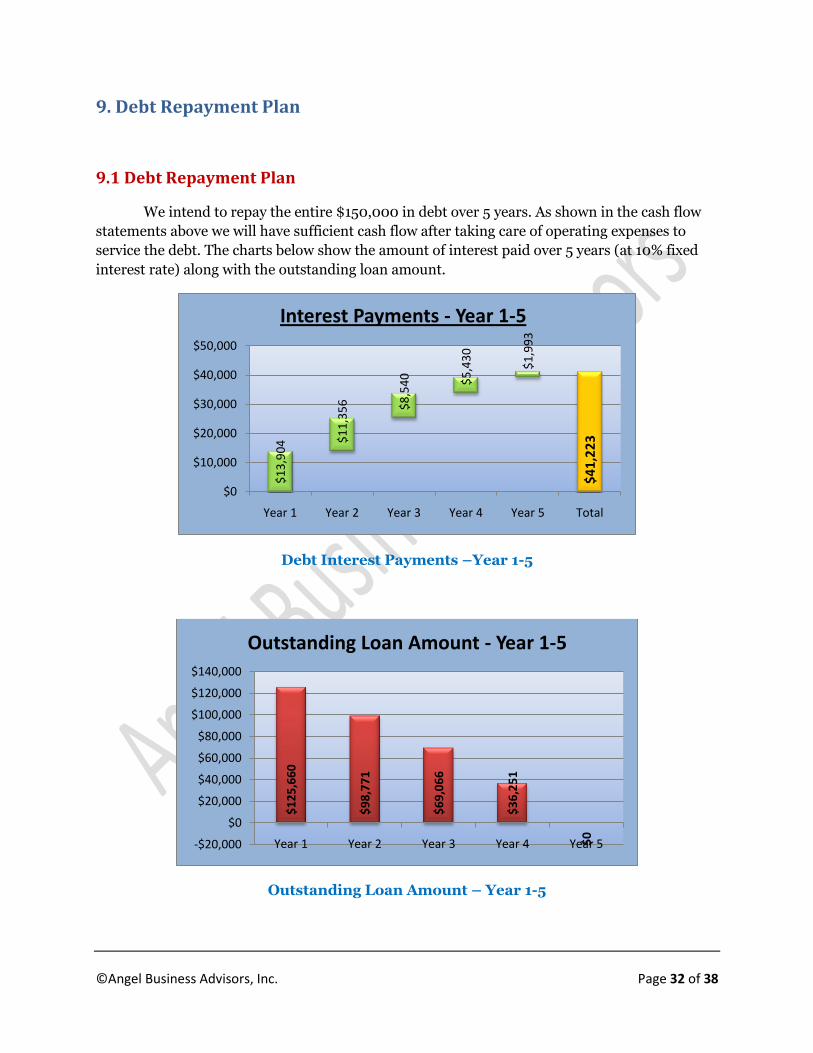
9.1 Debt Repayment Plan
We intend to repay the entire $150,000 in debt over 5 years. As shown in the cash flow
statements above we will have sufficient cash flow after taking care of operating expenses to
service the debt. The charts below show the amount of interest paid over 5 years (at 10% fixed
interest rate) along with the outstanding loan amount.
Debt Interest Payments –Year 1-5
Outstanding Loan Amount – Year 1-5
$1
3,9
04 $
11
,35
6 $8
,54
0 $5
,43
0
$1
,99
3
$4
1,2
23
$0
$10,000
$20,000
$30,000
$40,000
$50,000
Year 1 Year 2 Year 3 Year 4 Year 5 Total
Interest Payments - Year 1-5
$1
25
,66
0
$9
8,7
71
$6
9,0
66
$3
6,2
51
$0
-$20,000
$0
$20,000
$40,000
$60,000
$80,000
$100,000
$120,000
$140,000
Year 1 Year 2 Year 3 Year 4 Year 5
Outstanding Loan Amount - Year 1-5
©Angel Business Advisors, Inc. Page 33 of 38
10. Appendix
10.1 P&L Statement – Year 1
Mo
nth
1M
on
th 2
Mo
nth
3M
on
th 4
Mo
nth
5M
on
th 6
Mo
nth
7M
on
th 8
Mo
nth
9M
on
th 1
0M
on
th 1
1M
on
th 1
2
Sale
sC
off
ee
Sal
es
- R
eta
il$1
5,00
0$1
5,75
0$1
6,53
8$1
7,36
4$1
8,59
7$1
9,34
7$2
0,12
6$2
0,93
7$2
1,78
1$2
2,65
9$2
3,57
2$2
4,52
2
Co
ffe
e S
ale
s -
Cat
eri
ng
$700
$707
$714
$721
$728
$728
$728
$728
$728
$728
$728
$728
Inst
rum
en
t Sa
les
$1,5
00$1
,500
$1,5
00$1
,500
$1,5
00$1
,515
$1,5
30$1
,545
$1,5
61$1
,577
$1,5
92$1
,608
Inst
rum
en
t R
en
tal
$900
$900
$900
$900
$900
$909
$918
$927
$937
$946
$955
$965
Faci
lity
Re
nta
l$1
,000
$1,0
00$1
,000
$1,0
00$1
,000
$1,0
10$1
,020
$1,0
30$1
,041
$1,0
51$1
,062
$1,0
72
Tota
l Sal
es
$19,
100
$19,
857
$20,
652
$21,
486
$22,
726
$23,
509
$24,
323
$25,
169
$26,
048
$26,
961
$27,
910
$28,
896
CO
GS
Pu
rch
ase
Co
st -
Co
ffe
e$4
,710
$4,9
37$5
,175
$5,4
26$5
,798
$6,0
23$6
,256
$6,5
00$6
,753
$7,0
16$7
,290
$7,5
75
Pu
rch
ase
Co
st -
Mu
sic
Inst
rum
en
t$1
,050
$1,0
50$1
,050
$1,0
50$1
,050
$1,0
61$1
,071
$1,0
82$1
,093
$1,1
04$1
,115
$1,1
26
Tota
l CO
GS
$5,7
60$5
,987
$6,2
25$6
,476
$6,8
48$7
,083
$7,3
28$7
,582
$7,8
46$8
,120
$8,4
05$8
,701
Gro
ss P
rofi
t -
Co
ffe
e$1
0,99
0$1
1,52
0$1
2,07
6$1
2,66
0$1
3,52
8$1
4,05
3$1
4,59
8$1
5,16
6$1
5,75
7$1
6,37
1$1
7,01
0$1
7,67
5
Gro
ss P
rofi
t -
Mu
sic
Inst
rum
en
t Sa
les
$450
$450
$450
$450
$450
$455
$459
$464
$468
$473
$478
$482
Op
era
tin
g Ex
pe
nse
Lab
or
Co
st$3
,820
$3,9
71$4
,130
$4,2
97$4
,545
$4,7
02$4
,865
$5,0
34$5
,210
$5,3
92$5
,582
$5,7
79
Re
al E
stat
e$3
,500
$3,5
00$3
,500
$3,5
00$3
,500
$3,5
00$3
,500
$3,5
00$3
,500
$3,5
00$3
,500
$3,5
00
Mar
keti
ng
& A
dve
rtis
ing
$1,9
10$1
,986
$2,0
65$2
,149
$2,2
73$2
,351
$2,4
32$2
,517
$2,6
05$2
,696
$2,7
91$2
,890
Ele
ctri
city
an
d G
as$1
,000
$1,0
00$1
,000
$1,0
00$1
,000
$1,0
00$1
,000
$1,0
00$1
,000
$1,0
00$1
,000
$1,0
00
Tele
ph
on
e$1
50$1
50$1
50$1
50$1
50$1
50$1
50$1
50$1
50$1
50$1
50$1
50
Equ
ipm
en
t &
Off
ice
Su
pp
lie
s$1
91$1
99$2
07$2
15$2
27$2
35$2
43$2
52$2
60$2
70$2
79$2
89
Insu
ran
ce$2
00$2
00$2
00$2
00$2
00$2
00$2
00$2
00$2
00$2
00$2
00$2
00
Taxe
s an
d L
ice
nse
s$5
0$5
0$5
0$5
0$5
0$5
0$5
0$5
0$5
0$5
0$5
0$5
0
Dis
cre
tio
nar
y Ex
pe
nse
$191
$199
$207
$215
$227
$235
$243
$252
$260
$270
$279
$289
Ban
k &
Me
rch
ant
Fee
s$5
73$5
96$6
20$6
45$6
82$7
05$7
30$7
55$7
81$8
09$8
37$8
67
Pro
fess
ion
al F
ee
s$1
00$1
00$1
00$1
00$1
00$1
00$1
00$1
00$1
00$1
00$1
00$1
00
Tota
l - O
pe
rati
ng
Exp
en
se$1
1,68
5$1
1,95
0$1
2,22
8$1
2,52
0$1
2,95
4$1
3,22
8$1
3,51
3$1
3,80
9$1
4,11
7$1
4,43
6$1
4,76
8$1
5,11
4
Op
era
tin
g P
rofi
t$1
,655
$1,9
20$2
,198
$2,4
90$2
,924
$3,1
98$3
,482
$3,7
78$4
,085
$4,4
05$4
,737
$5,0
81
No
n-O
pe
rati
ng
Exp
en
seD
ep
reci
atio
n$1
,167
$1,1
67$1
,167
$1,1
67$1
,167
$1,1
67$1
,167
$1,1
67$1
,167
$1,1
67$1
,167
$1,1
67
Am
mo
rtiz
atio
n$0
$0$0
$0$0
$0$0
$0$0
$0$0
$0
Inte
rest
Exp
en
se$1
,250
$1,2
34$1
,218
$1,2
01$1
,185
$1,1
68$1
,151
$1,1
34$1
,117
$1,1
00$1
,082
$1,0
65
Tota
l - N
on
-Op
era
tin
g Ex
pe
nse
$2,4
17$2
,401
$2,3
84$2
,368
$2,3
51$2
,335
$2,3
18$2
,301
$2,2
84$2
,266
$2,2
49$2
,232
Ne
t In
com
e-$
762
-$48
1-$
186
$122
$573
$863
$1,1
65$1
,477
$1,8
02$2
,138
$2,4
88$2
,850
©Angel Business Advisors, Inc. Page 34 of 38
10.2 Balance Sheet – Year 1
Mo
nth
1M
on
th 2
Mo
nth
3M
on
th 4
Mo
nth
5M
on
th 6
Mo
nth
7M
on
th 8
Mo
nth
9M
on
th 1
0M
on
th 1
1M
on
th 1
2
Ass
ets
Cu
rre
nt
Ass
ets
Ca
sh a
nd
Ca
sh E
qu
iva
len
ts$
3,0
00
$1
,73
3$
74
4$
47
-$2
16
-$2
05
$9
0$
68
1$
1,5
80
$2
,79
7$
4,3
47
$6
,24
1
Sh
ort
-te
rm I
nv
est
me
nts
$0
$0
$0
$0
$0
$0
$0
$0
$0
$0
$0
$0
Ne
t R
ece
iva
ble
s$
0$
0$
0$
0$
0$
0$
0$
0$
0$
0$
0$
0
Inv
en
tory
$2
5,0
00
$2
5,0
00
$2
5,0
00
$2
5,0
00
$2
5,0
00
$2
5,0
00
$2
5,0
00
$2
5,0
00
$2
5,0
00
$2
5,0
00
$2
5,0
00
$2
5,0
00
Oth
er
Cu
rre
nt
Ass
ets
$0
$0
$0
$0
$0
$0
$0
$0
$0
$0
$0
To
tal
Cu
rre
nt
Ass
ets
$2
8,0
00
$2
6,7
33
$2
5,7
44
$2
5,0
47
$2
4,7
84
$2
4,7
95
$2
5,0
90
$2
5,6
81
$2
6,5
80
$2
7,7
97
$2
9,3
47
$3
1,2
41
No
n-c
urr
en
t A
sse
ts
Pro
pe
rty
an
d E
qu
ipm
en
ts$
68
,83
3$
67
,66
7$
66
,50
0$
65
,33
3$
64
,16
7$
63
,00
0$
61
,83
3$
60
,66
7$
59
,50
0$
58
,33
3$
57
,16
7$
56
,00
0
Inta
ng
ible
Ass
ets
$0
$0
$0
$0
$0
$0
$0
$0
$0
$0
$0
$0
Oth
er
No
n-C
urr
en
t A
sse
ts$
0$
0$
0$
0$
0$
0$
0$
0$
0$
0$
0$
0
To
tal
No
n-c
urr
en
t A
sse
ts$
68
,83
3$
67
,66
7$
66
,50
0$
65
,33
3$
64
,16
7$
63
,00
0$
61
,83
3$
60
,66
7$
59
,50
0$
58
,33
3$
57
,16
7$
56
,00
0
To
tal
Ass
ets
$9
6,8
33
$9
4,4
00
$9
2,2
44
$9
0,3
80
$8
8,9
50
$8
7,7
95
$8
6,9
23
$8
6,3
48
$8
6,0
80
$8
6,1
31
$8
6,5
14
$8
7,2
41
Lia
bil
itie
s a
nd
Eq
uit
yC
urr
en
t Li
ab
ilit
ies
Acc
ou
nts
Pa
ya
ble
$0
$0
$0
$0
$0
$0
$0
$0
$0
$0
$0
$0
Sh
ort
-te
rm B
orr
ow
ing
s$
0$
0$
0$
0$
0$
0$
0$
0$
0$
0$
0$
0
Oth
er
Cu
rre
nt
Lia
bil
itie
s$
0$
0$
0$
0$
0$
0$
0$
0$
0$
0$
0$
0
To
tal
Cu
rre
nt
Lia
bil
itie
s$
0$
0$
0$
0$
0$
0$
0$
0$
0$
0$
0$
0
No
n-c
urr
en
t Li
ab
ilit
ies
Loa
ns
Pa
ya
ble
$1
48
,06
3$
14
6,1
10
$1
44
,14
0$
14
2,1
54
$1
40
,15
2$
13
8,1
33
$1
36
,09
7$
13
4,0
44
$1
31
,97
4$
12
9,8
87
$1
27
,78
2$
12
7,7
82
Oth
er
No
n-C
urr
en
t Li
ab
ilit
ies
$0
$0
$0
$0
$0
$0
$0
$0
$0
$0
$0
$0
To
tal
No
n-c
urr
en
t Li
ab
ilit
ies
$1
48
,06
3$
14
6,1
10
$1
44
,14
0$
14
2,1
54
$1
40
,15
2$
13
8,1
33
$1
36
,09
7$
13
4,0
44
$1
31
,97
4$
12
9,8
87
$1
27
,78
2$
12
7,7
82
To
tal
Lia
bil
itie
s$
14
8,0
63
$1
46
,11
0$
14
4,1
40
$1
42
,15
4$
14
0,1
52
$1
38
,13
3$
13
6,0
97
$1
34
,04
4$
13
1,9
74
$1
29
,88
7$
12
7,7
82
$1
27
,78
2
Sh
are
ho
lde
r E
qu
ity
Pre
ferr
ed
Sto
ck$
0$
0$
0$
0$
0$
0$
0$
0$
0$
0$
0$
0
Co
mm
on
Sto
ck$
50
,00
0$
50
,00
0$
50
,00
0$
50
,00
0$
50
,00
0$
50
,00
0$
50
,00
0$
50
,00
0$
50
,00
0$
50
,00
0$
50
,00
0$
50
,00
0
Ad
dit
ion
al
Pa
id-i
n C
ap
ita
l$
0$
0$
0$
0$
0$
0$
0$
0$
0$
0$
0$
0
Re
tain
ed
Ea
rnin
gs
-$7
62
-$4
81
-$1
86
$1
22
$5
73
$8
63
$1
,16
5$
1,4
77
$1
,80
2$
2,1
38
$2
,48
8$
2,8
50
Ad
dit
ion
al
Sh
are
ho
lde
r E
qu
ity
-$1
00
,46
8-$
10
1,2
30
-$1
01
,71
0-$
10
1,8
96
-$1
01
,77
4-$
10
1,2
02
-$1
00
,33
8-$
99
,17
4-$
97
,69
6-$
95
,89
4-$
93
,75
6-$
93
,39
1
To
tal
Sh
are
ho
lde
r E
qu
ity
-$5
1,2
30
-$5
1,7
10
-$5
1,8
96
-$5
1,7
74
-$5
1,2
02
-$5
0,3
38
-$4
9,1
74
-$4
7,6
96
-$4
5,8
94
-$4
3,7
56
-$4
1,2
68
-$4
0,5
41
To
tal
Lia
bil
itie
s a
nd
Eq
uit
y$
96
,83
3$
94
,40
0$
92
,24
4$
90
,38
0$
88
,95
0$
87
,79
5$
86
,92
3$
86
,34
8$
86
,08
0$
86
,13
1$
86
,51
4$
87
,24
1
©Angel Business Advisors, Inc. Page 35 of 38
10.3 Cash Flow Statement – Year 1
Mo
nth
1M
on
th 2
Mo
nth
3M
on
th 4
Mo
nth
5M
on
th 6
Mo
nth
7M
on
th 8
Mo
nth
9M
on
th 1
0M
on
th 1
1M
on
th 1
2
Ope
rati
ng A
ctiv
itie
sN
et In
com
e($
762)
($48
1)($
186)
$122
$5
73
$863
$1
,165
$1
,477
$1
,802
$2
,138
$2
,488
$2
,850
Dep
reci
atio
n an
d A
mor
tiza
tion
$1,1
67
$1,1
67
$1,1
67
$1,1
67
$1,1
67
$1,1
67
$1,1
67
$1,1
67
$1,1
67
$1,1
67
$1,1
67
$1,1
67
Cha
nges
in A
ccou
nts
Rec
eiva
bles
$0
$0
$0
$0
$0
$0
$0
$0
$0
$0
$0
$0
Cha
nges
in L
iabi
litie
s$0
$0
$0
$0
$0
$0
$0
$0
$0
$0
$0
$0
Cha
nges
in In
vent
ory
($25
,000
)$0
$0
$0
$0
$0
$0
$0
$0
$0
$0
$0
Cha
nges
in O
ther
Ope
rati
ng A
ctiv
itie
s$0
$0
$0
$0
$0
$0
$0
$0
$0
$0
$0
$0
Tota
l Cas
h F
low
fro
m O
per
atin
g A
ctiv
itie
s($
24,5
95)
$686
$9
80
$1,2
89
$1,7
39
$2,0
30
$2,3
31
$2,6
44
$2,9
68
$3,3
05
$3,6
54
$4,0
17
Inve
stin
g A
ctiv
itie
sC
apit
al E
xpen
ditu
res
($70
,000
)$0
$0
$0
$0
$0
$0
$0
$0
$0
$0
$0
Inta
ngib
les
$0
$0
$0
$0
$0
$0
$0
$0
$0
$0
$0
$0
Tota
l Cas
h F
low
fro
m In
vest
ing
Act
ivit
ies
($70
,000
)$0
$0
$0
$0
$0
$0
$0
$0
$0
$0
$0
Fina
ncin
g A
ctiv
itie
sD
ebt
Proc
eedi
ngs
$150
,000
$0
$0
$0
$0
$0
$0
$0
$0
$0
$0
$0
Deb
t Pa
ymen
ts (
Prin
cipl
e)($
1,93
7)($
1,95
3)($
1,96
9)($
1,98
6)($
2,00
2)($
2,01
9)($
2,03
6)($
2,05
3)($
2,07
0)($
2,08
7)($
2,10
5)($
2,12
2)
Equi
ty P
roce
edin
gs$5
0,00
0 $0
$0
$0
$0
$0
$0
$0
$0
$0
$0
$0
Div
iden
ds P
aid
$0
$0
$0
$0
$0
$0
$0
$0
$0
$0
$0
$0
Tota
l Cas
h F
low
fro
m F
inan
cin
g A
ctiv
itie
s$1
98,0
63
($1,
953)
($1,
969)
($1,
986)
($2,
002)
($2,
019)
($2,
036)
($2,
053)
($2,
070)
($2,
087)
($2,
105)
($2,
122)
Tota
l Ch
ange
in C
ash
$3,0
00($
1,26
7)($
989)
($69
7)($
263)
$11
$295
$591
$898
$1,2
18$1
,550
$1,8
94
Ope
ning
Cas
h B
alan
ce$0
$3
,000
$1
,733
$7
44
$47
($21
6)($
205)
$90
$681
$1
,580
$2
,797
$4
,347
Endi
ng C
ash
Bal
ance
$3,0
00
$1,7
33
$744
$4
7 ($
216)
($20
5)$9
0 $6
81
$1,5
80
$2,7
97
$4,3
47
$6,2
41
©Angel Business Advisors, Inc. Page 36 of 38
10.4 P&L Statement – Year 1-5
Year 1 Year 2 Year 3 Year 4 Year 5
SalesCoffee Sales - Retail $236,194 $268,216 $290,076 $313,717 $339,285
Coffee Sales - Catering $8,670 $8,843 $9,108 $9,382 $9,663
Instrument Sales $18,429 $19,350 $20,317 $21,333 $22,400
Instrument Rental $11,057 $11,610 $12,190 $12,800 $13,440
Facility Rental $12,286 $32,654 $33,034 $33,425 $33,828
Total Sales $286,635 $340,674 $364,726 $390,657 $418,616
COGSPurchase Cost - Coffee $73,459 $80,347 $83,772 $87,237 $90,727
Purchase Cost - Music Instrument $12,900 $13,351 $13,816 $14,293 $14,784
Total COGS $86,359 $93,699 $97,587 $101,530 $105,511
Gross Profit - Coffee $171,405 $196,712 $215,413 $235,862 $258,222
Gross Profit - Music Instrument Sales $5,529 $5,998 $6,502 $7,040 $7,616
Operating ExpenseLabor Cost $57,327 $68,135 $72,945 $78,131 $83,723
Real Estate $42,000 $43,260 $44,558 $45,895 $47,271
Marketing & Advertising $28,664 $20,440 $18,236 $19,533 $20,931
Electricity and Gas $12,000 $12,360 $12,731 $13,113 $13,506
Telephone $1,800 $1,854 $1,910 $1,967 $2,026
Equipment & Office Supplies $2,866 $3,407 $3,647 $3,907 $4,186
Insurance $2,400 $2,472 $2,546 $2,623 $2,701
Taxes and Licenses $600 $618 $637 $656 $675
Discretionary Expense $2,866 $3,509 $3,869 $4,269 $4,712
Bank & Merchant Fees $8,599 $10,527 $11,608 $12,806 $14,135
Professional Fees $1,200 $1,236 $1,273 $1,311 $1,351
Total - Operating Expense $160,322 $167,818 $173,960 $184,210 $195,217
Operating Profit $39,954 $79,157 $93,178 $104,917 $117,888
Non-Operating ExpenseDepreciation $14,000 $18,000 $20,000 $20,000 $20,000
Ammortization $0 $0 $0 $0 $0
Interest Expense $13,904 $11,356 $8,540 $5,430 $1,993
Total - Non-Operating Expense $27,904 $29,356 $28,540 $25,430 $21,993
Net Income $12,049 $49,802 $64,638 $79,488 $95,895
©Angel Business Advisors, Inc. Page 37 of 38
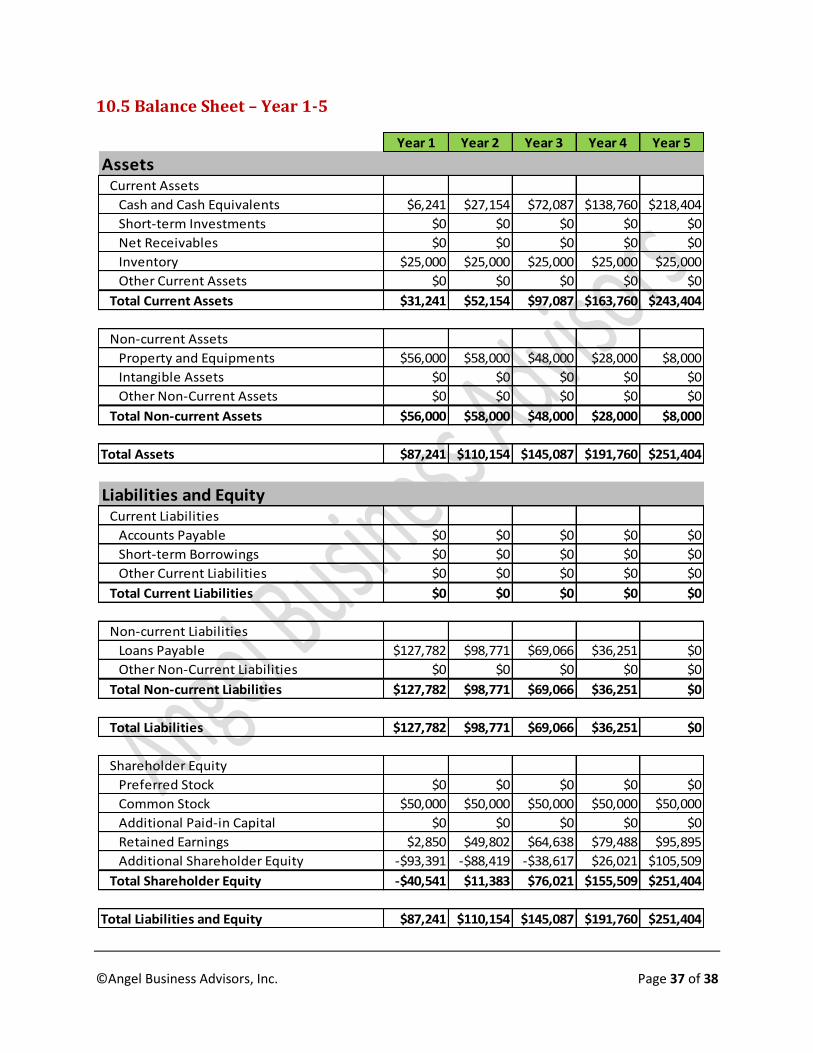
10.5 Balance Sheet – Year 1-5
Year 1 Year 2 Year 3 Year 4 Year 5
AssetsCurrent Assets
Cash and Cash Equivalents $6,241 $27,154 $72,087 $138,760 $218,404
Short-term Investments $0 $0 $0 $0 $0
Net Receivables $0 $0 $0 $0 $0
Inventory $25,000 $25,000 $25,000 $25,000 $25,000
Other Current Assets $0 $0 $0 $0 $0
Total Current Assets $31,241 $52,154 $97,087 $163,760 $243,404
Non-current Assets
Property and Equipments $56,000 $58,000 $48,000 $28,000 $8,000
Intangible Assets $0 $0 $0 $0 $0
Other Non-Current Assets $0 $0 $0 $0 $0
Total Non-current Assets $56,000 $58,000 $48,000 $28,000 $8,000
Total Assets $87,241 $110,154 $145,087 $191,760 $251,404
Liabilities and EquityCurrent Liabilities
Accounts Payable $0 $0 $0 $0 $0
Short-term Borrowings $0 $0 $0 $0 $0
Other Current Liabilities $0 $0 $0 $0 $0
Total Current Liabilities $0 $0 $0 $0 $0
Non-current Liabilities
Loans Payable $127,782 $98,771 $69,066 $36,251 $0
Other Non-Current Liabilities $0 $0 $0 $0 $0
Total Non-current Liabilities $127,782 $98,771 $69,066 $36,251 $0
Total Liabilities $127,782 $98,771 $69,066 $36,251 $0
Shareholder Equity
Preferred Stock $0 $0 $0 $0 $0
Common Stock $50,000 $50,000 $50,000 $50,000 $50,000
Additional Paid-in Capital $0 $0 $0 $0 $0
Retained Earnings $2,850 $49,802 $64,638 $79,488 $95,895
Additional Shareholder Equity -$93,391 -$88,419 -$38,617 $26,021 $105,509
Total Shareholder Equity -$40,541 $11,383 $76,021 $155,509 $251,404
Total Liabilities and Equity $87,241 $110,154 $145,087 $191,760 $251,404
©Angel Business Advisors, Inc. Page 38 of 38
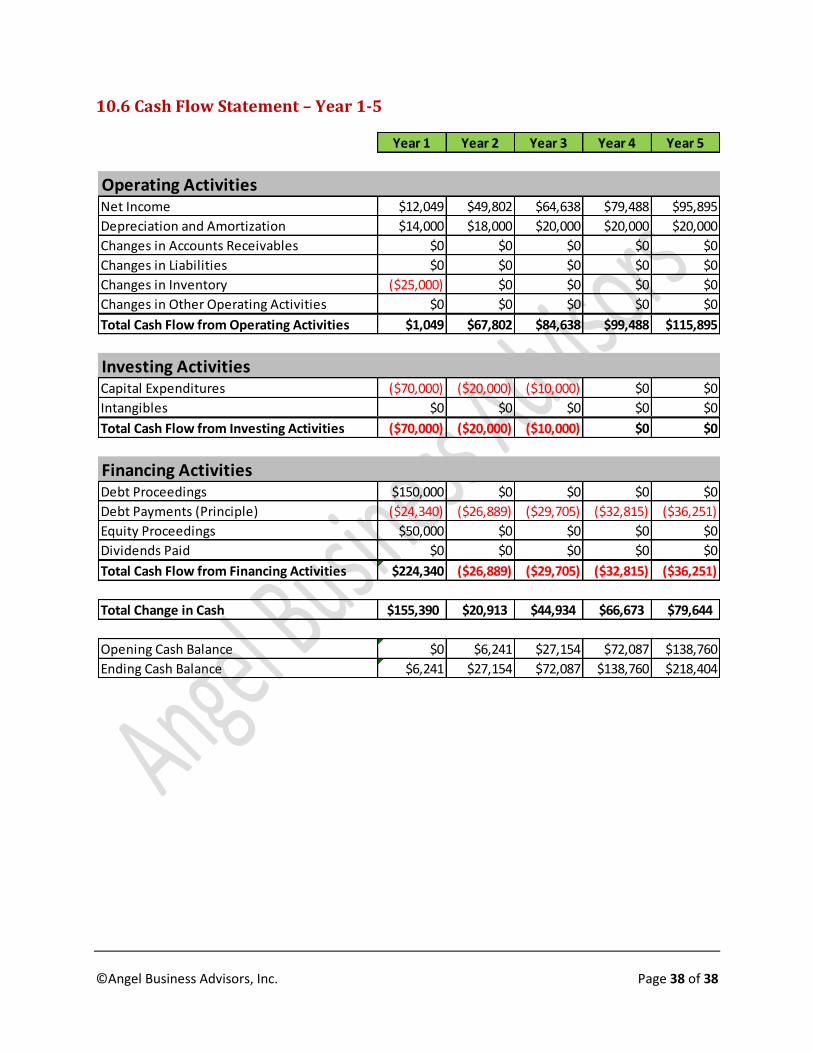
10.6 Cash Flow Statement – Year 1-5
Year 1 Year 2 Year 3 Year 4 Year 5
Operating ActivitiesNet Income $12,049 $49,802 $64,638 $79,488 $95,895
Depreciation and Amortization $14,000 $18,000 $20,000 $20,000 $20,000
Changes in Accounts Receivables $0 $0 $0 $0 $0
Changes in Liabilities $0 $0 $0 $0 $0
Changes in Inventory ($25,000) $0 $0 $0 $0
Changes in Other Operating Activities $0 $0 $0 $0 $0
Total Cash Flow from Operating Activities $1,049 $67,802 $84,638 $99,488 $115,895
Investing ActivitiesCapital Expenditures ($70,000) ($20,000) ($10,000) $0 $0
Intangibles $0 $0 $0 $0 $0
Total Cash Flow from Investing Activities ($70,000) ($20,000) ($10,000) $0 $0
Financing ActivitiesDebt Proceedings $150,000 $0 $0 $0 $0
Debt Payments (Principle) ($24,340) ($26,889) ($29,705) ($32,815) ($36,251)
Equity Proceedings $50,000 $0 $0 $0 $0
Dividends Paid $0 $0 $0 $0 $0
Total Cash Flow from Financing Activities $224,340 ($26,889) ($29,705) ($32,815) ($36,251)
Total Change in Cash $155,390 $20,913 $44,934 $66,673 $79,644
Opening Cash Balance $0 $6,241 $27,154 $72,087 $138,760
Ending Cash Balance $6,241 $27,154 $72,087 $138,760 $218,404