table of contents - the cmo survey · table of contents topic 1: marketplace dynamics overall...
TRANSCRIPT


Table of Contents
Topic 1: Marketplace Dynamics
Overall Economy and Company 1 Are you more or less optimistic about the U.S. economy compared to last quarter?
2 Rate your optimism about the U.S. economy on a scale from 0-100 with 0 being the least optimistic.
3 Are you more or less optimistic about your own company compared to last quarter?
4 Rate your optimism about your company on a scale from 0-100 with 0 being the least optimistic.
Customers and Competitors 5 Rank your customers’ top three priorities over the next 12 months.
6 Do you expect the following customer outcomes in the next 12 months to change?
7 Do you expect the following competitor outcomes in the next 12 months to change?
Topic 2: Firm Growth Strategies 8 Allocate 100 points to reflect your firm’s spending on growth strategies during the prior 12 months.
9 Allocate 100 points to reflect your firm’s spending on growth strategies during the next 12 months.
10 What percentage of your firm’s sales is domestic? Through the internet?
11 Which international market is your firm’s largest in terms of sales?
12 Which international market you are not in is your firm’s biggest opportunity for the future?
Topic 3: Marketing Spending 13 What is your company’s change in marketing spending during the next 12 months?
14 What percent of your marketing budget do you spend on mobile activities?
15 Marketing expenses account for what percent of your firm’s overall budget?
16 Marketing expenses account for what percent of your firm’s revenues?
17 What percent of your marketing budget does your firm spend on domestic markets?
Topic 4: Financial and Marketing Performance 18 Rate your firm’s performance during the last 12 months.
19 What is your firm’s goal for the next 12 months?
20 Rate the performance of your company’s mobile marketing activities.
21 Rate your company's marketing excellence.
Topic 5: Social Media 22 What percent of your marketing budget do you spend on social media?
23 How effectively is social media integrated with your firm’s marketing strategy?
24 How effectively does your company integrate customer information across purchasing, communication, and
social media channels?
25 What percent of your company's social media activities are performed by outside agencies?
26 Which best describes how you show the impact of social media on your business?
27 Social media metrics: Check all of the metrics your company uses to show the impact of social media?
28 Social media capabilities: How well has your company developed strong knowledge and skills in each area?
29 Social learning: Which approaches does your company use to learn about customers in social media or digital?
Topic 6: Marketing Jobs 30 By what percentage will your firm’s marketing hires change in the next year?
31 By what percentage will your firm's outsourcing of marketing activities change in the next year?
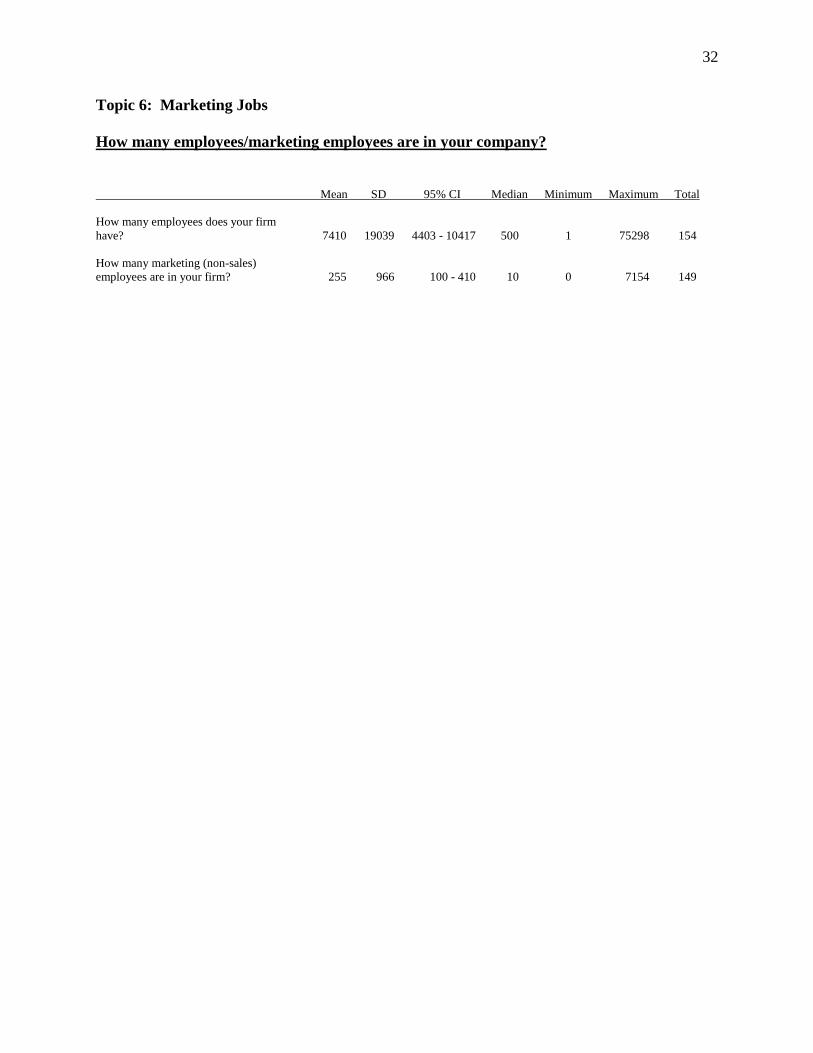
32 How many employees/marketing employees are in your company?

Topic 7: Marketing Organization 33 Select the description that best captures the role of sales within your firm.
34 Use of product and customer organizational structure in your firm.
Topic 8: Marketing Leadership 35 What is marketing primarily responsible for in your firm?
36 How many direct reports and indirect reports do you have?
37 How many years have you been with this firm in your current role? In any role?
Topic 9: Marketing Analytics 38 What percent of your marketing budget do you spend on marketing analytics?
39 In what percent of projects does your company use available or requested marketing analytics before a decision
is made?
40 To what degree has the use of marketing analytics contributed to your company's performance?
41 How is your company using marketing analytics to drive decision making?
42 Which best describes how your company shows the short-term impact of marketing spend on your business?
43 Which best describes how your company shows the long-term impact of marketing spend on your business?
Appendix: Firm-level Descriptive Information 44 Which is your primary economic sector?
45 Which industry sector best describes your firm?

1
Topic 1: Marketplace Dynamics - Overall Economy and Company
Are you more or less optimistic about the U.S. economy compared to last quarter?
Number Percent 95% CI
3=More 116 45.5 % ± 6.1 %
2=No Change 106 41.6 % ± 6.1 %
1=Less 33 12.9 % ± 4.1 %
Total 255 100.0 %
Mean = 2.33
SD = 0.69
Missing Cases = 2
Response Percent = 99.2 %
2
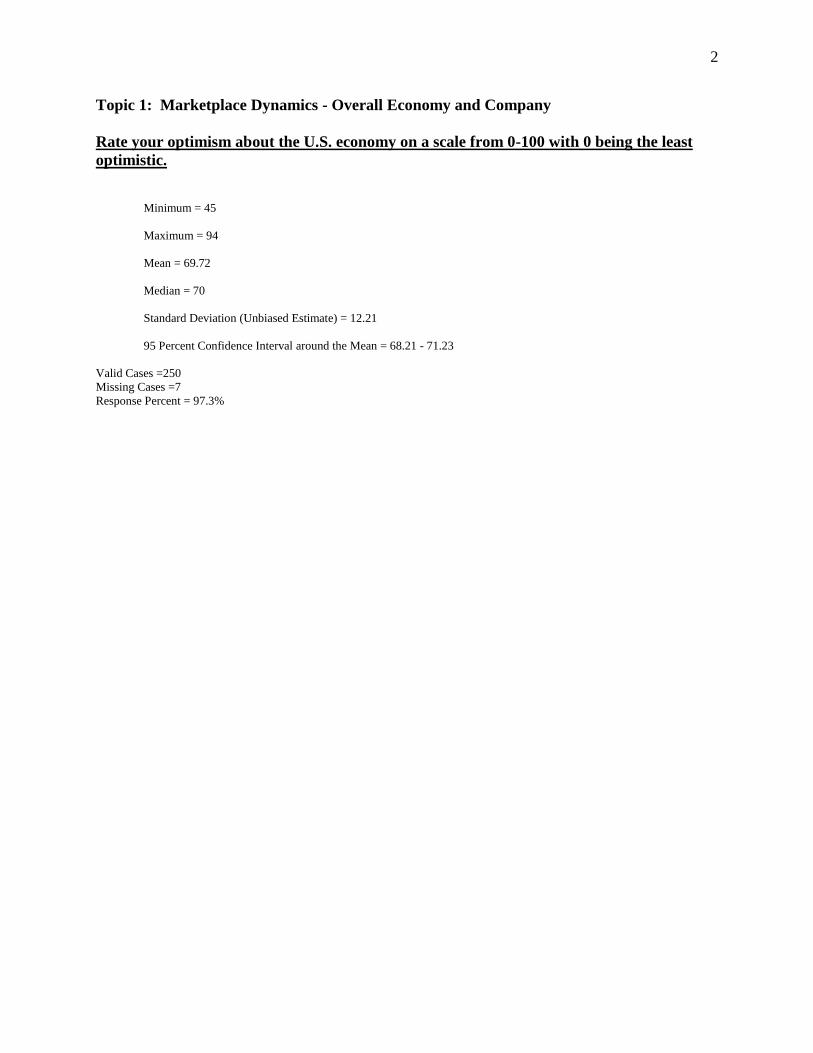
Topic 1: Marketplace Dynamics - Overall Economy and Company
Rate your optimism about the U.S. economy on a scale from 0-100 with 0 being the least
optimistic.
Minimum = 45
Maximum = 94
Mean = 69.72
Median = 70
Standard Deviation (Unbiased Estimate) = 12.21
95 Percent Confidence Interval around the Mean = 68.21 - 71.23
Valid Cases =250
Missing Cases =7
Response Percent = 97.3%

3
Topic 1: Marketplace Dynamics - Overall Economy and Company
Are you more or less optimistic about your own company compared to last quarter?
Number Percent 95% CI
3=More 139 56.0 % ± 6.1 %
2=No Change 65 26.2 % ± 5.4 %
1=Less 44 17.7 % ± 4.6 %
Total 248 100.0 %
Mean = 2.38
SD = 0.77
Missing Cases = 9
Response Percent = 96.5 %

4
Topic 1: Marketplace Dynamics - Overall Economy and Company
Rate your optimism about your company on a scale from 0-100 with 0 being the least
optimistic.
Minimum = 46
Maximum = 100
Mean = 75.40
Median = 75
Standard Deviation (Unbiased Estimate) = 14.14
95 Percent Confidence Interval around the Mean = 73.66 - 77.15
Valid Cases =253
Missing Cases =4
Response Percent = 98.4%

5
Topic 1: Marketplace Dynamics - Customers
Rank your customers' top three priorities (1, 2, 3) over the next 12 months, where 1 is most
important.
(N=235)
1st Priority 2nd Priority 3rd Priority
40 31 36
Low Price 17.0% 13.2% 15.3%
61 47 45
Superior Product Quality 26.0% 20.0% 19.1%
28 22 24
Superior Innovation 11.9% 9.4% 10.2%
56 76 46
Excellent Service 23.8% 32.3% 19.6%
43 46 48
Trusting Relationship 18.3% 19.6% 20.4%
7 14 36
Brand 3.0% 6.0% 15.3%

6
Topic 1: Marketplace Dynamics - Customers
Do you expect the following customer outcomes in the next 12 months to increase, decrease
or stay the same?
(N=257)
Mean & SD Increase No Change Decrease
+1 0 -1
0.62 160 58 15
Customer's purchase volume 0.60 68.7% 24.9% 6.4%
0.08 75 102 56
Customer's price per unit 0.75 32.2% 43.8% 24.0%
Customer will buy related products/ 0.54 132 95 6
services from my firm 0.55 56.7% 40.8% 2.6%
My firm's ability to retain current 0.41 111 107 16
customers 0.62 47.4% 45.7% 6.8%
The entry of new customers into this 0.33 111 89 34
market 0.72 47.4% 38.0% 14.5%
My firm's ability to acquire new 0.68 172 47 14
customers 0.58 73.8% 20.2% 6.0%

7
Topic 1: Marketplace Dynamics - Competitors
Do you expect the following customer outcomes in the next 12 months to increase, decrease
or stay the same?
(N=257)
Mean & SD Increase No Change Decrease
+1 0 -1
0.50 99 101 0
Emergence of new domestic competitors 0.50 49.5% 50.5% 0.0%
0.46 99 118 0
Emergence of new global competitors 0.50 45.6% 54.4% 0.0%
0.77 177 53 0
More intense rivalry for customers 0.42 77.0% 23.0% 0.0%
0.63 140 82 0
More competitor innovation 0.48 63.1% 36.9% 0.0%
0.66 148 75 0
More competitor price-cutting 0.47 66.4% 33.6% 0.0%
0.29 63 154 0
More cooperation on non-price strategies 0.45 29.0% 71.0% 0.0%

8
Topic 2: Firm Growth Strategies
Allocate 100 points to reflect your firm's spending in each of the four growth strategies
during the prior 12 months.
Mean SD 95% CI Median Minimum Maximum Total
Existing products or services in existing markets 56.8 24.6 53.3 - 60.3 60 0 100 191
Existing products or services in new markets 17.4 17.0 15.0 - 19.9 10 0 95 191
New products or services in existing markets 17.9 14.7 15.8 - 20.0 15 0 70 191
New products or services in new markets 7.8 10.2 6.4 - 9.3 5 0 70 191

9
Topic 2: Firm Growth Strategies
Allocate 100 points to reflect your firm's spending in each of the four growth strategies
during the next 12 months
Mean SD 95% CI Median Minimum Maximum Total
Existing products or services in existing markets 50.3 23.9 46.9 - 53.8 50 0 100 189
Existing products or services in new markets 18.1 15.0 16.0 - 20.3 15 0 75 189
New products or services in existing markets 20.8 15.9 18.5 - 23.1 20 0 95 189
New products or services in new markets 10.7 12.4 9.0 - 12.5 10 0 90 189

10
Topic 2: Firm Growth Strategies
What percentage of your firm's sales is domestic? Through the internet?
Mean SD 95% CI Median Minimum Maximum Total
What % of your firm's sales is through the Internet? 10.3 17.0 7.9 - 12.6 2 0 58 203
What % of your firm's sales is domestic? 81.0 23.4 77.8 - 84.2 90 30 100 205

11
Topic 2: Firm Growth Strategies
Which international market is your firm’s largest in terms of sales?
Number Percent 95% CI
Western Europe 43 41.0 % ± 9.5 %
Canada 16 15.2 % ± 6.9 %
China 14 13.3 % ± 6.6 %
Middle East 8 7.6 % ± 5.1 %
Japan 4 3.8 % ± 3.7 %
Indonesia and Southeast Asia 3 2.9 % ± 3.2 %
India 3 2.9 % ± 3.2 %
Mexico 2 1.9 % ± 2.6 %
Korea 2 1.9 % ± 2.6 %
Eastern Europe 2 1.9 % ± 2.6 %
Northern Europe 2 1.9 % ± 2.6 %
South America, not Brazil 2 1.9 % ± 2.6 %
Brazil 1 1.0 % ± 1.9 %
Central America 1 1.0 % ± 1.9 %
Australia/New Zealand 1 1.0 % ± 1.9 %
Russia 1 1.0 % ± 1.9 %
Total 105 100.0 %
Missing Cases = 1
Response Percent = 99.1 %

12
Topic 2: Firm Growth Strategies
Which international market you are not in is your firm’s biggest opportunity for the
future?
Number Percent 95% CI
China 21 19.3 % ± 6.3 %
Western Europe 15 13.8 % ± 5.4 %
South America, not Brazil 9 8.3 % ± 4.3 %
Indonesia and Southeast Asia 8 7.3 % ± 4.1 %
Brazil 6 5.5 % ± 3.6 %
Canada 6 5.5 % ± 3.6 %
Mexico 6 5.5 % ± 3.6 %
Eastern Europe 5 4.6 % ± 3.3 %
Central America 5 4.6 % ± 3.3 %
Middle East 5 4.6 % ± 3.3 %
Australia/New Zealand 5 4.6 % ± 3.3 %
India 5 4.6 % ± 3.3 %
Northern Europe 3 2.8 % ± 2.5 %
Korea 3 2.8 % ± 2.5 %
South Africa 2 1.8 % ± 2.1 %
Russia 2 1.8 % ± 2.1 %
Taiwan 2 1.8 % ± 2.1 %
Japan 1 0.9 % ± 1.5 %
Total 109 100.0 %
Missing Cases = 25
Response Percent = 81.3 %
13
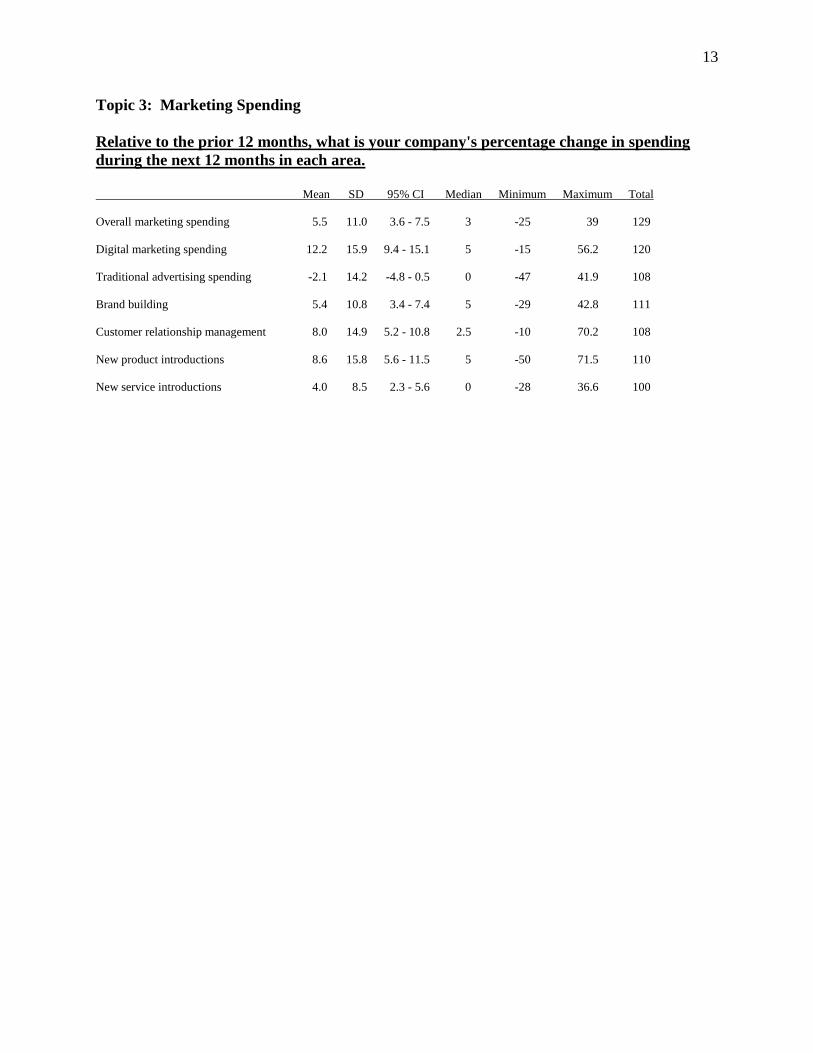
Topic 3: Marketing Spending
Relative to the prior 12 months, what is your company's percentage change in spending
during the next 12 months in each area.
Mean SD 95% CI Median Minimum Maximum Total
Overall marketing spending 5.5 11.0 3.6 - 7.5 3 -25 39 129
Digital marketing spending 12.2 15.9 9.4 - 15.1 5 -15 56.2 120
Traditional advertising spending -2.1 14.2 -4.8 - 0.5 0 -47 41.9 108
Brand building 5.4 10.8 3.4 - 7.4 5 -29 42.8 111
Customer relationship management 8.0 14.9 5.2 - 10.8 2.5 -10 70.2 108
New product introductions 8.6 15.8 5.6 - 11.5 5 -50 71.5 110
New service introductions 4.0 8.5 2.3 - 5.6 0 -28 36.6 100

14
Topic 3: Marketing Spending
What percent of your marketing budget do you spend on mobile activities?
Mean SD 95% CI Median Minimum Maximum Total
What percent of your marketing budget do
you currently spend on mobile activities? 6.0 7.8 4.8 - 7.2 5 0 27 172
What percent will you spend on mobile
activities in three years? 15.6 13.6 13.5 - 17.6 10 0 48 171

15
Topic 3: Marketing Spending
Marketing expenses account for what percent of your firm's overall budget?
Percent of budget
Minimum = 0
Maximum = 39
Mean = 11.44
Median = 8
Standard Deviation (Unbiased Estimate) = 10.63
95 Percent Confidence Interval around the Mean = 9.69 - 13.20
Valid Cases =141
Missing Cases =116
Response Percent = 54.9%

16
Topic 3: Marketing Spending
Marketing expenses account for what percent of your firm's revenues?
Percent of revenues
Minimum = 0
Maximum = 28
Mean = 6.61
Median = 5
Standard Deviation (Unbiased Estimate) = 7.06
95 Percent Confidence Interval around the Mean = 5.47 - 7.75
Valid Cases =146
Missing Cases =111
Response Percent = 56.8%

17
Topic 3: Marketing Spending
What percent of your marketing budget does your firm spend on domestic markets?
Minimum = 13
Maximum = 100
Mean = 72.79
Median = 80
Standard Deviation (Unbiased Estimate) = 28.42
95 Percent Confidence Interval around the Mean = 67.93 - 77.66
Valid Cases =131
Missing Cases =126
Response Percent = 51.0%

18
Topic 4: Financial and Marketing Performance
Rate your firm's performance during the last 12 months
Mean &
SD -10% -7% -5% -3% -1% 0 +1% +3% +5% +7% +10%
Market 2.14 4 0 4 4 9 26 22 21 23 1 15 share 4.23 3.1% 0.0% 3.1% 3.1% 7.0% 20.2% 17.1% 16.3% 17.8% 0.8% 11.6%
Sales 3.84 8 2 1 8 3 10 10 30 22 4 43 revenue 5.50 5.7% 1.4% 0.7% 5.7% 2.1% 7.1% 7.1% 21.3% 15.6% 2.8% 30.5%
Marketing 2.83 2 0 1 1 2 31 14 20 15 4 15 ROI 4.00 1.9% 0.0% 1.0% 1.0% 1.9% 29.5% 13.3% 19.0% 14.3% 3.8% 14.3%
3.11 9 0 7 3 3 19 12 23 13 7 35
Profits 5.70 6.9% 0.0% 5.3% 2.3% 2.3% 14.5% 9.2% 17.6% 9.9% 5.3% 26.7%
Customer 2.87 1 2 1 4 4 28 23 25 12 6 21 acquisition 4.14 0.8% 1.6% 0.8% 3.1% 3.1% 22.0% 18.1% 19.7% 9.4% 4.7% 16.5%
Customer 1.70 3 1 2 9 9 35 19 13 13 4 14 retention 4.26 2.5% 0.8% 1.6% 7.4% 7.4% 28.7% 15.6% 10.7% 10.7% 3.3% 11.5%
2.77 3 0 0 1 2 33 15 16 17 3 16
Brand value 4.17 2.8% 0.0% 0.0% 0.9% 1.9% 31.1% 14.2% 15.1% 16.0% 2.8% 15.1%

19
Topic 4: Financial and Marketing Performance
What is your firm's goal for the next 12 months?
Mean &
SD -10% -7% -5% -3% -1% 0 +1% +3% +5% +7% +10%
4.33 0 1 0 0 0 11 21 35 26 8 24
Market share 3.43 0.0% 0.8% 0.0% 0.0% 0.0% 8.7% 16.7% 27.8% 20.6% 6.3% 19.0%
6.41 0 1 1 1 0 7 9 18 27 14 61
Sales revenue 3.81 0.0% 0.7% 0.7% 0.7% 0.0% 5.0% 6.5% 12.9% 19.4% 10.1% 43.9%
4.62 0 1 0 0 1 16 9 20 25 5 25
Marketing ROI 3.77 0.0% 1.0% 0.0% 0.0% 1.0% 15.7% 8.8% 19.6% 24.5% 4.9% 24.5%
5.61 0 2 2 2 0 9 8 13 36 13 43
Profits 4.07 0.0% 1.6% 1.6% 1.6% 0.0% 7.0% 6.3% 10.2% 28.1% 10.2% 33.6%
Customer 5.31 0 0 0 0 0 6 17 26 33 7 35
acquisition 3.39 0.0% 0.0% 0.0% 0.0% 0.0% 4.8% 13.7% 21.0% 26.6% 5.6% 28.2%
Customer 3.70 0 0 2 2 1 23 16 21 28 5 20
retention 3.70 0.0% 0.0% 1.7% 1.7% 0.8% 19.5% 13.6% 17.8% 23.7% 4.2% 16.9%
5.01 1 0 0 0 0 12 9 18 28 9 26
Brand value 3.74 1.0% 0.0% 0.0% 0.0% 0.0% 11.7% 8.7% 17.5% 27.2% 8.7% 25.2%
20
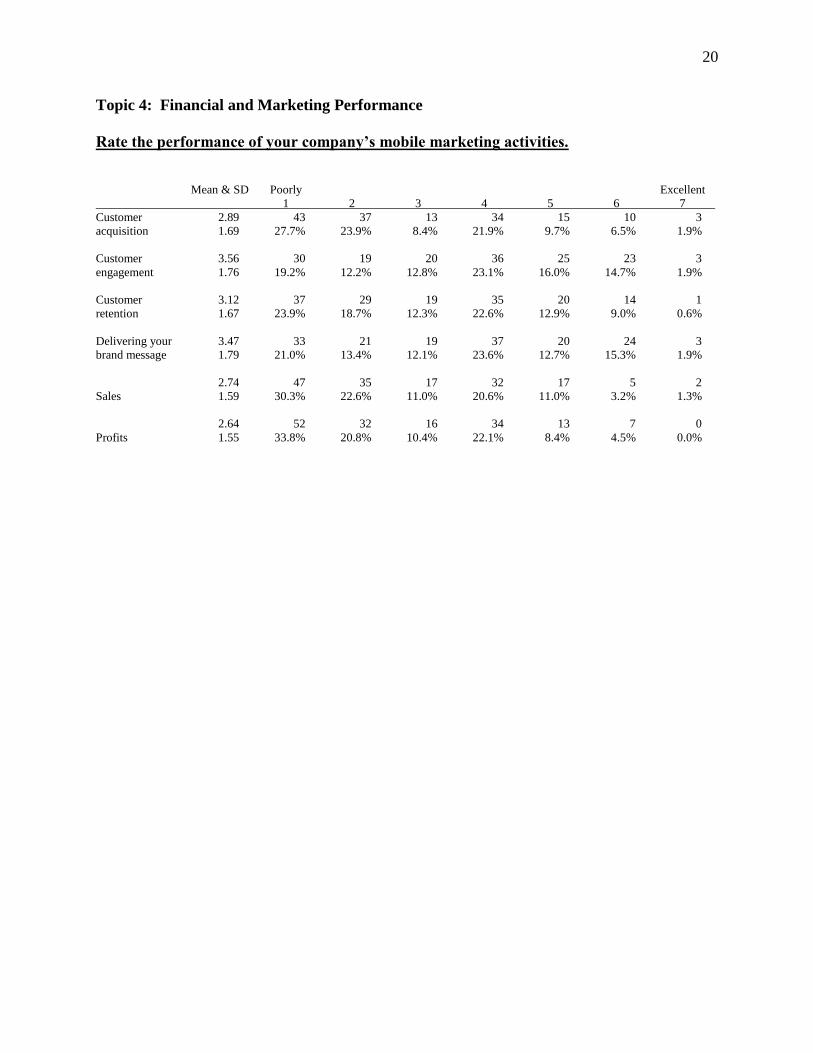
Topic 4: Financial and Marketing Performance
Rate the performance of your company’s mobile marketing activities.
Mean & SD Poorly Excellent
1 2 3 4 5 6 7
Customer 2.89 43 37 13 34 15 10 3
acquisition 1.69 27.7% 23.9% 8.4% 21.9% 9.7% 6.5% 1.9%
Customer 3.56 30 19 20 36 25 23 3
engagement 1.76 19.2% 12.2% 12.8% 23.1% 16.0% 14.7% 1.9%
Customer 3.12 37 29 19 35 20 14 1
retention 1.67 23.9% 18.7% 12.3% 22.6% 12.9% 9.0% 0.6%
Delivering your 3.47 33 21 19 37 20 24 3
brand message 1.79 21.0% 13.4% 12.1% 23.6% 12.7% 15.3% 1.9%
2.74 47 35 17 32 17 5 2
Sales 1.59 30.3% 22.6% 11.0% 20.6% 11.0% 3.2% 1.3%
2.64 52 32 16 34 13 7 0
Profits 1.55 33.8% 20.8% 10.4% 22.1% 8.4% 4.5% 0.0%
21
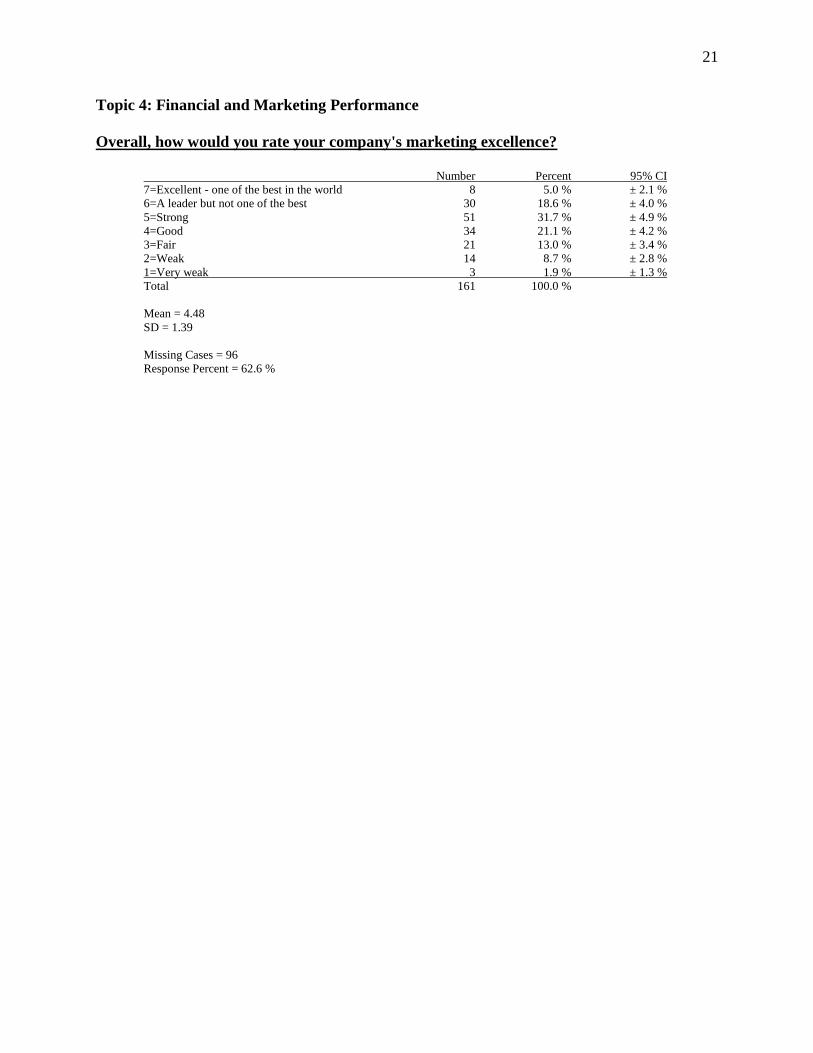
Topic 4: Financial and Marketing Performance
Overall, how would you rate your company's marketing excellence?
Number Percent 95% CI
7=Excellent - one of the best in the world 8 5.0 % ± 2.1 %
6=A leader but not one of the best 30 18.6 % ± 4.0 %
5=Strong 51 31.7 % ± 4.9 %
4=Good 34 21.1 % ± 4.2 %
3=Fair 21 13.0 % ± 3.4 %
2=Weak 14 8.7 % ± 2.8 %
1=Very weak 3 1.9 % ± 1.3 %
Total 161 100.0 %
Mean = 4.48
SD = 1.39
Missing Cases = 96
Response Percent = 62.6 %

22
Topic 5: Social Media
What percent of your marketing budget do you spend on social media?
Mean SD 95% CI Median Total
...of your marketing budget do you currently spend on social media? 10.7 11.3 9.1 - 12.3 10 192
...will you spend in the next 12 months? 14.0 13.0 12.2 - 15.9 10 191
...do you predict you will spend in five years? 23.8 17.8 21.2 - 26.3 20 188
23
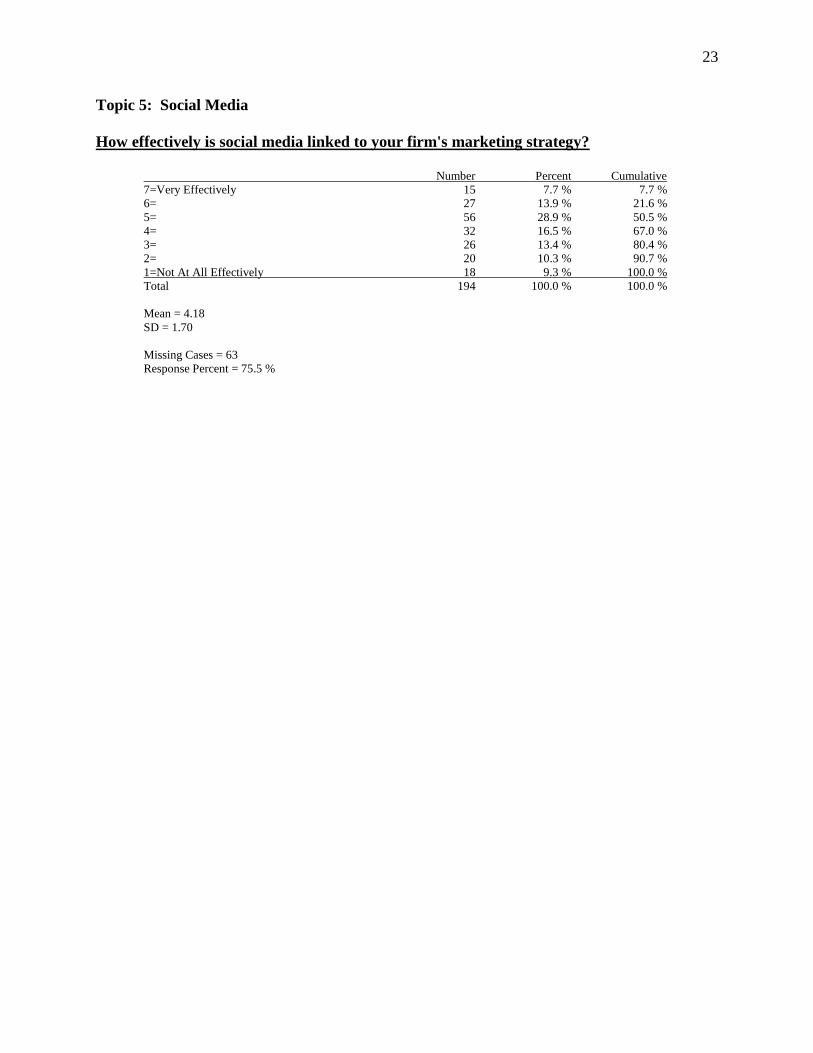
Topic 5: Social Media
How effectively is social media linked to your firm's marketing strategy?
Number Percent Cumulative
7=Very Effectively 15 7.7 % 7.7 %
6= 27 13.9 % 21.6 %
5= 56 28.9 % 50.5 %
4= 32 16.5 % 67.0 %
3= 26 13.4 % 80.4 %
2= 20 10.3 % 90.7 %
1=Not At All Effectively 18 9.3 % 100.0 %
Total 194 100.0 % 100.0 %
Mean = 4.18
SD = 1.70
Missing Cases = 63
Response Percent = 75.5 %

24
Topic 5: Social Media
How effectively does your company integrate customer information across purchasing,
communication and social media channels?
Number Percent 95% CI
1=Not At All Effectively 21 11.1 % ± 3.4 %
2= 28 14.7 % ± 3.8 %
3= 40 21.1 % ± 4.5 %
4= 42 22.1 % ± 4.6 %
5= 39 20.5 % ± 4.4 %
6= 16 8.4 % ± 3.0 %
7=Very Effectively 4 2.1 % ± 1.5 %
Total 190 100.0 %
Mean = 3.60
SD = 1.54
Missing Cases = 67
Response Percent = 73.9 %
25
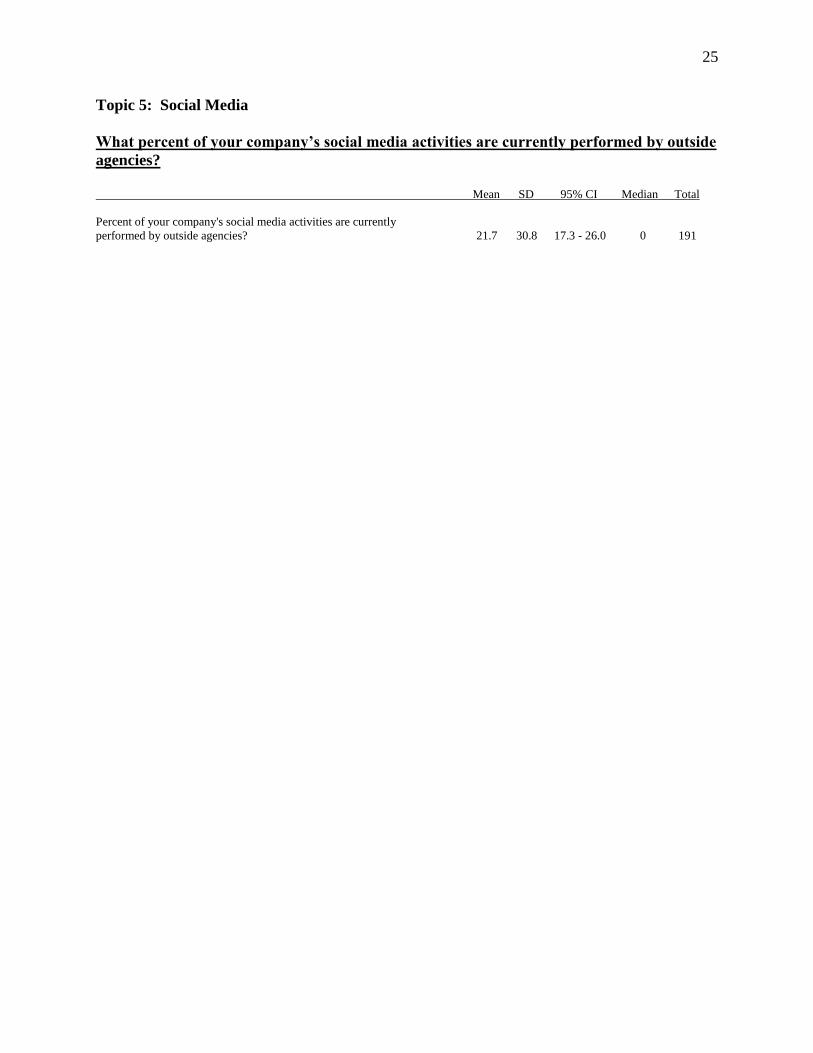
Topic 5: Social Media
What percent of your company’s social media activities are currently performed by outside
agencies?
Mean SD 95% CI Median Total
Percent of your company's social media activities are currently
performed by outside agencies? 21.7 30.8 17.3 - 26.0 0 191

26
Topic 5: Social Media
Which best describes how you show the impact of social media on your business?
Number Percent 95% CI
We have proven the impact quantitatively 29 15.0 % ± 3.9 %
We have a good qualitative sense of the impact,
but not a quantitative impact 84 43.5 % ± 5.8 %
We haven't been able to show the impact yet 80 41.5 % ± 5.7 %
Total 193 100.0 %
Missing Cases = 64
Response Percent = 75.1 %

27
Topic 5: Social Media
Which metrics does your company use to show the impact of social media? (Check all that
apply)
Number Percent 95% CI
Hits/visits/page views 155 60.3 % ± 6.0 %
Site traffic 132 51.4 % ± 6.2 %
Clickthrough rates 123 47.9 % ± 6.2 %
Number of friends, followers, and likes 121 47.1 % ± 6.2 %
Conversion rates (whether a visitor is converted to a buyer) 74 28.8 % ± 5.6 %
Search volume (the number of people searching for your brand) 73 28.4 % ± 5.6 %
Repeat visits 65 25.3 % ± 5.4 %
Social influence of friends, followers, and likes 61 23.7 % ± 5.3 %
Buzz indicators (web mentions) 55 21.4 % ± 5.1 %
Virality (extent to which your content/links are shared) 49 19.1 % ± 4.8 %
Brand sentiment ratings 43 16.7 % ± 4.6 %
Share of voice (compares your firm to competitors on mentions) 41 16.0 % ± 4.5 %
Net promoter score 41 16.0 % ± 4.5 %
Number of inbound links 40 15.6 % ± 4.5 %
Revenue per customer 40 15.6 % ± 4.5 %
App download 38 14.8 % ± 4.4 %
Sales levels 36 14.0 % ± 4.3 %
Customer acquisition costs 32 12.5 % ± 4.1 %
Online product/service ratings 28 10.9 % ± 3.8 %
Metrics using analysis of online text 25 9.7 % ± 3.7 %
Profits per customer 17 6.6 % ± 3.1 %
Customer retention costs 16 6.2 % ± 3.0 %
Abandoned shopping carts 15 5.8 % ± 2.9 %
Total 1320
Number of Cases = 257
Number of Responses = 1320
Average Number of Responses Per Case = 5.1
Number of Cases with at least one Response = 180
Response Percent = 70.0 %
28
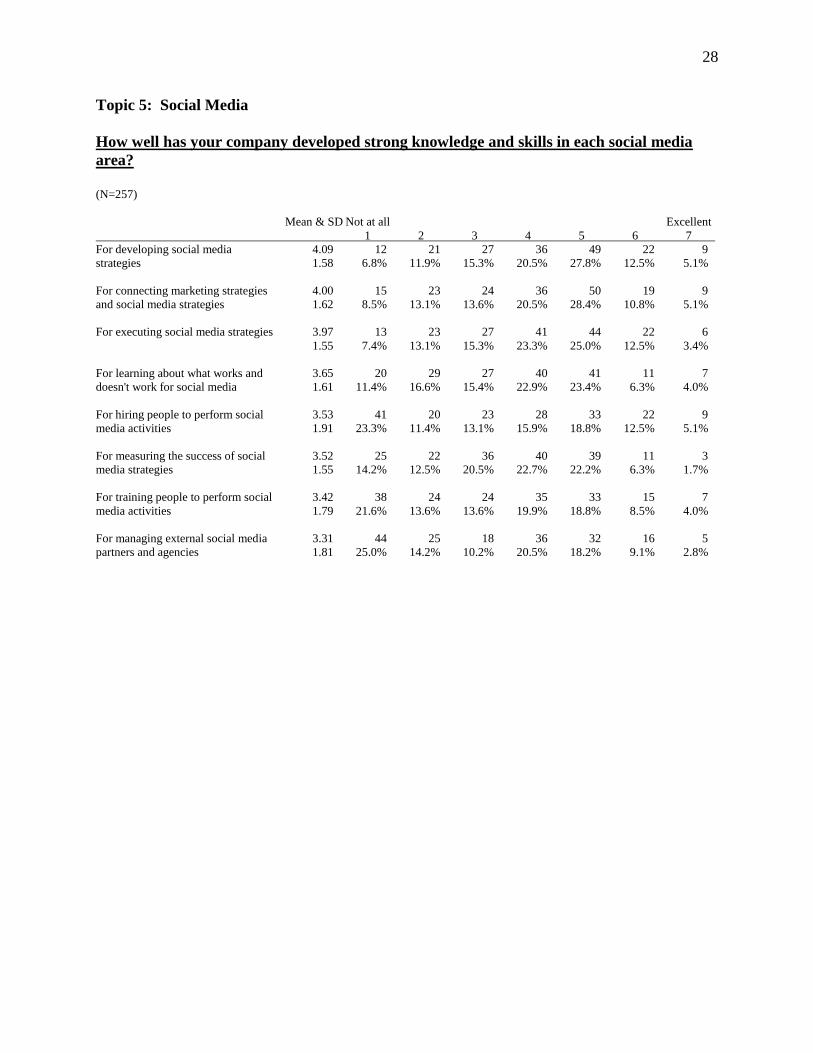
Topic 5: Social Media
How well has your company developed strong knowledge and skills in each social media
area?
(N=257)
Mean & SD Not at all Excellent
1 2 3 4 5 6 7
For developing social media 4.09 12 21 27 36 49 22 9
strategies 1.58 6.8% 11.9% 15.3% 20.5% 27.8% 12.5% 5.1%
For connecting marketing strategies 4.00 15 23 24 36 50 19 9
and social media strategies 1.62 8.5% 13.1% 13.6% 20.5% 28.4% 10.8% 5.1%
For executing social media strategies 3.97 13 23 27 41 44 22 6
1.55 7.4% 13.1% 15.3% 23.3% 25.0% 12.5% 3.4%
For learning about what works and 3.65 20 29 27 40 41 11 7
doesn't work for social media 1.61 11.4% 16.6% 15.4% 22.9% 23.4% 6.3% 4.0%
For hiring people to perform social 3.53 41 20 23 28 33 22 9
media activities 1.91 23.3% 11.4% 13.1% 15.9% 18.8% 12.5% 5.1%
For measuring the success of social 3.52 25 22 36 40 39 11 3
media strategies 1.55 14.2% 12.5% 20.5% 22.7% 22.2% 6.3% 1.7%
For training people to perform social 3.42 38 24 24 35 33 15 7
media activities 1.79 21.6% 13.6% 13.6% 19.9% 18.8% 8.5% 4.0%
For managing external social media 3.31 44 25 18 36 32 16 5
partners and agencies 1.81 25.0% 14.2% 10.2% 20.5% 18.2% 9.1% 2.8%

29
Topic 5: Social Media
Check all of the approaches your company is using to learn how to acquire, engage, and
retain customers online (in social media or in digital marketing more generally).
Number Percent 95% CI
Online customer surveys 103 40.1 % ± 6.0 %
Online customer observations 66 25.7 % ± 5.4 %
Informal online interactions with customers 63 24.5 % ± 5.3 %
Offline informal interactions with customers 60 23.3 % ± 5.2 %
Offline customer surveys 59 23.0 % ± 5.2 %
Online customer experiments 49 19.1 % ± 4.8 %
Offline customer observations 47 18.3 % ± 4.8 %
My company is not using any digital tools for learning at this time 36 14.0 % ± 4.3 %
Offline customer experiments 26 10.1 % ± 3.7 %
Studying words or pictures used online by customers 16 6.2 % ± 3.0 %
Total 525
Number of Cases = 257
Number of Responses = 525
Average Number of Responses Per Case = 2.0
Number of Cases with at least one Response = 174
Response Percent = 67.7 %

30
Topic 6: Marketing Jobs
Compared to the number of marketing hires last year, by what percentage will your firm’s
marketing hires change in the next year?
Minimum = -30
Maximum = 47
Mean = 6.58
Median = 0
Standard Deviation (Unbiased Estimate) = 12.75
95 Percent Confidence Interval around the Mean = 4.54 - 8.62
Valid Cases =150
Missing Cases =107
Response Percent = 58.4%
31
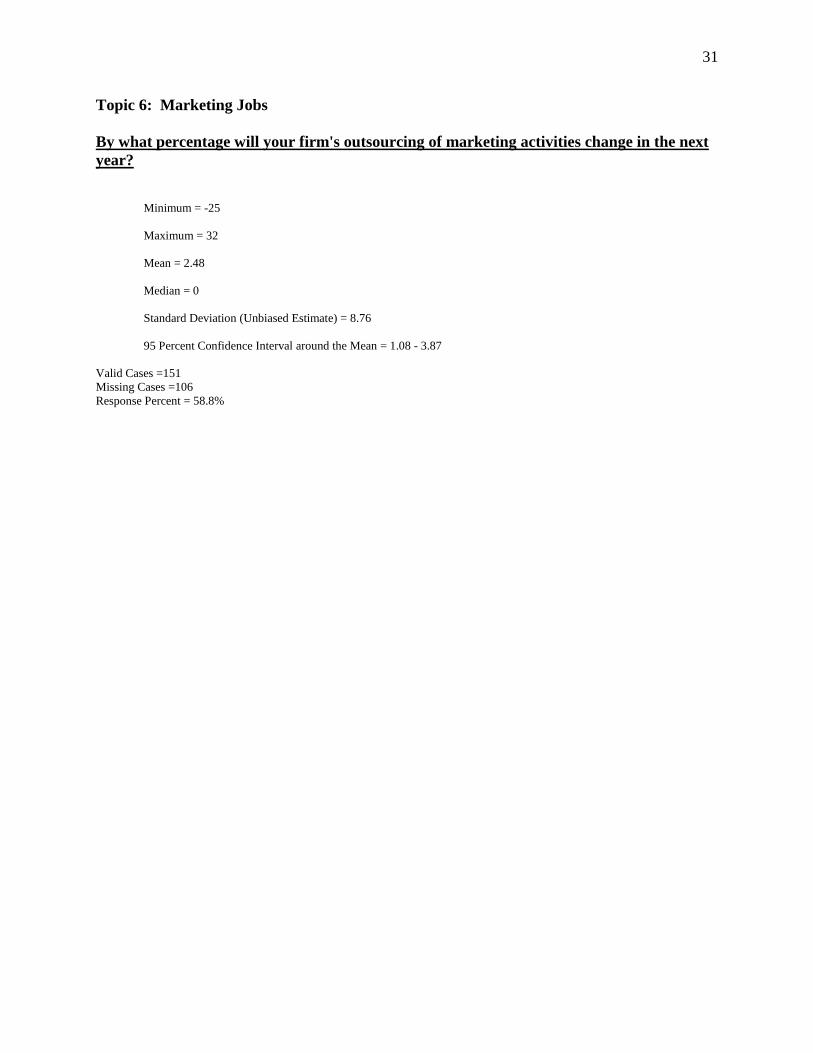
Topic 6: Marketing Jobs
By what percentage will your firm's outsourcing of marketing activities change in the next
year?
Minimum = -25
Maximum = 32
Mean = 2.48
Median = 0
Standard Deviation (Unbiased Estimate) = 8.76
95 Percent Confidence Interval around the Mean = 1.08 - 3.87
Valid Cases =151
Missing Cases =106
Response Percent = 58.8%
32
Topic 6: Marketing Jobs
How many employees/marketing employees are in your company?
Mean SD 95% CI Median Minimum Maximum Total
How many employees does your firm
have? 7410 19039 4403 - 10417 500 1 75298 154
How many marketing (non-sales)
employees are in your firm? 255 966 100 - 410 10 0 7154 149

33
Topic 7: Marketing Organization
Select the description that best captures the role of sales within your firm.
Number Percent 95% CI
Sales is in charge of marketing 17 11.0 % ± 3.1 %
Sales is within the marketing function 10 6.5 % ± 2.4 %
Sales and marketing work together on an equal level 109 70.3 % ± 6.1 %
We don't have a sales function 18 11.6 % ± 3.2 %
We have a sales function, but not a marketing function 1 0.6 % ± 0.8 %
Total 155 100.0 %
Missing Cases = 102
Response Percent = 60.3 %

34
Topic 7: Marketing Organization
Companies are generally organized by product/service groups or by customer groups.
Which organizational structure is most common in your company?
Number Percent 95% CI
Product/service groups 108 70.6 % ± 6.1 %
Customer groups 45 29.4 % ± 4.7 %
Total 153 100.0 %
Missing Cases = 104
Response Percent = 59.5 %

35
Topic 8: Marketing Leadership
What is marketing primarily responsible for in your firm?
Number Percent 95% CI
Advertising 129 82.7 % ± 6.0 %
Brand 128 82.1 % ± 6.1 %
Positioning 125 80.1 % ± 6.3 %
Social media 124 79.5 % ± 6.4 %
Promotion 119 76.3 % ± 6.8 %
Marketing analytics 117 75.0 % ± 6.9 %
Marketing research 110 70.5 % ± 7.2 %
Public relations 100 64.1 % ± 7.6 %
Lead generation 87 55.8 % ± 7.9 %
Market entry strategies 87 55.8 % ± 7.9 %
Competitive intelligence 86 55.1 % ± 7.9 %
Customer relationship management 61 39.1 % ± 7.7 %
New products 59 37.8 % ± 7.7 %
Sales 50 32.1 % ± 7.4 %
Pricing 48 30.8 % ± 7.3 %
Market selection 47 30.1 % ± 7.3 %
Innovation 36 23.1 % ± 6.7 %
Customer service 31 19.9 % ± 6.3 %
Distribution 19 12.2 % ± 5.2 %
Stock market performance 6 3.8 % ± 3.1 %
Total 1569
Number of Cases = 156
Number of Responses = 1569
Average Number of Responses Per Case = 10.1
Number of Cases with at least one Response = 156
Response Percent = 100.0 %

36
Topic 8: Marketing Leadership
Number of direct and indirect reports you have?
Median Mean SD Minimum Maximum Range Total
How many direct reports do you have? 5 6.81 9.81 0 89 89 154
How many indirect reports (dotted-line) reports
do you have? 6 18.86 36.23 0 178 178 139

37
Topic 8: Marketing Leadership
How many years have you been with this firm in your current role? In any role?
Median Mean SD Minimum Maximum Total
In your current role? 4.50 5.81 4.73 0 16 156
In any role? 8 10.76 8.19 0 28 144

38
Topic 9: Marketing Analytics
What percent of your marketing budget do you spend on marketing analytics?
Mean SD 95% CI Median Minimum Maximum Total
...do you currently spend on marketing
analytics? 6.7 6.8 5.7 - 7.7 5 0 24 170
...will you spend on marketing analytics the
next three years? 11.1 9.9 9.6 - 12.5 10 0 36 169

39
Topic 9: Marketing Analytics
In what percent of projects does your company use available or requested marketing
analytics before a decision is made?
Minimum = 0
Maximum = 94
Mean = 31.02
Median = 20
Variance (Unbiased Estimate) = 984.48
Standard Deviation (Unbiased Estimate) = 31.38
Standard Error of the Mean = 2.43
95 Percent Confidence Interval Around the Mean = 26.27 - 35.78
99 Percent Confidence Interval Around the Mean = 24.77 - 37.28
4 Groups
1 = 1
2 = 20
3 = 50
Valid Cases =167
Missing Cases =90
Response Percent = 65.0%

40
Topic 9: Marketing Analytics
To what degree has the use of marketing analytics contributed to your company's
performance?
Number Percent 95% CI
1=Not At All 34 20.0 % ± 4.2 %
2= 16 9.4 % ± 3.0 %
3= 22 12.9 % ± 3.5 %
4= 29 17.1 % ± 3.9 %
5= 40 23.5 % ± 4.5 %
6= 20 11.8 % ± 3.3 %
7=Very Highly 9 5.3 % ± 2.3 %
Total 170 100.0 %
Mean = 3.71
SD = 1.85
Missing Cases = 87
Response Percent = 66.1 %

41
Topic 9: Marketing Analytics
Check all of the areas in which your company is using marketing analytics to drive decision
making.
Number Percent 95% CI
Customer insight 98 38.1 % ± 6.0 %
Customer acquisition 94 36.6 % ± 6.0 %
Digital marketing 87 33.9 % ± 5.8 %
Marketing mix 81 31.5 % ± 5.7 %
Customer retention 79 30.7 % ± 5.7 %
Social media 79 30.7 % ± 5.7 %
Segmentation 75 29.2 % ± 5.6 %
Promotion strategy 75 29.2 % ± 5.6 %
Branding 68 26.5 % ± 5.5 %
Sales strategy 68 26.5 % ± 5.5 %
Customer service 66 25.7 % ± 5.4 %
Pricing strategy 56 21.8 % ± 5.1 %
New product or service development 52 20.2 % ± 5.0 %
Product or service strategy 52 20.2 % ± 5.0 %
Multichannel marketing 42 16.3 % ± 4.6 %
Total 1072
Number of Cases = 257
Number of Responses = 1072
Average Number of Responses Per Case = 4.2
Number of Cases with at least one Response = 148
Response Percent = 57.6 %

42
Topic 9: Marketing Analytics
Which best describes how your company shows the short-term impact of marketing spend
on your business?
Number Percent 95% CI
We prove the impact quantitatively 55 35.9 % ± 5.1 %
We have a good qualitative sense of the impact,
but not a quantitative impact 70 45.8 % ± 5.5 %
We haven't been able to show the impact yet 28 18.3 % ± 3.9 %
Total 153 100.0 %
Missing Cases = 104
Response Percent = 59.5 %

43
Topic 9: Marketing Analytics
Which best describes how your company shows the long-term impact of marketing spend
on your business?
Number Percent 95% CI
We prove the impact quantitatively 45 29.4 % ± 4.7 %
We have a good qualitative sense of the impact,
but not a quantitative impact 73 47.7 % ± 5.6 %
We haven't been able to show the impact yet 35 22.9 % ± 4.2 %
Total 153 100.0 %
Missing Cases = 104
Response Percent = 59.5 %

44
Appendix: Firm-level Descriptive Information
Which is your primary economic sector?
Number Percent 95% CI
B2B - Product 83 32.4 % ± 5.8 %
B2B - Services 97 37.9 % ± 6.0 %
B2C - Product 36 14.1 % ± 4.3 %
B2C - Services 40 15.6 % ± 4.5 %
Total 256 100.0 %
Missing Cases = 1
Response Percent = 99.6 %

45
Appendix: Firm-level Descriptive Information
Which industry sector best describes your firm?
Number Percent 95% CI
Technology [Software/Biotech] 42 16.3 % ± 4.6 %
Professional Services/Consulting 40 15.6 % ± 4.5 %
Manufacturing 37 14.4 % ± 4.3 %
Health Care/Pharmaceutical 30 11.7 % ± 4.0 %
Banking/Finance/Insurance 23 8.9 % ± 3.5 %
Retail/Wholesale 20 7.8 % ± 3.3 %
Consumer Packaged Goods 16 6.2 % ± 3.0 %
Communications/Media 16 6.2 % ± 3.0 %
Consumer Services 9 3.5 % ± 2.3 %
Energy 8 3.1 % ± 2.1 %
Transportation 8 3.1 % ± 2.1 %
Education 4 1.6 % ± 1.5 %
Mining/Construction 4 1.6 % ± 1.5 %
Total 257 100.0 %
Missing Cases = 0
Response Percent = 100.0 %