table of - mkwd.gov.ph€¦ · management procedures ... structure who have the greatest influence...
TRANSCRIPT

2
TABLE OF CONTENTS_______________________________________
Module 1. MKWD Water Safety Plan Team ................................................................................4Module 2. System Description ....................................................................................................6 2.1 Service Coverage Area ...................................................................................6 2.2 Service Coverage Area by Percentage in terms of Barangay served/with accessible water ......................................................7 2.3 Intended Use and Users ................................................................................8 2.4 Target Water Quality .......................................................................................8 2.5 Schematic Diagram .......................................................................................9 2.6 Process Flow Diagram ...................................................................................9 2.7 CATCHMENT – Six Wells ..............................................................................11 2.7.A. Libtong Pumping Station .......................................................................11 2.7.B. Tinigaw Deep Well ............................................................................11 2.7.C. Manabayan Deep Well ...........................................................................12 2.7.D. Bubog Deep Well ..............................................................................12 2.7.E. Palale Pumping Station ...................................................................12 2.7.G. Cupang Pumping Station .................................................................13 2.8 Aklan River (Bulk Water) .............................................................................13 2.9 Treatment .....................................................................................................14 2.10 Water Distribution ........................................................................................14 2.11 Distribution Network ....................................................................................15 2.11.1 Reservoirs/Sump & boosters ....................................................15-21 2.11.2 Network Condition ............................................................................21 2.11.3 Consumer’s Installation ...................................................................22 2.11.4 Water Pipeline located under the Drainage Line ...........................23 Module 3. IdenficationofHazards&HazardousEvent& Assessment of Risks ...............................................................................................23Module 4. Determine & Validate Control Measures, Re-Assess &PrioritizetheRisk ..........................................................................................25-34Module 5. Develop, Implement and Maintain an Improvement Plan ...............................35-37Module 6. Monitoring Control Measures ............................................................................37-40Module 7. Verify the Effectiveness of WSP ........................................................................40-42Module 8. Management Procedures ..................................................................................43-44Module 9. Support Programs ....................................................................................................45Module 10. Periodic Review ........................................................................................................46Module 11. Revision of the WSP following an incident .............................................................46

3
Introduction The Metro Kalibo Water District (MKWD) has always put the safety of its concessionaires first, paramount to anything else. Since its inception in 1976, MKWD has assumed the role of the premier source of quality water supply in the municipality of Kalibo and beyond. Its continued growth has proven that putting quality and safety first can and will pay off. Because most if not all of MKWD employees are also part of its concessionaire population, MKWD has a finger on the pulse of what improvements can be made and undertaken in order to keep its services up to par with the expectations and satisfaction of the concessionaires. Over and beyond concessionaire expectation and satisfaction, MKWD has pledged to keep water services in top quality as well as ensure safety in the water delivered to the thousands of households it reaches. To further that aim, MKWD continues to find ways to augment and better its mission.
When the Department of Health (DOH) issued Administrative Order No. 2014-0027, requiring all drinking water service providers to develop and implement a water safety plan, and the Local Water Utilities Administration (LWUA) issued Memorandum Circular No. 010-014, directing all water districts and rural waterworks and sanitation associations to develop and implement a water safety plan to comply with the provisions of DOH AO 2014-0027, the MKWD pursued the mandate of the law in support of the objectives of the DOH and the LWUA, issuing Office Order No. 034, establishing a Water Safety Plan Team to tackle the development and implementation of the MKWD Water Safety Plan.
As per the WHO Guidelines for Drinking-water Quality - First Addendum to Third Edition, Volume I: Recommendations, “a water safety plan is a plan to ensure the safety of drinking water through the use of a comprehensive risk assessment and risk management approach that encompasses all steps in water supply from catchment to consumer.”
With that in mind, MKWD called on the primary players within its organization structure who have the greatest influence in terms of its water supply system. From the initial stages of planning a new water service connection to its preventative and procedural upkeep, members of the MKWD Water Safety Plan team are the same people who have intimate knowledge and experience with the entire system.
Through the MKWD Water Safety Plan, MKWD aims to further its mission in keeping concessionaires safe with quality water supply, ensuring that wherever MKWD water reaches, the product remains the same and compliant with concessionaire satisfaction.

4
METRO KALIBO WATER DISTRICTWSP TEAM STRUCTUREF.Y. 2016-2017
Table 1 . Roles and Responsibilities of WSP Team Members
Module 1. MKWD WATER SAFETY PLAN TEAM
WATERFACILITIES
GROUP
ENGR EUGENE NICOLAS
MA. HEARTZELL DELGADO
ENGR. REGNIER REBALDO
NORIEL RESULTA
ADAM VILLANUEVA
ENGR. LINA PALAMANI
JAMZEN IGUBAN
FELISA BUYOC
DANTE JAVIER
MARY ANNE DAGOHOY
ANNA LHE TULIO
MA. CECILLE IGNACIO
PHILIP TOLENTINO
FREDERICK BUENAVIDEZ
WILSON NADUA
DISTRIBUTION GROUP
WATER SERVICE CONNECTION
GROUP
COMMERCIAL SERVICES
GROUP
FINANCESERVICES
GROUP
ADMINISTRATIVE SERVICESGROUP
SUPPORT GROUP
WSPAssistant Team Leader
ENGR. LENIEL B. AGUSTINO
WSPTeam Leader
ENGR. LYDIO I. URETA
Name Division Responsibility
Engr. Lydio I. Ureta MD WSP Team Leader
Engr. Leniel B. Agustino WRD WSP Asst. Team Leader
Water Facilities GroupEngr. Eugene L. Nicolas WRD Water Facilities
Ma. Heartzell T. Delgado WRD Water Quality
Distribution Lines GroupEngr. Regnier A. Rebaldo PDCD Technical
Noriel P. Resulta MD Technical
Adam I. Villanueva PDCD Technical
Water Services Connection GroupEngr. Lina Q. Palmani PDCD Water Service
Connection Engineer
Jamzen T. Iguban PDCD Water service connection Inspector
Commercial Services Group Felisa A. Buyoc CSD Customer Services
Dante S. Javier CSD Commercial Inspector
Finance Services GroupMary Ann T. Dagohoy, CPA FSD Finance
AnnaLhe B. Tulio FSD Finance/Communication
Administrative Services Group Ma. Cecille M. Ignacio ASD Training Program
Philip D. Tolentino ASD Materials
Support Services Group Frederick M. Buenavidez OGM Over-all Coordinator
Wilson K. Nadua Jr. OGM Documentation
Figure 1

5
Table 2
WSP Stakeholder Identification and Interaction
StakeholdersInteraction
mecha-nism3
Record of InteractionName
Relationship to Drinking Water Sup-ply Issues1
Point of Contact with
WD/WSP Team2
Issues withDrinking Water
Supply
Municipal/Pro-vincial Health
Office
Regulator/ Data Informa-tion Source
P - WD: Lab Aide/ SH: Sani-tary Inspector
Compliance with PNSDW for drinking
water supplied
P:Joint Sam-pling (i.e., it
is proposed to conduct joint
sampling)
Joint Sampling Report
Environment and Manage-ment Bureau
Regulator/ Data Informa-tion Source
WD:WSP Lead-er / SH:EMB
Provincial Focal Person
Compliance with ECC requirements
ECC Com-pliance
Inspection reports
DPWH / PEO / MEO
Distribution Line ROW
issues
WD: Mainte-nance DM / SH: Mainte-
nance Division Head
Project coordination and issues
Joint site inspections / Leakage
repair
Permits /Service requests
WaterRefillingStation and
Food Process-ing Operators
Concession-aires
WD: Water Re-sources DM / SH: Operator
Compliance with PNSDW for drinking
water supplied
Site Inspec-tion
Certificationand Bacte-test
Results
AKENRO Regulator
WD: Water Resources DM / SH: Provincial
Environment Head
Compliance with En-vironmental issues
of plants
Site Inspec-tions / Meet-
ings
Reports / Minutes
DENR / Pro-tected Areas Management
Board
Watershed/ Catchment
user
WD: WD Rep-resentative / SH:PAMB
Board
Catchment issuesJoint Projects / Board Meet-
ings
PAMB Resolu-tions and Minutes
Numancia Water District
Bulk Water Concession-
aire
WD: GM / SH: GM
Compliance with bacteriological qual-ity of drinking water
supplied
MeetingsMinutes/ Letters
of Correspon-dence
Datem Water, Inc
Bulk Water Supplier
WD: GM / SH: GM
Compliance with PNSDW for drinking
water supplied
Meetings / Joint sampling
and inspec-tions
Minutes/ Letters of Correspon-dence/ Joint
Sampling and In-spection Reports
National Irri-gation Admin-
istrationROW issues WD: GM / SH:
NIA HeadProject coordination
and issues MeetingsMinutes / Letters of
Correspondence

6
System AssessmentModule 2. SYSTEM DESCRIPTION 2.1 SERVICE COVERAGE AREA (FIGURE 2. SERVICE COVERAGE MAP)
MUNICIPALITY LAND AREA (HAS.)KALIBO 5,075NEW WASHINGTON 6,669BANGA 8,453BALETE 11,893BATAN (PORTION) 1,958TOTAL 34,048
Table 3. Land Area of Service Coverage Area

7
2.2 SERVICE COVERAGE AREA BY PERCENTAGE IN TERMS OF BARANGAY SERVED/WITH ACCESSIBLE WATER
Table 4.
*2015 PSA Census
BARANGAYSKALIBO 80,605 41 Dingle 698
1 Andagaw 12,703 42 Jumarap 1,8352 Bachaw Norte 2,336 43 Lapnag 6273 Bachaw Sur 3,131 44 Libas 1,7174 Briones 1,321 45 Linabuan Sur 3,7565 Buswang New 10,431 46 Mambog 1,8036 Buswang Old 3,247 47 Mangan 1,5427 Caano 1,803 48 Muguing 7648 Estancia 8,372 49 Pagsanghan 1,9179 Linabuan Norte 4,130 50 Palale 67810 Mabilo 2,378 51 Poblacion 1,99711 Mobo 1,543 52 Polo 95512 Nalook 3,323 53 Polocate 1,70713 Poblacion 11,751 54 San Isidro 32014 Pook 5,744 55 Sibalew 98915 Tigayon 5,640 56 Sigcay 1,01216 Tinigaw 2,752 57 Taba-ao 1,164
NEW WASHINGTON 45,007 58 Tabayon 1,77717 Candelaria 1,708 59 Tinapuay 45718 Cawayan 4,168 60 Torralba 1,89019 Dumaguit 2,139 61 Ugsod 1,56620 Fatima 1,219 62 Venturanza 82421 Guinbaliwan 3,031 BALETE 28,92022 Jalas 1,518 63 Aranas 5,25623 Jugas 2,577 64 Arcangel 3,48624 Lawa-an 1,361 65 Calizo 3,86325 Mabilo 3,552 66 Cortes 3,27826 Mataphao 1,842 67 Feliciano 2,88327 Ochando 3,369 68 Fulgencio 3,56828 Pinamuk-an 2,951 69 Guanko 1,32129 Poblacion 5,974 70 Morales 3,18430 Polo 3,514 71 Oquendo 1,23431 Puis 2,675 72 Poblacion 84732 Tambak 3,409 Batan 9,710
BANGA 39,505 73 Caiyang 94133 Agbanawan 1,524 74 Cabugao 2,40834 Bacan 1,703 75 Camaligan 2,82135 Badiangan 1,747 76 Lalab 2,99036 Cerrudo 1,485 77 Magubahay 55037 Cupang 740 TOTAL POPULATION 250,68838 Daguitan 459 Total Barangay served 6639 Daja Norte 1,340 Total Barangay unserved 1140 Daja Sur 512 Percentage 85.71%

8
2.3 INTENDED USE AND USERS
The water MKWD supplies to its consumers---the population of the MKWD Service Area and Numancia Water District through bulk water supply---is intended for general domestic use and consumption such as drinking, food preparations, and washing. For industrial and pharmaceutical use, additional treatment may be necessary to achieve the water quality requirements as may be required.
Listed above in Figure 2/Table 3 are the service coverage area and at Table 4 are the population served.
Table 5 Population served
Table 6. 14 Parameters of PNSDW
2.4 TARGET WATER QUALITY MKWD aims to provide safe drinking water that meets the Philippine National Standards for Drinking Water in terms of microbial, physical, chemical, and even residual disinfectant quality. DOH Circular 2007-12 the following Priority Parameters shall be regularly tested to comply with the Philippine National Standards for Drinking Water:
Parameters PNSDW Maximum LevelColor 10 Color units/ 5 Color unitsTurbidity 5 NTUpH 6.5 – 8.5 TDS 500 mg/L Iron 1.0 mg/LManganeese 0.4 mg/LLead 0.01 mg/LCadmium 0.003 mg/LChloride 250 mg/LSulfate 250 mg/LNitrate 50 mg/LBenzene 0.01 mg/LArsenic 0,01 mg/LBacteriological Negative
9
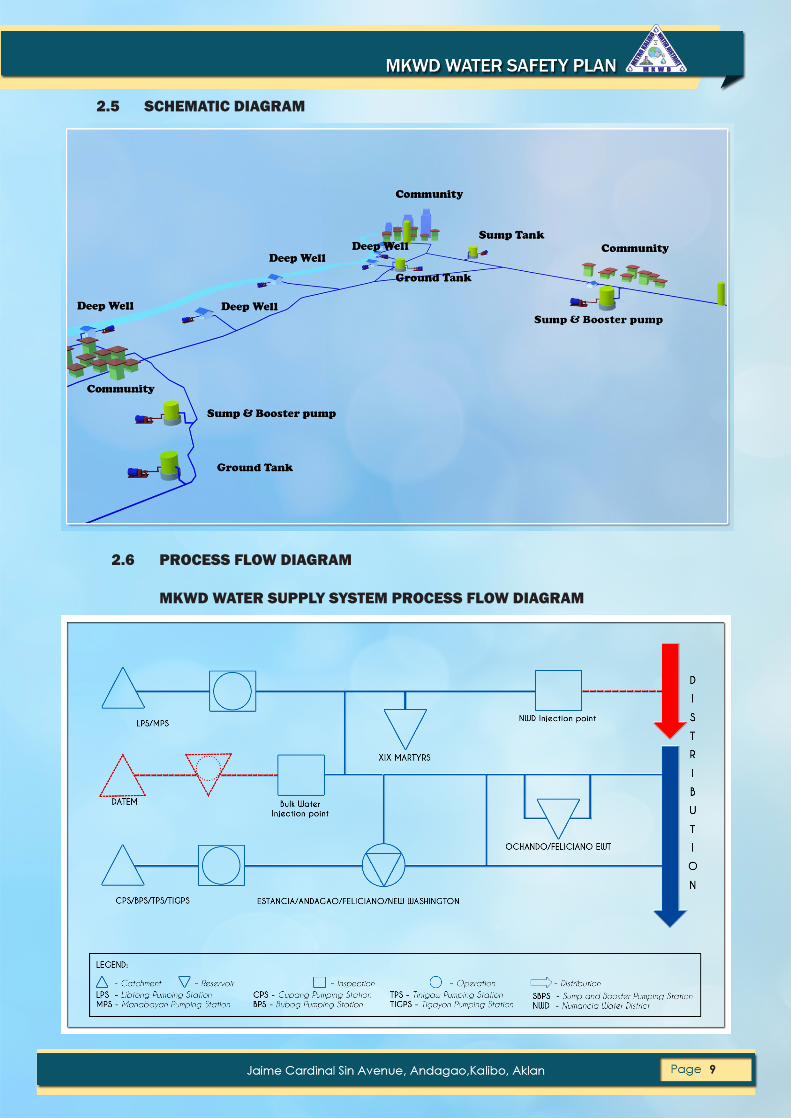
2.5 SCHEMATIC DIAGRAM
2.6 PROCESS FLOW DIAGRAM
MKWD WATER SUPPLY SYSTEM PROCESS FLOW DIAGRAM

10
Compo-nent
Catchment Treatment Bulk Wa-ter
Distribu-tion
Storage Tap
Activity Operation Inspection Inspection InspectionOperation /
*Treatment & Inspection
Operation / Inspection
Place Libtong PS, Manabayan PS,
Tinigaw PS, Tigayon PS,
Bubog PS, Cu-pang PS
Libtong PS, Manabayan PS,
Tinigaw PS,Tigayon PS,Bubog PS,Cupang PS
Injection point
Hydrants / Blow-offs /
Water service
connections
19 Martyrs Ele-vated Tank,
Ochando Elevated Tank,
*Feliciano S&B, Feliciano Ground
Tank,
Poblacion NW S&B, Estancia Steel bolted
Tank,
Andagao Steel bolted Tank
Household water
serviceconnections
Responsi-ble Per-
sons / Unit
PumpOperators
Laboratory Technician
Laborato-ry Techni-
cian
Flushing Team/Mainte-
nance Team
PumpOperator
Laboratory Technician / Commercial Inspectors/
Mainte-nance
Table 7. Table of Components of the MKWD Distribution Network
2.7 CATCHMENT – SIX (6) DEEP WELLS The Metro Kalibo Water District draws water primarily from six wells (originally seven until the Palale Pumping Station was decommissioned due to high contents of iron and manganese). The wells have been in service from 12 to 34 years, With the oldest constructed in 1982. The shallowest well reaching a depth of 180 feet and the deepest at 220 feet.

11
2.7.A. LIBTONG PUMPING STATION
The oldest pumping station of MKWD nearly four decades now, the Libtong Pumping Station has been providing the Metro Kalibo Water District water supply system with an ample source of water. Sometimes in October 2000 operation has been stop due to occurance of turbidity which attributed by damage casing and later on undergo a rehabilitation through recasement of casing. In July 2006, a new well was drilled beside the original well location which increased its source capacity from 40 LPS
to 60 LPS at present. At a depth of 216 feet, the casing and screen are spiral and stainless, with cement grout at a depth of 22 m. Both the pumpbase and the pumphouse are in good condition and a perimeter fence ensures protection from natural threats.
2.7.B. TINIGAO DEEP WELL
The Tinigao Pumping Station has been providing water since 1991. Same with Libtong Pumping Station, the Tinigao Pumping Station has a depth of 216 feet, a spiral casing and stainless screen, and a 22-m deep cement grout. Both the pumpbase and the pumphouse are in good condition and a perimeter fence ensures protection from natural threats.
2.7.C. MANABAYAN DEEP WELL
Manabayan Pumping Station has been in commission since 1994. It has a depth of 223 feet, spiral casing and stainless screen, and 14 m of cement grout depth. The Pump house including the pump base is in good condition. A perimeter fence was constructed to protect against external threat.

12
2.7.D. BUBOG DEEP WELL
The youngest pumping station, having just started contributing to the Metro Kalibo Water District water supply system in 2010, the Bubog Pumping Station has a depth of 262 feet, B.I. pipe casing and stainless screen, and 15 m of cement grout depth. Both the pumpbase and the pumphouse are in good condition while a perimeter fence protects it against natural threats.
2.7.F. TIGAYON PUMPING STATION Since 2000, the Tigayon Pumping Station has been in service to
the public, comprising the Metro Kalibo Water District water supply system. The well is 115 feet in depth, has a spiral casing and a stainless screen, and 5 m of cement grout depth. Both the pumpbase and the pumphouse are in good condition and a perimeter fence protects it against natural threats.
2.7.E. PALALE PUMPING STATION
The Palale Pumping Station had been in service since October 2003 when high contents of iron and manganese rendered it unsafe for the drinking public. This pumping station was decomissioned in 2017. The well has 193 feet in depth and has a spiral welded blank casing and stainless screen. The depth of cement grout is 9 m. Both the pumpbase and the pumphouse are in good condition. A perimeter fence protects it against natural threats.
2.7.G. CUPANG PUMPING STATION Cupang Pumping Station has been augmenting the Metro Kalibo Water District water supply system since February 2005. The well is 164 feet in depth, has a spiral welded blank casing, a stainless steel screen and 12 m of cement grout depth. Both the pumpbase and the pumphouse are in good condition. A perimeter fence ensures its protection against natural threats.
13
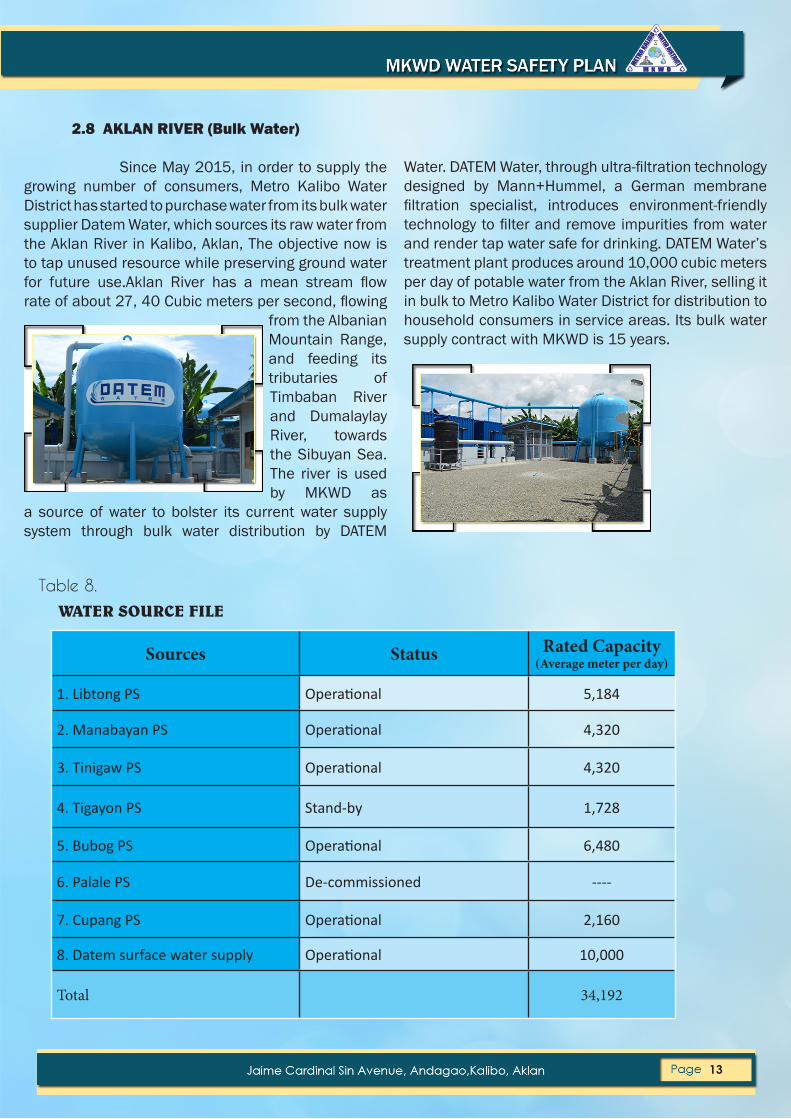
2.8 AKLAN RIVER (Bulk Water)
Since May 2015, in order to supply the growing number of consumers, Metro Kalibo Water District has started to purchase water from its bulk water supplier Datem Water, which sources its raw water from the Aklan River in Kalibo, Aklan, The objective now is to tap unused resource while preserving ground water for future use.Aklan River has a mean stream flowrateofabout27,40Cubicmeterspersecond,flowing
from the Albanian Mountain Range, and feeding its tributaries of Timbaban River and Dumalaylay River, towards the Sibuyan Sea. The river is used by MKWD as
a source of water to bolster its current water supply system through bulk water distribution by DATEM
Sources Status Rated Capacity(Average meter per day)
1. Libtong PS Operational 5,184
2. Manabayan PS Operational 4,320
3. Tinigaw PS Operational 4,320
4. Tigayon PS Stand-by 1,728
5. Bubog PS Operational 6,480
6. Palale PS De-commissioned ----
7. Cupang PS Operational 2,160
8. Datem surface water supply Operational 10,000
Total 34,192
WATER SOURCE FILE
Water.DATEMWater,throughultra-filtrationtechnologydesigned by Mann+Hummel, a German membrane filtration specialist, introduces environment-friendlytechnologytofilterandremoveimpuritiesfromwaterand render tap water safe for drinking. DATEM Water’s treatment plant produces around 10,000 cubic meters per day of potable water from the Aklan River, selling it in bulk to Metro Kalibo Water District for distribution to household consumers in service areas. Its bulk water supply contract with MKWD is 15 years.
Table 8.
14
Well No Location Depth Casing SWL PWL YEAR Condition
1 Libtong Road, Estancia, Kalibo
216 22 6.70 1983 Serviceable
2 Sitio Manabayan, Tinigaw, Kalibo
216 22 6.50 1996 Serviceable
3 Tinigaw, Kalibo 223 14 6.70 1995 Serviceable4 Tigayon, Kalibo 115 5 2006 Serviceable5 Sitio Bubog, Linabuan
Sur, Banga 262 15 4.50 2010 Serviceable
6 Brgy Palale, Banga 193 9 2003 De-commissioned7 Brgy. Cupang, Banga 164 12 4.90 2005 Serviceable
Table 9
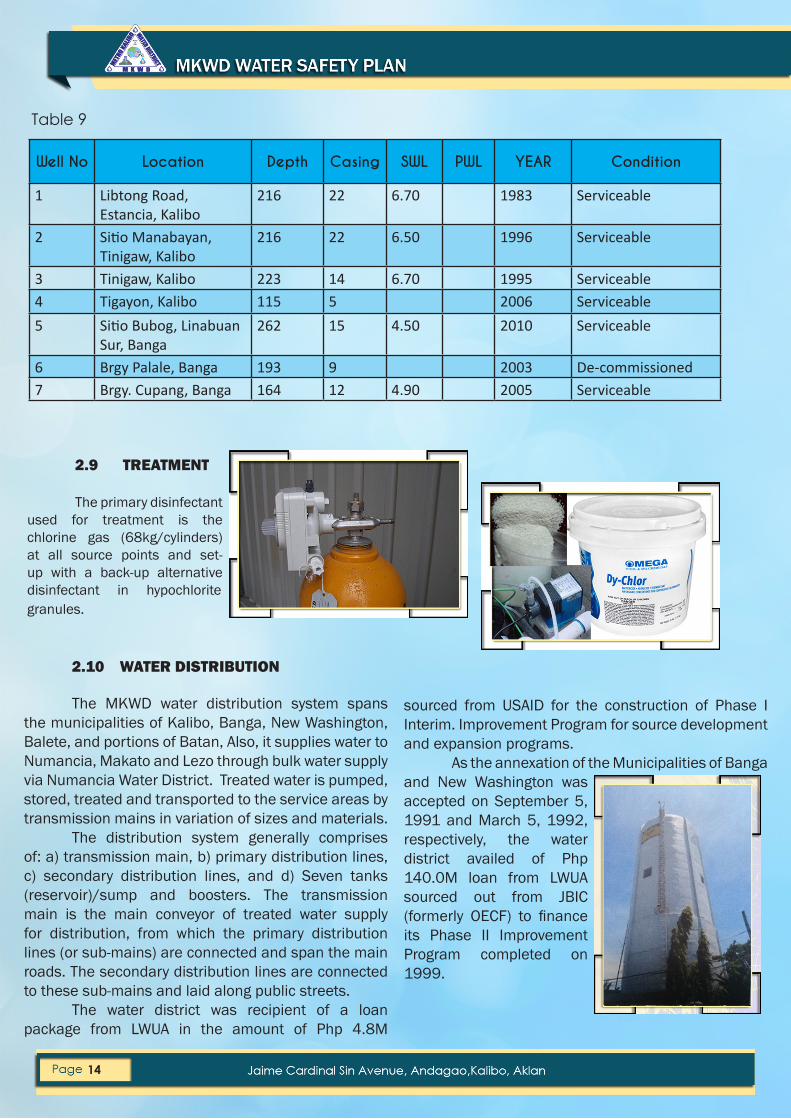
2.9 TREATMENT
The primary disinfectant used for treatment is the chlorine gas (68kg/cylinders) at all source points and set-up with a back-up alternative disinfectant in hypochlorite granules.
2.10 WATER DISTRIBUTION The MKWD water distribution system spans the municipalities of Kalibo, Banga, New Washington, Balete, and portions of Batan, Also, it supplies water to Numancia,MakatoandLezothroughbulkwatersupplyvia Numancia Water District. Treated water is pumped, stored, treated and transported to the service areas by transmissionmainsinvariationofsizesandmaterials. The distribution system generally comprises of: a) transmission main, b) primary distribution lines, c) secondary distribution lines, and d) Seven tanks (reservoir)/sump and boosters. The transmission main is the main conveyor of treated water supply for distribution, from which the primary distribution lines (or sub-mains) are connected and span the main roads. The secondary distribution lines are connected to these sub-mains and laid along public streets. The water district was recipient of a loan package from LWUA in the amount of Php 4.8M
sourced from USAID for the construction of Phase I Interim. Improvement Program for source development and expansion programs. As the annexation of the Municipalities of Banga and New Washington was accepted on September 5, 1991 and March 5, 1992, respectively, the water district availed of Php 140.0M loan from LWUA sourced out from JBIC (formerly OECF) to financeits Phase II Improvement Program completed on 1999.

15
The water district, being consistent with its mandate, wasofficiallyre-categorizedfrommediumtobigwaterdistrict in February 1996. With the annexation of another nearby town in view and the various expansion projects accomplished, the water district was renamed to Metro Kalibo Water District on March 2002. The annexation of Municipality of Balete was approved on March 25, 2002. With the progress and development the district has so far accomplished, upgrading of Metro Kalibo Water District from big water district category to large category was approved on August 2003. On February 12, 2007, the annexation of three (3) barangays of Batan, namely Camaligan, Magubahay, and Caiyang (CAMACA) was approved.
2.11 DISTRIBUTION NETWORK 2.11.1 Reservoirs/Sump & boosters Reservoirs are used to store product water to augment the high water demand during peak hours of the day. Generally across the service coverage area, peak hours are between 6am to 9am and 5pm to 7pm. Sincethewell-fieldofMKWDcanbefoundalongtheAklanriveronlywhich is located in thewesternboundaries of the service coverage area. Sump and boosters are needed to transport/convey product water to the farthest barangays from the source.
This is more evident in the areas of Balete and Batan which can be found in the southeastern portions of theservicecoveragearea.Thisparticularareacanbecharacterizedbyrollingandundulatinghillswithelevationranging from 30m to 50m above mean sea level. Thus the requirement to boost product water a second time fromsource.AsummaryoftheStorageandsumpprofileislistedbelowtakenfromSection__oftheDistributionnetwork facilities and assets master list:
Facility System TypeAge
(years)Capacity
1. XIX Martyrs Floating on the line Elevated Concrete Tank 40 380
2. Estancia Fill and drawwith boosting pump Steel bolted ground tank with lining 3 1,000
3. Andagao Fill and Drawwith boosting pump Steel bolted ground tank with lining 1 1,000
4. Poblacion, NW (S&B) Sump and booster Concrete sump tank 18 200
5. Ochando Floating on the line Elevated Steel Tank 18 3006. Feliciano (S&B) Sump and booster Concrete Sump Tank 12 1007. Feliciano Fill and draw Concrete Ground Tank Tank 12 200
Total 3,230
Table 10. Storage and sump profile
NowtheMetroKaliboWaterDistrictiscategorizedas Category B (Large) water district. The Kalibo Water District started with an initial 380 household connections in 1976 and now, Metro Kalibo Water District has total household connections of 26,689 as of July 30, 2017. Since 2012, MKWD has engaged in the supply of bulk water with Numancia Water District as its newest client with the interconnection of the Php 4.6M Kalibo-Numancia Bridge Crossing project.
To support the continuous expansion of its service coverage area, the distr ict has implemented the construction of two (2) 1,000 cubic meter Elevated Steel Ground Water StorageTanks at Estancia, Kalibo and Andagao which are now operational.

16
Municipality Length (lm) Size range (mm) Materials Age (yrs)
Kalibo
4175
4752
1920
6474
558
300
250
250
200
150
Steel
uPVC
Steel
uPVC
uPVC
17
17
23-27
17-35
23-35
New Washington4818
5816
250
200
uPVC
uPVC
17
17
Banga
5395
3013
55
200
150
150
uPVC
uPVC
Steel
7-13
13-19
14
Balete6788
72
150
150
uPVC
Steel
12
12Batan ---- ---- ---- ----
Numancia WD 440 200 HDPE 5
Total 44,866
Table 11. Transmission Mains
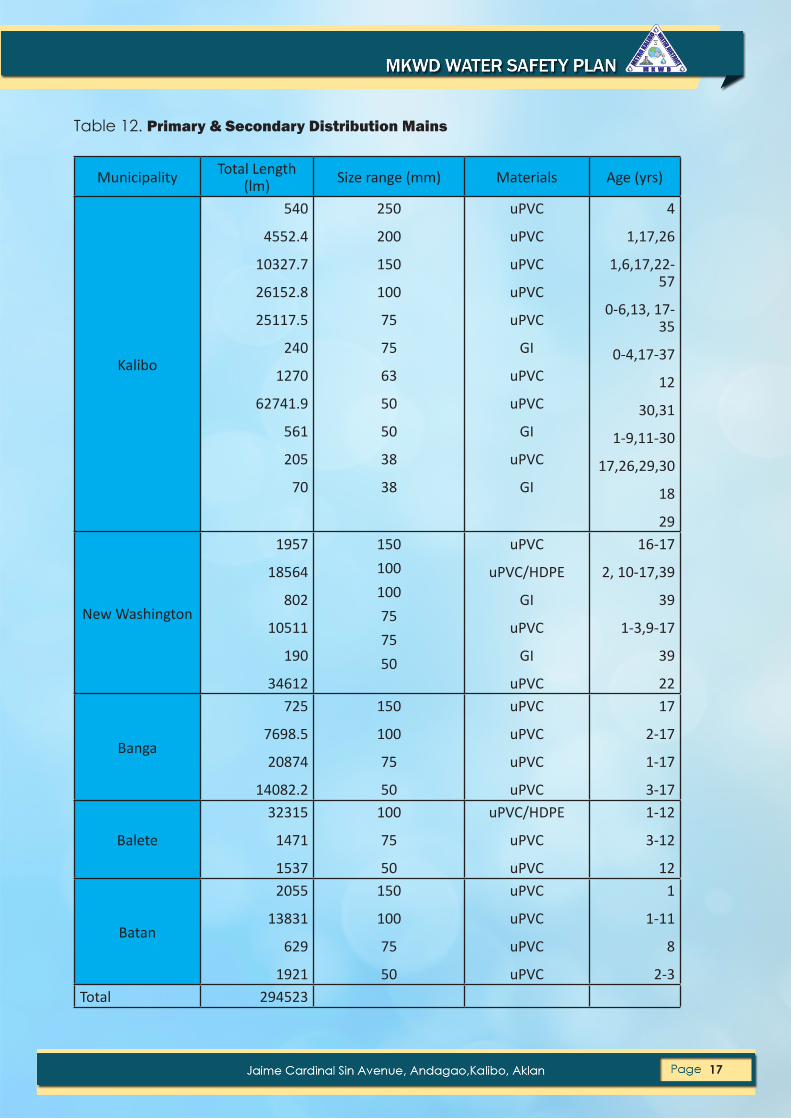
From the source the following Transmission mains supply the primary and secondary distribution mains that provide for tapping of water service connections to the concessionaires. A summary of which are found in Table 9 and 10 below taken from Section 3.1 of the Distribution Network Facilities and Assets Master List
17
Table 12. Primary & Secondary Distribution Mains
Municipality Total Length (lm) Size range (mm) Materials Age (yrs)
Kalibo
540
4552.4
10327.7
26152.8
25117.5
240
1270
62741.9
561
205
70
250
200
150
100
75
75
63
50
50
38
38
uPVC
uPVC
uPVC
uPVC
uPVC
GI
uPVC
uPVC
GI
uPVC
GI
4
1,17,26
1,6,17,22-57
0-6,13, 17-35
0-4,17-37
12
30,31
1-9,11-30
17,26,29,30
18
29
New Washington
1957
18564
802
10511
190
34612
150100100757550
uPVC
uPVC/HDPE
GI
uPVC
GI
uPVC
16-17
2, 10-17,39
39
1-3,9-17
39
22
Banga
725
7698.5
20874
14082.2
150
100
75
50
uPVC
uPVC
uPVC
uPVC
17
2-17
1-17
3-17
Balete
32315
1471
1537
100
75
50
uPVC/HDPE
uPVC
uPVC
1-12
3-12
12
Batan
2055
13831
629
1921
150
100
75
50
uPVC
uPVC
uPVC
uPVC
1
1-11
8
2-3Total 294523

18
Table 13. Service laterals and Sub-Mains
Municipality Total length (lm) Size range Materials Age
Kalibo
33
222
8769
4632
78
15490
312
18
20
25
25
25
38
38
38
75
PB
GI
HDPE, PVC
PB
GI
HDPE
PB
GI
18
20,23
14-27
18-22
19
1-20
20-21
19
New Washington3486
9372
25
38
HDPE
HDPE
16-18
1-17
Banga130
3983
25
38
HDPE
HDPE
16
5-13Balete 2912 38 HDPE 1-13Batan 418 38 HDPE 3
Total 55173
To better manage the Distribution network valves were strategically placed by MKWD. ThisallowsMKWDmanagementmoreoperationalflexibilityandrange.AlsotakenfromtheDistribution Network Facilities and Asset Master List, the following summary of valves per municipality is shown in Table 12:
In its commitment to fully serve its coverage area, MKWD further extended its Distribution net-work with expansion of service laterals and sub-mains. A summary of said service laterals is shown in Table 11 taken from Section 3.2 of the Distribution Network Facilities and Assets Master List.

19
Table 14. Valves
Municipality Total No Size range (mm) Materials Age
Kalibo
1
3
9
122
12
68
13
82
5
34
3
10
18
12
3
2
20
25
50
50
50
75
75
100
100
150
150
200
200
250
250
300
B.R.
B.R.
B.R.
C.I
D.I.
C.I.
D.I.
C.I.
D.I.
C.I.
D.I.
C.I.
D.I.
C.I.
D.I.
C.I.
29
26-28
18-31
8-35
0-6
9-35
1-5
11-35
0-7
12-35
0-6
19,37
0-7
16,19,26,33
0-5
19
New Washington
4
36
5
1
6
12
2
16
1
3
3
50
50
50
75
75
75
100
100
100
150
200
B.R.
C.I.
D.I.
B.R.
C.I.
D.I.
B.r.
C.I.
D.I.
C.I.
C.I.
20-22
11-20
3-4
39
11-16,39
1-3
39
10-18
2
16-18
18
Banga
1
25
15
10
28
4
6
6
50
50
75
75
100
100
150
200
Brass
C.I.
C.I.
D.I.
C.I.
D.I.
C.I.
C.I.
10
8,9,13-21
8-18
1-3
9-18
2-3
14,18
12,14,18

20
Balete
13
1
1
9
6
12
50
75
75
100
100
150
C.I.
C.I.
D.I.
C.I.
D.I.
C.I.
13
13
3
9-13
0,2,11
13Batan 5 100 C.I. 10
Total 628
To compliment further its operations, hydrants and blow-offs were designed andimplementedforpurposesofflushingturbidwaterandforwaterextractionifneed-ed just as in the case of Bureau of Fire Protection. Hereunder is Table 13 which shows a summary of theabove-said appurtenances of the MKWD Distribution Network Facilities and Asset Master List:
Table 15. Hydrants and blow-offs
Municipality Total No Pipe/Head diameter (mm) Materials Age Status
Kalibo
1
1
5
3
2
14
24
6
3
1011
200/200
150/150
150/63
100/100
100/63
100/50
75/75
75/63
75/50
50/63
50/50
1
1
17-18
1,14,18
9,18
1,21
1-3,18,21-22,33
9,16-19,25-4,14,18,29,37,57
18,24-27
1-4,9,11-19,20-37
Serviceable
Serviceable
Serviceable
Serviceable
Serviceable
Serviceable
Serviceable
Serviceable
Serviceable
Serviceable
Serviceable
New Washington
1
3
2
11
12
7
34
200/200
100/100
100/63
75/75
75/63
75/50
50/50
25
2,25
1-2,14-16
18,39
3,19-16
3,9-16,25-26,39
Serviceable
Serviceable
Serviceable
Serviceable
Serviceable
Serviceable
Serviceable

21
2.11.2 Network Condition
Banga
1
2
25
20
1
25
100/100
100/63
75/75
75/63
75/50
50/50
14
18,39
1-5, 10-18,39
15-18,39
21
1—13,15-18,21-22
Serviceable
Serviceable
Serviceable
Serviceable
Serviceable
Serviceable
Balete
7
1
11
5
1
2
100/100, 100/75
75/75
75/63
50/75
50/50
0-13
8
3,13
13
13
13
Serviceable
Serviceable
Serviceable
Serviceable
Serviceable
Serviceable
Batan
7
1
3
100/100
75/75
50/50
3,12,13
13
3-5
Serviceable
Serviceable
Serviceable
Total 343
The ensuing table (Table 15) shall describe the conditions of the Distribution network in terms of service requests:
Month Turbid Water No Water Low Pressure LeakageJanuary 29 16 6 246February 20 7 3 206March 20 16 4 186April 15 9 3 146May 16 20 12 203June 23 13 9 218July 32 10 9 207August 19 3 3 203September 10 10 5 162October 15 5 6 162November 7 3 1 169December 5 12 2 160Total 211 124 63 2268Ave./month 17.58 10.33 5.25 189.00

22
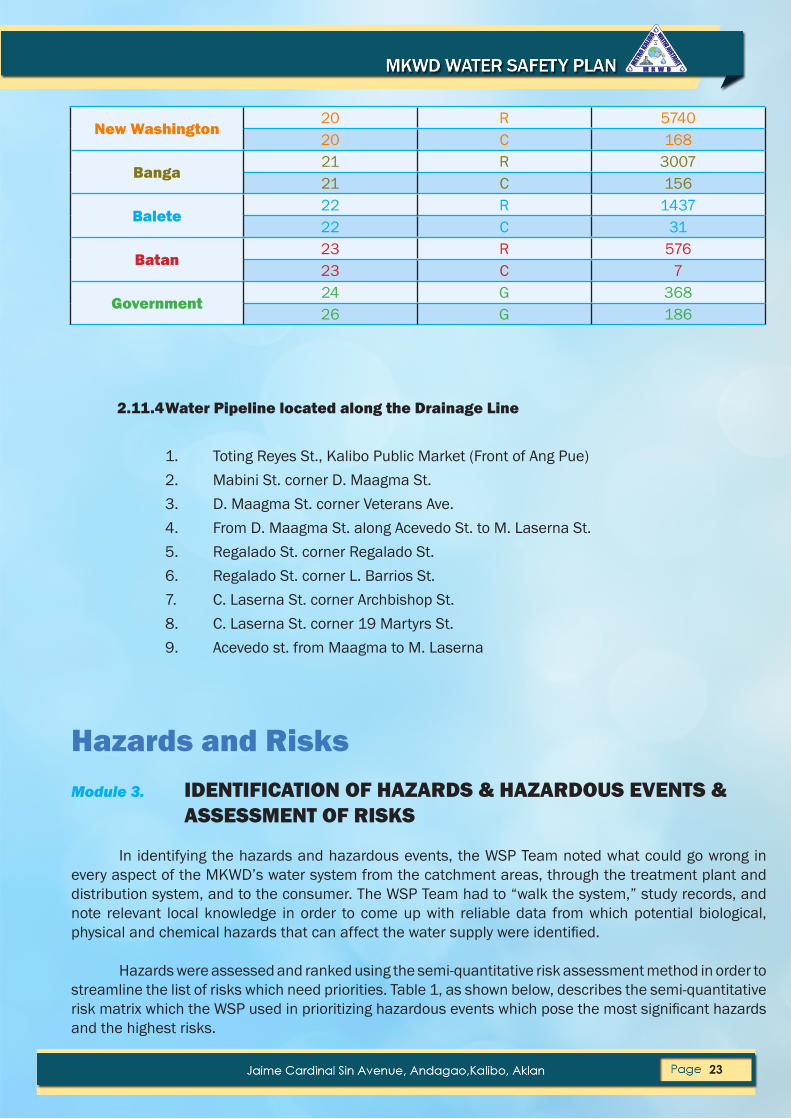
2.11.3 Consumer’s Installation
Municipality Zone Type Count
KALIBO
01 R 73801 C 9602 R 53702 C 9003 R 27003 C 28504 R 16104 C 32705 R 75905 C 22406 R 44906 C 10607 R 66007 C 3008 R 158708 C 3909 R 116909 C 13910 R 70010 C 15711 R 74211 C 2912 R 170812 C 13913 R 44913 C 31514 R 71614 C 15215 R 78215 C 17916 R 62616 C 20017 R 124217 C 6618 R 176718 C 8719 R 161519 C 16
Table 16. Transmission Mains
23
New Washington20 R 574020 C 168
Banga21 R 300721 C 156
Balete22 R 143722 C 31
Batan23 R 57623 C 7
Government24 G 36826 G 186
Hazards and RisksModule 3. IDENTIFICATION OF HAZARDS & HAZARDOUS EVENTS & ASSESSMENT OF RISKS
In identifyingthehazardsandhazardousevents,theWSPTeamnotedwhatcouldgowronginevery aspect of the MKWD’s water system from the catchment areas, through the treatment plant and distribution system, and to the consumer. The WSP Team had to “walk the system,” study records, and note relevant local knowledge in order to come up with reliable data from which potential biological, physicalandchemicalhazardsthatcanaffectthewatersupplywereidentified.
Hazardswereassessedandrankedusingthesemi-quantitativeriskassessmentmethodinordertostreamline the list of risks which need priorities. Table 1, as shown below, describes the semi-quantitative riskmatrixwhichtheWSPusedinprioritizinghazardouseventswhichposethemostsignificanthazardsand the highest risks.
2.11.4 Water Pipeline located along the Drainage Line
1. Toting Reyes St., Kalibo Public Market (Front of Ang Pue) 2. Mabini St. corner D. Maagma St. 3. D. Maagma St. corner Veterans Ave. 4. From D. Maagma St. along Acevedo St. to M. Laserna St. 5. Regalado St. corner Regalado St. 6. Regalado St. corner L. Barrios St. 7. C. Laserna St. corner Archbishop St. 8. C. Laserna St. corner 19 Martyrs St. 9. Acevedo st. from Maagma to M. Laserna

24
Semi-Quantitative Risk Matrix (from Deere et. al. 2001)Table 17
Table 18
Likelihood/ Frequency Severity/ Consequence
5 Almost Certain (Once a day) Catastrophic (Mortality expected)
4 Likely (Once a week) Major (Morbidity expected)
3 Moderate (Once a month)Moderate (Major objection – will lead to use of
alternative water)
2 Unlikely (Once a year)Minor (Minor objection – will not lead to use of
alternative water)
1 Rare (Once every five years) Insignificant (No detectable impact)
Risk Factor Matrix
Severity/ Consequence
Insignificant(No Impact)
1
Minor(Compliance
Impact)2
Moderate(AestheticImpact)
11
Major(Regulatory
Impact)4
Catastrophic(Public
Health Im-pact)
5
Likel
ihoo
d/ S
ever
ity
Almost Certain(Once a day)
Rating: 55 10 15 20 25
Likely(Once a week)
Rating: 44 8 12 16 20
Moderate(Once a month)
Rating: 33 6 9 12 15
Unlikely(Once a year)
Rating: 22 4 6 8 10
Rare(Onceeveryfive
years)Rating: 1
1 2 3 4 5
Risk Score <6 6-9 10-15 >15Risk Rating Low Moderate High Very High
For reference,allocated for purposes of this Water Safety Plan in terms of the frequency and conse-quencesofidentifiedhazardsandrisksareshownbelowinTable18.
For The purposes of this Water Safety Plan Module 3 and Module 4 was assessed, prepared and completedatthesametime.Shownbelow(Table19)istheoutputofhazardandriskassessmentusingthe semi-quantitative approach, covering the various points of the MKWD’s water system

25
For reference, the scores allocated for purposes of this Water Safety Plan in terms of the frequen-cyandconsequencesofidentifiedhazardsandrisksareshownbelowinTable18.
For The purposes of this Water Safety Plan Module 3 and Module 4 was assessed, prepared and completed at the same time. Shown below (Table 19)istheoutputofhazardandriskassessmentusingthe semi-quantitative approach, covering the various points of the MKWD’s water system
Control MeasuresModule 4. DETERMINE & VALIDATE CONTROL MEASURES, RE-ASSESS & PRIORITIZE THE RISKS
Inassessingandprioritizingtherisksaspresentedunderthepreviousmodule,theWSPTeamcon-currently documented existing and potential control measures. The risks were recalculated taking into considerationtheeffectivenessofsaidmeasures,andweresubsequentlyre-assessedandprioritizedaccording to their residual risk ratings, noting their likely impact on the capacity of the system to deliver safewater.BelowisTable18showinginsumtheresultsafteridentificationofcontrols,validatingtheireffectiveness,andidentificationandprioritizationofinsufficientlycontrolledrisks.
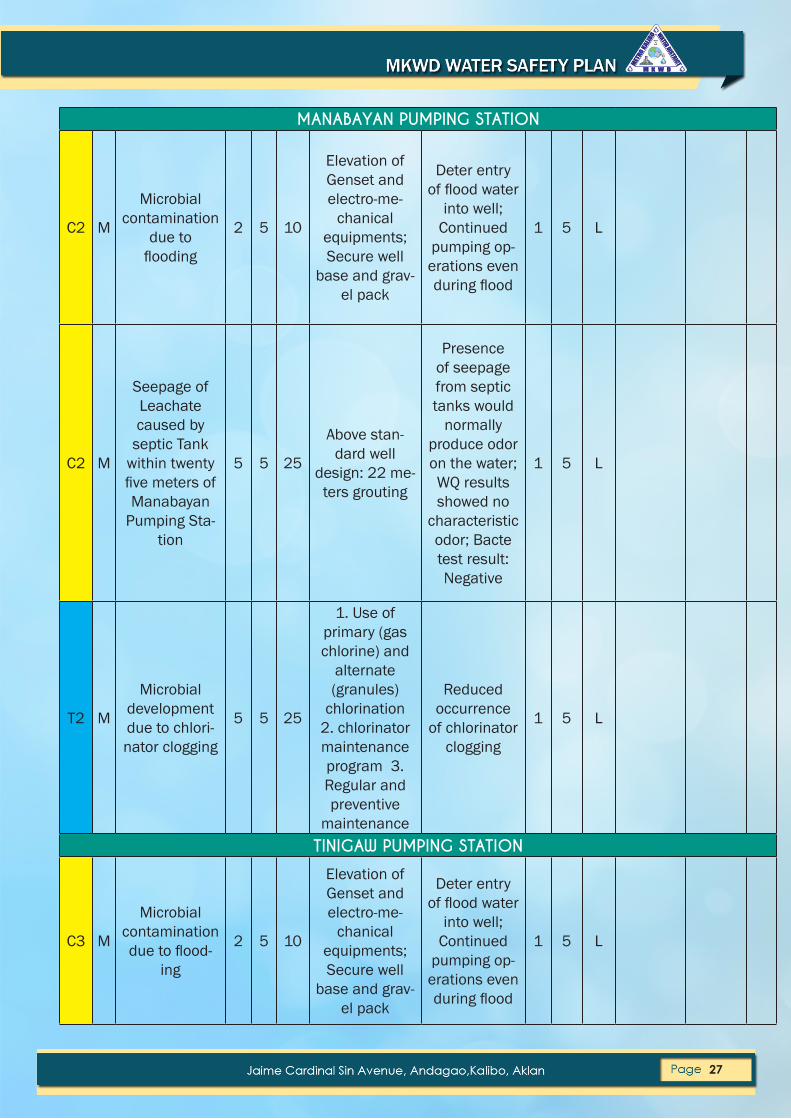
Table 19
Hazard Assessment & Risk Assessment Using the Semi-Quantitative Risk MatrixDetermination and Validation of Existing Control Measures, Re-Assessment
and Prioritization of Risks
Risk
Ref
Hazard Hazardous
event (source ofhazard)
Raw RiskExistingControl
Measure
Effectiveness of existing
controlmeasure
Re-sidual Risk
Prio
rity Pro-
posed Control
Measure
Valida-tion
PCM
Ref
Like
lihoo
d
Seve
rity
Scor
e
Like
lihoo
d
Seve
rity
LIBTONG PUMPING STATION
C1 M
Microbial contamination duetoflood-
ing
2 5 10
Elevation of Genset
and electro-mechanical equipments; Secure well base and
gravel pack

26
C1 M
Seepage of leachate from
septic tank six meters
upstream of Libtong Pump-
ing station
5 5 25
Above stan-dard well
design: 22 me-ters grouting
Presence of seepage from septic tanks
would normally produce odor on the water; WQ results showed no
characteristic odor; Bacte test result: Negative
1 5 L
C1 M
Seepage of leachate from
municipal drainage with-intwenty-five
meters of Libtong Pump-
ing station
5 5 25
Above stan-dard well
design: 22 me-ters grouting
Presence of seepage from septic tanks would
normally produce odor on the water; WQ results showed no
characteristic odor; Bacte test result: Negative
1 5 L
C1 C
Increase in salinity due to Salt water
intrusion
1 3 3
Minimizepumping oper-ations; iden-tify alternate
source
Increased/regulated
static water level
1 3 L
T1 M
Microbial development due to chlori-nator clogging
5 5 25
1. Use of primary (gas chlorine) and
alternate (granules)
chlorination 2. chlorinator maintenance program 3. Regular and preventive
maintenance
Reduced occurrence
of chlorinator clogging
1 5 L
27
MANABAYAN PUMPING STATION
C2 M
Microbial contamination
due to flooding
2 5 10
Elevation of Genset and electro-me-
chanical equipments; Secure well
base and grav-el pack
Deter entry offloodwater
into well; Continued
pumping op-erations even duringflood
1 5 L
C2 M
Seepage of Leachate caused by
septic Tank within twenty fivemetersofManabayan
Pumping Sta-tion
5 5 25
Above stan-dard well
design: 22 me-ters grouting
Presence of seepage from septic tanks would
normally produce odor on the water; WQ results showed no
characteristic odor; Bacte test result: Negative
1 5 L
T2 M
Microbial development due to chlori-nator clogging
5 5 25
1. Use of primary (gas chlorine) and
alternate (granules)
chlorination 2. chlorinator maintenance program 3. Regular and preventive
maintenance
Reduced occurrence
of chlorinator clogging
1 5 L
TINIGAW PUMPING STATION
C3 M
Microbial contamination duetoflood-
ing
2 5 10
Elevation of Genset and electro-me-
chanical equipments; Secure well
base and grav-el pack
Deter entry offloodwater
into well; Continued
pumping op-erations even duringflood
1 5 L

28
C3 M
Seepage of Leachate caused by
septic Tank within twenty fivemetersofTinigaw Pump-
ing Station
5 5 25
Above stan-dard well
design: 22 me-ters grouting
Presence of seepage from septic tanks would
normally produce odor on the water; WQ results showed no
characteristic odor; Bacte test result: Negative
1 5 L
T3 M
Microbial development due to chlori-nator clogging
5 5 25
1. Use of primary (gas chlorine) and
alternate (granules)
chlorination 2. chlorinator maintenance program 3. Regular and preventive
maintenance
Reduced occurrence
of chlorinator clogging
2 10 M
TIGAYON PUMPING STATION
C4 M
Microbial contamination duetoflood-
ing
2 5 10
Elevation of Genset and electro-me-
chanical equipments; Secure well
base and grav-el pack
Deter entry offloodwater
into well; Continued
pumping op-erations even duringflood
1 5 L
C4 M
Seepage of Leachate caused by
septic Tank within twenty fivemetersofTigayon Pump-
ing Station
5 5 25
Above stan-dard well
design: 22 me-ters grouting
Presence of seepage from septic tanks would
normally produce odor on the water; WQ results showed no
characteristic odor; Bacte test result: Negative
1 5 L

29
T4 M
Microbial development due to chlori-nator clogging
5 5 25
1. Use of primary (gas chlorine) and
alternate (granules)
chlorination 2. chlorinator maintenance program 3. Regular and preventive
maintenance
Reduced occurrence
of chlorinator clogging
2 10 M
BUBOG PUMPING STATION
C5 M
Microbial contamination duetoflood-
ing
2 5 10
Elevation of Genset and electro-me-
chanical equipments; Secure well
base and grav-el pack
Deter entry offloodwater
into well; Continued
pumping op-erations even duringflood
1 5 L
C5 M
Seepage of Leachate caused by
septic Tank within twenty fivemetersofBubog Pump-
ing Station
5 5 25
Above stan-dard well
design: 22 me-ters grouting
Presence of seepage from septic tanks would
normally produce odor on the water; WQ results showed no
characteristic odor; Bacte test result: Negative
1 5 L
T5 M
Microbial development due to chlori-nator clogging
5 5 25
1. Use of primary (gas chlorine) and
alternate (granules)
chlorination 2. chlorinator maintenance program 3. Regular and preventive
maintenance
Reduced occurrence
of chlorinator clogging
2 10 M

30
CUPANG PUMPING STATION
C6 M
Microbial contamination duetoflood-
ing
2 5 10
Elevation of Genset and electro-me-
chanical equipments; Secure well
base and grav-el pack
Deter entry offloodwater
into well; Continued
pumping op-erations even duringflood
1 5 L
C6 M
Seepage of Leachate caused by
septic Tank within twenty fivemetersofCupang Pump-
ing Station
5 5 25
Above stan-dard well
design: 22 me-ters grouting
Presence of seepage from septic tanks would
normally produce odor on the water; WQ results showed no
characteristic odor; Bacte test result: Negative
1 5 L
T6 M
Microbial development due to chlori-nator clogging
5 5 25
1. Use of primary (gas chlorine) and
alternate (granules)
chlorination 2. chlorinator maintenance program 3. Regular and preventive
maintenance
Reduced occurrence
of chlorinator clogging
2 10 M
PALALE PUMPING STATION
C7 C
Iron and Manganeese water quality
problem
5 4 20 De-commis-sioned 5 4 20
BULK WATER INJECTION POINT
B1
Microbial contamina-tion due to injection of
contaminated water due to failureoffilter
5 5 25 daily clorine re-sidual testing
NO contami-nated water
injected1 5 L
Daily bac-
ti-test
WQ result
= nega-tive PC
MB/
1

31
IX MARTYRS STORAGE TANK
S1 M
Microbial contamination due to accu-mulation of biofilminsidethe storage
tank
2 5 10Regular main-tenance every
six months
Minimizedbiofilmaccu-
mulation1 5 L
S1
Microbial contamination due to vermin intrusion from
vents/over-flows
5 5 25 all vents/over-flowsscreened
deterred ver-min intrusion 1 5 L
ESTANCIA STORAGE TANK
S2 M
Microbial contamination due to rainwa-ter seepage
due to inade-quate design for manhole
4 5 20 none N/A 4 5 20Improve manhole
cover
Site inspec-
tion. No
rain-water seep-age
PCM
S1/1
S2 M
Microbial contamination due to accu-mulation of biofilmduetooutlet drain
not located at the bottom
4 5 20Regular main-tenance every
six months
Minimizedbiofilmaccu-
mulation2 10 M
S2 M
Microbial contamination due to vermin intrusion from
vents/over-flows
5 5 25 all vents screened
deterred ver-min intrusion 1 5 L
ANDAGAO STORAGE TANK
S3 M
Microbial contamination due to rainwa-ter seepage
due to inade-quate design for manhole
4 5 20 none N/A 4 5 20Improve manhole
cover
No rain-water seep-age
PCM
S2/1

32
S3 M
Microbial contamination due to vermin intrusion from
vents/over-flows
5 5 25 all vents/over-flowsscreened
deterred ver-min intrusion 1 5 L
OCHANDO ELEVATED STEEL TANK
S4 M
Microbial contamination due to accu-mulation of biofilminsidethe storage
tank
2 5 10Regular main-tenance every
six months
Minimizedbiofilmaccu-
mulation1 5 L
S4
Microbial contamination due to vermin intrusion from
vents/over-flows
5 5 25 all vents/over-flowsscreened N/A 1 5 L
FELICIANO GROUND TANK
S5 M
Microbial contamination due to vermin intrusion from
vents/over-flows
5 5 25 all vents/over-flowscreened N/A 1 5 L
S5 M
Rainwater seepage due to slab dam-
age
3 5 15 none N/A 3 5 15 Install roofing
No rain-water seep-age
PCM
S5/1
S5 M Manhole cov-er corrosion 5 4 20 none N/A 5 4 20
Replace manhole
cover
No corro-sion at man-hole cover
PCM
S5/2

33
FELICIANO SUMP AND BOOSTER
S6 M
Microbial contamina-
tion made by saboteur due
to no guard on duty/perime-
ter fence
2 5 10 none N/A 2 5 10
Con-struction
of pe-rimeter fence
No un-autho-rized
access to
ground tank
PCM
S6/1
S6 M
Microbial contamination due to vermin intrusion from
vents/over-flows
5 5 25 all vents/over-flowscreened
deterred ver-min intrusion 1 5 L
S6 M
Microbial contamina-
tion manhole cover has no
lock
2 5 10 place lockdeterred
intrusion of contaminants
1 5 L
T7 M
Microbial development due to chlori-nator clogging
5 5 25
1. Use of primary (gas chlorine) and
alternate (granules)
chlorination 2. chlorinator maintenance program 3. Regular and preventive
maintenance
Reduced occurrence
of chlorinator clogging
1 5 L
D3 M
Intrusion of contaminants due to back flowatserviceconnections
with overhead tanks
5 5 25
Maintainsuficientwaterpressure 24/7.
Flushed all lines every
after isolation during repair and intercon-nection works
Deter intrusion of
contaminants2 10 M
Installa-tion of check valves
All water
service con-
nection with over-head tanks
shall be provid-ed with check valve
PCM
D3/
1

34
D4 M
Intrusion of contaminants at distribution lines that in-stalled under the drainage
2 5 10 none N/A 2 10 M
Reha-bilitate/relocate all lines
inter-secting
drainage
NO distri-bution lines inter-
secting drain-age
PCM
D4/
1
D5 P
Turbidity at specificloca-
tions and time of the day
4 4 16
Periodic flushingof
transmission mains
Minimizedturbidity <5NTU
2 8 M
Identify cause and
adopt a program to maintain an allow-
able amount of sediment-build
up in the pipeline
Mini-mized
tur-bidity
<5NTU PCM
D5/
1
LEGEND:
YELLOW CatchmentBLUE TreatmentRED StorageGREEN Distribution
LEGEND:
YELLOW CatchmentBLUE TreatmentRED StorageGREEN Distribution
After validation of control measures and re-calculation of risks, issues were narrowed based on thosewhicharemoresignificantandneedimmediateactionfromthosewhichareleastsignificantandcan be set aside for periodic review, using the table below for reference:
Risk Priority Level Action TypeVery High Immediate action
High Part of short-term planModerate Part of medium-term plan
Low For periodic review
Intheirorderofpriority,theidentifiedriskswerethenlistedasfollows:

35
Improvement Plan
Module 5. DEVELOP, IMPLEMENT AND MAINTAIN AN IMPROVEMENT PLAN
Risksthatwerefoundhavingnocontrolmeasuresinplaceorwereinsufficientlycontrolledhavebeensortedasseenontheprecedingmodule.Improvementandupgradingplanshavebeendrawntoaddresseachidentifiedrisk,takingnoteofthosewhichneedshort-,medium-orlong-termprograms.Assuch,allrisksthatwereidentified,includingthosewiththeleastsignificantimpact,wereconsidered,havinginmindtheeffectsofmanagingcostsforcapital investments without compromising water safety up to the consumers’ taps.
Table 20 as presented below shows the improvement plan developed by the WSP Team:
Table 20. Improvement/ Upgrading Plan
PCM
Ref Action
(Proposed Control
Measure)
Hazardous Event
Identified specific im-provement
plan
Account-abilities
Cost/Funding Source
Due Status
PCM
B/1
Daily collil-ert testing
Microbial con-tamination due to injection of contaminated
water
Require Bulk water supplier
Daily bactetesting
WRD Internal Funds 2017
Require submission of WSP from Bulk water
supplier
PCM
S1/1 Improve
manhole cover
Microbial con-tamination due
to rainwater seepage due to inadequate de-
sign for manhole
Fabricate ade-quately de-
signed man-hole cover
PDCD Internal Funds 2018 For submis-
sion of POW
PCM
S2/1 Improve
manhole cover
Microbial con-tamination due
to rainwater seepage due to inadequate de-
sign for manhole
Fabricate ade-quately de-
signed man-hole cover
WRD Internal Funds 2018 For submis-
sion of POW
PCM
S5/1
Rehabilitate top slab
Rainwater seep-age due to slab
damage
Rehabilitate ground tank PDCD Internal
Funds 2018
For submis-sion of design andspecifica-
tions

36
PCM
S5/2 Improve
manhole cover
Manhole cover corrosion
Fabricate ade-quately de-
signed man-hole cover
WRD Internal Funds 2018 For imple-
mentation
PCM
S6/1
Construc-tion of
concrete perimeter
fence
Microbial con-tamination
made by sabo-teur due to inad-equate perime-
ter fence
Construction of concrete perimeter
fence
PDCD Internal Funds 2018 For imple-
mentation
PCM
D3/
1
Installation of check valves
Intrusion of con-taminants due tobackflowatservice connec-tions with over-
head tanks
Installation of check valves
Com-mercial Services Division, Mainte-nance
Division, Planning/
Design & Con-
struction Division
Internal Funds
Internal Funds
2nd Qtr 2018
3rd Qtr2018
Quality Management
Systems report on
water service connections perzone
PCM
D4/
1 Realign all water lines away the drainage
Intrusion of contaminants to leaking distribu-tion lines from the drainage
All lines in-stalled away to drainage
Planning/Design & Con-
struction Division
Internal Funds
4th Qtr 2018
Right of way engineering
protocols: For issuance
Mainte-nance
Division
Internal Funds
Construction protocols: For
issuance
37
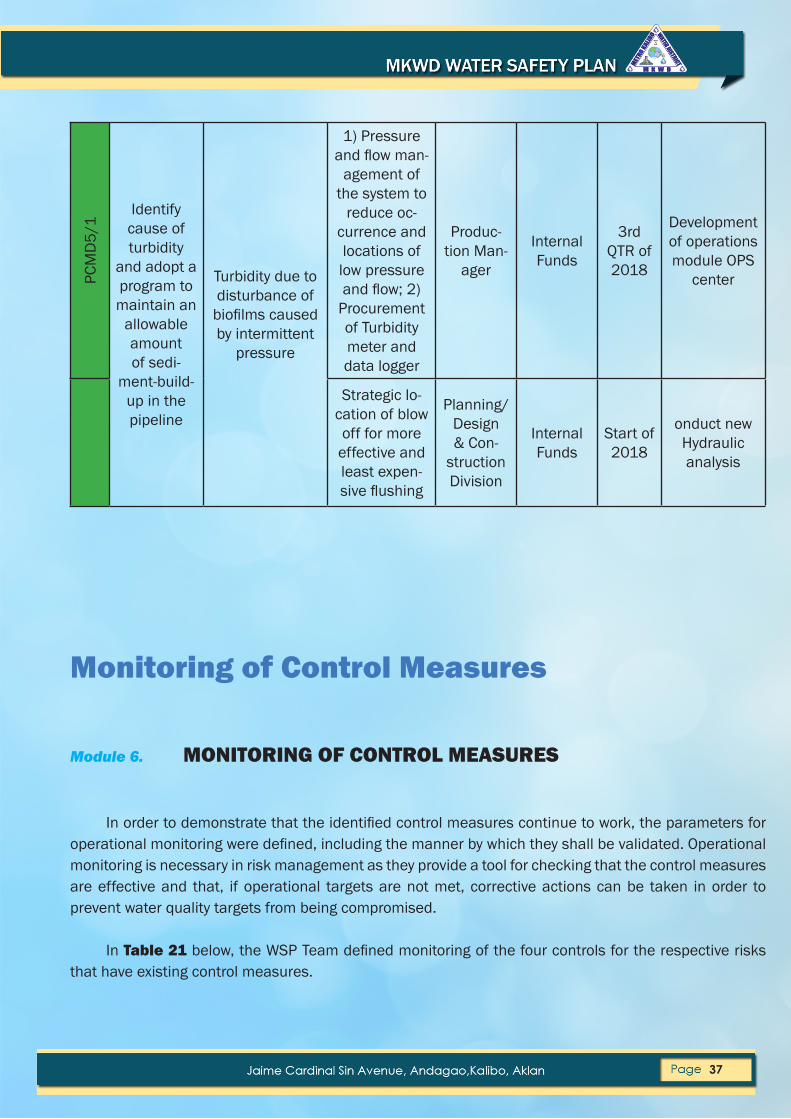
PCM
D5/
1
Identify cause of turbidity
and adopt a program to maintain an
allowable amount of sedi-
ment-build-up in the pipeline
Turbidity due to disturbance of biofilmscausedby intermittent
pressure
1) Pressure andflowman-
agement of the system to
reduce oc-currence and locations of low pressure andflow;2)
Procurement of Turbidity meter and data logger
Produc-tion Man-
ager
Internal Funds
3rd QTR of 2018
Development of operations module OPS
center
Strategic lo-cation of blow off for more
effective and least expen-siveflushing
Planning/Design & Con-
struction Division
Internal Funds
Start of 2018
onduct new Hydraulic analysis
Monitoring of Control Measures
Module 6. MONITORING OF CONTROL MEASURES
Inordertodemonstratethattheidentifiedcontrolmeasurescontinuetowork,theparametersforoperationalmonitoringweredefined,includingthemannerbywhichtheyshallbevalidated.Operationalmonitoring is necessary in risk management as they provide a tool for checking that the control measures are effective and that, if operational targets are not met, corrective actions can be taken in order to prevent water quality targets from being compromised.
In Table 21below,theWSPTeamdefinedmonitoringofthefourcontrolsfortherespectiverisksthat have existing control measures.

38
PCM Ref
Process Step: Control
Measure Critical
limit What Where When How Who Corrective action
Elevation of Genset and elec-
tro-mechan-ical equi-pements;
Secure well base and
gravel pack
> 1.3 me-ters from the NGL
his-torical floodlevel
Eleva-tion of Genset
and Elec-
tro-me-chan-ical
equip-ments
Pumping stations
regular inspec-tion and
every after
flooding
Facil-ity in-spec-tion
Water Re-
sourc-es
Man-ager
elevate further if
necessary; Submit re-port to GM
and rec-ommend for devel-opment review
Regulate pumping
operations
6.7 me-ters
<6.7 meters
static water level
Libtong Pumping Station
every month
ohm-meter
Water Re-
sourc-es
Man-ager
Adjust pumping
operations
Well de-sign should be within
standards; Regular well inspection
and mainte-nance are conducted
water quality test =
negative
Water quality test =
positive
Bacteri-ological
Test
Pumping station monthly
water quality sam-pling
labo-ratory techni-
cian
two con-secutive resam-plings /
additional flushing
1. Use of primary
(gas chlo-rine) and alternate (granules)
chlorination 2. chlorina-tor main-tenance program
1.5 ppm to 1.0 ppm
1.0 ppm
chlorine residual
at source and at
random in every zone
dailycom-para-
tor
labo-ratory techni-
cian
sub-chlori-nation
Table 21. Monitoring of Control Measures
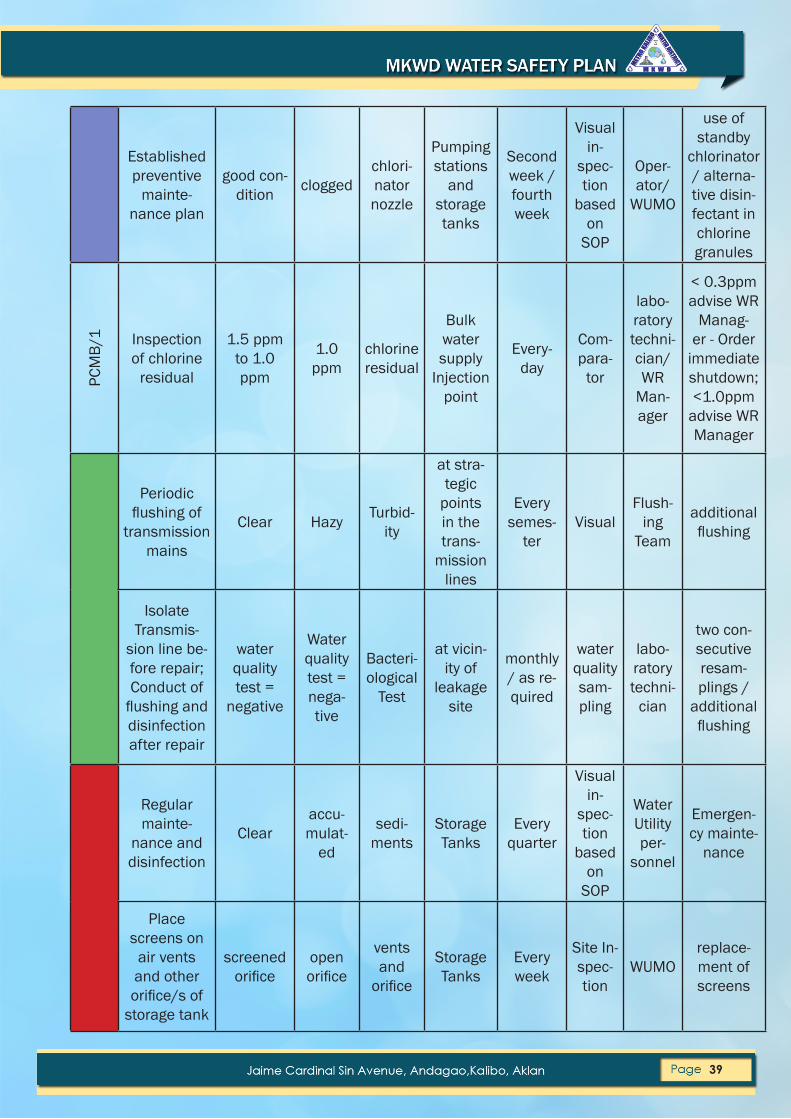
39
Established preventive
mainte-nance plan
good con-dition clogged
chlori-nator nozzle
Pumping stations
and storage tanks
Second week / fourth week
Visual in-
spec-tion
based on
SOP
Oper-ator/
WUMO
use of standby
chlorinator / alterna-tive disin-fectant in chlorine granules
PCM
B/1 Inspection
of chlorine residual
1.5 ppm to 1.0 ppm
1.0 ppm
chlorine residual
Bulk water supply
Injection point
Every-day
Com-para-
tor
labo-ratory techni-cian/WR
Man-ager
< 0.3ppm advise WR
Manag-er - Order
immediate shutdown; <1.0ppm
advise WR Manager
Periodic flushingof
transmission mains
Clear Hazy Turbid-ity
at stra-tegic
points in the trans-
mission lines
Every semes-
terVisual
Flush-ing
Team
additional flushing
Isolate Transmis-
sion line be-fore repair; Conduct of flushinganddisinfection after repair
water quality test =
negative
Water quality test = nega-tive
Bacteri-ological
Test
at vicin-ity of
leakage site
monthly / as re-quired
water quality sam-pling
labo-ratory techni-
cian
two con-secutive resam-plings /
additional flushing
Regular mainte-
nance and disinfection
Clearaccu-mulat-
ed
sedi-ments
Storage Tanks
Every quarter
Visual in-
spec-tion
based on
SOP
Water Utility per-
sonnel
Emergen-cy mainte-
nance
Place screens on
air vents and other orifice/sof
storage tank
screened orifice
open orifice
vents and orifice
Storage Tanks
Every week
Site In-spec-tion
WUMOreplace-ment of screens

40
chlorination 0.6ppm 0.3 ppm
chlorine residual
Felicia-no/New Washing-ton S&B
Every-day
Com-para-
tor
Opera-tor
sub-chlori-nation
Established preventive
mainte-nance plan
good con-dition clogged
chlori-nator nozzle
Storage Tanks
Second week / fourth week
reg-ular
main-te-
nance based
on SOP
Opera-tor
use of standby
chlorinator / alterna-tive disin-fectant in chlorine granules
Sectional lineflushing Clear Hazy Turbid-
ityDistribu-tion lines
Every quarter visual
Flush-ing
Team
additional flushing
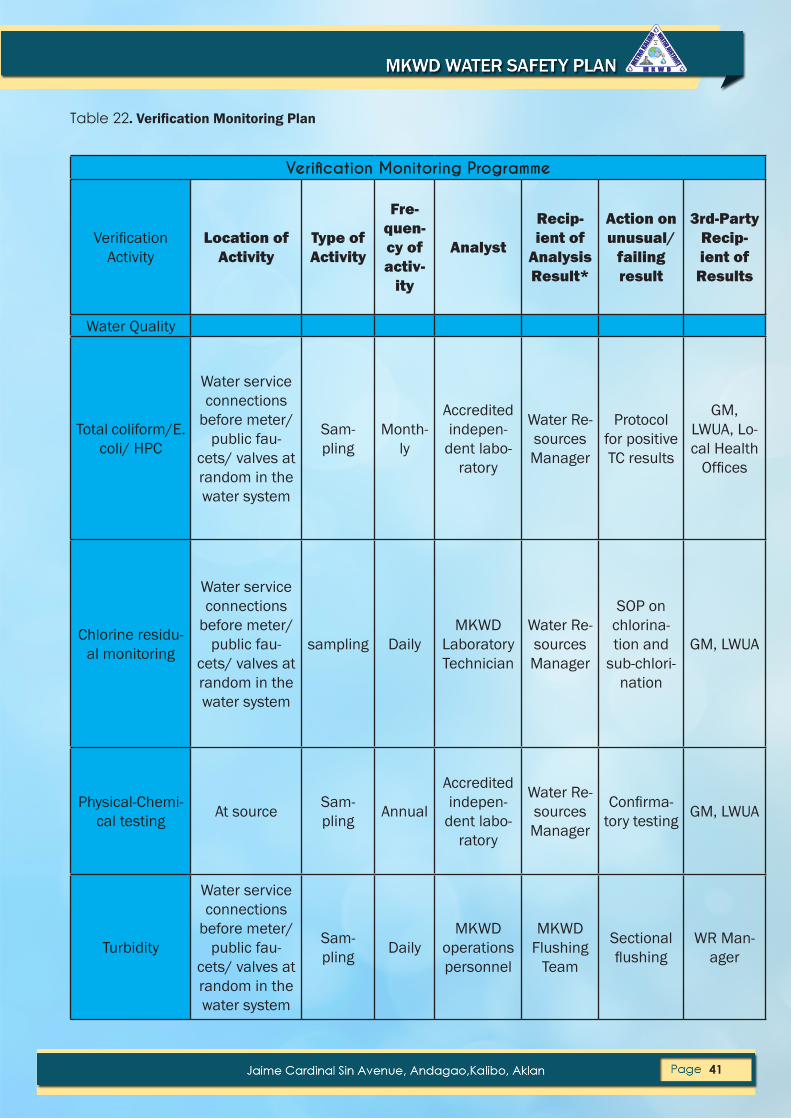
VerificationModule 7. VERIFY THE EFFECTIVENESS OF THE WSP
VerificationshallbenecessaryinordertodeterminewhetherornotthisWSPisworkingproperly.Itinvolves three activities that are to be undertaken together to provide evidence of its effectiveness. These are:
• Compliance monitoring; • Internal and external auditing of operational activities; and • Consumer satisfaction.
Compliancemonitoringinvolvesconfirmationofcompliancewithwaterqualitytargets.Ontheotherhand, internal and external auditing of operational activities can be used in assessment and in checking compliancetorequiredstandards.Thefrequencyofauditdependsonthelevelofconfidencerequiredbythe MKWD and the regulatory body. Meanwhile, consumer satisfaction includes obtaining feedback from consumersiftheyaresatisfiedwiththewatersuppliedtothem.
Insum,verificationshouldprovideevidencethattheoverallsystemdesignandoperationiscapableofconsistentlydeliveringwaterofthespecifiedqualitytomeetthehealth-basedtargets.Ifitdoesnot,theupgrade and improvement plan shall be revised and implemented.Thetablebelowshowstherespectiveverificationmonitoringplanfortheidentifiedcontrolmeasures.
41
Table 22. Verification Monitoring Plan
Verification Monitoring Programme
VerificationActivity
Location of Activity
Type of Activity
Fre-quen-cy of activ-
ity
Analyst
Recip-ient of
Analysis Result*
Action on unusual/
failing result
3rd-Party Recip-ient of Results
Water Quality
Total coliform/E.coli/ HPC
Water service connections
before meter/ public fau-
cets/ valves at random in the water system
Sam-pling
Month-ly
Accredited indepen-
dent labo-ratory
Water Re-sources Manager
Protocol for positive TC results
GM, LWUA, Lo-cal Health Offices
Chlorine residu-al monitoring
Water service connections
before meter/ public fau-
cets/ valves at random in the water system
sampling DailyMKWD
Laboratory Technician
Water Re-sources Manager
SOP on chlorina-tion and
sub-chlori-nation
GM, LWUA
Physical-Chemi-cal testing At source Sam-
pling Annual
Accredited indepen-
dent labo-ratory
Water Re-sources Manager
Confirma-tory testing GM, LWUA
Turbidity
Water service connections
before meter/ public fau-
cets/ valves at random in the water system
Sam-pling Daily
MKWD operations personnel
MKWD Flushing
Team
Sectional flushing
WR Man-ager

42
Internal Audit
VerificationActivity
Location of Activity
Type of Activity
Fre-quency of ac-tivity
AuditorRecipient of Audit Result*
Action on areas for improve-
ment
3rd-Party Recipient of Results
Verificationof operations
monitoring
Water Facili-ties and on-
site
Internal audit
Un-sched-uled,
at least
twice a year
Internal Au-dit/Quality Represen-
tative
General Manager / Board of Direc-
tors
Devel-opment Review
and Rec-ommenda-
tions
WSP external
audit
VerificationofEquipment and instrumentation
accuracy
Calibration section
Inernal audit
Un-sched-uled,
at least
once a year
Internal Au-dit/Quality Represen-
tative
General Manager / Board of Direc-
tors
Devel-opment Review
and Rec-ommenda-
tions
WSP external
audit
External Audit
VerificationActivity
Location of Activity
Type of Activity
Fre-quency of ac-tivity
AuditorRecipient of Audit Result*
Action on areas for improve-
ment
3rd-Party Recipient of Results
will comply with guidelines of
regulatory agen-cies
Customer Satis-faction
VerificationActivity
Location of Activity
Type of Activity
Fre-quency of ac-tivity
Analyst
Recip-ient of
Analysis Result*
Action on areas for improve-
ment
3rd-Party Recipient of Results
Customer Feed-back
Payment/Col-lection Area Survey Daily
Internal audit/Qual-
ity repre-sentative
WSP/QMS Team
Devel-opment Review
and Rec-ommenda-
tions
GM, Con-cerned Units
*It is assumed that the recipient of the activity result is the entity responsible for the activity

43
Management ProceduresModule 8. MANAGEMENT PROCEDURES
Clear management procedures documenting actions to be taken when the system is operating under normal conditions (Standard Operating Procedures or SOPs) and when the system is operating in ‘incident’ situations (corrective actions) are an integral part of the WSP. For standard operating procedures under normal conditions the approved Revised Operations Manual (Revision1) shall be used.For procedures due to incidents that breaches the critical limits as set in this water safety plan or on incidents of near misses the following procedures shall be followed: A. Incidents that breaches the critical limits B. Incidents of near misses
In such cases the following procedures shall be followed to institute the proper corrective actions: A. InvestigationandVerificationofincidentofresponsibledivision B. Documentation of incidents by the Water Safety Plan Team C. Automatic review of procedures D. Develop/Reiterate Personnel Training E. Calibration of support programs F. Calibration of Water Safety Plan On the other hand, in case of improvement or upgrade plans here are the prescribed management procedures: A. Annual Systems and Development review and recommendations shall be conducted every month of November B. AnnualreviewofVerificationprogramofWaterSafetyPlan The MKWD is in the process of developing and implementing its quality management systems. These processes shall be give special focus on the water supply operations and water service connections processes.
In cases of emergency, the Emergency Action Plan of MKWD shall be deployed and it will be guided by the Revised Operations Manual (Revision1) and this Water Safety Plan. In connection with the foregoing procedures the following communication protocols shall be followed:
1. Communication protocols
a. Consumers (Table 23)
Line of Communication and Reporting Person responsibleReport of operational limit breach to the Division Manager
Plant / Field / Technical Personnel
Report of situational assessment to the General Manager
Division Manager
Approve Public Advisory General Manager / PIOPublic Advisory to Consumers thru Broadcast Media and Social Media
Consumers

44
Line of Communication and Reporting Person ResponsibleReport of operational limit breach to the Division Man-ager. (Initiate operations shutdown)
Field / Technical Personnel
Water Resources Division Manager advises Bulk Water Supplier Operations Manager
Water Resources Division Manager
Bulk Water Supplier Operations Manager acknowledges Bulk Water Supplier Operations ManagerBulk Water Supplier shuts down facility Bulk Water Supplier Personnel
Report of operational limit breach to the Division Man-ager
Plant Operator
Report of situational assessment to the General Man-ager
Division Manager
Send Advisory to Environmental Agency concerned General Manager/PIOEnvironmental Agency sends Emergency Response Team
Environmental Agency
Prepare laboratory results of PNSDW compliance Laboratory TechnicianPrepares transmittal of laboratory results of PNSDW compliance
Water Resources Division Manager
Approves submission to Municipal / Provincial Health Officer
General Manager
Acknowledges submission of results Municipal/ProvincialHealthOfficer
Prepare statutory and operational requirements and compliance
Division Manager
Approves submission to regulatory body General ManagerRegulatory body acknowledges compliance Regulator
b. Bulk Water supplier (Table 24)
c. Environmental agencies (Table 25)
2. Out of hours / On call In every case, all personnel shall be in an On-call duty during emergencies and other calamities.
e. Health authorities (Table 27)
d. Regulators (Table 26)

45
Support ProgramsModule 9.
In support of the Water Safety Plan Development and Implementation the MKWD have committed a more holistic approach in its water supply operations. The continuous development and update of necessary and pertinentdocumentsliketheoperationsmanualandthecitizen’scharterarebeinggivenpriority.Thisyearthedevelopment of the MKWD Quality Management Systems continue to encompass all processes of the District with special focus on the water supply operations and water service connection services. In relation to the Water Safety Plan per se, the MKWD will be developing and implementing its program for the Integration of a Geo-spatial platform for the Water Distribution facilities and assets in the water supply operations. The activity involves the comprehensive mapping of the MKWD network with Geographic Information Systems. This will be developed with the end view of incorporating Hydraulic modeling of the system to monitor among others water quality issues. A Research and Development Program is also being eyed to provide MKWD for technical and data information with regards the catchment area of the Metro Kalibo Water District. To compliment all these developments a Program for the Training and Development of the MKWD employees to properly implement the Water Safety Plan
Table 28. WSP SUPPORTING PROGRAMMES
CATCHMENT
Program Purpose Activities
1 Training and AwarenessEquip Plant personnel in daily handling of chlo-rine gas and Emergency Response Personnel in handling chlorine gas during leaks
Seminar on Safe Handling of LiquefiedchlorineGasJuly7,2017
2 Research and DevelopmentDetermination of the hy-drological cycle of the wellfieldofMKWD
Conduct of isotopic dating of raw water for the deep wells
3 Distribution Network Fa-cilities and Asset Manage-ment
Develop an In-House Water Supply Operations Module in a GIS platform utilizingtheDistributionNetwork Facilities and Asset Master List.
Comprehensive and integrated mapping of the MKWD Distribution Network Facilities and Asset Mas-ter List

46
Periodic ReviewModule 10.
For the purposes of the establishment of this Water Safety Plan, this year of 2017, upon approval of the MKWD Board of Directors a monthly, quarterly and annual review shall be conducted as follows.
Table 29.
In2018aquarterlyreviewshallbescheduledforthemonitoringofverificationlimitsandtheimplementationofImprovementPlans.FormonitoringofVerificationprogramsanannualreviewwillbeset.ThescheduleforperiodicreviewshallbeasdefinedhereunlessrevisedbytheWaterSafetyPlanTeaminthefutureasitmaydeemfit.
Revision of the WSP following an incidentModule 11.
Asoutlinedpreviously, toensure thataWSPcoversemerginghazardsand issues, itshouldbe reviewedperiodicallyby theWSP team.Aparticularbenefitof implementing theWSP framework isa likely reduction inthe number and severity of incidents, emergencies or near misses affecting or potentially affecting drinking-water quality. However, such events may still occur. In addition to the periodic review, it is important that the WSPisreviewedfollowingeveryemergency, incident,orunforeseenevent irrespectiveofwhethernewhazardswereidentifiedtoensurethat,ifpossible,thesituationdoesnotrecuranddeterminewhethertheresponsewassufficientorcouldhavebeenhandledbetter.
Aside from this regular review of the Water Safety Plan, mandatory review shall be performed within one week from any occasion of breach of any critical limits or near-misses of such. The following procedures shall be strictly followed in every such incident of breach and near misses, to wit:
INVESTIGATION AND DOCUMENTATION OF INCIDENTS
1. The Implementing Division concerned shall prepare an incident report to be submitted to the Department Manager/General Manager copy furnished the Water Safety Plan Team Leader. 2. The Water Safety Plan Group concerned shall gather and collate all the necessary papers and other documentation for the review of the WSP Team. If necessary, the group shall take pictures of the site of the incident. 3. The review shall be conducted within one week from the incident of breach or near miss. For the purposes of this module one week for the incident of breach shall mean, a week after the cessation of the breach of an operational limit and the application of the proper corrective action
Monitoring of WSP FrequencyMonitoring of operational limits Water facilities Group, Water
Distribution GroupMonthly
Implementation of Improvement Plans
Water facilities Group and Water Distribution Group
Quarterly
Monitoringofverificationprograms WSP Team Annual

47
ANNEXES TO WATER SAFETY PLAN a. OfficeOrder2015 b. OfficeOrder2016 c. MKWD Board resolution no.024, s. 2017 d. Inter-officememo(scheduleofmeetings)

48

49

50

52