tackling methamphetamine: progress report · pdf filepolicy advisory group tackling...
TRANSCRIPT
Tackling Methamphetamine: Progress Report
October 2015
DEPARTMENT of the PRIME MINISTER
and CABINET
Tackling Methamphetamine: Indicators and Progress Report October 2015
Contents
Introduction ........................................................................................................................... 1 1.1 Purpose ....................................................................................................................... 1 1.2 Latest data and reports on progress............................................................................. 1 1.3 Overview of expected results and indicators ................................................................ 1
Part 1: Progress on cross-agency actions since 2009 ........................................................... 3 Part 2: Methamphetamine supply is controlled ...................................................................... 5
2.1 Price ............................................................................................................................ 5 2.2 Purity ........................................................................................................................... 6 2.3 Availability .................................................................................................................... 7 2.4 Seizures ....................................................................................................................... 8 2.5 People are deterred from the methamphetamine trade ................................................ 9
Part 3: Demand for methamphetamine is reduced ................................................................12 3.1 Prevalence ..................................................................................................................12 3.2 Frequency of use ........................................................................................................13 3.3 Communities and government agencies help users into treatment .............................13
Annex 1: Key data sources ...................................................................................................16
POLICY ADVISORY GROUP
Tackling Methamphetamine: Indicators and Progress Report October 2015 1
Introduction 1.1 Purpose This report outlines the progress made since the launch of the Government's Tackling Methamphetamine: an
Action Plan (the Action Plan) in 2009. It shows the changes against the Action Plan's baseline data of 2008 or 2009
and details progress on the actions identified in 2009.
1.2 Latest data and reports on progress Reports on progress against the Action Plan are provided to the Prime Minister and the Ministers of Justice, Health,
Police, Corrections, Customs and for Māori. DPMC coordinates the reporting process and the Interagency
Committee on Drugs, made up of senior officials from the relevant agencies, approves the reports.
Given the completion of the 2009 action plan and stabilisation in the methamphetamine market, progress will be
reported yearly against key demand and supply side indicators going forward. These indicators were identified as the expected areas of results in 2009. For these indicators, the data sources remain the same.
Data sources are described in Tackling Methamphetamine: Baseline Indicators Report at
http://www.beehive.govt.nz/sites/all/files/baseline_indicators.pdf. Annex 1 has a high-level description of the
differences between some of the key data sources.
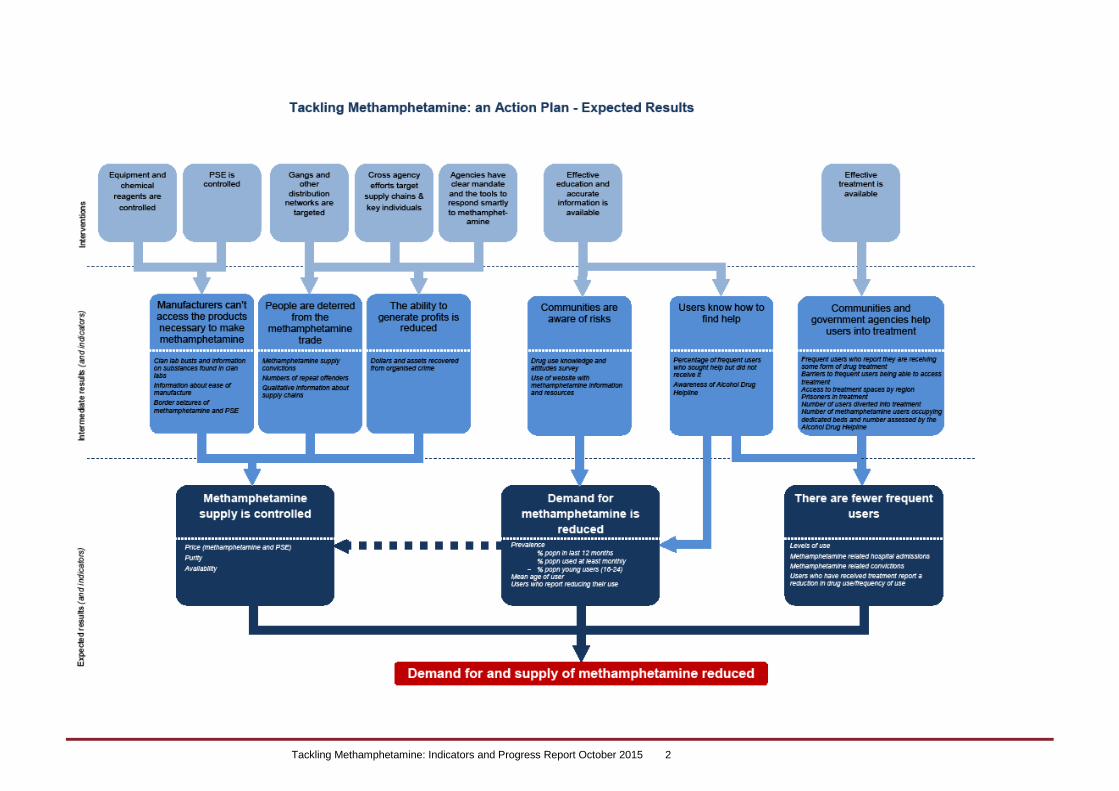
1.3 Overview of expected results and indicators An overview of the actions, expected results, and the indicator set can be found in the Action Plan available at http://www.beehive.govt.nz/sites/all/files/ActionPlan.pdf. Previous Progress and Indicator Reports can be found at
http://www.dpmc.govt.nz/dpmc/publications/methamphetamine. The indicators in this report measure the expected
results from the Action Plan (as outlined in the next page).
Tackling Methamphetamine: Indicators and Progress Report October 2015 2
Tackling Methamphetamine: Indicators and Progress Report October 2015 3
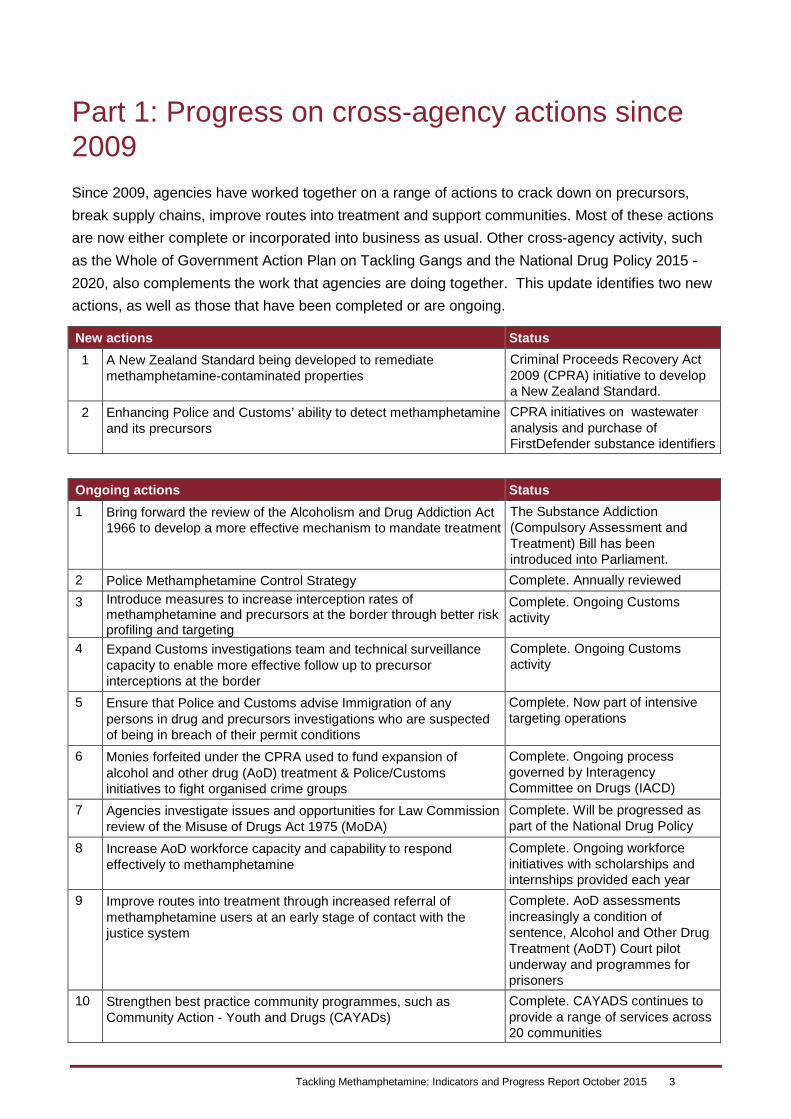
Part 1: Progress on cross-agency actions since 2009 Since 2009, agencies have worked together on a range of actions to crack down on precursors, break supply chains, improve routes into treatment and support communities. Most of these actions are now either complete or incorporated into business as usual. Other cross-agency activity, such as the Whole of Government Action Plan on Tackling Gangs and the National Drug Policy 2015 -2020, also complements the work that agencies are doing together. This update identifies two new actions, as well as those that have been completed or are ongoing.
New actions Status 1 A New Zealand Standard being developed to remediate
methamphetamine-contaminated properties Criminal Proceeds Recovery Act 2009 (CPRA) initiative to develop a New Zealand Standard.
2 Enhancing Police and Customs’ ability to detect methamphetamine and its precursors
CPRA initiatives on wastewater analysis and purchase of FirstDefender substance identifiers
Ongoing actions Status 1 Bring forward the review of the Alcoholism and Drug Addiction Act
1966 to develop a more effective mechanism to mandate treatment The Substance Addiction (Compulsory Assessment and Treatment) Bill has been introduced into Parliament.
2 Police Methamphetamine Control Strategy Complete. Annually reviewed 3 Introduce measures to increase interception rates of
methamphetamine and precursors at the border through better risk profiling and targeting
Complete. Ongoing Customs activity
4 Expand Customs investigations team and technical surveillance capacity to enable more effective follow up to precursor interceptions at the border
Complete. Ongoing Customs activity
5 Ensure that Police and Customs advise Immigration of any persons in drug and precursors investigations who are suspected of being in breach of their permit conditions
Complete. Now part of intensive targeting operations
6 Monies forfeited under the CPRA used to fund expansion of alcohol and other drug (AoD) treatment & Police/Customs initiatives to fight organised crime groups
Complete. Ongoing process governed by Interagency Committee on Drugs (IACD)
7 Agencies investigate issues and opportunities for Law Commission review of the Misuse of Drugs Act 1975 (MoDA)
Complete. Will be progressed as part of the National Drug Policy
8 Increase AoD workforce capacity and capability to respond effectively to methamphetamine
Complete. Ongoing workforce initiatives with scholarships and internships provided each year
9 Improve routes into treatment through increased referral of methamphetamine users at an early stage of contact with the justice system
Complete. AoD assessments increasingly a condition of sentence, Alcohol and Other Drug Treatment (AoDT) Court pilot underway and programmes for prisoners
10 Strengthen best practice community programmes, such as Community Action - Youth and Drugs (CAYADs)
Complete. CAYADS continues to provide a range of services across 20 communities
Tackling Methamphetamine: Indicators and Progress Report October 2015 4
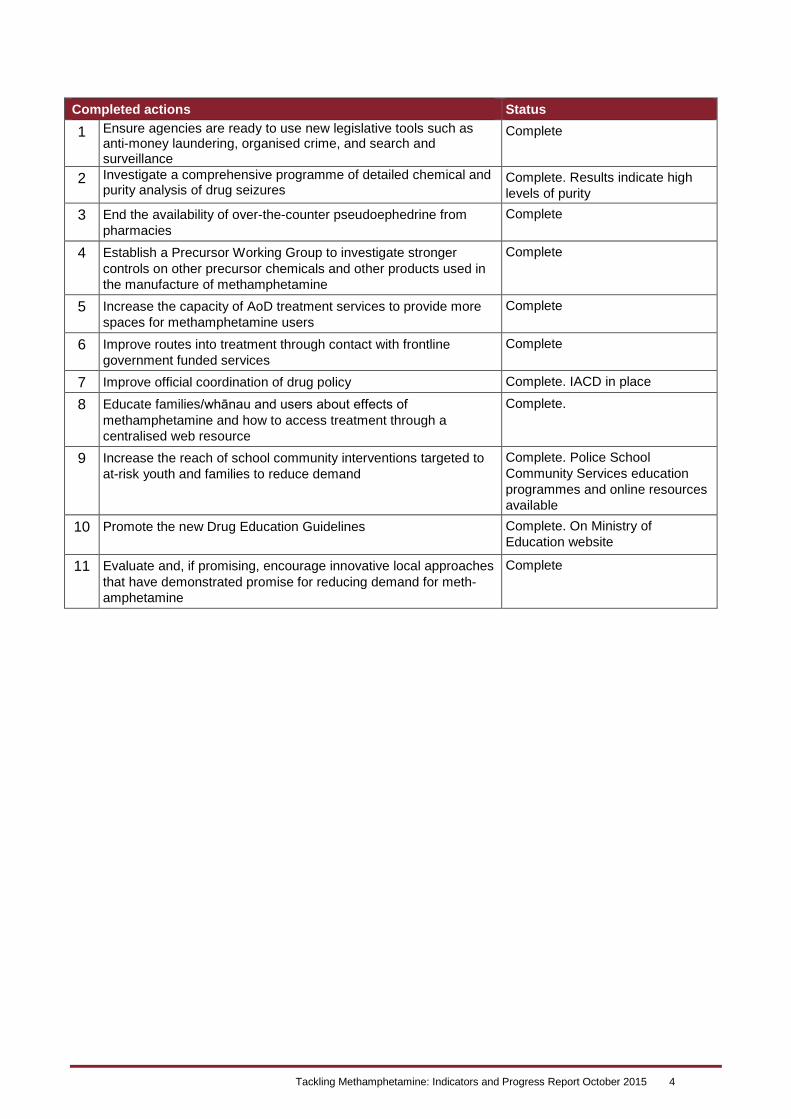
Completed actions Status
1 Ensure agencies are ready to use new legislative tools such as anti-money laundering, organised crime, and search and surveillance
Complete
2 Investigate a comprehensive programme of detailed chemical and purity analysis of drug seizures
Complete. Results indicate high levels of purity
3 End the availability of over-the-counter pseudoephedrine from pharmacies
Complete
4 Establish a Precursor Working Group to investigate stronger controls on other precursor chemicals and other products used in the manufacture of methamphetamine
Complete
5 Increase the capacity of AoD treatment services to provide more spaces for methamphetamine users
Complete
6 Improve routes into treatment through contact with frontline government funded services
Complete
7 Improve official coordination of drug policy Complete. IACD in place
8 Educate families/whānau and users about effects of methamphetamine and how to access treatment through a centralised web resource
Complete.
9 Increase the reach of school community interventions targeted to at-risk youth and families to reduce demand
Complete. Police School Community Services education programmes and online resources available
10 Promote the new Drug Education Guidelines Complete. On Ministry of Education website
11 Evaluate and, if promising, encourage innovative local approaches that have demonstrated promise for reducing demand for meth-amphetamine
Complete
Tackling Methamphetamine: Indicators and Progress Report October 2015 5
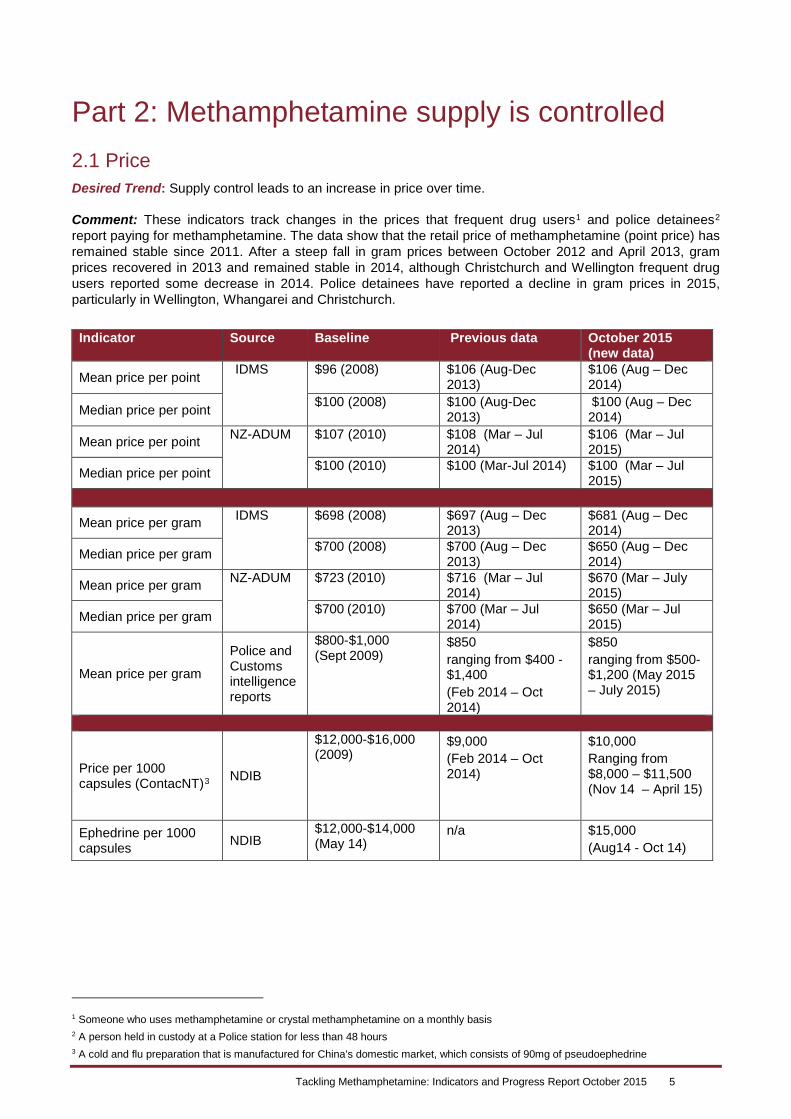
Part 2: Methamphetamine supply is controlled 2.1 Price Desired Trend: Supply control leads to an increase in price over time. Comment: These indicators track changes in the prices that frequent drug users1 and police detainees2 report paying for methamphetamine. The data show that the retail price of methamphetamine (point price) has remained stable since 2011. After a steep fall in gram prices between October 2012 and April 2013, gram prices recovered in 2013 and remained stable in 2014, although Christchurch and Wellington frequent drug users reported some decrease in 2014. Police detainees have reported a decline in gram prices in 2015, particularly in Wellington, Whangarei and Christchurch. Indicator Source Baseline Previous data October 2015
(new data)
Mean price per point IDMS $96 (2008) $106 (Aug-Dec 2013)
$106 (Aug – Dec 2014)
Median price per point $100 (2008) $100 (Aug-Dec 2013)
$100 (Aug – Dec 2014)
Mean price per point NZ-ADUM $107 (2010) $108 (Mar – Jul 2014)
$106 (Mar – Jul 2015)
Median price per point $100 (2010) $100 (Mar-Jul 2014) $100 (Mar – Jul 2015)
Mean price per gram IDMS $698 (2008) $697 (Aug – Dec 2013)
$681 (Aug – Dec 2014)
Median price per gram $700 (2008) $700 (Aug – Dec 2013)
$650 (Aug – Dec 2014)
Mean price per gram NZ-ADUM $723 (2010) $716 (Mar – Jul 2014)
$670 (Mar – July 2015)
Median price per gram $700 (2010) $700 (Mar – Jul 2014)
$650 (Mar – Jul 2015)
Mean price per gram
Police and Customs intelligence reports
$800-$1,000 (Sept 2009)
$850 ranging from $400 - $1,400 (Feb 2014 – Oct 2014)
$850 ranging from $500- $1,200 (May 2015 – July 2015)
Price per 1000 capsules (ContacNT)3 NDIB
$12,000-$16,000 (2009)
$9,000 (Feb 2014 – Oct 2014)
$10,000 Ranging from $8,000 – $11,500 (Nov 14 – April 15)
Ephedrine per 1000 capsules NDIB
$12,000-$14,000 (May 14)
n/a $15,000 (Aug14 - Oct 14)
1 Someone who uses methamphetamine or crystal methamphetamine on a monthly basis 2 A person held in custody at a Police station for less than 48 hours 3 A cold and flu preparation that is manufactured for China’s domestic market, which consists of 90mg of pseudoephedrine
Tackling Methamphetamine: Indicators and Progress Report October 2015 6
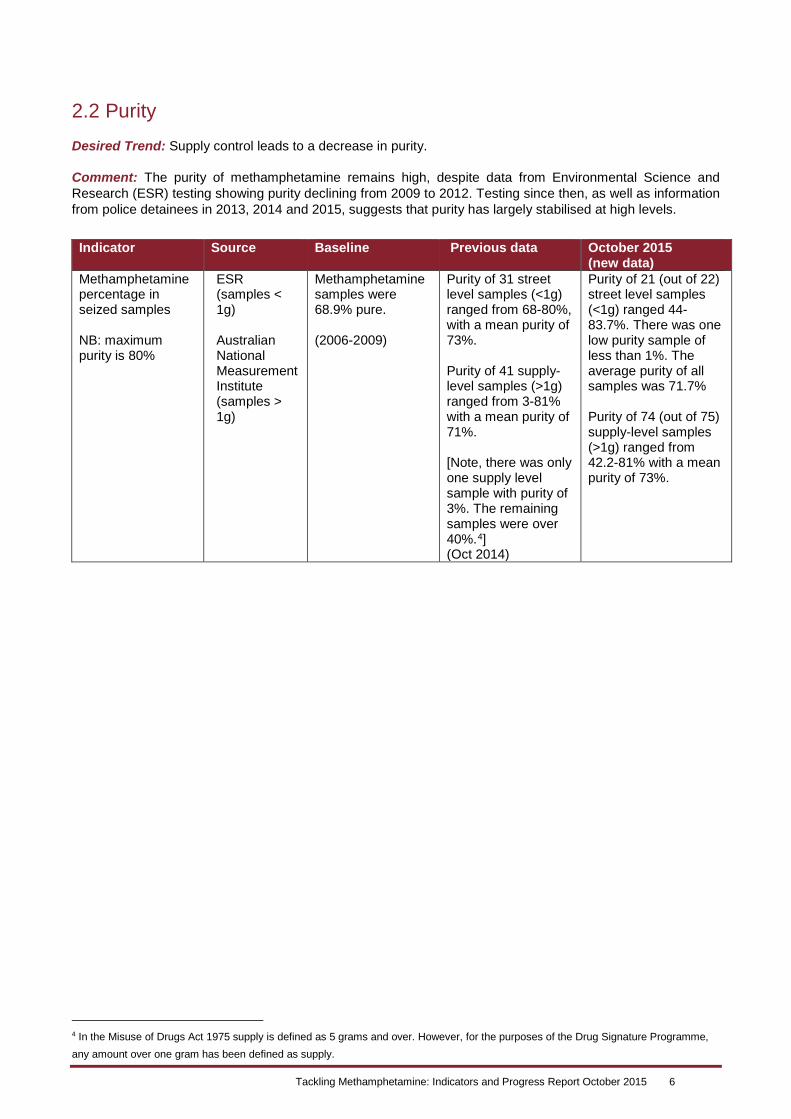
2.2 Purity Desired Trend: Supply control leads to a decrease in purity. Comment: The purity of methamphetamine remains high, despite data from Environmental Science and Research (ESR) testing showing purity declining from 2009 to 2012. Testing since then, as well as information from police detainees in 2013, 2014 and 2015, suggests that purity has largely stabilised at high levels. Indicator Source Baseline Previous data October 2015
(new data) Methamphetamine percentage in seized samples NB: maximum purity is 80%
ESR (samples < 1g) Australian National Measurement Institute (samples > 1g)
Methamphetamine samples were 68.9% pure. (2006-2009)
Purity of 31 street level samples (<1g) ranged from 68-80%, with a mean purity of 73%. Purity of 41 supply- level samples (>1g) ranged from 3-81% with a mean purity of 71%. [Note, there was only one supply level sample with purity of 3%. The remaining samples were over 40%.4] (Oct 2014)
Purity of 21 (out of 22) street level samples (<1g) ranged 44-83.7%. There was one low purity sample of less than 1%. The average purity of all samples was 71.7% Purity of 74 (out of 75) supply-level samples (>1g) ranged from 42.2-81% with a mean purity of 73%.
4 In the Misuse of Drugs Act 1975 supply is defined as 5 grams and over. However, for the purposes of the Drug Signature Programme, any amount over one gram has been defined as supply.
Tackling Methamphetamine: Indicators and Progress Report October 2015 7
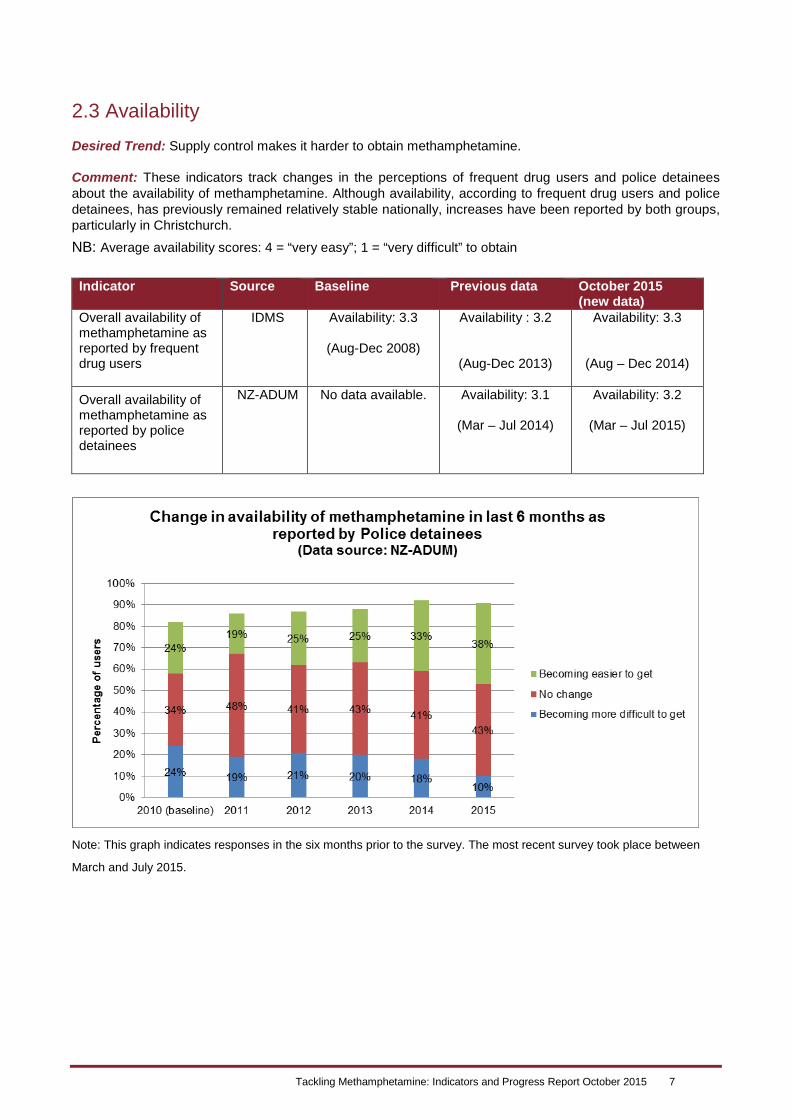
2.3 Availability Desired Trend: Supply control makes it harder to obtain methamphetamine. Comment: These indicators track changes in the perceptions of frequent drug users and police detainees about the availability of methamphetamine. Although availability, according to frequent drug users and police detainees, has previously remained relatively stable nationally, increases have been reported by both groups, particularly in Christchurch. NB: Average availability scores: 4 = “very easy”; 1 = “very difficult” to obtain
Indicator Source Baseline Previous data October 2015
(new data) Overall availability of methamphetamine as reported by frequent drug users
IDMS Availability: 3.3
(Aug-Dec 2008)
Availability : 3.2
(Aug-Dec 2013)
Availability: 3.3
(Aug – Dec 2014)
Overall availability of methamphetamine as reported by police detainees
NZ-ADUM No data available. Availability: 3.1
(Mar – Jul 2014)
Availability: 3.2
(Mar – Jul 2015)
Note: This graph indicates responses in the six months prior to the survey. The most recent survey took place between
March and July 2015.
Tackling Methamphetamine: Indicators and Progress Report October 2015 8
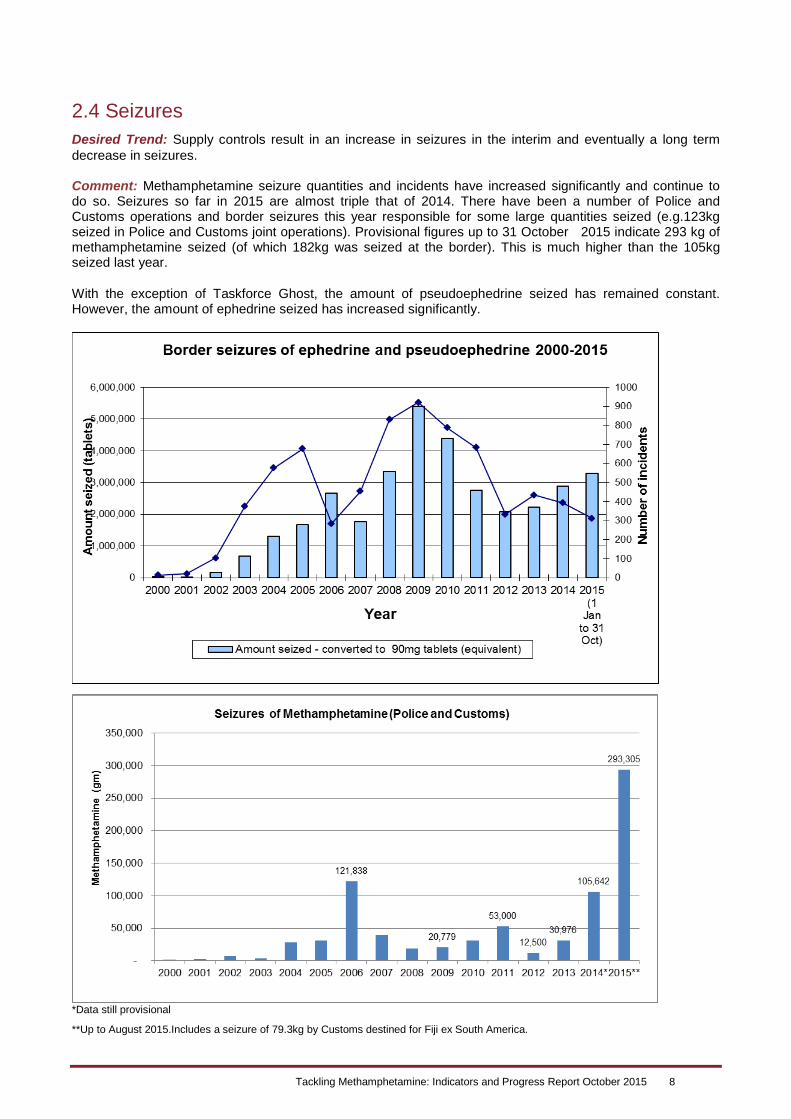
2.4 Seizures Desired Trend: Supply controls result in an increase in seizures in the interim and eventually a long term decrease in seizures. Comment: Methamphetamine seizure quantities and incidents have increased significantly and continue to do so. Seizures so far in 2015 are almost triple that of 2014. There have been a number of Police and Customs operations and border seizures this year responsible for some large quantities seized (e.g.123kg seized in Police and Customs joint operations). Provisional figures up to 31 October 2015 indicate 293 kg of methamphetamine seized (of which 182kg was seized at the border). This is much higher than the 105kg seized last year.
With the exception of Taskforce Ghost, the amount of pseudoephedrine seized has remained constant. However, the amount of ephedrine seized has increased significantly.
*Data still provisional
**Up to August 2015.Includes a seizure of 79.3kg by Customs destined for Fiji ex South America.
Tackling Methamphetamine: Indicators and Progress Report October 2015 9
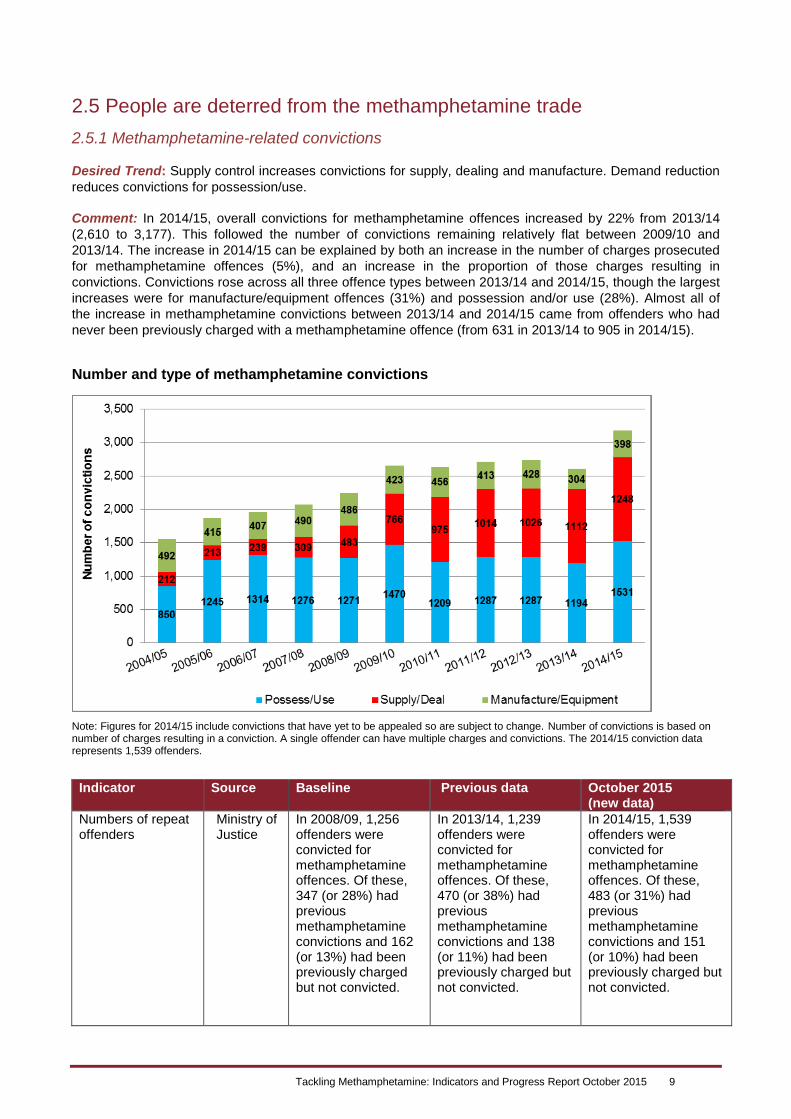
2.5 People are deterred from the methamphetamine trade 2.5.1 Methamphetamine-related convictions Desired Trend: Supply control increases convictions for supply, dealing and manufacture. Demand reduction reduces convictions for possession/use. Comment: In 2014/15, overall convictions for methamphetamine offences increased by 22% from 2013/14 (2,610 to 3,177). This followed the number of convictions remaining relatively flat between 2009/10 and 2013/14. The increase in 2014/15 can be explained by both an increase in the number of charges prosecuted for methamphetamine offences (5%), and an increase in the proportion of those charges resulting in convictions. Convictions rose across all three offence types between 2013/14 and 2014/15, though the largest increases were for manufacture/equipment offences (31%) and possession and/or use (28%). Almost all of the increase in methamphetamine convictions between 2013/14 and 2014/15 came from offenders who had never been previously charged with a methamphetamine offence (from 631 in 2013/14 to 905 in 2014/15). Number and type of methamphetamine convictions
Note: Figures for 2014/15 include convictions that have yet to be appealed so are subject to change. Number of convictions is based on number of charges resulting in a conviction. A single offender can have multiple charges and convictions. The 2014/15 conviction data represents 1,539 offenders. Indicator Source Baseline Previous data October 2015
(new data) Numbers of repeat offenders
Ministry of Justice
In 2008/09, 1,256 offenders were convicted for methamphetamine offences. Of these, 347 (or 28%) had previous methamphetamine convictions and 162 (or 13%) had been previously charged but not convicted.
In 2013/14, 1,239 offenders were convicted for methamphetamine offences. Of these, 470 (or 38%) had previous methamphetamine convictions and 138 (or 11%) had been previously charged but not convicted.
In 2014/15, 1,539 offenders were convicted for methamphetamine offences. Of these, 483 (or 31%) had previous methamphetamine convictions and 151 (or 10%) had been previously charged but not convicted.
Tackling Methamphetamine: Indicators and Progress Report October 2015 10
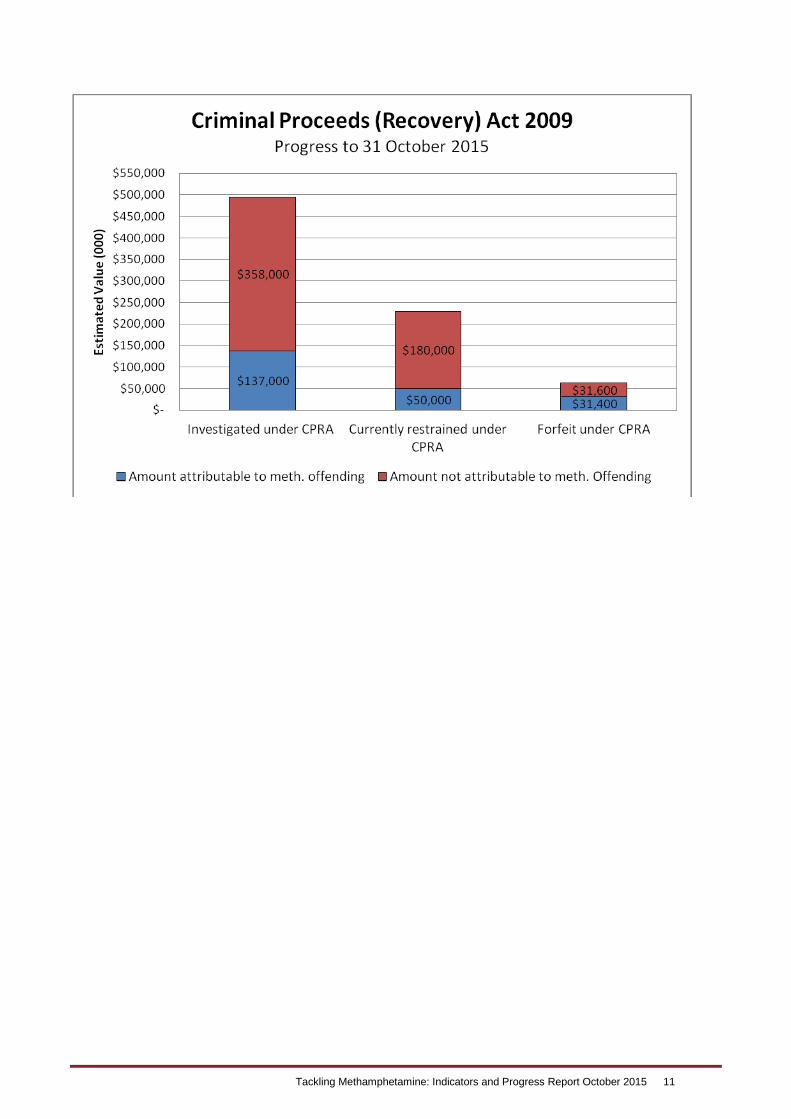
2.5.2 The ability to generate profits is reduced Comment: The Criminal Proceeds (Recovery) Act 2009 (CPRA) came into effect on 1 December 2009. Since then, Police have investigated assets worth an estimated $495 million. Around $137 million of this total is associated with methamphetamine offending. Police currently hold Restraining Orders over assets worth an estimated $230 million. Around $50 million of this total has been restrained from respondents associated with methamphetamine offences. Since 2009, Police have obtained Forfeiture Orders over assets worth an estimated $63 million (this is an increase of $13 million since the November 2014 Progress and Indicators Report). $31.4 million of this forfeited total is associated with methamphetamine offences. After procedural factors are taken into account, around $12 million will be available by the end of the calendar year to allocate to proposals to fund the expansion of alcohol and other drug (AoD) treatment and additional law enforcement initiatives to fight organised criminal groups dealing in methamphetamine and other drugs. Including the initiatives announced by the Prime Minister in December 2015, CPRA funding of $16.4 million has already supported: • enhanced engagement with China by Customs and Police
• analysis of seized methamphetamine samples to assess purity
• enhanced frontline screening capability for Customs, including purchasing portable substance identifiers and setting up a laboratory
• more transitional and supported accommodation beds for residential and day treatment services
• funding for counsel and court co-ordinator for the Alcohol and Drug Treatment Court Pilot • training for drug search dogs to detect cash, which is already producing positive results
• development of media guidelines for reporting on the use of volatile substances
• an expanded Police asset recovery capability to increase disruption of organised crime and drug syndicates and civil recovery actions under the CPRA
• expanded treatment for pregnant women and mothers with substance abuse issues
• offenders with alcohol and drug issues to reconnect and re-integrate into their communities • an improved evidence base that supports treatment services for offenders, to reduce reoffending rates
and provide up to date information about the costs of harm from alcohol and other drug use
• Police’s capability to disrupt cannabis and other drug supply chains, and recover digital evidence from devices seized under warrants, to support identification of additional offenders and criminal activity
• supplementing the ability of Police and the Psychoactive Substances Regulatory Authority to identify illicit
substances to support prosecution • measures to prevent harm from alcohol, including referral and intervention toolkits for Police and Health
services
• strengthening education, intelligence and enforcement of the use of drugs in sport, with a focus on youth • developing a standard for remediating properties with methamphetamine-related contamination.
Tackling Methamphetamine: Indicators and Progress Report October 2015 11
Tackling Methamphetamine: Indicators and Progress Report October 2015 12
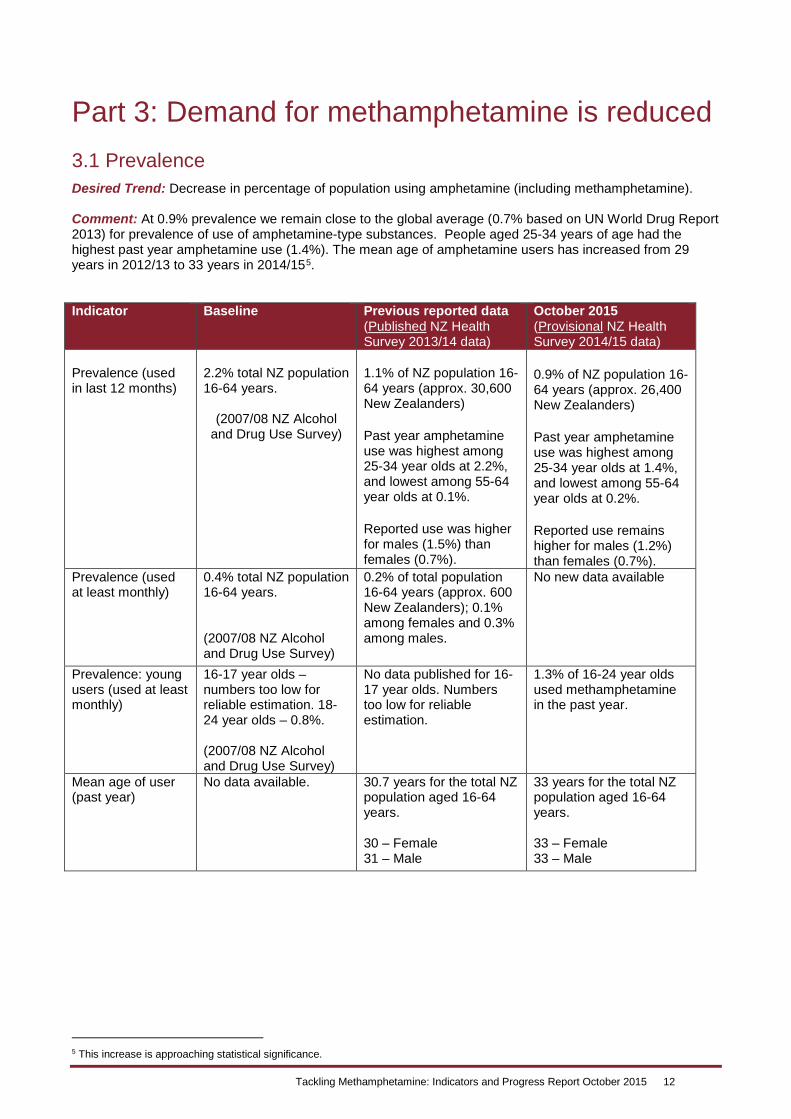
Part 3: Demand for methamphetamine is reduced 3.1 Prevalence Desired Trend: Decrease in percentage of population using amphetamine (including methamphetamine). Comment: At 0.9% prevalence we remain close to the global average (0.7% based on UN World Drug Report 2013) for prevalence of use of amphetamine-type substances. People aged 25-34 years of age had the highest past year amphetamine use (1.4%). The mean age of amphetamine users has increased from 29 years in 2012/13 to 33 years in 2014/155.
5 This increase is approaching statistical significance.
Indicator Baseline Previous reported data (Published NZ Health Survey 2013/14 data)
October 2015 (Provisional NZ Health Survey 2014/15 data)
Prevalence (used in last 12 months)
2.2% total NZ population 16-64 years.
(2007/08 NZ Alcohol and Drug Use Survey)
1.1% of NZ population 16-64 years (approx. 30,600 New Zealanders) Past year amphetamine use was highest among 25-34 year olds at 2.2%, and lowest among 55-64 year olds at 0.1%. Reported use was higher for males (1.5%) than females (0.7%).
0.9% of NZ population 16-64 years (approx. 26,400 New Zealanders) Past year amphetamine use was highest among 25-34 year olds at 1.4%, and lowest among 55-64 year olds at 0.2%. Reported use remains higher for males (1.2%) than females (0.7%).
Prevalence (used at least monthly)
0.4% total NZ population 16-64 years. (2007/08 NZ Alcohol and Drug Use Survey)
0.2% of total population 16-64 years (approx. 600 New Zealanders); 0.1% among females and 0.3% among males.
No new data available
Prevalence: young users (used at least monthly)
16-17 year olds – numbers too low for reliable estimation. 18-24 year olds – 0.8%. (2007/08 NZ Alcohol and Drug Use Survey)
No data published for 16-17 year olds. Numbers too low for reliable estimation.
1.3% of 16-24 year olds used methamphetamine in the past year.
Mean age of user (past year)
No data available. 30.7 years for the total NZ population aged 16-64 years. 30 – Female 31 – Male
33 years for the total NZ population aged 16-64 years. 33 – Female 33 – Male
Tackling Methamphetamine: Indicators and Progress Report October 2015 13
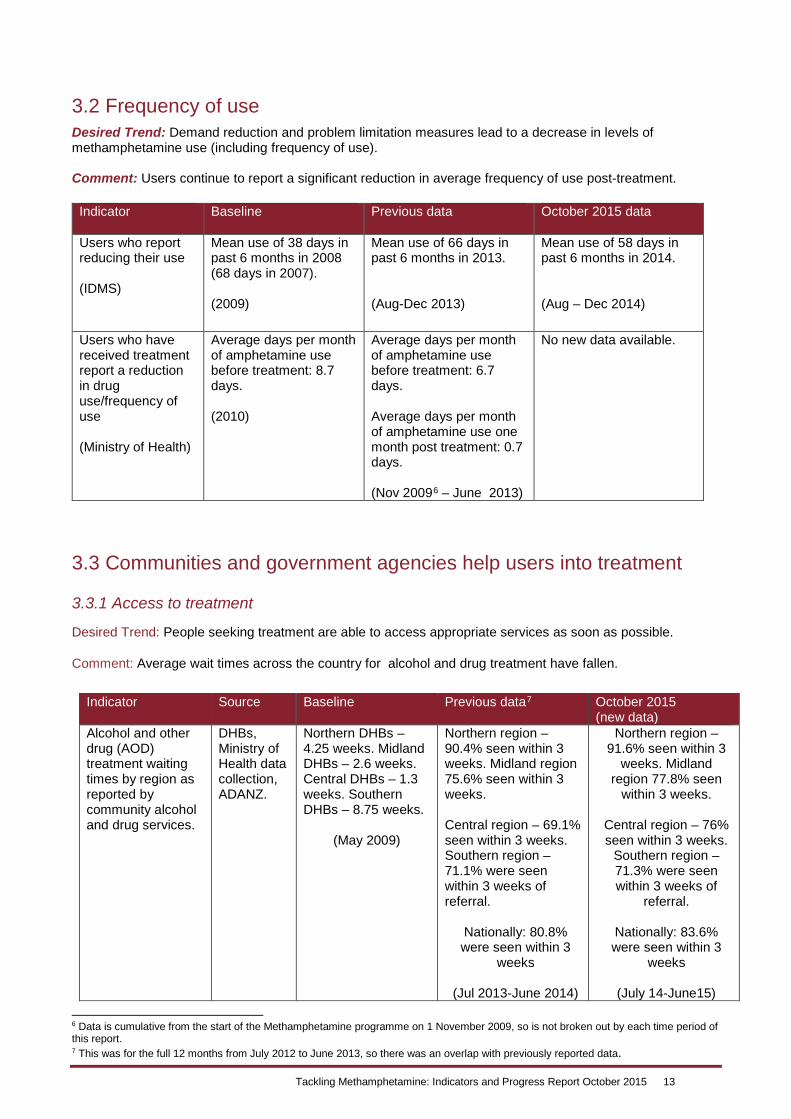
3.2 Frequency of use Desired Trend: Demand reduction and problem limitation measures lead to a decrease in levels of methamphetamine use (including frequency of use). Comment: Users continue to report a significant reduction in average frequency of use post-treatment.
Indicator Baseline Previous data
October 2015 data
Users who report reducing their use (IDMS)
Mean use of 38 days in past 6 months in 2008 (68 days in 2007). (2009)
Mean use of 66 days in past 6 months in 2013. (Aug-Dec 2013)
Mean use of 58 days in past 6 months in 2014. (Aug – Dec 2014)
Users who have received treatment report a reduction in drug use/frequency of use (Ministry of Health)
Average days per month of amphetamine use before treatment: 8.7 days. (2010)
Average days per month of amphetamine use before treatment: 6.7 days. Average days per month of amphetamine use one month post treatment: 0.7 days. (Nov 20096 – June 2013)
No new data available.
3.3 Communities and government agencies help users into treatment
3.3.1 Access to treatment
Desired Trend: People seeking treatment are able to access appropriate services as soon as possible. Comment: Average wait times across the country for alcohol and drug treatment have fallen.
Indicator Source Baseline Previous data7 October 2015 (new data)
Alcohol and other drug (AOD) treatment waiting times by region as reported by community alcohol and drug services.
DHBs, Ministry of Health data collection, ADANZ.
Northern DHBs – 4.25 weeks. Midland DHBs – 2.6 weeks. Central DHBs – 1.3 weeks. Southern DHBs – 8.75 weeks.
(May 2009)
Northern region – 90.4% seen within 3 weeks. Midland region 75.6% seen within 3 weeks. Central region – 69.1% seen within 3 weeks. Southern region – 71.1% were seen within 3 weeks of referral.
Nationally: 80.8% were seen within 3
weeks
(Jul 2013-June 2014)
Northern region – 91.6% seen within 3
weeks. Midland region 77.8% seen
within 3 weeks.
Central region – 76% seen within 3 weeks.
Southern region – 71.3% were seen within 3 weeks of
referral.
Nationally: 83.6% were seen within 3
weeks
(July 14-June15)
6 Data is cumulative from the start of the Methamphetamine programme on 1 November 2009, so is not broken out by each time period of this report. 7 This was for the full 12 months from July 2012 to June 2013, so there was an overlap with previously reported data.
Tackling Methamphetamine: Indicators and Progress Report October 2015 14
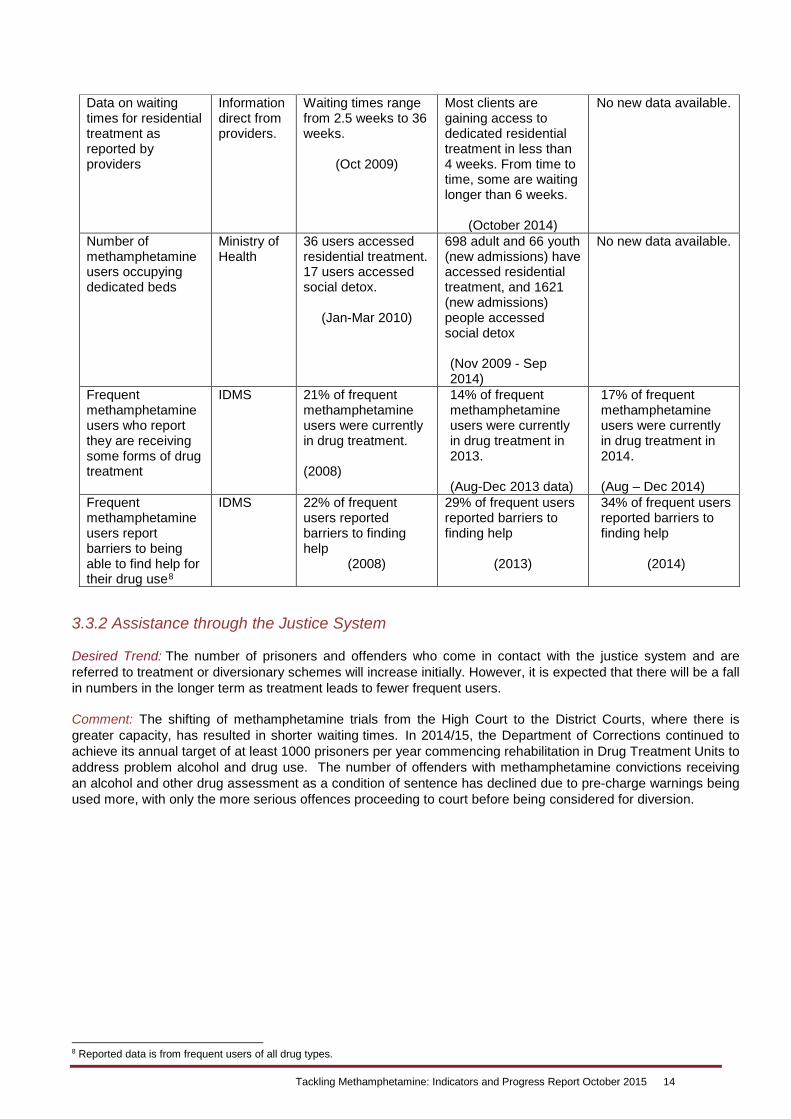
Data on waiting times for residential treatment as reported by providers
Information direct from providers.
Waiting times range from 2.5 weeks to 36 weeks.
(Oct 2009)
Most clients are gaining access to dedicated residential treatment in less than 4 weeks. From time to time, some are waiting longer than 6 weeks.
(October 2014)
No new data available.
Number of methamphetamine users occupying dedicated beds
Ministry of Health
36 users accessed residential treatment. 17 users accessed social detox.
(Jan-Mar 2010)
698 adult and 66 youth (new admissions) have accessed residential treatment, and 1621 (new admissions) people accessed social detox (Nov 2009 - Sep 2014)
No new data available.
Frequent methamphetamine users who report they are receiving some forms of drug treatment
IDMS 21% of frequent methamphetamine users were currently in drug treatment. (2008)
14% of frequent methamphetamine users were currently in drug treatment in 2013. (Aug-Dec 2013 data)
17% of frequent methamphetamine users were currently in drug treatment in 2014. (Aug – Dec 2014)
Frequent methamphetamine users report barriers to being able to find help for their drug use8
IDMS 22% of frequent users reported barriers to finding help
(2008)
29% of frequent users reported barriers to finding help
(2013)
34% of frequent users reported barriers to finding help
(2014)
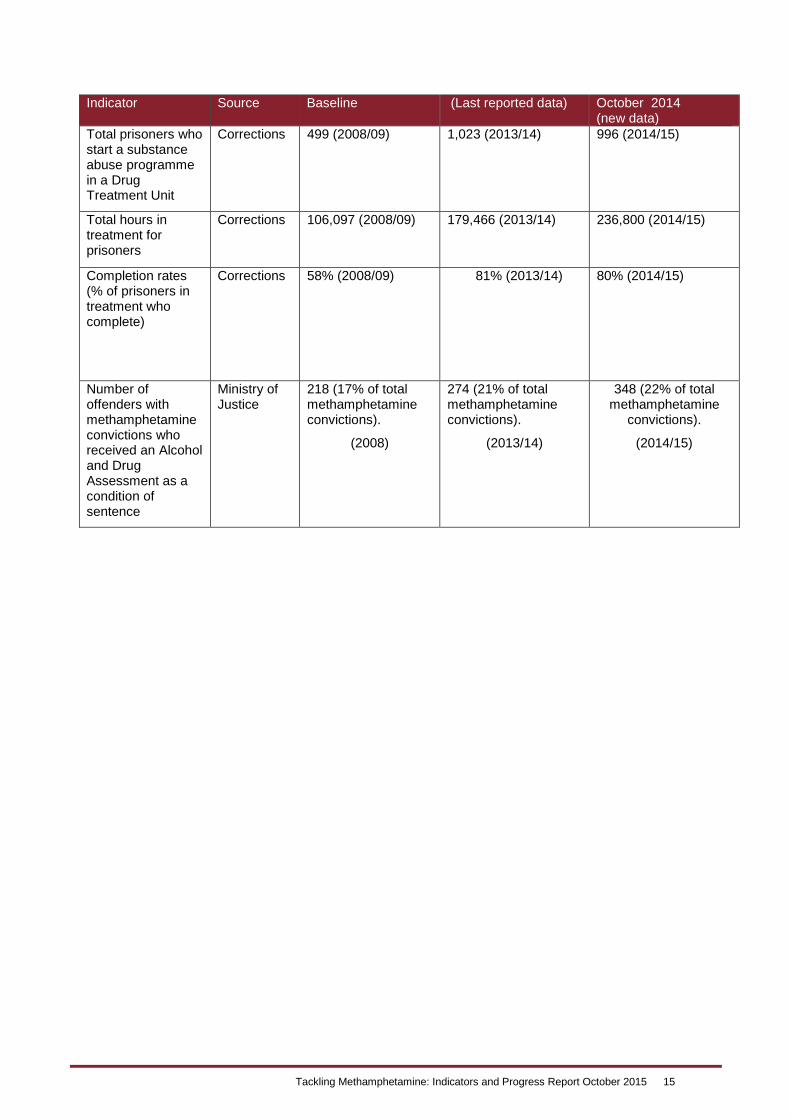
3.3.2 Assistance through the Justice System Desired Trend: The number of prisoners and offenders who come in contact with the justice system and are referred to treatment or diversionary schemes will increase initially. However, it is expected that there will be a fall in numbers in the longer term as treatment leads to fewer frequent users. Comment: The shifting of methamphetamine trials from the High Court to the District Courts, where there is greater capacity, has resulted in shorter waiting times. In 2014/15, the Department of Corrections continued to achieve its annual target of at least 1000 prisoners per year commencing rehabilitation in Drug Treatment Units to address problem alcohol and drug use. The number of offenders with methamphetamine convictions receiving an alcohol and other drug assessment as a condition of sentence has declined due to pre-charge warnings being used more, with only the more serious offences proceeding to court before being considered for diversion.
8 Reported data is from frequent users of all drug types.
Tackling Methamphetamine: Indicators and Progress Report October 2015 15
Indicator Source Baseline (Last reported data) October 2014 (new data)
Total prisoners who start a substance abuse programme in a Drug Treatment Unit
Corrections 499 (2008/09) 1,023 (2013/14) 996 (2014/15)
Total hours in treatment for prisoners
Corrections 106,097 (2008/09) 179,466 (2013/14) 236,800 (2014/15)
Completion rates (% of prisoners in treatment who complete)
Corrections 58% (2008/09) 81% (2013/14) 80% (2014/15)
Number of offenders with methamphetamine convictions who received an Alcohol and Drug Assessment as a condition of sentence
Ministry of Justice
218 (17% of total methamphetamine convictions).
(2008)
274 (21% of total methamphetamine convictions).
(2013/14)
348 (22% of total methamphetamine
convictions).
(2014/15)
Tackling Methamphetamine: Indicators and Progress Report October 2015 16
Annex 1: Key data sources New Zealand Arrestee Drug Use Monitoring System (NZ-ADUM) and Illicit Drug Monitoring System (IDMS) The NZ-ADUM and IDMS datasets have different samples and purposes.
The aim of the IDMS is to track recent trends in illegal drug use. It recruits active frequent methamphetamine
users. Participants in the study have used methamphetamine at least monthly in the previous six months. This
ensures that the participants have current knowledge of the methamphetamine market based on recent ‘first
hand’ experience. It also means that they will typically not be in (residential) drug treatment.
The aim of NZ-ADUM is broader – to investigate levels of alcohol and other drug use among police detainees.
The main criterion for eligibility for the study is detention in a police station for no more than 48 hours. The arrestee population has high levels of alcohol and drug use, but not all are frequent drug users. As a result,
the researchers (who administer both studies) conclude that they know less about current drug trends than
the frequent drug users in the IDMS study. Results from each of these studies are available annually. (Note: Both studies have relatively small sample
sizes and not all participants answer every survey question). New Zealand Health Survey Between July 2014 to June 2015, 10,309 people aged between 16 and 64 years were interviewed in their
homes as part of the New Zealand Health Survey, 4,471 men and 5,838 women. People were asked "In the
last 12 months, have you used any of the following drugs for recreational or non-medical purposes, or to get high?". People who answered yes to 'P' ('pure' methamphetamine), ice (crystal methamphetamine) and speed
were counted as people who used amphetamines in the last year.