taco bell investor day - corporate-ir. · pdf fileyum! profits driven by china, yri, and u.s....
TRANSCRIPT
TACO BELL INVESTOR DAY
Tim Jerzyk
SVP, Investor Relations
Information herein is as of 2/17/11
This presentation will include forward-looking statements
that reflect management’s expectations based on currently
available data. However, actual results are subject to
future events and uncertainties. The information in the
presentation related to projections or other forward-looking
statements which may cause actual results to differ
materially are subject to the safe harbor statement posted
on our Web site: www.yum.com.

Yum! Profits Driven By China, YRI, and U.S. Taco Bell U.S.
Taco Bell U.S.
Taco Bell U.S.
YRI
YRI
China
China
2004 2010
~90% of
Profits
~70% of
Profits
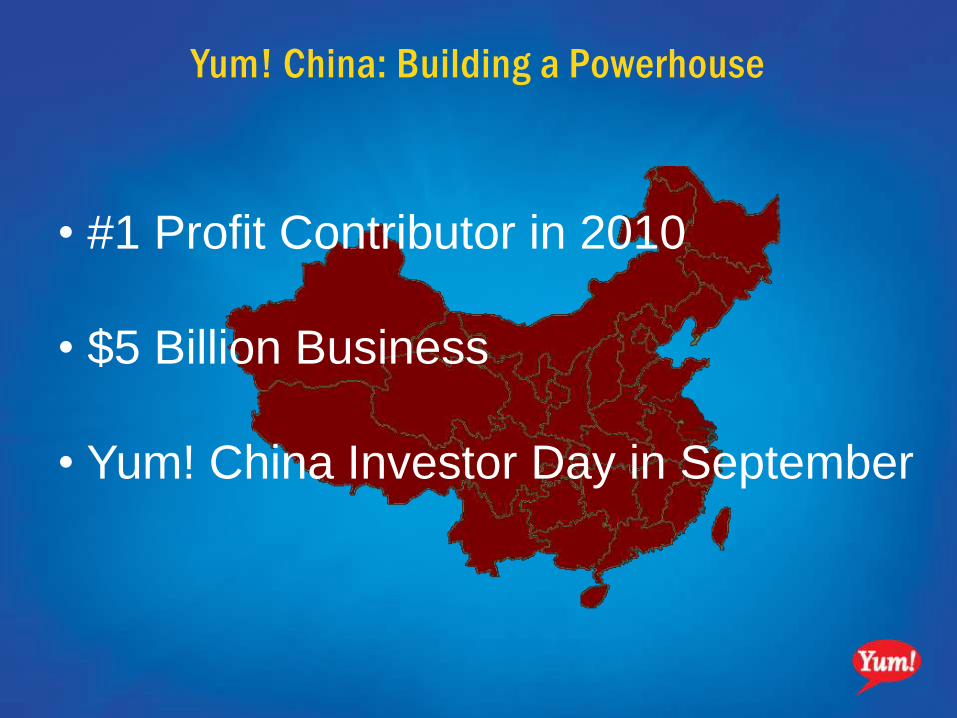
Yum! China: Building a Powerhouse
• #1 Profit Contributor in 2010
• $5 Billion Business
• Yum! China Investor Day in September
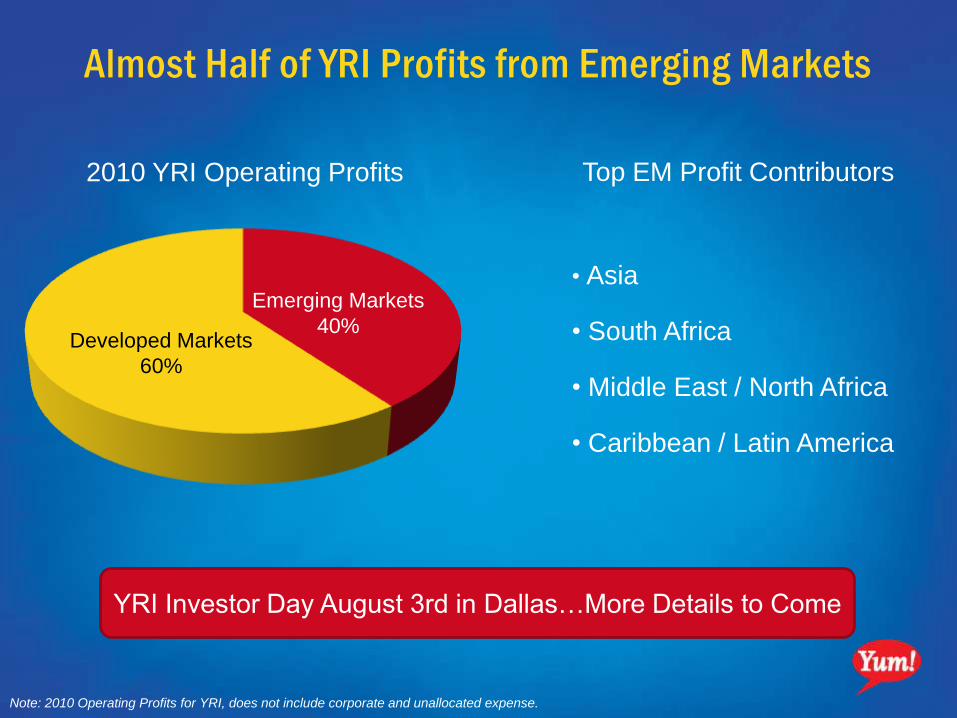
Almost Half of YRI Profits from Emerging Markets
Developed Markets
60%
Emerging Markets
40%
Note: 2010 Operating Profits for YRI, does not include corporate and unallocated expense.
2010 YRI Operating Profits Top EM Profit Contributors
• Asia
• South Africa
• Middle East / North Africa
• Caribbean / Latin America
YRI Investor Day August 3rd in Dallas…More Details to Come

Refranchising Has Transformed U.S. Division
25% 24% 24%
21%
8% 7%
18%
16%
5%
2007 2010 2011 & Beyond
% of Company Ownership by Brand
2011 Focus on KFC

13.3%
0.5%
0.5%
(0.5%)
14.2%
Refranchising Improved U.S. Restaurant Margins
2008 201020092007
U.S. Rest. Margin
2010
U.S. Rest.
Margin
0.4%
Other
Impact of Refranchising
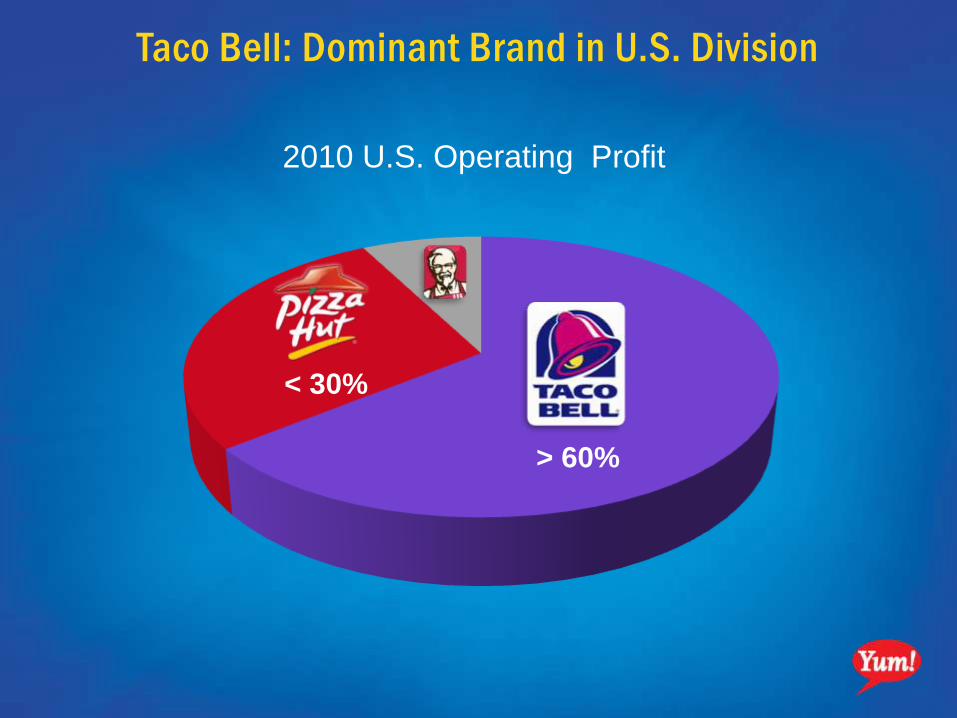
2010 U.S. Operating Profit
Taco Bell: Dominant Brand in U.S. Division
> 60%
< 30%
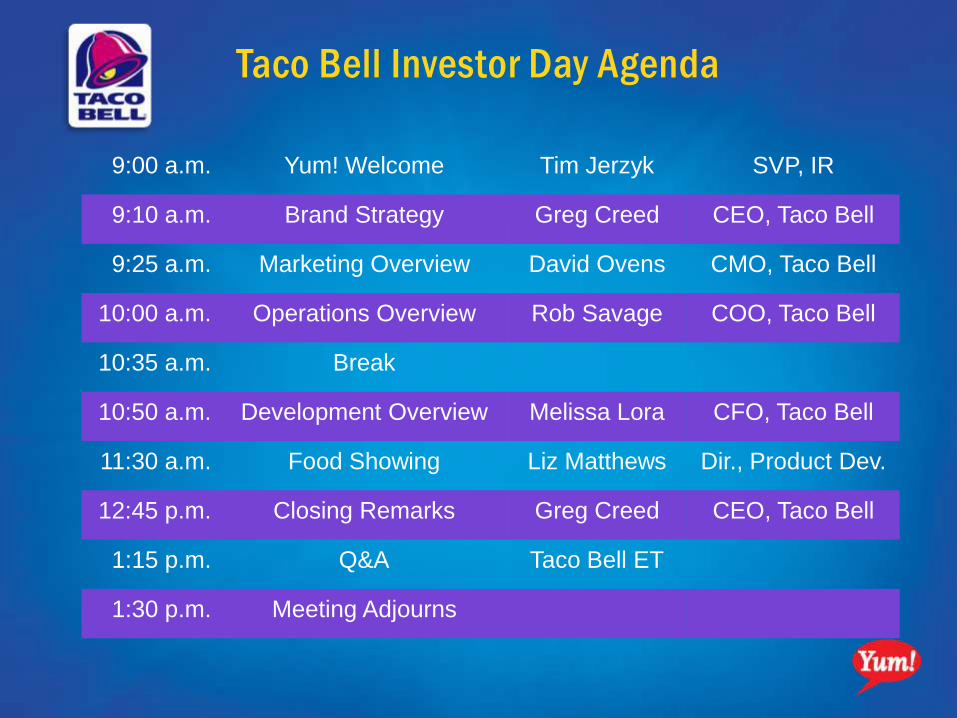
9:00 a.m. Yum! Welcome Tim Jerzyk SVP, IR
9:10 a.m. Brand Strategy Greg Creed CEO, Taco Bell
9:25 a.m. Marketing Overview David Ovens CMO, Taco Bell
10:00 a.m. Operations Overview Rob Savage COO, Taco Bell
10:35 a.m. Break
10:50 a.m. Development Overview Melissa Lora CFO, Taco Bell
11:30 a.m. Food Showing Liz Matthews Dir., Product Dev.
12:45 p.m. Closing Remarks Greg Creed CEO, Taco Bell
1:15 p.m. Q&A Taco Bell ET
1:30 p.m. Meeting Adjourns
Taco Bell Investor Day Agenda
BRAND OVERVIEWFebruary 17, 2011

GREGCREEDPresident & Chief Executive Officer
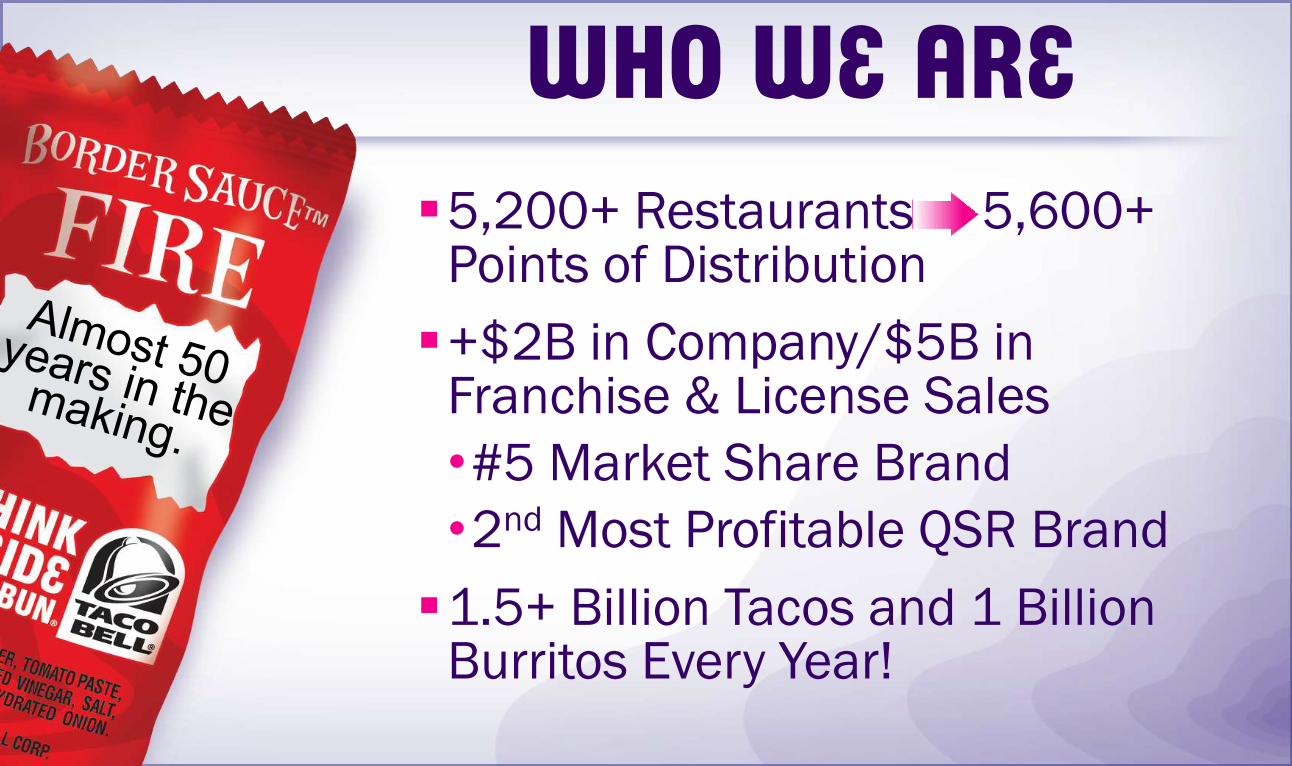
5,200+ Restaurants 5,600+ Points of Distribution
+$2B in Company/$5B in Franchise & License Sales
•#5 Market Share Brand
•2nd Most Profitable QSR Brand
1.5+ Billion Tacos and 1 Billion Burritos Every Year!
WHO WE ARE
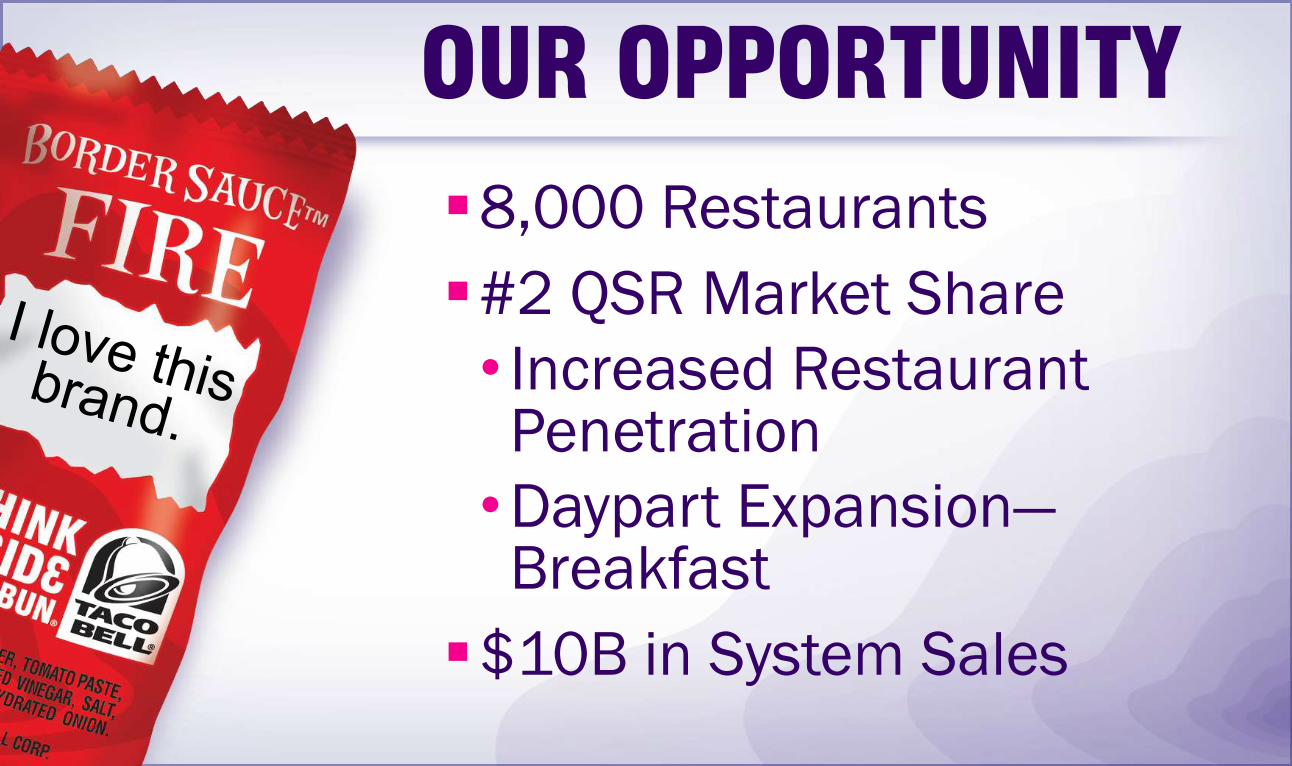
OUR OPPORTUNITY8,000 Restaurants
#2 QSR Market Share
• Increased Restaurant Penetration
•Daypart Expansion—Breakfast
$10B in System Sales
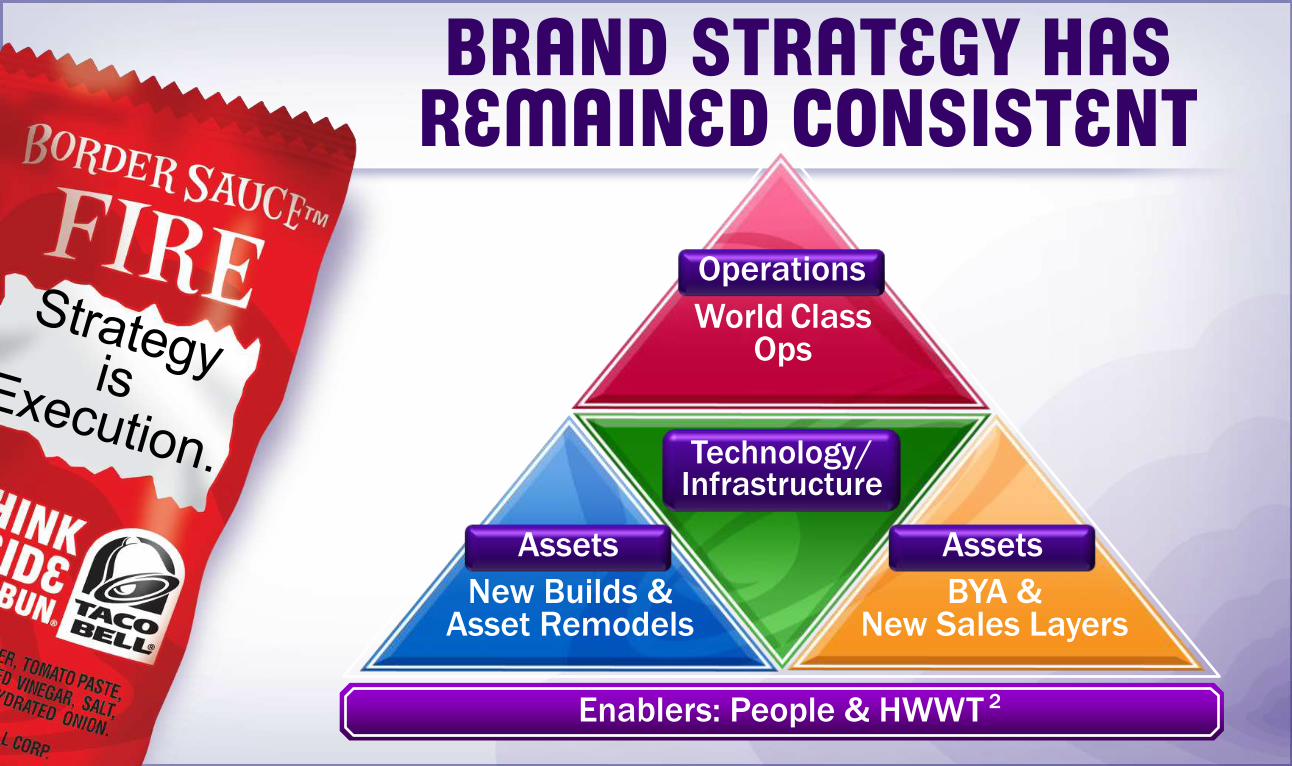
BRAND STRATEGY HAS REMAINED CONSISTENT
Enablers: People & HWWT 2
Operations
World Class Ops
Assets
New Builds & Asset Remodels
Assets
BYA & New Sales Layers
Technology/Infrastructure
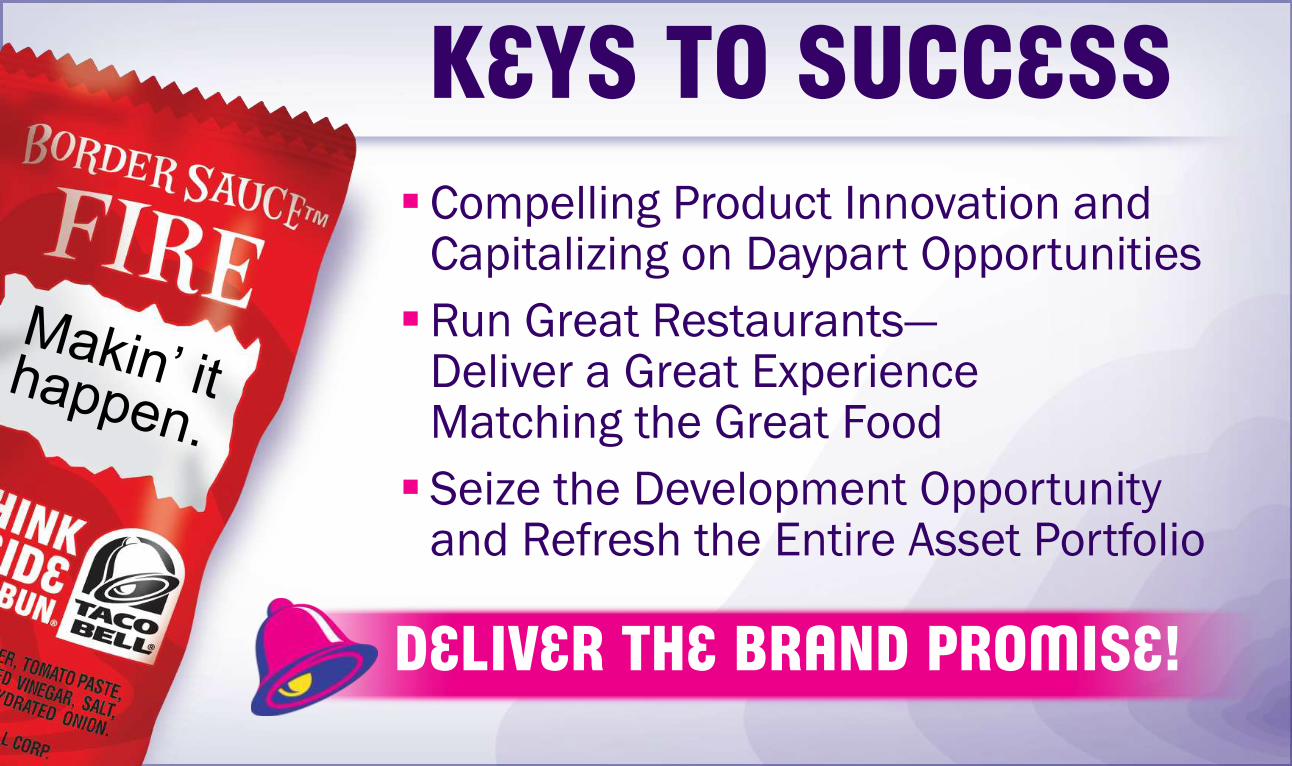
KEYS TO SUCCESSCompelling Product Innovation and
Capitalizing on Daypart Opportunities
Run Great Restaurants—Deliver a Great Experience Matching the Great Food
Seize the Development Opportunity and Refresh the Entire Asset Portfolio
DELIVER THE BRAND PROMISE!

Also Appeared In:San Francisco Chronicle • Montgomery Advertiser • Mobile Press
Anniston Star • San Diego Tribune • Birmingham News • Hoy (Chicago) La Opinion (Los Angeles) • El Diario La Prensa (New York)

DAVID OVENSChief Marketing Officer

0.0
5.0
10.0
15.0
20.0
25.0
30.0
35.0
40.0
-5%
0%
5%
10%
15%
1980
1981
1982
1983
1984
1985
1986
1987
1988
1989
1990
1991
1992
1993
1994
1995
1996
1997
1998
1999
2000
2001
2002
2003
2004
2005
2006
2007
2008
2009
2010
Nov 198210.8%
17.1 Weeks
ALL STARTS WITH CUSTOMER–UNEMPLOYMENT REMAINS BIG ISSUE
Unemployment Rate (%)
Unemployment Rate Avg Weeks Unemployed
Dec 20109.4%
34.2 Weeks
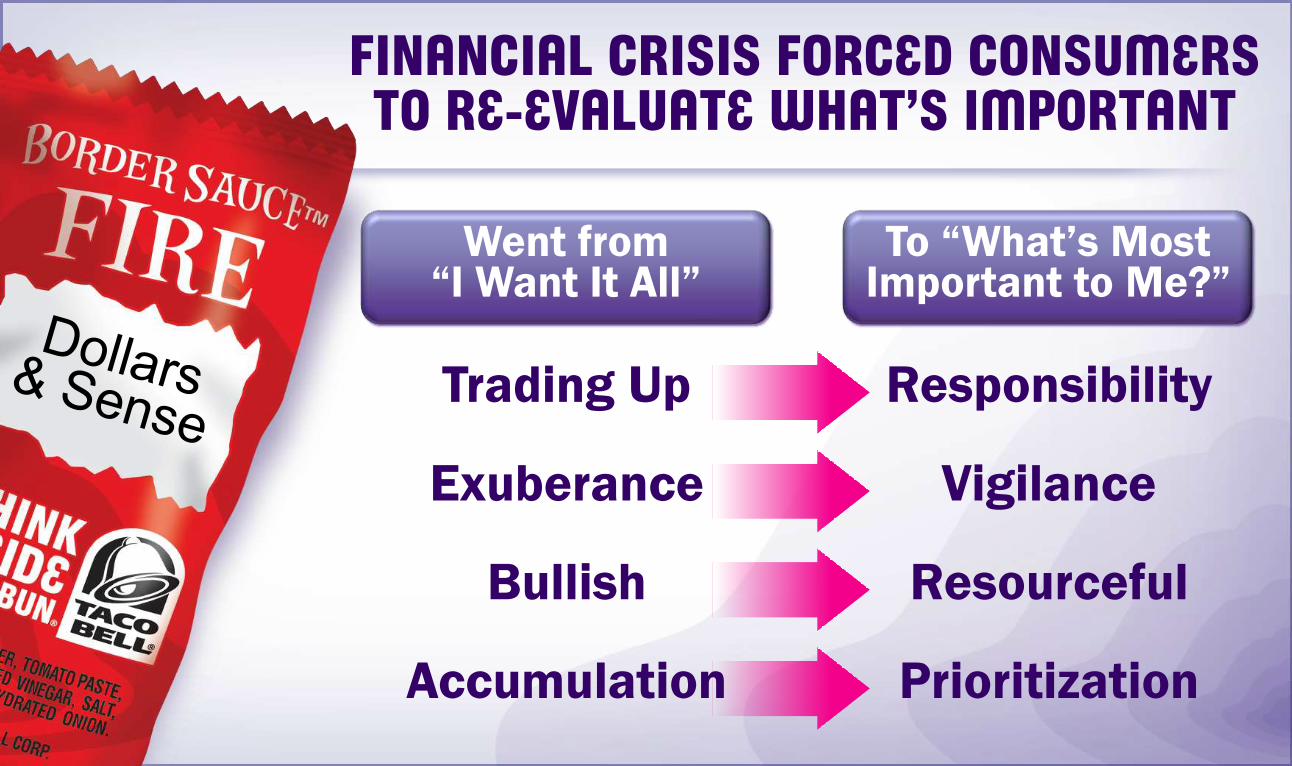
FINANCIAL CRISIS FORCED CONSUMERS TO RE-EVALUATE WHAT’S IMPORTANT
Went from “I Want It All”
To “What‟s Most Important to Me?”
Trading Up
Exuberance
Bullish
Accumulation
Responsibility
Vigilance
Resourceful
Prioritization

QSR TRAFFIC RECOVERINGQSR Traffic
(% Change vs. Year Ago)
-1.1%
1.0%
-2.4%
-1.7%
-0.6%
-2.7%
-0.2%
2.2%
0.8%
-3.7%
0.8%0.3%
1.5%
0.1%0.7%
Q2 ’10
Q1 ’07
Q2 ’07
Q3 ’07
Q4 ’07
Q1 ’08
Q2 ’08
Q3 ’08
Q4 ’08
Q1 ’09
Q2 ’09
Q4 ’09
Q1 ’10
Q3 ’09
Q3 ’10
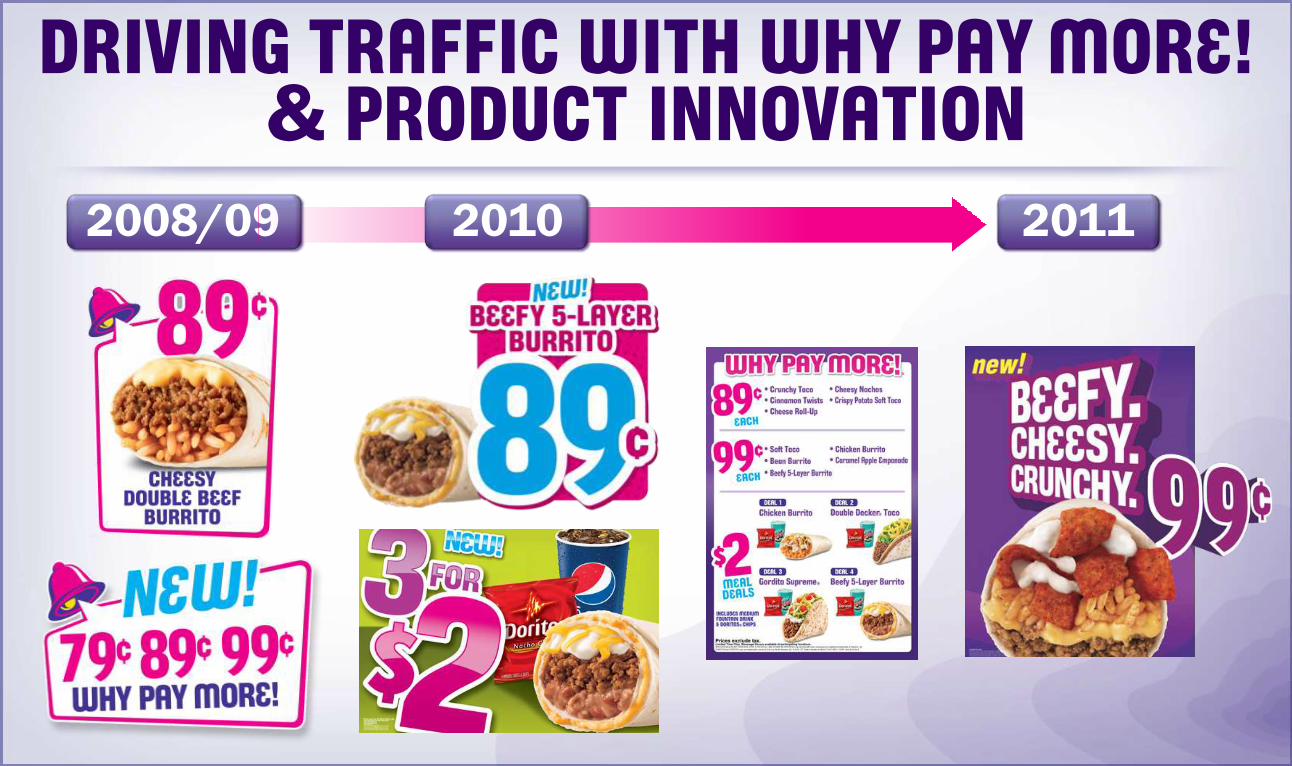
DRIVING TRAFFIC WITH WHY PAY MORE! & PRODUCT INNOVATION
2008/09 20112010
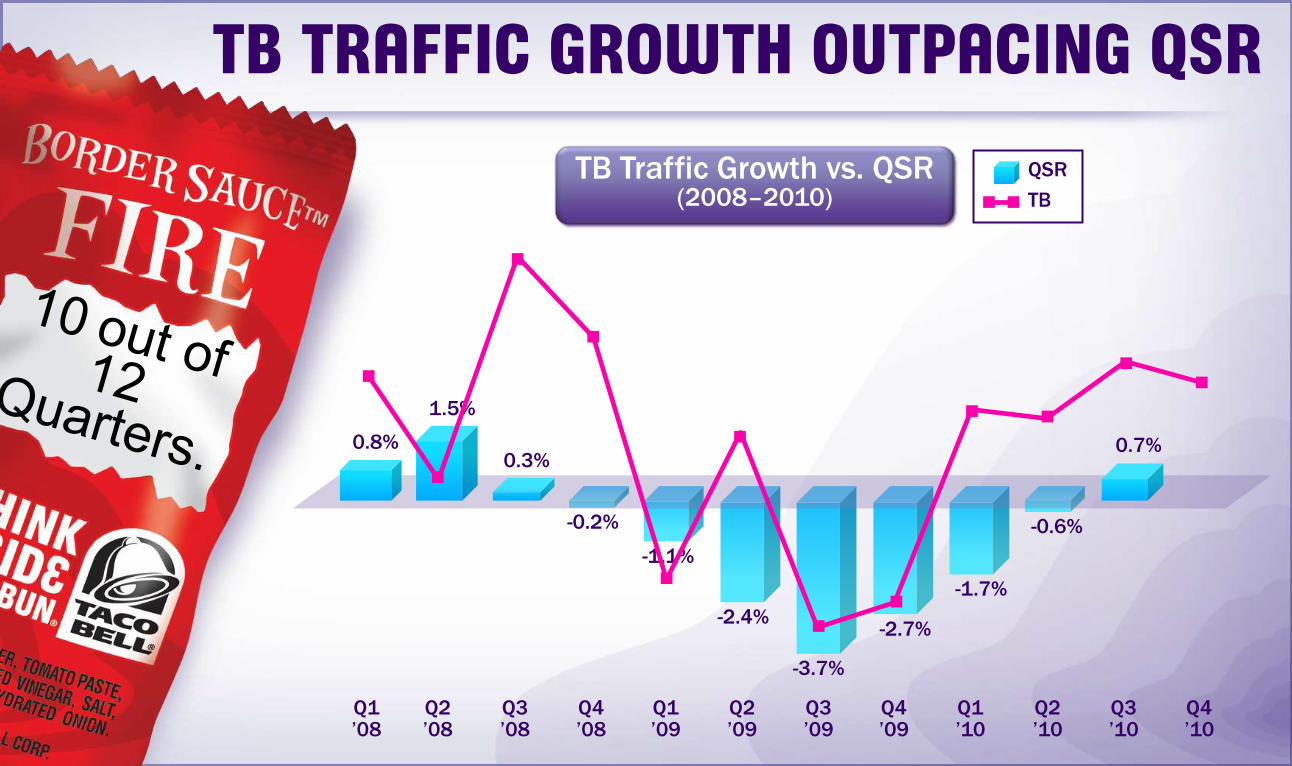
TB Traffic Growth vs. QSR (2008–2010)
-1.1%
-2.4%
-1.7%
-0.6%
-2.7%
-0.2%
-3.7%
0.8%0.3%
1.5%
0.7%
TB TRAFFIC GROWTH OUTPACING QSRQSR
TB
Q2 ’10
Q2 ’08
Q3 ’08
Q4 ’08
Q1 ’09
Q2 ’09
Q4 ’09
Q1 ’10
Q3 ’09
Q3 ’10
Q4 ’10
Q1 ’08
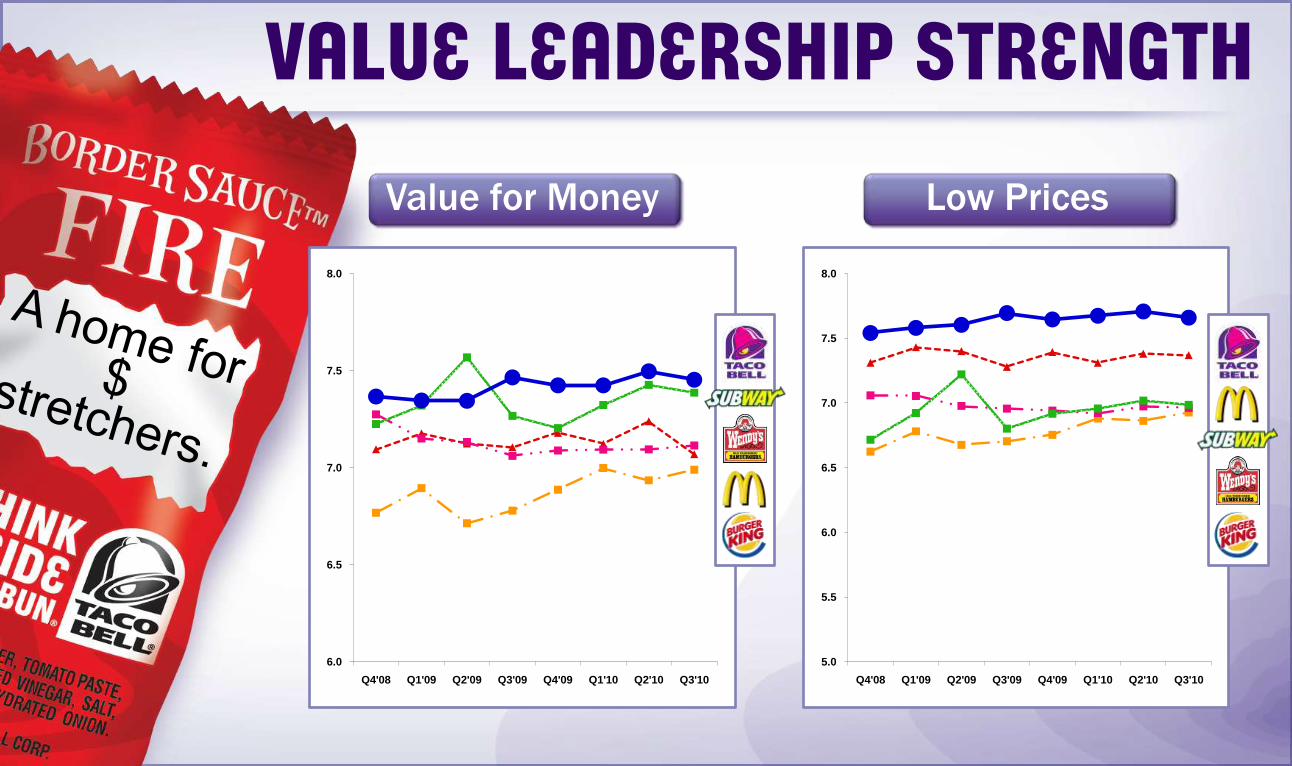
VALUE LEADERSHIP STRENGTH
6.0
6.5
7.0
7.5
8.0
Q4'08 Q1'09 Q2'09 Q3'09 Q4'09 Q1'10 Q2'10 Q3'10
Value for Money
5.0
5.5
6.0
6.5
7.0
7.5
8.0
Q4'08 Q1'09 Q2'09 Q3'09 Q4'09 Q1'10 Q2'10 Q3'10
Low Prices
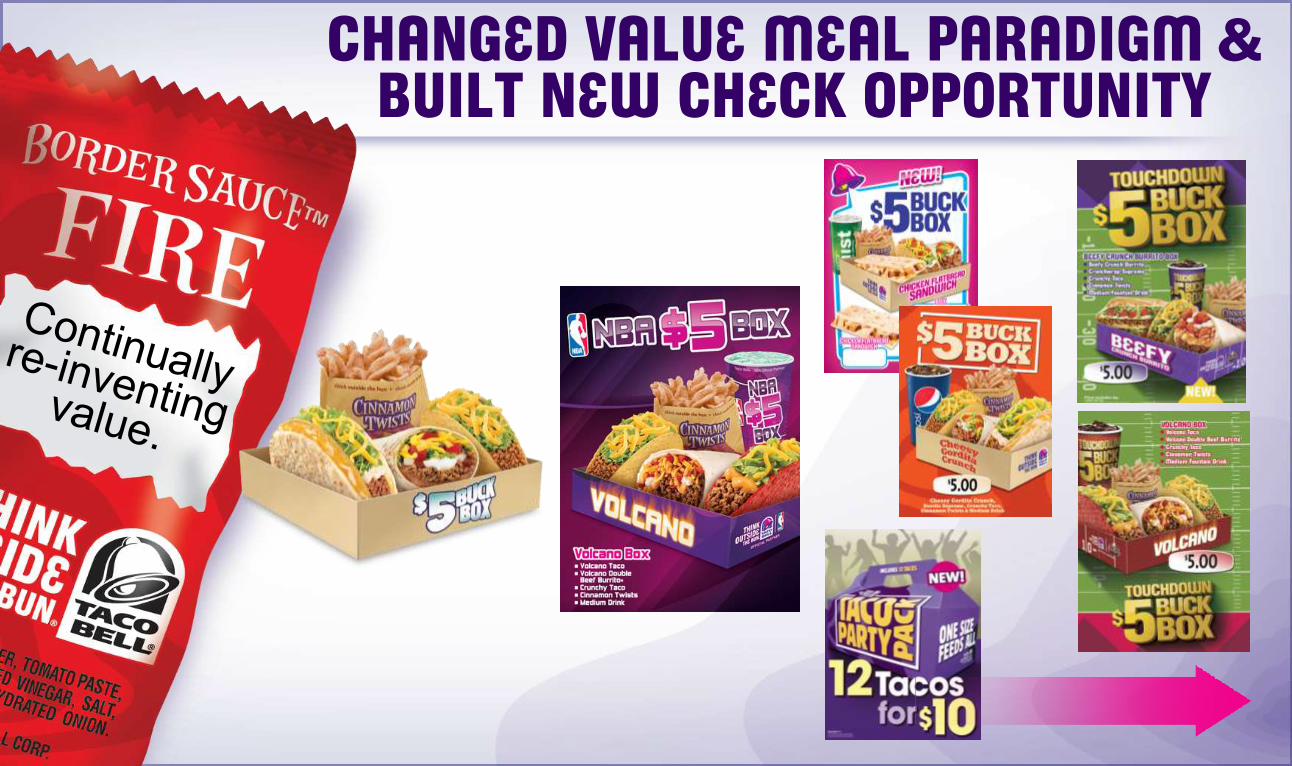
CHANGED VALUE MEAL PARADIGM &BUILT NEW CHECK OPPORTUNITY
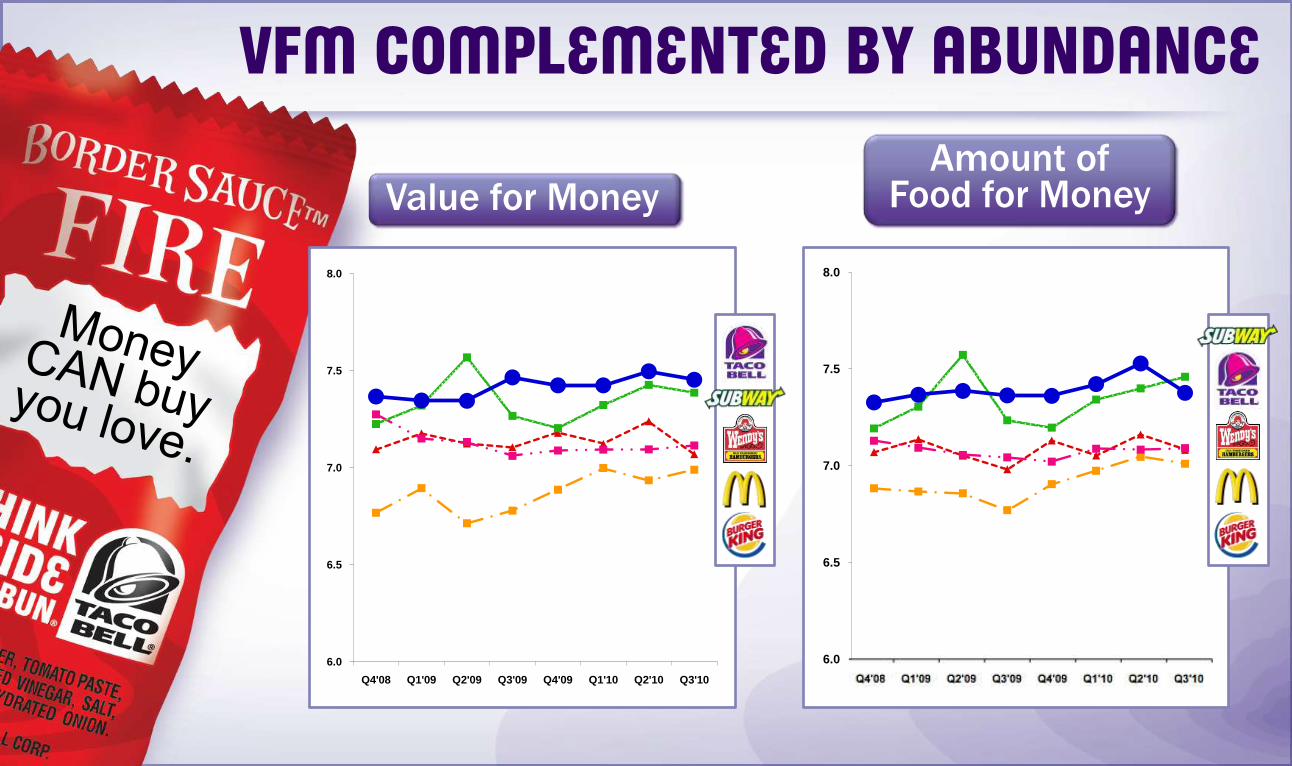
6.0
6.5
7.0
7.5
8.0
Q4'08 Q1'09 Q2'09 Q3'09 Q4'09 Q1'10 Q2'10 Q3'10
Value for Money
VFM COMPLEMENTED BY ABUNDANCEAmount of
Food for Money
6.0
6.5
7.0
7.5
8.0
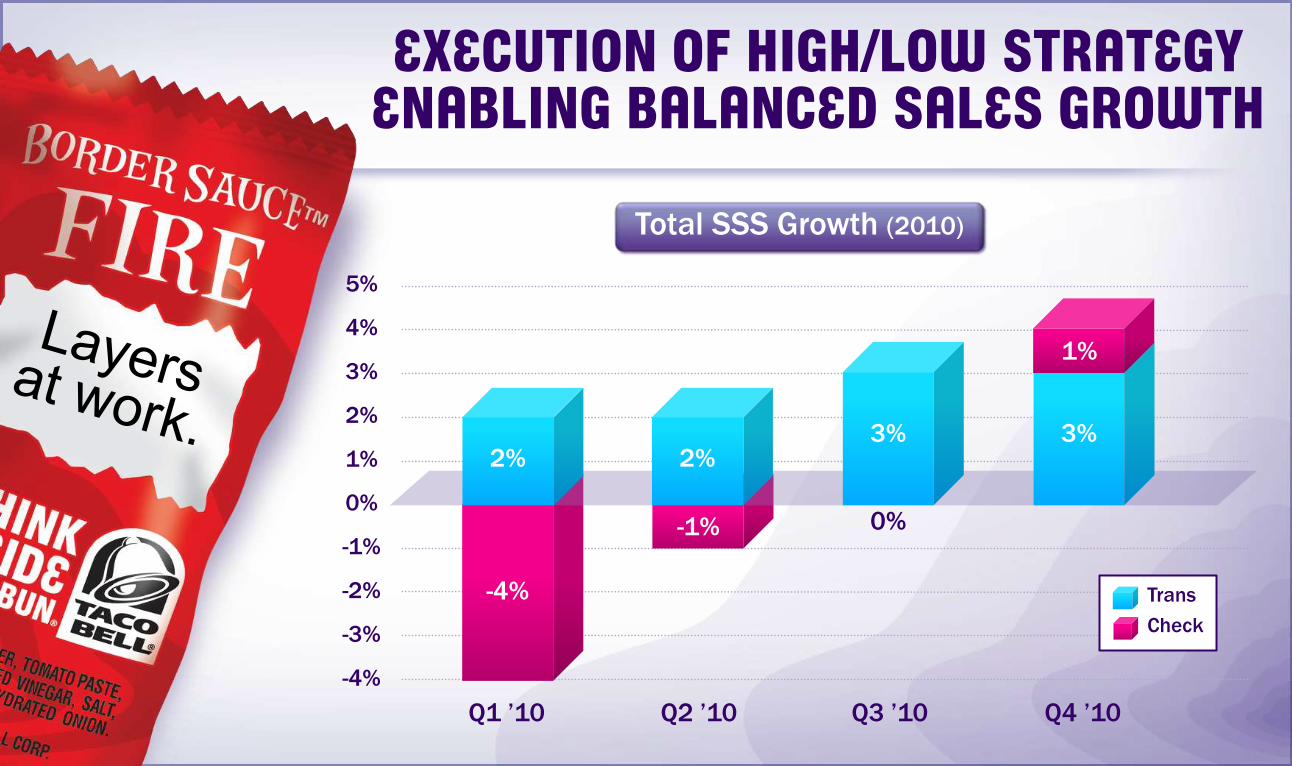
EXECUTION OF HIGH/LOW STRATEGY ENABLING BALANCED SALES GROWTH
Total SSS Growth (2010)
5%
4%
3%
2%
1%
0%
-1%
-2%
-3%
-4%
Q2 ’10 Q3 ’10 Q4 ’10
Trans
Check
Q1 ’10
-4%
2%
-1% 0%
3%2%
3%
1%

CORE BRAND GROWTH DRIVEN BY CAPABILITY IN INNOVATION & VALUE
Mexican Inspired, Forms, Flavors and Proteins
Not Just Low Prices,Priced to Make Value Matter
Proprietary, One-of-a-Kind Products
CraveableTastes
PioneeringValue
ProductInnovation
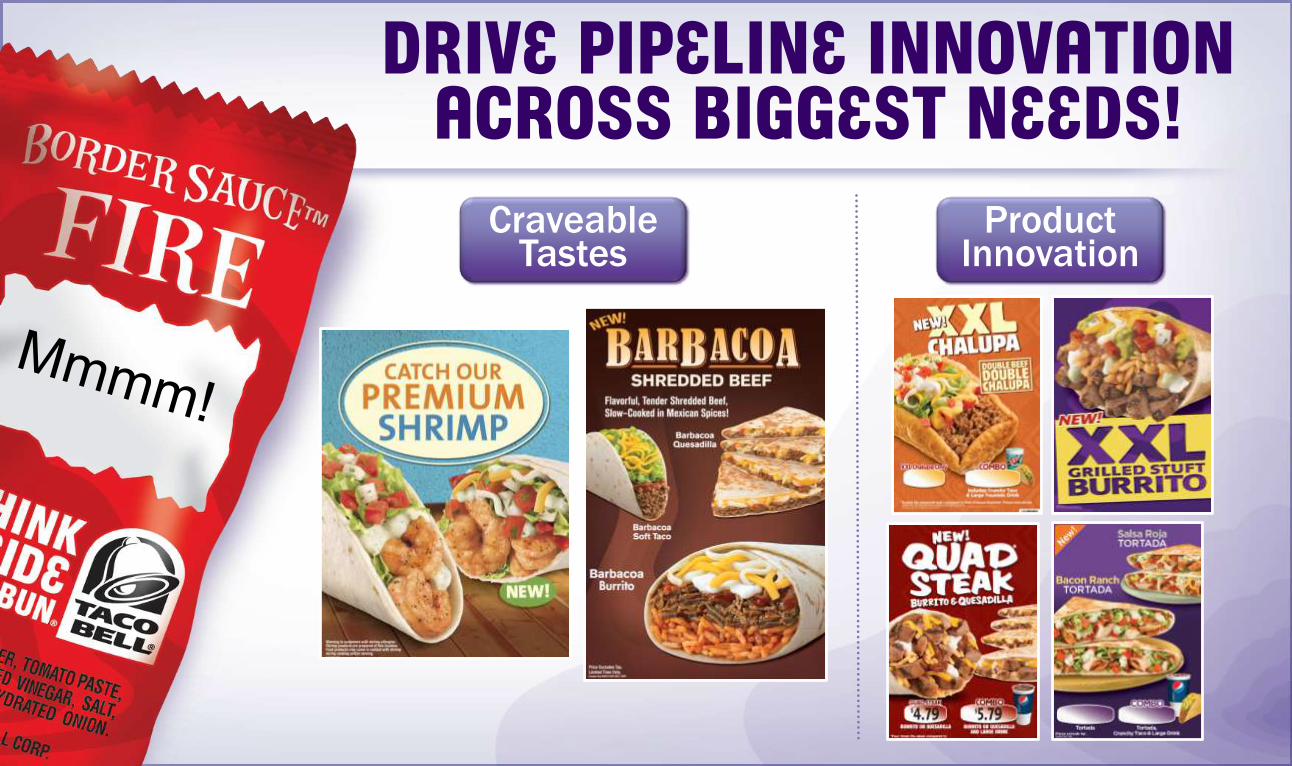
DRIVE PIPELINE INNOVATION ACROSS BIGGEST NEEDS!
CraveableTastes
Product Innovation


AfternoonSnack
DinnerLunchAM SnackBk’fst
1.5
3.53.8
0.30.1
2.8
EveningSnack
BUILD NEW REASONS TO VISIT TACO BELL
TB Share of All Restaurant Meals by Daypart
All Meals
2.7
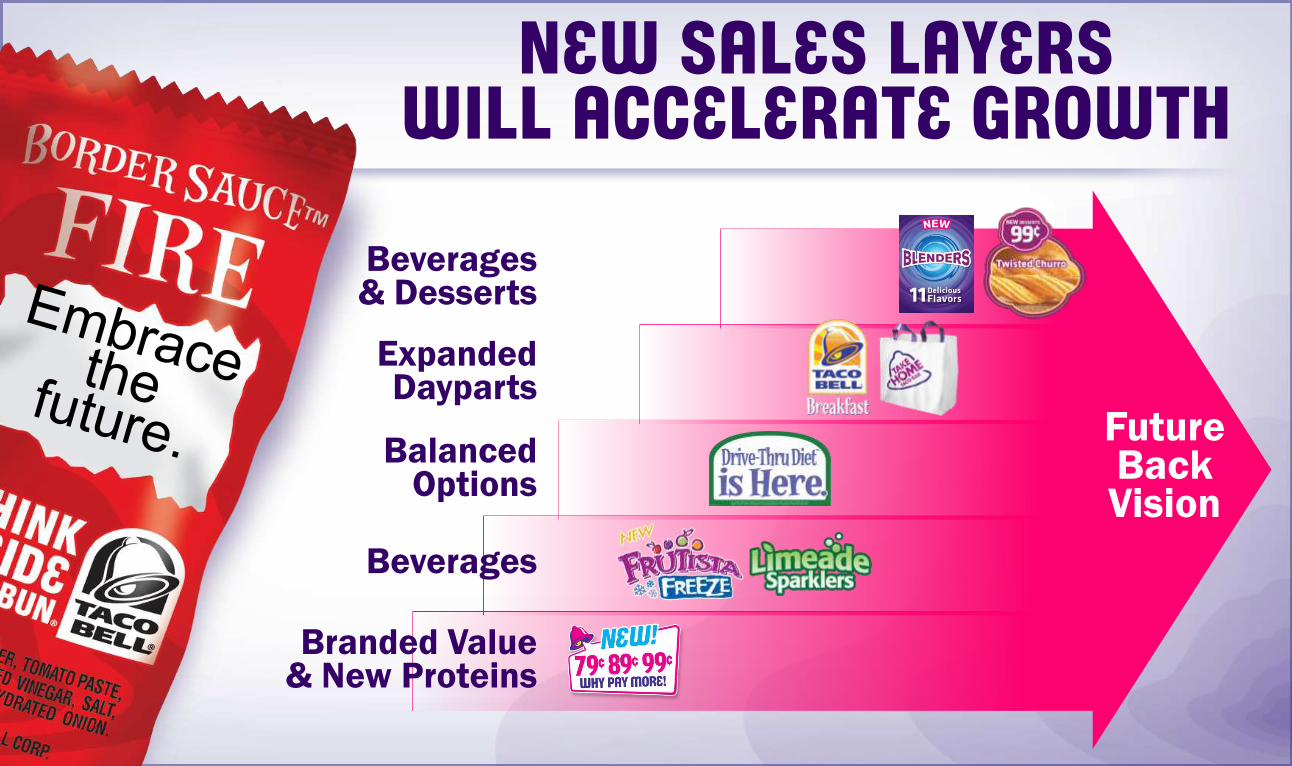
Beverages & Desserts
Expanded Dayparts
Balanced Options
Beverages
Branded Value & New Proteins
NEW SALES LAYERS WILL ACCELERATE GROWTH
FutureBackVision
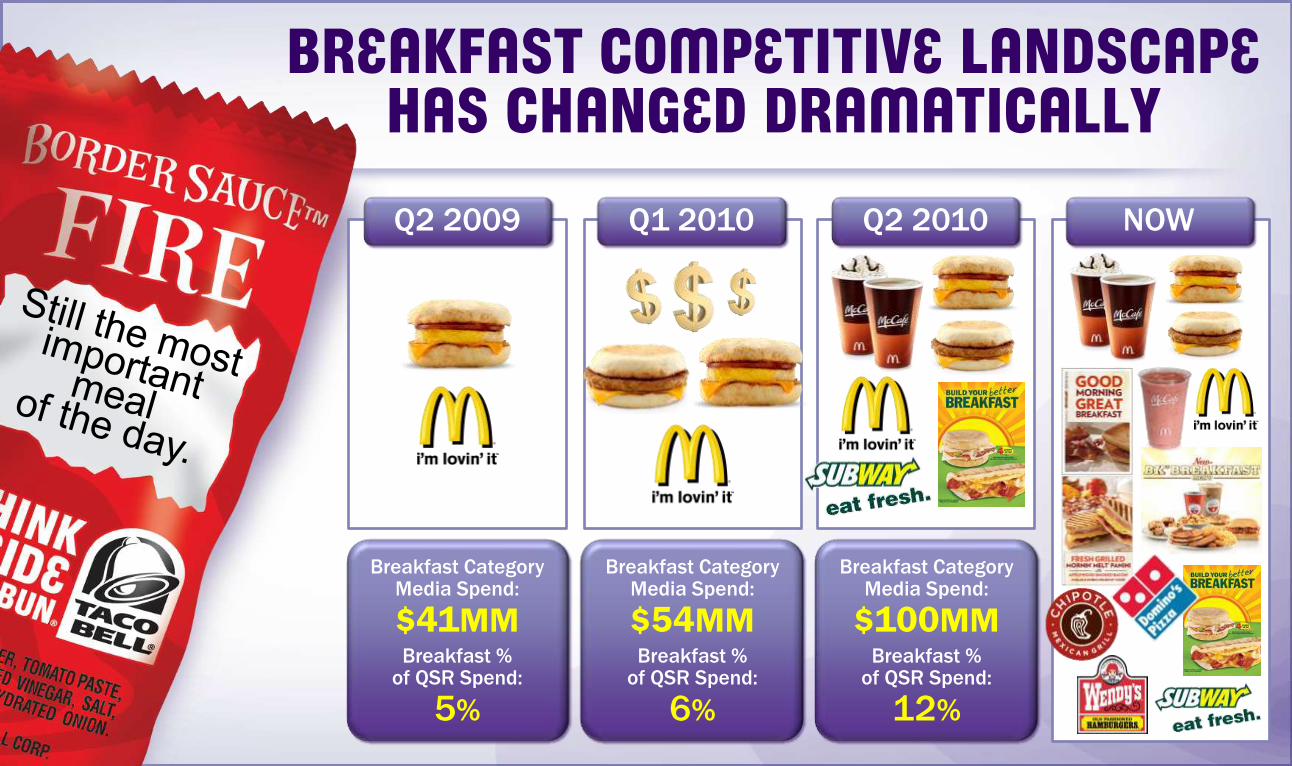
BREAKFAST COMPETITIVE LANDSCAPE HAS CHANGED DRAMATICALLY
NOWQ2 2009
Breakfast Category Media Spend:
$41MMBreakfast %
of QSR Spend:
5%
Q1 2010
Breakfast Category Media Spend:
$54MMBreakfast %
of QSR Spend:
6%
Q2 2010
Breakfast Category Media Spend:
$100MMBreakfast %
of QSR Spend:
12%
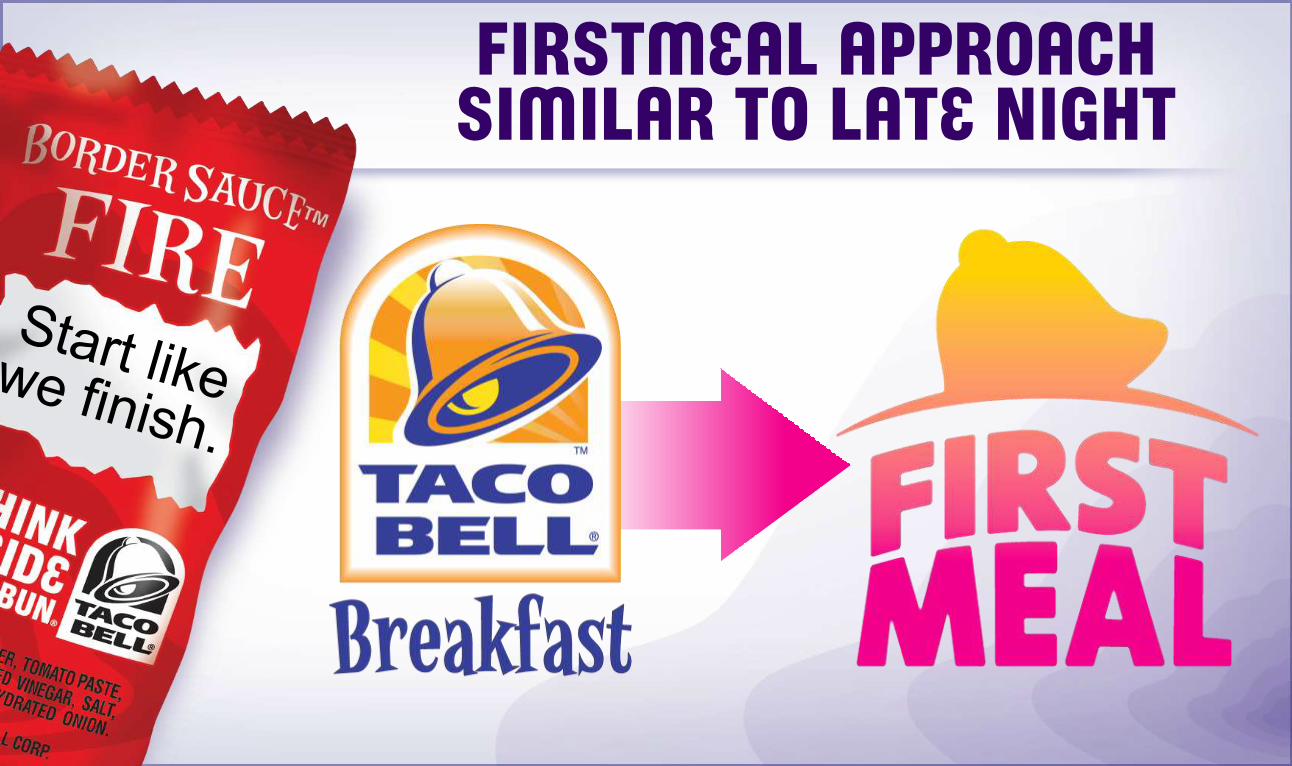
FIRSTMEAL APPROACH SIMILAR TO LATE NIGHT

BUILD NEW REASONS TO VISIT TACO BELL
AfternoonSnack
DinnerLunchAM SnackBk’fst
1.5
3.53.8
0.30.1
2.8
EveningSnack
TB Share of All Restaurant Meals by Daypart
All Meals
2.7

OASIS: THE BEVERAGE &SNACKING STRATEGY
Refresh Refuel Reconnect
“All I get is a soda.”
“Lunch, Dinner or Late Night.”
“I’d rather eat in my car.”
FR
OM
TO
“It’s a Beverage
Destination.”
“Satisfying snacks for my
clocklesslifestyle.”
“I come to Taco Bell
as much for the
experience as the food.”

PRODUCTS ARE DELICIOUS...
Beverages Desserts

EXPERIENCE CHANGES PERCEPTIONS!
“I’d rather eat in my car”
Sit & Stay
Modular Furniture
Seating Options
Quality Lighting

SUMMARY Value leadership great in
current economy
Product innovation culture a strategic advantage to get beyond low prices
New sales layers are hard, but when done correctly, payoff will be huge
ROB SAVAGEChief Operating Officer
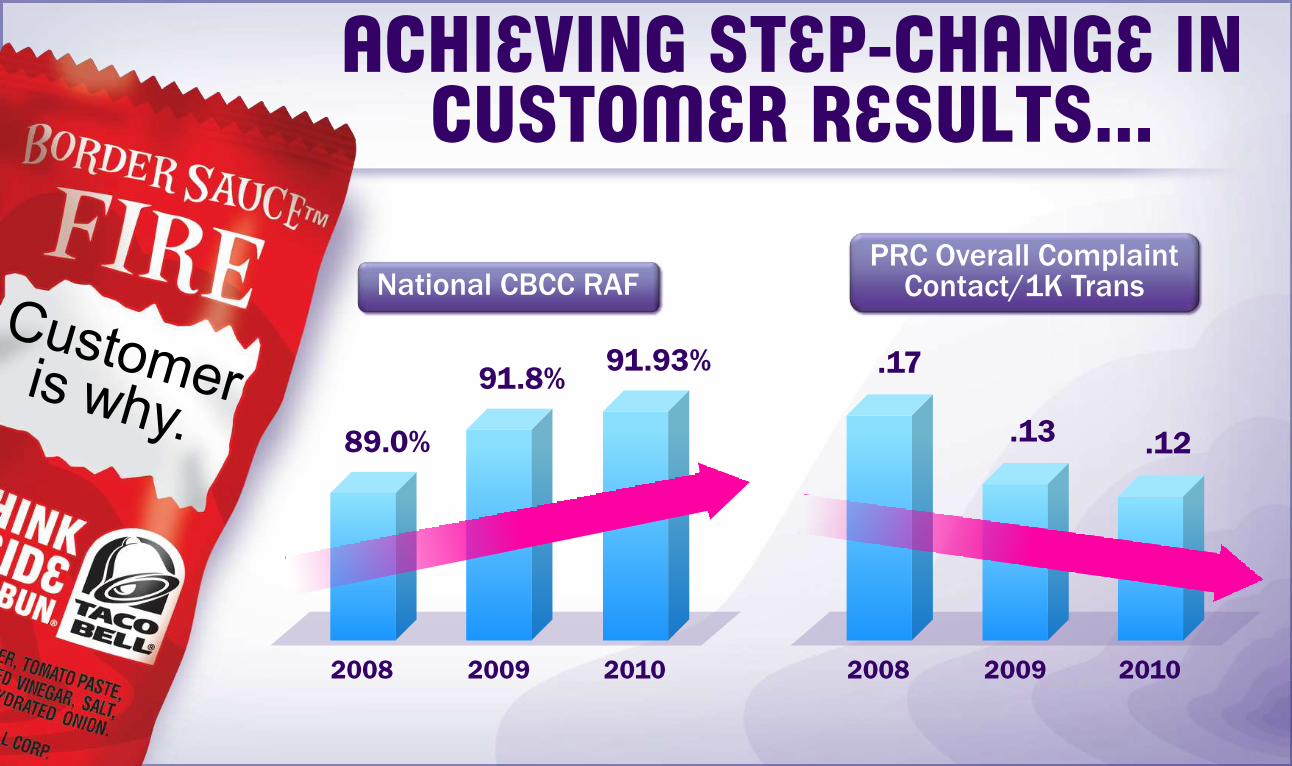
ACHIEVING STEP-CHANGE IN CUSTOMER RESULTS...
2008
91.93%
2009 2010
91.8%
89.0%
National CBCC RAF
2008
.12
2009 2010
.13
.17
PRC Overall Complaint Contact/1K Trans
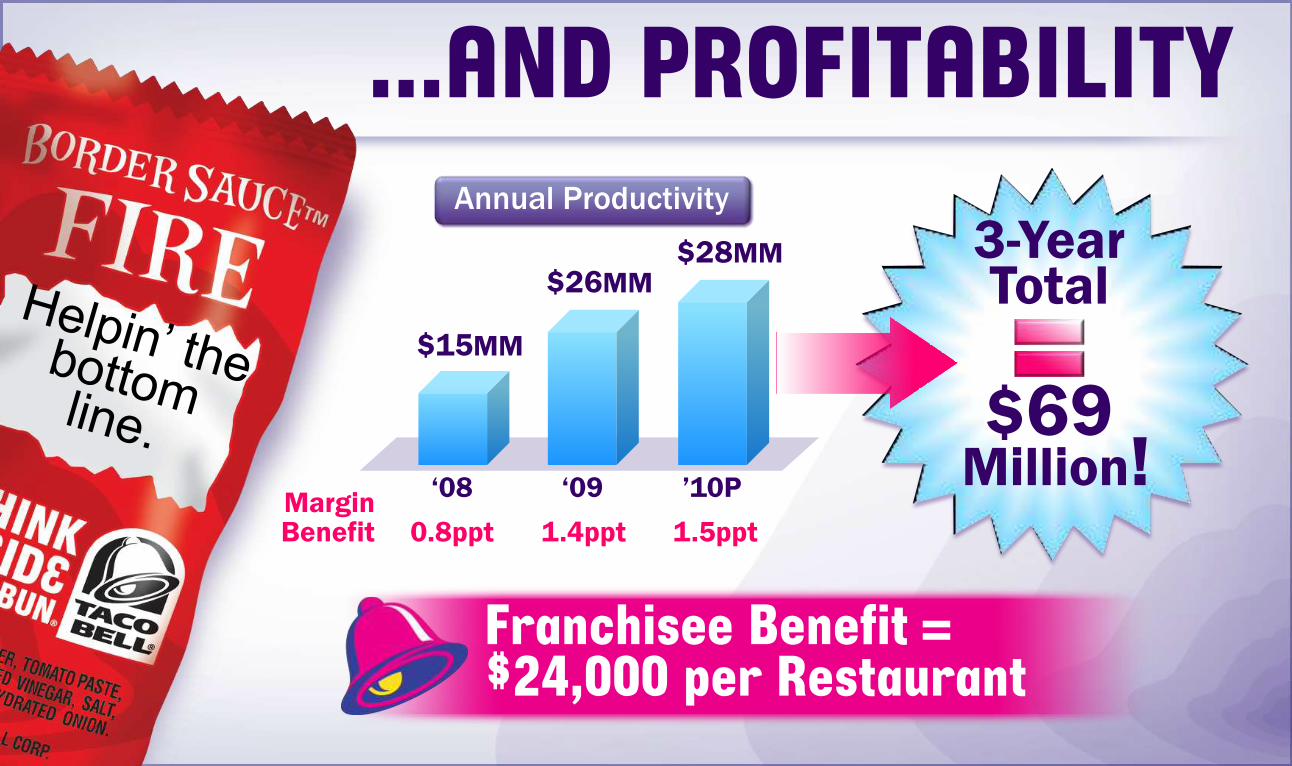
3-Year Total
$69Million!
...AND PROFITABILITY
„08
$28MM
„09 ‟10P
$26MM
$15MM
Annual Productivity
MarginBenefit 0.8ppt 1.4ppt 1.5ppt
Franchisee Benefit =$24,000 per Restaurant
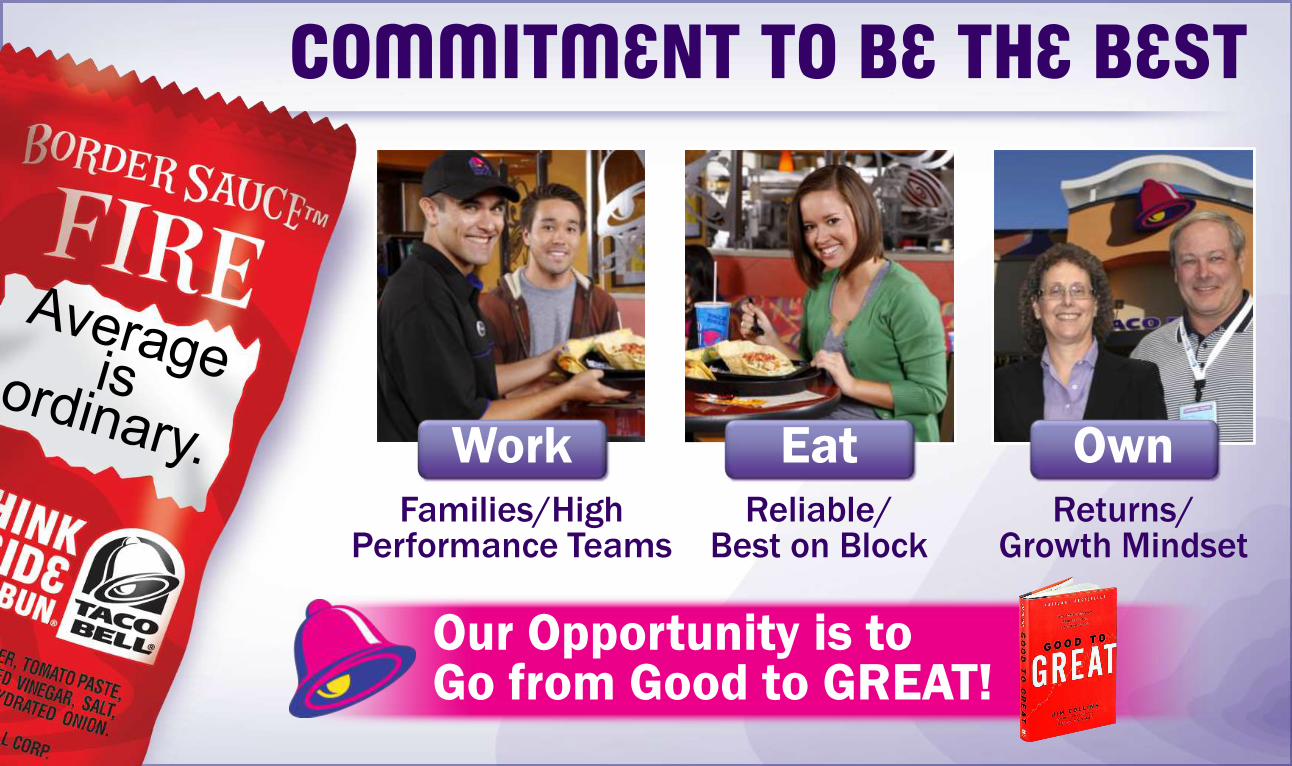
Our Opportunity is to Go from Good to GREAT!
COMMITMENT TO BE THE BEST
Work Eat OwnFamilies/High
Performance TeamsReliable/
Best on BlockReturns/
Growth Mindset
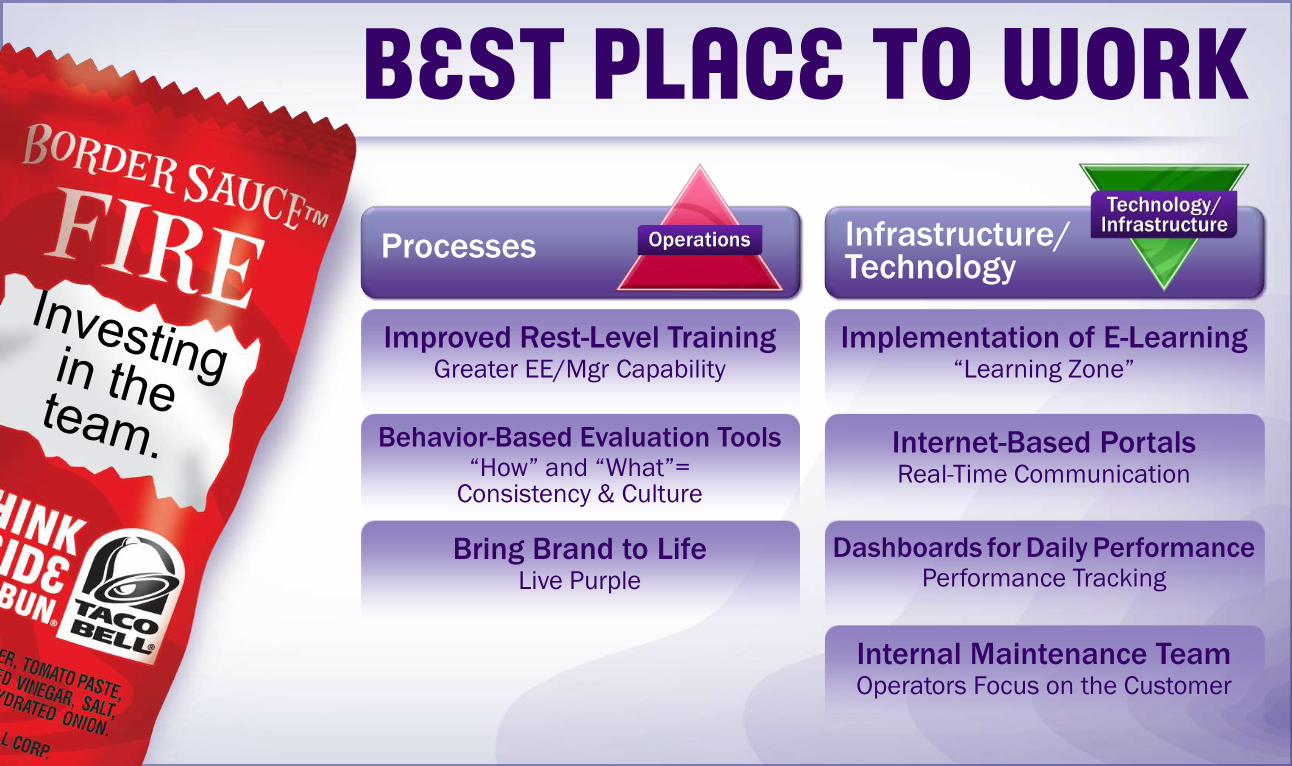
BEST PLACE TO WORK
Processes Infrastructure/Technology
Improved Rest-Level TrainingGreater EE/Mgr Capability
Behavior-Based Evaluation Tools“How” and “What”=
Consistency & Culture
Bring Brand to LifeLive Purple
Implementation of E-Learning“Learning Zone”
Internet-Based PortalsReal-Time Communication
Dashboards for Daily PerformancePerformance Tracking
Internal Maintenance TeamOperators Focus on the Customer
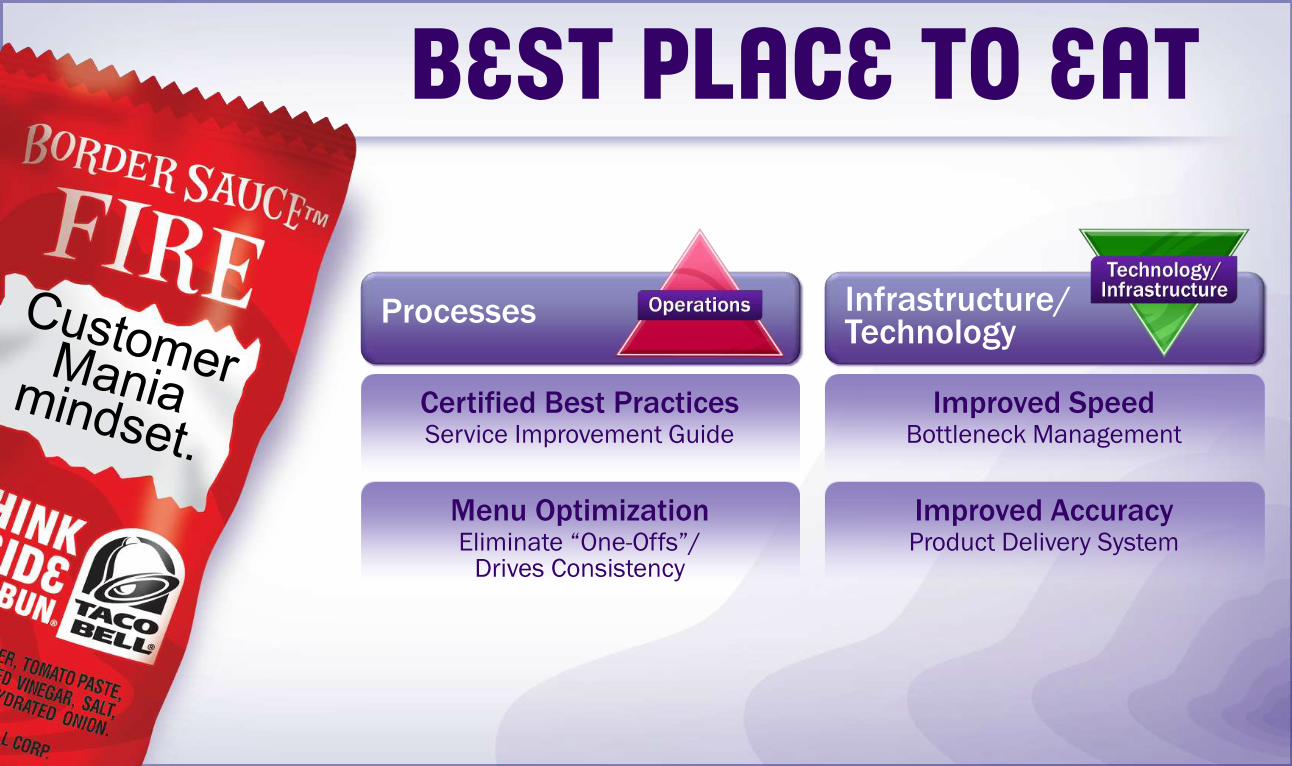
Certified Best PracticesService Improvement Guide
Menu OptimizationEliminate “One-Offs”/
Drives Consistency
Improved AccuracyProduct Delivery System
Improved SpeedBottleneck Management
Processes Infrastructure/Technology
BEST PLACE TO EAT

Processes Infrastructure/Technology
Enhanced RSC SupportDedicated Ops & Financial
Stewardship
Ongoing Productivity InitiativesTarget .5% Annually
Insight-Based ReportingDrive Sales/Profit
Inventory ManagementReduced Time/Optimized Capacity
Daily Business SummaryFinger-tip Performance Analysis
Internal Maintenance TeamReduced Repair Costs/
Longer Life-Cycle
BEST PLACE TO OWN
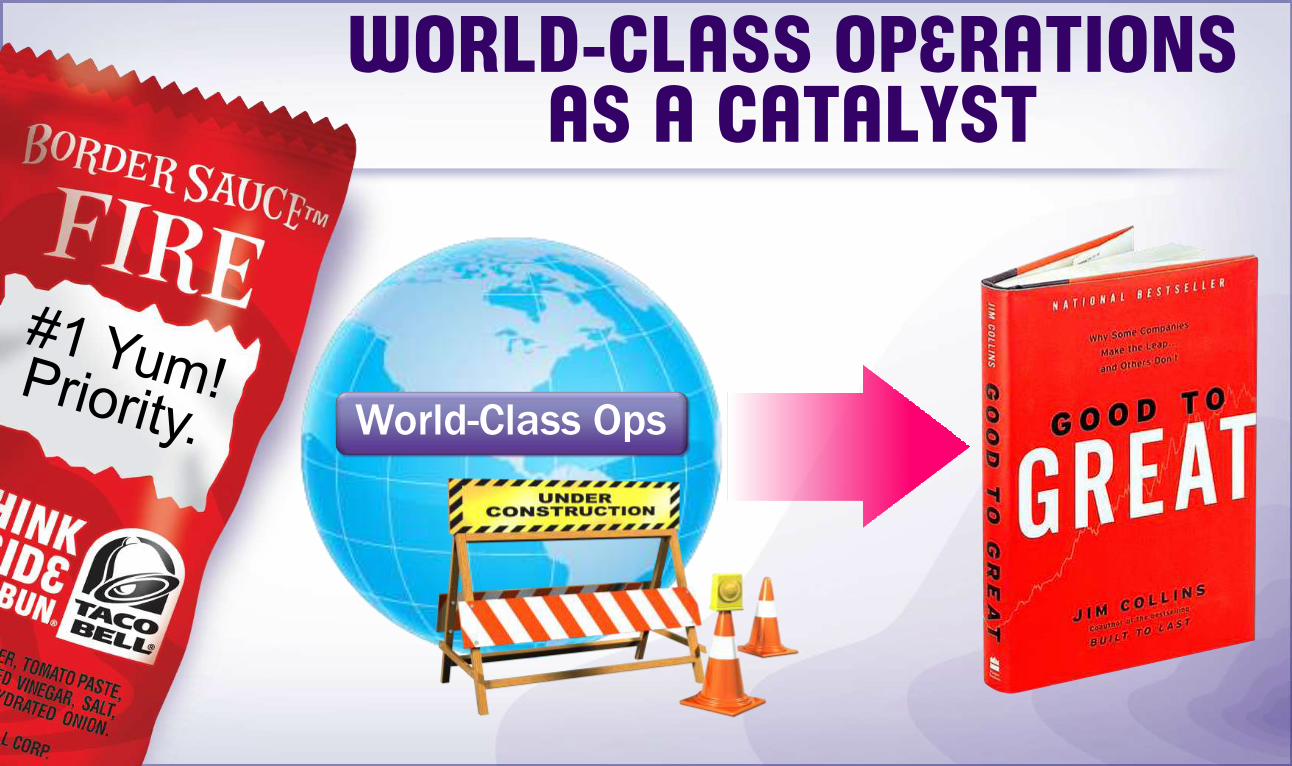
World-Class Ops
WORLD-CLASS OPERATIONS AS A CATALYST
MELISSA LORAChiefFinancialOfficer
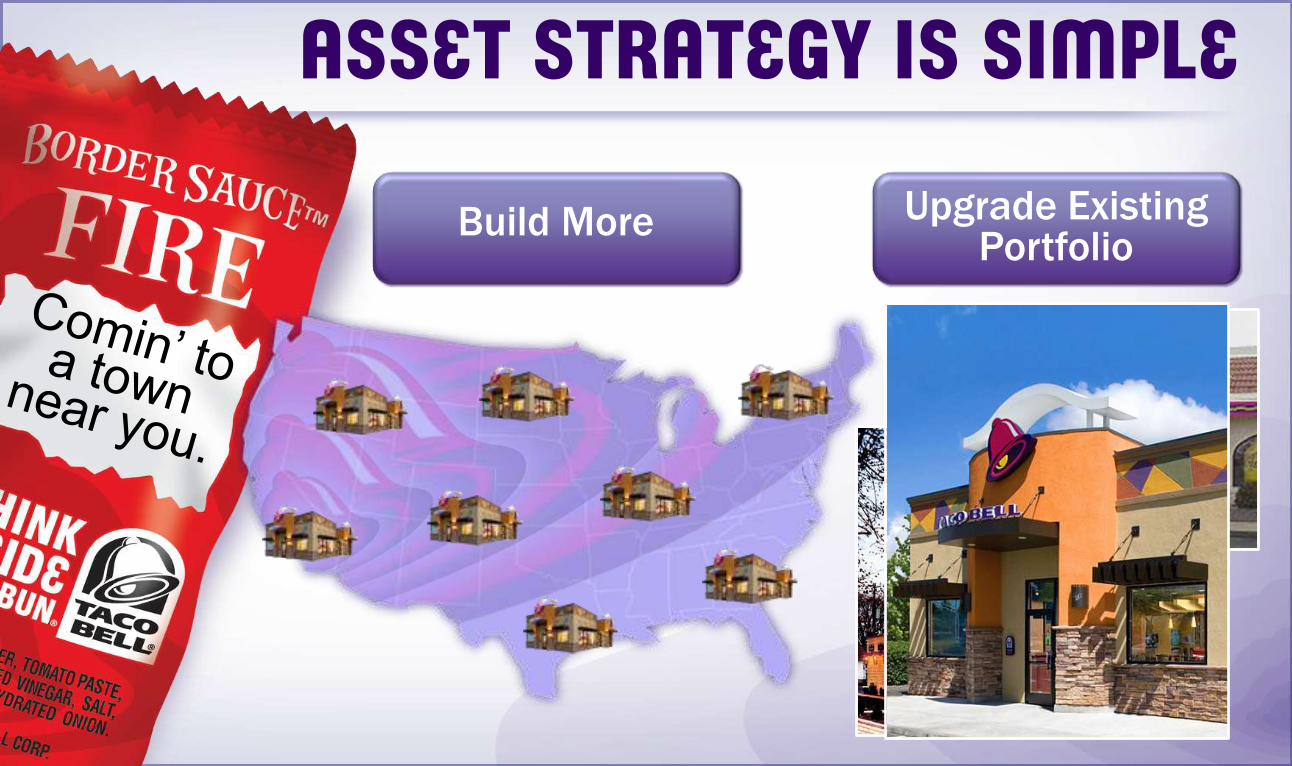
Build More Upgrade Existing Portfolio
ASSET STRATEGY IS SIMPLE

STEADY NEW UNIT DEVELOPMENT
System New Units
2009
102
115–125
88
2010 2011
Net New % 0.8% 0.6% 1.2%
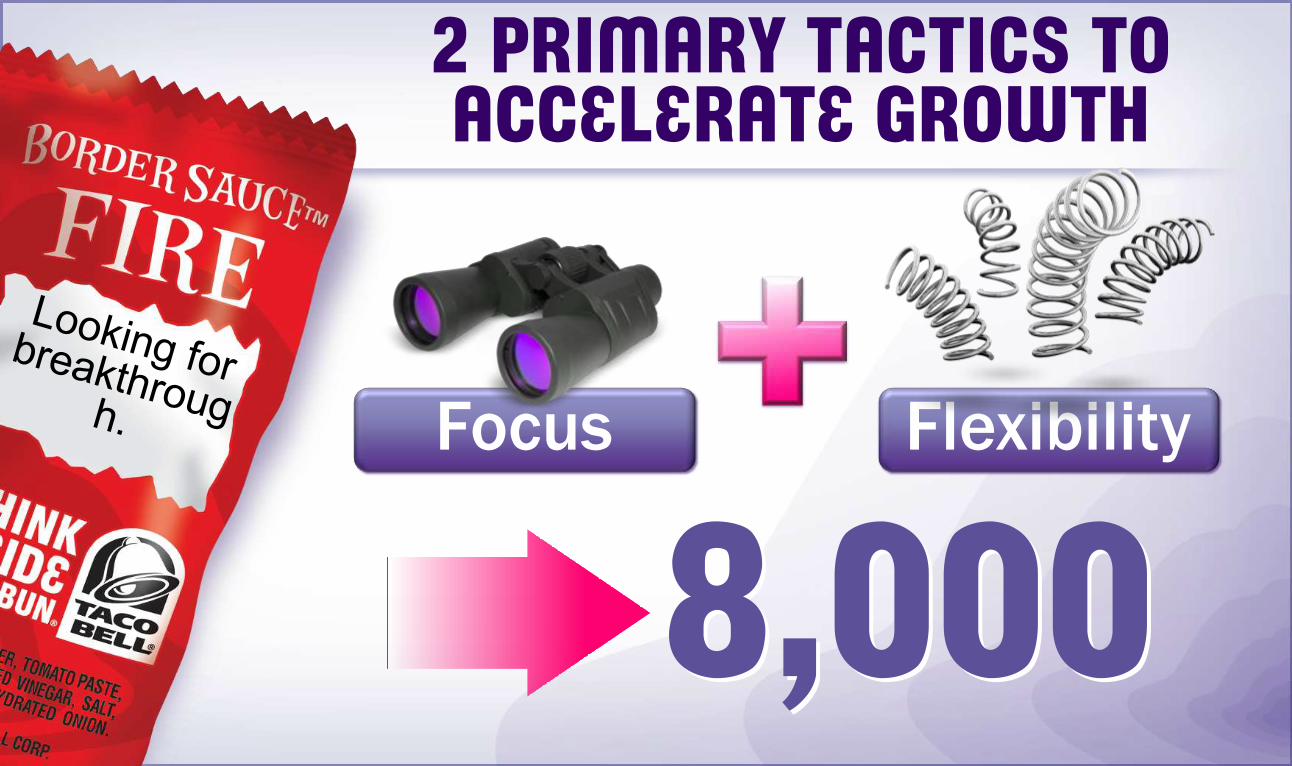
2 PRIMARY TACTICS TO ACCELERATE GROWTH
FlexibilityFocus
8,000 8,000
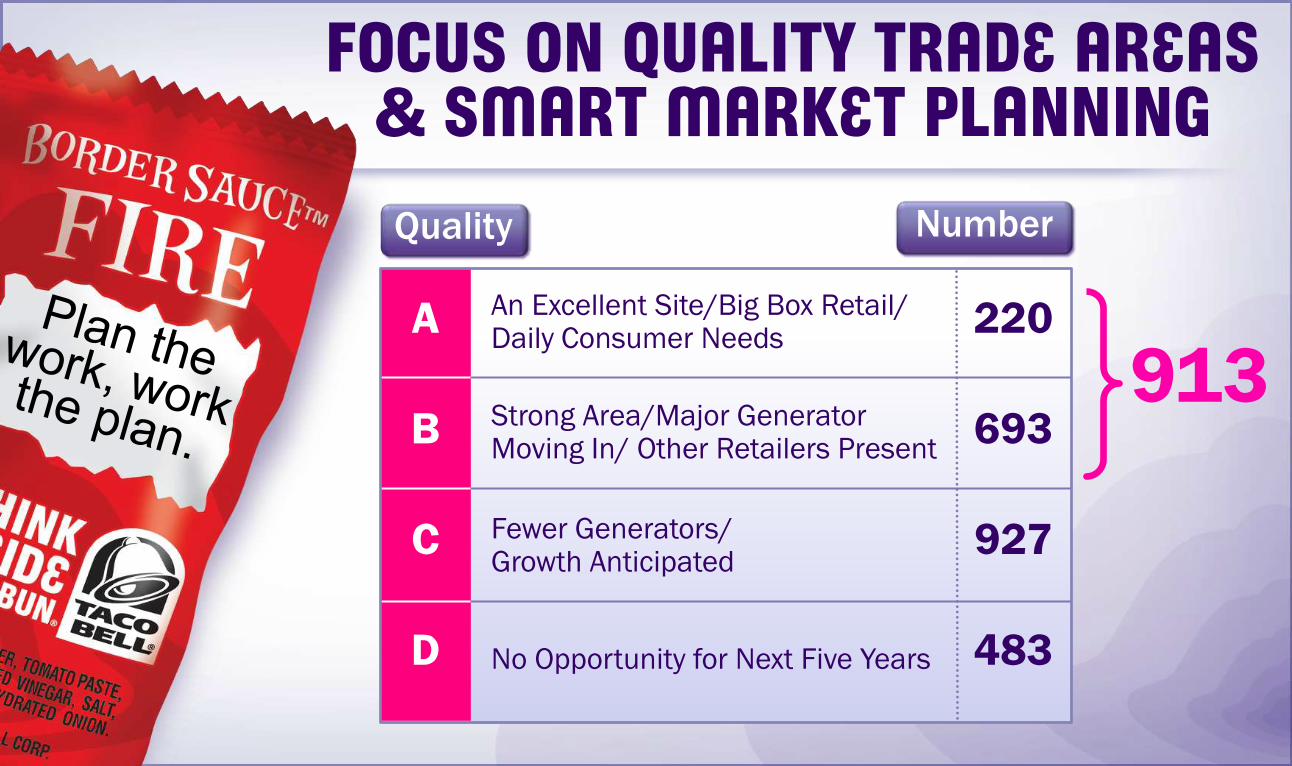
FOCUS ON QUALITY TRADE AREAS & SMART MARKET PLANNING
Quality Number
A
B
C
D
220
693
927
483
An Excellent Site/Big Box Retail/Daily Consumer Needs
Strong Area/Major Generator Moving In/ Other Retailers Present
Fewer Generators/Growth Anticipated
No Opportunity for Next Five Years
913
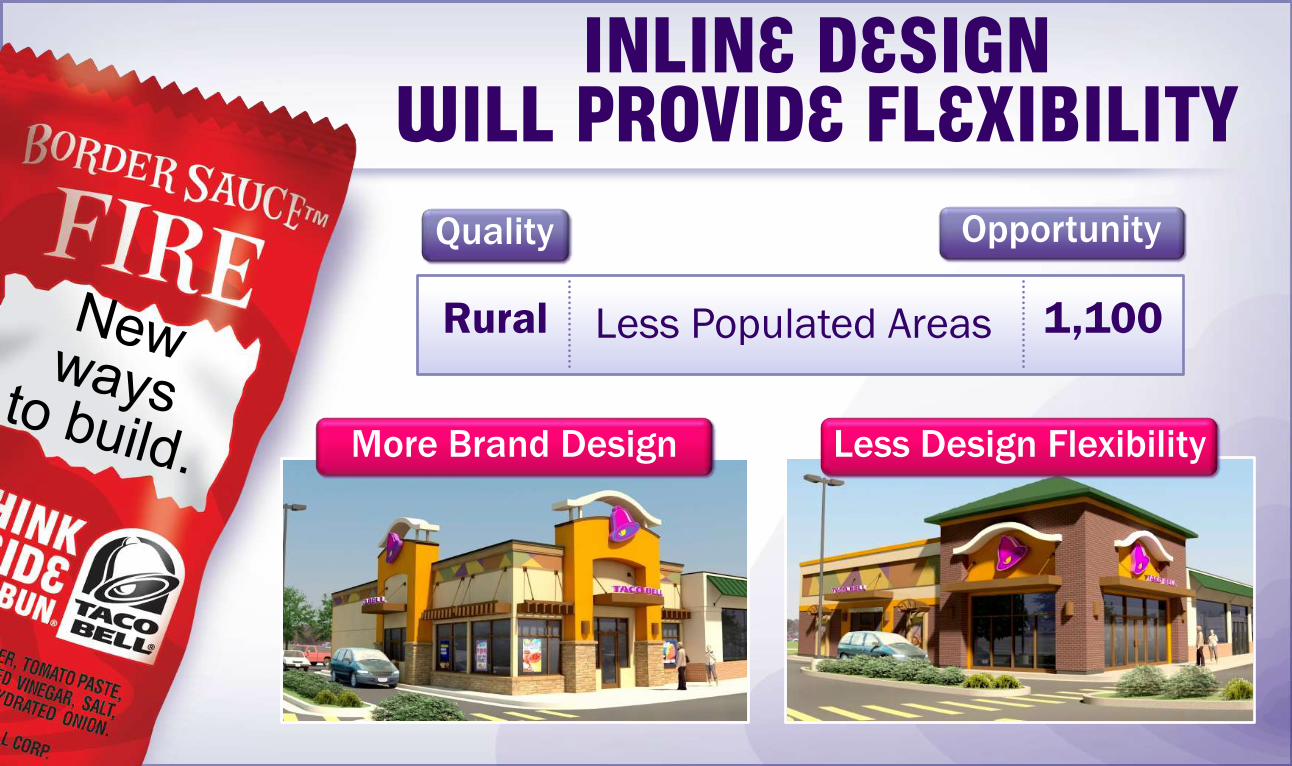
INLINE DESIGN WILL PROVIDE FLEXIBILITY
Quality Opportunity
Rural 1,100Less Populated Areas
More Brand Design Less Design Flexibility

REFRESH/REMODEL ACCELERATING
2007
316
2008 2009
194126
390371
2010 2011
System AssetUpgrades
Asset Strategy–YE 2008
Bold27%
AllOther
Asset Strategy–YE 2011
Bold54%
AllOther
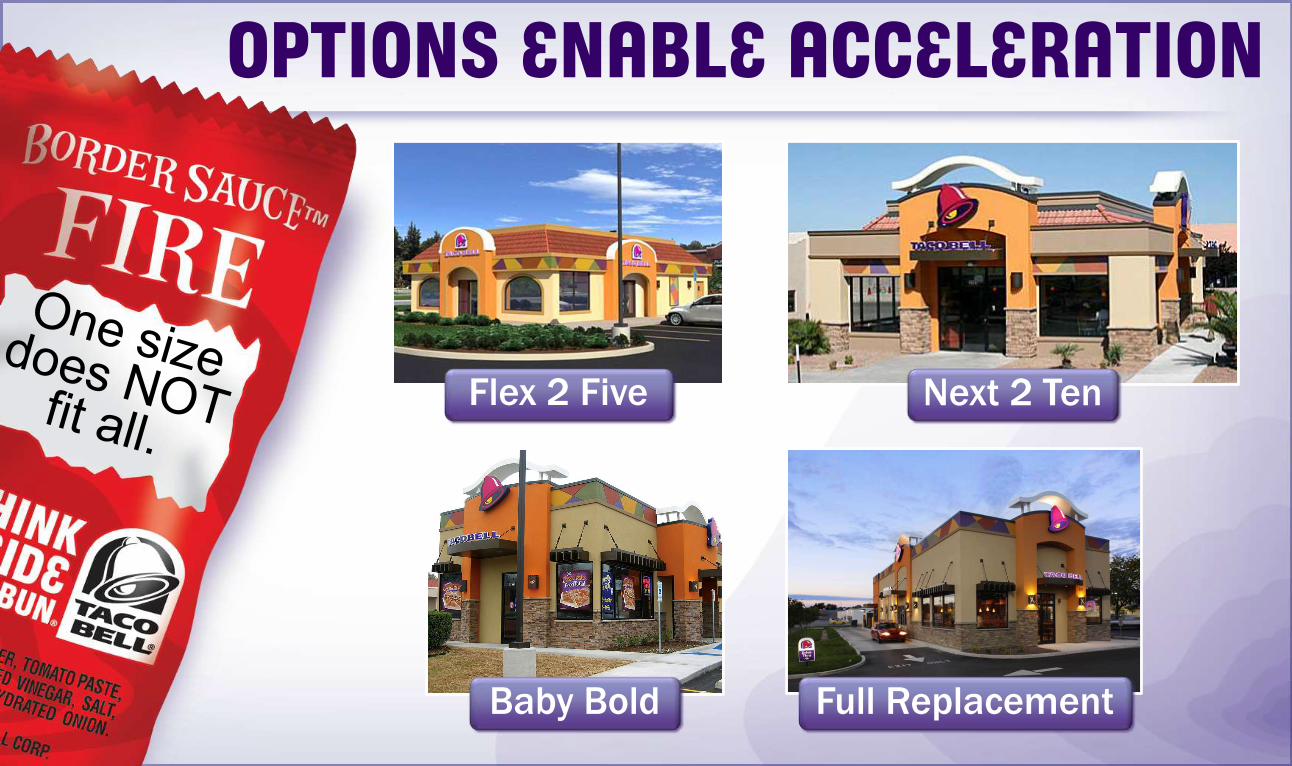
OPTIONS ENABLE ACCELERATION
Full Replacement
Next 2 Ten
Baby Bold
Flex 2 Five
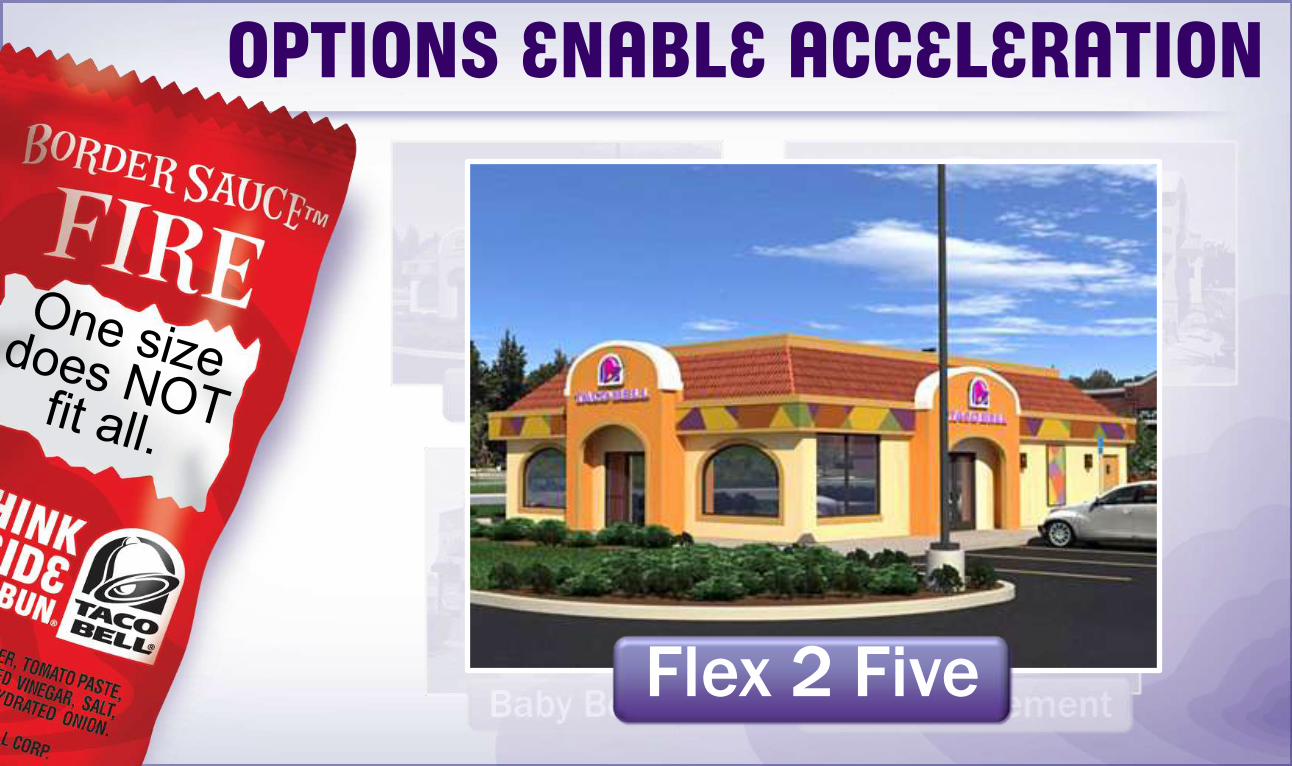
OPTIONS ENABLE ACCELERATION
Flex 2 Five
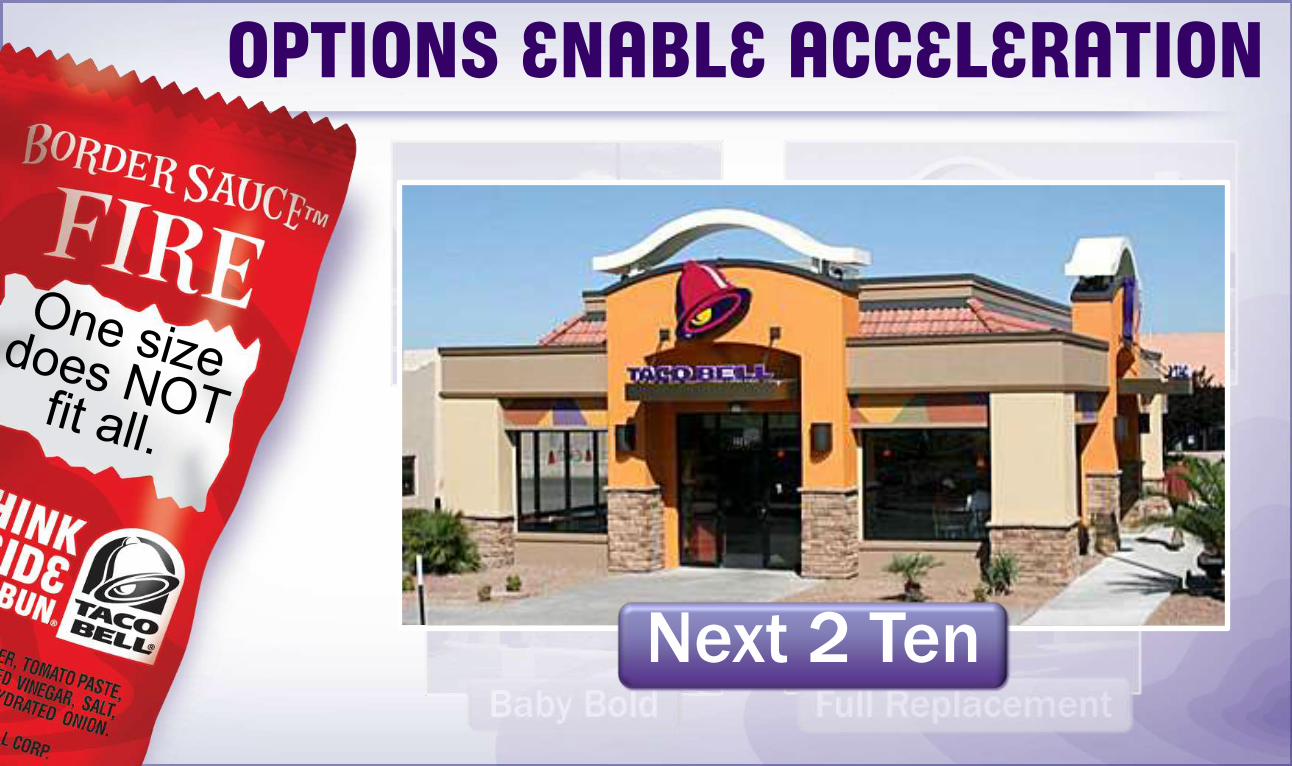
OPTIONS ENABLE ACCELERATION
Next 2 Ten
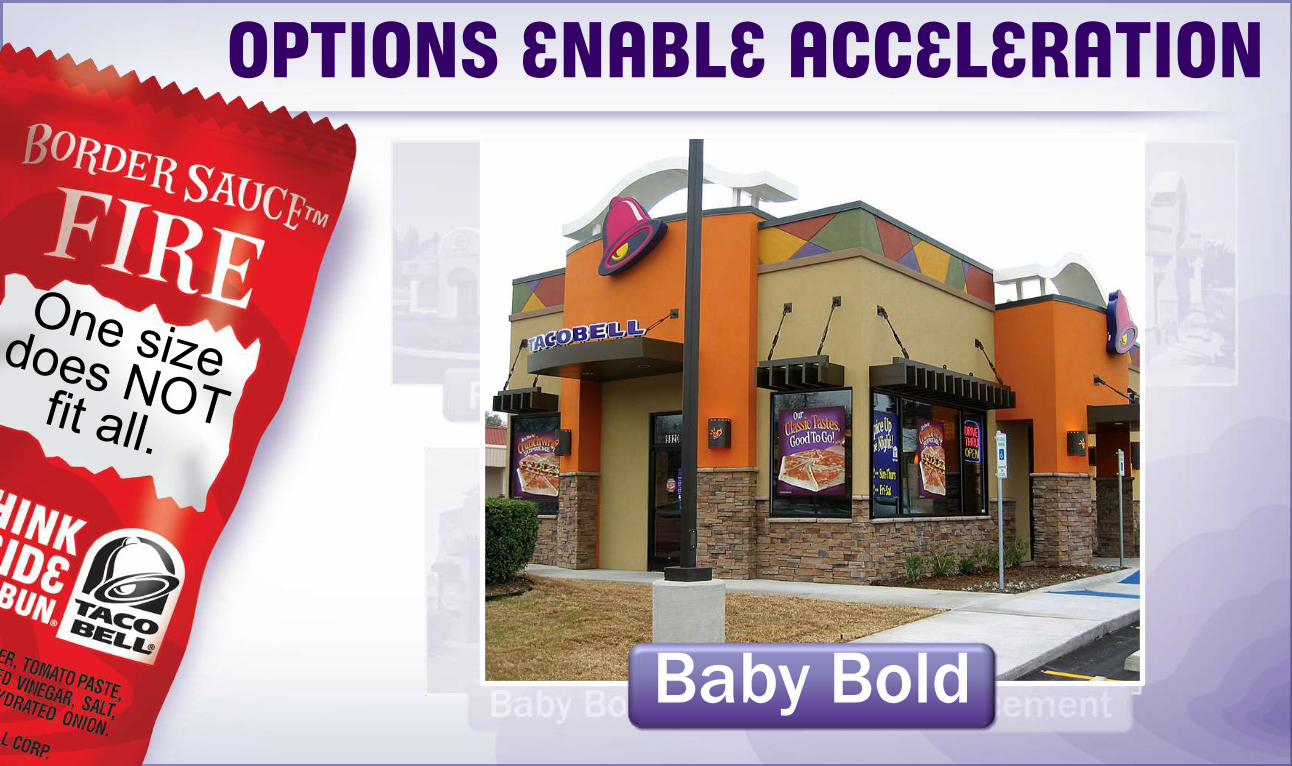
OPTIONS ENABLE ACCELERATION
Baby Bold

OPTIONS ENABLE ACCELERATION
Full Replacement

OPTIONS ENABLE ACCELERATION
OLD NEW
Refresh

REFRESH BRINGS CONTINUITY TO LOOK & FOUNDATION FOR BRAND
OCB
Menuboards
POS
Certified Broadband
PaintSignage
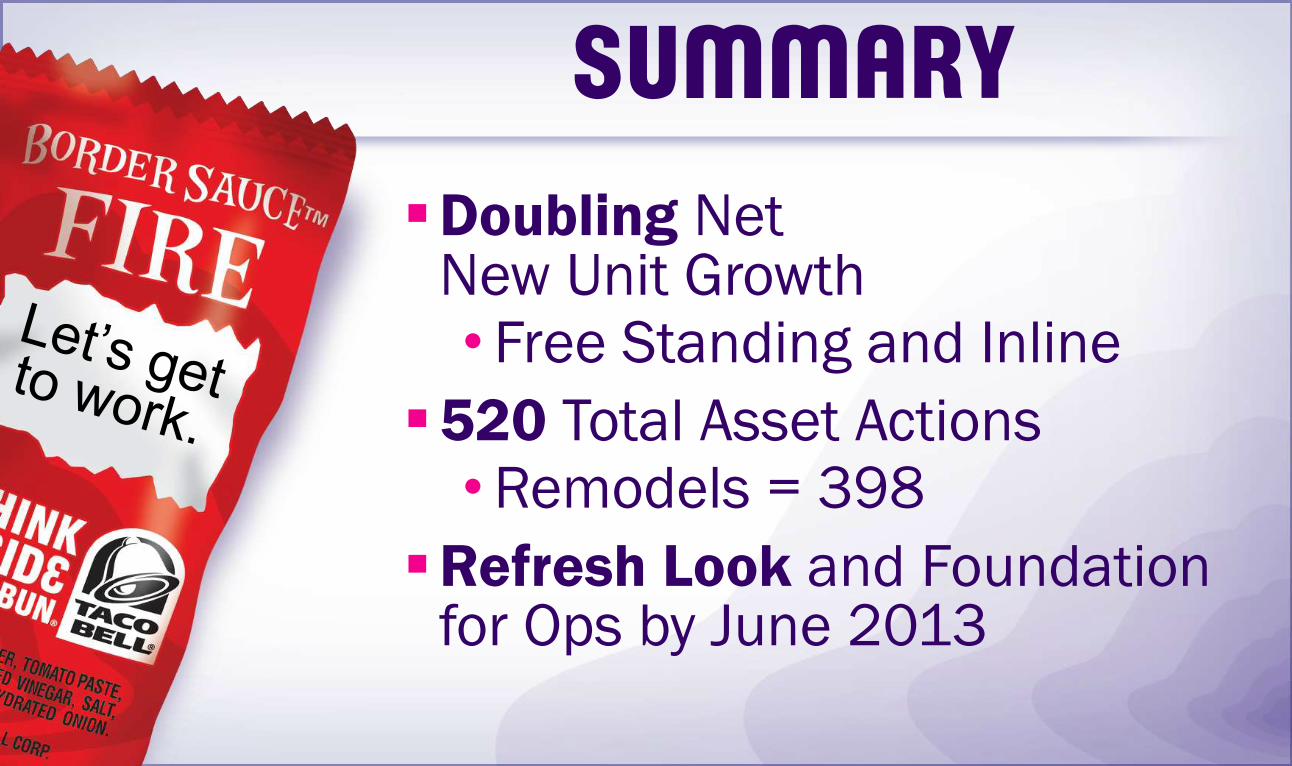
SUMMARYDoubling Net
New Unit Growth• Free Standing and Inline
520 Total Asset Actions• Remodels = 398
Refresh Look and Foundation for Ops by June 2013
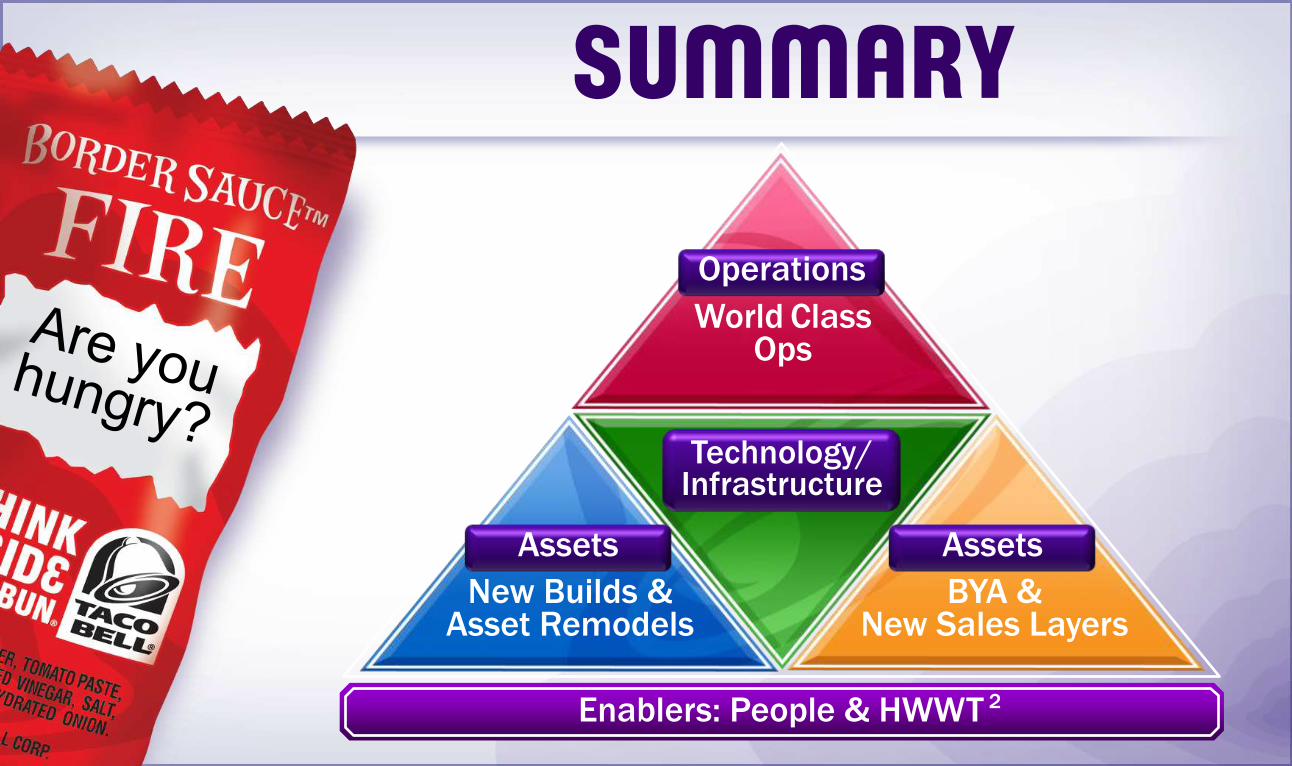
SUMMARY
Enablers: People & HWWT 2
Operations
World Class Ops
Assets
New Builds & Asset Remodels
Assets
BYA & New Sales Layers
Technology/Infrastructure
BRAND OVERVIEWFebruary 17, 2011