taeuber, karl e.;wilson, franklin d. the demographic ... · publication as chapter 12 in ... all...
TRANSCRIPT

ED 155 289 ,
rNSTITUTION
SPONS AGENCY
REPORT NOPUFODATECONTRACTNOTE
EDRS PRICEDESCRIPTORS
IDENTIFIERS
ABSTRACT
DOCUMENT RESUME
UD 018 334
Taeuber, Karl E.;Wilson, Franklin D.The Demographic Impact of School DesegregationPolicy. Discussion Papers No. 478.Wisconsin Univ., Madison. Inst. fcr Research onPoverty/.
Office of the Assistant Secretary for Planning andEvaluation (DREW), Washington, .C.IRP-DP-478-78Jan 78100-76-019639p,
iMF-$0.83 HC-$2.06 Plus Postage.*City Demography; City Problems; Elementary SecondaryEducation; *Enrollment Trends; *Integration Effects;MetropOlitan Areas; Public Schbols; *ResearchProblems; *School Integration; Social ScienceResearch; Statistical Data; *Urtan to SuburbanMigration*White Flignt
The inconsistency in research investigations of theprocess of white flight is especially.evident when social scientistsbecome actors in the legal drama surrounding the desegregatiqn ofpublic schools. Social science "experts" for the contending litigantsoften present contradictory evidence. The resultant ambiguity allowsjudges and administrators to dismiss the utility cf social scienceand rely o.n their own intuition Of the social process. It issuggested that many of the empirical ambiguities concerning thecauses and magnitude of white flight stem from the narrow,policyfocus cf most recent research. By failing to place the process ofwhite flight in a'sgeneral theory of urban demographic change,researchers b'ecOme 'susceptible to conclusions that enccurage asimplistic misidentitilcation of a complex set of behaviors. Extensivereliance .on aggregate measures of net change has increased thelikelihood of misidentification.- The advantages and shortcomings ofseveral methods that dirmrt-a richer analysis cif trends anddeterminants of deviations from trends are illustrated by utilizinglongitudinal and cross sectional data from American cities. A policyresearch agenda is suggested, in the hope that a broader perspectivewill be adopted in future studies of the redistribution ofmetropolitan population, especially with regard to the role played bydesegregation actions. (Author/GC)
e-s
****************************************************4******************** Reproductions supplied by EDRS are the best that can'be made ** from the original document. . v ************************************************************************
A

NST LT1SEARC
VIR
.41119
#478-78
ODISCUSSION
PAPERS
THE DEMOGRAPHICINPACT OF SCHOOL DESEGREGATION POLICY
U S DEPARTMENT OF HEALTH,EDUCATION &WELF ARENATIONAL INSTITUTE OiF
EDUCATION /
,`) 00(7,1MENf HAS BEEN REPRO-DuCED ExAC,LY AS RECEIVED FROME PE SON OR OPGAWZATIONORIGINA, NC, 7 P04475 or VIEW OR OPINIONS'
0 00 NECES,SARILY REPRESENT O. , AL, NATIONAL ,N$T,TuTE OF
E0.1'A POS11,004 OP POLICY
Karl E. TaeuberFranklin D. Wilson
'PERMISSION TO REPRODUCE THISMATERIAL HAS SEEN GRANTED BY
jbeask_a_4,4....A on ue4
TO THE EDUCATIONALRESOURCE ,, INFORMATION CENTER (ERIC) AND
USERS OF THE ERIC SYSTEM "
S.
U\IVERSFY OF WISCO\ N -MADISa\
JUN 6 197e.
The Demographic Impact of School Desegregation Policy
O
9
Karl E.-Taeuber,Franklin D. Wilson
January 1978
This paper .is one in a series, "Studies in Racial Segregation," supported.by funds.grantedto the Institute for Research on Poverty at the University,of Wisconsin by the Department of Health, Education and Welfare pursuant tothe provisions of the Economic'Opportunity Act Of 1964, .by Contract6No. HEW-1004.76-0196 froMthe Assistant Secretary for Planning and Evaluation, DREW,and by Grant No. 5 R01,11E 27880-02 froi the-Center for Studies of MetropolitanProblems, NIMH.' Data acquisition and processing wesupported in part byPopulationitesearch Center Grant No. 5P01-RD-0-5876 awarded to theCenterfor Demography and EcOlosy, of the University of Wisconsin by the Center forPopulation Research of the National Institute-of Tbild'Realth and HumanDevelopment. Conciusions,and4nterpretations are the sole responsibilityof the authors. This"pa:per'is scheduled'for publiCation as Chapter 12 inMichael Kraft and Mirk Schneider,,eds., Population Policy Analysis: Issuesin American Politics (Txilligton Books;-978).
e
C`,
, :1, ,

_
ABSTRACT.
While the process of white flight has been the subject of many
investigations, students of the urban,theater are still without a con-
sistent repertoire. This inconsistency is especially evident when social
scientists become actors in the legal drama surrounding the desegregation
of public schools. Social science "experts" for the contending litigants
often present contradictory evidence. The resultant ambiguity allows
jildges and administrators to dismiss the utility of social science and
rely on their own intuition of social process.
We suggest that many of the empirical ambiguities concerning the
causes and magnitude of white flight stem from the narrow policy focus
--.......aLapst recent research. By failing to place the process of white flight
fArin a eneral theory of urban demographic change, researchers become
susceptible to conclusions that encourage a simplistic misidentification
of a complex set of behaviors. °Extensive reliance on aggregate measures
of net change has increased the likelihood of misidentification. Utilizing
longitudinal and cross-sectional data, we illustrate the advantages and
\shortcomings of several methods tha permit a richer analysis of trends
and determinants of deviations from tr Finally, we'offer a policy
research agenda in the hope that a broader perspective will be adopted
in future studies of the redistribution of metropolitan population,
especially with regard to the role played by desegregation actions.

The Demographic Impact of School Desegregation Policy
In a courtroom in Dallas in March, 1976, a federal judge heard
testimony from sociologists retained by each party in a remedy hearing
.1on school desegregation. The expert witness for the school district
'presented an analysis showing that full desegregation with extensive.
busing would spur rapid and sustained white flight, quickly turning the
public schools into a system serving primarily 'black and Mexican American
children. The school district proposed a limited desegregation plan that
it claimed would avoid excessive white flight and thus permit the maximum
feasible amount of desegregation. The plaintiffs opposed a plan that,
preserved a substantial amount of uniracial schooling. Their expert
took issue with the unpublished and incomplete analysis of the other
expert, and presented unpublished and ,incomplete evidence that sowed no
consistent relation between desegregation and white flight. The judge
reached his decision only a few days after the conclusion of hearings.2
He expressed dismay at his inability to resolve "the battle of the socio-
logical experts." But he atcepted a limited plan that had as one of its )4
perCeived' virtues"the avoidance of massive white flight.
Social science research`on white flight is becoming a growth industry,
% but it has yet to return significant policy dividends. The judge was right
to express bewilderment. Despite the recent flurry of studies, there is as
o yet little schdlarly consensus.3
The news media have publicized particular
experts who are willing to express policy conclusions, and protagonists
%'
have seized upon those schplars willing to present evidence in judicial or
heariri& Presentation of evidence in Scholarly publications
2
is increasing, but cumulation of trustworthy evidence occurs at a glacial
pace. Our purpose here is to indicate certain complexities in the study
of white flight that take it extraordinarily difficult-to analyze, and to
suggest some data sources and modes nalysis that should prove helpful.
The redistribution of metropolitan population hps long been affected
by a variety of governmental actions, among 'which central city school-
desegregation actions are a recent addition. The call for a coherent
national policy on.population distribution is a recurring one in the
United States (and many other nations), but the Unitgd States has been
no more successful at developing a distribution polfCy than it has been
at developing a comprehensive population growth policy or an integrated
national urban policy. Massive suburbaniittion of the white population
is a fundamental featura of twentieth-century social change. .It has been
spurred by numerous governmental actions, often in ways not fully anti
cipated. At the federal level, public ho sing, slum clearance, highway
construction, urban renewal, transformation of residential mortgage
markets, public assistance regulations, facility location, and other
programs, together- with pervative racial discrimination in the conduct.
of each, all contributed to shaping the current urban crisis and its. , , ,
racial ditensions. State and local governmental actions similarly con-
tributed.tributed. Inactions at each level of government in the regulation of
private racial discrimination (redlining, restrictive covenants, etc.)
may also be cited.ed4
Interest in school viesegregation as'a possible contributing cause
of the duburbanization of white families has not developed out of a4
11.
broad concern for a coherent distribution policy, but springs rather
/
C.?

%Is
3
from political maneuvering over school desegregation policy. The narr6wti
policy framework within which questions about white flight have been
posed is one explanation for the narrowness of the social science research
on this topic. .We believe a broader perspective is both feasible and
more enlightening.
Varieties of White Flight
1,
In its decision mandating implementation of school desegregation
with "all deliberate speed," the Supreme Court ruled that "the, vitality
of these constitutional principles cannot be allowed to yield simply
beca\use of disagreement with,them."4
The Court did not then recognize
the ingenuity that would be displayed in, devising ways to,inhibappli-,
cation of these principles. In the 1960s and early 1970s the Court struck
ddwn one after another technique pf delay and evasion. As pAlic school
ystems increasingly desegregated their formal operations, avoidance of
central city public schools became one of the most effective techniques
by which individual white families could,evade."unyielding" constitutional
principles.
The immediate objective of most school desegregation programs is to
effect a redistribution of pupils among schools. Although school districts
havet,he authority to assign pupili to specific public schools, not all of
the pupils need attend as directed. In the early stages of desegregation
1n, many districts, simple boycott disrupted the intended attendance
patterns. Usually organized for the pu pose of keeping whitchildren
out of racially mixed schools or off the buses, bo cotts and the agitation
that often accompany them could induce such fear anti concern among,black ,
parents that minority as well.as whitelnrollments were diminished. Under
local compul'ory attendance laws and with the continued. high valuation
by the public of universal education, boycotts have invariably been
temporary phenomena. Their effectiveness, however temporary, suffices
to demonstrate that a carefully devised desegregation plan can, upon:
2
implementation, result in a greatly diminished and still totally segregated
pupil enrollment.
The transfer of pupils from public to private schooling is another
constitutionally permiSsible formof white evasion of public school deseg-
regation.' Many hastily organized and poorly financed "segregation
academies" have proved to be only somewhat less temporary than school
boycotts. In a few school districts, with Memphis a leading example,
large-scale private eduational systems have persisted for several' years.
Previously existing parochial schools, especially in cities with a large
Catholic population, have also received recruits from public schools.'
In some districts, with Boston a leading example, religious authdrities
have sought to avoid use of parochial schools as a haven for'white flight
.from desegregation. In other districts new pupils have been welcomed,
if only covertly, as t1j basis for miercomidg problems associated with
a steadiiy'declining enrollment.'
The most permanent type of white flight is movement to another school
district. If the districtundergoing desegiegatiOn is the central city
of a metropolitan area, ,there may be many suburban districts that offer
sctooling with few or no minority pupils. Nearly all northern suburban
districts and many southern suburban districts have an overwhelmingly
white enrollment. .Their schools are nearly uniracia veeif the suburban
district has implemented its own desegregation plan.

r
5
Rssidential atobility to escape undesirable effects of a desegregation
plan may be possible within a city. A change of residence may permit a
family's children to attend.a nearby school or a racially unbalanced school,
depending on the details of the plan and its completeness, 'In other situa-
tions, moving'may be o'f little effectiveness as flight from desegregation.'
In Florida, for example, school districts are county-wide, most.counties
contain a sizable proportion of black pupils, and all counties have deseg-
regation plans in operation.
A Cohort Perspective on Enrollment Changes
Most studies of white flight from school desegregation have taken
as their index of white flight a measure of change in the enrollment of
white pupils in public schobl systems.5 The energy that has been put
into assembling data and undertaking complex-multivariate time-series'
analyses has not been matched by sufficient attention to the key variable.
The changed in white enrollment from one year to the' next is a composite
reflection of several types of change. iIn standard demographic parlance,
is a measure of "nee. change rather than "gross" change. Use of net
changeAlosses over the separate types of change,and conceals informationP
that would be revealed by appropriate specific measures.
To illustrate the limitation imposed by using net enrollment change4
as an index of white flight, consider any central city school district.
Each year some families move to the Zity and some from the, city, and some
pupils transfer from public to private school or the reverse. Each year
'some pupils graduate from high school or drop out at an earlier stage,6.1
and others first enroll in kindeggarten or first grade. Assume that this
44.
9
1.0
6
normal flowof pupils into and out nf the public schools amounts to 10%
annual turnover in White pupils. Each year about 10% of the pupils from
the'previous year don't return and about im of the pupils, are new to
the system. Now assume that a desegregation program is begun, and that,, 4
as a result of public controversy the supply of new white pupils dries-
up., No white parents movingsto or within the metropolitan area locate
so that they have to enroll their children in the desegregated system,
and no five or six year olds enroll for the first time. Even if all of
the pupils in the pUblic sehool system comply fully with the desegregation
action, there will be an annual percent decline in white enrollment. There
is in this hypothetical situation a strong demographic responge to school
desegregation.- To label that response white flight rather than white
avoidance encourages a oimplistip misidentification of the process.
Most studies of white flight have been sensitive to the, problem of
demonstrating that post-desegregation enrollment changes differ from
predesegregation enrollment changes, but have overlooked the possibill-cy:
- of identifying separately any Of the components of change. A diagram of
the main linkages between desegregation actlions,and enrollment changes
is given in Figure 1. A desegregation action can affect aggregate enroll-
ment by its influence on migration or private school enrollment. (The
diagram simplifies by omitting the possibility of an effect on dropout41
rates, on annexation to or from the school district, on the pattern of
inter-district pupil changes, or on schools, grade spans, and Special
students included in'the district-enrollment count.) A change in pupil
migration patterns may take several'forms, as suggested in the hypothetical
example of a district with a 10% turnover rate: (1) Parente of currently
1,01

7
enrolled pupils may move to another' district; (2) parents of pre-school.,:'
.children or potential parents may leave the district (note that parents
may fit in categories (1) and (2) simultaneously); and (3) parents or
potential parents who live in other districts and might have moved to
the desegregated district may deAde not to do so. An increase in enroll-
ment in i.riVate schools may occur from: (1) an increa6ed rate of transfer
of pupils from public schools; (2) higher-than-expected rates of enroll-'
menf of new pupils in private rather,than public schools; or (3) lower-
than-expected,rates of transfer of pupils from private to pliblic schools.
. The second set of three modes of desegregation action affecting
enrollment patterns was couched in terms of higher or lower enrollments
than expected; the first bet could have been phrase in similar conditional
terms. Each of the distinct enrollment effects occurs in the "normal"
course of events in the Absence of desegregation actions. To identify
the causal effects suggested by Figure 1 requires a complex analysis of
trends and the determinants of deviations from trehds. Much enrollment
change arises from causes other 'than desegregation actions. Unless these
are well-specified and well-measured, there is,a'severe danger of over-
interpretation of the impact of desegregation actions. The greater the
reliance on aggregate measures of net change rather than on disaggregated
'or gross measures of specific components of change, the greater the inter-,
pretive difficulties.
Many of the analytic proglems we have raised are not subject to
resolution with the finds of data generally available, nor are they all
soluble within the Techniques of contemporary social science. We shall
return to these issues later, bu-t'first'we wish to indicate that simple

/
J
COMmuroATro.MuTES
MIC./kAl" tON
OtSiG.l .ArIONACTio,N.1`
-Figure-1. Model of School Enrollment Responses to Desegfegation Actions /
111
Cs S C bI Oz4N MOLL PM46
Pra.%%; Are' 1 .Hoot.5N 12.0t4, ttite N
t
co

V
46,
improvements in the measurement of enrollment change are'feasible with
data that often are available, and that these simple improvements may
. increase the interpretability of desegregation analyses.
The task of describing and assessing components of change in public
school enrollment is formally similar to tasks routinely encountered in
demographic studies of population change. Demographers have developed
a variety of techniques for assessing components of change. One of the
most powerful is cohort analysis. A cohort is a group of people defined
on the basis of some common event during an initial period (for example,
being born in year T). Cohort members are traced through succeeding
years as they are exposed to the risk of sequential events (in the most
elementary demographic example, the risk of death, which may be viewed
as one form of departure from the initial population). The entrance of
children into grade 1 of a public school district may be used as the
defining-event for a cohort. In a school population unaffected'hv
migration, failure, mortality, and other changes, the number of pupils
in grade 2 in year T + 1 should equal the number initially observed in
grade 1 in year T. In fact, of course, there will be additions to and
subtractions, from the initial cohort that alter the numbers observed
year by year. And if our data source is enrollment data rather than
longitudinal information on the schooling and residential experience of
'each individual child, then we cannot identify all of the components of
change nor exploit the full potential of cohort analysis. But adminis-
tratively gathered data do permit a partial cohort analysis that improves
upon analysis of aggregate net enrollment change. We shall illustrate

10
the technique with published data from Ahnual Reports of the State Depart-
ment of Education of Louisiana.
In Louisiana, public education is organized by parishes counties).
The East Baton Rouge Parish School District serves the populat-ion of the
Baton Rouge metropolitan area (as defined at the time of the 1970 census).
The Shreveport metropolitan area is served by the Bossier Parish and Caddo
. Parish School Districts, and we have combined data for these two parishes.
Data for these school districts are displayed in Tables.1 and 2. Each of
these districts implemented a partial desegregation program in Fall, 1970.
In Table 1, selected enrollment data for the years 1968 to 1975 in
the East Baton Rouge Parish School District are organized to permit tracing
the enrollment history of cohorts. The cohorts are identified by the year
in which the pupils who progressed normally\entered 1st grad4. The first
row of the table refers to the cohort of white pupils that entered'lst
grade in Fall, 1961.. We first observe them in this\data set in Fall, 1968,
when they art in 8th grade. They numbered 3,319 when the official enroll-.
ment count was made. In Fall, 1,969, the official enrollment count of
white 9th grades was 3.9% greater. The 10th grade count;,in Fall, 1970
(upli-tdplementation of the partial desegregation plan) was 5.5% lower
than the year before. Between 10th and 11th grades, this cohort experienced
a net loss of 8.9% of its members. Throughout the table, the first entry
for each row shows the size of the cohort of white pupils when it first`
appears in this data set, and subsequent entries in each row show the
percentage change in'enrollment from the previous year.
A -
The principal'question for which these data were assembled is whether
grade by grade changes in white public school enrollment are associated
a

//
-Table 1- '
Initial Public SChool Enrollment and Annual Percent Change,for Selected Cohorts of White Pupils, Ee'st Baton Rouge Parish School District:
Fall; 1968 toFall,1975.
Cohort and Grade'i
1968 1969 19702 1971 1972 1973 1974 1975
.
19611. 8th . 3319 3.9 - 5.5 -8.9 - 2.5.
1962 7th 3678 - 2.0 1- 4.3 - 0.9 -11.8 - 0.4
1963 .6th 3549 6.9 - 9.2 4.9 2.8. -10.1 -18.6
1964 5th 3362 ''''' . 1.6 - 0.6 . -.1.6 - 0.1 0.1 . r16.1 3.3
1965 4th 3623 0.6 - 6.3 3.9 - 1.9 2.4 t) - 5.7 - 1.5
1966 3rd 3625 0.8- - 7.7, 3.3 - 3.2 0.1 5.9 7.0
1967 2nd 3680,
- 0.9 ' - 5.4 - 0.3 6.2,, 7.6 7.9 7.2
1968 1st 3734 - 1.7 . - 6.4 . 0.8 - 2.3 1.6 - A.4 18.7
1969 1st 3650 -10.2 1.3 _6.3 2.1 - 4.5 9.5
1970 1st 3410 - 1.3 - 0.7 2.0 -,7.2 6.4
1971 1st 4 2947 - 0.2 1.9 - 7.5 8.7
1972 1st 2931 1.9 - 8.6.
8.1
1973 1st 3111 - 8.4 . 8.4
1974 1st 2988 9.5. -
'Cohorts are identified by yeas (Fall) that most entered*lst grade.first observation in this data set (Fall, 1968 or later).
large-scale pupil desegregdtion plan was impleiented in Fall, l970.
S!urce: Annual-Reports of the State Department of Education of Louisiana.
Grade identified is that at time nf
16 1

12
with'the implementation of a desegregation program. In Table 1 and in
Table 2 the entries in the 1970 column are uniformly negative and are
among the largest negative percentages in each row. Each cohort experi-
enced a large l6ss in the'year of desegregation.
Amother, question raised in the white flight literature is whether
an apparent first yearwhite enrollment loss is matched by unusually high
losses for several succeeding years, whether the pattern for subsequent
years .returns to "normal," orwhether there is a drift back to, publid-'
schools of some of those who left the first year. Examination of experi-
ence in the years after 1970 shows an erratic pattern of gains and losses
for the EastBaton Rouge cohorts, and an inconsistent pattern of small
declines for the Bossier/Caddo cohorts.
The data in Tables ;1 and 2 provide other opportunities for browsing
to discern patterns in enrollment trends. In both tables there are sub-
stantial enrollment declines associated with the transition from the 10th
to 11th grades; perhaps this reflects dropouts of children exceeding com-
pulsory attendance ages. The numbers at the bottom of each column show
the, size of the successive cohorts entering 1st grade. These numbers
display a general downward trend. We cannot determine from these data
how much of this downward trend is accounted for by previous fertility
declines and the consequent annual declines in the number of children in
each parish reaching age 6, how much stems from increasing util \zation
of private schooling, and how much reflects migration patterns of families
with young
Annual counts of'enrollment by grade are often produced and used-in
educational administration.' Standard computer programs have been prepared
QY
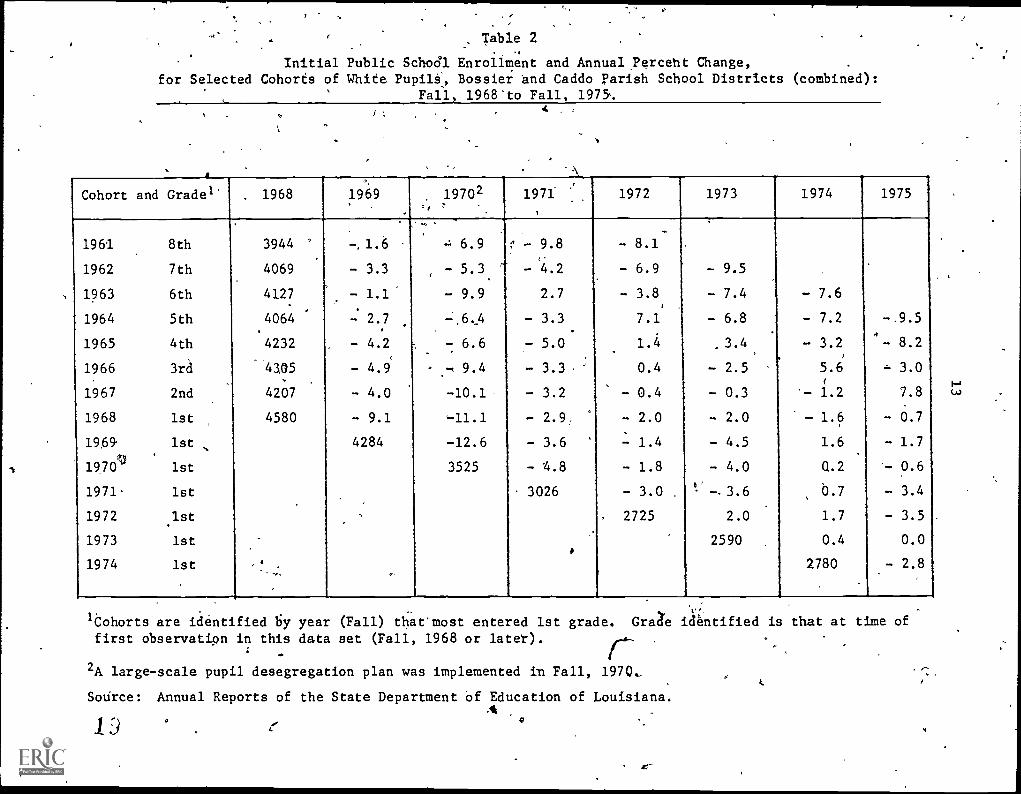
Table 2"
Initial Public Schodl Enrollment and Annual Perceht Change,for Selected Cohorts of White Pupili, Bossier and Caddo Parish School Districts (combined):
Fall, 1968'to Fall, 1975.4
Cohort and Grade1 . 1968 1969.
19702.
1971.,
1972 1973 1974 1975
1961
1962
1963
1964
1965
1966
1967
1968
19,69
1970
1971.
1972
1973
1974
8th
7th
6th
5th
4th
3rd
2nd
1st
1st
1st
1st
1st
1st
1st
.
3944
4069
4127.
4064
4232
41m
4207
4580
' -,1.6
- 3.3
- 1.1'
- 2.7
- 4.2
- 4.9
- 4.0
- 9.1
4284
...
.
=6.9
- 5.3
- 9.9
-:,6,4
- 6.6
- -, 9.4
-10.1
,-11.1
-12.6
3525
4
: - 9.8
-'4.2
2.7
- 3.3
- 5.0
- 3.3
- 3.2
- 2.9
- 3.6
- 4.8
- 3026
0
- 8.1
- 6.9
- 3.8
7.1
1.4
0.4
- 0.4
- 2.0
- 1.4
- 1.8
- 3.0
. 2725
- 9.5
- 7.4
- 6.8
.3.4
- 2.5
- 0.3
- 2.0
- 4.5
- 4.0D ,
- -.3.6
2.0
2590
- 7.6
- 7.2
- 3.2
5.6
- 1.2
- 1.6
1.6
Q.2
b.7
1.7
0.4
2780
-.9.5.
- 8.2
.. 3.0
7.8
- 0.7
- 1.7
- 0.6
- 3.4
- 3.5
0.0
- 2.8
'Cohorts are iaentified by year (Fall) that most entered 1st grade. Grah identified is that at time offirst observation in this data set (Fall, 1968 or later).
2A large-scale pupil desegregation plan was implemented in Fall, 1970,
Sodrce: Annual Reports of the State Department of Education of Louisiana.4
11)

14
to permit use of such data in projecting future,enrollmen s.6
- It is common
or.experience that these numbers and the associated gradetograde transition
rates fluctuate in erratic patterns. One expert-recommends using a ten,
-.
.
year trend to establish a base from which to make a projection./
Clearly..
the task of establishing "normal." trends from which to'Identify deviationA
attributable to school'dvegregation actions is extraordinarily difficult.
If it is assumed that parental flight responses may occur during the period
that desegregation is a controversial issue before any action has been
taken, at the time of actions, and for some years following, identification
of effects would require extraordinarily rich data sources. and ingenious '
and meticulous statistical methodology.8
1
Flight to Where
If pupils flee from public schools in a desegregating district, they,
must alight in some other school system. One way to work".the puzzle of
interpreting complex enrollment trends in the desegregating district is
to find evidence of complementary enrollment trends iliterivate schools
of adjoining districts. Of course, it is not necessarily any easier to
identify unusual enrollment increases in suburban districts than it is to
identify unusual enrollment declines in a central city district. Indeed,
. for those central city districts in whiCh the numb4of white public school
pupils declined greatly before desegregation,,use of enrollment data to,
identify destinations of fleets may be much harder. A10% decline in
public school whites in the centraldistriCt may represent only a 2 or 3%
rise in public school whites in suburban districts. If the suburban\

15
territory is divided into many small school districts, the enrollment
in each may be too small and trends too erratic for reliable interpretation.
To illustrate the utility of pairing outflow with inflow data, we
may use the Louisiana districts. Because these are metropolitan districts,
the principal destination of white fleers from public schools must have
P
been private schools: (Unfortunately for our example, each Of these4
metropolitan areas has been expanding into adjoining parishes, and the
formal.definitions of the Standard Metropolitan Statistical Areas have
been altered since 1970 to include additional parishes. To keep our
'Texample simple, we ignore this real-world complication.)
0Anna). dataion4private,school enrollments, by race and grade, are
provided in the Annual Report) of the State Department of Education of
LoUisiaba. To permit a summary comparison of public and private enroll-
meat tienda, without sacrificing., all of the benefits of the cohort approach,
we have summed together data for five cohorts, those that were in 1st through4
5th grade in Fall,s1968 (7th thraiigh 11th grades in Fall, 1975). Publit
7
and private school totals are aft'ayed.side by in Table 3. The firstv4
pair.of.miata columns Waows the aggregate enrollthent in the five -grade span
for` each year, 1968 to 1974. The middle columns present the annual numerical
changes in enrollment, and the final columns present the change figures'ss
percentages.
6 During the years 1968,1975 public school enrollments (for these
, . If
cohorts) were.generally declining. Private school enrollments incr4sed
to a peak in 1970 and subsequently.declined. We must examine theibMiddle,
columna'for evidence of complementarity in public an& private enrollment $. ,
trends. The most striking result is the`-change accompanying the partial
t

16
Table 3
Annual Change in Enrollment of Selected Cohorts of White Pupils
,)in Public and Private Schools, East Baton Rouge Parish and
Bossier and Caddo Parishes (combined) H ,
Fall, 1968 to Fall) 19751
.
School Year
(Fall)
' InitialEnrollment
Changes in Enrollment
Number
Public
Percent-
Public
, /Private Public Private
,,
,t
.
East tone Parish..
1968 to 1969 18,024 4,581 14 - 135 0.1 - 2.9
1969 to 1970 18,038 4,44,6 - 969 459 -5.4 10.3
1970 to 1971 17',669 4,905 254 -.378 1.5 - 7.7
1971 to 1972 17,323 4,527 - 14 - 242 -0.1 - 5.3
1972 to 1973 ---' 17,309 4,285 434 - 379 2.5 - 8.8
1973 to 1974 , 17,743 3,906 -1,382 - 638 -7.8. -16.3
1974 to 1975 16,361 3,268 808 107 4.9 3.3
....,
. 0
Bossier and Caddo Parishes
196 to 1,969 ', 21,38 1,205 *-1,084 1,008 -5.1. 83.7
1969 to 1970 '20,304 2,213 -1,879 1,822 -9.3 82.3
1970 to 1971 18,425 4,035 - 749 - 71 -4.1 - 1.8
1971 to 1972 17,676 3-,964 251 - 378 1.4 - 9.5
1972 to 1973 17,927 3,586 - 341 124 -1.9 1.5
1973 to 1974 '17,586 3,710 - 309 - 411 -1.8 -11.1
1974 to 1975 11,2'77 3,299 - 568 - 427 -3.3 -12.9
-!Enrollment figures for all years are for those cohorts present in,lst through 5th
grade in Fall, 1968 (identified in Table'l and 2 as the 1964 `through 1968
cohorts) ..
Source: Annual Reports of the State Depar,tment of Education of Louisiana.
.,..Z,Xf"r**1
1 aa
17
desegregation in Bossier/Caddo 196,9 to 1970. PubliC enrollment for our
cohorts declined by 1,879 and private enrollment increased by 1,822.
The prima facie case for a significant white flight to private schools
couldn't be stronger. But there is more than just this one piece of
evidence, and the other pieces do not fit so, easily into a ;fflite,:flight
interpretation. The year prior to desegregation in tossier/Caddo also
reveals a matched transfer from public to private schooling, of a large
magnitude. The second year after desegregation there is an increase in
public enrollment and a somewhat greater decrease in private enrollment.
Is this evidende of a return to the public system once desegregation is
implemented successfully? No other year showssuch a pattern, and the
last two annual observations reveal declining enrollments in both public
and private schools:
The data in Table3 for East Baton Rouge contain evidence of a public-
\s,to-private transfer upon implemental on of desegregation and a subsequent
return movement, but agaill there is much other evidence not so readily
interpreted. The public school loss with desegregation*is twice the size
of the private school gain. The subsequent pattern of return from private
a
to public schooling shows up in-the first .a third years after desegregation,
but not in the second year."
In East Baton Rouge Pariih,.20% of white pupils in these cohorts
attended private schools in Fall, 1968. This increased to 22% with de-.
segregation, but had dropped back to 17% by 1974 (adrop that may reflect
a general tendency to utilize private schooling more during the early
grades when children are younger and costs are lower). Ih Bossier /Caddo'
Pgiishes, only 5% of white pupils ih these cohorts attended private schools

di 18
in Fall, 1968, and this increased in two years to 18%. By 1974 this had,
dropped only to 167.. ..
Enrollment data collected by governmental agencies canndt be expected
to prpvide complete information on where parents flee to when desegregation
9ccurs. Longitudinal data for indiviilual pupils seeiiiinprineiple, to
be needed. Such data are diffiCult and expensive to collect, and the only.
c--
extant body of repeated interviews of in -a district undergoing
desegregation is the Boston study.9
fitlas, even As massive body of data
has proven intractable,to simple analysis of white flight, and no unambiguous
findings have yet been reported.
Identifiability of Desegregation. Effects<,
During the Darla iesegregation remedy hearings, a sociologist testified r
about the ambiguities in the evidence for desegregation-induced white flight.
During the morning recess he was corralled by two persons whO pres4ted them-(
selves as living prool that white flight exists:; In a search for other
living proof, we present in Tables 4 and 5 sample 'survey data on the "main
reason" given by white heads of households with school-age chilolren for
moving from the central city to elsewhere in the metropolitan area. These
data are from the Annual Housing Survey, a recently inaugurated ihnoVative
AF-
program sponsored by the Department of Housing and Urban Develop ent and
condutted by the Bureau of the Census. Each year a subset of the nation's 4
largest metropolitan areas is oversampled so that data for those individual
areas can be reported in addition to national estimates.a
Result; for the metropolitan areas included in the 1975 and 1976
surveys are presented in Tahles 4 and 5. ;i1 each year, the interviewer

-k-
19
was in tructed to write all reasons mentioned and to-mark the main reason.
Reason- were subsequeWy coded into a specific set of about 30 categories,
which we have collapsed into the groupings shown in the colutn headings.
There was one change in coding °particular interest,to,us. In 1975,
-
"neigtiorhood" was a single category., whi in 97 it was subdivided
)into "neighborhood overcrowded," "change in racial or ethnic composition
,of neighborhood," and "want71 better neishborhoo41,,> In both years,
"schools" Gras a single coding category.
I,H using considerationsneeded larger houge'or,apartment, wanted to
own orre wanted better house, wanted residence with,more conveniences,
etc.--dominate as.the main reason for a suburban move. .Family reasons--
hatfte in marital status,, change in size of amily, wanted own, household,
moved to closer to relatives--were cited frequently in many metropolitan.
areas. Employment reasons include job transfer or change and commuting
reasons. The "ether" category in the tables includes displacement by
urban renewal, highway construction, fire, or disaster, along with,a few
miscellaneous categories,
The reasons 1 principal interest in the study of white flight from
desegregation are "schools" and "neighborhood." The percentage of families
indicat g as the miln reason for movin&to the suburbs is small,
)
ranging from zero for 12 of the 27 places to above 10% for only pwo. Both
Fort Worth and San Francisco have school 'deseiiation programs, with a
major implementation occurring one year _and four ydars prior to the housing
survey, ref ectively. Even in Boston with its history of bitter and
stained public controversy over desegregation, schools are cited as
the main reason for moving by only 6% of white families who moved to
the suburbs.

Table 4
Percentage Giving Each Main Reason for Moving from the Central City.:to the_Suburbs,_
White Households with School Age Children,
Selected Metropolitan Areas: 1974 to 1975
Metropolitan Area Employment Family Housing
Minneapolis-St. Paul 8.7 9.1
Newark 0.0 13.6 43;2
Phoenix, 28.6 0.0 29.1
Pittsburgh 13.4 13.1 33.3
Boston 0.0 17.3, 41.4
Detroit 22.7 8.7 36:4
Anaheim 8.2 8.1 39.9
Albany 0.0 4.9 50.0
_Dallas 24p 11.2 32.2
Fort Worth 14.9 6.5 32.3
Los 'Angeles . 13.7 .34.0
Washington 13.1 25.6 49.6
O
Note: Each row sums to 100 percent.,
Neighborhood
0.0
26.8
14%5
6.4
23.2
23.3
15.9,
24.4
0.0
Schools Other
0.0 45.7
0.0 16.4
0.0 27.8
7.2 26.6
5.7 12.4
4.3 4.6
7.8 20.1
4.9 15.8
3.7 28.8
15.3 12.2
6.3 26.6
0.0 11.7
r
Source: U.S. Bureau of the Census, Annual Housing Survey for Metropolitan Areas, 1974/75.
2
. Table 5 ,
.
.
.
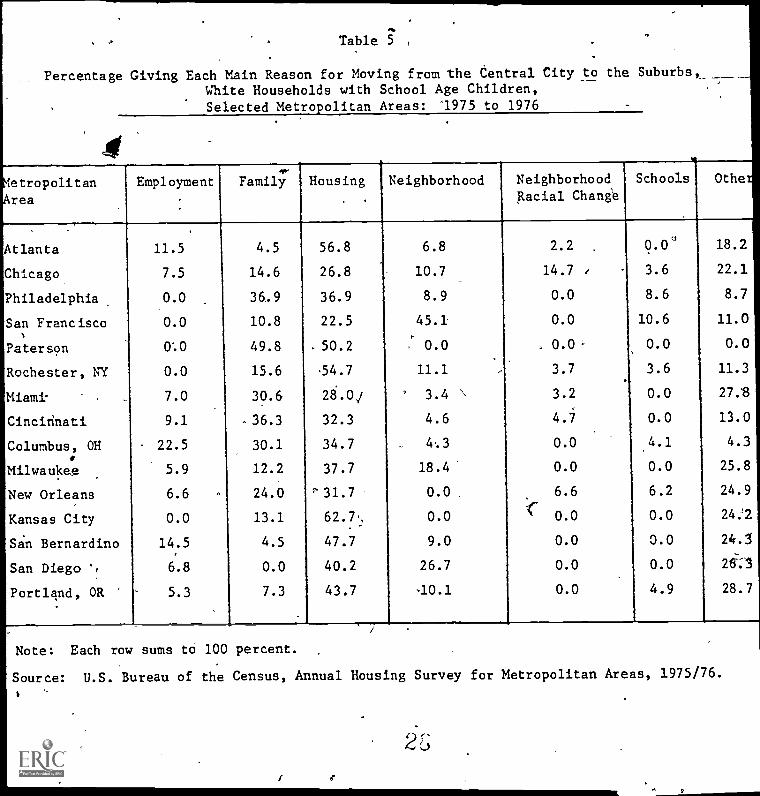
Percentage Giving Each Main Reason for Moving from the Central City to the Suburbs,______
White Households with School Age Children,Selected Metropolitan Areas: "1975 to 1976 -
.
. .
Metropolitan Employment Family Housing Neighborhood Neighborhood Schools Othe
Area Racial Change
Atlanta 11.5 4.5 56.8 6.8 2.2 0.0° 18.2
Chicago 7.5 14.6 26.8 10.7 14.7 / 3.6 22.1
Philadelphia 0.0 36.9 36.9 8.9 0.0 8.6 8.7
San Francisco1
0.0 10.8 22.5 45.1,
0.0 10.6 11.0
Paterson OA 49.8 .50.2 0.0 . 0.0- 0.0 0.0
Rochester, NY 0.0 15.6 54.7 11.1 r 3.7 3.6 11.3
Miami- _ 7.0 30.6 28.0/ ' 3.4 \ 3.2 0.0 27.S
Cincinnati 9.1 .36.3 32.3 4.6 4.7 0.0 13.0
Columbus, OH.-
22.5 30.1 34.7 4.3 0.0 4.1 4.3
Milwaukee 5.9 12.2 37.7 18.4 0.0 0.0 25.8
New Orleans 6.6 - 24.0 '31.7 0.0 6.6 6.2 24.9
Kansas City 0.0 13.1 62.7. 0.0 f 0.0 0.0 24:2
San Bernardino 14.5 4.5 47.7 9.0 0.0 0.0 24.3
San Diego ', 6.8 0.0 40.2 26.7 0.0 0.0 26:3
Portland, OR 5.3 7.3 43.7 -10.1 0.0 4.9 28.7
Note: Each row sums to 100 percent.
Source: U.S. Bureau of the Census, Annual Housing Survey for Metropolitan Areas, 1975/76.
L
221,
Perhaps white parents are reluctant to cite schools because that
might tend to identify them as prejudiced. Judging, from the public con-,
troversy in many cities, and from the national turmoil over busing, we
would expect "schools" to be regarded by most whites as a legitimate-
and respectable answer. In the 1976 surrey, neighborhood racial change
was singled out as a separate category; it was cited by 15% of Chicago
area movers (Chicago did not'yet have a desegregation plan) and a much
lower percentage of families in 'five other places. Wanting a "better
neighborhood" may entail racial considerations, even if unspoken.
Neighborhood reasons are relatively common for some metropolitan areas
and infrequent for others. Unfortunately for simple Anterpretation, the
search for better neighborhoods has been a motivating force for subur-
banization for many decides, and hence cannot be regarded with any con-
fidence as an indicator of racial coUcerns.4,To the extent that racial
concerns are subsumed in broader reasons such as wanting a better neighbor-
hood or better house, the racial considerations may reflect4white flight
from black neighbors--a process that has also been an active suburganizing
force for many decades--rather than a direct or immediate concern with
school desegregation. Indeed, the opinion that suburban schools are
better than city schools predates the controyersy over desegregation.
Surveys designed more specifically to tap sentiments toward school
desegregation _could provide better information for our purposes than is
available from the Annual Housing Survey. Even if such data were avUil-:
able, the analyst would be faced with a difficult task of inferring
motivation. There are many reasons for moving to the suburbs and each
family may have a mixture of motives. In this sense the behavior of most
23

.41
t, 23
families is "overdetermined." If a concern with desegregation is iden-
tified as one reason among a larger set of reasons, how is it possible
to specify whether it is one more straw on the pile or the straw that
broke the back of residential inertia? Self perceptions of motivation
and public opinion polling on reactions to school desegregation are
informative, but they do not provide a simple solution to the task of
identifying desegregation effects.
Any .specific effects of desegregation actions taken by a school
district on migration patterns within,.to, or from that district, occur
in a context of many other political, social, economic, and psychological
forces. 'National concern over white suburbanization and black ghetto-,
ization predates the recent decade of controversy over urban school de-
segregation,.ana_the scholarly literature on the causes of these resi-
dential transformations is enormously rich and complex. Trends in public
and private school enrollment have also been analyzed, incorporating
such causes as trends in the birth rate, city-,suburb and white-black
differentials in fertility, the changing role of parochial education
and of Catholicism in American life, the declining availabili-O.of nuns
as teachers, educational finance,'increasing educational attainment of
parents, changing parental perspectives on the donstituents of quality
educatibn,,and many more.
To identify a specific impact of desegregation actions on public
,and private school enrollment and on the residential distribution of
racial groups, we must be able to demonstrate either (1) that the changes
in these variables could not have occurred as they did in the absence of
desegregation actions, or (2) that some temporal or spatial variation in
30A
7
24
these processes can be attributed statistically to variations in deseg-
regation actions. The first alternative can be dismissed,. for racial
enrollment and residential patterns clearly can and do change enormously
in the-absence of desegregation actions. Thus the task of identifying
the impacts of desegregation actions requires sophisticated multivariate
analysis.
If the effects of a desemegation action are direct/and large, it
should be feasible to disentangle their influence from the milieu of other
forces. David Armor's recent work pu'rports to demonstrate such a con-/
.sistent pattern of massive white flight (when there is extensive mandatory
''bUsing in large districts with substantial minority populations and
developed Suburbs, to accommodate residential MOO that no entanglement.
of other forces could possibly account for the results.10
Gary Orfi
conclusion is similar to ours, that "to firmly establish any argument
about white flight one would need some kind of general theory of urban
racial change...."11
Most studies of white flight, even when they have incorporated some
kind of multivariate model, have been ineffective -in controlling for the
full range of known factors that'should form part of a general theory of
urban racial change.12
Consider, the two most noteworthy published studies.
Coleman, Kelly, and Moore estimated equations in which changes in white
public school enrollment were evaluated as a function of change in school
segregation, number of pupils in the district, proportion black, segregation .
between districts in the metropolitan area, region, and certain interaction
terms.13 Farley added variables refleTting the metropolitan residential
structure (city /suburb housing ratio, percentage of homes built before 1940,
ti

I.
25
,population density) and economic structure (white unemployment rate/.
14
Neitr study included measures of the administrative,structure of school
districts, tie fiscal situation of municipalities and'school districts,
social and physical characteristics such as crime rtes, fire and bond
ratings, history of racial disturbances, and other such components of
'a general theory of urban racial change. In both studies the variable
to be explained was aggregate. net change in white public school enroll
ment, and desegregation action was characterized by a single measure
(decline in the value of a segregation index). Orfield's mandate has,
not yet been fulfilled.
A Policy Research Agenda
Much social science research on contemporary society can be regarded
to some degree as policy analysis. Narrowly focussed evalUgtion research
obviously seeks to influence policy choice, but even general social re
search is often carried out in the hope that better understanding of
social change will enhance the design and implementation of. social policy:
In the case of school desegregation and white flight, neither is prime
cause or consequence of the other. There are many reasons for undertaking
school desegregation, and white flight is but one of many outcomes in
need. ofassessment. There are many facets to white flight, and each has
a number of Causes. any of these are the direct or indirect consequence
of governmental policies of diverse sorts beyond the explicitly educational.
As students of urban racial patterns in migration, housing consumption,
residential location, and schooling, we can design an array of further
studies of the demographic impacts of school desegregatibn. Some of

26
these would be considered policy analysis only to the extent that they
help set a realistic social context for the policy discussion, whereas
others respond more directly to questions that legislators, judges,
school board members, and citizens think need answering. We shall de-.
scri6e a few prospective studies to illustrate the range of types of
policy relevance.
What is the response of white families to the presence of minority
puptls, in communities that have not implemented desegregation prOgrams?
The literature on residential succession abounds with instances of rieighbor-
hood racial turnover.15
How are residential change and school change linked
in this process? Can annual racial enrollment data provide a richer data
resource for neighborhood turnover studies than is available from decennial
census data? Is there .nything distinctive about the presumed white flight
from desegregation that is not already embraced in the whitd avoidance of
"changing" neighborhoods and schools? .Why should a concern with white 4.,
flight lead to a policy focus on school 'desegrega on rather than on racial
functioning of she metropolitan housing market, economic shifts between
cities and suburbs, and the like?
Somewhat less far-reaching would be studieg differentiating the private
school and migi-ation components of white flight. Moving one's children to
private schools is much less permanent than moving one's family to the
suburbs, and does not entail the same range of fiscal and residential
impacts on the city. Further knowledge is needed of the circumstances
under which existing or new private school systems serve as havens, and
411.the circumstances that are conducive to a return to public schooling.
3 3

27
ILK f/The white population les been treated throughout our discussion as
an undifferentiated ggregate. The socioeconomic differentiation within
the white population is of great concern in the assessment of policy.
implications. Socioeconomic selectivity in private schOoldOr
enrollment
and residential relocation is to be expected, yet has been ignored in
most studies.16
The socioeconomic selectivity of the. response bears on
the degree of conflict between seemingl}i independent federal policies.
Urban development policy is concerned with attracting and retaining
middle c persons as central city residents, with the avowed aim to
NA
alleviate the fiscal crisis of the cities and to reduce the city/suburb,
racial separation. To what extent is the federal effort to improve the
education of city residents through desegregation working at crosspurposes
with other urban policy goals? Within the domain of education, what are
the potential conflicts in methods and aims between (1) desegregation
actions that seek to disperse pupils according to race, (2) educational
assistance prdgrams aimed.at schools with concentrations of disadvantaged
children, and (3) programs designed to meet the special needs of non
Englishspeaking children and others of minority ethnic identification?
The attempt to use studies of white flight as a specifi basis for
lirichanging.,public policy on school desegregation reached a pea 1975
with extensive pre-is coverage given to statements by James S. Coleman.
There has been dbntroversy over the methodology of t e study conducted
by Coleman and his colleagues, but let us ignore sfi rtcomings of the
research and consider two of his summary conclusions:17
1$
The effect of desegregation.on white loss has been widelydifferent among different cities where desegregation hastaken place.
(11

.;=
28
Because, insofar aswe can estimate, the loss, of whitesupon desegregation is a one-time loss, the long-term
impact of desegregation is considerably less than that
. of other continuing factors. The continuing white lossesproduce an extensive erosion- of the,, -in+errocial contact
,
that desegregation of city schools bri gs about..
The second of rhese conclusions might have been used as the rationale:4
for the undertaking f broader-based research of the type we have presented
and proposed. The r5;ortaof this conclusion was largely overlooked in-cs K
the effort to reach immediate specific policy conclusions regarding school'
desegregation.
The firs of these conclusions is even-more intriguing, for it has
als een largely overlooked but pertains directly to the information
needed fo ppropriate policy modification. The most immediately per-
tinent policy esearch on demographic impacts of school desegregation,
actions woul be identification of the sources of differentials in the
impacts. Of particular interest is whether the character of the deseg-
regating agent'(court, HEW, state, school district) or of the desegre-
gation action affects the demographic impact. Katzman's review of a
few case studies suggests that these policy choices do not affect the
outcome,18 but Armor's previously cited report sursts that the agent
and the action are of fundamental import'.19
If it could be demonstrated
that some controllable features of the desegregation process had a
significant effect pn the demographic impact--for example, the number
of schools affected, the speed of implementation, the specific techniques
used, the character dif community edutation about the plan, reliance on
court order or other federal pressure--then educational administrators
could better plan to desegregate and avoid or 'minimize white flight.'41

29
` Press coverage of Coleman's research and even subsequent scholarly
research focussed on the findings of an average effect of school desegre-
gation on white enroi.ment. No judge, superintendent, or school board
really cares-much about average effects. They seek to discern what
choices within their power can make the outcome of their actions'more
favorable. If social research is to aid in resolving America's continu-
ing racial dilemma, its protagonists should seek to 1.ncrease the stock
of Wormation about the effects of alternative policy choices. Other-
wise the battles of the sociologists will continue to be dismissed in
favor of personal intuition.
;1$
3G
4
O
e*
7
4
30
NOTES
1One of us (K.T.) testified as an expert witness for the plaintiffs.
1
\ 2Taeby v. Estes, 416 F. Sup 644, 1976.
\3See, for example, Charles T. Clotfelter, "School Desegregation,si
'Tipping,' and Private School Enrollment," The Journal of Human Resources.
11 (December, 1975), pp. 28-50.
James S. Coleman, Sara D. Kelly, John A. Moore, Trends in School Segre-
kation,,1968-73, (Washington, DC: Urban Institute Paper 722-03-01, 1975).
Michael W. Giles, Everett F. Cataldo, Douglas S. Gatlin, "White Flight
and PerCent Black: The Tipping Pbint Re-examined." .Social Science
Quarterly, 56 (June 1975), pp. 85-92.
Reynolds Farley, "Can Governmental Policies,Integrate Public Schools?"
Paper presented at the Annual Meeting of the American Sociological
Association (New York City: September 1, 1976).
Thomas F. Pettigrew and Robert L. Green, "School Desegregation in Large
Cities:-A Critique of the Coleman 'White Flight' Thesis," Harvard
Educational Review, 46 (February, 1976), pp. 1753.
David J. Armor: "Declaration of David J.Armor," Carlin et al. vs. San
Diego Board of Education (San Diego,,19771t
Martin T. Katzman, The Quality of Municipal Services, Central City DeCiline,
and Middle Class Flight (Boston: Department of City and Regional Planning,
Harvard University, 1977).
4Brown v. Board of Education, 349 U.S.'294.
5Coleman, Kelly, and Moore, 22. cit.
3--1

(
-1(
31
Christine Rossell. "School Desegregation and White Flight," Political,
Science Quarterly, 96 (Winter, 1975/76), pp. 675-695..
Armor, 22. cit.
6Donald N. Mclsaac, Dennis W. Spuck, and Lyle Hunter, "Enrollment,
PTojections: ENROLV2," Department of Educational Administration, University
of Wisconsin, September 1972.
7Cited in Mclsaac, Spuck, and Hunter, 22. .cit.
8Armor, 22. cit.
9J. Michael Ross, "Ch nges in Public Preference for Alternative School
T:Desegregation Policies: eoretttal Formulations." Paper presented at the
--Arryual Meeting of the American Sociological Association, 1976.
See also D. Garth Taylcr and Arthur L. Stinchcombe, The Boston School Deseg-
regation Controversy, Draft Report (Chicago: National Opinion Research
Center, 1971).
,)
10Armor,22. cit.
(11Gary Orfield, "White Flight Research: Its Importance, Perplexities
and Possible Policy Implications." Symposium on School Desegregation and-
White Flight (Notre Dame, Ind: Center2for Civil Rights1975),
12Katzman, 22. cit.
13Coleman, Kelly, and Moore, 22. cit.
14Farley,'22. cit.
7-J
15Howard Aldrich, "Ecological Succession in Ratially,Changing Neighbor-
hoods,. A, Review of the Literafure." Urban Affairs Quarterly, 10 (March, 1975),
pp. 327-348.
3r)
4
9
32
16A study reported by Giles, Gatlin, and Cataldo does deal with the
class issue as it relates to forms of protest against schoo
Michael W. Giles, Douglas S. Gatlin, and Everett F.'Cataldo
Class Prejudice: Their Relative Effects on Protest against
regation." American Sociological Review, 41 (April, 1976),
17Coleboan, Kelly, and Moore, 22.. cit., p.,79.
18Katzman, 22. cit., chapter 3, p. 28.
19 /
Armor, 22., cit.
F
1 desegregation.
: "Racial and
School Deseg-
pp. 280-288.
A