taft - west value analysis study€¦ · value engineering recommendations ..... 2 introduction ......
TRANSCRIPT

UPN 9487000 Taft West
Cost Risk Assessment & Value Engineering Study
Final Report
DEPARTMENT OF TRANSPORTATION
Prepared for:
Montana Department of Transportation
Lead Authors:
Ken Smith, PE, CVS® Rachel Boylan, EIT
Prepared By:
HDR Engineering, Inc.
Date:
February 2019

Disclaimer:
The information contained in this report is the professional opinions of the team members during the Cost Risk Assessment and Value Engineering (CRAVE) Study. These opinions were based on the information provided to the team at the time of the study. As the project continues to develop, new information will become available, and this information will need to be evaluated on how it may affect the recommendations and findings in this report. All costs displayed in the report are based on best ava'ilable information at the time of the study and are in Current Year (CY) 2019 dollars unless otherwise noted.
This report was prepared by:
HOR Engineering, Inc. 970 South 29th Street West
Billings, MT 59102-7431

Table of Contents
CRAVE Summary ..................................................................................................................... 1
Introduction ............................................................................................................................. 1
Project Overview ................................................................................................................... 1
Value Engineering Recommendations .................................................................................... 2
Introduction .............................................................................................................................. 4
Proposed Scope of Work ......................................................................................................... 4
Needs and Objectives .............................................................................................................. 4
Project Location and Limits .................................................................................................... 4
Scope of the CRAVE Study .................................................................................................... 5
CRAVE Approach ................................................................................................................... 6
CRAVE Study Timing ............................................................................................................. 6
CRAVE Team Members ......................................................................................................... 7
Information Phase .................................................................................................................... 8
Information Provided to the CRAVE Team ............................................................................. 8
Constraints and Controlling Decisions ................................................................................... 8
Investigation Observations................................... . .......................................................... 8
Base Cost Review .. . . . ..... ...... ... . . .. . ..... ...... ..... ... .. . .. . . . .. . ................................... 9
Cost Model............... . .............................................................. 12
Uncertainty ........................................................................................................................... 13
Project Schedule Review ...................................................................................................... 14
Performance Attributes ......................................................................................................... 14
Performance Attribute Matrix ...... . . ............................ 15
FAST Diagram .................................. . ·····················17
Baseline Risk Assessment ..................................................................................................... 19
Pre-Response Results ......................... .
Top Risk Factors ................................. .
. .................... 20
······················21
Creative Phase ........................................................................................................................ 23
Function: Support Load ................................................................................ -......................... 23
Function: Maintain Traffic ............................... , ..................................................................... 24
Function: Increase Safety ............. _ ........................................................................................ 24
Function: Span Culverts ....................... ., .............................................................................. 24
Pavement Evaluation .............................................................................................................. 25
Life Cycle Cost Analysis (LCCA) Overview and Terminology ............................................. 41
Taft West CRAVE Report
Table of Contents - i February 2019

Evaluation Phase •..................•••..••....•.....................•...••...•..•...•...............•.....••.•...•.................. 45
Function: Support Load ......................................................................................................... 45
Function: Maintain Traffic ....................................................................................................... 55
Function: Increase Safety ..................................................................................................... 58
Function: Span Culverts ......................................................................................................... 60
Development Phase ..••.......................•....••....•.......................••..••............................••...••......... 63
Design Considerations .......................................................................................................... 63
FHWA Functional Benefit Criteria ......................................................................................... ,66
Value Engineering Recommendation Approval ...................................................................... 66
Recommendations ................................................................................................................. 67
Analysis of Results •....•....••...................•...•••...••..........................•....•••......................••...•••...... 87
Risk Analysis on Response Strategies ................................................................... , .............. 87
Post-Response Results ......................................................................................................... 87
Tracking, Monitoring, and Control .......................................................................................... 89 CRAVE Process Summary .................................................................................................... 92
Appendix .......................••..••....•.................•••...••....••.....................••....•.....•............••...•••...••..... 93
VE Study Recommendation Approval Form ............................................................... , .......... 95
Risk Analysis Sheets ....... .
CRAVE Study Location ................................. . ······························97
···························112 Ground Rules ..................................................................................................................... 112
VE Study Attendees Taft West CRAVE ............................................................................... 119
Value Engineering Report Out ............................................................................................. 121
Value Engineering Process ............................ , .................................................................... 143
Reporting .................................................................................................... , ........................ 144
Taft West CRAVE Report
Table of Contents• ii February 2019

Table of Figures and Tables
Figure 1: Project Overview .......................................................................... ,. ............................ 5 Figure 2: CRAVE Process .......................................................................................................... 6 Figure 3: CRAVE Team ............................................................................................................. 7 Figure 4: Cost Model ....................................................................... ,. ........................................ 12 Figure 5: FAST Diagram ............................................................ ,. ............................................. 18 Figure 6: Overall Construction Cost Risk Analysis Results ....................................................... .20 Figure 7: Top Cost Risks ........................................................................................................... 21 Figure 8: Total Cost Risk Analysis Results - 50% VE Recommendation Implementation ......... 87 Figure 9: Total Cost Risk Analysis Results- 75% VE Recommendation Implementation ......... 88 Figure 10: Total Cost Risk Analysis Results-100% VE Recommendation Implementation ..... 89 Figure 11; Top Cost Risks ......................................................................................................... 90 Figure 12: Top Schedule Risks ................................................................................................. 91
Table 1: Pre-Response Risk Based Estimate (Millions$) ........................................................... 2 Table 2: Post-Response Risk Based Estimate (Millions$) ......................................................... 2 Table 3: Summary of Recommendations ................................................................................... 3 Table 4: Information Provided to CRAVE Team .......... _ ............................................................... 8 Table 5: Total Project Estimate ................................................................................................ 10 Table 6: Cost Summary ............................................................................................................ 12 Table 7: Base Costs and Uncertainty ........................................................................................ 13 Table 8: Baseline Schedule Assumptions ................................................................................. 14 Table 9: Performance Attributes ................................................................................................ 15 Table 1 O: Performance Attrlbutes Criteria Matrix ....................................................................... 16 Table 11: Functions .................................................................................................................. 17 Table 12: Summary of Recommendations ................................................................................ 63 Table 13: Analysis of Results Summary (Millions $) ......... , ........................................................ 89
Taft West CRAVE Report
Table of Contents - iii February 2019

Taft West CRAVE Report
This page is left intentionally blank.
Table of Coolenls - iv February 2019

CRAVE Summary
Introduction This cost risk assessment and value engineering {CRAVE) report summarizes the events of the study conducted for the Montana Department of Transportation (MDT) and facilitated by HOR Engineering, Inc. The subject of the CRAVE Study was the UPN 9487000 Taft West Project.
The study was conducted February 11-15, 2019
with the presentation of findings held February 15, 2019. The primary objectives of the CRAVE Study were to:
■ Verify or improve upon the various concepts for the project
• Evaluate the staging options and
•
•
constructability
Identify high risk areas in delivering the project
Improve the value of the project through
Value Summary
Project Cost: $29.9M
Number of Recommendations: 6
Recommended Cost Savings: $7. 96M
Total Number of Team Members: 11
MDT Employees: 6
Others: 5
Facilitator: Ken Smith, PE, CVS®- HOR
Cost of the Study: $ 25 K (Consultant)
innovative measures aimed at improving the performance while reducing costs of the project
• Perform a cost risk assessment on both the baseline design and the VE recommendations
Project Overview The purpose of this project on 1-90 east of Lookout Pass is to replace the existing pavement and provide a new much more durable concrete highway, The project will evaluate additional improvements to the Lookout Pass Interchange ramp alignments, wildlife crossing facilities, roadside geometry, and other miscellaneous safety improvements. There are several bridges within the project limits. Only minor bridge work such as deck sealing is anticipated. The project
begins on the Montana and Idaho border at reference post (RP) 0.0 and extends 5. 7 miles easterly to the Taft interchange at RP 5.7.
In performing the cost risk analysis, a risk based modeling tool was incorporated to model the cost uncertainty and the identified project risks. Table 1 shows the project base costs in 2019 dollars. The pre-response modeled results at the 70 percentile are $38.0 million prior to
implementation of risk management strategies and value engineering recommendations.
MDT Taft West CRAVE Report
CRAVE Summary -1 February 2019

Table 1: Pre-Response Risk Base_d Estimate {Millions $)
Base Cost Probability of NOT
Project Exceeding 2019 $'s
70%
UPN 9487000 Taft West $29.9 $38.0
The CRAVE team identified 15 independent risks that carry potential cost impacts to the project. ln the workshop, a likely range of cost impacts and the probability of occurrence were identified for each risk. The next step was to develop response strategies and value engineering recommendations for the active risks. These were added into the risk based modeling tool as post-response results to measure the overall impact the risk mitigation strategies have on the project. An additional risk opportunity was incorporated into the model to capture the magnitude of the VE recommendations developed by the team.
After mitigating the identified risks and incorporating VE recommendations with a 50% probability of implementation, the modeled 70% confidence level (probability of NOT exceeding) for the total project was $35. 7 million, a net reduction in projected costs of $2.3 million. Additional scenarios were also modeled to provide decision support at a 75% VE recommendation and 100% VE recommendation implementation probability, or $32.0 million and $29.9 million respectively. Please refer to Table 2 below for additional information. Additional detail is provided in the Analysis of Results section of this report.
. •. . •.
Ta~le,2: Post-Response Risk'Base;d·Estimate·(Millions.$) •
Base Cost Probability of NOT
Post-response Scenarios Exceeding 2019 $'s
70%
50% VE Rec. Implementation $35.7
75% VE Rec. Implementation $29.9 $32.0
1 OD% VE Rec. Implementation $29.9
These tables illustrate the power of proactive management and implementation of the value engineering recommendations in response to the identified risks. In summary, implementing the value engineering recommendations can offer an additional expected value cost reduction beyond the cost of the items themselves.
Value Engineering Recommendations In total, the CRAVE Team generated 43 ideas for the project. These ideas were compared against the baseline concept developed by the project team. The ideas that performed the best were further developed by the CRAVE Team and resulted in six VE Recommendations being brought forward.
MOT Taft West CRAVE Report
CRAVE Summary· 2 February 2019

The recommendations developed by the CRAVE Team are shown in Table 3 and are detailed in
the Development Phase section of this report .
. Tabte·3: Summary of Recommendations
# Description Cost Delta
1 Pavement Sectlon $7.01 M
2 Performance Engineered Mix Design N/Q
3 Stringless Paving N/Q
4 Binder $0.32 M
5 Dowels $0.33 M
6 Maintenance of Traffic $0.30 M
The actual savings will depend on the recommendations accepted and their relationship to the other recommendations.
To facilitate implementation, a Value Engineering Recommendation Approval Form is included
within the Appendix. If the Project Manager elects to reject or modify a recommendation, please include a brief explanation of why on that form.
The CRAVE Team wishes to express its appreciation to the project design team and management
for the excellent support they provided during the study. These recommendations and other
design considerations provided will assist in the management decisions necessary to move the project forward.
Ken L. Smith, PE, CVS®
CRAVE T earn Leader
MDT Taft West CRAVE Report
CRAVE Summary - 3 February 2019

MUN(" rY.P~ITTMU.T or ii1JJ;SPOR7ATlV/i
Introduction This report summarizes the events of the CRAVE Study' conducted for the Montana Department of Transportation (MDT), facilitated by HOR, Inc. The subject of the study was the Taft West Project UPN 9487000.
Proposed Scope of Work The proposed p'roject will reconstruct the Interstate to current MDT design standards and replace the existing plant mix bituminous surface with PCCP. The project will also include drainage, environmental, traffic and safety improvements. The project will look into whether realigning the Lookout Pass Interchange ramps is feasible and will also look at the possibility of installing new wildlife crossings.
The project was originally nominated as a mill/fill pavement preservation, however the District decided to increase the scope of this project to a reconstruction after observing rapid pavement joint deterioration and the short life cycle of chip seals. This scope change was approved by the Transportation Commission in April 2018.
This project will be designed in enhanced workspace as agreed during the review.
Needs and Objectives The purpose of this project is to remove the existing plant mix bituminous surface that is deteriorating due to the harsh weather environment in this area. The plant mix will be replaced with a more durable surface. Additional improvements to interchange layout, drainage, and wildlife crossing opportunities will be evaluated.
Project Location and Limits • Route: 1-90, Principal Arterial - Interstate • County: Mineral County • Begin Project: Reference Post (RP) 0.0, at the Idaho-Montana border
English as-built station 1 +09.45 • End Project: RP 5.7, ·east end of the Taft Interchange bridge
English as-built station 302+63.00 • Project Length: 5.7 miles • Location: Township 20 N, Range 32 W, Section 32
Township 19 N, Range 32 W, Sections 2, 3, 4, 5, 11 & 12
See the location map (Figure 1) below.
MDT Taft West CRAVE Report
ln1roduction - 4 February 2019

. . , .. !!; ---.. ~ ... ~" ii - .:1'
;~ -.1i -~ :;.:;
', -.ti' 4\ """,.
oot"c, '- V;,-f 1 I
MINERAL COUNTY
lHIS CONlR;,,CT RP O.o TO 5.7
Figure 1: Project Overview
Scope of the CRAVE Study
The scope of the CRAVE Study was to verify or improve upon the concepts being proposed for the Taft West project. To accomplish this, the CRAVE Team applied the principles and practices of the VE Job Plan (see Appendix) and:
■ conducted a thorough review and analysis of the key project issues using a mu!tidiscipline, cross~functional team (i.e. review the baseline design)
• verified or improved upon the various concepts for the Taft West project ■ identified high risk areas in delivering this project • evaluated the staging options and constructability
■ improved the value of the project through innovative measures aimed at improving the performance while reducing costs of the project
• performed a cost risk assessment on both the baseline design and the VErecommended design
MDT Taft 'Nest CRAVE Report
Introduction - 5 February 2019

CRAVE Approach CRAVE is an advanced project management process that has combined the proven tools and process from cost risk assessment and value engineering process into a single process. The
process uses various tools to solicit inputs from the project team and key stakeholders, quantify risks, and track the risks together with the corresponding mitigation strategies. In particular, and as Figure 2 shows, CRAVE consists of four main steps as follows:
Step 1: Baseline Risk Assessment
a) Review baseline cost
b) Review baseline schedule
c) Identify risks related to baseline project
d) Assess and quantify risks in terms of project's cost and schedule
Step 2: Value Engineering and Risk Response Development
a) Develop value engineering recommendations that further mitigate or avoid high risk elements
b) Develop recommendations that add value by modifying project scope and/or schedule
Step 3: Risk Analysis on Response Strategies
a) Identify risks related to response strategies
b) Assess and quantify threats and opportunities in terms of project's cost and schedule
Step 4: Tracking, Monitoring, and Control
a) Identify risk owners, monitoring frequency
b) Continliously update risk management plan
c) Document and report progress
d) At key milestones, update cost and schedule
CRAVE Study Timing
{',]"
e :.:-.,,-..... ,
~~~ •k,1
Figure 2: CRAVE Process
The study was conducted February 11-15, 2019 with the presentation of findings held February 15, 2019.
MDT Taft West CRAVE Report
Introduction - 6 February 2019

CRAVE Team Members The list of team members for the CRAVE Study is provided below. Other attendees are identified on a sign-in sheet which is provided in the Appendix of this report. The team members included:
• Jody Bachini - Maintenance
• Matt Bean- Federal Highway Administration Construction • Rachel Boylan -Facilitator Assistant • Paul Bushnell - Materials
• Matt Collingwood - Construction Bureau
• Robert Conway- Federal Highway Administration Pavement/Materials ■ T.J. Ramaeker-Construction Bureau • Darin Reynolds - Value Analysis Engineer ■ Ken Smith - Facilitator
■ Matt Strizich - Federal Highway Administration Pavements/Materials ■ Miles Yerger- Pavement Design Engineer
MDT Taft \Nest CRAVE Report
Figure 3: CRAVE Team
Introduction - 7 February 2019

1iDrk DE?.AJm.lWT Of r'1_<//S?OiTTATi.J/I
Information Phase
Information Provided to the CRAVE Team The following project documents were provided to the Team for their use during the study:
Table.4:Jiiformat_ion Provided to CRAVE Team
Document Date LHSR Preliminary Drainage Report (Draft) 2/11/2019 MDT Project Cost Estimate 2/12/2019 Preliminary Alignment and Grade Review Plans 2/12/2019 Lookout Pass - East As-Builts 5/1974 Taft West Crack & Seat, P.M.S. Overlay 9/8/2010 Project Risk Documentation 10/4/2018 PFR Report 7/30/2018
Constraints and Controlling Decisions As part of the project briefing, the CRAVE Team was given the following project constraints and controlling factors for considering possible alternatives:
• Improve safety wherever possible; for example, interchange ramps at Exit 0
• Maintain one lane of traffic in each direction throughout the duration of the construction project
• No rehabilitation work of rest areasm ramps, only new tie-ins to new mainline
• Minimal geotechnical information for below pavement
• 4 lanes of traffic (with finished surface) must be maintained/restored during winter between two construction seasons
• Taller barrier on median, taper down to smaller to fit attenuators
• Provide long term solution instead of short-term
Investigation Observations The first day of the study included a presentation from the project team. The following
summarizes key project issues, project drivers and observations identified during this session:
• The horizontal curvature of the interchange ramps at Exit 0 may need some improvement
• Significant drainage rehabilitation/improvements will be needed throughout the project
• Currently filling cracks for maintenance
• The pavement in this segment is deteriorating quickly. It is uncertain what maintenance costs will be incurred prior to construction (2023).
MDT Taft West CRAVE Report
lnforrnalion Phase• 8 February 2019

Base Cost Review One of the objectives of a cost risk assessment is to review the base cost estimate in a collaborative setting with independent expert opinion and project team members. The base cost estimate represents the project cost that can reasonably be expected if the project materializes as planned, and there Is no occurrence of significant risk.
The base cost estimate is unbiased and neutral - it is neither optimistic nor conservative. The base cost includes the known and quantified items and the known but not yet quantified items or miscellaneous item allowances. The base cost estimate does not include any risks (either threats or opportunities), unknown/unknowns, or contingencies.
The team was provided a preliminary estimate dated February 12, 2019 shown in Table 5 below. The prelimin~ry cost estimate includes 15% contingency, 8% construction engineering (CE), and 10.49% indirect costs (!DC).
MDT Taft Wes! CRAVE Report
Information Phase, - 9 February 2019

Murk otAAl!ll'£NTOF'T~~S"Oir!Wl!N
Table 5: Total Project Estimate
MD1* Montana Department of Transportation Con:,ct /"/or,r,;;,licn CS$ HRlj>O(l;t
AASHTOWare Project Estimation P1~'1i! 1-~n-40H~J8 DEPARmENT Of TRANSPORTATION
R~p:,r! N~me. Ocle: ()2/11.'1019 Preliminary Estimate . .\ASITTOESTOti1
Projoct ,W'l'l>c;. T;,fl-'/\'oc.: Prop;ut:~ Sy: N;ilh.1r,d W;,~or,:
O;un: /l:.,>-1~·201~
l.lJ>tl N~rnb<>r. ~,1-~rmxi C<>1>n1y: Mimr.l Prt>J~-cj LMgth: 01~1fkt; Ml~se<,110
0~$i!!r'I S\1190: Prnh<r,<i;)f) F,~ld Rivi""' Wo<II TYJ)(I'. RE:CO!ISTRl.'CHQr~. GRNJING
I 1\l501aOJO
rnsaoow; 1092000-)5
2GJ.llZ01{1(1
2!t3C20310
21}30&!100
.W80102(l0
31}1020~0
3l':10:2-!lt.2&
Jn?,llO~OW
4~1()2!)()48
41!\{!2();,,JQ
402il200l5
•1{!20-20315
40202'0:UO
402C2-0~8
J.tl9tlWll20
4!101/ll)JI)
4!Hl711:!.5
!ill1Cl01n,
Ql}3U1QQ:JZ
>3(}.10100,:0
603010'>16
603010006
603010098
604.010221
13::5000050
6¼DOlOOO
IJ~BQl{llf,()
f;Cf.n1l!Jl0
l',Ol;(lll!:,.,;O
ljr;61J1!l:;,JS
6C-60106'<:?:
MDT Taft West CRAVE Report
''"' 2:J5.80';0(l00
""' 277,C'3Hl0'.l
2.co~_aoo SO,OOMOO
111:,,00~.ooo
121,~42,000
253,!\9~000
7~3.~9.0[).J
24,172.(lOO
:i-:2 600
1,419000
12.&18000
1,eoHlC,J
37-000
20,°'11 ()00
317,241 aoo ll ~00
?t:;,~$()00
780Q(X!
1.620000
4,990.000
UOO,ODJ
2,SOO.DCtJ
1&-000
2,73.7 000
7.400'300
l?tl().1
1,00U(l00
111;100
1,Z57COJ
17.~00
CONYRACfOH SVfl,..-,:C'r' ANO LAYOvr
FINISH: GRADE CC<'.TROl
r,,oa~1vmoN
EXCAVATION-UNCLASS1FIED
SPECIAl BORFlOl'i•NEAT LINE
TOPSOIL-3M. VA@NG MD PLACJ'-IG
TEMPORARY E:ROSIO:I CONTROl
CRIJSf<!i:D AGGREGATE COURSE:
.o,Gl1RE'.GA Tl; TREA TiiS:tlT
P,o.w:~H,~rr PU!,\/ERllAno~
~Nl MIX SURF i:lR s.iiz IN
HYORA.TEVUME
ASPHAf_T CEMENi PC 70-.28
EMULSIFIED ASPHAL T·TACK COAT
EMULSIFIED ASPHAL T·fOG SEAL
EMULSll'IEO ASPtlAL T CRS.2P
CO\IER•TYP!;2
COLO M:i.llttG
RUIJBLE SlRlf>S
PORT Cfl,I CONi; l'>"A'JI;' 9 !N
l)AAINAGE Pll'E 1i IN
ORAINA0E PIPE ,a IN
DRAINAGE Plf'E 24 IN
Olv',tNAGE:PIPE. 36 IN
DR.AJNAGE PIPE '18 IN
INLt:T DRDP·1'YPI: 1
RES!.T CONCRETE BJ.J'lRl&R RAIL
Tl.LL COs'!C:RfiTE BARRr£R RAIL
GUr ... 'lDR.e.11.,SrLIBR l.PPR•TY 1
t,1(,S CVAfiDAAII.
MGS 10 M!:lAL GUAAOR-'JL 1RN<&ll"!ON
REl.10'.ti: GUA:lORA:t.
GUARDR;;JL-Of'TIOML Ti:RM SEC'l
LS
c;fU'T
LS
cum
cuw cu,n
lJNIT
cu,o
su,n
savn 1011
'"" "'" G>L
G>L
""' sm'O so,o
MILE
sovn
LNI l
t;,IFt
LN~
l.NFT
LNFT
'"'" EACH
EACH
F;;.t:H
1.NFT
t;.cH
LNFT
EACH
$!;1.1,01;0,IXJWO $00.0:;Q.l'<.I
aonoool tt/,l,,:.',\l$,l;,(I
$22s1.,w,.12000 S2,281,lll';l,12
~8.((1000 S2216.-1fl8.W
525.((1001) SS0.0~0.00
SJ.7!1490 Srn<J,245.00
$1.00000 S, 1 Y.l.000.(-0
520.40732 S2A7D,32G.lli
~0.2MtB S!>il,H:t.45
$1.t,:JOOO $311,(),9l!l'L~O
SJ!;.62746 $1171,815,2{1
snnall-37 S81,2il0 ~,$
S.511'-1.NQ~ $~42.953.05
S-IA4ei32 S56.0~8.20
B.8'192~ f.!i,7B9.J:3
~s,1.:m7a S2t.1<10.'13
f1.2'3017 327,J.29,8.I.
.S.1.14006 $31>1,~54.74
$1,117,l'A:1~1 .si~.~7.2:)
Sf>Q.OOOOC S 1 f,ij99,9!i0.00
s-i:v,w:15s S;!.3.293.20
SJ9.mw;o .S&4,'7i4.69
sn.4J~a SJ00.432,57
S125.52!l79 S\6:l,188.73
S171.45t0~ ~!.7.210_!!'2
Sl,4!n.C(l00Q &55,920.00
S15.00MO S41,0S5.00
Sl,illt:.!l.7000 $d43.~21UO
$1.!157,CW~!ll S~3.ll5.'.l(l
$16 ~HJ/ S;6,6~t.:11
$515,1,llOlB $8.710 13
$26121)5 !-.'3,359.W
52.973.fa3~5r, 550,556.f.,:I
F'il!J" 1 cl '
Information Phase , 10 February 2019

-1.•:turk DEPARTMENT OFTRANSPORTATK.lf.l
Uf'N N1,1mb,.,:
ProJ•<>l lsat19t11:
Montana Department-of Transportation
AASHTOWare Project Estimation
Preliminary Estimate
Pr~p;u~d Ely:
D>-1~:
Col,lr,\y;
om,m:
t-1.~11-,,,r,,,1 w,,tlo,:;
02.1:i,,019
Mlr,;ir~I
MloH>,1la
C<m!.'.let l"form.:olien CS$ J,taip D~••
fll·,~o~· 1-~D-40ij-43:l8
R~p.:,llName: AASHTOE:S.TOM
Dottalgn Stago', W(><k Typo, REC.Ots:STRIJ:::T!Oll, GRADING
~I ooetf111~ □ <l-,:l:IIOIXJ RFMO\lf eom;;fi:fTF, t!ARAIFK !'CAIL EACH $40.00IXIO ~1 r1,4~0 t<i
iji)(ltl-]1,'44 ~(IOQOO COM;;fU:.11: 6.>.RRIEf! AAlL EACH $8~0,r.(]OOI) Sl76.o~o.r.o
610\0J101 iCDOl).J SEEOll~G ARE.O,NO 1 ACRE s.J34,05WI~ HM~600
61010~102 35".{100 StE:DINO AREAN0 2 ACRE $&11,W181 $Z!.'Hi7.62
6!0100103 35,000 SEEDING AREA NO 3 ACHE S26-1.77516 S\1,967.13
610100:!26 100000 FERTILIZING AREA NO l ""' S67.2-'•17fi 95.724.43
81010'.l:127 35..000 rER"!ILIZING AREJ,,NO 2 AC«E Si'5.4SS:i0 U,642.:!-1
61010-'.!555 135 coo CONDITION SEEDBED S!JRF/,CE: ,\CRE S00.65001 :£.9,ln7.75
6!&rlY.ll).15 ;:,~o,co,:-.aoo TRAFFIC CONTROL DEVICES CB UNIT 50.74111!- St4!J,231H-O
clJM'.l,ll055 P.000 TfW'f.lC CONTROL,RM!P CAOSSOVE!< £,CH M,000 00000 !;2.!,0~0.00
G1$n:'l(JlM 4000 TRAFFIC CONTROL-CROSSOVtR l::t..cH $/,$00,0jl;(l:'., $:I0.000.f.<)
(ilJW:,l.)1~0 H ~IX! l'W.Ff'IQ CONlROL-IWO '/\'AY IKAF MIL!:; S'1.:m1.oowo S49.46~M
51S0::-0~10 2'.000 CROSSOVEfl.•/,1!:.0IAN BARRIER F.AIL EACH $1,SCD 00000 $15.0llO.OO
620012950 11.~oo TEMPORARY STRl?lNG MILE: S62"8.97940 ~7.170.l7
·150()00 Prellmi:l,:,;,~, S")i'ifl!) l,fSlali<~I\ '" $54,072.79
HHA¥iii¥F&HMHii
MOT Taft Wes! CRAVE Report
15.0C-%
itO'.l¾
Glls>tO\ t'ltol
No<1GMati:h Tal{.31
SUIJ1ctill
C:lllll<',;l~t>C)'
Con~lnJCUlln Tofal
Con~trus:tion Engir.eering
iQta:t.1
1.-.ditael Cost (IOC), C<in:<trueticn
l c<al C0'1:;lrud>:m •-,/ IDC
1r.<lin,r.l Co:;1 (iDCj • C0n~!ru::11<1n F,r,~IMr.rtng
TQl,11 Consm,,c1/<)f) tngln~"''"9 w/ IOC
T,,1,-1 WIIOC
S2_i!B,4,119.W
$2Ul)i,526. I½
127,'500,648.133
54.153.591.n
$31,!M<l,246.H
52.547,5'.19.f,9
R.OS1,7&5.!!5
S'.U.W,l-!11.42
$;3$.11¾,707 r...-i
S7&7,,-jG'l-!
.12,a1.a:,ni;,&1
!::17,999,4M ~~
Information Phase - 11 FebrUBI)' 2019

Cost Model The CRAVE Team Leader prepared a cost model from the most recent cost estimate provided by the project manager. The cost model is organized to identify major construction elements or trade categories, and the percent of total project cost for the significant cost items. Development of this cost model allows the team to focus on project elements with the highest degree of impact and utilize workshop time most effectively.
Surface and Pave $17,910,049.84 56.2 % 56 % Contingency $4,153,597.32 13.0 % 69%
Barrier & GR $ 3,046,392.49 9.6% 79%
Earthwork $2,585,733.00 8.1 % 87%
Preparation $2,556,314.12 8.0% 95%
Drainage $1,180,820.31 3.7% 99%
Traffic Control $ 273,870.97 0.9% 100 %
Seeding $83,395.31 0.3% 100 %
Signing $54,072.79 0.2% 100 %
Total Construction Cost $ 31,844,246
Taft West
~ S20,000 ~-------·--·------95%,·:::-:::=::\J_:c.9%'°_,.a·~-·~--100%_ 100%-+-_f 100%
~ $18,000 .,_., ____ ,,,_,.,., --- -------~--, .. - - ·-· .... ------~-- ,, ____ --t 90%
: srn.ooo '----79% ________ l 80%
I $14,000 ·------------------····---t 70%
$12,000 ------·--·-··-·-·~-... ----.. --.. ------- __________ ,, __ ,_L 60%
$10,000 1
.J_ 50% I
$8,000 -----i-- ------·--·----- -------------------·----------- --------·-·-·- --~ 40%
$6,000
$4,000
$2 000
$0
MDT Taft Wes! CRAVE Report
' ~---·---·'-----···--·-'
~ ~ • e " e e 0 0
• ~ ' ] • . ' e 0
i " 0 • 0 w ' u ~ •
' .. -----------------+! 30%
' _________ :_ 20%
----------J 10%
• l LJ!il!l!!ll!! _____ _:0%
• • ~ 0 e e 0 • u • 00 □ " E
~
Figure 4: Cost Model
Information Phase - 12 February 2019

Uncertainty Estimating is not an exact science: a cost estimate is an approximation of the costs comprised of many elements that may not be completely defined at the time the estimate is prepared. As a result, there is variability or uncertainty associated with any estimate. When applied to the project estimate, this uncertainty establishes the range that the base cost could fall within. A numerical value of uncertainty is, in essence, an estimate of the error or tolerance within the quantity or unit price of each item within the estimate.
For any given project, the level of uncertainty is directly related to its position in the project life cycle (i.e., the earlier in the project development process, the greater the uncertainty; conversely, the closer to completion, the less uncertainty).
In establishing the uncertainty ranges for each item, corisideration was given to factors that might affect quantities or bid prices, such as project location (rural vs. urban), quantities (large or small), items that are difficult to construct or site constraints, methods of payments, timing of advertisement, specialty work, geotechnical and project delivery methods. The yellow cells in Table 7 below represent the input values provided by the team while the orange cells represent the calculated values based on the inputs.
Previous Pre-Construction Costs to Date ($Ml
Previous Right-of-Way Costs to Date ($M)
Previous Construction Costs to Date ($M)
Design & Permitting Costs ($M)
Right-of-Way Costs ($Ml
Base Construction Costs ($Ml
Construction Engineering(%)
JDC
Total Project Base Cost (Includes Previous Costs to Date)
{$M)
N/A
N/A
N/A
$27.69 M 17% 16%
8% 8% 8%
10% 10% 10%
Uncertainty was established for the base costs using all available information at the time of the workshop. Doing this established an uncertainty in the base construction costs of-17 percent to +16 percent. The team believed that based on the identified quantities and the initial estimate date, costs could be 17 percent lower than shown in the baseline estimate. They may vary as high as 16 percent greater based on similar projects.
MDT Taft West CRAVE Report
lntorrnalion Phase - 13 February 2019

Project Schedule Review The project delivery is Design-Bid-Build. Construction is scheduled to start in May 2023. For the purposes of the study, the CRAVE Team assumed contract duration of 18 months (two seasons) for construction. The yellow shaded cells in Table 8 below represent the input values provided by the team while the orange cells represent the calculated durations and/or start dates based on those inputs.
Tabie.8: ·sasei'ine Sc'hedule As~umptiO,,l's
Design & Permitting Completion Date (date} 4/1/2023
Right-of-Way Start Date {date) 2/12/2019
Right-of-Way Completion Date (date) 4/1/2023
Procurement Start Date (date)
Begin Construction (date)
Construction Duration (months)
Design & Permitting Duration (months)
Right-of-Way Duration (months)
Procurement Duration (months)
Project Completion Date (date)
Performance Attributes Performance attributes are an integral part of the value analysis process. The performance of each project must be properly defined and agreed upon by the Project Team, CRAVE Team and stakeholders at the beginning of the each study. These attributes represent those aspects of a project's scope and schedule that possess a range of potential values.
Performance attributes can generally be divided between project scope components (mainline operations, environmental impacts, maintainability, etc.) and project delivery components. It is important to make a distinction between performance attributes and performance requirements. Performance requirements are mandatory and binary in nature. All performance requirements MUST be met by any VE recommendation being considered,
Performance attributes possess a range of acceptable levels of performance. For example, if the project was the design and construction of a new bridge, a performance requirement might be that the bridge must meet all current seismic design criteria. In contrast, a performance attribute
mfght be project schedule, with a range of acceptable sequence of operations of differing durations.
The CRAVE Team, along with the Project Team, identified and defined the performance attributes for this project and then defined the baseline concept as it pertains to these attributes. The
MDT Taft West CRAVE Report
Information Phase - 14 February 2019

MDD1r ) D<PAFID:[l/10f7'1•-'•SPC!iffAnrm 1-- ~ following performance attributes were used throughout the study to identify, evaluate, and document ideas and recommendations .
. Table 9: Performance.Attributes·
Performance Description Baseline Attribute
An assessment of traffic operations and safety on the main line within the project Two 12' lanes in each direction, 10' limits. outside shoulder. Tall median barrier,
Mainline Operational considerations include level of concrete barrier and guardrail on
Operations service relative to the 20-year traffic outside where applicable. No current projections, as well as geometric improvements planned for ramps or considerations such as design speed, rest areas. Currently three emergency sight distance, and Jane and shoulder vehicle turnaround areas. widths. An assessment of the long-term maintainability of the facilities and equipment. Maintenance considerations include the overall durability, longevity, 10" of concrete wearing surface for
Maintainability and maintainability of structures and lanes and shoulders. Replacement of systems; ease of maintenance; deteriorated barrier rail. accessibility and safety considerations for maintenance personnel, including sediment and debris removal.
An assessment of the temporary impacts Temporary widen in phase/season 1 and shift all traffic to WB lanes, one to the P\lblic during construction related to lane in each direction. Flexible traffic disruptions, detours and delays; delineators divide head to head traffic. Construction impacts to existing utilities; impacts to Phase/season 2 is second season, Impacts businesses and residents relative to shift traffic onto new lanes with flexible
access, vlsual effects, noise, vibration, delineators dividing head to head dust, and construction traffic;
environmental impacts. traffic as well. Ramps or rest areas mav be closed.
An assessment of the permanent impacts to the environment including ecological May be some minor, temporary
Environmental (i.e., flora, fauna, air quality, water quality, impacts with cross stream revisions. Impacts visual, noise); socioeconomic impacts; Work to be completed outside fish
impacts to shore edge; impacts to cultural, windows. recreational and historic resources. An assessment of the total project delivery
Active risk management performed Reduce Risk as measured from the time of the VE Studv to comoletion of construction. through project delivery.
Performance Attribute Matrix
A matrix was used to determine the relative importance of the individual performance attributes
for the Project. The Project and VE Teams evaluated the relative importance of the pe1iormance
attributes that would be used to evaluate the creative ideas.
These attributes were compared in pairs, asking the question: ~which one is more important to
the purpose and need of the project?" The letter code (e.g., ~A") was entered into the matrix for
each pair.
MDT Taft West CRAVE. Report
Information Phase - 15 February 2019

' " ' ' ' " ' ' " ' ' Table 10: Performance Attributes Criteria Matrix .
Paired Comparison
Total % of Total noints
Main Line Operations IA A A A A 5.0 33.5%
Maintainability B B B B 4.0 26.6%
Construction Impacts C C C 3.0 20.0%
Environmental Impacts D E 1.0 6.6%
Reduce Risk E 2.0 13.3%
Total 15.0 100.0%
Without emphasis on preference
A = A is of greater importance
A/8 = A and B are of equal imporlance
OR
With emphasis on preference
A# = A is of greater importance with # preference How Important
emphasis 3 - Major Preference
A/8 = A and B are of equal importance WITH 2 - Medium Preference
A - Minor Preference
After all pairs were discussed, they were tallied (after normalizing the scores by adding a point to each attribute) and the percentages calculated. These scores were then used to calculate the value of each recommendation during the performance evaluation scoring team review for each recommendation.
MDT Taft West CRAVE Report
Information Pliase • 16 Februa_ry 201 g

Function Analysis
Function analysis results in a unique view of the project. It transforms project elements into functions, which moves the CRAVE Team mentally away from the original design and takes it toward a functional concept of the project.
Functions are defined in verb-noun statements to reduce the needs of the project to their most elemental level. Identifying the functions of the major design elements of the project allows a broader consideration of alternative ways to accomplish the functions, The major functions identified by the team were:
Tab1e· 1 t:--:Fun·cti011s .
.
Verb Noun
Support Load
Maintain Traffic
Increase Safety
Span Culverts
FAST Diagram The Function Analysis System Technique or FAST diagram arranges the functions in logical order so that when read from left to right; the functions answer the question "How?" If the diagram is read from right to left, the functions answer the question "Why?" Functions connected with a vertical line are those that happen at the same time as, or are caused by, the function at the top of the column.
The FAST Diagram for this project shows Prolong Service Life as the basic function of this project. Key secondary functions were Span Creek and Support Load. This provided the CRAVE Team with an understanding of the project design rationale and which functions offer the best opportunity for cost or performance improvement.
MDT Taft West CRAVE Report
111/orrnation Phase, "17 February 2019

IDJI
MDT TaftWest CRAVE Report
sow
i >; Sran Lr••h
'
SCOPE Of VAlU~ENGINmUNG ,ruov
Mit!cot. Risk,
Figure 5: FAST Diagram
iAt-1ho..,.mM0'1ol ! _, .. , _Fu.,:li~r, _, _ _i
' 1,-Cau'<d•b; I I Fu,,,,.,,., I '··~··-· ___ ...,
111M
' .i: Aµp)yD,,.-.,1>,o C11\tt•ia
Information Pl1ase - 18 February 2019

Baseline Risk Assessment In evaluating the risk for the project, a cost risk assessmenUvalue engineering or CRAVE process was utilized. The cost risk assessment portion of the evaluation was used to identify the range of unexpected project costs as it relates to total project cost, as well as potential delays in schedule that might arise.
The Team discussed the potential risk events and elements facing the project. During the discuss.ion of the project, the Team identified high risk elements or potential events which may occur that would impact the project. For each signlficant risk event that was identified, the probability of the risk and its impact to cost, schedule, or both was estimated.
The risk assessment process includes identifying high risk areas and risk elements as threats (or opportunities where appropriate) to a project, quantifying the identified risk elements, developing appropriate risk response strategies, and quantifying the effects of the risk response strategies to be employed.
The risk assessment process quantrfied risk events by establishing the expected probability of occurrence and range of impacts through elicitation of information from the CRAVE Team. The
range of impacts defines the representative distribution to be used when modeling the risk. The probability determines the relative frequency (or likelihood) of an event transpiring.
The CRAVE Team identified 15 active risks that pose potential schedule and/or cost threats and opportunities to the Taft West project:
• Access to rest areas • Traffic barrier
• Material availability • Adequate staging areas • Unidentified change orders • Market conditions • Added scope beyond 10% design • Outside shoulders with traffic barrier • Value Engineering Recommendations • ITS
• Opportunity to reuse existing roadway materials • Drainage concerns with existing infrastructure • Minor rehabilitation/maintenance to existing structures • Lack of geotechnical information • Utility conflicts
The Risk Analysts Sheets in the Appendix of this report have additional information on each risk.
MDT Taft West CRAVE Report
Baseline Risk Assessment - 19 February 2019

Pre-Response Results The risk analysis results are given in the form of graphs showing the relationship between cost and the probability of not exceeding that cost. Risk-based analysis provides a distribution of
probabilities that a project will not exceed an estimated dollar figure. Typically, agencies report the project risk-based estimation using the 70 percent confidence interval.
The extreme values, represented by the minimum and maximum on the graph, realistically have little chance to materialize. It is common and more realistic to evaluate the 80 percent confidence interval (the range from the 1 0 percentile to the 90 percentile).
Each graph indicates the best opinion of the cost ranges by the workshop participants at the time of the analysis.
100%
90% I
' 80% I
' " ' -" 70% I ~ ' • ' • u ' ' 60%
' w ~ ' 0
' " 50% ' -C ' > ' ;; 40% ' :a :;;' • ~ ~' C 30% ., " ~h ~ .,,
20% ' ' ' 10% I I
' 0%
$29.4
MDT Taft West CRAVE Report
$31.4 $33,4
Construction Cost Pre-Response
$37.4 $39.4
Cost {SM}
$41.4
-Construction Cost Pre-Response (Current Year $'s)
- - -· Base Construction Cost (Current Year S's)
5.0%
4.5%
4.0%
3,5% f:l C
~ 3.0% :::i
8 0
2.5% 1i ~
2.0% ~ • ~ e 1.5% c.
1.0%
0.5%
Figure 6: Overall Construction Cost Risk Analysis Results
Baseline Risk Assessment- 20 February 2019

Murk otAAITT>1wror:;1A11.11>(1RT~'XW
The gray vertical dashed line in Figure 6 above represents the base cost in 2019 dollars. The base cost is the construction cost without any contingencies, or $29.9 million.
Note that construction costs include 8% for construction engineering and 10.49% for IDC
The red S-curve represents the cumulative probability distribution after adding in the risks (threats and opportunities) to the base costs and their uncertainties. This S-curve represents all possible values the costs could take, expressed in CY dollars.
The 80 percent confidence interval, described by the cost range between the 10th percentile and
9oth percentile figures, reveals that the total project cost will fall between $34.1 million and $40.0 million. There is 70 percent chance that the total project cost for the project will be equal to or less than $38.3 million at CY.
Top Risk Factors After the risks were identified, the GRAVE Team focused on responding to those risks that were the most likely to happen or which held a significant impact if the risk event occurs. Using the information portrayed in the tornado diagrams, the highest risk elements received the most focus.
The tornado diagrams for the top risks impacting cost and schedule for the project are shown in the following figures.
Pre-Response Results Top Cost Risk Factors
STG 20.01 • Lack cl gectechnical lnlormatlcn •• ! i£ .j!m'J~jlil:f 7 a i
CNS 900.01 - Un•ldentified Change orders -~~lfj~ $0.60 i ' ' ' ' '•··· '
CNS 70.01 - Material Availability -T??iiifTif;§!ijii S0.56
: STG 10.01 - Miner rehabima!ntenance le existing structures ~~?fl@$!?~ $0.40 I : . ' i I DES 10.02. Outside Shoulders with Baniern l!@%W?P@iW1w~ $0.35
I
DES 10.01 - Added scope beycnd 10% Design Hi, [ /\ ! \ f •:1:M $0.26
' CNS 10.01 -Access le Rest Areas .• $0.06
UTL 20.01 -Ulillly Conflicts ~ $0.04
CNS 90.01 - Adequate staging areas -~ $0.04
'
Expected Cost Impact($ millions)
11 Rlsk Cost Impact wAdditicnal Sup pert Costs
MDT Taft West CRAVE Report
Figure 7: Top Cost Risks
Baseline Risk Assessmen1- 21 February 2019
Figure 7 on the previous page shows the top risk identified for the project with the most significant risk attributed to the lack of geotechnical information. The dark red bar shows the direct cost impact caused by the risk followed by the schedule impact shown in light red, otherwise known as the extended overhead caused by the delay. The total impact for the lack of geotechnical information is an expected value of $860,000 followed by unidentified change orders at an expected value of $600,000, Risk documentation and response strategies were documented for each of the risks above and may be found in the Risk Analysis Sheets section provided in the Appendix.
For risks that did not have a VE recommendation, the CRAVE Team Leader and the VE Team determined the appropriate riSk response strategies for the remaining high risk areas.
The next step was to determine the appropriate risk response strategies for the identified high risk areas, Four risk response strategies, are considered when addressing threat risks. Those strategies are to avoid, accept, transfer, or mitigate the risk.
Avoiding a risk may cost more money up front, but may prevent or reduce a more significant impact.
Accepting a risk means that there is not much that can be done or relatively little benefit in addressing the risk.
Transferring a risk allows for the risk owner to move the liability of the risk to another party that is better able to respond to the risk.
Mitigation of a risk addresses risk by reducing the likelihood of the risk occurring or lessen the impact through proactive efforts.
Each of the risks that were ideritified had a unique response strategy developed to address it, as well as the identification of the risk owner. Identifying a risk response and risk owner, along with review intervals for the risk, a framework for a risk management plan is established. This allows proactive management of risk throughout the life of the project.
MDT Taft West CRAVE Report
Baseline Risk Assessment - 22 February 2019

Creative Phase During the Creative Phase of the Value Methodology Job Plan, the CRAVE Team brainstormed ideas on how to achieve the various functions. These Ideas were based on the available information given to them at the time of the study, taking into consideration the constraints and controlling decisions that were also defined for them. The ideas listed below coincide with each function being considered:
Function: Support Load
Baseline - Excavate existing roadway structure 2.0'. From bottom of excavation, pulverize 1.0', place 1.0' of crushed aggregate course, place 0.15' of plant mix asphalt. Place 0.83' of concrete pavement to match up with existing roadway profile.
SL-1 Eliminate 0.15' plant mix leveling course SL-2 Use open graded existing pulverized concrete LJnder new concrete (ITD
Pavement Design) SL-3 Bonded overlay concrete on top of existing roadway SL-4 Mill off existing 0.32' of plant mix surfacing, place 0.83' of new concrete
pavement over existing crack and seat concrete. Adjust slopes, additional barrier rail, and tie into existing roadway features (ramps, exist, structures)
SL-5 Mill off 0.4' asphalt, remove crack and seat concrete, use leveling course of plant mix to where 0.83' of new concrete matches existing profile
SL-6 Mill off 0.4' asphalt, pulverize existing concrete, pulverize existing plant mix and crushed aggregate course, use leveling course of plant mix to where 0.83' of new concrete matches existing profile
SL-7 Replace 0.15' plant mix with 100% recycle RAP (recycled asphalt pavement) SL~8 Fix longitudinal and transverse joints (if any), mil! and fill top 0.2' with existing
plant mix SL-9 Unbonded concrete overlay with permeable material SL-10 Replace 1' crushed aggregate course with 0.5' crushed aggregate course and
0.3'-0B recycled base SL-11 Do full depth pavement repair and overlay with concrete SL-12 Concrete driving lanes and asphalt the shoulders SL-13 In areas of divided interstate, concrete over existing and in areas of undivided
interstate, match existing profile SL-14 Thin concrete on shoulders to 0.5' SL-15 Increase transverse joints to 15' SL-16 Reduce number of dowels in each joint SL-17 Alternative dowel material SL-18 Alter contract to be pavement maintenance contract SL-19 Precast concrete panels for shoulders only SL-20 Cement or asphalt stabilized drainab!e base in lieu of 1' CAC SL-21 Flatten existing fill slopes with excavation waste SL-22 Optimize aggregate gradation {durable concrete)
MOT Taft West Crealive Phase - 23 CRAVE Report February 2019

SL-23 StringleSs paving SL-24 Contractor discretion Baskets SL-25. Downgrade binder to 58-28
Function: Maintain Traffic
Baseline - Construction sequencing for the first season requires the construction of a 10' shoulder for the WB lane prior to shifting to the WB lane so that the EB lane can be constructed in the first season. The second sequence in the second season would move traffic to the newly constructed EB lane for the construction of the WB lane.
MT-1 Provide emergency pull outs every mile in lieu of shoulder widening in stage 1 MT-2 Evaluate 24/7 tow truck standby MT-3 Shuttle for bicyclistslpedestrians MT-4 Lump sum traffic control MT-5 Three season project Year 1: shoulder, stream crossings/drainage, all prep work,
etc. Year 2: WB lanes Year 3: EB lanes MT-6 Concrete temporary barrier separating head to head traffic MT-7 Always have uphill traffic with widened shoulder MT-8 Split project into 2-3 mile sections (divided one season, shared one season) MT-9 Split project EB vs WB MT-1 O Use steel guardrail in lieu of concrete barrier rail MT-11 Flip barrier 180 degrees
Function: Increase Safety
Baseline - Not in Baseline (may be part of contingency) IS-1 Install new chain up/chain off areas in median area IS-2 Taft Interchange off-loop ramp widen shoulders for additional recovery (don't
change radius) IS-3 Move roadway slightly south (realign centerline) to increase chain up area
around MP 3.5 IS-4 Address unauthorized access points or utilize for chain up/removal IS-5 Use excess fill to build snow storage areas IS-6 Outside barrier IS-7 Reconstruct chain-up/removal areas
Function: Span Culverts
Baseline - Baseline has not addressed culverts yet SC-1 Line existing culverts and backfill bulge by overlapping SC-2 Separate project out ahead (replace) or after (lining) paving project
MDT Taft West CRAVE Report
Creative Phase - 24 February 2019

Murk Vi:PA/11/JI], "I Of TT/~NSPDMATJ(;//
Pavement Evaluation The Value Engineering team performed a detailed Life Cycle Cost Analysis (LCCA) for the top three pavement sections evaluated and the baseline pavement section.
Roadway Section Evaluation PCCP Inlay
0.83 Concrete Pavement 0.32' Mill Existing Plant Mix
Net Grade Raise 0.51' Do not remove existing Crack and seat PCCP
MDT Taft West CRAVE Report
_:,f~U-:l
CJ rM• "i:C«
CZ1 r, """ -'-~- " >,;,;? ca~r,, »41 su,, ,:'llm
r.c;J c,;u;"rn A(;Cq<c,•rc W,"15s
$23.15M Capital Cost $26.81M Net Present Value 60 year LCCA
21
pavement Evaluation - 25 February 2019

Mui* OCPAFmlWT (If :,W.'S"fl/,fAnr>N
Roadway Section Evaluation No. 1 IDEANO.
PCCP Inlay SL-4
Bas~line
Excavate existing roadway structure 2.0'. From bottom of excavation, pulverize 1.0', place 1.0' of crushed aggregate course, place 0.15' of plant mix asphalt, place 0.83' of concrete pavement to match up with existing roadway profile.
'R!;!Colllmendation . .
. .
Mill off 0.30' of existing plant mix surfacing, place 0.83' of new concrete pavement over existing crack and seat concrete and remaining 0.10' plant mix. Adjust slopes, additional barrier rail, and tie into existing roadway features (ramps, exits, structures).
Adv"aiitage_$ ·DJs.adyant~g_es __ .
' ', \' . . .. .. . .·
• Doesn't waste crack and seat • Side-slope corrections needed infrastructure • Tie-ins to existing structures
• Shorter construction time • Lack of performance history • Millings could be used for embankment • Doesn't address subgrade drainage
(may require exception) • Would require additional embankment (imported materials)
• Would require rebuilding differential shoulder support
• Makes replacing cross pipes more costly
. . : .~e~.ults-·ot Ari31ysis Summary_ . ..
. . . . .· . . . .
Baseline
Recommendation
Cost Savings
Life Cycle Costs
MDT Taft West CRAVE Report
. ··cost
$30,159,425
$23,151,994
$7,007,431
$ 26,808,890 (Net Present Worth)
Pavement Evaluation - 26 February 2019

Roadway Section Evaluation No. 1 PCCP Inlay
D_iscuss,ion/S.k:etches/Photos-
Baseline Roadway Sections: TYPICAL SECTION NO. 1
,., .. ----- "" --·--··•·"·--"·--
IDEA NO.
SL-4
] ', .,,_ ;-,~--:·,; "••/ ' - . --,• ! --- --"'--•!"""" - ____ ,,_
-_ ~d:s±GG!).X~t" .1 :?'.L~,--~~i,~:;4. ¥.~ ,.L1:"•-~-~::i~_;;]~h~.,, ! .... '· --·•··--"•
·- I -· i :· 1 -- ----- .. J. -- --~"'
TYPICAL SECTION NO. 2 ,.,,,,,?,YG',,i',i.,..,.,,
l
: il''·-o,: L ! ~"·:=-
Recommendation Roadway Section
MDT Taft West CRAVE Report
~c,_'-'.'P. D PH'P oCCP
(./\H?V.S ,, P:<;~ ~,-.ov ~k' ,,~, <Nm
[:,;: c,v:;-,ro a•;e,,,ctAft c~c:-•ccc
Pavement Evaluation - 27 February 2019

~ OfPJ.mY,L\'<Df;i;,IN$POIITAT/CN
Roadway Section Evaluation No. 1 PCCP Inlay
,Assump_tions/Ca,lculatlons
IDEA ND.
SL-4
0.1 0' of existing asphalt will be left in place as the paving surface for the concrete section. During the removal of the 0.30' of 0.40' of existing PMS we anticipate the potential for some of the crack and seat concrete beneath to be exposed. To address this we added 5,000 tons of cold mix patching to address de!amination. This recommendation wlll result in a 0.5' grade raise throughout the project. Additional aggregate will be required to build up the raised shoulders and steepening up the side slopes will require some additional areas of concrete barrier (see details below).
Recommend reviewing shoulder section detail due to risk of settteinent. Consider locating the longitudinal joint 1'-1.5' outside edge of underlying PCCP.
Additional Concrete Barrier Rail:
• Assumption' is that due to grade raise throughout the project concrete barrier rail may be required along each shoulder a significant portion of the project. This may be needed to mitigate over steepened side slopes and impacts to RMI, tree clearing, adjacent streams, and the frontage road.
Calculations:
• 200 Concrete Barrier included in baseline estimate • 2737 Remove & Reset Concrete Barrier included in baseline estimate • To line entire project with concrete barrier: 5.7 miles X 5280 ft X 2 sides/ 10 ft per piece
= 6020 barriers. • 6020 - 200 - 2737 = 3083 barriers additional barriers potentially needed • Assuming only half of the 3083 would be needed-= ~1540 Concrete Barriers • Barrier may not be required and may be accommodated by slope flattening. Slope
flattening costs would be covered by the concrete barrier currently in the estimate.
MDT Taft West CRAVE Report
Pavement Evaluation • 28 February 2019

Roadway Section Evaluation No. 1 PCCP Inlay
lteni -· ·,auallity Descri/itlon IJriit" Unit Price Amount 203020100 277,061 EXCAVATION-UNCLASSIFIED CUYD ' $8.001 $2,216,488 203020310 2,000 SPECIAL BORROW-NEAT LI NE CUVD ! $25.00· $50,000 301020340 121,443 CRUSHED AGGREGATE COURSE CUYD ~ $2.Q~ $2,478,652 301020625 253,999 AGGREGATE TREATMENT CUYD $0.271 $68,580 302000000 253,999 PAVEMENT PULVERIZATION SQYD $1.50 $380,999 401020048 24,472 PLANT MIX SURF GR S-1/2 IN '" $35.63 $371,875 401020300 343 HYDRATED LIME rn, $237.19 $81,35S 40202009$ 1.419 ASPHALT CEMENT PG 70-28 ro, $594.05 $842,953 402020315 12,608 EMUI.SIFIEDASPHALT-TAC~COAT GAL 54.45 $56,088 402020320 1,S04 EMULSIFIED ASPHAlT·fOG SEAL "' $3.85 $5,789 402020368 37 Emulsified AsphaltCRS-2P ro, $571.35 $21.140 409000020 20,081 COVER-TWE 2 SQYD $1.36 $27,330 411010000 317,241 COLD MILLING SQYD $1.14 $361,655 501010125 253,999 PORT CEM CONC PAVE 9 IN SQYD $50.00 $12,699,950
CONCRETE BARRIER RAIL EACH ~so:oo HANO PATCHING TO> $80.00
Subtotal $20,162,853 Mobiljzation 19%) $1,814,657 Raw Construction Sub total $21,977,510 MOT & Contingency (15%) $3,Z96,626 Construction Subtotal $25,274,136 Construction Engineering (8%) $2,021,931
Total $27,296,067 IOC (1.49%) $2)363)57
Total $30,159,425
IPCCPOVERLAY Costl$1 T of Maintenance ln~ial Co11Stru:tlon
Malntenance#1
Maintenance#2 Sa1va~e.va1ue
Total Cost
MDT Taft West CRAVE Report
S23.151.994 PCCP OVERLAY 54,657,763 Diamond Grid/Joint Seat/Slab Re> la0
$4,657,763 Diamond G~d/Joint SeaVSlab R"' lac -$5,787,999 25% of R'econstruct
IDEA NO. SL-4
Recommended Quanity-- ArijoJnt
'""' $15.00 $15,000
4,700 $SO.do $235,000
'"'' $30.00 $30,000
'""' $1.00 $1,000
0 $1.50 $0 2,000 $75.00 $150,000
" $237.19 $7,116 u, $594.05 $68,909
' $4.45 so 1,504 $3.SS $5,789
" $571.35 sh,140 '20,081 $1.36 $27,330
317.241 $1.14 $361,655 253,999 sso.oo $12,699,950
1,S40 ,$880.00 $1,355,200 5,000 s100:oo ssOO,ooo
$15,478,089 $1,393,028
$16,871,117 $2,530,668
$19,401,784
$1,552.,143
$0 $0 $20,953,927 $0 $0 $2,198,067
$0 $0 $23,151,994
Year of Malnt. 11+1Mn Present Worth 0 1 $23.151,994 ,0 1.35· $3,458,251
" 1.81 $2.567.649 60 2.44 -$2,369.004
TotalNPV $26,808,890
Pavement Evaluation - 29 February 2019

MDNr D<PAFITT/WT OF TTIAHSroITTAITON
Roadway Section Evaluation PCCP - PULVERIZED BASE
"I
---=--~*~f.~://_;./ ;// <.~ ,,.,>) !L.t:'.:LL/:,( pl·,·~~; ~:L,~///1/~%~~~~
.. .,. """ .. ,, .... , .•. ...._,.,1,411"'
Excavate 1.98' Match existing Profile
MDT Taft West CRAVE Report
"~ c::J...,,..,.,. --=""'-"'"'"""' o""""'""""""""'""" 0.83 Concrete Pavement 0.15' Plant Mix 1.0' Pulverized.
$26.63M Capital Cost $29.93M Net Present Value 60 year LCCA
22
Pavement Ev.:iluation • 30 February 2019

Roadway Section Evaluation Illa. 2 IDEA NO.
PCCP - Pulverized Base SL-6 .
-Baseline ••
Excavate existing roadway structure 2.0'. From bottom of excavation, pulverize 1.0', place 1.0' of crushed aggregate course, place 0.15' of p!ant mix asphalt, place 0.83' of concrete pavement to match up with existing roadway profile.
·Recomniendcltioil .
Mill off existing 0.4' of plant mix surfacing, excavate 0.67' of existing concrete pavement. Pulverize 1.0' of existing plant mix and CAC. Place .15' of PMS base. Place 0.83' of new PCCP at existing Profile grade.
Advantages· __ .. .. . -Disadv3·n~ge_s . . .. •'•
,• . . .
• Shorter construction time • Pulverized material not as uniform as • Millings could be used for embankment CAC
(may require exception) • Reduced surfacing section • Does not disturb existing subgrade • Eliminates virgin CAC • Robust typical section that requires less
surfacing materials • Reduces excavation cost • Shallower vertical cut improves traffic
safety • Generates less waste material
. . . ReSu_lts,of An.Jysis ·suminary
. . _;,_ ' .. · .
. .
Baseline
Recommendation
Cost Savings
Life Cycle Costs
MDT Taft Wes! CRAVE Report
. .
$30,127,875
$26,630,522
$3,528,761
$29,931,481 (Net Present Worth)
Cost
Pavement Evaluation• 31 February 2019

ll.:;furJr l>l:P~Wf117 OF rRANSPOITTA m:111
Roadway Section Evaluation No. 2 PCCP - Pulverized Base
DiscussiOri/Sketchf;!s/Photos
Baseline roadway sections:
TYPICAL SECTION NO. 1
' ,,.~,--,,,.·!"
QUANTITIES
·- I , •• I ::: ....
MDT Taft West CRAVE Report
TYPICAL SECTION NO. 2 "", ,./'lM'WI'!\ ,o,.o,
~
IDEA NO.
'"~" ,.,,.," :;~ ;~.;:: K
SL-6
Pavemerit Evaluation - 32 February 2019

Roadway Section Evaluation No. 2 PCCP - Pulverized Base
Recommended roadway sections:
TYPICAL 1
I Jl .. ,
IDEA NO.
SL-6
,----,,,:d~O:~~~=~L=.:f?✓,-/_;,:',.:; ~/4;-,,Lc..:;,:-,_r~a~:,,..;;~~-:~~C!.;.~~:fb:LL.c:L.¼:L,c'✓ ✓; "'-' C.',, ;
l.l;;.,. -' ···--~ ...
TYPICAL2
I " I "' -~"7· . . . . . ·. . ·. . ' ":~~
~~'Sff}fi[f{JJ!l..;4,~ .. :,_//L°/:L.,.'/J;L/Lc(/..t//t.U,:·f~Z(.~[c:::,,/,::,'.Z,,LL..:..-:c::.t.,,-:.t::LJ!"&"±.~~.""-·
ur •<<> ~,,- .... ' •-~ "'""""'""
MDTTaftV✓est
CRAVE Report
,,_ Cl..,._ -G'J"-<"'"'""" (F.l ,,,,,.., '"""'"'" ,...,,
Pavement Evaluation - 33 February 2019

Roadway Section Evaluation No. 2 PCCP - Pulverized Base
Assumpt_ions/Calculations
IDEA NO.
SL-6
Remove 1.0' of CAC for the length of the job resulting 1.0' less excavation for the entire length.
beg (sta) end (sta) dist. (ft) 01+09.45 104+70.00 10360.55
106+30.00 181+42.00 7512
258+44.30 271+55.00 1310. 7
274+60.00 300+75.00 2615
181+42.00 258+44.30 7702.3
7702.3
Quantity Calculation
21798.25 Typ 1 Length
15404.6 Typ 2 Len_gth
Length (It) Width (ft) Depth (ft) lt3 cy
Typ 1 21798.25
Typ 2 15404.6
76
38 1
1
1656667 61358.04
585374.8 21680.55
83038.59 sum
MOT Taft West Pavement Evaluation - 34 CRAVE Report February 2019

Roadway Section Evaluation No. 2 PCCP - Pulverized Base
IDEA NO.
SL-6
Mi /PH i h:rnm;m illleBWH/ id !ffi~a,~---d· " Re~~mrnend;d --- -~ iltein · ·-QUani\~---:□_eSCl"iption ---· ___ . · UniC- ;LJliitPriCe'. AmOunl ···,. Q.:.ianit~- Amount ! . 2.o3E+08 277,061 ·ExcAVATIDN-UNCLASSIFIED Clli□ ,. $8.00 $2,216,488 194,022 $1,552,179.32 i 2.03E+08 2,000 SPECIALBORRO'w'-NEATUr~E CIJi□ $25.00 $50,000 2,000 $ 50,000.00 i i 3.01E+08 121,443 CRUSHED AGGREGATECOUR:: CIJYD $20-41 $2,478,652 38,404 $ 783,834.11 ! 3.01E+08 253,389 AGGREGATETREATMENT two $0.27 $68,580 253,999 $ 68,579.73 I, 3.02E+08 253,999 PAVEMENTPULVERIZ:ATION SQYD $l50 $380,999 253,999 $ 380,998.50
4.01E+08. 24,472 PLANTMIXSURFGRS-1/ZIN TON $35.63 $871,875 24.472 $ 871,875.20 I 4.01E+08 343 HYDRATEOLIME TON $237.19 $81,260 343 $ 81,260.05 i, 4.02E+08 1,419 ASPHALTCEMEMTPG?0-28 TON $584.05 $842,953 1.419 $ 842,953._05
4.02E+08 12,608 EMi.JLSIFIEDASPHALT-TACKC GAL $4.45 $56,088 12.608 $ 56,088.20 I, 4.02E+08 1,504 EML.iLSIFIEDASPHALT-FOGS'EGAL $3.85 $5,789 1,504 $ 5,789 , 4·_02E+08 37 EMULSIFIEOASPHALTCRS-2 .TON $57135 $2J,140 37 :t 21.140 I 4.0SE+08· 20,081 COVER-TYPE2 SQYO $1.36 $27,330 20,081 :t 27,330 I 4.11E+os 317,241 cDL□ MILLING SQYO $1.14 $361.655 311,241 :t 361.655
5.01E+08 253,899 P□Rr'cEMCDNCPAVEi'i"1N SQYO $50.00 $12,699:950 253,999 :t 12,699,950 i
l
Subtotal Mobilization (9%)
Raw Construction SL-tb total Contingenc~ and MOT (15%) Construction Subtotal Construction Engineering (81/.)
Total IDC(1.49%)
Total
Cost □-ifferenoe
$20,162,758 $1,814,648
$21,977.406 $3,296,611
$25,274,017" $2,021,921
$27,295,338 $0 $2,863,344 $0
$30,159,283 -$0
-$3,528J61
17,803,6,32 $1,602.327
$19.405,859 $2,910,884
$22,316,852 $1,785,348
$0 $24,102,201 $0 $2,52sj21
lnitiil1'C0i.Structi<in '·°' ·: .,.: ..... ·· •· .. 7,:,-0.,c--:· .. · ,::. -:/1\<·-·- ·.· ... ,.$26.630.522
Matiit8nance·#t,c:-Y:. :,. .. ·• · SalVa;,,iValtie _:•;:-·· , ..
MDT Taft West CRAVE Report
' ·,;,,'$4;657,763 oiaii,Of,:i'GridljOinl-seal/Siab'REi" -· ·-:$6,657.63125%'0f.Recorisfroor·· ....
•":.'.·:20 :;,·,, :, ",;, 1,-:,·5:•:, :,, ··:.: ,"$3;458;251 :::: ::.io::::• .. · ·- :,·.·1.ili,· · ·: '·<·: $2.567.649
· .. ·,:-:.-::so··:.·-:.•-- - 2M·,> "-"'-::~-s2:124,941
Pavement Evaluation - 35 February 2019

MD'rk /ltl',\/IDffJIT ~; ;;w;;ropr, T/0:I
Roadway Section Evaluation PMS - FLEXIBLE PAVEMENT
MDT Taft West CRAVE Report
Match existing Profile Rehab Longitudinal Joints 2' wide
C,Ct'Q
"""'"""""' '.)J ,, "'' .· .' " "" •'-"'' ""', ... '"''
Ci) '""'~'' ''""''"' """'"
0.20' Plant Mix Type 3 Chips and Seal
$5.77M Capital Cost $58.31M Net Present Value 60 year LCCA
23
Pavement Evaluation - 36 February 2019

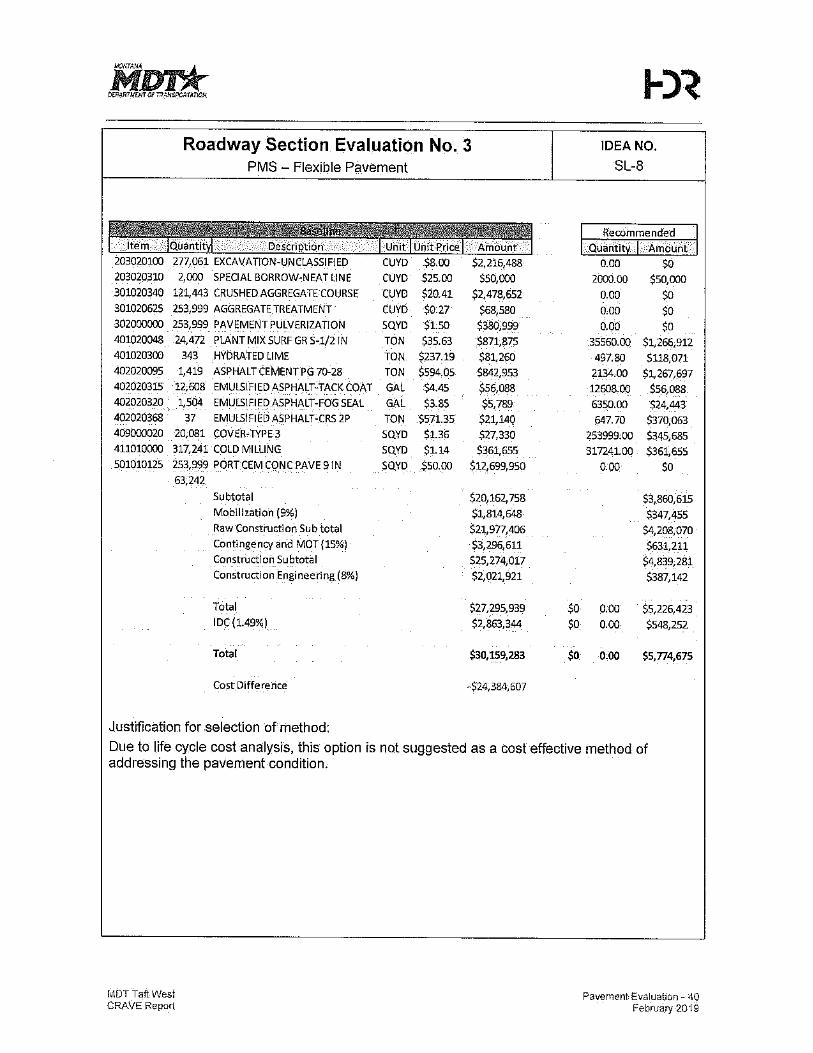
Roadway Section Evaluation No. 3 IDEANO.
PMS - Flexible Pavement SL-8 .
Baseline •
Excavate existing roadway structure 2.0'. From bottom of excavation, pulverize 1.0', place 1.0' of crushed aggregate course, place 0.15' of plant mix asphalt, place 0.83' of concrete pavement to match up with existing roadway profile.
Recommendation \ .. . .
Minor Rehab- Repair longitudinal and transverse joints (if any), mill top 0.2' and replace with new½" plant mix surfacing full width of existing surfacing and chip seal with Type 3 chips and a fog coat.
Joint Rehab will consist of milling out longitudinal joints down to the crack and seated concrete, 2' wide, and replacing with new plant mix surfacing (0.2') prior to the ful! width overlay.
Advantages . . . . .Disadvantages
• Smaller initial capital cost • Not as durable, anticipated shortened life • No grade raises of surfacing • Significantly shorter construction duration • More anticipated scheduled preventative
{one season initially) maintenance treatments needed • Familiarity with construction methods • Higher LCCA maintenance cost
(contractor/MDT) • More impacts to traveling public long • Large pool of qualified Contractors with term.
similar project experience. • Anticipated higher life cycle cost* • More risk of premature deterioration
based on previous experience with similar traffic and environment
• --Results of Analysis:Sllmmary
Baseline
Recommendation
Life Cycle Costs
MDT Taft West CRAVE Report
Cost
$30,159,425 ($33,070,779 LCCA)
$5,774,675 (Initial Construction)
$58,304,166 (Net Present Worth)
Pavement Evaluation - 37 February 2019

MDT:k C/1:PAITT\ILJ,"/ CF '1l<H5P<liffA!lf,V
Roadway Section Evaluation No. 3 PMS - Flexible Pavement
Discussion/Sketches/Photos
Baseline roadway sections: TYP!CM SECTION ,VO, !
-~····-·-----~··-·-··-·_·_-·_-·----~--+'--i ·------ . "--~----., • T ' ,, ·p--·---f ,. ~ - T
.... __ . L f ~ -,:-..J: :-..;): ··---·· _\?.: __ ¥'-.
Recommended roadway section: fx , ,,,1~,._ scr.na•,
HP/C:Al sn:.TJON NO, 2 ,~ ... J'?"'"'~---
IDEA NO.
SL-8
t__:'_j"'"
ao\E.S =---, -,-r-··"· · - J j 6·7 Q .-=:-3:1J&t:s-t::;;;~{{~Z.c~ .,~--~_:::~:-.::/c: ~- -~c-~: i;:~j);.,;_~4:R{~-----
0.e rcu ;,-iD!i, Q\'!c'll.M
->OOITIJN~. ~.2- "'
),§_G£~0
mZJ PFO~ Pi-l"
G'.J ;;1 "'MS (:<; t> ?'CF (R-'CK ~~::, SCP •2BIB Eel tRu·;~£:J AGG~lGMC wu~, ..
For Life Cycle Cost Analysis (LCCA) calculations:
,ow·;nun1'"'L -io:N1;
Major Rehab - Mill 0.4' from entire surface of Plant Mix, inclusive of shoulders, and replace with 0.4' of½" plant mix surfacing followed by a chip Seal with a fog coat.
Reconstruction - Remove all surfacing to the bottom of existing crack and seat concrete. Pulverize 1' (6"HMN6"Existing CAC). Top with 1 O" of CAC and 0.6' of ½"plant mix sU1facing with a chip seal wlth Type 3 chips and a fog coat.
Mill and Fill Driving Lanes - Remove 0.2' Plant Mix in driving lanes and replace with 0.2' Plant Mix with a chip seal with Type 3 chips and a fog coat.
MDT Taft West CRAVE Report
Pavement Evaluation - 38 February 2019

1lur:k DU'NIT/.11:Nr or fRAk'SPCITTATTO.~
Roadway Section Evaluation No. 3 IDEA NO,
PMS - Flexible Pavement SL-8
Assumptions/Calcu!ations .
Quantities for½" plant mix surfacing, chip seal, fog seal, were calculated using the baseline surface area of the concrete bid item, 253,999 yd'
We assumed a roadway length of 5. 7 miles for calculations of quantity (Bridges not excluded).
Assumed 6% asphalt cement in pf ant mlx.
Assumed 1 .4% hydrated !ime in plant mix. 8,5 lbs/gallon was used for unit weight of bituminous materials.
0.6 gallons/ yd2 was used for estimating CRS2P quantities (increase over typical for Type 2).
0.025 gallons/ yd2 was used for estimating fog seal quantities. 3855 lbs/yd 3 was used for unit weight of Plant Mix.
Special Borrow was assumed consistent with Baseline quantity. Cold Milling was assumed consistent with Baseline quantity.
We assume chip price remains consistent with substitution of Type 3 chips.
Pavement Maintenance Assumed:
PM'S ; R.EXl!ltE PAVB,Hfff·: :·. __ '
• .. __ ._, ·, ,:.: ,· . c;;.1,s' , .. -·, '._,: 'C: ·• ·1 .. ~oflhint~Mii0!
k-J.iileoii,tr(,c:h,i:·.
Mirne=#'I i~rn.Wo fl. '.;
r,tii\ter.ri;e#l:•,• lltli,ti,na,ujl,\<,
ili1m:iw.:.~'"· r,liWerwi~iis• ;-·
Mllrteri.ooe,1: :,-
fAmrem~#S--~~#9
~~10 --· i,tmten.ii:0#11: '-:
l"""'~,,.,k~ii ~#'13·' l~tfU-":"
~~is''-~!110 i.tit=~m-f.l!rn=ti11a· ·-
11Jr.ten~~l9-
Sa·N,,,•Vobe" '
TolalcO;i .
MDT Taft West CRAVE Report
',,' . ...
,' ·$5,n.1,675 · .. _ ·, ·.-: ... : seT(,896
-$91'7,8'36 __ ,', : ' ;, -J~,1N,lo9 • ., j9n,M6
-- . .-· ,:• ··-'Sffl,1196 ',,::·_.· -:· ,.'·520,61$,!oB
",' ,;, .. •" .. W,:T,B9G ',,:· .· ', -_ ... ... .-, .. S917,s..,
.. :: '' ·;,; ·s,,174,;15 ··,,"'· ·· .. S9J"1:!95
·.:sm,tlOO '·':" . i :_: $_~.m.~
:· .. _ .· _. $m,e96
• $9T7.S96 .. ·. ... :, .·: ~,016$68
'_.- . Sm.i~ . $!11.iiS
· sS,11~.61s .
··1m.iie _.- ' ,' . -s\1S(s~1
·. · ...
0.10'1.t.tJ!'ii··· 'Se.\!'_,,'
Oi>s,.r. :'_-._.· 0,iui.i.t..fli> .. .
s..l:,• ·.· ,.· Se.I '. "- -,,.'.'•,: __ ... ~:.
' "" • /, Seai: ·. :, .··
li10'~Wti _':'-, ,_ '
,-S<!ai" . .. '"Seal';
o.AO'"(i.i.ru.:: -·_-, ,: • ... ..
'Seal,' . '·: ;-~:,, .· .
fflism.cr ; ... . •'•Seal',
• . . ...
DNWfli:·
Clillseai .. .
25% QI' Refoostrbcl .
Yeuo11!iir11.:· ,•I_•, 0 ._.-•,,-,·
' -:'- •3,•
o-: '_,9 ,-'·--
" ,:.: !5 "; _, .. -.. . ·. _11'
A1-.··." . _," :.~4
: · •,_'21:'.- ,,_. ', "·_30 ,' ,"
" ..
" •. _3{
',-·, 42 : ___ ·,
..·. · 4s
" .. " " · . 57' '
•
-._ (1-tll'~'-.- .P1mniWot1h. ', •f' -iS,17l,675
i:o,:- ':. . .':·,-- ' $915,179 ;1,09: :-, .. :~:m
· '1.14:_.. :~.~al2 "'uO:: >S~tUOO
'-.>1:2:S·:-' ·,, sn,2,112 _:1.3f · · . --· .-..:-.-·.s1s,m,m i.r1-• ·-:.s115~ 1.43•: ,$SM,QS1
'··149,, .. I.·:,· --~,ssj_t15
·.:··1.$_·.','•' :$625,521
· >1.63'--, """' :i.1f .. .;. ,_55;3alJZ9
i79 -~_7,16)
·ur"·, -: ·SS?l,2"2
.',' i,$· .. · ·- :s10,r,so_m -2.04'• ·.-:~1ts45 2.14 .,5,\57µ1
'" Sl,Sa-1,409
'" ~1a,m ,µ --S2.1~,it.i
rOl&INPV !ss:mtGo
Pavement Evaluation - 39 February 2019
203020310
301020340 301020625 302000000 401020048 401020300
402020095 402020315 402020320
402020368 409000020 411010000 501010125
Roadway Section Evaluation No. 3 PMS - Flexible Pavement
. CAVATION-UNCLASSIF!ED $2,215,488 2,000 SPECIAL BORROW-NEAT LINE CUYD $25.00 $50,000
121,443 CRUSHED AGGREGATE COURSE CUYO $20.41 $2,478,652 253,999 AGGREGATETREATMENT CUY6 $0:27 $68,580
253,999 PAVEMENT PULVERIZATION SQYD $1.50 $380,999 24,472 PLANT MIX SURF GR 5-1/2 lN TON $35.63 $871,875
343 HYDRATED LIME TON $237.19 $81,260 1,419 ASPHALT (EMENT PG 70-28 TON $594.05 $842,953
12,608 EMULSIFIED ASPHALT-TACK COAT GAL $1.45 $55,088 1,504 EMULS\FIED ASPHALT-FOG SEAL GAL $3.85 $5,789
37 EMULSIFIED ASPHALT-CRS 2P TON $571.35 $21,140 20,081 COVER-TYPE3 SQYD $1.35 $27,330 317,241 COLD MILLING SQYD $1.14 $361,655 253,999 PORTCEMCONCPAVE91N SQYD $50.00 $12,699,9SO 63,242
Subtotal $20,162, 7S8 Mobilization (9%) $1,814,648 Raw Construction Sub total $21,9n,406 Contingency and MOT {15%) $3,296,611 Construction Subtotal $2S,274,017 Construction Engineering (8%) $2,021,921
Total $27,295,939 IDC(l.49%) $2,863,344
Total $30,159,283
Cost Difference -$24,384,607
Justification for selection of method:
IDEA NO. SL.-8
Recommended Quantit .-Amount
0.00 $0 2000.00 $50,000
0.00 $0 0.00 $0 0.00 $0
35560.00 $1,266,912 497.80 $118,071
2134.00 $1,267,697 12508.00 $56,088
6350.00 $24,443 647.70 $370,063
253999.00 $345,685 317241.00 $361,655
0.00 $0
$3,860,615 $347,4SS
$4,208,070 $631,2n
$4,839,281 $387,142
$0 0.00 $5,226,423 $0 0.00 $548,252
$0 0.00 $S,n4,675
Due to life cycle cost analysis, this option is not suggested as a cost effective method of addressing the pavement condition.
MDT Taft West CRAVE Repor\
Pavernent Evaluation - 40 February 2019

Life Cycle Cost Analysis (LCCA) Overview
A LCCA consists of calculating initial construction costs, future maintenance costs and a salvage value at the end of the analysis period. Based on these calculations, the relative value of each option is determined based upon their net present value. A 60~year analysis period was used for the scenario evaluated and presented for this VE study. Multiple scenarios should be
evaluated and considered in a LCCA. The assumptions used for the initial construction cost, maintenance intervals and assumed scope of rehabilitations should be varied for alternate scenarios. The spreadsheet used for this LCCA will be presented to the Pavement Analysis Section and Design Project Manager for use as the project development continues. This analysis includes the following concepts and terminology:
Initial Construction Cost: The cost of initial construction of the pavement. This cost includes pavement related bid items, mobilization, traffic control, construction engineering {CE), indirect costs {IDC). Some costs may be omitted within the initial construction cost if they occur in all of the alternatives being considered (i.e. striping) and will not affect the results of the analysis.
Maintenance Cycle and Costs: This includes both the predicted year and cost of future
maintenance activities. These costs are calculated using historic bid prices and the cost per square yard prices within the PvMS Annual Report. These costs include mobilization, CE, and !DC.
Net Present Value: The net present value (NPV) is the discounted cost of initial construction, maintenance activities, and salvage value of the pavement option during the LCCA
period. Future maintenance activities and salvage value are discounted to today's dollars using the discount rate. In simpler terms, NPV is the amount of money MDT would have to invest in
treasury bonds today to pay for all construction activities within the pavement life cycle reduced by the salvage value. The pavement option with the lowest NPV is considered the best value.
Salvage Value (Remaining Life}: For pavement LCCA, it is often necessary to compare pavements with a differing service life. An additional cost is subtracted from the NPV to account for the salvage value of the pavement (remaining service life). An example of this is the salvage value of a failed concrete pavement which can still serve as a base for a crack & seat and overlay project.
Discount Rate: The discount rate is the real rate of return that can be expected on a conservative, long-term investment. For pavements, the discount rate is calculated as follows:
30-year (and greater) Treasury Bond Rate -Average Rate of Inflation = Discount Rate
The official discount rate published by the White House Office of Budget and Management {OBM circular A-94) is 1.5% for 2019. https://www.whitehouse.gov/wp-content/up!oads/2018/12/ M-19-05.pdf
MDT Taf!West CRAVE Report
Pavement Evaluation - 41 February 2019

60-YEARLCCA Oisccunt Ra1~"' Dlstounl Rate r,om tM 2016 While Ho<ase Offite O! Sudce( and Mana emenl (0MB) Circular No. A-94
1 P CP OVERLAY Initial Coosmic1lcn Mainfonarn:o #1 Mnaitenan"co In saNoga Va!ue
M.iinteMrua:i 112:. Salva -Val11G.,.-.-·
lnlenanco 117. · M1wllenance1l8 • MMl!en.a0<0"'9 Maitltenance/110: M""11onance"#11 Mainten<inoe #12. <· · · MalnWnatlro#13 Malnt,maoco #-14 , · Mclnte,,anoa #1s· Mairilenanoe #-16 M!Untananoo#-17-Mafn!enaoao#-18 Maintaniui«ilt19 5ar,ag~Vatuo_•., ·-· Toto!C01it ....
PCCP OVERLAY
lniffal Construction
lriitiEll ·.Gon·strtu::tiori·;_.;:,- .. -··
PCCP. RECONSTROCT:· :-- --101tli;il ·c_ohsfructiort .-_,::-- ·
PMS~ FLEXIBLE PAVEMENT
Chin seal. 0.20'"MILUFILL 0.40' MILUFILL RECONSTRUCT'·
MDT Taft Wes! CRAVE Report
Co•t (S) TYi>e 0! Molntenonce
S23,1S1,994 PCCPOVERLAY 54,657,763 Oiamond G<it!IJoint ScaUSlab Re ocomon1 S4,6S7,7Gl Dia mend Gridl.J,,int SeaUSlab Re lacemen1
'55.787,999 25% or Reoon,iruot
Year of Malnt,
0
'" '" '"
l1+l)"n
' 1.35
"' 2A4
PresentWctth $23,151,994
$3,4&8,:1:51 52.567,649
Tota!NPV ·0:na,o!Maint·'(1tl)~n,·• •.-._p
:-:::,Q_•,. .",C'j :,,'-"_,, ...
Rei>t.oa..,..,,l->"" . •J.:, 20··.-.,,., .. ,•:·, 1.35" -Ro"" a'C<imt111I ;. · -:-'<AO,->:-:.-.. -. :·. 1.a1·,- -
•, ·- ·- -•, ·,.,: •S-1-,657.753 rn.m<>nd G<kl/Jo;,,tsoavsrOh'Rc ·1eoomon!' · • 7,531.915 25%·ol oonslrucl•;·•
Typo olMalnl<tnonoo · Mll.tJFILL Seal;> s,,,.1·:
Mll.tJFILL
QTY 253,999"
·- 253,999'
QTY .. 253999.
"253,999 253,999" 253,999-
-Unit
S/SY
·-:unit': ---
Unit .. SISY
··stSY · SISY SISY
:',YearofMalnt":- !1+1)"11 -.:_.;,__-_ ----o .- -·· .':-.1 -_.:
:-40.-- ------1'.81.-· . £(!".-,,, .. ------. 2;1~-
. •.·•: Tot.o!NPV·:·
Yoor.ofMaint; (l+l •11 _.Pr
-o· -.1 3 •,1.(!S
·.-6. -1.09"•· .9 · :.1.14
', .; .12 • 1.20 · '- '15 -· .-, 1.-25 -,1s> -- 1.31
21-: · 1.37"• ·24..-·." '1.43': · ,•-.. ·-S6Sl,081
-. .;27 ·- ,•1.49 53863,175 ·.30 1:56 ' $625621 .33· . .-. -· · .. 1,6J· .. ·S598,292
" -:,.51 • -. 54
57-- · 60" .. •
. '1,71'· . ·1:19
:2.04· .. · 2.14 ·
"' ,~ · ----'2.44 otal NPV.
.'SS::167,629 "$547,163 $52;!:W2
-- 510,550;727 S478,5"5
-:S457,641 52.584,409
"$418,532
-S2'109;7S4 ·. ~8,304.166
Uriit$ Cost
Untl.$
.
$91.15 $23.1'51,994
C6st $3.50 .$977;896
$22:74 $5;774,675 $36:12 $9,174,369 $81.17 $20,618,3"68
Pa\lement Evaluation• 42 February 2019

RD'rk n!"PAFmlWl"Ol"TP.AIISP0,'1,AJ,0/1
PCCP • MAINTENANCE COSTS,..... 2% Slab Replacement 5080 Joint Sealant 375588 Diamond Grindinn 253999 SUBTOTAL TRAFFIC CONTROL/ MOB. I GE I IDC TOTAL
PCCP • RECONSTRUCT (BASELINE PMS - FLEXIBLE PAVEMENT
MDT Taft West CRAVE Report
SY FT SY
75%
S200,00 $1,015,996 $1.00 $375,588 $5.00 $1,269,995
$2,661.579 $1,996.184
$18.34 $4,657,763
$26,808,890 $29,931,481
$33,070,779
$58,304, 166
Pavement Evaluation - 43 February 2019

11.Wui* OfPAJlTl/1:1<1 OFTTl~/isro:;rAIT;N
MDT Taft West CRAVE Report
This page is left intentionally blank
Pavement Evaluation - 44 February 2019

Evaluation Phase Although each project is different, the evaluation process for each CRAVE effort can be thought of in its simplest form as a way of combining, evaluating, and narrowing ideas until the CRAVE
team agrees on the proposals to be forwarded.
Taking into consideration the constraints and controlling decisions, the team discussed each idea and documented the advantages and disadvantages. Each idea was then carefully evaluated with the CRAVE Team reaching consensus on the overall rating of the idea (zero through five).
High-rated ideas (four or higher) were developed further; those that were considered to be equivalent to the baseline (rated three) were documented as design considerations; and low-rated ones (two or lower) were dropped from further consideration; however, the team provided a short
description and justification to support the low rating. The rating values are shown below:
3 = Great Opportunity 2 = Design Consideration (comparable to project team's approach) 1.8 = Good 1dea {but not a design consideration)
1 = Major Value Degradation 0 = Fatal Flaw (unacceptable impact or doesn't meet the project purpose and need)
= Advanced as recommendation
= Forwarded as design consideration
= Good idea but not a design consideration
II = Dropped from future consideration
Function: Support Load
Baseline - Excavate existing roadway structure 2.0'. From bottom of excavation, pulverize 1.0', place 1.0' of crushed aggregate course, place 0.15' of plant mix asphalt, place 0.83' of concrete pavement to match up with existing roadway profile
MDT Taft West CRAVE Report
Evaluation Phase - 45 February 2019

# Description Advantages Disadvantages
• Cost reduction • Reduces excavat1on • May get higher bid price
• Reduces time and on SY of concrete
paving phase • Less robust typical Eliminate 0.15' plant mix
SL-1 leveling course • Reduces mobilization section
• Easier to grade gravel • May have to make
than fix plant mix more grade correction
• Reduced material with concrete pavement
reauired Mainline
Maintainability Construction Environmental
Reduce Risk Qnerations lmnacts lmoacts
~ ~ ~
/~,t~it!}li JuStifiCatioll'fCOmme·nts/DiSj::i'osi'ticin: _,- . .-_·:c '
#. .
Description Advahtages . · ' Dfsa·dvantages
• Increased hauling and processing costs
• Difficult to measure compaction
• Disposal of fines • Reduces waste • May continue to
Use open graded existing • Provides drainable degrade in place SL-2
pulverized concrete under base • Not typical standard for new concrete (ITD • Minimizes use of virgin MDT Pavement Design) aggregate • May require additional
• Reduces haul underdrains • May take longer than
baseline • Limited crushing
contractors
Mainline Maintainability
Construction Environmental Reduce Risk Onerations lmnacts
~ " \~:i~!!·$f'.~ Justification/Comments/Disposition:
,-.·--:•.//·-
MDT Tali West CRAVE Report
lmnacts
Evaluation Phase • 46 Febru.iry 2019

Description
SL-3 Bonded overlay concrete on top of existing roadway
Mainline Operations
Maintainability
Advantages
■ Doesn't waste crack and seat infrastructure
■ Shorter construction time
Disadvantages ■ Side-slope corrections
needed ■ Tie-ins to existing
structures ■ Lack of performance
history ■ Doesn't address
subgrade drainage ■ Would require
additional embankment (imported materials)
■ Would require rebuilding differential shoulder support
Construction Impacts
Environmental Impacts Reduce Risk
?R~tiri1mi1: 'JustificatfCm1c'orti'merts/O,is_p_Osition: ..- .- .
?'.;\zm§:{~;~;I Combine with other ideas
# Description
Mill off existing 0.32' of plant mix surfacing, place 0.83' of new concrete pavement over existing crack and seat
SL-4 concrete. Adjust slopes, additional barrier rail, and tie into existing roadway features (ramps, exits, structures)
Mainline 0 erations
Maintainability
Adv_antages.
•
•
• Doesn't waste crack • and seat infrastructure
• Shorter construction • time
• Millings could be used • for embankment (may require exception)
•
Construction Im acts
Environmental Im acts
Justification/C.omments'/Disposition:
Move fotward for fwther evaluation
MDT Taft West CRAVE Report
·Dis_a'dvantages·
Side-slope corrections needed Tie-ins to existing structures Lack of performance history Doesn't address subgrade drainage Would require additional embankment (imported materials) Wou!d require rebuilding differential shoulder support
Reduce Risk
Evaluation Phase - 47 February 2019

# Description Advantages Mill off 0.4' asphalt, remove
• May minimize use of crack and seat concrete, use virgin aggregate •
leveling course of plant mix SL-5
to where 0.83' of new • Reduces haul Reduces possibility of •
concrete matches existing • nrofile contaminating slibbase
Mainline Maintainability Construction Environmental
Ooerations lmoacts lmnacts
-11~t~t:)t;. .JustifiCation/Comments/DispositiOli: .
# . . -pescri_ption· : . . . AdVanta'ges . Mill off 0.4' asphalt, pulverize existing concrete, pulverize
• Eliminate imported existing plant mix and crushed aggregate course, crushed aggregate •
SL-6 use leveling .course of plant • Reuse 1 00% of
mix to where 0.83' of new materials
concrete matches existing • Reduces excavation
orofile Mainline
Maintainability Construction Environmental
Operations Impacts Impacts
Rating: -~ustification/Comments/DispOsition:
2.5 Would require LCA
# . Desc;riptirin Advantages
Replace 0.15' plant mix with • Reuses existing SL-7 100% recycle RAP (recycled •
asphalt pavement) materials
Mainline Maintainability
Construction Environmental Ooerations lmoacts lmoacts
~
;:'.i::~f i~_;;~_{( Justification/Commet'lts/Disposition:
Combine with other idea(s)
MDT Taft West CRAVE Report
Disadvantages
No free draining material Unknown subgrades
Reduce Risk
~ .
Disadv:anta·ges'-
Could increase risk
Reduce Risk
~ .
·oisadVantages
Structural integrity
Reduce Risk
Evaluation Phase - 48 February 2019

# Description. Advantages Disadvantages
Fix longitudinal and • Not as durable transverse joints (if any), mill • More maintenance
SL-8 and fill top 0.2' with existing • Smaller capital cost • Higher maintenance plant mix cost
Mainline Maintainability
Construction Environmental Reduce Risk Ooerations lmoacts lmoacts
'l &,
Rating: .Justificatioll/Colllrriehts/Disposition:
2.5
#
SL-9
Would require LCA
Description
Unbonded concrete overlay with permeable material
Mainline 0 erations
Maintainability
,Advantages
• Free drain between existing pavement and new concrete overlay
■ Increased structural quality
Disadv_anta_ges
• Could add cost ■ Freeze/thaw issues ■ Lack of performance
history in MT • Raises profile ■ Side-slope corrections
needed ■ Tie-lns to existing
structures ■ Would require
additional embankment (imported materials)
■ Would require rebuilding differential shoulder support
Construction Im acts
Environmental Im acts
Reduce Risk
Just'ificatidti/Comments/DispositiCln:
Combine with other idea(s)
# Description • Advantages
• Replace 1' crushed
• Recycles some existing SL-10
aggregate course with 0.5' materials •
crushed aggregate course • Free draining and 0.3'-0.5' recycled base
Mainline Maintainability
Construction Environmental Onerations lm □acts lm□acts
'l
;:~:~~m-tt Justification/Comments/Disposition:
MDT Taft West CRAVE Report
Disadvantages
May require underdrains Harder to control density on first lift of open grade
Reduce Risk
Evaluation Phase - 49 February 2019

11.WDTI<" Dffil/if/,!lM" Oi" c;:w;sro.rArnJN
# Description Advantages
•
•
•
Do full depth pavement • Doesn't waste crack and seat infrastructure •
SL-11 repair and overlay with concrete • Shorter construction
time •
•
Mainline Maintainability
Construction Environmental Onerations lmnacts lmnacts
i!:~:;ti) Justification/C_omlTlentS/DispOsitiOn:
Combine with other idea(s)-improvement to SL 1-3
# Des_cri.J)i,ion· . AdVant"a,geS . _
. .
•
SL-12 Concrete driving lanes and • May reduce capital asphalt the shoulders costs •
Mainline Malntainabrnty
Construction Environmental Oneralions lmnacts l!Tlnacts
'l
-,1:ttiiN::~1:t Justification/Comments/Disposition:
Description .
SL-13
In areas of divided interstate, concrete over existing and in areas of undivided interstate, match existing profile
Mainline Onerations
MDT Taft West CRAVE Report
Maintainability
Advantages ·
■ Reduce excavation ■ Reduce waste ■ Provides test section
for future nro·ects
• •
Construction Environmental lmnacts lmnacts
Disadvantages
Side-slope corrections needed Tie-ins to existing structures Lack of pertormance history Doesn't address subgrade drainage Would require additional embankment (imported materials) Would require rebuilding differential shoulder support
Reduce Risk
.
Dis_advantages Increase maintenance of shoulders May minimize MOT options
Reduce Risk
Disadvantag~
Profile transitions Potential ROW issues where raising profile
Reduce Risk
Evalualiori Phase - 50 Febru~ry 2019

# Description Advantages
Thin concrete on shbulders to
Disadvantages
■ Lower sh6ulder durability
• Less MOT flexibility • May complicate
construction
SL-14 0.5' ■ Reduces concrete
• Additional construction activity
• May not be feasible as one operation
Mainline 0 erations Maintainability Construction
Im acts
■ May increase cost/schedule
• May trap water underneath at super sections
Environmental Im acts Reduce Risk
_,Justification{Coinments/[)isposition: .-
# Desc,ription
SL-15 Increase transverse joints to 15'
Mainline 0 eratlons Maintainability
Advantages
• Less dowels and sawcutting
Disadvantages
• Thinner concrete roadway section not recommended
Construction Im acts
Environmental Im acts Reduce Risk
J_ustificatiOtlJComments/Dispositki'rl-:
Currently aflowed by specifications/details, not specified at 10% design
# bescriptiph
SL-16 Reduce number of dowels in each joint
Mainline 0 erations
Maintainability
_;AdVaritages-
• ■ Reduce steel cost
Construction Im acts
Environmental lm acts
JUstifiCatipn/CorhmeiltsiDisposition:
Move forward for further evaluation
MDT Taft West CRAVE Report
Disadvantages-
Reduced load transfer capacity
Reduce Risk
Evaluatiori Phase~ 51 February 2019

Description
SL-17 Alternative dowel material
MainlineO erations Maintainability
Advantages
• Less potential for corrosion
• Easier for contractors • Could apply towards
5% innovation fundin
• •
Construction Environmental Im acts lm acts
JuStific~tion/Comments/OiSp_osition·:
# Description
Alter contract to be SL-18 pavement maintenance
contract
Mainline 0 erations Maintainability
AdVantages
•
• Could free up • maintenance crews for other district areas •
•
Construction Im acts
Environmental Im acts
, Jllstific•ation/Commellts/DisPosition:-
·Des<?ription
SL-19 Precast concrete panels for shoulders only
Mainline O erations Maintainability
Advantages
• Short construction • •
Construction Im acts
Environmental !m acts
JustificadoniCommentslo"isposition:
MDT Taft Wes! CRAVE Report
Disadvantages
No performance history Determining alignment post-construction is difficult
Reduce Risk
- Disadvan_tag_es
Continuous impacts to traffic Development of contractual language Contractor instability Federal funding questionable
Reduce Risk
Disoldvantages Precast issues Differential settlement
Reduce Risk
EvaIuatIon Phase• 52 February 2019

MDT:k Oi:PARr"1:t,T DFT;IAI/SF'CIITU/C/1
# be_scrlption Advantages Disadvantages
• Increased stabillzatfon • Increase cost Cement or asphalt stabilized of base • Increase time
SL-20 drainable base in lieu of 1' • Increased structure • Lack of industry CAC • May be able to reduce experience in the area
roadwav section denth Mainline
Maintainability Construction Environmental
Reduce Risk Ooerations lmnacts lmnacts
'.iiti~:'.::~ Justific_ationfComtnents/Dispo~ition:. .
.· .
SL-21
Combine with other idea(s)
·_ Des'c;riptio'n . _
Flatten existing fill slopes with excavation waste
Mainline Oneratlons
Maintainability
. . .
A,dvantages - .·
■ Reduces waste ■ Increase areas of
storage or chain up/removal areas
• Potentially allows more flexibility in barrier options
• Balances earthwork within nroiect limits
•
•
Construction Environmental lmnacts lmnacts
~
. Pisadv_antages·
May'haveROW impacts May have environmental impacts
Reduce Risk
'.-~~~!~!:;~~f-'J~u~s~ti~fi~c~at~i~o~nl~C-o~m_m_e_n_t_s_lD~i~s~p~o~s~it~io~n~:-----'-------~-------·-'"-----1
SL-22 Optimize aggregate gradation (dura_b!e concrete)
Mainline 0 erations
Maintainability
Advan.tage·s
• Reduces paste • Reduces long-term cost
■ Could increase capital costs
• Durabilit Construction
Im acts Environmental
Im acts Reduce Risk
JuStification/Corriirients/DiSposition:
Move forward for fwtherevafuatian
MDT Taft West CRAVE Report
Evaluation Phase - 53 February 2019

# Descripti\'.}n.
SL-23 Stringless paving
Mainline 0 erations
Maintainability
Advantages
• • Can reduce time • Reduce paving footprint •
(construction zone width) •
Construction Im acts
Environmental Im acts
Justific~tio·n./Commerits/Disposition:·
Make allowable but not required.
# _Oesc,:ripti011 ·. Advanta:geS· .·.
• Could minimize costs • SL-24 Contractor discretion
over prescriptive Baskets soecification
Mainline Maintainability Construction Environmental Operations lmnacts lmnacts
'itl~!11 JU_sfi~ica,tion/Gommellts/O_isposi'tiorl:
# __ Description Advantag_es
Disadvantages
May decrease ride quality Changes inspection procedure May limit contractor pool
Reduce Risk
. DiSadvantag_es·_
Increase inspection with MIT-scan for dowel bar alignment
Reduce Risk
Oisadv_ahtag_es_
SL-25 Downgrade binder to 58-28 ■ Reduces cost • Could require two types
of binder for construction
Mainline 0 erations
Maintainability Construction
Im acts
_JUstificaiio_niComments/Disposition:
Move forward for further evaluation
MDT Tait Wes\ CRAVE Report
Environmental lm acts
Reduce Risk
Evaluation Phase - 54 February 2019

Function: Maintain Traffic
Baseline - Construction sequencing for the first season requires the construction of a 10' shoulder for the WB lane prior to shifting to the WB lane so that the EB lane can by constructed in the first season. The second sequence in the second season would move traffic to the newly constructed EB lane for the construction of the WB lane.
# Description Advantcige_s
• May reduce impacts from temporary detour
Provide emergency pull widening • outs every mile in lieu of • Reduce Cost/materials
MT-1 9' shoulder widening in • Eliminates work from
stage 1 stage 1 • • Reduces impacts to
ROW and environmental
Mainline Maintainability
Construction Environmental O□erations lm □acts lm□acts
ti&;!t~i.: ·Justifi·ca,tion/COinmellts/bispositioii:,
.
Combine with other idea(s)
~ ~ . # __ DeScription . Adv.anta~es .
MT-2 Evaluate 24/7 tow truck • Can clear disable • standby vehicles auicker
Mainline Maintainability
Construction Environmental Qnerations lmnacts ]mnacts
:;:~;ttJt~{;f JustificationJCOmments/Disposi~ion: •
Combine with other idea(s)
# ·cescrif)tion Advanfages
• Accommodates
MT-3 Shuttle for bicyclists/pedestrians
bicycles and • pedestrians through construction zone
Mainline Maintainability
Construction Environmental Qneralions lmnacts !mnacts
L1~t~~:~ :=)I Justification/Comme_n~!Disposition:
Combine with other idea(s)
MDT Taft West CRAVE Report
Disadvantages
Breakdowns between pull outs cou!d result In blocked lane Reduces risk
Reduce Risk
~ ..
.-DiSadv,3,nta:Qes.
Reduces risk
Reduce Risk
~
•
Disadvantages
Cost
Reduce Risk
~ .
Evaluation Phase - 55 February 2019

# Description Advantages Disad\lantages
MT-4 Lump·sum traffic control • Simplifies estimate • May transfer risk of
dama e to contractor • Difficult to enforce
Mainline 0 erations
Maintainability Construction Im acts
Environmental Im acts
Justifit:ation/Comments/Disposition:
.
# Des~ripth;m Advantages
Three season project Year • Improves quality of
1: shoulder, stream shoulder barrier (longer • MT-5 crossings/drainage, all prep cure time} •
work, etc. Year 2: WB lanes • Higher probability of • Year 3: EB lanes completing work in
season Mainline Maintainability Construction Environmental
Operations lmnacts Impacts
I-2:!f!:-~'.~~j;; JUStificatiOii/ConiflleiltS/Disposition·:
.
MT-6
Descript'ion --
Concrete temporary barrier separating head to head traffic
Mainline Ooerations Maintainability
Advantages
• Safety
Construction lmoacts
• •
• •
Environmental lmoacts
Reduce Risk
Disadvantag·es·
Adds escalation costs Adds time Adds (1sk
Reduce Risk
~
Dis8._dvantages .
Cost May require additional widening Emergency response Complicates bicycle traffic
Reduce Risk
/~~1'~~;/j>-J_u_st_if_i_c_at_io_n_i_C_o_m~m_e_·n_ts_l_D_i_s~po_s_.i_ti_o_n_: ___________ ~---------l
# Description
MT-7 Always have uphi!I traffic with widened shoulder
Mainline O erations Maintairiability
Advanta~es
• Construction
Im acts
• Environmental
Im acts
Justification/Commenis/Oisposition:
Intent of the baseline
MDT Taft West CRAVE Report
Disadvantages
Reduce Risk
Evaluation Phase - 56 February 2019

Mm* !J!'PAIIIMUrfOF'il.WSP(!RT~TIOI<
# Description
MT-8 Split project into 2-3 mile sections (divided one season, shared one season)
Mainline 0 erations
Maintainability
Advantages
■ Shorter chute for traffic ■ Allow more flexibility in
pavement design
Disadvantages
• Shorter construction area for contractor to work in
■ Shifting traffic twice ln same season
■ More cross-overs • Double mobilizations • Extends construction
duration each season
Construction Im acts
Environmental Im acts
Reduce Risk
Justific;itlO"n/Col'nrrients/DispoS:ition·:
Move fotward for further evaluation, combine with other idea(s)
Des_Criptio_n
MT-9 Split project EB vs WB
Mainline 0 erations
Maintainability
._ -Adyant_~ges
• Construction
lm acts
• Environmental
Im acts
Jus~ificatiori1Cominent$/DispoSition: .·
Assumed baseline
# Descr_iption
MT-10 Use steel guardrail in lieu of concrete barrier rail
Mainline 0 erations
Maintainability
Adva_11tages
• Minimizes footprint • ■ Less durable Construction
Im acts Environmental
Im acts
Justific.iiition/COmments/Disposition:·
MDT Taft West CRAVE Report
Disadvantages·
Reduce Risk
Disadvantages
Additional maintenance
Reduce Risk
Evaluation Phase - 57 February 2019

# DescJiption Advantages
• Reduces cost • Flip outside barrier 180 • Reuse existing barrier
MT-11 degrees (double life)
• Eliminates waste • □ roblem
Mainline Maintainability Construction Environmental
Operations lmnacts lmnacts
'.:'.~tt'.t~:;; Justlficatii:>niComments/tii.sposition: ~
Function: Increase Safety
Baseline - Not defined
IS-1
Desi::ription
Construct chain-up/removal areas in median
, Advantages.
• Increase chain-up area • Lighting/infrastructure
could be used for chain-up/removal
• Reduce back-ups when chain-u areas are full
• • •
Mainline 0 erations
Maintainability Construction Environmental
Im acts Im acts
;Justific·atiori/Colilments/DispOSition:
# . · . DeScription AdV:a·11tages
• Provides additional
Taft Interchange off-loop recovery for road runoff
ramp widen shoulders for • Potential area to waste 1S-2 excavation •
additional recovery (don't change radius) • Reduces potential for
trucks getting stuck on tji1ht ramns
Mainline Maintainability
Construction Environmental Ooerations lmnacts
{~~!t:~('.'. Justification/CommentsfDisposition:
Accident history evaluation needed
MDT Taft West CRAVE Report
lmnacts
Disadvantages
May need to be replaced before next pavement life cycle
Reduce Risk
···Disadvanta,ges
Left side chain areas Cut down trees Increase cost
Reduce Risk
Disadvantages
Increases cost
Reduce Risk
Evaluation Phase - 58 February 2019

# Description • Advantages
Move roadway slightly south • Increase chain-up area • (realign centerline) to • Reduce back-ups when
IS-3 increase chain up area chain-up areas are full around MP 3.5 • Reduces mainline •
curvature Mainline
Maintainability Construction Environmental
Qnerations lmoacts lmoacts
~
i~~lJ!:'i Justific;tipn/CoromentsfDis_po_Sition: . .
Combine with other idea(s)
# oescriptiOn -. · . . · .. _Advantages
.. . ·.
Address unauthorized • IS-4 access points or utilize for • Maintains limited
chain u /removal access infrastructure
Mainline Maintainability
Construction Environmental Qnerations lmoacts lm □acts
~i~,~t::t:;I;i ' ' ' ' '" . .
JostificatiOn/Comme·nts/OiSposition: . _ . • Check with emergency access for lock gate
' ,#' . Descri.ption. .. _Advanta~res .
• Could eliminate some Use excess fill to build snow barrier rail •
IS-5 storage areas • Use excess excavation
to flatten slo es Mainline
Maintainability Construction Environmental
Onerations lmnacts
:tRJHifg':}I Justification/Comments'/DispOsition:- . .
D:2.fa ,;.--
i'.1'> "'•.','•-<:,":,:';/'
MDT Taft West CRAVE Report
lmnacts
.
Disadvantages
Cut down trees/increase disturbance area Increase cost
Reduce Risk
~
. . . -- Disadvantag_es
Cut down trees/increase disturbance area
Reduce Risk
. . .
Disadvantages
May cause drifting in some areas
Reduce Risk
..
Evaluation Phase - 59 February 2019

# Description Advantages Disadvantages
• Meets standards • Where outside barrier is placed, it must be either
1S-6 Outside barrier pinned down or have two feet of extra pavement behind it
Mainline Maintainability
Construction Environmental Reduce Risk
Ooerations lmoacts lmoacts
Jllstificatiori/Colllments/Disposition: .
Rating:
2 Design consideration; evaluate pavement width for shoulder to accommodate unpinned barrier or include detail for pinning barrier
. # . _Qescription ... Advantages ,
Reconstruct chain- • Provides additional IS-7 chain-up areas for peak •
up/removal areas usane times
MainHne Maintainability
Construction - Environmental Qnerations lmoacts lmoacts
Rating: JuslifiCation/_Comme·rlts/Di5:p_osition:
2 Design consideration
Function: Span Culverts
Baseline - Has not addressed culverts yet
I # 'Oescfi_ptibll Advantages· __ --
• Eliminate need to • replace deep culvert
• May save construction
SC-1 Line existing culverts and time • backfill bulge by overlapping • Could be completed as •
separate project • Could be phased to late •
in summer season Mainline
Maintainability Construction Environmental
Ooerations Impacts
/!it;;ti: JuStificationfCbmm·ents/Dispositio_n:
MDT Taft West CRAVE Report
lmoacts
Disadvantages ,-,.
Increased cost
Reduce Risk
·.
Disadvanlages-
May reduce capacity of culvert (overcome by friction) May alter hydraulics Potential fish passage issues Fish window
Reduce Risk
Evaluation Phase - 60 February 2019

# Description -Advantages
• Allows flexibility • Doesn't impact
Separate drainage project schedule of paving • SC-2 out ahead (replace) or after project
(lining') paving project • Prime contractor work • Better chance of
maintaining timeframes on both oro·ects
Mainline Maintainability Construction Environmental
Ooerations lmoacts lmoacts
Rating: Justification/COmments/Disposition: -- . .
2 Combine with other ideas
MDT Taft Wes\ CRAVE Report
Disadvantages
Could increase contract admin and development costs
Reduce Risk
Evalllalion Phase - 61 February 2019

MDT Taft West CRAVE Report
This page is intentionally left blank.
Evaluation Phase - 62 February 2019

Development Phase The VE Recommendations are presented as written by the team during the CRAVE Study. While
they have beE!n edited from the CRAVE report to correct errors or better clarify the recommendation, they represent the CRAVE Team's findings during the Study. The following
table is a summary of all recommendations generated and their impact to the project.
Table 12: Summa!')' of Recom·m_endations·
# Description Cost Savings
1 Pavement Section $ 7.01 M
2 Performance Engineered Mix Design N/Q
3 Stringless Paving N/Q
4 Binder $ 0.32 M
5 Dowels $ 0.33 M
6 Maintenance of Traffic $ 0.30 M
Total $ 796 M
Design Considerations In addition to the recommendations above, the CRAVE Team generated a number of considerations that they felt were important enough to be docuniented and should be further
considered by the project team. These include:
1. Drainage
2. Outside barrier/shoulder
3. Roadway Sections
4. Chain-up areas
Design Consideration No. 1 Drainage
The baseline did not specifically address or include culverts, however the drainage report
received at the beginning of the workshop calls for replacing or lining the following existing
pipes: (31) 24" pipe, (8) 30" pipe, (1) 36" pipe, (3) 48" pipe, (2) 54" pipe, (2) 108" pipe, and (1)
180" pipe.
Consider evaluating if a separate contract for lining the culverts would be beneficial. Lining the
culverts will be done by a specialty contractor, and the access for many of these pipes is limited
and challenging. Consider expanding the project limits for a separate contract for a lining
contract to address adjacent segments to capitalize on economy of scale. Pipe condition in this
MOT Taft West CRAVE Report
Development Phase - 63 February 2019

segment are considered generally poor, and adjacent segments were constructed in the same era.
Consider lining of all culverts in the contract (rather than replacement) because of the cost and time of removing and replacing the old crack and seated PCCP. The additional cost to line might be offset by the additional excavation, CLSM, and rigid surfacing replacement costs.
Consider the use of jack and bore for pipes at some locations.
Consider upsizing all pipes that will be replaced by a minimum of 6'' to accommodate future lining, sleeving.
Consider the use of HOPE pipes to extend the life of new pipes due to tt,e level of moisture and chlorides. This may make the project eligible for 5% increased federal share.
Consider specifying vertical trenching where possible (on CSP or HOPE) to minimize existing crack and seated PCCP and Plant mix removal. Specify excavatable flowable fill (CLSM) to back fill trenches.
Advantages to these considerations include the following: allows flexibility, doesn't impact schedule of paving project, prime contractor vs specialty contractor work, better chance of maintaining timeframes of both projects, and lower unit costs by increasing quantities. Disadvantages of these considerations are that they could increase contract administration and development costs as well as increase traffic control needs.
Design Consideration No. 2 Outside Barrier/Shoulder At this level of design, the baseline does not account for the required additional pavement width needed for the outside barrier. The current standard requires an additional 4' of pavement if barrier is not pinned or 2.5' of pavement if barrier is pinned.
Consider evaluating the pavement width to accommodate unpinned barrier or include detail for pinning barrier. The advantage to this consideration is that it meets standards, a disadvantage is that it widens the pavement section. The area of concern for this design consideration is the first two miles of the project. Where outside barrier is placed, it must be either pinned down (2' barrier+ 6" pinned= 2.5' total) or have two feet of extra pavement behind it (2' barrier+ 2' unpinned barrier= 4' total). This widens the pavement the pavement section by either 2.5' or 4'.
MDT Taft West CRAVE Report
Development Phase - 64 February 2019

~ Oi'.P,Rf\l[~l' Of liU~SPCRTA'IO.~
Design Consideration No. 3 Roadway Sections Pavement Evaluation No. 1. PCCP Inlay and Pavement Evaluation No. 2 Pulverized Base had the two lowest Net Present Value costs in the 60 year LCCA (life cycle cost analysis). The VE
team recognizes a 6" grade raise posed in PCCP Inlay may be challenging to accommodate in some areas of this project. Pavement Evaluations 1 and 2 utilized a 0.83' PCCP (10") section to stay consistent with the other PCCP sections in the LCCA. Because of the existing pavement structure {Crack and Seat 8" PCCP over 6" PMS), the 10" PCCP may be reduced to 8" PCCP, which would result in a 4" net grade raise. This may make this option more feasible on this project (or portions of the project).
Additionally, Pavement Evaluation No. 1 could be used where a 4-6" grade raise is easily accommodated (RP - 3.1-5.7), and Pavement Evaluation No. 2 utilized where a 4"-6"grade raise poses insurmountable challenges with permitting, ROW etc. {RP ~0.0-3.1). For example, Pavement Evaluation No. 1 could be used for the divided portions of the interstate while Pavement Evaluation No. 2 utilized for the undivided interstate.
Design Consideration No. 4 Chain-up areas The baseline is to construct the chain-up/removal areas with concrete at the existing locations.
Consider extending the existing chain-up area at RP 3.2 to RP 3.9 or expanding the WB rest area to accommodate additional truck chain-up areas. Reconstruct the chain-up/removal areas with concrete at the existing locations. Advantages of this consideration include providing
additional chain-up areas for peak usage times. A disadvantage of this consideration is an increased cost. Maintenance personnel indicated the current chain-up area d.oes not have adequate capacity during peak usage. When this occurs, trucks end up using the shoulder and stacking up as far back as the Rest Area.
Extending the current area would require excavation and likely generate excess material that would need to be wasted. Extending it back towards the Rest Area is probably not feasible due to potential sight distance limitations but extending to the west may be feasible.
There appears to be property immediately to the East of the WB Rest Area that could be developed for expanding the current rest area parking area and that could be used as a chainup area if it's feasible to access it from the Rest Area off ramp and the property could be obtained. There would be RW involvement and an evaluation of the geometrics of the ramp and any new chain-up areas along with the existing parking area would be necessary.
In addition to the design considerations, the CRAVE Team generated a number of ideas that
should be further considered by the project team. These include:
1. Provide emergency pull outs every mi!e in lieu of 9.0' shoulder widening in stage 1 2. Evaluate 24n tow truck on standby 3. Shuttle for bicyclists/pedestrians 4. Three season project Year 1: Cast CBR, stream crossings/drainage, al! prep work, etc.
Year 2: WB lanes, Year 3: EB lanes
5. Consider using temporary CBR to separate head to head traffic
MDT Taft West CRAVE Report
Development Phase - 65 February 2019

6. Construct chain-up/removal areas in median at divided highway 7. Taft Interchange off-loop ramp widen shoulders for additional recovery (don't change
radius) 8. Move roadway slightly south (realign centerline) to increase chain up areas around MP
3.5 9. Address unauthorized access points or utilize for chain-up/removal 1 O. Use excess fill to build snow storage areas 11. Line existing culverts
FHWA Functional Benefit Criteria Each year, State DO T's are required to report on CRAVE Recommendations to FHWA. In addition to cost implications, FHWA requires the DOT's to evaluate each approved recommendation in terms of the project feature or features that recommendation benefits. If a specific recommendation can be shown to provide benefit to more than one feature described below, count the recommendation in each category that is applicable. These same criteria can be found on each of the individual recommendations that follow.
• Safety: Recommendations that mitigate or reduce hazards on the facility.
• Operations: Recommendations that improve real-time service and/or local, corridor, or regional levels of service of the facility.
• Environment: Recommendations that successfully avoid or mitigate impacts to natural and or cultural resources.
• Construction: Recommendations that improve work zone conditions, or expedite the project delivery.
• Right-of-Way: Recommendations that lower the impacts or costs of right-of-way.
Value Engineering Recommendation Approval The Value Engineering Recommendation form is to aid in annual reporting of VE activities to FHWA. It is the intent that the project manager review and evaluate the CRAVE Team's alternatives included in this report. The Project Manager would then complete the Recommendation Approval form provided in the Appendix.
Each alternative that is not approved or is modified by the Project Manager should include a justification (a summary statement containing the Project Manager's decision not to use the recommendation in the project).
The completed Value Engineering Recommendation Approval form, including justification for any recommendations not approved or modified, shall be serit to the MDT Value Analysis Engineer so the results can be included in the annual VE Report to the Federal Highway Administration (FHWA).
MDT Taft West CRAVE Report
Development Phase - 66 February2019

MDTI< D!?AHT>l<m or Tl1A!,'5ro'IT~I/C?H
Recommendations Based on the evaluation process, individual recommendations were developed. Each recommendation consists of a summary of the original concept, a description of the suggested change, a listing of its advantages and disadvantages, and a brief narrative that includes justification, sketches, photos, assumptions and calculations (where applicable) as developed by the CRAVE T earn,
MDT Taft Wes\ CRAVE Report
Deve1op1ner1t Phase - 67 Feb"uary 2019

MDrk 0,.,''-/fNOfl Dr t!IW5POIITAT/O/I
VE Recommendation No. 1 IDEA NO.
PCCP Inlay SL-4
Baseline
Excavate existing roadway structure 2.0'. From bottom of excavation, pulverize 1 . .0', place 1.0' of crushed aggregate course, place 0.15' of plant mix asphalt, place 0.83' of concrete pavement to match up with existing roadway profile.
. Recommend_ation
Mill off 0.30' of existing plant mix surfacing, place 0.83' of new concrete pavement over existing crack and seat concrete and remaining 0.10' plant mix. Adjust slopes, additional barrier rai!, and tie into existing roadway features (ramps, exits, structures).
Advantages · Disadvantages . .
• Doesn't waste crack and seat • Side-slope corrections needed
infrastructure • Tie-ins to existing structures
• Shorter construction time • Lack of performance history
• Millings could be used for embankment • Doesn't address subgrade drainage
(may require exception) • Would require additional embankment (imported materials)
• Would require rebuilding differential shoulder support
• Makes replacing cross pipes more costly
Results of-Analysis-Summary
Baseline
Recommendation
Cost Savings
Life Cycle Costs
Safety
MDT Taft West CRAVE Report
cost
$30.16M
$23.15 M
$7.01 M
$26.81 M (Net Present Worth)
FHWA FuncUon?II Benefit
Operations Environment Construction
✓
· ..
ROW
Development Phase , 68 February 2019

VE Recommendation No. 1 PCCP Inlay
IDEA NO.
Discussion/Sketches/Photos
Baseline Roadway Sections:
TYPICAL SECTION NO,
.. ., -~ ,· :;;;::.,=-·; :: -~c._...,.~_, ,- ·1=~"'-j -, -·;~-... _:: -;:··-:-··-·:~;;·: ' - -" -j
--. ~~_,x.-,.!,, .. ,,;,l--£.,,_..;:,:i;"l.~"~'.,£"j,_ .,,,!<-,---·---·· -___ . ----------------·-----··- ' --·----· ., ... , --·-- ------------ "'l
TYPICAL SfCT!ON NO, 2 ,,.,, ....... ,,1,1«~ ..... ,, .,_ -- ____ ,,,,._. ... ·· ._, --- ····--··--··---· , __ ..,
[J:,1~:~-~~~~f :~.-: ..
Recommendation Roadway Section:
LC_(i;Sl>
D P~[P P((:;>
'.::Zi 1:-< P"O --~/4 L, ~;.tP U•~t;'- ~\<e Sl~l ''W" F":?_ ;rJ; ,r~ ,,.a~r,..s1[ ~q_,~,,
SL-4
MDT Taft West CRAVE. Report
Development Pha$e - 69. February 2019

1iiDrk OCPA'1™£11T /Jr 7.IAl,'SPOPr• H/lN
VE Recommendation No. 1 PCCP Inlay
Assumptibns/CalculatiOns
IDEA NO.
SL-4
0.10' of existing asphalt will be left in place as the paving surface for the concrete section. During the removal of the 0.30' of 0.40' of existing PMS we anticipate the potential for some of the crack and seat concrete beneath to be exposed. To address this we added 5,000 tons of cold mix patching to address delamination. This recommendation will result in a 0.5' grade raise throughout the project. Additional aggregate will be required to build up the raised shoulders and steepening up the side slopes will require some additional areas of concrete barrier (see details below).
Recommend reviewing shoulder section detail due to risk of settlement. Consider locating the longitudinal joint 1'-1.5' outside edge of underlying PCCP.
Additional Concrete Barrier Rail:
• Assumption is that due to grade raise throughout the ptoject concrete barrier rail may be required along each shoulder a significant portion of the project. This may be needed to mitigate over steepened side slopes and impacts to RM/, tree clearing, adjacent streams, and the frontage road.
Calculations:
• 200 Concrete Barrier included in baseline estimate • 2737 Remove & Reset Concrete Barrier included in baseline estimate • To line entire project with concrete barrier: 5.7 miles X 5280 ftX 2 sides/ 10 ft per piece
= 6020 barriers, • 6020 - 200 - 2737 = 3083 barriers additional barriers potentially needed • Assuming only half of the 3083 would be needed = -1540 Concrete Barriers • Barrier may not be required and may be accommodated by slope flattening. Slope
flattening costs would be covered by the concrete barrier currently in the estimate.
MDT Taft West CRAVE Report
Development Phase - 70 Februa,y 2019

MDJY< llfl'AITT!,l!Hf l)F lP ANSPC-RT~ 00//
VE Recommendation No. 1 PCCP Inlay
Item··.; Qu.inllv:; ·, di.Sc(ipti_on ·. ·--u·n11
203020100 277,061 EXCAVATION-UNCIASSJFIED CUYD
203020310 2,000 SPECIAL BORROW-NEAT LINE CUYD
301020340 121,443 CRUSHED AGGREGATE COURSE wrn 301020625 253,999 AGGREGATE TREATMENT CUYD
302000000 253,999 PAVEMENT PULVERIZATION SQYD
401020048 24,472 PlANT MIX SURF GR S-1/2 IN rn, 401020300 343 HYDRATED LIME '°' 402020095 1,419 ASPHALT CEMENT PG 70-28 rn, 402020315 12,603 EMULSIFIED ASPHALT-TAC~ COAT "' 402020320 1,504 EMULSIFIED ASPf-lALT-FOG SEAL "' 402020368 37 Emulsified AsphaltCR5-2P '°' 409000020 20,081 COVER-TYPE 2 SQYD
411010000 317,241 COLD MIUING SQYD
501010125 253,999 PORT CEM CONC PAVE 9 IN SQVD
CONCRETE BARRIER RAIL "''" HAND PATCHING '°' Subtotal
Mobilization 19%) Raw Construction Sub total
MOT & Contingency (15%)
Construction Subtotal Construction Engineering (8%)
Total IDC(l.49%)
Total
PCCPOVERLAY Cost 1$l
Initial Cons\rn::tfon $23,151,994
Maintenance#1
Maln\er..mc:e#2 Salvane Value
Total Cost
MDT Taft West CRAVE Report
$4,657,763
$4,657,763 . -$5,787,999
.UnitPlice Arrioun,t .
$S.OO' $2,216,488
s2s.oo! $50,000
~ $2.478,652 , $68,580
0 $380,999 $35.63 $871,875
$237.19 $81,355
$594.05 $842,953
$4.45 $55,088
$3.85 $5,789
$571.35 $21,140
$1.36 $27,330
$1.14 $361,655
$50.00 $12,699,950
$880.00
$80.00
$20,162,853 $1,814,657
$21,977,510
$3,296,626
$25,274,136
$2,021,931
$27,296,057
$2,863,357
$30,159,425
T of Maintenance
PCCP OVERLAY
Dlamord GJid/Joln\ Seal/Slab Renlac
Diamord Grid/Joint-Se"aVSlab Re.-.•a~
25% of-Re<:0nslruci
IDEA No·.
SL-4
Recommended
Qu~nity 'Amount
1,000 S1s.oo $15,000
4,700 $50.00 $235,000
1,00-0 $30,00 $30,000
'·""' $1.00 $1,000
0 $1.50 $0
2,000 $75.00 $150,000
so $237,19 $7,116
us $594.05 $68,909
0 $4.45 $0
1,SQ4 $3.85 $5,789
" $S71.3S $21,140
20,081 $1.36 $27,330
317,241 $1.14 $361,655
253,999 sso.oo $12,699,950
1,540 $380.00 $1,355,200
5,000 $100.00 $500,000
$15,478,089 $1,393,028
$16,871,117
$2,530,668 $19,401,784
$1,552,143
$0 $0 $20,953,927
$0 $0 $2,198,067
$0 $0 $23,151,994
YearofMainL 11+111'n Present Worth 0 ' $23,151,994
" 1.35 $3,458,251
40 1.81 $2,567,649
" ,.« -$2,369,004
TotalNPV $26 ecie:aso
Development Phase - 71 February 2019
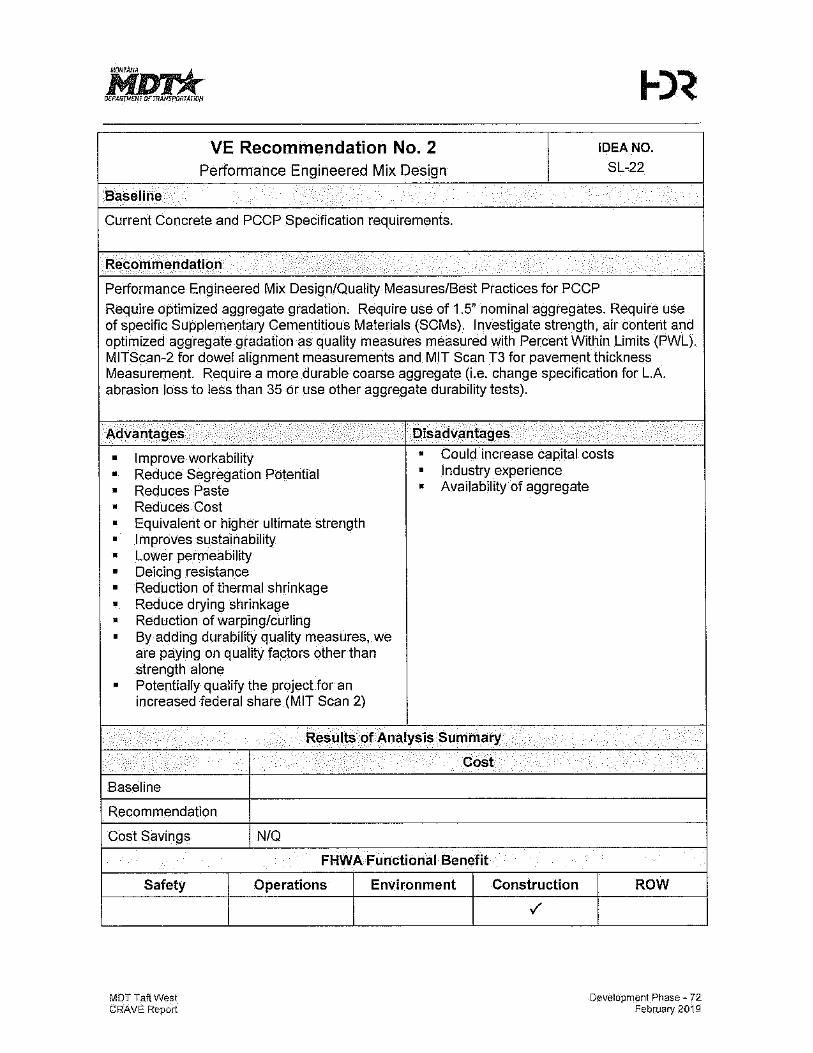
VE Recommendation No. 2 IDEA NO.
Performance Engineered Mix Design SL-22
Baseline .
Current Concrete and PCCP Specification requirements.
Re"Commendati9n . . . .
Performance Engineered Mix Design/Quality Measures/Best Practices for PCCP
Require optimized aggregate gradation. Require use of 1.5" nominal aggregates. Require use of specific Supplementary Cementitious Materials (SCMs). Investigate strength, air content and optimized aggregate gradation as quality measures measured with Percent Within Limits (PWL). MITScan-2 for dowe! alignment measurements and MIT Scan T3 for pavement thickness Measurement. Require a more durable coarse aggregate (i.e. change specification for L.A. abrasion loss to less than 35 or use other aggregate durability tests).
Ac{vantages . . . Disadvantages . .
• Improve workability • Could increase capital costs
• Reduce Segregation Potential • Industry experience
• Reduces Paste • Availability of aggregate
• Reduces Cost • Equivalent or higher ultimate strength • Improves sustainability • Lower permeability • Deicing resistance • Reduction of thermal shrinkage • Reduce drying shrinkage • Reduction of warping/curling • By adding durability quality measures, we
are paying on quality factors other than strength alone
• Potentially qualify the project for an increased federal share (MIT Scan 2)
. Results of Analysis Summary
• •
Baseline
Recommendation
Cost Savings
Safety
MDT Taft West CRAVE Report
Cost
N/Q
FHWA Functional Benefit
Operations Environment Construction
✓
ROW
Development Phase - 72 February 2019

MD'l'Jr D!'!\\RIMU/T OF ;!lM'SPCilTAT!C/i
VE Recommendation No. 2 Performance Engineered Mix Design
Discussic,n/Sketches/Photos
IDEA NO.
SL-22
To achieve a longer pavement design life, changes to our standard practices concerning PCCP and current mix design requirements will need to be made to account for the harsh environment this pavement section experience's. Aggressive salts and chemical attack are expected. The existing PCCP mix design would give a reduced life expectancy in these aggressive weather conditions. The existing PCCP was in service for 40 year prior to the crack and seat. The total service life for the new PCCP was assumed to be 60 years, which included two rehabilitations during that interval. More durable concrete would increase the probability that the PCCP provides acceptable performance over the entire service life. This can be accomplished by reducing the paste within the concrete, while improving performance, and increase the overall durability.
MDT Taft West CRAVE Repor1
Development Phase - 73 February 2019

VE Recommendation No. 2 Performance Engineered Mix Design
IDEA NO.
SL-22
Optimized Aggregate Gradation: Finding the best combination of aggregates used in the concrete mixture involves minimizing the paste content while still producing a workable mixture. Optimizing aggregate gradation offers advantages for both fresh and hardened concrete properties. It's a balancing act; mixtures should contain a minimum amount of paste to fill all the voids between aggregate particles and to separate aggregates slightly, acting as a lubricant to make the mixture workable. Excess paste beyond this amount does not offer any benefit and may, in fact, be detrimental to performance (cracking, higher permeability etc.). Requirement of specific SCM's will further increase the durability of the placed concrete pavement.
Optimized Combined Gradation How does that work?
, . 1:i----•--~'""'4 t~/"\\I "•"-~-~~:-_-_~,:_~.c--',i ~·:! :,
• ·~--·-- ! , .. ~, ,..,,,.. .. .,., .. "" .... ,__,.,,, '"""
https:/ /www. fhwa. dot. gov/pavement/ co ncrete/tra i ler/reso urces/h if 17 0 38 . pdf
MDT Taft Wes! CRAVE Report
Development Phase - 74 February 2019

VE Recommendation No. 2 Performance Engineered Mix Design
IDEA NO.
SL-22
This project location will be exposed to tire chains on a much higher frequency than other areas within Montana. A more durable aggregate will resist degradation and concrete rutting within the wheel paths. The current specification for concrete aggregate_s allows for coarse aggregate to have a maximum loss when tested for L.A. abrasion of 40. This aggregate requirement is not consistent, and indicates an aggregate of much lesser quality than those typically used by states who incorporate a large amount of PCCP within their infrastructure. The state of Washington requires freeze/thaw testing of the mixture and requires an L.A. abrasion less than 35.
https://www.wsdot.wa.gov/NR/rdonlyres/098E61 DC-AD06-4860-AFA2-808207BCEE7E/O/PavementsStuddedTires.pdf
MDT Taft West CRAVE Report
Development Phase - 75 February 2019

iJJurl< !/EP.>Jm<Ulf QF mAli!PO!lfA TWl1
VE Recommendation No. 2 Performance Engineered Mix Design
MIT Scan T3 will reduce corin to check thickness:
....... ~ ... ..,.,,.,a!.@;,
-~,-~ ·s ,....... €)
....... , .. ""''"~'"' • .....,,,w.,., ""'""""' ..............
kN< ..
IDEA NO.
SL-22
http://docplayer.net/58974236-Mit-scan-t3-precise-and-nondestructive-measurement-of-asphaltand-co ncrete-layer-thickness-in-com p liance-with-tp-d-stb-12-the-sm art-precision . htm I MIT Scan 2 will confirm dowel bar alignment to ensure that joints are not locked and prevent blown joints.
MDT Taft West CRAVE Report
Development Phase - 76 February 2019

Muri< /JtPM/rMtJ'/f a, '11, NSPORTAftrl/1
VE Recommendation No. 3 IDEA NO.
Stringless Paving SL-23
Baseline .
Current Spectfications are silent on Stringless Paving and 3D Construction.
Recommen~atiori .
.
Quantify additional requirements to allow Stringless Paving and 3D Construction.
Advantages· · ..
, DiSadvantiiges· _' _ ··: --. . ,.
. . . . . .
• Could reduce cost • Requires contractor to submit a 3D model
• Prevent stringless paving from being for review and approval by the agency
utilized without proper requirements in • Changes Agency Inspection protocol
place • New technology for MDT
• Reduces footprint of paving operation • New GPS Survey Required
• Can reduce time • Extensive survey control not required in
remote areas. • Could encourage more bidders
.
·.
Baseline
Recommendation
Cost Savings
Safety
MDT TattWesl CRAVE Report
.·•·· Re.suits _Of-Analysis S.uni'mary·
. Cost . .
N/Q
FHWA Fun..:;tional Benefit.
Operations Environment Construction
✓
.
. . .
ROW
Development Phase - 77 February 2019

MD1'k DU~RTJ.l!;/11 or'.l!.INSl'QRT!r;o/1
VE Recommendation No. 3 Sti"ingless Paving
Disc'us_Sion/Sketches;/Photos
IDEA NO.
SL-23
Stringless Paving and 3D Modeling for PCCP pavement is not defined nor specifically disallowed. lt would be prudent to define submittal and approval requirements of digital models and it will change the layout, inspection and quantity verification. The specification requirements need to be updated to accommodate this technology as most contractors have already adopted this project delivery method. Not allowing this technology would increase bid cost and potentially reduce the number of bidders.
MDT Taft West CRAVE Report
Configuration Example: Mainllne Paver with 2 Total Station Control System
CwU, .. \ ~w,, 10, .,_ ;.,,.,i • • .. ,••'
c;;:f
Development Phase - 78 February 2019

VE Recommendation No. 3 Stringless Paving
IDEA NO.
SL-23
Assumpt_i.ons/Calculatiohs
Figure 1. Operating space requirements for conventional
pa,ring (ACPA 2013).
Space requirements for traditional paving are shown above. Stringless paving is a technology that eliminates the installation and maintenance of stringlines and has the potential to decrease
the need for surveying and increase the smoothness of the pavement profile. The string line adds several additional feet ( +/- 6 ft) of required clearance to the paving envelope, which is
already wider than the pavement due to the tracks of the slipform paver.
MDT Taft West CRAVE Report
Development Phase " 79 February 2019
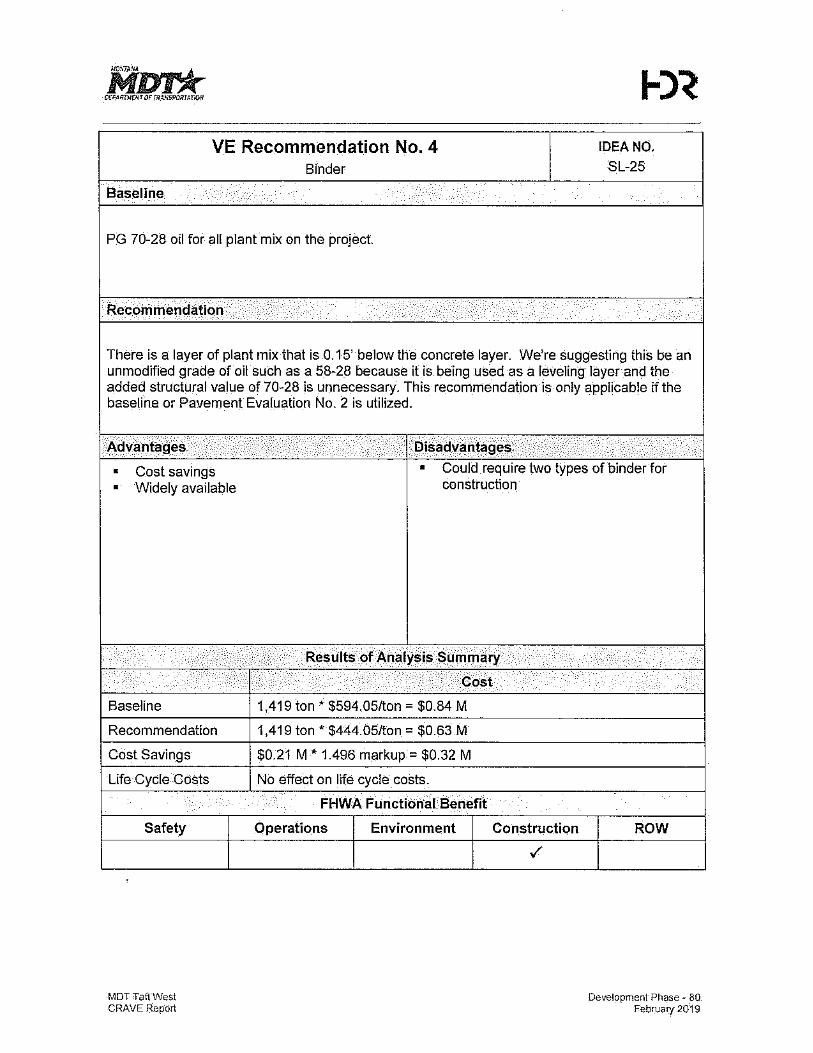
VE Recommendation No. 4 IDEA Nd.
Binder SL-25
Baseline
PG 70-28 oil for all plant mix on the project.
Rec.ommendation .
There is a layer of plant mix that is 0.15' below the concrete layer. We're suggesting this be an unmodified grade of oil such as a 58-28 because it is being used as a leveling layer and the added structural value of 70-28 is unnecessary. This recommendation is only applicable if the baseline or Pavement Evaluation No. 2 is utilized.
AdvanfaQ·es. -__ ' '
• Cost savings • Widely available
. .
Baseline
Recommendation
Cost Savings
Life Cycle -Costs
Safety
MDTTafl.West CRAVE Report
. .·
.. · DiSadv~llta·Qes· ·-·,. .·.-:"' • •• .
• Could require two types of binder for construction
Results of Analysis Summary
•• . co·st
1,419 ton• $594.05/ton = $0.84 M
1,419 ton• $444.05/ton = $0.63 M
$0.21 M' 1.496 markup= $0.32 M
No effect on life cyc!e costs.
FHWA Function-al Benefit
Operations Environment Construction
✓
.
ROW
Development Phase - 80 February 2019

Mui* OCPAITT),ffNT OF TTl~NSPDm"AfliJN
VE Recommendation No. 4 Binder
Discussion/Sketches/Photos
Baseline Roadway sections: TYPICAL SECTION NO. 1
Ur---.,., ,, ·-_-L · __ .. ,., ... - .. ·,~'-"'''""---•4~-~-- __ .. __ .,.._ f:· .. "'• "~--7 •- ' ' )L~l'P
MDT Taft West CRAVE Report
T
llUANTITIEZ
TYPICAL SECTION NO. 2 , • .,,.,f'ljRW/'Il.,,,,,P,
'L
--•--""~ --.~.-.-~~··"-
IDEA NO.
SL-25
., ... ,~~ .. ,, ·•··~>< " , .. ,,,,.,,. ., ,<,•"•" "
-----------------.-.-.. -. .,, _--7
·1
Development Phase - a1 February 2019

VE Recommendation No. 5 IDEA NO.
Dowels SL-16
Baseline .
18" dowel bars (per standard detail 501-00) at 12" on center (oc) in driving and passing lanes.
R'ecommenda_tion .
Reduce dowel bars to 4 per whee! path in driving lanes and change length of bars to 15".
. . . .. · Disadvantages'
. Advantages . ..
• Reduced steel cost • Reduced load transfer capacity
Results of-Analysis Summary . .
Cost . .
Baseline See calculations and assumptions
Recommendation See calculations and assumptions
Cost Savings $0.33 M
FHWA Functional Benefit
Safety Operations Environment Construction ROW
MDT Taft West CRAVE Report
✓
Development Phase - 82 February 2019

VE Recommendation No. 5 IDEA NO.
Dowels SL-16
Discuss·ion/Sketches/Photos AsstJmptions/ Calculations
Flll!Sti O!JTEfl EDGE OF PCCP SHOULDER \l'ITH 112" ( 131 RADIUS - ,s· " o· [45701
MAXIMUM {FP. l
/TRMl$VE~S£ CONTRACTION OR / CONSTRUCTION JOINT ITY/>.)
/ !SE£ SECTION Vi£WSJ
/ I/
PCCP SHOULDER IF RE.OU IRED . I I ' I ' ' ' ' ' ' ' ' I ' ' ' . ' 't' I I I ' I. -, I I I ii I
' " --. - ' - -
- - REMOVE ,,
LONGITUDINAL CONrRACTIOII OR -- . - ,\ - CONSTRUCTIGr{ JOINTS !TYP. \ - -
.,// ISEE SECTIOfi VIE\l,'S I - --
/ ' I - I I I I I ' - I ' I I 1<1 I
Length of Typical 1 = 21,798' / 15' Joint spacing = 1,453 transverse joints Detailed drawing states bars at 12" oc = 26 dowels per joint Suggested 4 bars per wheel path at 12" oc = 20 dowels per joint
Length of Typical 2 = 7702 x 2 (EB and WB) = 15,404 / 15' spacing = 1,027 transverse joints Detailed drawing states bars at 12" oc = 56 dowels per joint Suggested 4 bars per wheel path at 12" oc = 42 dowels per joint
Total number of bars Typical 1 & 2 plan = 81,368 Total revised bars= 55,489 23,598 bars@ $8 = $188,784 savings Going from 18" dowels to 15" dowels saves $0.55 per bar* 55,489 = $30,519. Savings = ($188,784 + $30,518) * effective mark up of 1.496 = $328,076
MDT Taft Wes\ CRAVE Report
Development Phase - 83 February 2019

VE Recommendation No. 6 IDEA NO.
Maintenance Qf Traffic MT-8
Baseline . . . .
The original design outlines two sequence operations which required multiple traffic control adjustments. Construction sequencing for the first season required the construction of a 10' shoulder for the westbound lane prior to shifting to the westbound lane so that the eastbound lane can be constructed in the first season. The second sequence in the second season would move traffic to the newly constructed eastbound lane for the construction of the westbound lane .
Rec_ommen_dation - ,, . . · .
The traffic control and sequencing will be modeled according to the 2011 Crack & Seat project. This would separate traffic utilizing delineated traffic control devices and provide "Distressed Truck Exits" at regular intervals through the center median. Additionally it is recommended that the first season complete construction from STA 181+42 - 300+ 75. The second season the remaining section of the project from STA 1 +09 - 181 +42 would be completed.
Advantag'E!s DiSadvantaff¢_s .
• Eliminates costs & duration of constructing • Eliminates the widened shoulder
temporary 10' shoulder and associated changes to traffic configurations
• Provides more efficient work zone for Contractor.
• Accommodates Wide Loads . • Simplifies construction of crown during
paving operations • Sequence does not leave differing grades
side by side over winter shutdown
Results ofAnalysis Surilmary . .
c'ost-.
Baseline $0.20 M
Recommendation $0
Cost Savings $0.20 M x markup 1.496= $0.30 M
FHWA Functional Benefit
Safety Operations Environment Construction ROW
✓
MDT Taft West CRAVE: Report
Development Phase - 84 Febru;iry 2019

Murk OCPAlm/U. 'T Of 7~A~'SPO;iTAr,'OII
VE Recommendation No. 6 Maintenance of Traffic
IDEA NO.
MT-8
Disc.ussion/Sketches/Photos
Baseline Sequence of Operations:
Proposed Sequencing for Season 2:
shldr
MDT Taft West CRAVE Report
'
POUR 1 trvl lane
TRAFFIC
trvl lane.
FIRST SEQUENCE
SECOND SEQUENCE
]~!-· .. , I
PHASE 1
TRAFFIC .f"L trv/ trvl shldr me Ian;· i lane lane -,·.,c/.,'.-1·----~--~~-~ ,---~,
PHASE 2
POUR 2 shldr
Development Phaser 85 February 2019

VE Recommendation No. 6 Maintenance of Traffic
Assumptions/Calculatiohs·
IDEA NO.
MT-8
During the 2011 Crack & Seat projec;t, traffic control did not utilize positive separation. Traffic control devices were used for separation of traffic. There were also 3 "Distressed Truck Exits" provided between STA 1+09 -STA 181+42 to allow for truck breakdowns headed uphill to be removed from impacting traffic. These locations were at approximately MP 0.5, 1.5, & 2.3. These exits would eliminate the need a heavy truck hauler to be on standby for the project.
From STA 181 +42 to 300+ 70 the interstate is separated allowing each shoulder of the roadway to be used for pull off areas in case of breakdowns.
The Contractor will also be responsible to shuttle pedestrians and bicyclists through the project as a part of their traffic control responsibilities.
Season 1 (Construct STA 181 +42 - 300+70):
The separated lower section of the project would be completed in the first season. The westbound lane would be constructed with traffic in the eastbound lane and then switched over to construct the opposite lane part way through the season. This would require a traffic crossover before the beginning of this work zone and one at the end of the project. Traffic crossovers ar'e already included in the baseline design.
Season 2 (Construct STA 1 +09 -181+42):
The second season, the upper section of the project will be completed in the combined median section of the project. The westbound lane would be constructed with traffic in the eastbound lane and then switched over to construct the opposite lane part way through the season. This would require traffic crossovers before the beginning of the project and at the end of the work zone. Traffic crossovers are already included in the baseline design. Completing this section of the project in the second season will allow for longer cure tiine for the new median barrier before their placement on the project and wlll eliminate potential issues with having this section of the project only partially completed over a wiriter shutdown. Traffic would be shifted far enough on each configuration to allow the construction to the roadway centerline, making for a more efficient and productive operation.
MDT Taft West CRAVE Report
Develcpmenl Phase " 86 February 2019

Rm* PUA!m,r.morTRAI/Sl'Q;,1ATKW
Analysis of Results
Risk Analysis on Response Strategies New and innovative approaches inherently carry risk; the team identified the risks associated with
these types of VE recommendations and risk response strategies.
To quantify these impacts, the VE recommendations and the response strategies were input into
scenario models as opportunities or threats in terms of their likely impact, as well as the probability
of the implementation of the recommendation. Risk response strategies were defined and quantified for each of the risks that were not modified by VE recommendations.
At this point, new cumulative cost curves were generated that represented both the impacts of responding to the risk elements and partially or fully implementing the VE recommendations. By treating the VE recommendations as an opportunity to increase value through performance increases and cost reductions, it was demonstrated that further cost and schedule efficiencies could be obtained for the project.
Post-Response Results
100%
90%
80% -.5 70% ~ • • 0
60% < w
" 0 z 50% ~ 0
-~ 40% :a • ~ e 30% 0
20%
10%
0%
$21.5
Construction Cost {50% Implementation) Pre-Response & Post-Response Results
w I ~ I
-$35.7M, 70%
I 11
i I
·If] .. r
. I $26.8 M, 10% "'
. ~
$27.5 $32.5 $37.5
Cort{$MJ
--Construction Cost Pre•Response (YOE S's)
--Cdnstruction Cost Post·Response (YOE S's)
- - Base Construction Cost Post-Response {YOE S's)
Figure 8: Total Cost Risk Analysis Results - 50% VE Recommendation Implementation
MDT Taft West CRAVE Report
Analysis of Results - 87 February 2019

The red S-curve in Figure 8 shows the modeled re·sults prior to risk mitigation and VE recommendation implementation. Th~ green S-curve represents the cumulative probability distribution after adding in the value engineering opportunities and responding to the identified risk. This "S-curve" represents a!I possible values the costs could take, expressed in CY dollars.
Prior to value engineering and risk response, the total costs for the project had a 70 percent chance of being less than or equal $38.3 million at CY. With the VE recommendations and risk response strategies included, the project now has a 70 percent chance of being less than $35.7 million CY, assuming 50% of the VE recommendations are implemented.
If the implementation percentage increases to 75% or even up to 100%, the 70 percentile modeled results are reduced to $32.0 million and $29.9 million respectively. Please refer to Figure 9 and Figure 1 0 on the following pages that show the modeled results for 75% and 100% implementation respectively.
100%
''" 80%
• _, 70%
~ • • 0
" 60% w
" 0 z 50% -0
~ 40% :.
0 ~
e 30% •
20%
10%
0%
$22.5
Construction Cost (75% Implementation) Pre-Response & Post-Response Results
$27.5 $32.5
Cost ($M)
--Construction Cost Pre-Response {YOE S's!
--Constru('tion Cost Post-Response {YOE S's)
$37.5
- - Base Construction Cost Post-Response {YOE$'s)
: $38.3 M, 70%
$42.5
Figure 9: Total Cost Risk Analysis Results - 75% VE Recommendation Implementation
MDT Taft West CRAVE Report
Analysis of Results - 88 February 2019

100%
'
Construction Cost (100% Implementation)
Pre-Response & Post-Response Results
90% "$40,0 M, 90% ,/'
80%
30% i
' 20% ~
$27:3 $32.3
Cost ($M)
-Construction Cost Pre-Response {YOE $'s)
--Construction Cost Post-Response {YOE $'s)
$37.3
- - Base Construction Cost Post-Response (YOE $'s)
.,,,,, l '$38.3 M, 70%
$42.3
Figure 10: Total Cost Risk Analysis Results - 100% VE Recommendation Implementation
A summary of the modeled results for each recommendation implementation scenario, currently established at 50, 75 and 100 percent is provided in the table below.
. Table ·1~: Analysis Qf Results •Sum.mafy ·(llliilllons··$) ..
Base Cost Probability of NOT
Post-response Scenarios Exceeding 2019 $s
70%
50% VE Rec. Implementation $35.7
75% VE Rec. Implementation $29.9 $32.0
100% VE Rec. Implementation $29.9
Please see the Risk Analysis Sheets provided in the Appendix for additional detail.
Tracking, Monitoring, and Control The 50% VE Recommendation Implementation expected value (likelihood multiplied by expected risk outcome)' tornado diagrams below depict the actual expected values of the identified risks
MDT Taft West CRAVE Report
Analysis of Results - 89 February 2019

MDl'k DfP4111J./[~7 or ITIANSFO/U'ATm,~
and help summarize the evolution the project has gone through by engaging in the CRAVE process. Not all risks identified require immediate management. Often, a project team needs to prioritize the risks for which it plans to develop strategies in the future in an effort to make the best use of the time available. An example would be to begin with the risks with the highest cost and schedule Impacts.
Within the diagrams, the risks have the expected values plotted prior to responding to the risks and implementing the VE recommendations (red bars) and after responding to the risks and implementing VE recommendations at their expected likelihood (green bars).
Top Cost Risk Factors
DES10.03 • Valu'" Engine.,,.ing Recommendations
ENV·70.0l - Drainage ton(erns wilh existing infrutructure
CNS 900.01 - Un-Identified Change orders
CNS 70.01 · Material Availability
STG 10.01 - Mlnw rehab/maintenance to existing structures
DES 10.02 - Outside Shoulders with Barrie,s
DES 10.01 -Added scope beyond 10% Design
STG 20.01 - Lack of geotechn!ca! Information
Ull 20.01- Utility Conflicts
CNS 90,01 - Adequate staging a,eaia
Ii Pre-Response Risk Cost Impact
!.J Pre-Response Additional support Costs
Ll Post-Re,ponse Risk Cost Impact
,., Po<t-Response Additional Support Costs
-$7 .60 ~)-~,.~~~ . . . . - $1.14
Expected Cost Im pad[$ million,)
:iiiiJ $U< fii $0.60
~ $0.60
~ $0.'6
~ $0.56
lil $DAO
l!1 $0.40
Ii $0.35
j $0.35
ii $o:z6
"iii. $0.26
iiiJ $0.86
~ $0.11
l so.04 l so.o3 I $0.M
i $0.02
Figure 11: Top Cost Risks
MDT Taft West CRAVE Report
Analysis of Results - 90 Februart 2019

Rm* 0£PA/1T!'c/, T Ol'Ti'.AiiSPOITTA [1()/1
Top Schedule Risk Factors
STG 20.01-lackof geotechnical information !
ENV 70.01 - Drainage concerns with existing infrastructun~
0.0
0.30
0.5
0,75
0.75
1.0
1.50
1.5 2.0
El Pre-Response Expected Value Schedule Impact
B Post-Response Expected Value Schedule Impact
Expected Schedule Impact (months)
Figure 12: Top Schedule Risks
By engaging in this cost risk analysis process to evaluate the project, the overall expectations of cost and schedule were quantified in relation to identified risks, the associated impacts of those risk elements, the use of a Risk-Management Plan to respond to those risk elements, and impacts to the project bottom line of creating value for the project.
Through this process, value can simultaneously be created for the project through the VE portion
of the workshop, while risks can be proactively monitored and controlled to reduce potential impacts to the project cost and schedule.
MDT Taft West CRAVE Report
Analysis of Results - 91 February 2019

The risk register provided in the Appendix can serve as a risk tracking too! and contains columns for risk response and planning. The project team should assign a "risk owner" to track and record the effectiveness of the strategies and any changes to the project risk profile, as follows:
• Document the response action by describing the action, the work activities it will affect, and the cost of the response action.
• lde'ntify the person(s) responsible for successful implementation of the response action.
• Document whether response actions have a positive or negative effect on achieving project objectives in the Risk Management Plan.
• Consider the time impacts of the response action and how the risk response may affect the overall project and/or other risks.
CRAVE Process Summary The cost risk analysis provided an evaluation of the estimated project total cost and schedule and included four major steps.
The first step was to establish a base cost and schedule and then identify and quantify the major risk elements and how they impact cost and schedule. The second -step was to identify how to respond to the highest likelihood and impact risk elements. The third step was to quantify the effects of implementation of the risk response strategies. The final step was to quantify the effects on project cost and schedule by implementing the VE recommendations.
The information provided by a CRAVE Study gives valuable tools to project managers to help them deliver a Successful project on time and within budget. When a multi-disciplined team of experts is assembled in a workshop environment, maximum benefit can be achieved by using this combined cost risk assessment/value engineering process.
MDT Tiift West CRAVE Report
Analysis of Results - 92 February 2019

Appendix ■ VE Recommendation Approval Form ■ Risk Analysis Sheets
• CRAVE Study Agenda ■ CRAVE Study Attendee List ■ CRAVE Study Report Out Presentation ■ Value Engineering Process
MDT Taft West CRAVE Report
Appendix - 93 February 2019

MDT Taft West CRAVE Report
This page is intentionally left blank.
Appendix - 94 February 2019

VE Study Recommendation Approval Form Project: UPN 9487000 Taft West Project
Approoed
Recommendation YIN
1 Pavement Section
2 Performance Engineered Mix Design
3 Stringless Paving
4 Binder
5 Dowels
6 Maintenance of Traffic
Totals
" ~ • w
VE Study Date: February 2019
FHWA F.unctional ·Benefit·
" 0
• w E VE Team Estimated Actual Estimated 0 E 0
~ 0
~ Cost Avoidance Cost Avoidance e ~ Of Cost Added or Cost Added • ·, 0 0 0 0 0 0 w 0 ~
✓ $7.01M
✓ NIQ
✓ NIQ
✓ $0.32M
✓ $0.33M
✓ $0.30M
6 $7.96M
Please provide justification if the value engineering workshop recommendations are not approved or are implemented in a modified
form.
The Project Manager will review and evaluate the VE Team's recommend.ation(s) that are included in the Final Report. The Project Manager shall complete the VE Recommendation Approval form that is included in this report.
MDT Tai\ West Appe.sd;Y ·% CR.AVE Repo~ Fet,~ary 2019

For each recommendation that is not approved or is modrried by the Project Manager, justification needs to be provided. This
justification shall include a summary statement containing the Project Manager's decision not to use the recommendation in the project.
The completed VE Recommendation Approval form including justification for any recommendations.not approved or modified shall be sent to the MDT State Value Engineer by October 1 of each year so the results can be included in the annual Value Engineering
Report to FHWA.
Signature Project Manager Date
Name (please print)
FHWA Functional Benefit Criteria
Each year, State DOT's are required to report on VE recommendations to FHWA. In addition to cost implications, FHWA requires the DOT's to evaluate each approved recommendation in tem,s of the project feature or features that recommendation benefits. Jf a
specific recommendation can be showri to provide benefit to more than one feature described below, count the recommendation in
each category that is applicable.
Safety: Recommendations that mitigate or reduce hazards on the facility. Operations: Recommenda~ons that improve real•tirne service and/or local, corridor, or regional levels of service of the facility.
Environment: Recommendations that successfully avoid or mitlgate impacts to natural and or cultural resources. Construction: Recommendations that improve work zone conditions, or expedite the project delivery.
Right-of-Way: Recommendations that lower the impacts or costs of right-of-way.
MDT Taft West App~r<ic<- 96 CRAVE Report F~brun,y 2019

Risk Analysis Sheets
I Project I Taft West I I Risk IO I CNS 10.01 I
I Access to Rest Areas
I r,0. +,:V:\+\8:\i;S•;J&,tli),4)'''/i:IJ;:;{/:C1\:,:;t;i4'..:"''-*'i'"t'iNJPre~ReSl'.IOnSEf.QuatitificatiOfl'. '<'."'',"''"'• ;,-",·,,_,-"','-•J,.,Ci• Y,]fi)i, ->--"""'··nt ,}.'!?!,{
I Probability I Low I MostLlkelyl High I I Ri:ikStatus I I Activity Impacted I I 25% I I Active I I Construction I I Cost(SM} I $0.20 M I $0.23 M I $0.25 M I j Cdtii:al Path? I I EV Cost I EVSchcd I I SchedulefMol I I I I I I $0.06 M I 0.00 Mo. I
At this level of design, access to rest areas are not included. But if access to both rest areas are required throughout project, crossovers will need to be built.
Post•Resoonse 'Quantificauo·n·-,_.
I ProhabUJty I Low IMostUkclyl High I I RlskSlatus I I Risl10wncr I I 5% I I Active I I
I Cost [SM] I $0.20 M I $0.23 M I S0.25 M I I Strategy I I EV Cost I EVSd1ed I I Schcdulc[Mo} I I I I I Avoid I I S0.01 M I 0.00 Mo. I I Cost to MitiJ?atej I
Consider dosing rest area for season. Next services about 15 miles away. Similar to 2011 crack
February 21, 2019
MDT Taft West CRAVE Report
and seat project.
Risk Register Pa9e1of15
Appendix - 97 February 2019

I Project I Taft West I I Risk ID I CNS 10,02 I Traffic Barrier
%Y:$_f;;;;i: «?Jo,.s\·ti't-:,\,'fS-1:t /;,it.sc/c\, iXi:'-'U/J!:P.r(!'-Re~j~J1se,Qu'ahtifiCatiOn ,;:.;;\ ,_:}f:f._'-:/:,,i<) j,,B;ff,¥1!:c;i_:;ii_ifa_C<,!U\c;•:fs'c\).c'. ,;,,,;,
I Probability I Low I Most Likely I High I I Risk Status I I Activity Impacted I I Active I I Construction I
I Cost[SM} I I I I I Critical Path? I I EV Cost I EVS~hed I I SchcduldMo] I I I I I SO.OD M I 0,00 Mo. I
The risk is that prccast traffic barrier has historically had durability issues in the harsh conditions without adequate/appropriate curing/handling. This may require additional
specifications and oversight that could add cost to the project. Watch Hst risk.
P<ist,ReSponse·Quantiffcatlon .. I Probability I Low j Most Likely I High I I Risk Status I I Risk Owner I
I Active I I
I Cost{SM} I I I I I Strate©:'. I I EV Cort I EVSchcd I I Schedule (M"} I I I I I $0,00 M I 0.00 Mo. I I Cost to Mitigate! I
Possible response strntegies include: Include Specifications for µrecasting. curing and oversight
Separate contract ahead of this project to establish additional curing time prior to shipment. Require installation as last order of work, use what is out there for temporary barrier,
February 21, 2019 Risk Register Page 2 of 15
MDT Taft West CRAVE Report
Appendix - 98 February 2019

I Project I Taft West
I I Probability I Low
I 75% I I Cost {SM) I $0.50 M
I Schedule(Mo1 I
I I Risk ID I Material Availability
I Most Likely I High I I Risk Status I I Active I
I S0.75 M I $1.00 M I I Critical Path? I I I 11
I I I I
CNS 70.01
Activity Impact<:d I Construction
EV Cost I EV Sched I $0.56 M I o.oo Mo. I
I
I
There may be a long haul associated with aggregate materials used for paving that could.add a premium project cost.
"•'--ii_.:·-·-" '--.Post-Rosnor.Se;Quantification ·----- ··
I Probability I Low I Most Likely I High I I Risk Status
I 75% I I Active
I Cost[SM) I $0.50 M I $0.75 M I S1.00 M I I Strate&!'.
I Sch<:dule [Mo] I I I 11 I Cost to Mitigate I I
I I I I I I
Risk Owner I ======== EV Cost I EV Scl1ed j S0.56 M I 0.00 Mo. I
Reuse as much material as possible. Post VE ls not generating as much material
February 21. 2019
MDTTaf!West CRAVE Report
Risk Register Page 3 of 15
Appendix - 99 February 2019
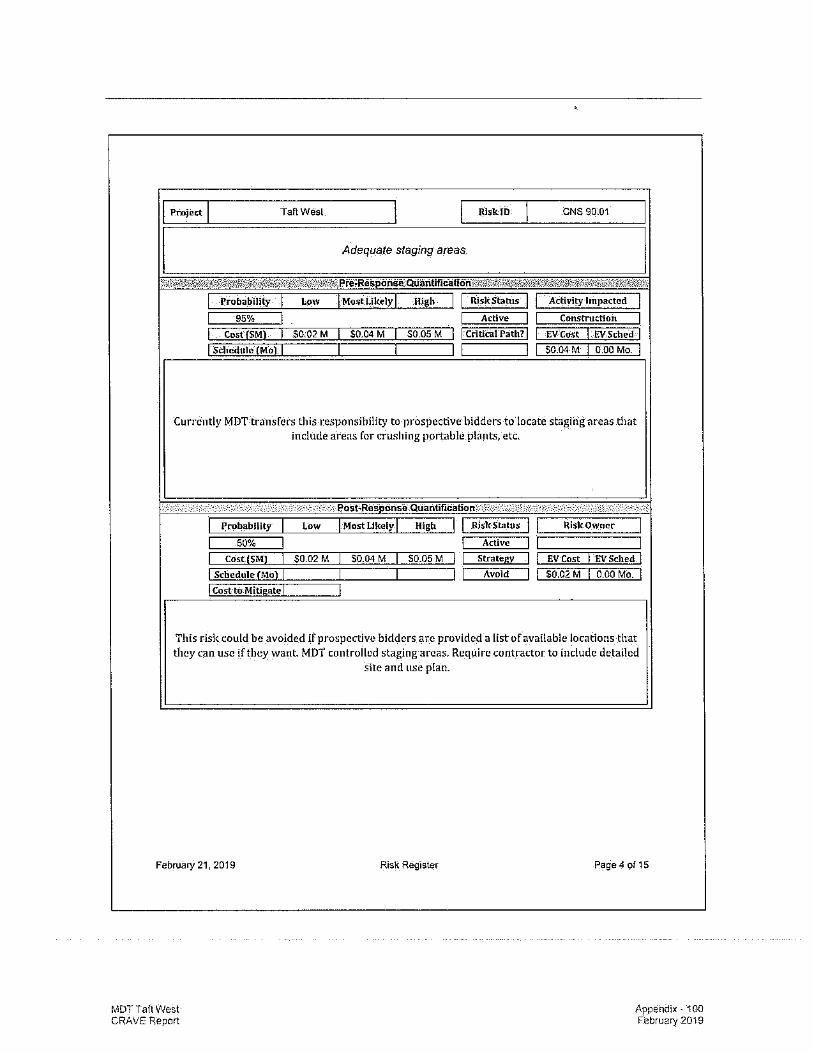
I Project I Tart West I I Risk ID I CNS90-01 I
I Adequate staging areas
I ,-.;.;;'!9V•,,·;i(.:x LQ:f;:';1'4[Sjs'.}(0id'i!fiit\:/ff,/ :\?.§ic'.~'.J:\t}sPl'e::RliS1lClt11.'i!iQUilntificiltiOn Y:d):1-t ?i\'ii1Zif'if.if;.(i;'f;1/f(W\if(.{1/#\fi/ZC;:J.\;/Jl:!A1/!if!
I Probability I Low IMostLikelyl High I I Risk Status I I Activity Impacted I I 95% I I Active I I Construction I I Cost {SM) I $0.02 M I $0.04 M I $0.05 M I l·critical Path? I I EV Cost I EVSched I I Sclmdule{Mol I I I 11 I I $0.04 M I 0.00 Mo. I
Cun'ently MDT transfers this responsibility to prospective bidders to locate staging areas that include areas for crushing portable plants, etc.
', ·._ ' __ -,.. '" '"·-· eost•Re'sPOnsO QuantifiCation·-- ·-- "· ·--.-:_· _._,,
I ~robability I Low I Most Llkely I High I I .RiskStalUS I I Risk Owner I I 50% I I Active I I Cost[S:MJ I S0.02 M I $0.04 M I S0.05 M I I Strategi I I EV Cost I EVSched I I Sciledule[Mo] I I I I I Avoid I I $0.02 M I 0.00 Mo. I I Cost-to Mitigate I I
This risk could be avoided if prospective bidders are provided a list of available locations that they can use if they want MDT controlled staging areas, Require contractor to include detailed
February 21, 2019
MDT Taft West CRAVE Report
site and use p!an.
Risk Register Page4of15
Appendix• 100 February 20-.S

I Project I Taft West I I Risk ID I CNS 900.01 I
I Un-Identified Change orders
I @!!~3:/!NiiS'. i&'W0i!cV!it-¥'3J/,t¾-teux:;;;;;,'!(ti!!t1'i,"slii!!f!te-ResliOilse:.auantifiC:atio·n¥11';:.'ft.\t1%0'+'itKhi½it&ifift<'4/W,¥e?0\'Am:t&ccit!c,
I Probablll1:y I Low I Most Likely I High. I I RislcStatus I I Activity Impacted I I 75% I I Active I I Construction I I Cost(SM} I $0,60 M I $0.80 M I $1.00M I I Critical Path?-1 I EV Cost I INSched I I Scl,edule fMol I I I I I I $0.60 M I 0.00 Mo. I
There ls a risk of construction change orders not yet identifide in the cmTent risk profile. A typical construction project has 2%•5% for construction change orders.
· .-,.-::-,-.Poi.t•Res nso"Qualitification ::,-:·-' ' ··--·-·-.: -c:_,,,,-_._;_,-,.•.:_
I Probability I Low I MostLikelyl High I I Risk Status I I Risk Owner I I 75% I I Active 11
I Cost{SM} I $0.60 M I $0.80 M I S1.00 M I I Stralelll'. I I EV Cost I EVSched I I Schedule {Mo) I I I I I Miti~te I I $0.60 M I 0.00 Mo. I I Cost to Mitll(atel I
Hold a res eve for un-known un-knows
February 21, 2019 Risk Register Page5of15
MDT Taft 1Nest CRAVE Report
Appendix - 101 February 2019

I Project I Taft West I I Risk ID I CTR40.02 I
I Merl<el Cond;t;oos I ,i1if;;;:C'.\is1'.i;%"i·,tfki-%'.0i\ili!f-Phi'-Re~ri$1'!'.QllailtifiC.iti011:½:Pl'il?iJi$½"/1~';)j"&;',%J01\\id;iiS:?c,'t+f\1'F:A"ik'i:l;\\\to:i,J <c,;:'{:,;,)<;iS/;'''f'C>/, ){{/:'},
I Probability I Low IMo.stLikelyl High I I RiskSiatus I I Activitylmpaded I I I I Inactive I I Construction I I Cost{SM) I I I I I Critical Patlt? I I EV Cost• I EVSdted I I Schedule fMol I I I I ' I $0.00 M I 0.00 Mo. I
Adequate bidder pool, labor, equipment, and material availab_i!ity. Trucking could become an
I Probability I I I
I Cost{SM} I I Schedule {Mo] I I C11stto Mlthrntel
Febniary 21, 2019
MDT Taft West CRAVE Report
issue. Watch lis_l risk.
· ·----<:-:Post.,ResDonso Quantification·--·---·--·
Low [Mostl.il{clyl High I I Risk Status
I Active
I I I I Stratcgx
I I I I
Risk Register
I I 11 I I I
Risk Owner I EV Cost I $0.00 M I
I
EVSched I 0.00 Mo. I
Page 6 of 15
Appendix - 102 February 2019

I Project I Taft West I I Risk ID I DES 10.01
I
I Added scope beyond 10% Design
I ?,i,f,,9'if'.-;i'>'.'if£!dti;43_i§Pr'e"-ReS~nse•Qtiiihtlfh:at!Ori'!;t,t~:':.{e&:if¥?i;,t s;,n> !i@i!iiN!'i'c!i;!i\ttc{'{i'!li ·•i)''/i!/'W/·dfiJH%f18')-\fi'Yt)'!l·±:17'{"Z
I Probability I Low jMostLllmlyj High I I ·RJsk Status I I Activity Impacted I I 50% I I A(liVl' I I Construction I I CoSt(SM) I S0.10 M I SO.SOM I $1.00M I I Critical Path? I I EV Cost I EVSched I I Schedule (Mo) I I I I I 50.26 M I 0.00 Mo. I
The risk wilh this type of project ls that it would not be necessary lo return to this section of road for potentially 40 years. Therefore, there may be added elemenls requested by
nrnintenance, wildlife, environmental, or others that we fix while we're there.
·.,.,. _ _, __,.. · -· POst-RespOn'se-QUaiiUfication'-. ,.··---e·.,--,':.;.' --··.;_' .-_::,
Probability I Low IMostLlkelyl lligh I I Risk Status I I Risk Owner I 50% I I Active I I Design PM I
Cost {SM) I S0.10M I SO.SOM I 51-00M I I Stratelll'. I I EV Cost I EVScl1cd I Schedulc{Mo} I I I I I Mitigate I I S0.26 M I 0.00 Mo. I Cost to Mitigate! I
Evaluate enhancements or added scope to determine if it will have an impact on con~truction
February 21, 2019
MDT Taft West CRAVE Report
duration or if it has independent utility.
Risk Register Page7of15
Appendix - 103 February 2019

I Project I Taft West I I Risk ID I DES 10.02 I
I Outside Shoulders with Barriers
I '.-\?fff,§.1/!)Y.NP'.%\'!fi?.Xff!il!fff,ff§!,'J:iJ,':,.'.{/,% iW,\\\ ;:p~~ilSi:IQrtise',Ql,Jafltifit:atlOn'?Yf/t;l!(f;.+!,;,JfX,fP/4'.(fJ?Y!.·?Y{i;,/Xi(/s'f;/f'!l'fif}'.(fj\)ti;/J{;
I Probability I Low IMostLikelyl lligh I I Risk~tatus I I Activity Impacted I I 95% I I Active I I Constrnction I I Cost{SM) I $0.20 M I $0.35 M I $0.60 M I I Criticil Path?.! I EVC0$t I EVSched I I Schedule (Mo) I I I 11 I I $0.35 M I 0.00 Mo. I
Where barrier is on the outside shoulder it needs to be widened from 10' to 14' if not pinned or 10' to 12.S' lf pinned to acomadate a surface for the barrier to sit on. Currently at this levd of
design there is not a provision for the two to three miles of outside barrier
,,.',<:--:· _,-,-. - ·-: -POst-RaspOns1f_Quarltification_:_-/·:·:- ·
I Probability I Cow j MostUkelyl High I I Risk Status I I Risk Owner I I 95% I I Active 11 I Cost(SM} I $0.20 M I S0.35 M I S0.60 M I I Stratci;)! I I EV Cost I EVSched I I Schedule (Mo] I I I I I Accel!t I I S0.'35 M I 0.00 Mo. I I Cost to Mlllgatel I
Dcvcloµ design detail for outside barrier placement
February 21, 2019 RisK Register Page 8 of 15
MDT Tall West CRAVE Report
Appendix - 1 04 February 201-9

I Project I Taft West I I Risk IO I DES 10.03 I
I Value Engineering Recommendations
I $.'''"· :fJt,fBY("i'iiW-'i?.i;.Ki :,t;J,',S,'l:~\i,?.'.'itf'.-'.1Ut1(YftP~eS'nQnsli!;Quantificiltion0\Wi1-ifi;\,1f;pf@'fiiicS-'0\Gf .t&,1.tiJ;f/,;,ni " ' '
I Probablllty I Low I MOstLikely j fllgh I I Risk Status I I Acti',;'ity hnpactcd I I 0% I I Acth'e I I Construction I I Cost [SM] I $0.00 M I $0.00 M I $0.00 M I I Critical Path? j I EV Cost I EVSched I I ScheduldMo) I I I I I $0.00 M I 0.00 Mo. I
----·, :-.-PQSt-RoSnonse'Quantification· , __ -,__,_ · ·
I Probability I Low I Most Llkelyl High I I RiskSt..·nus I I Risk Owner I I 50% I I Active 11 I
I Cost(SM) I -$7.60 M I -$7.60 M I -$7,60 M I I Strateg:t I I EV Cost I EVSd1ed I I Schedule (Mo) j I I I I Acceet I I -$3.80 M I 0.00 Mo. I I Costto Mitigate I I
VE recommendations 1-6 total $7.6M of avoidance assume up to 50% implentation
February 21. 2019 Risk Register Page 9 of 15
MOT Taft West CRAVE Report
Appendix• 105 February 2019

I Project I Taft West I I Risk ID I DES 50.01 I ITS
i!/;-tA~rsxt~\;0!+0-;;;·<cl';.W;;Fi!i\i!J):f'ic".}¼%8>'.½';;V;,xtr;J~re1ReSPOns1fQuantiffi::'atlo'n•;;ft\Fif:i"1@?\Pi'J ,,,;G°c;);w,\-g,fo;_,0Jh'GHN>'\tisls";);
I Probability I Low I Most Likely! High I I Risk Status I I ActMty lmpact~d I I Active I I Curistruction I
I Cost[SM] I I I I I-Critical Piith? I I EV Cost I EVSched I I .Scheduh:, {Mo) I I I I I "" I I $0.00 M I 0.00 Mo. I
The risk is thar'.my and all of this may need to be upd;ited to current technology. Current base estimate does not include ITS. Currently a VMS (variuble message sign) neilr the summit, weather stations and data RW!S, traffic camera. Hardwired currently because there is no
coverage there. This risk ls not quanlifiahle at this time, watch list.
Post~csnonse·Quantificatl6ri >>-· ·
I Probability I Low I Most Likely! High I I Risk Status I I Risk Owner I I Active I 1 I
I Cost[SM} I I I I I Strateg:,: I I EV Cost I EVSched I I Schcdule{Mo) I I I I I Miti;ate I I $0.00 M I 0,00 Mo. I I Cost to Mitigate I I
Accommodate wilh empty conduit that allows for future ]TS state-wide project district wide.
Februs,y 21, 2019 Risk Register Page10 □115
MDT Taft West CRAVE Report
Appendix - 106 February 2019

I Project I Taft West I I Risk-ID I DES 900.01 I Opportunity to reuse existing roadway materials
\-1!, ".~1ci)l';t;N;\\k.0iVYt\\>i'.i'."1'P,i 1?2/iit\·FFitYJf/ctS.,e~esnonse\QUa"i'ltffltiatlOnTf;,§'a;%Iti:'>:-i ;,a;)\,g,,,-,,~·dftt,kN·,'/,_1 !c,%;;">\r6~i1c);'\
I ProbabHlly' I Low I Mo~-i: Llkcly I High I I Risk Status I I Activity Impacted I I 50% I I Inactive I I Construction I I -Cost [SM) I -S10.00 M I -$3.00 M I -S1.00 M I I Critical Path? I I EV Cost I EVSched I I Schedule(Mo} I I I I I SO.OD M I 0.00 Mo. I
The current roadway section is pl.mt mix with concrete overlaid with plant mix. 0.40 ft. There is an opportunity that that structural section could be reused in the new pavement section.
--:·,_-·-.:_-"·"" ·-·>·- _: ·i::: .• ,_.,'POst;Res·oonse.QUahtificatlon · :: -· · · ·
I Probability I I 50% I I Cost (SM} I I Sclledule (Mo} I I Costto Mitigate!
Februa,y21. 2019
MDT Taft West CRAVE Report
Low
-$10.00 M
IMostLlkelyl High I I Risk Status
I Inactive
I -$3.00 M I -$1.00M I I StralCfil'.
I I I I I
Risk Register
I I I I
I I I I
·:;· .. ,-·_."·""
Risk Owner I EV Cost I SO.DOM I
I
EVSched I 0.00 Mo, I
Page 11 of15
Appe11dix - 107 February 2019

I Project I Taft West I I Risk ID I ENV70-01 I Drainage concerns with existing infrastructure
,.(!:, ;,i<+:1t/2C¥XF'i?YA'f/i'Ytf: '1!':'+?"'J);':i'i''s'i/)j'1;,\t'.t#•' ;-Pl'e!Rei.". iliutJQUantificliti0rii{i?H1:l.\fif,¼HC;?;ffiN0.\1\!n\@.!lii'.V,N;f/Cfu)if@(i'-:J:f,tS:
I Probability I Low I Most'Likely I liigh I I Risk Status I I Activity Impacted I I 100% I I Active I I Construction I I Cost [SM) I $0.50 M I $1.00 M I $1,25 M I I Critical Path? I I EV cost I EVScbed I I Sclfodule(Mol I 0,50 Mo. I 0.75 Mo. I 1.00 Mo. I I Yes I I $0.96 M I 0.75 Mo. I
At this level of design there is a risk of repair, re-line existing drainage infrastructure. $1.1Min dr.iinagc costs in base estimate that includes pipes and drop inlet~~ If re-lining or replacing any major drainage structures it will add significant costs and construction duration to this project. Recent prclimiuary drainage report recommends replacement/lining or tipsizing of some of the
significant drainage crossings not covered in base estimate. Assume additional SlM to be incorporated in the final design. Lining wouldn't be critical path, but replaccment/upsizing
would be critical path. Consider fish windows.
---.,,._.Post-1:!:eS nse .Quantification ·-- --- · ·
I Probabillty I Low I Most Likely I High I I Risk Status I I Risk Owner I I 100% I I Active I 1
I COst[SM} I $0.50 M I S1.00M I S1.25 M I I StrategJ'. I I EV Cost I EVSched I I Schedule{Mo) I 0.50 Mo. I 0.75 Mo. I 1.00 Mo. I I AcceEt I I $0.96 M I 0.75 Mo. I I Cost to Mitigate I I
Consider project next.year for major crossings to be done during dry months and not during pavement construction. Avoids delaying pavement project.
Februa,y 21. 2019 Risk Register Page 12 of 15
MDT Taft West CRAVE Report
Appendix. 108 February 2019

I Project I Taft West I I Risk ID I STG 10.01 I Minor rehab/maintenance to existing structures
o?!ht :A&'.'.'i 50i!t;'!:f:':-i4:i'!N-'£zij\\i';{/)];}j:'0£4:;.%,Wi.\{Pri-Re~nse·:QUlilltlflcatlOh',;PfY..i!i:!1!ieit1,\fF :?Y<'if'!!;r;:-0'!R1¼0.1t#?:!ZN0J/'6~
I Probability I Low I Most Likely I High I I Risk Status I I Activity Impacted I I 85% I I Active I I Construction I I Cost [SM} I S0.10 M I S0.50 M I $0.75 M I I Critical Path? I I EV Cost I EVSched I i Sched11le[Mo]-I I I I I 50.40M I 0.00 Mo. I
Existing structures in project vicinity may require some rehab. Opportunity to tie to other programed work to reduce overall program cosL May include deck seal, expansion joints,
barrier, o~her bridge rehab work while lhe road is dosed. Four bridge structures Lhat may need rehab/maintenance within project limits. Received information that at leasl one bridge rail is in need of repair. Somewhat dependent on how well past polymer overlay works on olher projects.
·-· Pcist'-Rl!Shonse Quarillficiltion ._. ;e·--· -- --'-.;_-.-: ,. .. __ ,, ______________ .
I Probability I Low I Most Llkely j High I I Risk Status I I lllilkOWller I I 85% I I Active I I
' I Cost[$M) I S0.10M I SO.SOM I S0.75 M I I Strategr I I EV Cost I EVSd1ed I I Schedule {Mo} I I I I I Accept I I S0.40 M I 0.00 Mo. I I Cost to Mitigate! I
Coordinate with JOC (lob Order Contract] to take advantage of this project'~' long-term traffic control. Could minimize this risk if found other funding sources are available.
FelJ11.1ary 21, 2019 Risk Reglsler Page 13of15
MDT Tall West CRAVE Report
Appendix - 109 February 2019
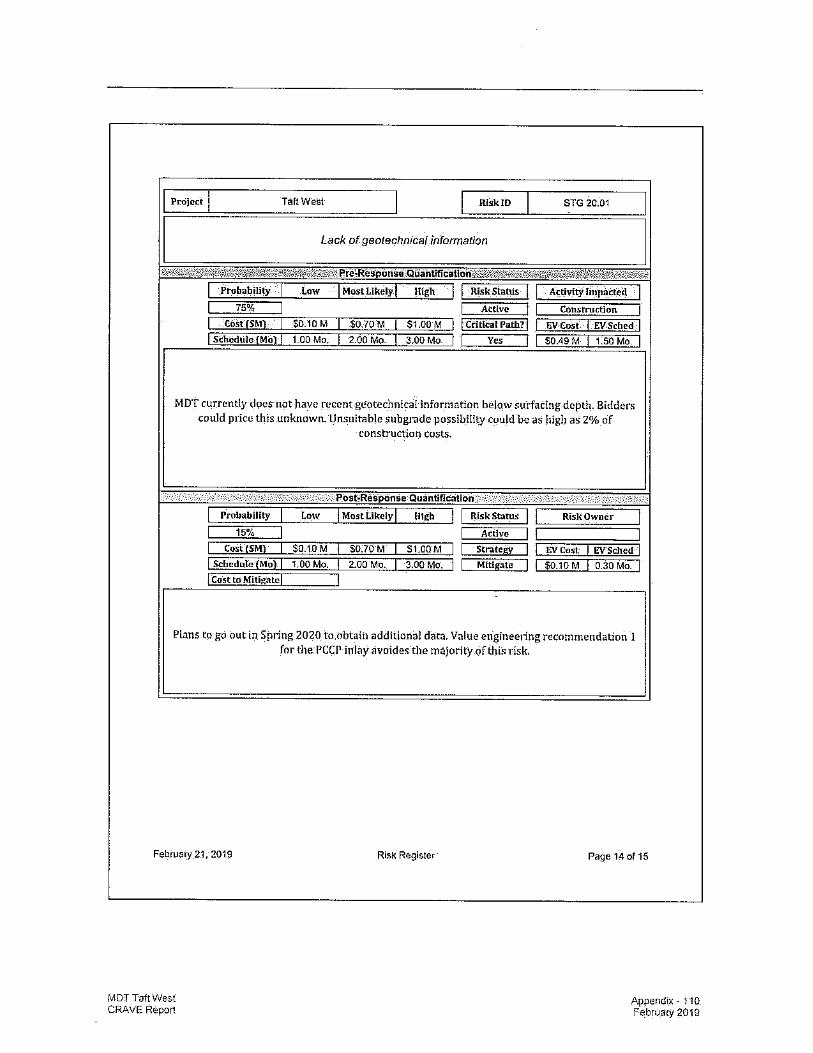
I Project I Taft West I I Risk ID I STG 20.01 I
I Lack of geotechnica/ information
I ilf'i!!/cii>Yf'Iih :';i(0J)'L½:;tW(&)i01..(';e,'li!sJ W?;i;-;f:J-;% IPre:.RElSf'onsllcQU.illtificiitioritu'-Ni!Ji,til0/i2ik0 i\.iili'?B:f'.J:.-iiJylif):J,q',&,s! \';;0±':½f':1
I Probability I Low I Most Likiily I 1-ligh I I Risk Status I I A1;tivity Impacted I I 75% I I Active I I Construction I I Co5f[SM} I $0.10 M I $0.70 M I $1.00 M I I Critical Path? I I EV Cost I EVSched I I Schedulc{Mo) I 1-00 Mo, I 2.00 Mo. I 3.00 Mo. I I v~ I I $0.49 M I 1.50 Mo. I
MDT currently doen10t have recent geotechnica! information below surfacing depth. Bidders could price this unknown. Unsuitable subgradc possibility could be as high as 2% of
construction costs.
Post,ReSponSe QuantifiCatlon.i- -·-
I Probability I Low j Most Likely I High I I Risk Status I I Risk Owner I I 15% I I Actlve I 1
I Cost(SM] I $0.10 M I S0.70 M I S1.00M I I Strategy I I IN Cost I EVSched I I Scbcd1.de(Mo) I 1.00 Mo. I 2.00 Mo. I 3.00 Mo. I I Mitigate I I $0.10M I 0.30 Mo. I I Cost to ,.liti~atcl I
Plans to go out in Spring 2020 to obtain additional data. V.ilue engineering recommendation 1
February 21, 2019
MDT Taft West CRAVE Report
for the PCCP inlay avoides the majority of this risk.
Risk Register Page 14 of 15
Appendix - 110 Fe.bruary 2019

I Project I Taft West I I Risk ID I UTL 20.01 I
I Utility Conflicts
I ,, .. ,.,,.;,;;~,+,\:.,.,,;hrY;\;<,.,vi,>?1:s,:~,.A,j;, ,)"(;-;SW:i&failiftPl'e~es 'n"s!e.iQWintifici\tlon't?t\i:,:r;,)0·:1s1\+'i:iS:;mf%RM,itsi?,M;4:;s;w,ss--'0l%h
I Probability I Low I Most Likely I Higl1 I I RlskSt.atus I I Activity lmpact,ed I I 75% I I Active I I Construction I I Cost(SM) I S0.02 M I S0.05 M I S0.10M I I Crltlcal Path? I I EV cost I EV Sd1ed I I Schedulc(Mo) I I I I I $0.04 M I 0.00 Mo. I
Existing fiber optic, drainage, underground power for chain-up/chain removal areas, overhead utilities, and MDT utHlties between rest areas. There is a fiber optic line that ls not clearly
identified in As-Builts that may have conflicts with excavation. The risk is it would need to be protected in place once identiffed and could add additional construction costs to work around.
Fiber Optics takes a while to splice.
":O'-.'•Post~Res·nohse Quantification'-"···
I Probability I Low I Most Likely I High I I Risk Status I I RiskOwnei- I I 50% I I Active I I Cost{SM} I $0,02 M I SO.OS M I S0.10M I I Strale&J:'. I I EV Cost I EVSched I I Schedule [Mo} I I I I I Mitigate I I $0.03 M I 0.00 Mo. I I Cost to Mitigate I I
Begin coordination with utilities. Need to conduct field surveys to identify if there will be conflict~ with excavations. If so, include protect-in-place clause/specification. Revised roadway section from VE recommendation 1 reduced exposure in roadway but stilt have risk in areas of
February 21, 2019
MDT Taft West CRAVE Report
drainage
Risk Register Page 15 of'15
Appendix - 111 February 2019

January 15, 2019
Value Engineering Study,
Taft West Project
Dear VE T earn members,
Greetings, this memo is to start laying some of the expectations for the upcoming CRAVE Study for the Taft West project February 11 117 --15th
, 2019. I'm looking forward to working with you on this endeavor.
If you have any questions, please direct them to Ken Smith via e-mail at [email protected] or call (360) 451-2527.
What is CRAVE?
The CRAVE process includes a baseline risk assessment, value engineering and risk response, risk analysis on response strategies, and tracking, monitoring, and risk management. The risk assessment is performed first and the quantified results are then modeled. As part of the VE Study, the team develops recommendations to mitigate and/or avoid the identified risks. The risk model is run a second time with the value engineering recommendations and mitigation strategies included. The modeled results provide the ability to monetize the schedule impacts. The modeled results will provide information for decision support on both cost and schedule.
CRAVE Study Location The CRAVE Study will be at the Days lnn hotel conference room - 2001 Prospect Ave, Helena, MT 59601
What to Bring Be sure to bring your normal tools of the trade, (e.g., calculator, laptop computer, etc.). Bring a creative and open mind. CRAVE Studies are a lot of work, but if you bring your expertise and an open mind you will have a good time and a rewarding experience.
Ground Rules A CRAVE Study includes the use of the VE Job Plan which is a prescribed process that has been proven over many years to produce the best results. This process needs the team members to be fully engaged in the study during the week.
In order to maintain our schedule and provide the best results to the project team I would ask that we follow some basic ground rules;
1. Please be prepared to attend all five days. You were selected to assist on this team based on your expertise. If you cannot be in attendance for the entire time then please contact me prior to the study so we can make the appropriate arrangements.
When team members leave part way through, or come and go frequently, the CRAVE team can lose its momentum and cohesiveness.
lvlDT Tafl"West CRAVE Report
Appendix - 112 February 2019

2. Please turn your cell phones to vibrate mode during the study. Unless it is information to assist the team, please try to wait until breaks to return phone calls, check on messages or sort through e-mails.
3. No Dress ·code. I want everyone to be comfortable. The appropriate dress is what some would call business casual (No ties required).
4. If you have a laptop please bring it along. I have found most team members are more comfortable developing their write-ups on a computer. The facility we are in will have wireless internet, however; the memory stick has become the network of choice for sharing files.
5. Our success will be evaluated based on the level of contribution that we bring to the project. Remember that the goal of any CRAVE Study is to "add value" to the project and saving money is just a by-product. We want to make recommendations based on solid engineering judgment that will result in an improved overall project with reduced risk.
I'm looking forward to working with you on this CRAVE Study and I really appreciate each of you blocking time out of your busy schedule to participate. Please don't hesitate to call or e-mail me if you have any questions.
Ken L. Smith, PE, CVS Vic;e President
Senior Value Engineering & Projec;t Risk Manager
HDR
905 Plum Street Suite 200, Olympia, WA 98501-1516 M 360-451-2527 ken.I [email protected]
MDT Tait Wes\ CRAVE Report
Appendix - 113 February 2019

Monday, February 11 th
Days Inn hotel conference room - 2001 Prospect Ave, Helena, MT 59601
8:30 am
8:45am 9:00 am
10:00 am
12:00 pm 12:30 pm
1:30 pm
2:00 pm
3:00 pm
5:00 pm
8:00 am
12:00 pm
1:00 pm
5:00 pm
8:00 am
8:30 am
12:00 pm
1:00 pm
2:00 pm
5:00 pm
8:00 am
12:00 pm
1:00 pm
2:30 pm
4:00 pm
5:00 pm
8:00 am
10:00 am
12:00 pm
MDT Taft West CRAVE Report
Welcome and Introduction
Overview of CRAVE process
Project Team presentation of the project What are the goals and objectives? What are the constraints and controlling decisions? What are the stakeholder issues Present project costs and schedule
Begin Risk Elicitation
Lunch
Virtual Site Visit (Google Earth)
Define the Performance Attributes & Attribute weighting Function Analysis - Define functions
Complete Risk Analysis - Conference call with IDT
Adjourn for the day
Tuesday, February 12th
Creative Phase
Lunch
Creative Phase moving into Evaluation Phase
Adjourn for the day
Wednesday, February 13th
Any new ideas from overnight?
Evaluation Phase
Lunch
Continue Evaluation Phase and move into Development Phase
Design team check in and risk response strategies
Adjourn for the day
Thursday, February 14th
Continue development of VE recommendations
Lunch
VE Team Review Recommendations
Define and evaluate the performance of recommendations
Revisit risks with VE recommendations
Adjourn for the day
Friday, February 15th
Team walk through of presentation
Presentation of Findings
Adjourn for the week
Appendix• 114 February 2019

CRAVE Study Process Step 1: Baseline Risk Assessment
e) Review baseline cost
f) Review baseline schedule
g) Identify risks related to baseline project
h) Assess and quantify risks in terms of project's cost and schedule
Step 2: Value Engineering & Risk Response
a) Develop value engineering recommendations that further mitigate or avoid high risk elements
b) Develop recommendations that add value by modifying project scope and/or schedule
Step 3: Risk Analysis on Response Strategies
a) Identify risks related to respons~ strategies
b) Assess and quantify threats and opportunities in terms of project's cost and schedule
Step 4: Tracking, Monitoring, and Control (performed post CRAVE study)
a) Identify risk owners, monitoring frequency
b} Continuously update risk management plan
c} Document and report progress
d) At key milestones, update cost and schedule
Pre-Study/Prep Meeting
Validate cost estimate/project schedule Once the team is familiar with the project, they set out to validate the construction cost estimate. The estimate is evaluated line by line with group discussion about the unit cost for each item and the quantities involved. If the team feels that adjustments are necessary, they are made to a duplicate estimate so comparisons can be made when this task is complete. The reasons for changes are clearly documented so that the project team can understand what changed and why.
Going through the estimate line by line gives the team a very good understanding of the intent of the project and the construction techniques that are assumed which can lead to discovering opportunities and/or risks that can be used in the Speculation Phase.
Early Elicitation of Risks
Information Phase
The CRAVE Team begins the study by investigating the project The project team provides a packet of information to the CRAVE Team on what is known about the project and what documents are available upon which they will base the development of their recommendations. Often, CRAVE Team want to rush right into speculating solutions before they have taken the time to acquaint themselves with the information that is already available.
Good groundwork in the Information Phase is important to providing viable recomme'ndations at the end of the study. Combining the CRAwith the VE investigation process encourages team building and allows the team members get to know each other and identify areas of expertise.
MDT Taft West CRAVE Report
Appendix - 115 ,February 2019

Presentation of Project Cost Estimate/Schedule validation/review Risk Elicitation and Quantification
After the estimate is validated, the team identifies the risks associated with the project team's design or the base design. Often the CRAVE Team Leader acts as the risk elicitor to assist the team with the identification of risks.
It is important to fully understand what is "known" about a project. Items that are not yet known must also be addressed, including uncertainty. Uncertain events in the future can pose threats or present opportunities. When preparing early estimates, particularly for complex projects, the effects of uncertainty must be considered.
A risk event may hold the possibility of a positive or negative effect on a project. A positive potential presents an opportunity to the project and a negative potential poses a threat to the project. These threats and opportunities can be related to both schedule and cost.
By identifying the risks associated with the base design, the team begins to generate ideas that will not only reduce risks, but also generally reduces costs and increases the value added to the project.
Site Visit - Due to project location and anticipated weather conditions the site visit will be performed virtually using computer projects of Google Earth.
Revisit and complete risk assessment. Model risks using pre-response side of the Risk Tracking & Analysis Tool
Risk Analysis is the use of available information to determine how often events may occur and the magnitude of their consequences.
Function Analysis Phase
The purpose of this phase is to identify and define the primary and secondary functions of the project. A Functional Analysis System Technique {FAST) was used to quickly define the functions of the project.
"Reduce Risk" is one of the "All the Time" functions that is used during a CRAVE Study.
Creative Phase
This phase is enhanced by adding speculation ideas on how to maximize the opportunities and reduce or eliminate the threats (risks) to the project. At the end of the speculation phase have the project team develop response strategies for those risks that are not carried into the Evaluation Phase.
During the Creative Phase, the CRAVE Team brainstorms ideas that satisfy the project functions and address the identified risks. A team member can explain an idea to the rest of the team, but no evaluation is allowed at this point. Off-the-wall, out-of-the-box ideas are encouraged, as they often lead to innovative, workable solutions. The team lists all of the brainstorm ideas, even the most improbable.
While the CRAVE Team is brainstorming ways to improve the project, different ideas start to emerge on how to reduce or eliminate the risks that were identified during the risk solicitation.
MDT Taft West CRAVE Report
Appendix . 11B Februa,y 2019

The opportunities defined from the risk assessment are carried over into brainstorm list to be evaluated along with ideas defined by the CRAVE Team. Ideas are generated based off of the functions identified in the information phase; additional brainstorming is performed on the function of"Reduce Risk". The ideas are evaluated and drafted into alternatives, sometimes referred to as proposals or recommendations.
Evaluation Phase
The Evaluation Phase begins by going back through the ideas brainstormed during speculation to determine those that have fatal flaws. Ideas that are not viable will be dropped.
The team lists the advantages and disadvantages of each idea that warrants further consideration. If the disadvantages of an idea outweigh the advantages, in number or importance, that idea will not be considered further.
When all of the ideas have been evaluated, and the tea·m still has competing ideas, the most promising may be put through an Evaluation Matrix. The evaluation matrix is used to determine which idea ranks best against selected criteria. Risk is generally used in the evaluation matrix as one of the criteria. This allows the opportunity to select the idea that results in the most significant reduction of risks.
Development Phase
During the Development Phase the CRAVE Team Leader will typically assign a subgroup for each recommendation, to develop the appropriate documentation and descriptions.
Cost estimates are included when developing recommendations. Although the goa! of any VE Program is to add value, due to the nature of highway projects and funding, we must also consider, and document, cost savings or cost added.
Within the CRAVE process, a final step is added to the development phase as the CRAVE Team revisits the risk elicitation.
Review risk elicitation and assessment based on the recommendations from the Development Phase
Complete the post-mitigated side of the risk management plan by adding the VE recommendations into the model and re-run the results.
Presentation
The" presentation will be enhanced since better project cost and duration data is available. The Risk Management Plan created during this process will specify what can or should be done in order to control and monitor the risk impacts on the project cost and schedule.
Post-Workshop {Implementation Plan}
The CRAVE Study Report will include mitigation strategies as spectfied by the Risk Management Plan.
Outcome
MOT Taft West CRAVE Report
Appencli),' • 117 February 2019

Combining these two processes, Cost Risk Assessment & Value Engineering, creates a new, enhanced CRAVE Study with the added benefit of a comprehensive analysis of major factors that would, or could, have an adverse effect on the final project.
The information provided by this style of CRAVE Study gives valuable too!s to project managers to help them deliver a successful project on time and within budget.
When a multi-disciplined team of experts is assembled in a workshop environment, maximum benefit can be achieved by using this combined process.
The ultimate goal of combining these studies is to reduce or eliminate risk, which will result in improved ability to deliver projects on time and within budget
MDT Taft West CRAVE Report
Appendix" 118 February 2019
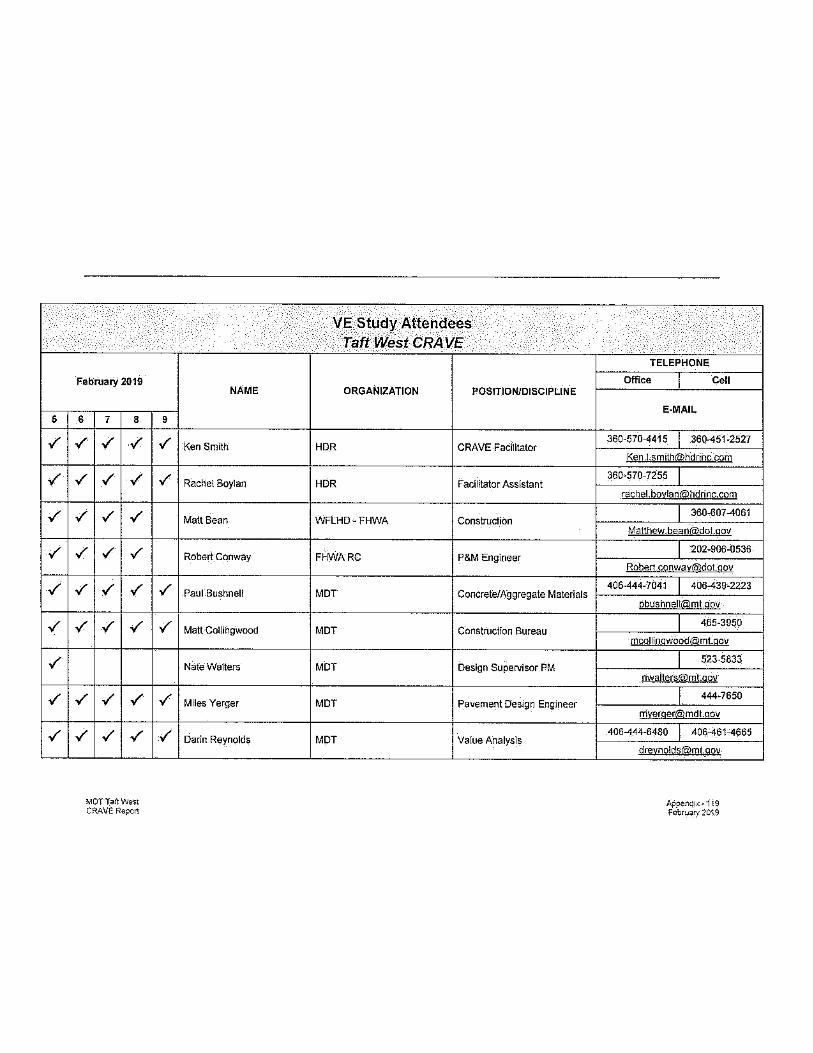
I
' ✓
✓
✓
✓
✓
✓
✓
✓
✓
.
February 2019
' 7 8
✓ ✓ ✓
✓ ✓ ✓
✓ ✓ ✓
✓ ✓ ✓
✓ ✓ ✓
✓ ✓ ✓
✓ ✓ ✓
✓ ✓ ✓
MDTT~nw~st CRAVE Rspor.
. · .
NAME
9
✓ Ken Smith
✓ Rachel Boylan
Matt Bea11
Robert Conway
✓ Paul Bushnell
✓ Matt Collingwood
Nate Walters
✓ Miles Yerger
✓ Darin Reynolds
.
VE Study Attendees Taft West CRAVE
ORGANIZATION POSITION/DISCIPLINE
HOR CRAVE Fadlltator
HOR Facilitator Assistant
WFLHD-FHWA Construction
FHWARC P&M Engineer
MDT Concrete/Aggregate Materials
MDT Constructfon Bureau
MDT Design Supervisor PM
MDT Pavement De Sign Engineer
MDT Value Analysls
TELEPHONE
Office I Cell
360-s10-441s I aeo-4s1-2s21
Ken.Lsmith@hdrinc com
3eo-s10-12ss I rachel.bo;[email protected]
I 3eo-eo1-4os1 [email protected]
I 202-906-0536
Robert.i;gnway:@dot.gov
405-444.7041 I 406-439-2223
gbushnell@mt gov
I 465-3950
moollingwood@mtgov
I 523-5833
I 444-7650
4oe-444.e4ao I 406-461-4665
Ajlnerv.1,x-119 Febrw~ry 2019
.

•
5
✓
✓
✓
February 2019
6 7 8
✓ ✓ ✓
✓ ✓ ✓
✓ ✓ ✓
MOT Tait Wes, CRA.VE Reror:
NAME
9
✓ Jotiy Bachini
✓ Matt Sbizich
T.J. Ramaeker
John Benda
Lee Bernardi
Ben Shendel
Jim Powell
Chris Hardan
VE Study Attendees Taf:t West CRAVE
ORGANIZATION POSITION/D1SCIPLINE
MDT-Maintenance Maintenance Reviewer
FHWA- MT Division Pavements & Materials
MDT Construction Review
MDTEPM EPM
ITD
MD7 Hydraulics
ACPA
MDT Bridge Bureau
.. · .
TELEPHONE
Office I Cell
I 444,6375
441-3918 I 461-8435
I
I
I
I
I
I
Appenci, • 120 Fc~,~~ry 2018

Value Engineering Report Out
j I Mui*
Taft West CRAVE Study
CRAVE Team members
• Jody Bachini - Maintenance
• Matt Bean- Federal Highway Administration Construction
■ Rachel Boylan -Facilitator Assistant • Paul Bushnell - Materials
■ Matt Collingwood - Construction Bureau
• Robert Conway-Federal Highway Administration Pavement/Materials
• TJ. Ramaeker-Construction
Darin Reynolds - Value Analysis
Ken Smith - Facilitator
Matt Strizich - Federal Highway Administration Pavements/Materials
Miles Yerger- Pavement Design
MDTTa!tWesl CRAVE Report
Appendi:,:: ~ 121 February 2019

What's Different with this workshop?
Cost Risk Assessment
& Value Engineering
CRAVE
Comparison of the two processes
Both use a team approach
Cost Risk Assessment
• Learn about project • Identify Risks ~ • Strategize how to handle • Qualify and Quantify -=====-• Develop response plans and triggers -
MDT Taft West CRAVE Report
Value Engineering
• Investigate
• Function analysis
• Speculate
• Evaluate
• Develop
Appendix. 122 Februaiy 2019

Addressing Cost and Schedule Concerns
• How much will it cost? Usual
Questions • How long will it take? • Why does it cost th:,t much?
Analysis Needs
• Why doe, it take that long?
• Risk Identification • Qualitative and Quantitative
Risk Analysis • Value Engineering &Mitigation
Strategies .· ·. . .• • Risk Monitoring .S.Gontrol ··
CRAVE Process
Step 1: CostRiskAssessment ~ ~ 0
Step 2: Risk Response
Step 3: Monitor and Control
MDT Taft West CRAVE Report
Base cost review, identificabon and quantification of coSi and schedule risks
Development of risk response'slrntegies and alternabve solU1ions (Value Engineering)
Continuous risk tracking, monitoring and reporting
Appelldix - 123 February 2019

Overview of Project Cost Base cost estimate serves as the basis against which cost risks and uncertainties are assessed Estimating is not an exact science:
Cost estimate is only an approximation of the probable costs Composed of many elements that may not be completely or equally defined at the lime the estimate is prepared
A numerical value of uncertainty is an estimate bf the error or tolerance within the quantity or unit price of an item. Level of uncertainty is directly related to its position in the project life cycle
Planning Stages
□ DI
Actual Cost
I
I l
"L; ~ign Stages Construction Project
Stage Comp!ctlon
. Proj~ct :Lif~ Cy.c/e . > 7
Traditional Vs. Risk-Based Estimating
Fixed Contingency% Iii
MDT Taft West CRAVE Report
$ ,,;;;5,,,.
Project Base Cost
Appendb; - "124 February 2019

Building Risk Analysis Backbone (Schedule)
Consensus-Based Workshops
Structured Workshops to Build Consensus Among Various Stakeholders
, Engagement of Internal and External Subject-Matter Experts
■ Sessions by Functional Assignment to:
• Identify Risks
• Quantify Risks • Discuss Risk Response and
Mitigation Strategies
MDT Taft West CRAVE Report
For Each Task
Appendix - 125 February 2019

Identifying Event Risks
• Focus on issues that matter
• Describe the event properly • How likely is ii to occur?
• What are the potential impacts (cosUschedule)?
If the event occurs what are the impacts
;. on the low end?
, on the upper end?
, most likely?
• Is the event dependent on or correlated with other events
How the Modeling Works
• Monte Carlo Simulation o Base cost and uncertainties o Cost Event Risks
o Schedule Event Risk
Making the "black box" transparent
MOT Taft Wes\ CRAVE Report
',•,·
' . . ·-: .-._,._
Impact
75°/4 P1Cb:ibllify
:6e,-. ·-Lit-.·--,-;~-----rref< Jw..y : :
,,,_ ..... I "'"' r"'! '.Cail~/-:H~-- •,•_ '" ~--_->·'
--~ -~ ·,S<!-.ecW
,;•6,.,,,-~
-~ ,..., -~-~ Me,,_..,,.&$,~
12
Appendix - 126 February 2019

"Contractors don't take risks, they price them!"
End project.Reference Post 5 7
MDT Taft West CRAVE Report
Sou rce: Mp llmc,iadrey oom'eClu ttNe-m.'Change-crd ers-;;,tsa:e-ccostruoic,i-<ai lracts
\\mdthg\mdtshares\TempStore\Eng\Beal Taft\Beal T aft Vld 60 Sec01.mp4
Taft- West Project Location
Appendix - 127 February 2019

Project Purpose The purposes of this project on !-90 east of Lookout Pass is to replace the existing pavement and provide a new much more durable concrete highway. The project will evaluate additional improvements to the Lookout Pass Interchange ramp alignments, wildlife crossing facilities, roadside geometry, and other miscellaneous safety improvements. The project begins on the Montana and Idaho border at reference post (RP) 0.0 and extends 5.7 miles easterly to the Taft interchange at RP 5.7.
Typical Cross-Sections TYPICAL SECTION NO. 1
~ 1-· ' ' i,,
_.,,,.,,,.~,......, .. n---'=-----i 'I ... :
"---,-.-_,_i __ ,, __ .. .,.--1 } \ 'jfiL,
, .. ,._,. ,, -~~ .. ,-, •M-b¥ ,, '"'"~ , .. '"-~ ., ,.,__,~., .... ,,.~~ .. --- -·~"'
' ' ·l~••'" ,=~:,,,r,-=,-•,; ··it~:~-~·:·,:····· --.-....,,_ . ..,; .... =.,,;.,.~,.
l ___ --~'""" I "·- ··----~-------'""'"-'--" ·· -----
0.83 Concrete Pavement 0.15' Plant Mix 1.0' Crushed Surfacing 1.0' Pulverized
MDT Taft West CRAVE Report
TYPICAL SECTION NO. 2 ,.,...,.,!'i'of'.i",'il..,.,.,,
' SL
i--- ··•'---. . ··-·--··-·.-~----, -i''r·""'·•·-; -•'""··-, --.----·i------·-i
~,h,,::c..4,j~;::1,x,..,;~----:---······ < ..... ,,., ______ ••• ""' .. --·' "", -~···-------- ... ·
Appendix - 128 February 2019

Baseline Risk Assessment Results
'"
Project Cost Pre-Response
<•!li1M)
--To,al p,oj«• con Pi••R.,porn CY~~)
' '·"" ; ..... i 0
1 . ...- D , "1.0,, jl:
'·"' 1
Pre-Re,pon<e 70th P<!rceniil~ Risk Profile
Tot;,l:38.32C\'
"
17
Pre-Response Results Top Cost Risk Factors
What is driving the risk costs
MDT Taft West CRAVE Report
E"" :>0.01 • 1>roin,go '°""'"' with od,~ng lof<"""<'"~
QI! 7(1.0l- M>ttta.l Mal!>M!;,v
is,~ 10.01 • Mino, rtb>bfm,lntMant•10 ••llli"ll >tru<tor«
CNS 10.01 • A«•» u, ... , Arn,
UTL>0.01 • UllOty0,,,111«>
~~=~ -, ,J $1.14
M:w(Y'Jltll;,.,,....:,.., ..... ,.:J so.86
l!ffl'lll'iW ~.ro
!iiif;if;Nso.ss
111 $(1.11
Ill ~-DG
I $0.04
N so.o4
I $(1.04
Appendix - 129 February 2019

Construction Estimate Summary Baseline
S.!0.000
s,amo ;
S!G.000 _
S14.000 i
s,2.000 1
S10,000 '
SB.000 i
SB,000 i
S4.0M .
Taft West
B7½
79',\
Total with CE and IDC $37,999,484
tO<l¾
40%
20¼
O¾
Use $38 Million
Roadway Section Evaluation Baseline
Excavate 2.98' Match existing Profile
MDT Taft West CRAVERepori
TYPICAL SECTION NO. l "· ,,.,~ '- , .. ,,. ~ '" '""·',, ., ,._,~
0.83 Concrete Pavement 0.15' Plant Mix tO' Crushed Surfacing 1.0' Pulverized
, .. ,~-, ., , ..... ~ .. \•• '"=• ,< •c -•- k
$30.15M Capital Cost $30.0?M Net Present Value 60 year LCCA
20
Appendix - 130 February 2019

Roadway Section Evaluation PCCP Inlay
0.83 Concrete Pavement 0.32' Mill Existing Plant Mix
Net Grade Raise 0.51' Do not remove existing Crack and seat PCCP
C:i [X PMS :?. !., r,;,;:o ca~,, ~,r, ssor ,2e,:, ~,';;j ca",:•r.n ~"~""'"'1r t\N,sc
$23.15M Capital Cost $26.81M Net Present Va!ue 60 year LCCA
21
Roadway Section Evaluation PCCP. PULVERIZED BASE
~,.c<_.,;:t&,'@fii/f"?,};t,~,• _ec;2/LCLLh'l£LliLLL:.6 (L:/~[CL'Z!':./L.~'Lu:....,:,c,,:j/ ,~~i<X'/i"G;F~
~u· ~• .,.. . ... , ........ ,,,.,,.,,.,..
Excavate 1.98' Match existing Profile
MDT Taft West CRAVE Repoit
""'"" □ -m> --= ..,__,.,.,. C ~o "'-""' '"""'
0.83 Concrete Pavement 0.15' Plant Mix 1.0' Pulverized
$26.63M Capial Cost $29.93M Net Present Value 60 year LCCA
22
ApperidIx • 131 Februa1y 2019

Roadway Section Evaluation PMS · FLEXIBLE PAVEMENT
~ .. ~ .... , '....C, ".,_, -',.•" rt·,, co.;,<>¢,,_,. "I"•
i:,::i cao,-,.,, "'""""' ""•"'"
0.20' Plant Mix $5.77M Capttal Cost Match existing Profile Rehab Longitudinal Joints 2' wide Type 3 Chips and Seal $58.31 M Net Present Value 60 year LCCA
23
Life Cycle Cost Analysis (LCCA)
• Compares alternatives with different design life/service
• Net Present Value (NPV)
• Discount Rate= 1.5% (adjusted for inflation)
• Initial Construction Cost
• Salvage Value
• Maintenance/Preservation Interval Preservation {n)
• FV= PV*(l +i)'n (Time Value of Money)
MDT Taft West CRAVE Report
Appendix • 132 February 2019

~~':";lLVrn!EciB\'SE:, "·' 'n<,,j~"" ,',•.
" '" ""~ ,;,;-,• ....,. v ...... T<t>IC>1t ·.'-/.C ,'.';':.- ,: ; .. :-:,.-, PCCe-REcoHsroucr a>.m.JE
..... ,.. .• ,,. u.,_..,,,.. u,--.,,.-,. ··Wane-.,,.,., .,._" "" ·- -
PAVB!ENT·
, .. ,,..,.,,. .:o '' ... ___,_,..,,, .,_.,,..,._,,.-.,, " .. , .._.,,.,,,,,..,.-"•""'-=~" "'""""·••5 ......... """" " ' ~'" ......... _ .• ,.-'5>1.-i'•V•"'-" T"-'lC.>t
c.~ T •d"'---S.'151.SS4 a;o CV5~-U,.Y ,.e,,.,., ,,.._.,,""""""'"''"'" ~ .!4~'-'<1 "' 0~0=ts.,t""SR.-,,__ -1,,o1.'m ·s,:, •'"-"'~-"'
-·C·Co~tll ,. --· S,01\eO,
Life Cycle Cost Analysis
Y,..-mu.n. 1t •• e,..,,.,w""' o t SZJ\l1.ES<
,_, '" 1,.,,.,i11
4') ' ' ""''~' "" "' ..S,.~CC<
ol.lNPV »uo•..,. .r...-oi ... a- ,; •o. ·-' .;_p,...ntw"'1> ,o·.- ._., ---~~.
._-,,_ a,. ---,g, ...,. ', ... <b!NPV ;·
tu,.:.. ... ..:-;-.--.,:,-,-.
---, ,-· ,,.. __ . -·' '• ,.,. '" 12•,.
" '•'"·· " " ,.,. . '" ·,;,
' -u, "~ -,o,-- . ,,~-' ,. --- ... -
,..,NPV-
!<1Sm -;;.,_,,,._,,. ·i>0.3<>4.!<0 25
60-YEAR LCCA SUMMARY
ltemate
PCCP OVERLAY
PCCP - PULVERIZED BASE
PCCP • RECONSTRUCT BASELINE
PMS - FLEXIBLE PAVEMENT
MDT Taft West CRAVE Report
Net Present Worth
$26,808,890
$29,931.481
$33,070,779
$58,304,166
26
Appendix - 133 February 2019

VE Recommendation# 1 Pavement Section
0.83 Concrete Pavement 0.32' Mill Existing Plant Mix
Net Grade Raise 0.51' Do not remove existing Crack and seat PCCP
Cost Avoidance $7.01M
\f/1,R\E.S. ~-·,·r·-•~--,,,.\:.✓. __ ,,,.9;l?J'2"±li?~tl~i'~•:-"_~""_;·j::~ ::: .. :
c.~c·
L~CE'\0
G::) Pf!O" PCCP L.7.J (~ P,'<S
::-:': . .:'' tx Pt.:P ,~~,::~ M,O -Sf~: 12a,i, {t?R CRUS~EO t•~G~~C~TS COLR>E
VE Recommendation# 2 Performance Engineered Mix Design
MDT Tall West CRAVE Repor1
Optimized Combined Gradation
Appendix -134 February 2019

VE Recommendation# 2 Performance Engineered Mix Design
VE Recommendation # 3 String-less Paving
'"""''""'"" ..... .,i., ..,.,..,p.,.,,..i., ,r .... ,s ..... c, .. ,.,;,-, .. .,
~7!'t~ '>/ V
Operating space requirements for conventional
MDT Taft West CRAVE Report
'
'::.·,r-·
Appendix •· 135 February 2019

VE Recommendation # 4 Binder
VE Recommendation # 5 Dowels
MDT Taft West CRAVE Report
' '
PCCP
' ' ' '
ts· . o· HOlOJ MA,<WI.I ,nr.'
SHOULDER IF REQUIRED
I I I l : I I I I I
,/
Appendi~" 136 February 2019

VE Recommendation # 6 Maintenance of Traffic
Reference Post3.4-5 7
MDT Taft West CRAVE Report
Baseline
FIRST SEQUENCE
SECOND SEQUENCE
Appendix - 137 February 2019

VE Recommendation # 6 Maintenance of Traffic
PHASE 1
POUR 1 TRAFFIC •. trv/ lrvf
me i,11~41 uvl Crvl shfdr s/1/dr /,WC lilne lane lane . . .
PHASE 2
TRAFFIC POUR 2 trv/ tnl
{' trv/ trvt
st,ldr lane lane ' 1,m 1,1n lane /;me shldr ->,,,'
Design Considerations
• In areas of .divided mecf1an, concrete over existing and in areas of shared median, match existing profile Provide emergency pull outs every mile in lieu of 9.0' shoulder widening in stage 1
• Evaluate 2417 tow truck on standby • Shuttle for bicycflsts/pedestrians • Three season project Year 1: shpulder, stream crossings/drainage, all prep work, etc. Year 2: WB lanes,
Year 3; EB lanes Concrete temporary barrier separating head lo head traffic Construct chain-up/removal areas in median
• Taft Interchange off-loop ramp widen shoulders for additional recovery (don't change radius) • Move roadway slightly south (realign centerline) to increase chain up areas around MP 3.5 • Address unauthorlzed access points or utilize for chain-up/removal • Build snow storage areas
Outside barrier/ shoulder Line existing culverts and backfill bulge by overlapping
• Separate drainage project out ahead (replace) or after (lining) paving project
MDT Taft West CRAVE Report
Appendix " 138 February 2019

Summary of Recommendations
# 1. Paverri_eht_ Section $7.01M.
#2 Performance Engineered Mix Design N/Q
.# .:fsttlng-less Paving N/Q
#4 Binder $0.32M
#5Ddwe,l,s $0.33M
# 6 Maintenance of Traffic $0.30M
Develop Risk Response Strategies , , , I Opportunities ,
Riollf•"""'ll!atn:inooC<,sotS<ho<U• , Rmhc!or,INI-Cl,sto,Sclm!I,
Avoid: Ch a,,ge the project scope lo eli min ale the ·,n, pact of a nst
: Elp!oit: ' To malre aproaciJre decision !otake adion\o show that an oppo1Wni~1s
rea!tzed.
' ' i Tnillil~r: -"····---.. --··-., .,_ .... ·-- ·-;-Shai8:· -- - ---- ""' ,,,_ ____ -- "' - ________ ,, _____________ -· -- -,
Moie a nsk to another party who is morecapablealhandlingthe nsl Assignrngo·11J1er5hipaf the opportunrtyto a third-parlywlio1s best able to \such as the de1eloperor rnsur~nce corrpany). capture the llenefil for the prujecl
:'Mitigate: ' The projedteam may seek to lessen the impact of a specific risk item.
wh1chmayin"ilie the consumf(:on ofaddilionalbme anefurmoner M1tigatJon usuallyrequires pos,tire aciJonand has a cost
-~ Eiihiillca: ----- ---- -- ---- ------------ ----------- ----- ---·----·"'"' ~· - ··;
Take action to incre<!5e tile probabilit-1 and'or •rnpact of the appmtu nif/ for . the b!!neijt of lhe project, s eeki ng to facil ,tate or strenglhe n lhe cau,e of '. the opportun 11'1, and pwacinl!~ la rgetmg and ,e,nforcing its trigger condl1ions.
, ACClll)i:". _ T otake no acton l'>fien a respons-e may b<dcJQ ais11yto Ile effeciJ1e 01 when the risks arc>uncoolrollab~ and noprac!Jcil action ma1betaken to specrtic~~ ( ad d ress Q In acii1·e acceptan re, the P"(lj ect learn sels up a contingen cue~e~·e fun d lo account for the residu a I expected ,alue of the remai ning ri s ks
··-··--·--··--·-- --··-·-·. ··--· ---·-----·--·- ··- ·- --------- --- ----- . -- --- -··---·-----[ 38
MDT Taft West CRAVE Report
Appe11dix - 1 39 Febru~ry 2019

,oo,
'""
Top Cost Risk Factors
ENV 70.01- 01aln•1.~«•0<•ni, ""lh oxl!Uni lnfr.>$t,u,;tu,e
·S3.80 ~@\fwf4 . . affljS1.14
(N S 900. 01 • Un-rd,ndfl,d o,, ,,. ord«<
l<TG 10.01-Mino, ...iiabfmotn,.,,,nco 10.,.l1tlor n,uc,u, ..
UTt 20.01- Utlllry COnOku
i,p, .. ~o,pon,, RJ,kc.,, lml"<t
W Pro-Ro,pon,e f>c.i4t>On
w Pro-R«pon•~Addltlonal Suppo,t ,.,.,
"Pon-Ro,pome Rl!kCo!! '"'""" wPon-R«pom• !«alallon
·$5,0
Construction Cost
-$1.0
tsii®l1tl s1.14 liwl. $0.60
w $0.60
jm $O.S6
~ $0.56
fil $0.40
~$0.40
if $0.35
b!ii $0.35
fif $0.26
ti $O.l6
lill.LJ$o.a~ f $0.17
I $0.o,i
i $0.03
I So.o4 !so.02
$0.0 $2,0 :
!>:p•<tod CO!! Im,,.<!($ mllr.on,)
Pre-Response & Post-Response Results
I
I 1,
h I, I, h
$35.7M, 70%
·'$40.0M,90% Assume 50% implementation rate of VE Saves $2.6M
10,. $26.B M, 10% $34.lM,10%
MDT Taft West CRAVE Report
$27.5 '"' $37.5
CO!t($M] -- Con,ttuctlon Co>t P,...ne,pon,e ---Constru<tion Co>t PosH\esJ>(ln>e - - Ga,e Construction Co,t l're-1\osponse - - Oa,e Con>truction Co,t Po>t·Re<p<1n"
Appendix• 140 February 2019

Construction Cost Pre-Response & Post-Response Results
I I, 1;
' t •5,..,,.., l"" I
-<••"""""°"~"'...,.•-~ -eon,.,,<t1onco,,.,,,_.,_,., - -o. .. c"""'""'°"""'',.,._..,...,., - -o.,.c""'n""'""<"''• .. •·•-""
Assume 75% implementation rate of VE Saves $6.3M
MDT Taft West CRAVE Report
·--•• i ,. ] -' , ,. ' .f .... j ,. ,.
Construction Cost Pre-Response & Post-Response Results
$)).~M-i9°S
I ~,. .• M,)O!i
I I l I, !~
' IOIIS!UM, IO!i I SlUM,Ulll
• '"'
I S>'-' ,.,
Co"(!Mj
--~··-'""""""'"""' .... "" --o,,,,.,,.«T0rtCO.C""'t .. ,_,,,, - -o,,-co,.,fi..,-CO,,.,..,.,...,,. - _.,,.c..,,.,"'-°"""""''"'•""
;'1-'
Assume 100% implementation rate of VE Saves $8.4M
Appenclix-141 February 2019

MDT Taft West CRAVE Report
This page is intentionally left blank.
Appendix - 142 February 2019

Value Engineering Process Value Engineering (VE) is a systematic process using a multidisciplinary team to improve the value of a project through the analysis oflts functions. The VE process incorporates, to the extent possible, the values of design; construction; maintenance; contractor; state, local and federal approval agencies; other stakeholders; and the public.
The primary objective of ayE Study is value improvement. The value improvements might relate to scope definition, functional design, constructabifity, coordination (both internal and external), or the schedule for project development. Other possible value improvements are reduced environmental impacts, reduced public inconvenience, or reduced project cost.
Value Engineering Job Plan
The Value Methodology Job Plan was employed in analyzing the project. This process is recommended by SAVE International® and is composed of the following phases:
Information - The objective of this phase was to obtain a thorough understanding of the project's design criteria and objectives by reviewing the project's documents and drawings, cost estimates, and schedules.
Function Analysis - The purpose of this phase was to identify and define the primary and secondary functions of the project. A Function Analysis System Technique (FAST) was used to quickly define the functions of the project.
Creative - During this phase the team employed creative techniques such as team brainstorming to develop a number of alternative concepts that satisfy the project's primary functions.
Evaluation - The purpose of this phase was to evaluate the alternative concepts developed by the CRAVE Team during the brainstorming sessions. The team used a number of tools to determine the qualitative and quantitative merits of each concept.
Development- Those concepts that ranked highest in the evaluation were further developed into CRAVE recommendations. Narratives, drawings, calculations, and cost estimates were prepared for each recommendation.
Presentation - The CRAVE Team presented their finding in the form of a written report ln addition, an oral presentation was made to the owner and the design team to discuss the CRAVE recommendations.
Implementation/Resolution - Evaluate, resolve, document and implement all approved recommendations.
MDT Taft West CRAVE Report
Appendix" 143 Februaiy2019

Pre-Study Acllvitif!$
Information PM~
Function Analysis
Phase
Croativo Phase.
Stage 1 - Pre-Workshop
Stage 2 - Workshop (Job Plan)
Evaluation \--►(' Phase
Presenfation ~---+----I Development I◄----' ~----l Phase Phase
Stage 3 - Post-Workshop
Figure 8 - Value Engineering Job Plan
Reporting Following the CRAVE Study, the Team Leader assembles all study documentation into the draft/final reports;
■ Publish Results - Prepare a draft and a final CRAVE Study Report; distribute printed and electronic copies as needed.
The CRAVE Study is complete when the report is issued as a record of the CRAVE Team's analysis and development work, as well as the Project Team's implementation dispositions for the recommendations.
MDT Taft West CRAVE Report
Appendix - 144 February 2019