taiwan component sector - credit suisse
TRANSCRIPT

DISCLOSURE APPENDIX CONTAINS ANALYST CERTIFICATIONS AND THE STATUS OF NON-US ANALYSTS. U.S. Disclosure: Credit Suisse does and seeks to do business with companies covered in its research reports. As a result, investors should be aware that the Firm may have a conflict of interest that could affect the objectivity of this report. Investors should consider this report as only a single factor in making their investment decision.
CREDIT SUISSE SECURITIES RESEARCH & ANALYTICS BEYOND INFORMATIONTM
Client-Driven Solutions, Insights, and Access
28 September 2012
Asia Pacific/Taiwan
Equity Research
Technology Hardware & Equipment / MARKET WEIGHT
Taiwan Component Sector COMPANY UPDATE
Metal casing: An upcycle with two concerns
Figure 1: Which design do you like?
Source: Company websites
■ Metal casing in an upcycle. We believe the metal casing market is in an
upcycle, given the trend of thinner and lighter portable devices with better
structural support. As casing design is becoming one of the key
differentiating factors for brands, we see an increase in metal content in
consumer notebooks (NB) and smartphones. This is evidenced by the higher
casing weighting in BOM (bill of materials)—from 5%-10% to 10%-15%.
■ However, cost and competition are concerns. Higher production costs
could force brands to look for alternative solutions, which will likely increase
the demand for hybrid casing designs. Competition from EMS/ODMs’ casing
subsidiaries (along with their stated intention to go public next year) could
bring margin headwinds and headline risks for existing suppliers.
■ We prefer Foxconn Tech and Pegatron. We advise investors to stick to
technology leaders with parent company support such as Foxconn Tech
(OUTPERFORM). Foxconn Tech also benefits from a new product cycle
(iPhone 5). We think Catcher’s (NEUTRAL) revenue growth has peaked in
2012, and its growth outlook is uncertain with more competition from
EMS/ODMs’ casing subsidiaries. We also like Pegatron (rated
OUTPERFORM, covered by Thompson Wu) on potentially better leverage
from its key smartphone and PC customers, which should drive its ROE
improvement in the long term.
■ Key risks to our sector call include: (1) high capex on advanced
technologies, (2) change of materials and (3) intense competition, which
could lead to the sector’s profit erosion.
Research Analysts
Pauline Chen
886 2 2715 6323
Josette Chang
886 2 2715 6367
Thompson Wu
886 2 2715 6386
Irene Wu
886 2 2715 6365

28 September 2012
Taiwan Component Sector 2
Focus charts and tables Figure 2: Which design do you like?
iPhone 5 (112 g)
Al unibody
Galaxy SIII (133 g)
Polycarbonate/ metal inside
Droid RAZR Maxx HD (157 g)
Kevlar/ metal frame
HTC 8X (130 g)
Polycarbonate unibody
Source: Company websites
Figure 3: Cost is a concern—different casing comparisons
Aluminum Aluminum Magnesium Plastic Glass fibre Carbon fibre
Process Unibody Stamping Die casting Injection Injection **
Density (g/cm2) 2.7 2.7 1.8 1.2-1.7 1.7 1.6
Melting point (degree) 590 590 600 100 120-140 n.a.
Thickness (mm) 0.7-0.9 0.7-0.9 0.7-0.9 1.2-1.5 0.8-1.0 0.5-1.0
ASP (US$) 50-100 20-25 30-50 15-20 20-25 50-100
** Carbon fibre is not ready for mass production of outer casing (only available for smaller parts).
Source: Company data, Credit Suisse estimates
Figure 4: EMS/ODMs join the party—a look at Apple’s casing supply chain
Note: Trademarked icons used. Source: Company data
Figure 5: Valuation comparison—Taiwan casing sector
Company Ticker CS Rating Price (NT$) EPS (NT$) EPS growth (%) P/E (x) P/B (x) ROE
Local Target 2012E 2013E 2012E 2013E 2012E 2013E 2012E 2013E 2012E 2013E
Catcher 2474 TT N 141.0 155.0 12.1 12.7 -15.1% 5.0% 11.7 11.1 1.9 1.7 16% 16%
FTC 2354 TT O 112.0 132.0 6.2 9.5 -4.5% 52.2% 18.0 11.8 2.3 1.9 13% 17%
Pegatron 4938 TT O 37.9 46.0 2.4 4.2 4740.1% 72.8% 15.7 9.1 0.9 0.8 6% 9%
Ju Teng 9136 TT NR 12.9 n.a. 1.8 2.0 111.9% 9.4% 7.1 6.5 0.7 0.7 10% 9%
Source: Company data, Credit Suisse estimates for rated companies, Bloomberg I/B/E/S estimates

28 September 2012
Taiwan Component Sector 3
An upcycle with two concerns Metal casing in an upcycle
We believe the trend of thinner and lighter portable devices with better structural support,
as well as brands’ increasing focus on differentiating casing design, will lead to growing
demand for metal casing (for both internal and external parts). Apple is the first brand that
widely uses metal across its product lines—iPod, Macs, iPad and iPhone 5. Intel’s
aggressive push for ultrabooks is also likely to trigger more demand for metal casing.
Besides NB, we also observe increasing use of metal content by most smartphones
brands, except for HTC and Nokia.
Concern #1: Costs
However, the first challenge of using metal casing for brands is higher costs. According to
our supply-chain checks, metal casing per box costs US$30-50, versus US$15-20 for
plastic casing and US$20-25 for glass fibre. The cost will rise to US$50-100 if it adopts
uni-body casing (depending on the processing time). The cost issue is even more painful
for non-Apple brands, in our view, as they do not have the same scale advantages over
Apple by using the same material or manufacturing process. Hence, PC OEMS are
seeking for alternative solutions such as hybrid casing design, to reduce costs and to
differentiate from Apple’s products. This was evident in the 2012 Computex, the largest IT
trade show in Asia, where we saw a wider variety of casing designs (different materials
and different manufacturing processes). Overall, we think metal casing (inside/outside)
remains the best solution (cost-performance) for an ultrabook which is slim, lightweight
and has better strength.
Concern #2: Intense competition
The second concern is intense competition, as casing design becomes one of the major
differentiating factors for brands. EMS/ODMs also try to make casing in-house, given the
significant margin difference (20%-50% for casing versus 4%-5% for assembly).
Independent casing companies are forced to form JVs with ODMs (like in the case of Ju
Teng), or to commit heavy capex to secure orders (such as Catcher). Based on our
industry checks, we believe Catcher and Foxconn Tech still lead in capacity, yield rates,
and financial strength. Pegatron’s casing subsidiary (Riteng) and Quanta’s casing
subsidiary, are the runners-up, as both benefit from Apple’s supply-chain diversification
together with strong financial and assembly support from their parent companies. Ju Teng
benefits from the trend of hybrid casing, as it moves up from lower-margin plastic casing to
higher-margin hybrid casings. Getac is also exploring its growth opportunities in glass fibre.
Net net, we think the competition is catching up.
We prefer Foxconn Tech and Pegatron
We advise investors to stick to technology leaders with parent company support, such as
Foxconn Tech (OUTPERFORM). Foxconn Tech also benefits from a new product cycle
(iPhone 5). We think Catcher’s (NEUTRAL) revenue growth has peaked in 2012, and its
growth outlook is uncertain with more competition from EMS/ODMs’ casing subsidiaries.
We also like Pegatron (rated OUTPERFORM, covered by Thompson Wu), on potentially
better leverage from its key smartphone and PC customers, which should drive its ROE
improvement in the long term. Key risks for our sector call include: (1) high capex on
advanced technologies, (2) change of materials and (3) intense competition, which could
lead to the sector’s profit erosion.
We believe the trend of
thinner and lighter portable
devices as well as brands’
increasing focus on
differentiating casing design,
will lead to growing demand
for metal casing
However, the first challenge
of using metal casing for
brands is higher costs,
especially for the non-Apple
camp
The second concern is
intensifying competition, as
EMS/ODMs also try to make
casing in-house
We advise investors to stick
to technology leaders with
parent company support.
Our top picks are FTC and
Pegatron

28 September 2012
Taiwan Component Sector 4
Metal casing in an upcycle We believe the trend of thinner and lighter portable devices with better structural support,
as well as brands’ increasing focus on differentiating casing design, will lead to growing
demand for metal casing (for both internal and external parts). However, higher production
costs could force brands to look for alternative solutions. Moreover, competition from
EMS/ODMs’ casing subsidiaries (along with their intention to go public next year) could
bring margin headwinds and headline risks for existing suppliers. As a result, we advise
investors to stick to technology leaders with parent company support, such as Foxconn
Tech. We think Catcher’s revenue growth has peaked in 2012, and its growth outlook is
uncertain with more competition from EMS/ODMs’ casing subsidiaries. We also like
Pegatron, on potentially better leverage from its key smartphone and PC customers, which
should drive its ROE improvement in the long term.
It all started with Apple
Metal casing has been mostly used in commercial NB PCs but its popularity increased
with Motorola RAZR’s success in 2H04-2005. While metal casing has several key
advantages such as lightweight, better heat dissipation, better structural support, better
vibration absorption, EMI (Electromagnetic Interference) shielding and recyclability, it was
mostly found in “high-end” products in earlier times. Apple is the first brand that widely
uses metal across its product lines—iPod, Macs, iPad and iPhone 5.
Figure 6: Apple iPod shuffle (2006) Figure 7: Apple MacBook Air (2008)
Source: Apple website Source: Apple website
Figure 8: Apple iPad (2010) Figure 9: Apple iPhone 5 (2012)
Source: Apple website Source: Apple website
Apple is the first brand that
widely uses metal across its
product lines—iPod, Macs,
iPad and iPhone 5
28 September 2012
Taiwan Component Sector 5
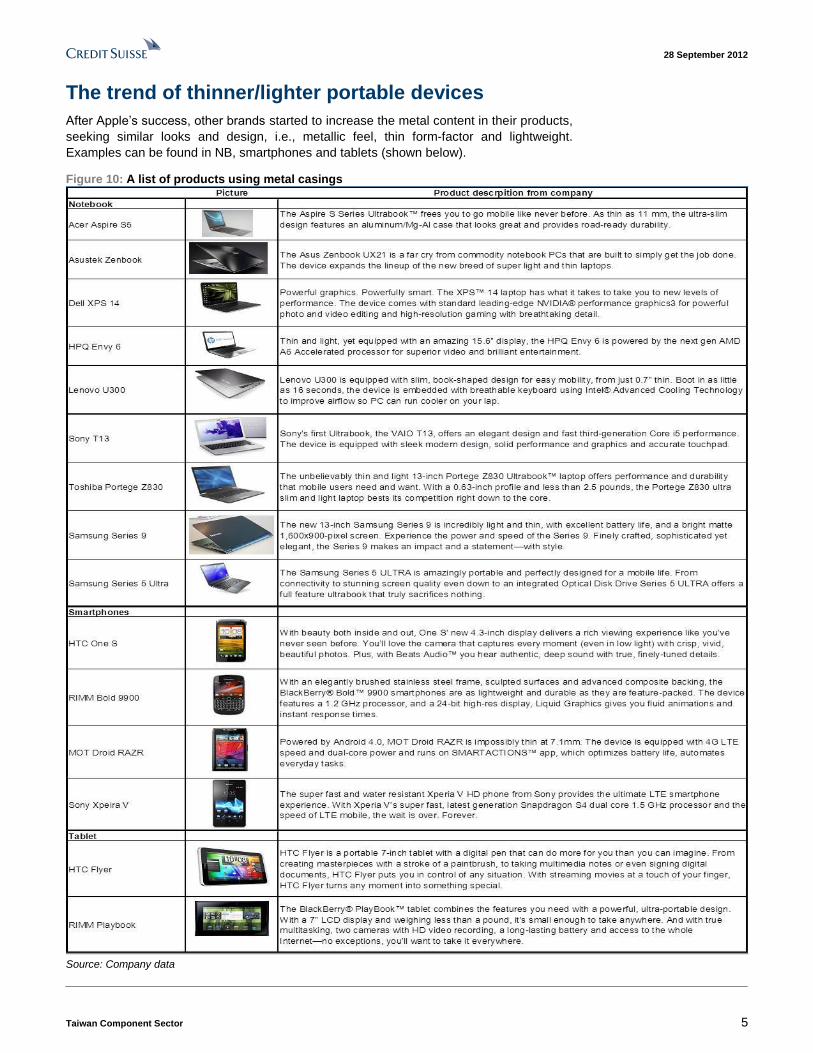
The trend of thinner/lighter portable devices
After Apple’s success, other brands started to increase the metal content in their products,
seeking similar looks and design, i.e., metallic feel, thin form-factor and lightweight.
Examples can be found in NB, smartphones and tablets (shown below).
Figure 10: A list of products using metal casings
Source: Company data

28 September 2012
Taiwan Component Sector 6
Ultrabooks possess thinner/lighter form-factors
After the launch of iPad, Apple started to outgrow the overall NB PC market (including
tablets), prolonging the replacement cycle for regular NBs. In mid-2011, Intel fought back
with the concept of ‘ultrabook’. According to Intel, ultrabooks are designed to reduce the
weight and thickness of notebooks, without compromising the performance and battery life.
The specifications for a 13-inch ultrabook look very similar to a 13-inch MacBook Air, in
terms of thickness (17-18 mm) and weight (both at 1.0-1.3 kg).
Figure 11: Apple’s YoY growth for notebooks (including
tablets) versus the non-Apple camp
Figure 12: Apple’s market share in notebooks (including
tablets) versus the non-Apple camp
Apple's mobile PC (incl. tablet) YoY growth vs. non-Apple camp
0%
50%
100%
150%
200%
250%
2006 2007 2008 2009 2010 2011 2012E 2013E
YoY (%)
Apple (Sum) WW Non Apple (Sum)
Apple's mobile PC (incl. tablet) market share vs. non-Apple camp
0%
20%
40%
60%
80%
100%
2006 2007 2008 2009 2010 2011 2012E 2013E
(%)
Apple's mobile PC non-Apple camp
Source: Company data, Gartner, Credit Suisse estimates Source: Company data, Gartner, Credit Suisse estimates
While Intel does not specifically require metal casing for ultrabooks, most of the 11/13-inch
designs use at least one piece of metal casing, so as to give similar metallic feel and
structural support. Examples include Acer’s Aspire S5, Asustek Zenbook, Dell XPS 14,
HPQ Envy 6, Lenovo IdeaPad U300, Samsung Series 9, Sony T13, and Toshiba Portege
Z830. This clearly increases the demand for metal casing, especially as most mainstream
consumer models are using plastic casing currently.
Figure 13: Intel’s ‘ultrabook’ definition
Platform Huron River Chief River Shark Bay
Release date Oct-11 Jun-12 mid-2013 (expected)
Processor Sandy Bridge Ivy Bridge Haswell
ULV (17 W TDP) ULV (17 W TDP) SoC (10 W TDP)
Height (maximum) 18 mm for 13.3-inch and below 18 mm for 13.3-inch and below
21 mm for 14-inch and above 21 mm for 14-inch and above
23 mm for convertible tablets
Battery life (minimum) 5 hours 5 hours 9 hours
Source: Intel
Increasing metal content in smartphones
The metal casing adoption rate in smartphones has been lower than that in NB PCs, likely
due to antenna interference and cost concerns. Our take is that most smartphone brands
are increasing the metal content, except for HTC and Nokia.
Apple (18.8% smartphone market share in 2Q12) used aluminium casing for its first
iPhone (iPhone 2G) in 2007. However, it changed to engineering plastic casing for iPhone
3G/3GS in 2008/2009, given signal interference issues. The back case was then changed
to strengthening glass for iPhone 4/iPhone 4S in 2010/2011 due to its better strength (30
times stronger than plastic) and scratch-resistant quality, although it still used stainless
steel in the frame. However, unsustainable yield rates at current back-case suppliers and
the trend of thinner/lighter smartphones made Apple revert to metal casing for iPhone 5.
By adopting aluminum unibody casing (as well as in-cell), Apple manages to reduce
iPhone 5’s weight by 20% and thickness by 18% (compared with iPhone 4S), and to
Ultrabooks generally
possess thinner/lighter form-
factors, which increase the
demand for metal casing
We believe most
smartphone brands are
increasing the metal
content, except for HTC and
Nokia

28 September 2012
Taiwan Component Sector 7
increase the strength support for the panel (given that it is one piece) and reduce the
number of components.
Figure 14: Aluminum stamping for iPhone 2G (135 g) Figure 15: Engineering plastic for iPhone 3G/3GS (133 g)
Source: Company website Source: Company website
Figure 16: Stainless steel frame for iPhone 4/4S (137 g) Figure 17: Aluminum unibody casing for iPhone 5 (112 g)
Source: Company website Source: Company website
HTC (6.1% smartphone market share in 2Q12) used to be a fan of metal casing for its
flagship models. However, it shows increasing preference for plastic casing over metal
casings since 2012, likely to stay cost competitive and reduce weight. Examples include
One X, 8X and 8S. HTC claimed it would stick to the unibody design for various materials.
Figure 18: HTC’s key flagship models
Desire HD (2010, 164 g)
Aluminum unibody
Sensation (2011, 148 g)
Aluminum unibody
One X (2012, 130 g)
Polycarbonate unibody
X8 (2012, 130 g)
Polycarbonate unibody
Source: Company website

28 September 2012
Taiwan Component Sector 8
Samsung (29.7% smartphone market share in 2Q12), on the other hand, prefers plastic
casing to metal casing for its smartphones. Its flagship models, Galaxy S I/II/III, are all
made of plastic casings (polycarbonate to be precise), although they still require metal
frame inside. A technology called NCVM (Non Conductive Vacuum Metallization) is widely
used on top of polycarbonate to provide similar metallic feel. Interestingly, Samsung uses
aluminum unibody casing in its Bada-OS Wave II.
Figure 19: Samsung’s flagship models
Galaxy SI (2010, 119 g)
Polycarbonate
Galaxy SII (2011, 116 g)
Polycarbonate
Galaxy SIII (2012, 133 g)
Polycarbonate
Galaxy Note II (2012, 180 g)
Polycarbonate
Source: Company website
Similarly, Sony (3.5% smartphone market share in 2Q12) also prefers plastic casing
(polycarbonate) with metal frame inside for its smartphones. However, it seems that Sony
is increasing its metal content in its flagship models, i.e., Xperia Ray (2011, metal frame
inside) to Xperia V (2012, metal frame outside).
Figure 20: Sony Xperia Ray (2011, 100 g) Aluminum inside Figure 21: Sony Xperia V (2012, 120 g) Metal outside
Source: Company data, ePrice Source: Company data, ePrice
Motorola (3.0% smartphone market share in 2Q12) started using metal casing for its
handsets back in 2004. Its RAZR V3 was one of the best-selling handsets in 2H04-2005,
given its stylish design with the thinnest clamshell form-factor and an anodized aluminum
casing. While it changed the back case from metal casing to Kevlar in its recent flagship
models such as Droid RAZR (2011) and Droid RAZR Maxx HD (2012), it still uses metal
frame outside to provide better structural support.
Figure 22: Motorola’s flagship models
RAZR V3 (2004, 95 g)
Aluminum
Droid RAZR (2011, 127 g)
Aluminum frame outside
Droid RAZR Maxx HD (2012,
157 g) Metal frame outside
Source: Company website

28 September 2012
Taiwan Component Sector 9
RIMM (5.2% smartphone market share in 2Q12) is a late-comer using metal casing in its
smartphones. The company started using metal frame outside from Bold 9900 (in 2011)
and continues this design in its latest model, Curve 9320 (2012).
Figure 23: RIMM’s flagship models
Bold 9700 (2009, 122 g)
Plastic
Bold 9900 (2011, 130 g)
Stainless steel frame
Curve 9320 (2012, 103 g)
Aluminum frame
Source: Company website
The extreme case is Nokia (7.6% smartphone market share in 2Q12), which only uses
polycarbonate (instead of metal casing) in its Lumia smartphones, likely due to WP8’s
strategy of colourful casings. However, Nokia does use aluminum alloy casing for its
Symbian handsets, i.e., N78/N96.
Figure 24: Nokia’s flagship models
Lumia 610 (2011, 131.5 g)
Polycarbonate
Lumia 800 (2011, 142 g)
Polycarbonate
Lumia 900 (2011, 160 g)
Polycarbonate
Lumia 920 (2012, 185 g)
Polycarbonate
Source: Company website

28 September 2012
Taiwan Component Sector 10
Tablets’ casing design depends on the price point
Unlike smartphones with an increasing metal content for most brands, in the tablet world,
only Apple, HTC and MSFT are using metal casing outside. Asustek uses metal casing
design only in the high-end models. Value-driven tablets from Amazon and Google use
plastic casing to save cost. Samsung still maintains its preference for plastic casing in
tablet designs, although it adds metallic spraying on top of plastic casing.
Figure 25: Major tablet flagship models
New iPad (2012) –
Aluminum unibody
MSFT Surface (2012) –
VaporMg
Amazon Kindle Fire HD (2012)
– Plastic
Google Nexus (2012) –
Plastic
Source: Company websites
Figure 26: Major tablet flagship models
HTC Flyer (2011) –
Aluminum unibody
Asustek Transformer (2011)
– Aluminum
Amazon Kindle Fire (2011)
– Plastic
Samsung Galaxy Tab 10.1
(2011) – Plastic
Source: Company websites

28 September 2012
Taiwan Component Sector 11
Concern #1: Costs However, the first challenge of using metal casing for brands is higher costs. According to
our supply-chain checks, metal casing per box costs US$30-50, versus US$15-20 for
plastic casing and US$20-25 for glass fibre. The cost would rise to US$50-100 if it adopts
uni-body casing (depending on the processing time). The cost issue is even more painful
for non-Apple brands, as they do not have the same scale advantages over Apple by
using the same material or manufacturing process.
Figure 27: Different casing comparisons
Aluminum Aluminum Magnesium Plastic Glass fibre Carbon fibre
Process unibody stamping die casting injection injection **
Density (g/cm2) 2.7 2.7 1.8 1.2-1.7 1.7 1.6
Melting point (degree) 590 590 600 100 120-140 n.a.
Thickness (mm) 0.7-0.9 0.7-0.9 0.7-0.9 1.2-1.5 0.8-1.0 0.5-1.0
ASP (US$) 50-100 20-25 30-50 15-20 20-25 50-100
** Carbon fibre is not ready for mass production for outer casing (only available for smaller parts).
Source: Company data, Credit Suisse estimates
2012 Computex showed hybrid casing designs
Given that casing accounts for 5%-15% of a notebooks’ BOM (bill of materials), PC OEMS
are seeking alternative solutions, such as hybrid casing designs, to reduce cost and
differentiate their products from Apple’s. This was evident in the 2012 Computex, the
largest IT trade show in Asia, where we saw a wider variety of casing designs. These
include: unibody (e.g., Acer’s 11.6-inch Aspire S7 and Asus Taichi), aluminum metal
casings (Asus ZenBook Prime), aluminum stamping/glass fibre (Gigabyte U2442),
tempered glass (Acer 13.3-inch Aspire S7) and Carbon Fibre (Gigabyte X11).
Hybrid casing design is the trend
While we see a variety of casing designs (made of different materials and using different
manufacturing processes), we think metal casing (inside/outside) remains the best
solution (cost-performance) for an ultrabook that is slim, lightweight and has better
strength.
Figure 28: BOM comparison
ItemBOM
Cost
Share
of Total
Cost
ItemBOM
Cost
Share of
Total
Cost
ItemBOM
Cost
Share of
Total
Cost
Intel CPU+Chipset 185 43% Intel CPU+Chipset 175 31% Intel CPU+Chipset 175 39%
HDD(320GB) 39 9% SSD (128GB) 125 22% HDD(320GB)+SSD (16GB) 50 11%
Chassis(PC/ABS) 18 4% Chassis ( All Unibody) 57 10%Chassis ( 2 pieces Metal
and 2 pieces PC+GF)39 9%
LCD Panel (13" panel) 49 11% LCD Panel (Slim 13" panel) 42 7% LCD Panel (Slim 13" panel) 40 9%
Battery 25 6% Battery ( Li Polymer) 38 7% Battery 28 6%
DRAM (4GB) 20 5% DRAM (4GB) 20 4% DRAM (4GB) 20 4%
PCB 11 3% PCB 15 3% PCB 14 3%
Other Componets 40 10% Other Componets 47 8% Other Componets 42 10%
Windows OS 45 9% Windows OS 45 8% Windows OS 45 9%
Total BOM Cost 432 100% Total BOM Cost 564 100% Total BOM Cost 453 100%
Low Price UltrabookNormal NB Mainstraim Ultrabook
Source: Company data, Credit Suisse estimates
Carbon fibre: The lightest solution, but not ready for mass production
We note that the Carbon fibre design is the lightest solution (Gigabyte X11 weighs only
975 g), but high production costs, a lack of mass producing suppliers and difficulty in
changing the colour are the key bottlenecks.
The first challenge of using
metal casing for brands is
higher costs, especially for
non-Apple names, given
they have less scale
advantage
We think metal casing
(inside/outside) remains the
best solution (cost-
performance) for an
ultrabook that is slim,
lightweight and has better
strength

28 September 2012
Taiwan Component Sector 12
Tempered glass: Fancy looks but heavy weight
Acer and HPQ use the tempered glass design, which looks fancy. However, we think
weight could be an issue—if we benchmark HP’s earlier launched ultrabook, Envy 14
Spectre, with glass chassis, weighing 3.97 pounds (or 1.80 kg), or 33% heavier than
Apple’s 13-inch MacBook Air (at 1.35 kg).
Aluminum unibody: Only limited to the most high-end models
While aluminum unibody casing matches the same design feel as Apple’s MacBook, it
seems to be limited to the most high-end models such as Acer Aspire S7 and Asustek
Taichi, due to high production costs.
Magnesium die casting: Mostly used in commercial models or keyboard casing
Magnesium casing is mostly found in commercial models (cover + bottom, or cover +
keyboard). However, it is mostly used in keyboard casing for consumer models, instead of
cover casing, given the difficulties in coloring.
Aluminum stamping: Mostly found in cover casing
Aluminum stamping is mostly found in cover casing, given its advantage of surface
treatment (versus Magnesium die casting and glass fibre), and cost advantage (versus
aluminum unibody).
Glass fibre: Mostly used in bottom casing
While glass fibre seems to be a perfect solution in between metal and plastic casing, we
note that glass fibre is only used for bottom casing, instead of cover casing, suggesting a
technology bottleneck for surface treatment of glass fibre.
Plastic casing: The cheapest solution
Plastic casing could be widely adopted in ultra-like NB, given its cost advantage. However,
most models still require metal frame inside.
Figure 29: Various product launches at the 2012 Computex
Model Acer Aspire S7 Acer Aspire S7 Asustek Taichi Asus Zenbook
Prime UX31A
Gigabyte X11 Gigabyte U2442
Picture
Size (inch) 11.6 13.3 11.6 / 13.3 13.3 11.6 14
CPU Intel Intel Intel Intel Intel Intel IvyBridge i5
OS Windows 8 Windows 8 Windows 8 Windows 7 Windows 7 Windows 8
Display size FHD 1920x1080 FHD 1920x1080 Dual display
(FHD/IPS) FHD 1920x1080 HD 1366×768 HD 1600×900
Touch Capacitive multi-
touch
Capacitive multi-
touch
Capacitive multi-
touch Multi-touch Multi-touch n.a.
Keyboard Yes Yes Yes Yes Yes Yes
Casing Al unibody Tempered glass /
Unibody Al unibody Al unibody Carbon Fibre
Al stamping /
Bottom-Glass Fibre
Hinge 180 degree flat 180 degree flat 360 degree flat n.a. n.a. n.a.
Max thickness (mm) 12.5 n.a. 8.9 9 16.5 21
Weight (kg) 1.0 1.2 <1.4 1.3 <1 1.66
Source: Company data

28 September 2012
Taiwan Component Sector 13
Concern #2: Intense competition The second concern is intensifying competition, as casing design becomes one of the
major differentiating factors for brands. EMS/ODM also try to produce cases in-house,
given the sizeable margin difference (20%-50% for casing versus 4%-5% for assembly).
Independent casing companies are forced to form JVs with ODMs (such as Ju Teng), or
commit heavy capex to secure orders (such as Catcher).
EMS/ODMs join the party
Figure 30: Competitive landscape of the casing sector
Note: Trademarked icons used.
Source: Company data
- The Hon Hai group has covered most casing technologies from Hon Hai in-house,
Foxconn Tech (30%-owned; metal casing), and FIH (69%-owned; plastic casing). The
Hon Hai group also supplies casings to its various customers including Apple, Nokia,
Motorola, Sony, HPQ, Dell, etc.
- Pegatron has three casing subsidiaries: Yi-Ding (37%-owned; plastic casing), Riteng
(76%-owned; metal casing) and AVY (51%-owned; metal casing). Pegatron’s casing
customers are mainly Asustek and Apple.
- Quanta has three casing subsidiaries: Zhan-Yun (plastic casing, major supplier to
Google Nexus tablet), Teng-Long (metal casing) and Kenseisha (metal casing;
acquired in October 2008). According to Quanta, it targets to keep 30%-40% of
components in-house in the long term.
The second concern is
intensifying competition, as
casing design becomes one
of the major differentiating
factors for brands, given
EMS/ODMs also try to
produce cases in-house

28 September 2012
Taiwan Component Sector 14
- Compal has expanded its footprint to casing through a JV with Ju Teng. The JV,
JuPal, specialises in both metal and plastic casings. Compal also acquired Hong Ya in
2007, a company specialising in thixomolding technology.
- Wistron also cooperates with Ju Teng on plastic casing. Wistron is relatively less
aggressive on in-house casing, compared to Quanta and Compal.
- Inventec formed a JV with Huan Hsin back in 2007 and increased its holdings to
100% (from 49%) in 2010. However, there has been little progress on this JV, based
on our supply-chain checks.
- Getac has two casing subsidiaries: MPT (both plastic and metal stamping) and Waffer
Tech (38%-owned; thixomolding technology). Most of Getac’s casing customers are
NB makers, while it also supplies desktop casings to Mitac (the parent company).
- Jabil is a major handset EMS company. Jabil acquired Taiwan Green Point in 2006.
Taiwan Green Point is now under Jabil’s material technology group, offering plastic
and metal casing solutions.
Catcher/FTC still lead; Pegatron/Quanta runners-up …
We try to rank each casing supplier’s capability using the following criteria:
(1) Production scale
(2) Yield rates
(3) Group support (from both assembly and financial support)
Based on our industry checks, we believe Catcher and Foxconn Tech still lead in terms
of capacity (both with >10,000 CNC machines), yield rates and financial strength (both are
in a net cash position). Pegatron’s casing subsidiary (Riteng) and Quanta’s casing
subsidiary are the runners-up, as both benefit from Apple’s supply chain diversification
together with strong financial and assembly support from the parent company. Ju Teng
benefits from the trend of hybrid casing, as it moves up from lower-margin plastic casing to
higher-margin hybrid casings. Getac is also exploring growth opportunities in glass fibre.
… but competition is catching up An analysis of 1H12 net profits suggests that Catcher still accounts for >50% of the
group’s net profit (the group includes Catcher, Foxconn Tech, Ju Teng and Riteng),
followed by Foxconn Tech (25%-30%), Ju Teng (10%-15%) and Riteng (5%-10%).
However, we note that Catcher’s 1H12 net profit was flattish YoY, while the group’s net
profit was up 10%-15% YoY in 1H12. On the other hand, Ju Teng showed the strongest
YoY net profit improvement (up 133% YoY) in 1H12, on a positive product mix change and
higher utilisation rates. Of note, Pegatron made most of its 1H12 net profit in 2Q12, as it
resumed its production in March 2012.
Figure 31: 1H12 casing net profit comparison
0
500
1,000
1,500
2,000
2,500
3,000
3,500
4,000
4,500
5,000
Catcher FTC JuTeng Riteng
Net profits(NT$mn)
Source: Company data
We believe Catcher and
Foxconn Tech still lead in
terms of capacity, yield rates
and financial strength.
However, we think
competition is catching up

28 September 2012
Taiwan Component Sector 15
Prefer Foxconn Tech and Pegatron We advise investors to stick to technology leaders with parent company support, such as
Foxconn Tech (OUTPERFORM). Foxconn Tech also benefits from a new product cycle
(iPhone 5). We think Catcher’s (NEUTRAL) revenue growth has peaked in 2012, and its
growth outlook is uncertain with more competition from EMS/ODMs’ casing subsidiaries.
We also like Pegatron (OUTPERFORM) on potentially better leverage from its key
smartphone and PC customers, which should drive its ROE improvement in the long term.
Catcher (2474 TT, NEUTRAL) Casing strategy
Catcher is the leading metal casing supplier globally, in terms of revenue and profitability,
which proves its competitive advantages in technology and production scale. As a result,
Catcher normally enjoys higher growth and margins when there is new casing design
coming out. However, the lack of parent company support puts Catcher in a relatively
weak position to secure major allocation when the technology is relatively mature. Its
heavy investment in unibody casing could be a margin headwind if the unibody design is
no longer in favour.
3Q outlook dampened by prolonged model transition
We expect Catcher’s revenue to decline 8% QoQ in 3Q12, versus the guidance of “at best
flattish QoQ”, given muted notebook demand, prolonged model transition (for its major
notebook customer) and weak smartphone customer mix. The falling scale is likely to
cause margin decline to 43%.
4Q12 riding on new tablet and 13-inch notebook models
4Q12 revenue should see a 10%-15% QoQ rebound, off a lower base, driven by its share
gains at two new tablet projects (one internal frame and one outside unibody casing), and
the launch of 13-inch high-end notebooks. However, the higher unibody casing spec for
the new 7.85-inch tablet could bring margin headwinds.
Increasing earnings risk in 2013
We fine-tune our FY12-14 EPS estimates by 3%, factoring in slower-than-expected ramp
up for its new 13-inch NB and yield rates issues for its 7.85-inch tablet. We maintain our
NEUTRAL rating and target price of NT$155 (based on 12x FY13 P/E), as (1) we expect
August revenue to mark the bottom in the near term, with shipments of new high-end 13-
inch notebooks (in September) and small-sized tablets (delayed to 2H of October); and (2)
the stock has underperformed the TAIEX by 29% in the past three months.
However, we are reluctant to push higher, given an increased earnings risk in 2013, due to:
(1) competition (newcomers are ramping up capacity with improving yield rates after two
years of learning curve); (2) lack of solid smartphone customer mix (Catcher indicated
smartphone revenue would decline in the next one-three quarters); and (3) the trend of
hybrid casings (not necessary unibody). These could result in margin headwinds for Catcher.
Figure 32: Difficult to repeat robust revenue growth Figure 33: Catcher is the only Apple casing supplier
without parent company support
Catcher's quarterly revenue vs. Apple NB shipment
0
2,000
4,000
6,000
8,000
10,000
12,000
1Q09 3Q09 1Q10 3Q10 1Q11 3Q11 1Q12 3Q12E 1Q13E 3Q13E
(NT$ mn)
0
700
1,400
2,100
2,800
3,500
4,200
4,900
5,600
(K units)
Catcher's quarterly revenue (NT$ mn), LHS Apple's quarterly NB shipment (k), RHS
Source: Company data, Credit Suisse estimates Note: Trademarked icons used; Source: Company data, Credit Suisse estimates
Catcher still leads in terms
of revenue and profitability,
due to its competitive
advantages in technology
and production scale.
However, we are reluctant
to push higher, given an
increased earnings risk

28 September 2012
Taiwan Component Sector 16
Foxconn Tech (2354 TT, OUTPERFORM)
Casing strategy
Foxconn Tech is the second-largest metal casing supplier, benefiting from its parent
company Hon Hai’s tight relationship with Apple. However, the flip side is there is always
profit sharing between these two companies. Other than metal casing, Foxconn Tech also
makes thermal modules and assembles game consoles for Nintendo. As a result, its
revenue fluctuates with the game console assembly business, but its profit has higher
correlation to metal casing.
Strong 2H outlook, driven by iPhone 5, refreshed iPod and Wii U
We model 81% QoQ revenue growth for 3Q12. This will require flattish MoM revenue in
September that looks achievable, driven by refreshed game console models and a gradual
ramp up of new smartphone casings. Gross margins are likely to see a milder QoQ drop,
due to an unfavourable product mix (more lower-margin game consoles) and yield rates
issues for iPhone 5 casing. Separately, according to Foxconn Tech’s official
announcement on 30 August 2012, it will reverse the non-cash investment loss from Sharp
investment in 3Q12, which is about NT$2.1 bn (or NT$1.7/share).
We believe 4Q revenue largely depends on Wii U demand, but margins should see QoQ
improvement, given improving yield rates for iPhone 5 casing off a bigger volume.
A new product cycle
We rate Foxconn Tech an OUTPERFORM with a NT$132 target price, based on 13x 12-
month forward EPS. We expect Foxconn Tech to benefit from the new product cycle
(iPhone 5). Its monthly sales should also be supportive, on refreshed game console
models, the iPhone 5 and the refreshed iPod.
While we are positive on Foxconn Tech’s product cycle story, we think near-term
sentiment on the stock could be impacted by yield rates issues at iPhone (from both
assembly and casing). However, we believe the shortfall in iPhone 5 delivery is more a
supply-side issue, instead of a demand-side issue, and yield rates should also improve
over time.
Figure 34: Foxconn Tech to benefit from new product cycle with new design
Al unibody in iPhone 5 Diamond cutting in iPhone 5 Colorful iPod Touch
Source: Company website
With its tight relationship
with Hon Hai, we expect
Foxconn Tech to ride on the
product cycle story,
although near-term
sentiment on the stock could
be impacted by the yield
rate issues at iPhone

28 September 2012
Taiwan Component Sector 17
Pegatron (4938 TT, OUTPERFORM)
Coverage analyst: Thompson Wu
Casing strategy
Casetek Holdings is a Pegatron subsidiary (75.95% owned as of 2Q12). Casetek includes
all Pegatron’s light metal casing investments, of which, Riteng is the largest. Riteng
specialises in medium- to large-size metal casing, but is also involved in some component
assembly business. The company’s utilisation improved to 80%-90% in 2Q12 from 60-
70% in 1Q12 following an unfortunate explosion in 4Q11. We expect its 3Q12 revenue to
improve over 2Q12, driven by orders from its key customer(s), which we believe is Apple.
Other income forecasts increased for Riteng post 2Q12 results
We believe the higher utilization has resulted in stronger net income at Riteng in 2Q12,
which we estimate was close to NT$600 million. On 75.95% stakes held by Pegatron as of
2Q12, we estimate it contributed NT$400-500 million to Pegatron, or roughly 50% of
Pegatron’s 2Q12 investment income. After Pegatron’s 2Q12 results, we lifted our
2012/13E other income (expenses) to NT$3.6 mn/NT$5.1 mn primarily from Riteng by
extrapolating from 2Q’s run rate.
Pegatron’s Q3 notebook shipment guidance may be under pressure
After Pegatron released its August monthly sales, its QTD revenues are tracking ahead of
our expectation due to better than expected July monthly sales, despite a sub-seasonal
August. It said its QTD revenues in CE and Communication are tracking in line with its
guidance of 15-20% and flat QoQ growth, respectively. We believe its notebook shipments
led to the sub-seasonal August sales. On notebook shipments, it will need to ship 2.3
million notebooks in September, or 100.0% MoM to reach our 3Q12 shipment estimate of
4.8 million (-10.3 QoQ). Seasonally, its September notebook shipments increase 7.2%
MoM. Given the macro environment and Win 8 transition, we believe there are risks to
Pegatron's 3Q12 notebook (including netbook) guidance of 15-20% QoQ decline and our
estimates.
Reiterate OUTPERFORM on potentially better leverage
The potential downward revision in its 3Q12 notebook guidance could be a near term
pressure in its share price. Nevertheless, we expect it could leverage its 1H12 upfront
costs as it ramps up new tablet products, and may be able to expand into new products by
leveraging its key smartphone and PC customers. In turn, this should drive its long-term
ROE improvement. We maintain an OUTPERFORM rating, and target price of NT$46
based on 1.0x 2013 BV/share.
Despite the downside risks
at its Q3 NB shipment, we
continue to favour Pegatron
as we expect the company
to leverage its 1H12 upfront
costs for the ramp-up of new
products in 2H12
28 September 2012
Taiwan Component Sector 18
Ju Teng (9136 TT, NOT RATED)
Casing strategy
Ju Teng is a leading NB/tablet casing supplier with a variety casing offerings, including
plastic, light metal, glass fibre and carbon fibre. The company has a diversified customer
base that includes worldwide brand names as well as OEM/ODM customers. Ju Teng has
a ~30% market share in the global plastic casing market.
Ju Teng believes ultrabook demand will largely depend on price points. Instead, the
company is more positive on ‘ultra-like’ devices, given their better form-factors (compared
with regular NB) but cheaper price points (compared with ultrabooks). Ju Teng believes
the trend for more ‘ultra-like’ devices should boost demand for ‘hybrid’ casing designs.
Unlike its major competitors, such as Catcher/Foxconn Tech (focusing on light metal
casing) and Hon Hai/Huan Hsin (focusing on plastic casing), Ju Teng believes that it is the
only casing supplier that can offer one-stop shopping services to NB/tablet customers by
providing a variety of casings including plastic, light metal (stamping, thixomolding,
unibody), glass fibre and carbon fibre. This in turn helps its customers shorten the time-to-
market and reduce logistic costs.
Ju Teng claims that its unique market position, and timely capacity expansion along with
JVs with NB ODMs (such as Compal and Wistron) have helped it capture growing demand
for hybrid casing designs; this has led to its market share gains since 2H11.
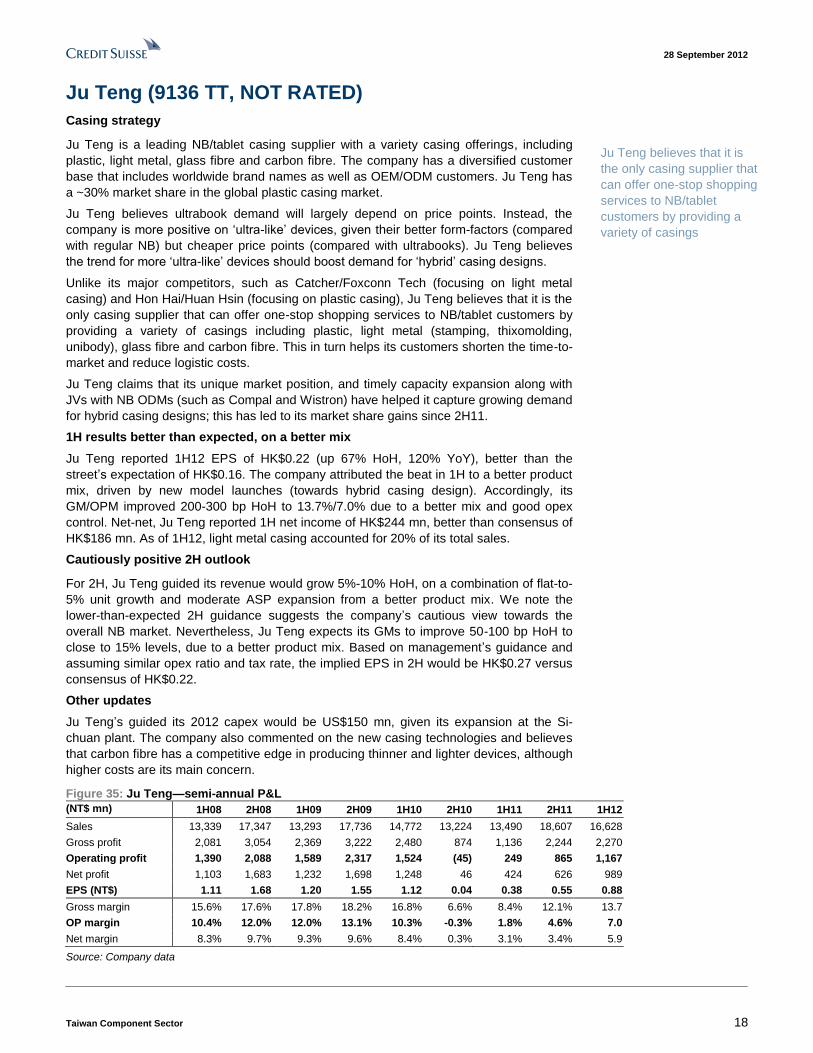
1H results better than expected, on a better mix
Ju Teng reported 1H12 EPS of HK$0.22 (up 67% HoH, 120% YoY), better than the
street’s expectation of HK$0.16. The company attributed the beat in 1H to a better product
mix, driven by new model launches (towards hybrid casing design). Accordingly, its
GM/OPM improved 200-300 bp HoH to 13.7%/7.0% due to a better mix and good opex
control. Net-net, Ju Teng reported 1H net income of HK$244 mn, better than consensus of
HK$186 mn. As of 1H12, light metal casing accounted for 20% of its total sales.
Cautiously positive 2H outlook
For 2H, Ju Teng guided its revenue would grow 5%-10% HoH, on a combination of flat-to-
5% unit growth and moderate ASP expansion from a better product mix. We note the
lower-than-expected 2H guidance suggests the company’s cautious view towards the
overall NB market. Nevertheless, Ju Teng expects its GMs to improve 50-100 bp HoH to
close to 15% levels, due to a better product mix. Based on management’s guidance and
assuming similar opex ratio and tax rate, the implied EPS in 2H would be HK$0.27 versus
consensus of HK$0.22.
Other updates
Ju Teng’s guided its 2012 capex would be US$150 mn, given its expansion at the Si-
chuan plant. The company also commented on the new casing technologies and believes
that carbon fibre has a competitive edge in producing thinner and lighter devices, although
higher costs are its main concern.
Figure 35: Ju Teng—semi-annual P&L
(NT$ mn) 1H08 2H08 1H09 2H09 1H10 2H10 1H11 2H11 1H12
Sales 13,339 17,347 13,293 17,736 14,772 13,224 13,490 18,607 16,628
Gross profit 2,081 3,054 2,369 3,222 2,480 874 1,136 2,244 2,270
Operating profit 1,390 2,088 1,589 2,317 1,524 (45) 249 865 1,167
Net profit 1,103 1,683 1,232 1,698 1,248 46 424 626 989
EPS (NT$) 1.11 1.68 1.20 1.55 1.12 0.04 0.38 0.55 0.88
Gross margin 15.6% 17.6% 17.8% 18.2% 16.8% 6.6% 8.4% 12.1% 13.7
OP margin 10.4% 12.0% 12.0% 13.1% 10.3% -0.3% 1.8% 4.6% 7.0
Net margin 8.3% 9.7% 9.3% 9.6% 8.4% 0.3% 3.1% 3.4% 5.9
Source: Company data
Ju Teng believes that it is
the only casing supplier that
can offer one-stop shopping
services to NB/tablet
customers by providing a
variety of casings

28 September 2012
Taiwan Component Sector 19
Appendix Consensus estimates: Only Ju Teng experiencing
upward revisions
According to Bloomberg, only Ju Teng is witnessing consensus’ upward estimate
revisions, due to its positive mix shift from lower-margin plastic casings to higher-margin
hybrid casings. FTC’s consensus estimates also saw a slight uptick recently, after its
announcement of reversing the Sharp non-cash investment loss in 3Q12 and strong
monthly sales in July and August. Catcher, on the other hand, saw consensus downward
revisions post its profit warnings.
Figure 36: Catcher—consensus EPS estimate changes Figure 37: FTC—consensus EPS estimate changes
10.00
12.00
14.00
16.00
18.00
20.00
22.00
Jan-
12
Feb
-12
Mar
-12
Apr
-12
May
-12
Jun-
12
Jul-1
2
Aug
-12
Sep
-12
(NT$)
Catcher 2012E EPS Catcher 2013E EPS
5.00
6.00
7.00
8.00
9.00
10.00
11.00
Jan-
12
Feb
-12
Mar
-12
Apr
-12
May
-12
Jun-
12
Jul-1
2
Aug
-12
Sep
-12
(NT$)
FTC 2012E EPS FTC 2013E EPS
Source: Bloomberg I/B/E/S estimates Source: Bloomberg I/B/E/S estimates
Figure 38: Pegatron—consensus EPS estimate changes Figure 39: Ju Teng—consensus EPS estimate changes
1.50
2.00
2.50
3.00
3.50
4.00
4.50
5.00
Jan-
12
Feb
-12
Mar
-12
Apr
-12
May
-12
Jun-
12
Jul-1
2
Aug
-12
Sep
-12
(NT$)
Pegatron 2012E EPS Pegatron 2013E EPS
0.00
0.10
0.20
0.30
0.40
0.50
0.60
Jan-
12
Feb
-12
Mar
-12
Apr
-12
May
-12
Jun-
12
Jul-1
2
Aug
-12
Sep
-12
(NT$)
Ju Teng 2012E EPS Ju Teng 2013E EPS
Source: Bloomberg I/B/E/S estimates Source: Bloomberg I/B/E/S estimates

28 September 2012
Taiwan Component Sector 20
QFII portfolio weighting
The QFII portfolio weighting suggests that the market has little interest in Ju Teng, likely
due to its poor liquidity (daily trading value of US$0.8 mn) and a lack of street coverage
(only seven brokers are covering the stock). Foxconn Tech’s QFII portfolio weighting is at
a historical average, despite moving into a positive product cycle, likely due to its poor
financial transparency. Catcher’s QFII portfolio weighting has come down sharply post
profit warnings, but it is still above the historical average. Pegatron’s QFII portfolio
weighting has been steadily increasing, suggesting the market’s increasing confidence on
its execution.
Figure 40: Catcher—QFII holdings Figure 41: FTC—QFII holdings
Source: Company data, TEJ Source: Company data, TEJ
Figure 42: Pegatron—QFII holdings Figure 43: Ju Teng—QFII holdings
Source: Company data, TEJ Source: Company data, TEJ
28 September 2012
Taiwan Component Sector 21
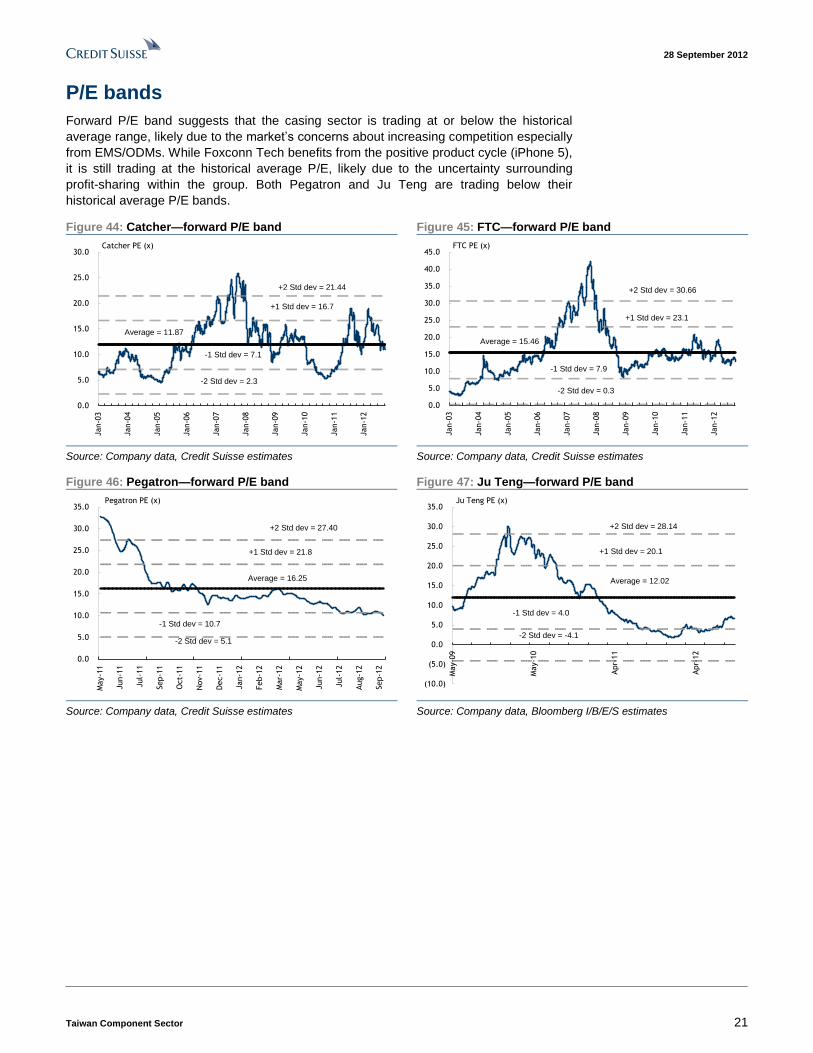
P/E bands
Forward P/E band suggests that the casing sector is trading at or below the historical
average range, likely due to the market’s concerns about increasing competition especially
from EMS/ODMs. While Foxconn Tech benefits from the positive product cycle (iPhone 5),
it is still trading at the historical average P/E, likely due to the uncertainty surrounding
profit-sharing within the group. Both Pegatron and Ju Teng are trading below their
historical average P/E bands.
Figure 44: Catcher—forward P/E band Figure 45: FTC—forward P/E band
0.0
5.0
10.0
15.0
20.0
25.0
30.0
Jan-0
3
Jan-0
4
Jan-0
5
Jan-0
6
Jan-0
7
Jan-0
8
Jan-0
9
Jan-1
0
Jan-1
1
Jan-1
2
Average = 11.87
+1 Std dev = 16.7
-1 Std dev = 7.1
+2 Std dev = 21.44
-2 Std dev = 2.3
Catcher PE (x)
0.0
5.0
10.0
15.0
20.0
25.0
30.0
35.0
40.0
45.0
Jan-0
3
Jan-0
4
Jan-0
5
Jan-0
6
Jan-0
7
Jan-0
8
Jan-0
9
Jan-1
0
Jan-1
1
Jan-1
2
Average = 15.46
+1 Std dev = 23.1
-1 Std dev = 7.9
+2 Std dev = 30.66
-2 Std dev = 0.3
FTC PE (x)
Source: Company data, Credit Suisse estimates Source: Company data, Credit Suisse estimates
Figure 46: Pegatron—forward P/E band Figure 47: Ju Teng—forward P/E band
0.0
5.0
10.0
15.0
20.0
25.0
30.0
35.0
May-1
1
Jun-1
1
Jul-
11
Sep-1
1
Oct-
11
Nov-1
1
Dec-1
1
Jan-1
2
Feb-1
2
Mar-
12
May-1
2
Jun-1
2
Jul-
12
Aug-1
2
Sep-1
2
Average = 16.25
+1 Std dev = 21.8
-1 Std dev = 10.7
+2 Std dev = 27.40
-2 Std dev = 5.1
Pegatron PE (x)
(10.0)
(5.0)
0.0
5.0
10.0
15.0
20.0
25.0
30.0
35.0
May-0
9
May-1
0
Apr-
11
Apr-
12
Average = 12.02
+1 Std dev = 20.1
-1 Std dev = 4.0
+2 Std dev = 28.14
-2 Std dev = -4.1
Ju Teng PE (x)
Source: Company data, Credit Suisse estimates Source: Company data, Bloomberg I/B/E/S estimates
28 September 2012
Taiwan Component Sector 22
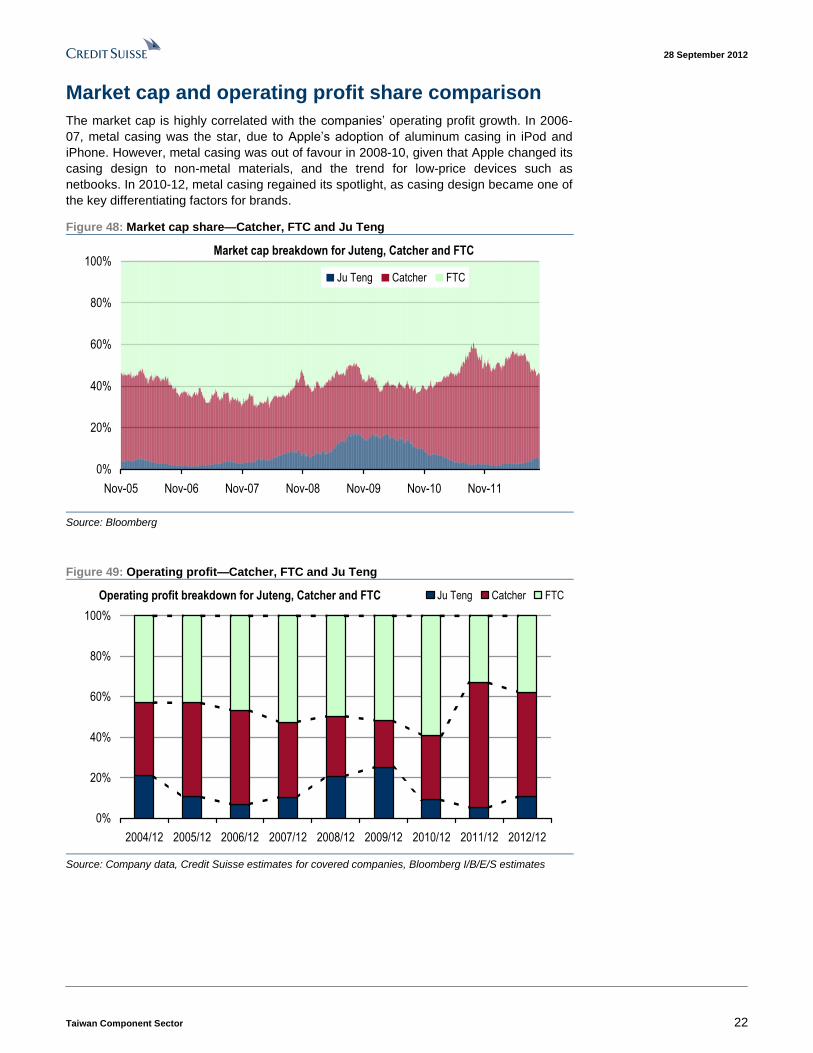
Market cap and operating profit share comparison
The market cap is highly correlated with the companies’ operating profit growth. In 2006-
07, metal casing was the star, due to Apple’s adoption of aluminum casing in iPod and
iPhone. However, metal casing was out of favour in 2008-10, given that Apple changed its
casing design to non-metal materials, and the trend for low-price devices such as
netbooks. In 2010-12, metal casing regained its spotlight, as casing design became one of
the key differentiating factors for brands.
Figure 48: Market cap share—Catcher, FTC and Ju Teng
Market cap breakdown for Juteng, Catcher and FTC
0%
20%
40%
60%
80%
100%
Nov-05 Nov-06 Nov-07 Nov-08 Nov-09 Nov-10 Nov-11
Ju Teng Catcher FTC
Source: Bloomberg
Figure 49: Operating profit—Catcher, FTC and Ju Teng
Operating profit breakdown for Juteng, Catcher and FTC
0%
20%
40%
60%
80%
100%
2004/12 2005/12 2006/12 2007/12 2008/12 2009/12 2010/12 2011/12 2012/12
Ju Teng Catcher FTC
Source: Company data, Credit Suisse estimates for covered companies, Bloomberg I/B/E/S estimates

28 September 2012
Taiwan Component Sector 23
Companies Mentioned (Price as of 26 Sep 12)
Acer Group (2353.TW, NT$28.50, UNDERPERFORM [V], TP NT$22.00) Amazon.com, Inc. (AMZN, $252.46, OUTPERFORM, TP $270.00) Apple, Inc. (AAPL, $673.70, OUTPERFORM, TP $750.00) Asustek, Inc. (2357.TW, NT$313.00, OUTPERFORM, TP NT$335.00) Catcher Technology (2474.TW, NT$141.00, NEUTRAL [V], TP NT$155.00) Compal Electronics (2324.TW, NT$25.85, NEUTRAL, TP NT$29.00) Dell, Inc. (DELL, $9.97, UNDERPERFORM, TP $11.00) Foxconn Technology Corp. (2354.TW, NT$112.00, OUTPERFORM [V], TP NT$132.00) Getac (3005.TW, NT$21.10, NOT RATED) Gigabyte Technology Co. (2376.TW, NT$26.65, NOT RATED) Google, Inc. (GOOG, $749.16, OUTPERFORM, TP $770.00) Hewlett-Packard (HPQ, $16.71, NEUTRAL, TP $25.00) Hon Hai Precision (2317.TW, NT$90.20, NEUTRAL, TP NT$87.27) HTC Corp. (2498.TW, NT$301.00, UNDERPERFORM [V], TP NT$230.00) Huan Hsin Holdings Ltd. (HUAN.SI, S$0.05, NOT RATED) Inventec Co Ltd. (2356.TW, NT$11.15, NOT RATED) Jabil Circuit, Inc. (JBL, $20.97, NOT RATED) Ju Teng International (9136.TW, NT$12.85, NOT RATED) Lenovo Group Ltd. (0992.HK, HK$6.35, OUTPERFORM, TP HK$7.50) Microsoft Corp. (MSFT, $30.40, OUTPERFORM, TP $38.00) Mitac International Corp. (2315.TW, NT$11.60, NOT RATED) Motorola Mobility Holdings, Inc. (MMI, $39.98) Motorola, Inc. (MOT, $50.83) Nokia (NOK1V.HE, Eu 2.12, NEUTRAL [V], TP Eu 2.00) Pegatron (4938.TW, NT$37.85, OUTPERFORM, TP NT$46.00) Quanta Computer, Inc. (2382.TW, NT$77.40, NEUTRAL, TP NT$79.00) Research In Motion Ltd. (RIMM, $6.60, NEUTRAL [V], TP $7.00) Samsung Electronics (005930.KS, W 1,325,000, OUTPERFORM, TP W 1,700,000) Sony (6758, ¥925, NEUTRAL [V], TP ¥1,750, MARKET WEIGHT) Toshiba (6502, ¥248, NEUTRAL, TP ¥280, MARKET WEIGHT) Wistron (3231.TW, NT$34.85, OUTPERFORM, TP NT$38.00) Waffer Technology Co Ltd. (6235.TW, NT$12.85) Sharp Corp. (6753, ¥207, UNDERPERFORM, TP ¥200, MARKET WEIGHT) Nintendo (7974, ¥9,940, NEUTRAL, TP ¥12,500, MARKET WEIGHT)
Disclosure Appendix Important Global Disclosures
Pauline Chen & Thompson Wu each certify, with respect to the companies or securities that he or she analyzes, that (1) the views expressed in this report accurately reflect his or her personal views about all of the subject companies and securities and (2) no part of his or her compensation was, is or will be directly or indirectly related to the specific recommendations or views expressed in this report.
See the Companies Mentioned section for full company names.
3-Year Price, Target Price and Rating Change History Chart for 2474.TW
2474.TW Closing
Price
Target
Price
Initiation/
Date (NT$) (NT$) Rating Assumption
8-Oct-09 82.8 85
19-Mar-10 71.8 71
15-Jun-10 69.4 80
14-Oct-10 77.2 90 O
7-Dec-10 102 115
10-Jan-11 109 120
28-Feb-11 124 140
18-Apr-11 167 186
26-Jul-11 248.5 286
27-Sep-11 164 210
30-Nov-11 141.5 178
21-Feb-12 199 220
24-Apr-12 196 225
31-Jul-12 145 140 U
12-Sep-12 146 155 N
8571
8090
115120
140
186
286
210
178
220 225
140155
NU
O63
113
163
213
263
28-S
ep-0
9
28-N
ov-0
9
28-J
an-1
0
28-M
ar-1
0
28-M
ay-1
0
28-J
ul-10
28-S
ep-1
0
28-N
ov-1
0
28-J
an-1
1
28-M
ar-1
1
28-M
ay-1
1
28-J
ul-11
28-S
ep-1
1
28-N
ov-1
1
28-J
an-1
2
28-M
ar-1
2
28-M
ay-1
2
28-J
ul-12
Closing Price Target Price Initiation/Assumption Rating
NT$
O=Outperform; N=Neutral; U=Underperform; R=Restricted; NR=Not Rated; NC=Not Covered
28 September 2012
Taiwan Component Sector 24
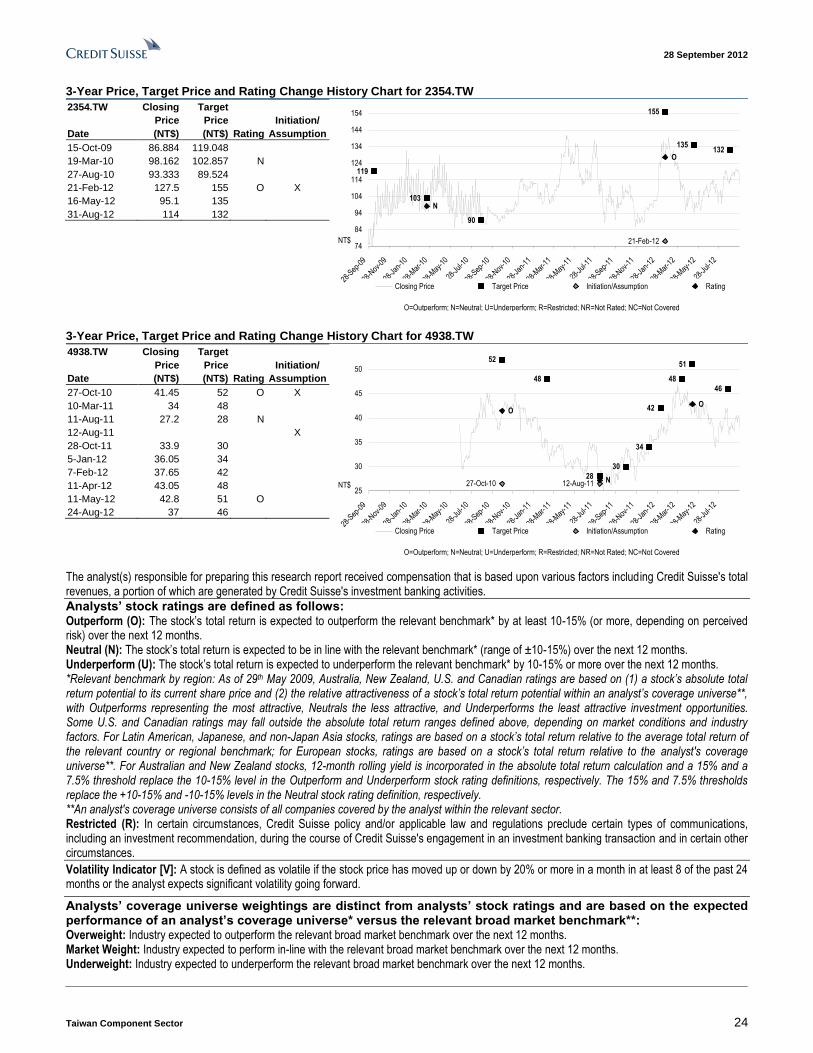
3-Year Price, Target Price and Rating Change History Chart for 2354.TW
2354.TW Closing
Price
Target
Price
Initiation/
Date (NT$) (NT$) Rating Assumption
15-Oct-09 86.884 119.048
19-Mar-10 98.162 102.857 N
27-Aug-10 93.333 89.524
21-Feb-12 127.5 155 O X
16-May-12 95.1 135
31-Aug-12 114 132
119
103
90
155
135132
21-Feb-12
O
N
74
84
94
104
114
124
134
144
154
28-S
ep-0
9
28-N
ov-0
9
28-J
an-1
0
28-M
ar-1
0
28-M
ay-1
0
28-J
ul-10
28-S
ep-1
0
28-N
ov-1
0
28-J
an-1
1
28-M
ar-1
1
28-M
ay-1
1
28-J
ul-11
28-S
ep-1
1
28-N
ov-1
1
28-J
an-1
2
28-M
ar-1
2
28-M
ay-1
2
28-J
ul-12
Closing Price Target Price Initiation/Assumption Rating
NT$
O=Outperform; N=Neutral; U=Underperform; R=Restricted; NR=Not Rated; NC=Not Covered
3-Year Price, Target Price and Rating Change History Chart for 4938.TW
4938.TW Closing
Price
Target
Price
Initiation/
Date (NT$) (NT$) Rating Assumption
27-Oct-10 41.45 52 O X
10-Mar-11 34 48
11-Aug-11 27.2 28 N
12-Aug-11 X
28-Oct-11 33.9 30
5-Jan-12 36.05 34
7-Feb-12 37.65 42
11-Apr-12 43.05 48
11-May-12 42.8 51 O
24-Aug-12 37 46
52
48
28
30
34
42
48
51
46
27-Oct-10 12-Aug-11
O
N
O
25
30
35
40
45
50
28-S
ep-0
9
28-N
ov-0
9
28-J
an-1
0
28-M
ar-1
0
28-M
ay-1
0
28-J
ul-10
28-S
ep-1
0
28-N
ov-1
0
28-J
an-1
1
28-M
ar-1
1
28-M
ay-1
1
28-J
ul-11
28-S
ep-1
1
28-N
ov-1
1
28-J
an-1
2
28-M
ar-1
2
28-M
ay-1
2
28-J
ul-12
Closing Price Target Price Initiation/Assumption Rating
NT$
O=Outperform; N=Neutral; U=Underperform; R=Restricted; NR=Not Rated; NC=Not Covered
The analyst(s) responsible for preparing this research report received compensation that is based upon various factors including Credit Suisse's total revenues, a portion of which are generated by Credit Suisse's investment banking activities.
Analysts’ stock ratings are defined as follows: Outperform (O): The stock’s total return is expected to outperform the relevant benchmark* by at least 10-15% (or more, depending on perceived risk) over the next 12 months. Neutral (N): The stock’s total return is expected to be in line with the relevant benchmark* (range of ±10-15%) over the next 12 months. Underperform (U): The stock’s total return is expected to underperform the relevant benchmark* by 10-15% or more over the next 12 months. *Relevant benchmark by region: As of 29th May 2009, Australia, New Zealand, U.S. and Canadian ratings are based on (1) a stock’s absolute total return potential to its current share price and (2) the relative attractiveness of a stock’s total return potential within an analyst’s coverage universe**, with Outperforms representing the most attractive, Neutrals the less attractive, and Underperforms the least attractive investment opportunities. Some U.S. and Canadian ratings may fall outside the absolute total return ranges defined above, depending on market conditions and industry factors. For Latin American, Japanese, and non-Japan Asia stocks, ratings are based on a stock’s total return relative to the average total return of the relevant country or regional benchmark; for European stocks, ratings are based on a stock’s total return relative to the analyst's coverage universe**. For Australian and New Zealand stocks, 12-month rolling yield is incorporated in the absolute total return calculation and a 15% and a 7.5% threshold replace the 10-15% level in the Outperform and Underperform stock rating definitions, respectively. The 15% and 7.5% thresholds replace the +10-15% and -10-15% levels in the Neutral stock rating definition, respectively. **An analyst's coverage universe consists of all companies covered by the analyst within the relevant sector. Restricted (R): In certain circumstances, Credit Suisse policy and/or applicable law and regulations preclude certain types of communications, including an investment recommendation, during the course of Credit Suisse's engagement in an investment banking transaction and in certain other circumstances.
Volatility Indicator [V]: A stock is defined as volatile if the stock price has moved up or down by 20% or more in a month in at least 8 of the past 24 months or the analyst expects significant volatility going forward.
Analysts’ coverage universe weightings are distinct from analysts’ stock ratings and are based on the expected performance of an analyst’s coverage universe* versus the relevant broad market benchmark**: Overweight: Industry expected to outperform the relevant broad market benchmark over the next 12 months. Market Weight: Industry expected to perform in-line with the relevant broad market benchmark over the next 12 months. Underweight: Industry expected to underperform the relevant broad market benchmark over the next 12 months.

28 September 2012
Taiwan Component Sector 25
*An analyst’s coverage universe consists of all companies covered by the analyst within the relevant sector. **The broad market benchmark is based on the expected return of the local market index (e.g., the S&P 500 in the U.S.) over the next 12 months.
Credit Suisse’s distribution of stock ratings (and banking clients) is:
Global Ratings Distribution Outperform/Buy* 44% (52% banking clients) Neutral/Hold* 42% (50% banking clients) Underperform/Sell* 11% (39% banking clients) Restricted 2%
*For purposes of the NYSE and NASD ratings distribution disclosure requirements, our stock ratings of Outperform, Neutral, and Underperform most closely correspond to Buy, Hold, and Sell, respectively; however, the meanings are not the same, as our stock ratings are determined on a relative basis. (Please refer to definitions above.) An investor's decision to buy or sell a security should be based on investment objectives, current holdings, and other individual factors.
Credit Suisse’s policy is to update research reports as it deems appropriate, based on developments with the subject company, the sector or the market that may have a material impact on the research views or opinions stated herein.
Credit Suisse's policy is only to publish investment research that is impartial, independent, clear, fair and not misleading. For more detail please refer to Credit Suisse's Policies for Managing Conflicts of Interest in connection with Investment Research: http://www.csfb.com/research-and-analytics/disclaimer/managing_conflicts_disclaimer.html
Credit Suisse does not provide any tax advice. Any statement herein regarding any US federal tax is not intended or written to be used, and cannot be used, by any taxpayer for the purposes of avoiding any penalties.
See the Companies Mentioned section for full company names. Price Target: (12 months) for (2474.TW) Method: Our target price of NT$155 for Catcher is based on 12x FY13E EPS. We use 12x, versus its historical trading range of 8-25x. We believe the stock is likely to see strong near-term momentum. However, we are reluctant to push higher, given increase in earnings risks in 2013, from (1) competition, (2) its lack of solid smartphone customer mix, and (3) the trend for hybrid casings. These could be margin headwinds. Risks: Risks to our NT$155 target price for Catcher may include: (1) high customer concentration which could lead to higher volatility in earnings, (2) competitors' yield rates issues, (3) Asian currency appreciation, and (4) end-market demand. Price Target: (12 months) for (2354.TW) Method: We set our NT$132 target price for Foxconn based on 13x 12-month forward P/E, versus its historical trading range of 9-20x, justified for a new product cycle (new iPhone). Risks: The risk to our target price of NT$132 for Foxconn Technology include: 1) the exact launch timing of new iPhone, 2) high CAPEX may be a risk to margins, 3) potential profit-sharing scheme between Foxconn Tech and Hon Hai would impact our EPS estimates, 4) potential fund raising plans may pose risks to our EPS and 5) potential losses from Sharp investment in 2012. Price Target: (12 months) for (4938.TW) Method: We use book value for Pegatron's valuation methodology. Our NT$46 target price is derived by applying an historical average multiple of 1x on 2013E book value per share. We believe the stock deserves to trade at least in line with its peer group, as it has shown that it can be a viable Tier 1 ODM, and has established itself as a key second source EMS partner to Apple iPhone, in our view. Risks: Risks to our NT$46 12 month target price for Pegatron include the following: 1) As key customers for Pegatron, end-demand for ASUS and Apple products that pass through Pegatron will be critical, and depending on orders, 2) Pegatron continues to expand its reach beyond PC into other segments including consumer electronics and broadband & networking. In consumer electronics, we believe that Pegatron is a key partner with a leading video game console brand, thus any volatility with orders could be a risk, and 3) Pegatron's LCD TV business is in a distant third behind that of Compal and Wistron. We believe the company's current volumes in LCD TVs, compounded by the significant capital requirements needed to expand, is making this business venture lose money for now. Key risks also include Asus's potential stake-sale in May/June, concerns on PC demand, ECB conversion at NT$42, and higher capex levels in 2012.
Please refer to the firm's disclosure website at www.credit-suisse.com/researchdisclosures for the definitions of abbreviations typically used in the target price method and risk sections.
See the Companies Mentioned section for full company names. The subject company (2354.TW, 4938.TW) currently is, or was during the 12-month period preceding the date of distribution of this report, a client of Credit Suisse. Credit Suisse provided investment banking services to the subject company (4938.TW) within the past 12 months. Credit Suisse provided non-investment banking services, which may include Sales and Trading services, to the subject company (2354.TW) within the past 12 months. Credit Suisse expects to receive or intends to seek investment banking related compensation from the subject company (2474.TW, 4938.TW) within the next 3 months. As of the end of the preceding month, Credit Suisse beneficially owned 1% or more of a class of common equity securities of (2474.TW, 2354.TW, 4938.TW). This holding is calculated according to U.S. regulatory requirements which are based on Section 13(d) of the Securities and Exchange Act of 1934.
Important Regional Disclosures
Singapore recipients should contact a Singapore financial adviser for any matters arising from this research report.

28 September 2012
Taiwan Component Sector 26
The analyst(s) involved in the preparation of this report have not visited the material operations of the subject company (2474.TW, 2354.TW, 4938.TW) within the past 12 months.
Restrictions on certain Canadian securities are indicated by the following abbreviations: NVS--Non-Voting shares; RVS--Restricted Voting Shares; SVS--Subordinate Voting Shares. Individuals receiving this report from a Canadian investment dealer that is not affiliated with Credit Suisse should be advised that this report may not contain regulatory disclosures the non-affiliated Canadian investment dealer would be required to make if this were its own report. For Credit Suisse Securities (Canada), Inc.'s policies and procedures regarding the dissemination of equity research, please visit http://www.csfb.com/legal_terms/canada_research_policy.shtml.
The following disclosed European company/ies have estimates that comply with IFRS: JBL, NOK1V.HE.
As of the date of this report, Credit Suisse acts as a market maker or liquidity provider in the equities securities that are the subject of this report.
Principal is not guaranteed in the case of equities because equity prices are variable.
Commission is the commission rate or the amount agreed with a customer when setting up an account or at anytime after that. Taiwanese Disclosures: This research report is for reference only. Investors should carefully consider their own investment risk. Investment results are the responsibility of the individual investor. Reports may not be reprinted without permission of CS. Reports written by Taiwan-based analysts on non-Taiwan listed companies are not considered recommendations to buy or sell securities under Taiwan Stock Exchange Operational Regulations Governing Securities Firms Recommending Trades in Securities to Customers.
To the extent this is a report authored in whole or in part by a non-U.S. analyst and is made available in the U.S., the following are important disclosures regarding any non-U.S. analyst contributors: The non-U.S. research analysts listed below (if any) are not registered/qualified as research analysts with FINRA. The non-U.S. research analysts listed below may not be associated persons of CSSU and therefore may not be subject to the NASD Rule 2711 and NYSE Rule 472 restrictions on communications with a subject company, public appearances and trading securities held by a research analyst account. • Pauline Chen, non-U.S. analyst, is a research analyst employed by Credit Suisse AG, Taipei Securities Branch. • Josette Chang, non-U.S. analyst, is a research analyst employed by Credit Suisse AG, Taipei Securities Branch. • Thompson Wu, non-U.S. analyst, is a research analyst employed by Credit Suisse AG, Taipei Securities Branch. • Irene Wu, non-U.S. analyst, is a research analyst employed by Credit Suisse AG, Taipei Securities Branch.
For Credit Suisse disclosure information on other companies mentioned in this report, please visit the website at www.credit-suisse.com/researchdisclosures or call +1 (877) 291-2683. Disclaimers continue on next page.

28 September 2012
Asia Pacific/Taiwan
Equity Research
TC1738.doc
This report is not directed to, or intended for distribution to or use by, any person or entity who is a citizen or resident of or located in any locality, state, country or other jurisdiction where such distribution, publication, availability or use would be contrary to law or regulation or which would subject Credit Suisse AG, the Swiss bank, or its subsidiaries or its affiliates (“CS”) to any registration or licensing requirement within such jurisdiction. All material presented in this report, unless specifically indicated otherwise, is under copyright to CS. None of the material, nor its content, nor any copy of it, may be altered in any way, transmitted to, copied or distributed to any other party, without the prior express written permission of CS. All trademarks, service marks and logos used in this report are trademarks or service marks or registered trademarks or service marks of CS or its affiliates.
The information, tools and material presented in this report are provided to you for information purposes only and are not to be used or considered as an offer or the solicitation of an offer to sell or to buy or subscribe for securities or other financial instruments. CS may not have taken any steps to ensure that the securities referred to in this report are suitable for any particular investor. CS will not treat recipients as its customers by virtue of their receiving the report. The investments or services contained or referred to in this report may not be suitable for you and it is recommended that you consult an independent investment advisor if you are in doubt about such investments or investment services. Nothing in this report constitutes investment, legal, accounting or tax advice or a representation that any investment or strategy is suitable or appropriate to your individual circumstances or otherwise constitutes a personal recommendation to you. CS does not offer advice on the tax consequences of investment and you are advised to contact an independent tax adviser. Please note in particular that the bases and levels of taxation may change. CS believes the information and opinions in the Disclosure Appendix of this report are accurate and complete. Information and opinions presented in the other sections of the report were obtained or derived from sources CS believes are reliable, but CS makes no representations as to their accuracy or completeness. Additional information is available upon request. CS accepts no liability for loss arising from the use of the material presented in this report, except that this exclusion of liability does not apply to the extent that liability arises under specific statutes or regulations applicable to CS. This report is not to be relied upon in substitution for the exercise of independent judgment. CS may have issued, and may in the future issue, a trading call regarding this security. Trading calls are short term trading opportunities based on market events and catalysts, while stock ratings reflect investment recommendations based on expected total return over a 12-month period as defined in the disclosure section. Because trading calls and stock ratings reflect different assumptions and analytical methods, trading calls may differ directionally from the stock rating. In addition, CS may have issued, and may in the future issue, other reports that are inconsistent with, and reach different conclusions from, the information presented in this report. Those reports reflect the different assumptions, views and analytical methods of the analysts who prepared them and CS is under no obligation to ensure that such other reports are brought to the attention of any recipient of this report. CS is involved in many businesses that relate to companies mentioned in this report. These businesses include specialized trading, risk arbitrage, market making, and other proprietary trading. Past performance should not be taken as an indication or guarantee of future performance, and no representation or warranty, express or implied, is made regarding future performance. Information, opinions and estimates contained in this report reflect a judgement at its original date of publication by CS and are subject to change without notice. The price, value of and income from any of the securities or financial instruments mentioned in this report can fall as well as rise. The value of securities and financial instruments is subject to exchange rate fluctuation that may have a positive or adverse effect on the price or income of such securities or financial instruments. Investors in securities such as ADR’s, the values of which are influenced by currency volatility, effectively assume this risk. Structured securities are complex instruments, typically involve a high degree of risk and are intended for sale only to sophisticated investors who are capable of understanding and assuming the risks involved. The market value of any structured security may be affected by changes in economic, financial and political factors (including, but not limited to, spot and forward interest and exchange rates), time to maturity, market conditions and volatility, and the credit quality of any issuer or reference issuer. Any investor interested in purchasing a structured product should conduct their own investigation and analysis of the product and consult with their own professional advisers as to the risks involved in making such a purchase.
Some investments discussed in this report have a high level of volatility. High volatility investments may experience sudden and large falls in their value causing losses when that investment is realised. Those losses may equal your original investment. Indeed, in the case of some investments the potential losses may exceed the amount of initial investment, in such circumstances you may be required to pay more money to support those losses. Income yields from investments may fluctuate and, in consequence, initial capital paid to make the investment may be used as part of that income yield. Some investments may not be readily realisable and it may be difficult to sell or realise those investments, similarly it may prove difficult for you to obtain reliable information about the value, or risks, to which such an investment is exposed. This report may provide the addresses of, or contain hyperlinks to, websites. Except to the extent to which the report refers to website material of CS, CS has not reviewed the linked site and takes no responsibility for the content contained therein. Such address or hyperlink (including addresses or hyperlinks to CS’s own website material) is provided solely for your convenience and information and the content of the linked site does not in any way form part of this document. Accessing such website or following such link through this report or CS’s website shall be at your own risk. This report is issued and distributed in Europe (except Switzerland) by Credit Suisse Securities (Europe) Limited, One Cabot Square, London E14 4QJ, England, which is regulated in the United Kingdom by The Financial Services Authority (“FSA”). This report is being distributed in Germany by Credit Suisse Securities (Europe) Limited Niederlassung Frankfurt am Main regulated by the Bundesanstalt fuer Finanzdienstleistungsaufsicht ("BaFin"). This report is being distributed in the United States by Credit Suisse Securities (USA) LLC ; in Switzerland by Credit Suisse AG; in Canada by Credit Suisse Securities (Canada), Inc.; in Brazil by Banco de Investimentos Credit Suisse (Brasil) S.A. or its affiliates; in Mexico by Banco Credit Suisse (México), S.A. (transactions related to the securities mentioned in this report will only be effected in compliance with applicable regulation); in Japan by Credit Suisse Securities (Japan) Limited, Financial Instrument Firm, Director-General of Kanto Local Finance Bureau (Kinsho) No. 66, a member of Japan Securities Dealers Association, The Financial Futures Association of Japan, Japan Securities Investment Advisers Association, Type II Financial Instruments Firms Association; elsewhere in Asia/Pacific by whichever of the following is the appropriately authorised entity in the relevant jurisdiction: Credit Suisse (Hong Kong) Limited, Credit Suisse Equities (Australia) Limited , Credit Suisse Securities (Thailand) Limited, Credit Suisse Securities (Malaysia) Sdn Bhd, Credit Suisse AG, Singapore Branch, Credit Suisse Securities (India) Private Limited regulated by the Securities and Exchange Board of India (registration Nos. INB230970637; INF230970637; INB010970631; INF010970631), having registered address at 9th Floor, Ceejay House,Dr.A.B. Road, Worli, Mumbai - 18, India, T- +91-22 6777 3777, Credit Suisse Securities (Europe) Limited, Seoul Branch, Credit Suisse AG, Taipei Securities Branch, PT Credit Suisse Securities Indonesia, Credit Suisse Securities (Philippines ) Inc., and elsewhere in the world by the relevant authorised affiliate of the above. Research on Taiwanese securities produced by Credit Suisse AG, Taipei Securities Branch has been prepared by a registered Senior Business Person. Research provided to residents of Malaysia is authorised by the Head of Research for Credit Suisse Securities (Malaysia) Sdn. Bhd., to whom they should direct any queries on +603 2723 2020. In jurisdictions where CS is not already registered or licensed to trade in securities, transactions will only be effected in accordance with applicable securities legislation, which will vary from jurisdiction to jurisdiction and may require that the trade be made in accordance with applicable exemptions from registration or licensing requirements. Non-U.S. customers wishing to effect a transaction should contact a CS entity in their local jurisdiction unless governing law permits otherwise. U.S. customers wishing to effect a transaction should do so only by contacting a representative at Credit Suisse Securities (USA) LLC in the U.S. Please note that this report was originally prepared and issued by CS for distribution to their market professional and institutional investor customers. Recipients who are not market professional or institutional investor customers of CS should seek the advice of their independent financial advisor prior to taking any investment decision based on this report or for any necessary explanation of its contents. This research may relate to investments or services of a person outside of the UK or to other matters which are not regulated by the FSA or in respect of which the protections of the FSA for private customers and/or the UK compensation scheme may not be available, and further details as to where this may be the case are available upon request in respect of this report. Any Nielsen Media Research material contained in this report represents Nielsen Media Research's estimates and does not represent facts. NMR has neither reviewed nor approved this report and/or any of the statements made herein. If this report is being distributed by a financial institution other than Credit Suisse AG, or its affiliates, that financial institution is solely responsible for distribution. Clients of that institution should contact that institution to effect a transaction in the securities mentioned in this report or require further information. This report does not constitute investment advice by Credit Suisse to the clients of the distributing financial institution, and neither Credit Suisse AG, its affiliates, and their respective officers, directors and employees accept any liability whatsoever for any direct or consequential loss arising from their use of this report or its content.
Copyright 2012 CREDIT SUISSE AG and/or its affiliates. All rights reserved.