taiyo holdings co., ltd. · taiyo holdings co., ltd. (“we” or “our ”) has identified its...
TRANSCRIPT

2-7-1 Hazawa, Nerima-ku, Tokyo 176-8508, Japan
PHONE : 81-3-5999-1511
http: // www.taiyo-hd.co.jp / English
TAIYO HOLDINGS CO., LTD.
Annual Report 2015Year Ended March 31, 2015
Passion for innovation

Management Philosophy
We will realize “a pleasant society” by further advancing “every technology”
the Group has and creating a wide range of products to help fulfill the
dreams for the whole world with our innovative products.
00 01TAIYO HOLDINGS CO., LTD. Annual Report 2015TAIYO HOLDINGS CO., LTD. Annual Report 2015

Development and manufacturing division personnel have been added and new project teams are being created
with the aim of commercializing products within one to two years with particular emphasis on sales marketing.
By fostering this type of environment where employees can devote themselves to development, we are able to
create new products ahead of other companies.
Launching new project teams to get products to market sooner
Our commitment to generating value
02 03TAIYO HOLDINGS CO., LTD. Annual Report 2015TAIYO HOLDINGS CO., LTD. Annual Report 2015
Pickup
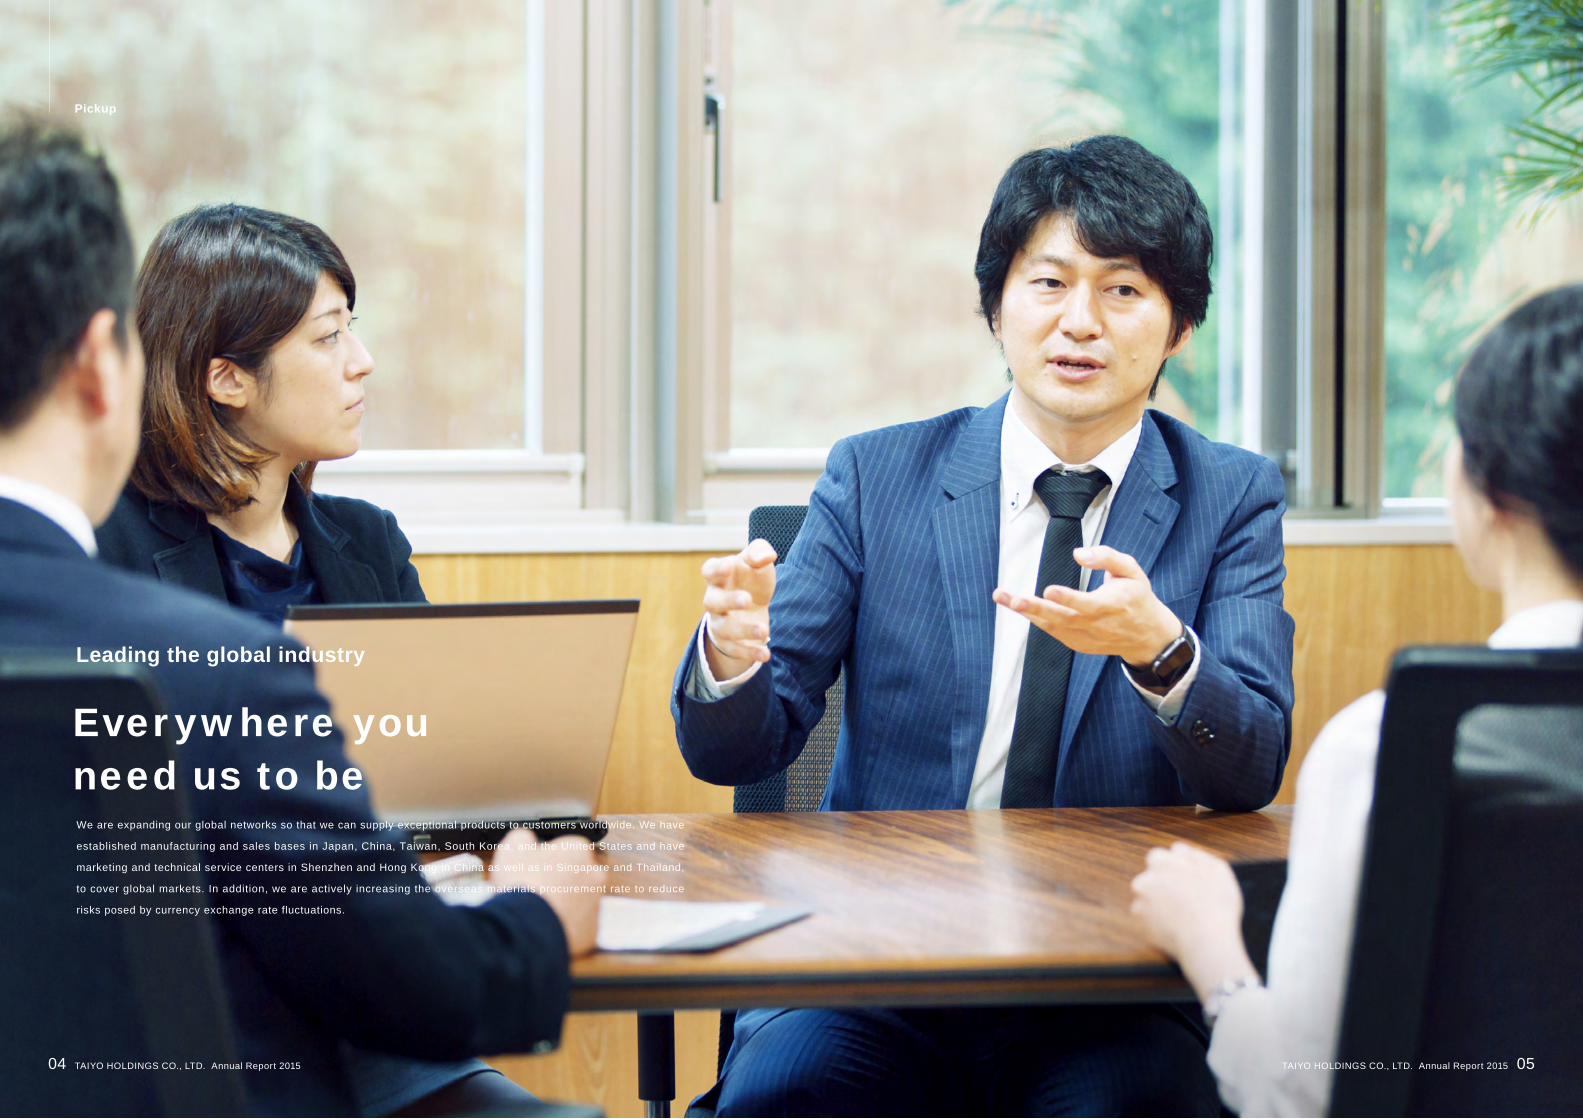
We are expanding our global networks so that we can supply exceptional products to customers worldwide. We have
established manufacturing and sales bases in Japan, China, Taiwan, South Korea, and the United States and have
marketing and technical service centers in Shenzhen and Hong Kong in China as well as in Singapore and Thailand,
to cover global markets. In addition, we are actively increasing the overseas materials procurement rate to reduce
risks posed by currency exchange rate fluctuations.
Everywhere you need us to be
Leading the global industry
04 05TAIYO HOLDINGS CO., LTD. Annual Report 2015TAIYO HOLDINGS CO., LTD. Annual Report 2015
Pickup

For the Taiyo Group to achieve continuous growth, we need all employees to be self-sufficient, that is, personnel
who are able to use opportunit ies and achieve personal growth. The Group creates such opportunit ies by
dispatching employees to universities as well as improving workplace environments so that employees can create
flexible ideas in their day-to-day work. Thanks to these innovations, in fiscal 2014, we also achieved results
including increases in sales and income.
Self-sufficient personnel are vital to the future of the group
Creating the one and only product
06 07TAIYO HOLDINGS CO., LTD. Annual Report 2015TAIYO HOLDINGS CO., LTD. Annual Report 2015
Pickup
We wil l generate profit and increase corporate value, thereby contributing to the well-being and prosperity of customers, communities, shareholders, and employees.1
We wil l discharge our corporate social responsibi l i ty with regard to the achievement of our Management Phi losophy, inc lud ing comply ing wi th the law, protect ing the envi ronment , ensuring thorough quality management, and contributing to society.
2
We will constantly create opportunities for employees to challenge and develop themselves, aiming to have a corporate group composed of people who are highly motivated to be successful and to achieve goals set by themselves.
4
We will increase our comprehensive corporate strengths by maximizing cooperation between the Group companies and strengthen the teamwork of all employees with emphasis on “speed and communication.”
5
We aim to have a group of global companies able to contribute to the realization of a pleasant society by constant ly working for technological innovation and creat ing new products and businesses.
Matters Regarding Forward- Looking Statements
This annual report contains forward-looking statements regarding Taiyo Holdings’ current management plans, strategies, and
other matters. Readers are cautioned that these forward-looking statements hold inherent risks and uncertainties, and may
differ materially from actual results or business performance.
6
We will leverage our global system to always provide superior products and services.3
Taiyo Holdings Co., Ltd. ( “we” or “our ”) has identified its objectives as a corporate group in the Management
Phi losophy and Basic Management Pol icy below. We wi l l develop by cont inuing the spir i t of our
Management Phi losophy without changes and reviewing our Basic Management Pol icies to match
changes in the environment and strategy on a long-term basis.
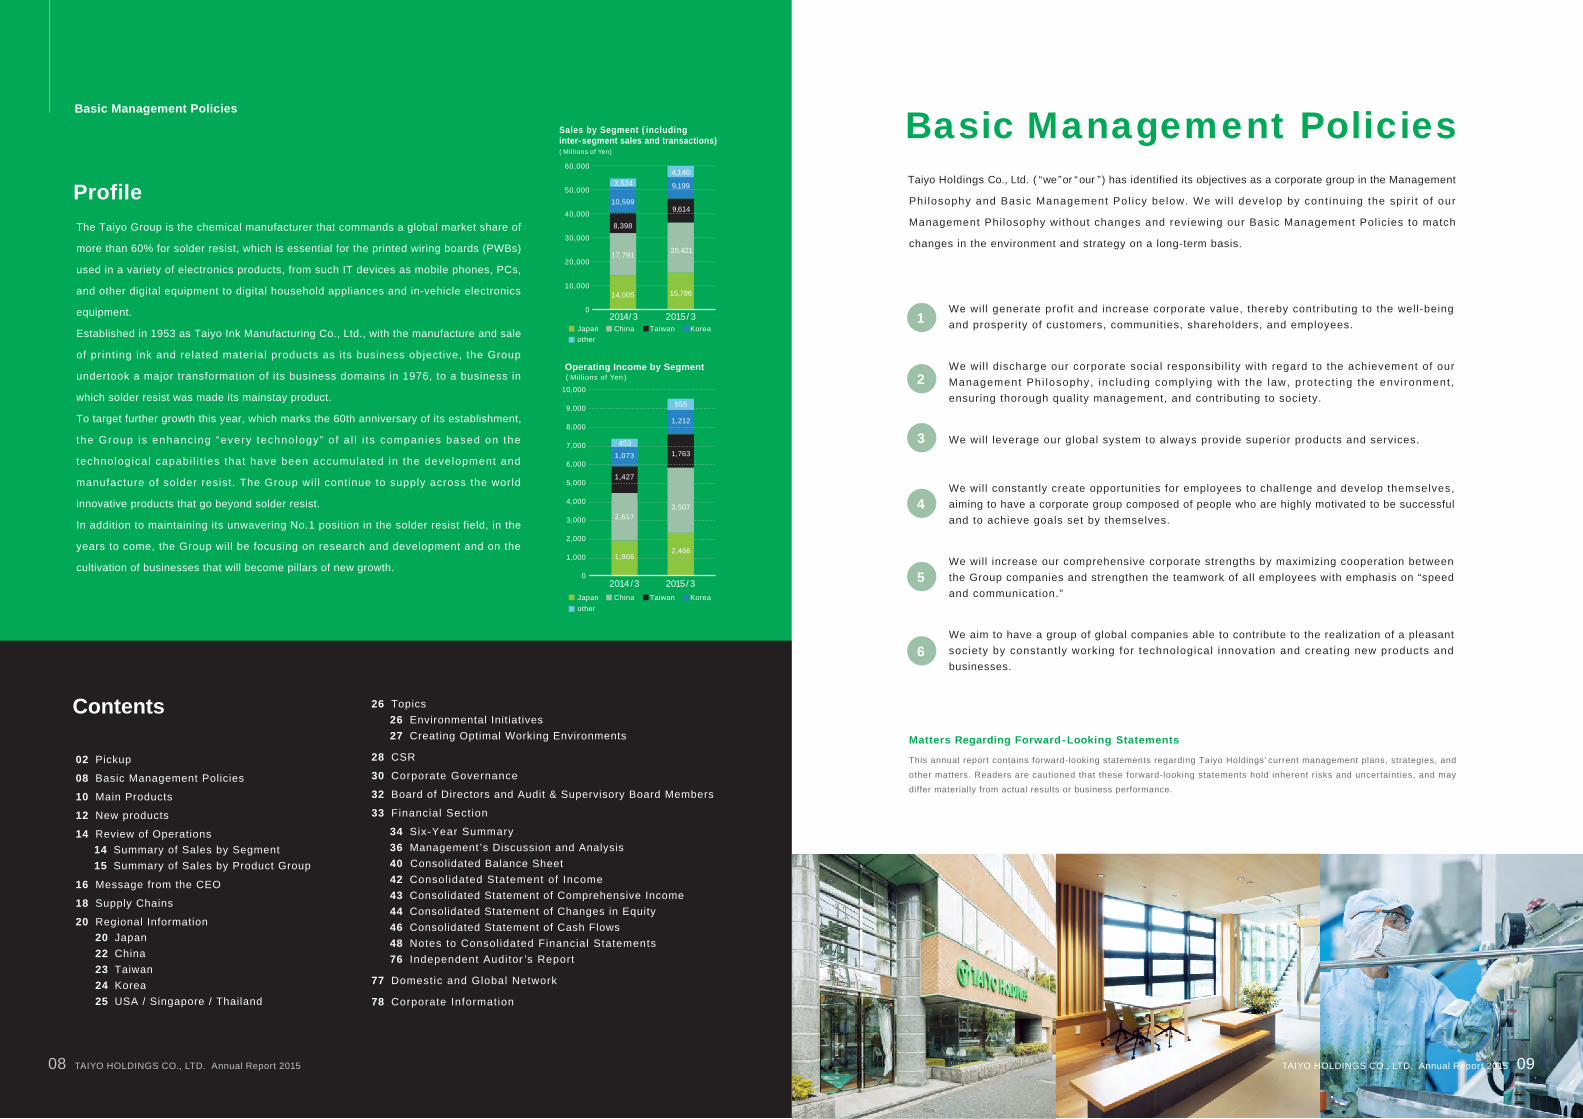
Basic Management Policies Sales by Segment ( including inter-segment sales and transactions)( Millions of Yen)
60,000
50,000
40,000
30,000
20,000
10,000
02014/ 3 2015/ 3
10,599
8,398
17,791
14,005
3,5244,140
9,199
9,614
20,421
15,786
Japan China Taiwan Koreaother
Japan China Taiwan Koreaother
Operating Income by Segment( Millions of Yen )
10,000
9,000
8,000
7,000
6,000
5,000
4,000
3,000
2,000
1,000
02014/ 3 2015/ 3
1,073
1,427
2,617
1,906
The Taiyo Group is the chemical manufacturer that commands a global market share of
more than 60% for solder resist, which is essential for the printed wiring boards (PWBs)
used in a variety of electronics products, from such IT devices as mobile phones, PCs,
and other digital equipment to digital household appliances and in-vehicle electronics
equipment.
Established in 1953 as Taiyo Ink Manufacturing Co., Ltd., with the manufacture and sale
of printing ink and related material products as its business objective, the Group
undertook a major transformation of its business domains in 1976, to a business in
which solder resist was made its mainstay product.
To target further growth this year, which marks the 60th anniversary of its establishment,
the Group is enhancing “every technology” of a l l i ts companies based on the
technological capabi l i t ies that have been accumulated in the development and
manufacture of solder resist. The Group wil l continue to supply across the world
innovative products that go beyond solder resist.
In addition to maintaining its unwavering No. 1 position in the solder resist field, in the
years to come, the Group will be focusing on research and development and on the
cultivation of businesses that will become pillars of new growth.
Profile
02 Pickup
08 Basic Management Policies
10 Main Products
12 New products
14 Review of Operations 14 Summary of Sales by Segment 15 Summary of Sales by Product Group
16 Message from the CEO
18 Supply Chains
20 Regional Information 20 Japan 22 China 23 Taiwan 24 Korea 25 USA / Singapore / Thailand
26 Topics 26 Environmental Initiatives 27 Creating Optimal Working Environments
28 CSR
30 Corporate Governance
32 Board of Directors and Audit & Supervisory Board Members
33 Financial Section
34 Six-Year Summary 36 Management ’s Discussion and Analysis 40 Consolidated Balance Sheet 42 Consolidated Statement of Income 43 Consolidated Statement of Comprehensive Income 44 Consolidated Statement of Changes in Equity 46 Consolidated Statement of Cash Flows 48 Notes to Consolidated Financial Statements 76 Independent Auditor ’s Report
77 Domestic and Global Network
78 Corporate Information
Contents
453
2,466
3,507
1,763
1,212
555
08 09TAIYO HOLDINGS CO., LTD. Annual Report 2015TAIYO HOLDINGS CO., LTD. Annual Report 2015
Basic Management Policies

Printed wiring boards (PWBs) are used in various digital consumer electronics such as mobile phones as
well as electronic products such as automobile electronics equipment. Solder resist (SR), a core product
of the Taiyo Group, protects PWBs by coating the surface of the conductor circuits, preventing short
circuits and other product problems, and making long-term, stable use possible.
Roles of Solder Resist
Liquid-Type SR
Preventing solder attachment in areas where it is not needed
When various components are mounted on a PWB, SR plays a role in
preventing short circuits that can occur as a result of solder adhering to
areas other than contacts that are electrically connected.
1
SR protects circuit patterns from the external environment including dust,
heat, and moisture. This makes it possible for electronic devices to operate
stably over extended periods.
Protecting circuit patterns from dust, heat, and moisture
2
Maintaining electrical insulation between circuit patterns
In conjunction with the miniaturization of electronic devices, package
substrates are also becoming increasingly fine with circuit patterns on
general c i rcui t boards in the 50 µm to 150 µm range. SR maintains
insulation between circuit patterns, preventing short circuits.
3
Photoimageable Solder Resist Pattern Formation Process ( Photolithography)
SR is applied to the entire surface.
1. Printing (coating)
The circuit board is heated to 150°C for 50 to 60 minutes to harden the SR.
The SR pattern formation process is complete.
Taiyo Ink SR products
5. Post-curing
The wiring board is heated to 80°C for 20 to 30 minutes and provisionally dried.
2. Pre-curing
The wiring board is exposed to ultraviolet light passed through a negative fi lm.
The SR in areas exposed to the light hardens.
3. Light exposure
The unhardened SR iswashed off using adeveloping agent (a dilute alkali water solution).
4. Developing
There are various types of SR, but Taiyo Ink was a pioneer
in the development of alkaline developable l iquid-type
SR, wh ich has now become a lead ing p roduc t . I t is
characterized by high sensitivity as well as outstanding
gold plating resistance and water-soluble flux resistance.
It is also used as SR on automotive PWBs for its excellent
migration resistance and pressure cooker test resistance.
Dry Film-Type SRExisting l iquid-type SR can be preprocessed into a fi lm and a
uniform thickness can be achieved. The use of dry film-type SR
on semiconductor PKG substrates is increasing. Because the
drying process, which is essential for l iquid-type SR, can be
e l iminated, i t is expected that dry f i lm- type SR wi l l reduce
manufacturing costs.
Features
Electrical resistance
High temperature resistance
High resolution
Excellent strength and adhesion
Chemical resistance
Main applications
PCs
Automotive components
Flat-screen televisions
Smart phones
Before SR application(Copper circuit pattern formed)
Main Products
10 11TAIYO HOLDINGS CO., LTD. Annual Report 2015TAIYO HOLDINGS CO., LTD. Annual Report 2015

This film offers excellent micro-machining properties and bendability while maintaining
reliability, properties that were difficult to achieve in a single product, which will make it
possible to integrate FPC materials in the future. In addition, customers that already use
SR will be able to continue using their existing facilities, simplifying FPC manufacturing
processes.
Mobile information devices and other equipment generally use connectors, a type of mechanical connection, as the
method for joining rigid PWBs and flexible PWBs. To respond to higher component densit ies in conjunction with the
development of smaller and lighter devices, we developed an anisotropic conductive adhesive that quickly cures at low
temperature.
Features
Rapid, low-temperature curing is possible1
Good adhesive strength even on glass circuit boards2
Photoimageable Coverlay Film
Anisotropic Conductive Adhesive
Two types of insulator materials are used together
Photoimageable Coverlay Film (alkaline developable)
High resolution & excellent bendability
Current Status Taiyo Group’s Proposal
Adequate bendability cannot be achieved
Solder resist( alkaline developable)
Micro-machining is diff icult
Coverlay film ( thermally curable)
Simplified manufacturing processes1
Higher reliability through consolidation of materials2
Lower total costs3
Reworking is possible3
For diagram, see below.
Connection area Application locations
1
2
3 PWB / FPC
Glass / FPC
Coating
Positioning and alignment
Press lamination
FPC / FPC
The volume of information processed by integrated circuits is increasing in conjunction with the incorporation of multiple
functions into mobile information devices, and as a result, circuit designs are becoming denser and more complex. At the
same time, mobile information devices are being made smaller and thinner, making the space available for mounting PWBs
even smaller, and the demand for flexible printed circuits (FPCs) that are lightweight and can be curved for mounting is
rising. In response to these issues, the Taiyo Group combined its technologies to develop photoimageable coverlay film and
anisotropic conductive adhesive.
Technology Background
New products
12 13TAIYO HOLDINGS CO., LTD. Annual Report 2015TAIYO HOLDINGS CO., LTD. Annual Report 2015
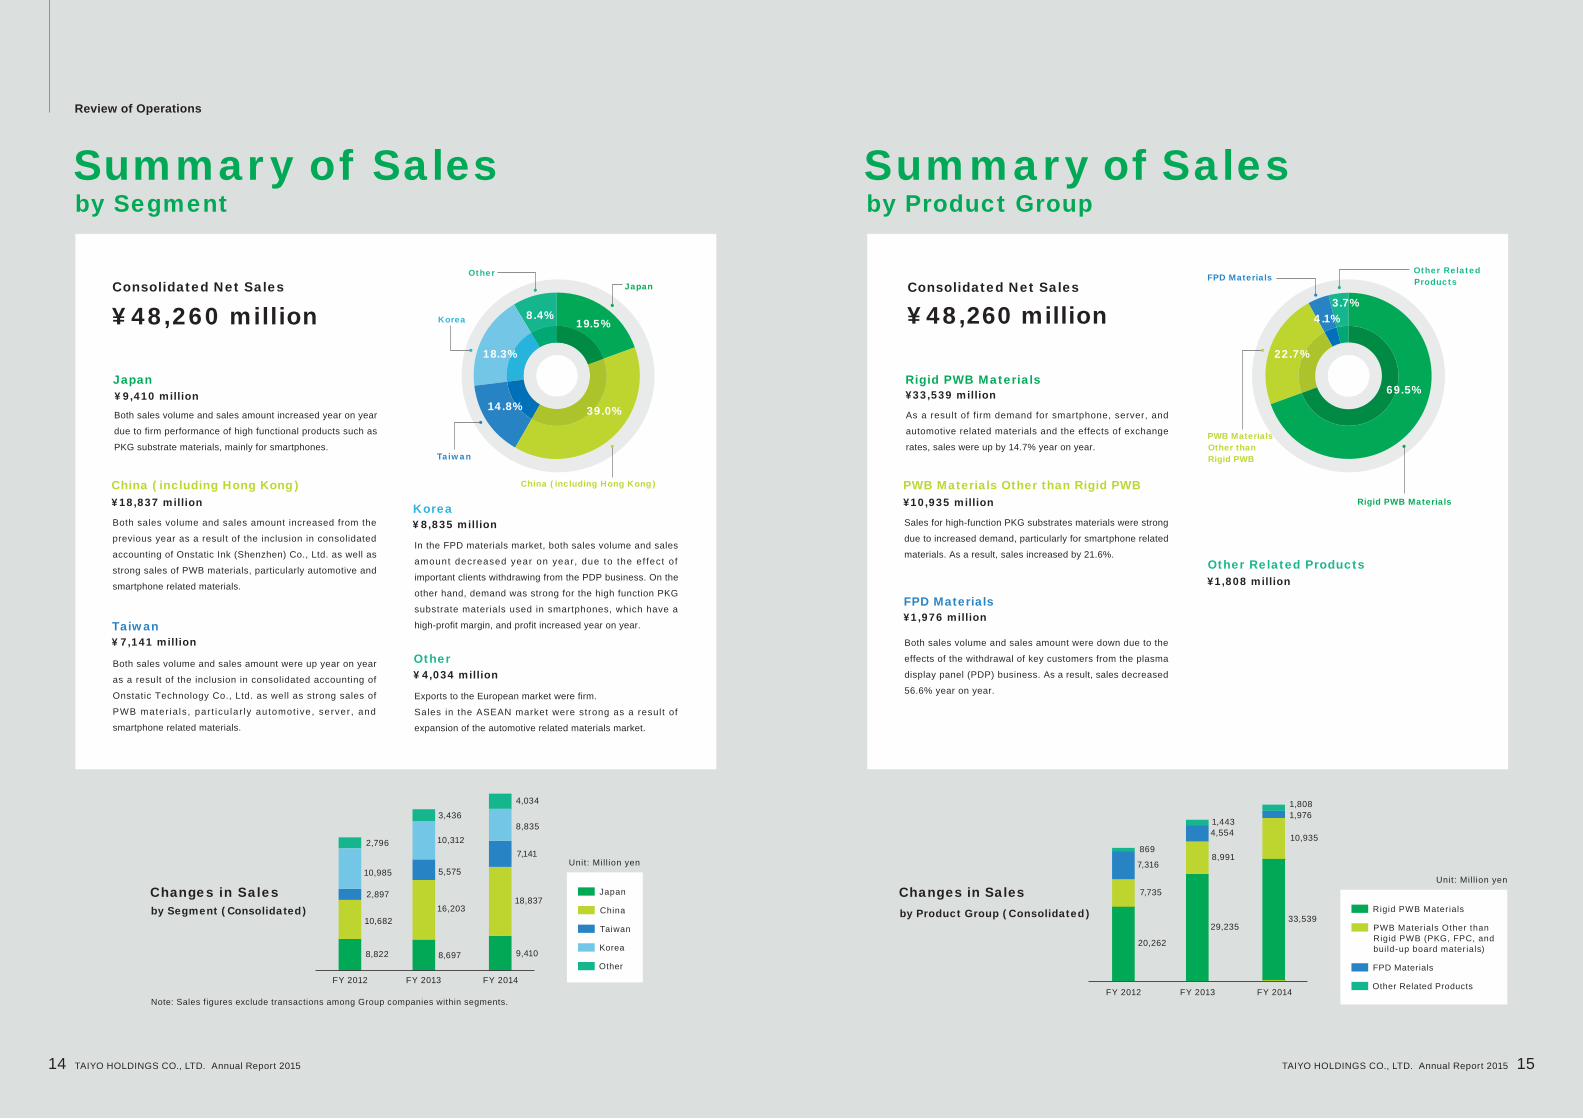
¥48,260 million
Japan¥9,410 million
Both sales volume and sales amount increased year on year
due to firm performance of high functional products such as
PKG substrate materials, mainly for smartphones.
China ( including Hong Kong)¥18,837 million
Both sales volume and sales amount increased from the
previous year as a result of the inclusion in consolidated
accounting of Onstatic Ink (Shenzhen) Co., Ltd. as well as
strong sales of PWB materials, particularly automotive and
smartphone related materials.
Taiwan¥7,141 million
Both sales volume and sales amount were up year on year
as a result of the inclusion in consolidated accounting of
Onstatic Technology Co., Ltd. as well as strong sales of
PWB mater ia ls , par t icu lar ly automot ive, server , and
smartphone related materials.
Other¥4,034 million
Exports to the European market were firm.
Sales in the ASEAN market were strong as a result of
expansion of the automotive related materials market.
Korea¥8,835 million
In the FPD materials market, both sales volume and sales
amount decreased year on year, due to the ef fect of
important clients withdrawing from the PDP business. On the
other hand, demand was strong for the high function PKG
substrate materials used in smartphones, which have a
high-profit margin, and profit increased year on year.
Consolidated Net Sales
Summary of Sales by Product Group
Summary of Salesby Segment
JapanOther
China ( including Hong Kong)
Taiwan
Korea 19.5%
39.0%14.8%
18.3%
8.4% ¥ 48,260 million
Rigid PWB Materials¥33,539 million
As a result of firm demand for smartphone, server, and
automotive related materials and the effects of exchange
rates, sales were up by 14.7% year on year.
PWB Materials Other than Rigid PWB
PWB Materials Other than Rigid PWB
¥10,935 million
Sales for high-function PKG substrates materials were strong
due to increased demand, particularly for smartphone related
materials. As a result, sales increased by 21.6%.
FPD Materials¥1,976 million
Both sales volume and sales amount were down due to the
effects of the withdrawal of key customers from the plasma
display panel (PDP) business. As a result, sales decreased
56.6% year on year.
Other Related Products¥1,808 million
Consolidated Net SalesFPD Materials
Other Related Products
Rigid PWB Materials
69.5%
22.7%
4.1%3.7%
Changes in Salesby Segment ( Consolidated)
2,796
3,436
5,575
8,697
10,985
10,312
16,203
4,034
7,141
9,410
8,835
18,8372,897
10,682
8,822
FY 2012 FY 2013 FY 2014
Japan
China
Taiwan
Korea
Other
Unit: Mill ion yen
Note: Sales figures exclude transactions among Group companies within segments.
Changes in Sales by Product Group ( Consolidated)
869
1,443
8,9917,316
4,554
29,235
1,808
10,935
1,976
33,539
7,735
20,262
FY 2012 FY 2013 FY 2014
Rigid PWB Materials
PWB Materials Other thanRigid PWB (PKG, FPC, and build-up board materials)
FPD Materials
Other Related Products
Unit: Mill ion yen
Review of Operations
14 15TAIYO HOLDINGS CO., LTD. Annual Report 2015TAIYO HOLDINGS CO., LTD. Annual Report 2015

As of March 2015, four years have passed since I was
appointed president and CEO. During that time, we have
faced ongoing challenges including establishing new product
development projects and transforming business structures
that are impacted by exchange rate fluctuations.
New personnel have been added in the development and
manufacturing divisions and new product teams are being
launched emphasizing sales marketing with the aim of
commercializing products in one to two years. By enabling
personnel to devote themselves to development activities, we
have created the seeds of several new businesses that will
become core within our business in the future. In addition,
we are creating processing technologies in-house that we
previously outsourced, accumulating know-how so that we
can rapidly develop new products.
The Taiyo Group holds the top share globally for solder resist
and we have expanded our network and cont inue to
introduce outstanding products and services. However, we
must address the issue that the business structure is
impacted by exchange rate fluctuations. To avoid these risks,
we are developing systems to locally procure raw materials
and produce goods to sell locally in an effort to unify income
and expenditure within the one currency.
As a chemical manufacturer, the Group seeks to enhance all
technologies and use innovation to develop products that
people around the world dream of, and to create a better
society. To achieve this, we require self-sufficient human
resources. The Group has placed the highest priority on
developing human resources by providing environments where
employees can learn and can tackle new challenges. Specific
measures include dispatching employees to universities
and subsidizing activity expenses on days off. We do this
because we believe that the accumulation of experience that
A Strategy to Stay Ahead as World’s No. 1 Solder Resist Manufacturer
Eiji Sato, President and CEO
cannot be gained in the workplace facilitates the emergence of
new ideas and can also be applied in work. These values have
taken root in our corporate culture and are reflected in our
business results.
We achieved record high financial results in fiscal 2014. As a
resul t of sol id demand for smartphones and automot ive
electronics, net sales were ¥48,260 million (up 9.1% year on
year), operating income was ¥9,254 million (up 22.3% year on
year), and net income was ¥6,667 million (up 35.2% year on
year). With the acquisition of Onstatic Technology Co., Ltd.
(OTC) in fiscal 2013, we were able to avoid price competition
and product prices stabi l ized. In addit ion, the Japanese
government’s policy of correcting the high value of the yen also
boosted income. Increased sales of high added value products
was another key factor.
In the coming f iscal year, we wi l l expand the overseas
procurement of raw materials, focus on development of new
products and other areas, and continuously and actively make
necessary investments. Our long-term goal is to achieve an
operating income rate of 20% or higher. The market scale for
interlayer dielectrics alone, for example, is approximately
¥30,000 million, and thus, there is still considerable untapped
demand for our existing products.
We have achieved a cumulative shareholder return ratio of
111.5% for the five consecutive years since fiscal 2010, and we
have continuously and stably provided high shareholder returns.
We will continue paying stable dividends over the medium to
long term with the aim of achieving a minimum dividend on
equity (DOE) ratio of 5%. The industry is undergoing drastic
change, but we will establish corporate structures that can
respond more flexibly and maintain stable growth. I ask for the
continued understanding and support of all our stakeholders.
Message from the CEO
16 17TAIYO HOLDINGS CO., LTD. Annual Report 2015TAIYO HOLDINGS CO., LTD. Annual Report 2015

Network Covering the Global Market
Global Network
In fiscal 2014, about 90% of the Taiyo Group sales were
accounted for by PWB materials. The principal centers for
production of PWBs have shifted from the United States
and Europe to Japan and then to emerging countries, and,
in recent years, production in China has risen rapidly.
While responding to these global changes in the business
environment, the Group has conducted transactions with
PWB manufacturers around the world. The Group has
been aware that its most-important mission is to provide
superior products and services at all times and has worked
to expand this network to cover global markets. Today, the
Group has manufacturing and marketing bases in Japan,
China, Taiwan, Korea, and the United States as well as
Production and Marketing Subsidiaries
Marketing or Technical Support Subsidiaries
TAIYO HOLDINGS CO., LTD.
TAIYO INK MFG. CO., LTD.
TAIWAN TAIYO INK CO., LTD.
ONSTATIC TECHNOLOGY CO., LTD.
TAIYO INK MFG. CO., (KOREA) LTD.
TAIYO INK (SUZHOU) CO., LTD.
ONSTATIC INK (SHENZHEN) CO., LTD.
TAIYO INK INTERNATIONAL(SINGAPORE) PTE LTD.
TAIYO INK( THAILAND) CO., LTD.
TAIYO INK INTERNATIONAL (HK) LTD.
marketing and technical service centers in Shenzhen and
Hong Kong in China, Singapore, and Thailand.
The quality of the Group’s products and services together
with the agility of its global network has enabled the Group
to secure the leading share in SR in global markets, and
overseas sales have climbed to account for about 80% of
its net sales. Further growth is expected in the med ium to
l ong t e rm i n demand fo r PWB ma te r i a l s f o r use i n
electronics components around the world. The Group will
step up its activities to develop its businesses globally and
will endeavor to respond to burgeoning demand.
Quality Management in the Overall Supply Chain
To provide superior products and services at all times to
customers throughout the world, act iv i t ies to improve
quality through the Group’s supply chain are indispensable.
First, to enable customers to select the optimal products
for their needs from the diverse lineup of items the Group
offers, marketing personnel in charge endeavor to match
product specifications with client requirements through
close communication. When client requirements exceed
the specifications of existing products, this is communicated
to product development divisions, designs are drawn up,
and, after production process plans are prepared by the
manufactur ing d iv is ions, the Group works to provide
customers with products that match their specifications. To
enhance qual i ty and provide for smooth del iver ies to
cus tomers , ano the r impor tan t p rocess i s ma te r ia l s
procurement.
To ensure the stable procurement of both volumes and
quantities, the Group conducts audits of supplier factories
and makes periodic assessments of their operations, while
also setting standards for the acceptance of raw materials
and ensuring that deliveries of raw materials that are not
up to standard are prevented.
Moreover, the Group has structured a quality management
system based on ISO 9001 at each of the Group’s production
bases.
Finally, the Group is aiming to win a high level of customer
satisfaction by creating a detailed management system
tha t ex tends f rom pack ing and sh ipment th rough to
deliveries. The Group is also providing fol low-up after
de l iver ies and is ask ing for assessments as wel l as
feedback from customers regarding each stage of the
supply chain .
The Group does business with customers in virtually every
country. In many cases, product sales prices are quoted in
foreign currencies, and one management issue is that
f luctuat ions in exchange rates have an impact on the
Group’s performance. To deal wi th th is, the Group is
promoting the implementation of “ local production and
local procurement” or, in other words, “products that are
sold in local areas (markets) are made from materials
procured in the local area and manufactured there.” By
increas ing the percentage o f raw mater ia ls that are
procured local ly , the Group is working to respond by
having income and expenditures denominated in the same
currency.
“Loca l p roduc t ion and loca l p rocurement ” leads to
strengthening the Group’ s capabilities for responding to
c l ient requests and needs. For example, through this
approach, the Group can develop products that meet
customers’ needs in the local markets quickly, and lead
time for filling orders can be shortened. This approach is
also effective for faci l i tat ing business continuity plans
(BCPs) because it means that prices of raw materials can
be lowered and tha t mu l t i p le supp ly cha ins can be
structured.
Especially regarding lead time, the Group is rapidly making
preparations for shortening required delivery times to meet
c l ients ’ requests and put into place systems that wi l l
enable the next-day delivery of orders.
Offering Advantages to Customers through “ Local Production and Local Procurement ”
Supply Chains
CHUGAI KASEI CO., LTD.
TAIYO INK TRADING(SHENZHEN) CO., LTD.
TAIYO AMERICA, INC.
Supply Chains
18 19TAIYO HOLDINGS CO., LTD. Annual Report 2015TAIYO HOLDINGS CO., LTD. Annual Report 2015

Core of Marketing Activities
One of the consol idated Group companies located in
Japan is Taiyo Ink Mfg. Co., Ltd., a manufacturing and
sales subsidiary.
In fiscal 2014, sales volume and value increased from the
previous year as a result of solid sales of PKG substrate
materials and other high-performance products, particularly
smartphone related materials. As a result, sales in Japan
in fiscal year 2014 were ¥15,786 million (up 12.7% year
on year) and operating income was ¥2,466 mil l ion (up
29.4% year on year).
One of the principal roles of the Group holding company
is to be in overall charge of strategies for Asian markets
and promote the i r imp lementa t ion . In more-spec i f i c
terms, the holding company must keep a watchful eye
on the Asian markets as a whole at al l t imes, ident i fy
needs before they emerge, and create new products that
match these needs through R&D, based on marketing.
Takaoka Sachiko, PCB Materials Sales Department, Taiyo Ink Mfg. Co., Ltd.
Current position :
Job description :Domestic and overseas marketing to expand PCB product sales
( currently for the automotive industry )
What I want to contribute to the Company in the future : I wan t to deve lop new cus tomers and bu i l d good re la t i onsh ips so tha t I
can es tab l ish s t ruc tures fo r ob ta in ing in format ion f rom customers before
anyone else.
Marketing Section, PCB Materials Sales Department
Voice of the Employee
In China, for example, new entrants into the smartphone part
market are emerging as manufacturing companies spin off or
otherwise break away from large companies in the field.
Grasping information on their presence is difficult for locally
based companies acting alone. Therefore, the Group’s base in
Japan draws on its marketing capabilities and makes direct
approaches to promis ing PWB manufacturers. I f i t is
discovered that these companies have needs that have not
been encountered thus far, the Group turns its attention to the
consideration of developing new products answering those
needs.
In addition, we are constructing a new plant as a manufacturing
base in Kitakyushu City from the perspectives of reinforcing
production systems for semiconductor PKG substrate SR,
demand for which is expected to grow in the future, as well as
business continuity plans. In June 2015, the Group acquired
Chugai Kasei Co., Ltd., which possesses strong research and
development capabi l i t ies, pr imari ly in the fine chemical
f ield. Going forward, we will make complementary a n d
effective use of both companies’ management resources to
expand new business development opt ions, reinforce
competitiveness, and develop business in new fields with
the expectation of responding promptly and precisely to
customer requirements.
In this way, Japan plays a role as the core for marketing in
Asia and promotes improvement in performance in other
countries in the region.
TAIYO INK MFG CO., LTD. Kitakyushu Plant
Location Yahatanish i -ku, Ki takyushu, Fukuoka (wi th in Mi tsubish i Chemical Corporation Kurosaki Plant)1
Site area approx. 18,000 ㎡2
Investment amount approx. 3.5 bil l ion yen3
Product Liquid- type SR and dry f i lm-type SR for semiconductor PKG board4
Capacity Liquid-type : 1,500 tons per year
Dry fi lm-type : 2,800,000 ㎡ per year5
CHUGAI KASEI CO., LTD.
Founded September 18, 1941
Paid-in capital JPY 49.5 million
Office Nihonmatsu Head Office / Factory, Urawa Factory, Tokyo Sales Office
Business description Manufacture and marketing of dyes, pigments, chemicals, and inks
( Millions of Yen)
16,000
12,000
8,000
4,000
0
14,00515,786
( Millions of Yen)
2,500
2,000
1,500
1,000
02015/ 3
1,906
2,466( %)
16
12
8
4
0
13.6
15.6
Sales Operating income Operating income rate
2014/3 2015/3 2014/3 2014/3 2015/3
Japan
Regional Information
20 21TAIYO HOLDINGS CO., LTD. Annual Report 2015TAIYO HOLDINGS CO., LTD. Annual Report 2015
Sales Operating income Operating income rate( Millions of Yen) ( Millions of Yen) ( %)
Voice of the Employee Voice of the Employee
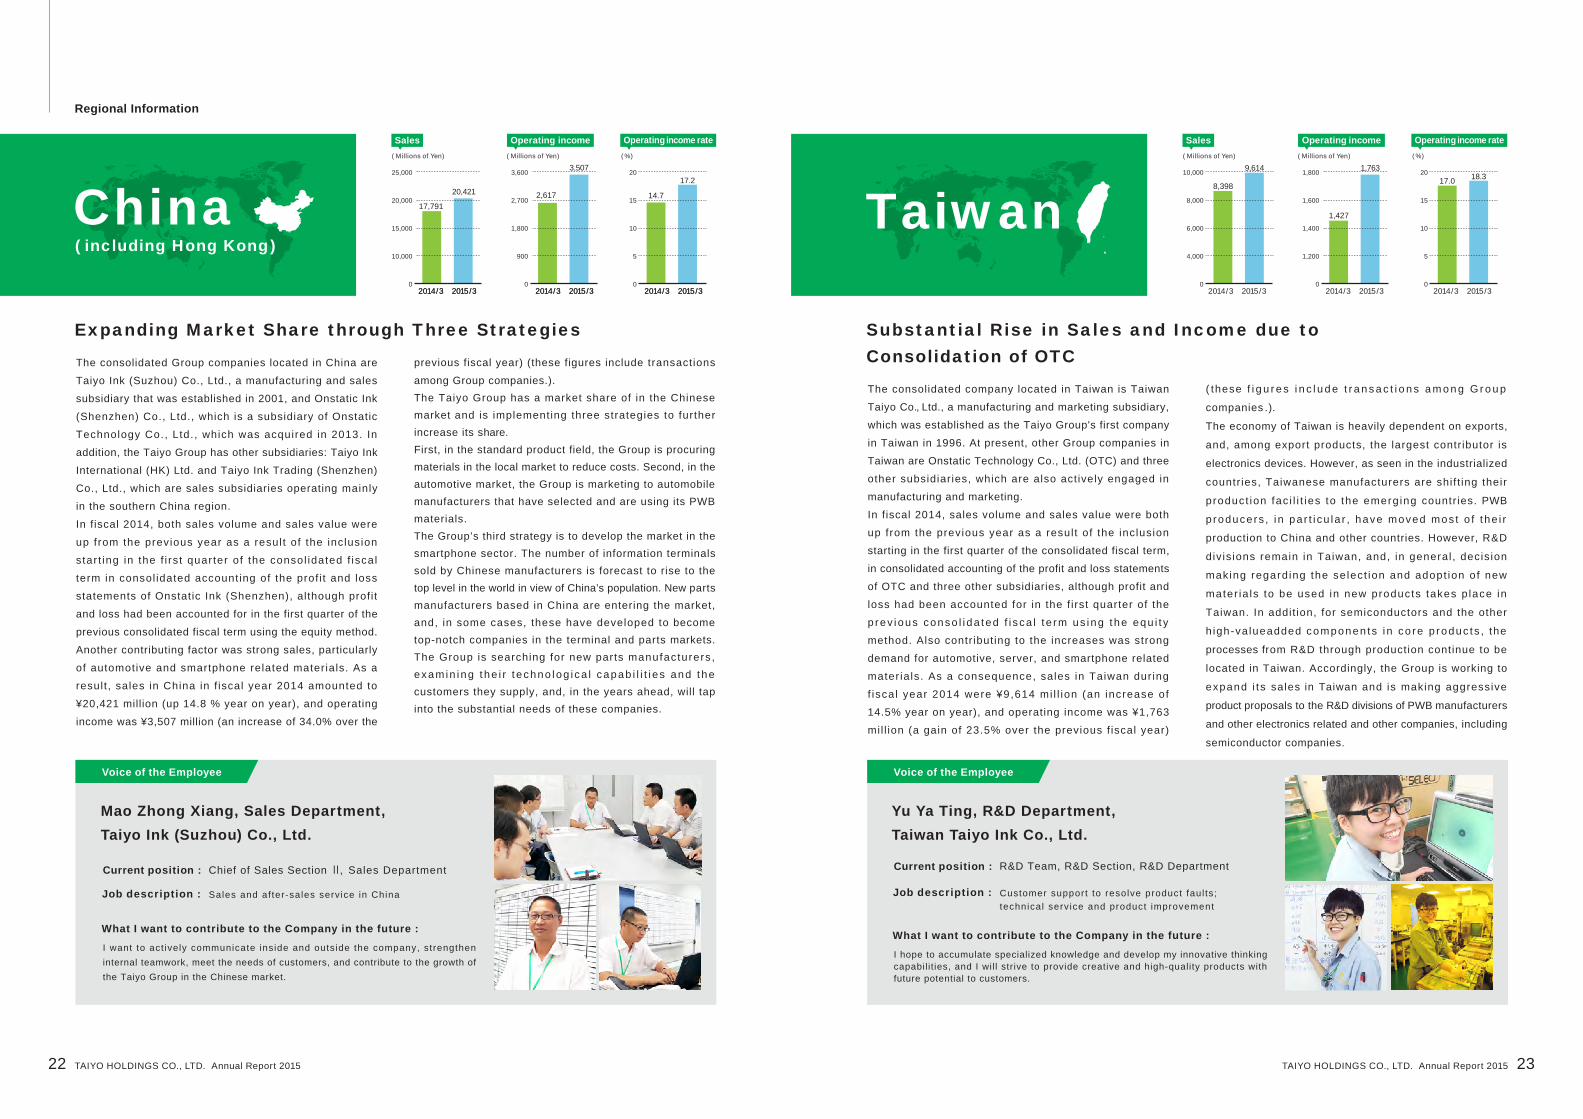
Expanding Market Share through Three Strategies
The consolidated Group companies located in China are
Taiyo Ink (Suzhou) Co., Ltd., a manufacturing and sales
subsidiary that was established in 2001, and Onstatic Ink
(Shenzhen) Co., Ltd., which is a subsidiary of Onstatic
Technology Co., Ltd., which was acquired in 2013. In
addition, the Taiyo Group has other subsidiaries: Taiyo Ink
International (HK) Ltd. and Taiyo Ink Trading (Shenzhen)
Co., Ltd., which are sales subsidiaries operating mainly
in the southern China region.
In fiscal 2014, both sales volume and sales value were
up from the previous year as a result of the inclusion
star t ing in the f i rs t quarter of the consol idated f iscal
term in consol idated accounting of the prof i t and loss
statements of Onstatic Ink (Shenzhen), although profit
and loss had been accounted for in the first quarter of the
previous consolidated fiscal term using the equity method.
Another contributing factor was strong sales, particularly
of automotive and smartphone related materials. As a
result , sales in China in f iscal year 2014 amounted to
¥20,421 million (up 14.8 % year on year), and operating
income was ¥3,507 million (an increase of 34.0% over the
previous fiscal year) (these figures include transactions
among Group companies.).The Taiyo Group has a market share of in the Chinese market and is implementing three strategies to further increase its share.First, in the standard product field, the Group is procuring materials in the local market to reduce costs. Second, in the automotive market, the Group is marketing to automobile manufacturers that have selected and are using its PWB materials.The Group’s third strategy is to develop the market in the smartphone sector. The number of information terminals sold by Chinese manufacturers is forecast to rise to the top level in the world in view of China’s population. New parts manufacturers based in China are entering the market, and, in some cases, these have developed to become top-notch companies in the terminal and parts markets. The Group is searching for new parts manufacturers , examin ing the i r t echno log i ca l capab i l i t i es and the customers they supply, and, in the years ahead, will tap into the substantial needs of these companies.
Substantial Rise in Sales and Income due to Consolidation of OTC
The consolidated company located in Taiwan is Taiwan
Taiyo Co., Ltd., a manufacturing and marketing subsidiary,
which was established as the Taiyo Group's first company
in Taiwan in 1996. At present, other Group companies in
Taiwan are Onstatic Technology Co., Ltd. (OTC) and three
other subsidiaries, which are also actively engaged in
manufacturing and marketing.
In fiscal 2014, sales volume and sales value were both
up from the previous year as a result of the inclusion
starting in the first quarter of the consolidated fiscal term,
in consolidated accounting of the profit and loss statements
of OTC and three other subsidiaries, although profit and
loss had been accounted for in the f irst quarter of the
p rev ious conso l i da ted f i sca l t e rm us ing the equ i t y
method. Also contributing to the increases was strong
demand for automotive, server, and smartphone related
mater ia ls. As a consequence, sales in Taiwan dur ing
f iscal year 2014 were ¥9,614 mi l l ion (an increase of
14.5% year on year), and operating income was ¥1,763
mil l ion (a gain of 23.5% over the previous f iscal year)
( these f i g u r e s i n c l u d e t r a n s a c t i o n s a m o n g G r o u p
companies .).
The economy of Taiwan is heavily dependent on exports,
and, among export products, the largest contributor is
electronics devices. However, as seen in the industrialized
countr ies, Taiwanese manufacturers are shif t ing their
product ion fac i l i t ies to the emerg ing countr ies. PWB
producers , i n pa r t i cu la r , have moved mos t o f the i r
production to China and other countries. However, R&D
div is ions remain in Taiwan, and, in general , decis ion
making regard ing the se lect ion and adopt ion of new
mater ia ls to be used in new products takes p lace in
Taiwan. In addit ion, for semiconductors and the other
h igh-va lueadded componen ts i n co re p roduc ts , the
processes from R&D through production continue to be
located in Taiwan. Accordingly, the Group is working to
expand i ts sales in Taiwan and is making aggressive
product proposals to the R&D divisions of PWB manufacturers
and other electronics related and other companies, including
semiconductor companies.
Mao Zhong Xiang, Sales Department,Taiyo Ink (Suzhou) Co., Ltd.
Current position :
Job description : Sales and af ter-sales service in China
What I want to contribute to the Company in the future :
I want to act ively communicate inside and outside the company, strengthen internal teamwork, meet the needs of customers, and contribute to the growth of the Taiyo Group in the Chinese market.
Chief of Sales Section Ⅱ, Sales Department
Yu Ya Ting, R&D Department, Taiwan Taiyo Ink Co., Ltd.
Current position :
Job description : Customer support to resolve product faul ts; technical service and product improvement
What I want to contribute to the Company in the future :
I hope to accumulate specialized knowledge and develop my innovative thinking capabilit ies, and I will strive to provide creative and high-quality products with future potential to customers.
R&D Team, R&D Section, R&D Department
10,000
8,000
6,000
4,000
0
8,398
9,614 1,800
1,600
1,400
1,200
0
1,427
1,763 20
15
10
5
0
17.0 18.3
China ( including Hong Kong)
TaiwanSales Operating income Operating income rate
25,000
20,000
15,000
10,000
0
17,791
20,421
3,600
2,700
1,800
900
0
2,617
3,507( Millions of Yen) ( Millions of Yen) ( %)
2014/3 2015/3 2014/3 2015/32014/3 2015/3 2014/3 2015/3
20
15
10
5
0
14.7
17.2
2014/3 2015/32014/3 2015/3 2014/3 2015/3 2014/3 2015/3 2014/3 2015/3
Regional Information
22 23TAIYO HOLDINGS CO., LTD. Annual Report 2015TAIYO HOLDINGS CO., LTD. Annual Report 2015
Voice of the Employee
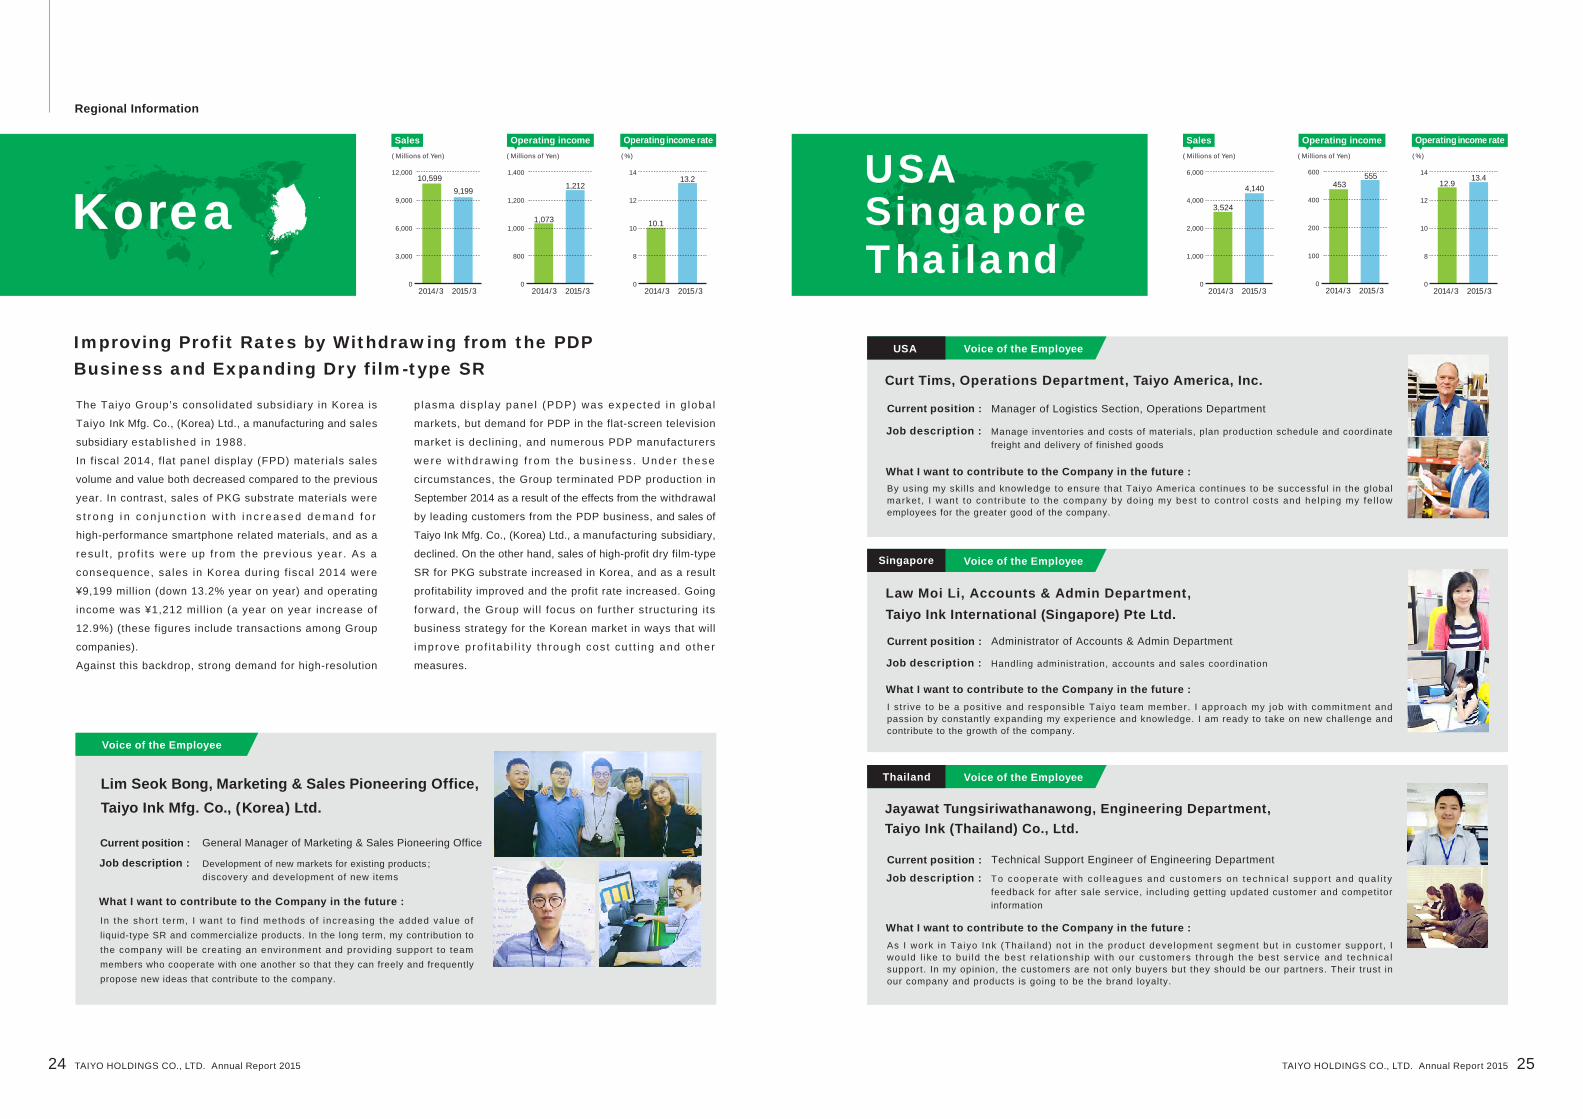
Improving Profit Rates by Withdrawing from the PDP Business and Expanding Dry film-type SR
The Taiyo Group’s consolidated subsidiary in Korea is
Taiyo Ink Mfg. Co., (Korea) Ltd., a manufacturing and sales
subsidiary establ ished in 1988.
In f iscal 2014, f lat panel display (FPD) materials sales
volume and value both decreased compared to the previous
year. In contrast, sales of PKG substrate materials were
s t r o n g i n c o n j u n c t i o n w i t h i n c r e a s e d d e m a n d f o r
high-performance smartphone related materials, and as a
resu l t , p ro f i ts were up f rom the prev ious year . As a
consequence, sales in Korea dur ing f iscal 2014 were
¥9,199 million (down 13.2% year on year) and operating
income was ¥1,212 mil l ion (a year on year increase of
12.9%) (these figures include transactions among Group
companies).
Against this backdrop, strong demand for high-resolution
p lasma d isp lay pane l (PDP) was expected in g loba l
markets, but demand for PDP in the flat-screen television
market is declining, and numerous PDP manufacturers
we re w i t hd raw ing f r om the bus iness . Unde r t hese
circumstances, the Group terminated PDP production in
September 2014 as a result of the effects from the withdrawal
by leading customers from the PDP business, and sales of
Taiyo Ink Mfg. Co., (Korea) Ltd., a manufacturing subsidiary,
declined. On the other hand, sales of high-profit dry film-type
SR for PKG substrate increased in Korea, and as a result
profitability improved and the profit rate increased. Going
forward, the Group wil l focus on further structuring i ts
business strategy for the Korean market in ways that will
improve pro f i tab i l i t y th rough cos t cu t t ing and o ther
measures.
Lim Seok Bong, Marketing & Sales Pioneering Office, Taiyo Ink Mfg. Co., (Korea) Ltd.
Current position :
Job description : Development of new markets for existing products ; discovery and development of new items
What I want to contribute to the Company in the future :
In the shor t term, I want to f ind methods of increasing the added va lue of liquid-type SR and commercialize products. In the long term, my contribution to the company wi l l be creat ing an environment and providing support to team members who cooperate with one another so that they can freely and frequently propose new ideas that contribute to the company.
General Manager of Marketing & Sales Pioneering Office
Voice of the Employee
Curt Tims, Operations Department, Taiyo America, Inc.
Current position :
Job description : Manage inventories and costs of materials, plan production schedule and coordinate freight and delivery of finished goods
What I want to contribute to the Company in the future : By using my ski l ls and knowledge to ensure that Taiyo America continues to be successful in the global market , I want to contr ibute to the company by doing my best to contro l costs and help ing my fe l low employees for the greater good of the company.
Manager of Logistics Section, Operations Department
USA
Voice of the Employee
Law Moi Li, Accounts & Admin Department, Taiyo Ink International (Singapore) Pte Ltd.
Current position :
Job description : Handling administration, accounts and sales coordination
What I want to contribute to the Company in the future : I str ive to be a posi t ive and responsible Taiyo team member. I approach my job with commitment and passion by constantly expanding my experience and knowledge. I am ready to take on new challenge and contribute to the growth of the company.
Administrator of Accounts & Admin Department
Singapore
Voice of the Employee
Jayawat Tungsiriwathanawong, Engineering Department, Taiyo Ink (Thailand) Co., Ltd.
Current position : Job description : To coopera te w i th co l leagues and cus tomers on techn ica l suppor t and qua l i t y
feedback for after sale service, including gett ing updated customer and competitor information
What I want to contribute to the Company in the future : As I work in Taiyo Ink (Thai land) not in the product development segment but in customer support , I wou ld l i ke to bu i ld the best re la t ionsh ip w i th our cus tomers through the best serv ice and techn ica l support. In my opinion, the customers are not only buyers but they should be our partners. Their trust in our company and products is going to be the brand loyalty.
Technical Support Engineer of Engineering Department
Thailand
12,000
9,000
6,000
3,000
0
10,5999,199
2014/3 2015/3
1,400
1,200
1,000
800
0
1,073
1,212
2014/3 2015/3
14
12
10
8
0
10.1
13.2
2014/3 2015/3
6,000
4,000
2,000
1,000
0
3,524
4,140
2014/3 2015/3
600
400
200
100
0
453555
2014/3 2015/3
14
12
10
8
0
12.913.4
2014/3 2015/3
Korea( Millions of Yen) ( Millions of Yen) ( %)
Sales Operating income Operating income rate Sales Operating income Operating income rate
USA
ThailandSingapore
( Millions of Yen) ( Millions of Yen) ( %)
24 25TAIYO HOLDINGS CO., LTD. Annual Report 2015TAIYO HOLDINGS CO., LTD. Annual Report 2015
Regional Information

Solar Power
Plant Factory
CHANGE is essential for developing self-sufficient personnel
who can freely express themselves without being constrained
by existing ideas. For this reason, the Taiyo Group places
particular emphasis on easy to use office environments that
present a significant departure from existing workplaces. For
example, par t i t ions that separate divisions have been
removed and glass has been installed in meeting and other
individual rooms. Other innovations include pillars and walls
that can be used as whiteboards to ensure that no ideas
arising in these work spaces are lost.
The Taiyo Group launched the solar power business with a
water-based mega-solar instal lat ion in Ranzan-machi,
located in the Hiki Distr ict of Saitama Prefecture, and a
roof top generating facil i ty on the management building
rooftop of the Ranzan Facility.
The G roup’s e f fo r t s s t a r ted w i t h t he ins ta l l a t i on o f
generating facilities on the management building rooftop at
the Ranzan Facility on February 27, 2015. This was followed
in October 2015 by the lease of a regulat ing reservoir
adjacent to the Ranzan-machi Hanamidai Industrial Park
from the Ranzan-machi council and the installation of a
water-based mega-solar fac i l i t y. Approximately 4,500
solar panels provide enough electr ic ity for around 370
households. In terms of reducing carbon dioxide emissions,
the mega-solar facility alone is expected to cut emissions by
approximately 400 tons annually.
Office Spaces
Starting production of safe and secure vegetables at a clean room farm
Brighter Communities, Greener Environment :Launching a Solar Power Business
A new workplace environment designed to embrace CHANGE
Cafeteria
More than just a cafeteria—it’s a place to meet up and exchange ideas
Nursery School (On-Site Daycare Center )
An on-site daycare center will be opened for employees to let them focus on work without worries.
Environmental InitiativesCreating Optimal Working Environments
In addition to these programs, the Group is making other
ac t ive cont r ibut ions to the loca l communi t y th rough
measures such as donating facilities equipped with solar
panels and bat ter ies to the Hanamidai Industr ial Park
Management Center, which is the designated evacuation
area of Ranzan-machi, in order to provide electricity in the
event of a power outage.
In October of 2015, the Group began full-scale operations of
a plant factory, which are increasingly common in recent
years , as a par t o f i ts cont r ibut ions, as a chemica ls
manufacturer, to a safe and secure food supply. The facility
was established in a Taiyo Holdings research center and
uses artificial light for hydroponic cultivation. Operations are
not affected by the weather and regularly produce fresh,
organic vegetables. Initially, the vegetables will help supplied
the on-site employee cafeteria, and when stable production
is achieved, sales channels will be expanded.
Compared to outdoor cultivation, the plant factory imposes
fewer physical burdens on workers, and as the population
ages, we expect that it will provide employment opportunities
for senior citizens.
Effective internal communications are crucial for accelerating
product development and customer proposals to outperform
competitors. Based on this idea, the cafeteria was renovated
to create a space that can also be used for meetings among
employees and with business partners as well as for creating
new ideas. “Local production for local consumption” is
promoted through the use of locally-sourced ingredients, and
the cafeteria interior is decorated with cedar and cypress
from Saitama Prefecture.
As a part of efforts to create an optimal work environment for
employees, a daycare center will open at a site adjacent to the
Ranzan Facility in December 2015. The center will be equipped
with security facilities to provide peace of mind. There is a forest
nearby, and there will be many opportunities for the children to
experience the blessings of nature including living creatures
and trees. Such efforts will assist in recruiting outstanding
personnel, whether mid-career employees or recent graduates.
The daycare center wil l also be open to local residents
to enhance local options for childcare. Designed and supervised by Atelier4A
Topics
26 27TAIYO HOLDINGS CO., LTD. Annual Report 2015TAIYO HOLDINGS CO., LTD. Annual Report 2015

Interest in the health has been rising in recent years, and in conjunction with this change, various sporting events open to
participation by members of the public are being held. The Group provides subsidies to such events with the hope of
promoting the health of participants and contributing to the revitalization of local communities.
In fiscal 2014, we supported the Nerima Kobushi Half Marathon, which was held near the Taiyo Holdings head office,
as well as the 22nd Ogawa Washi Marathon and the 37th Nihon Three-Day March, which were held near Ranzan-machi
in Saitama Prefecture, where Taiyo Ink Mfg. Co., Ltd. is based.
Investor RelationsIn order to provide shareholders and investors with information that will be effective for making investment decisions, the
Taiyo Holdings’ fundamental policy is to carry out investor relations measures that ensure accuracy, fairness, and timeliness.
Specific measures include the provision of investor relations information on the Group website, issuing annual reports,
holding financial briefings for analysts and institutional investors, and meeting individually with institutional investors.
Since fiscal 2014, our announcement of financial results has been approximately one week earlier than usual as a result of
our efforts to provide timely information disclosures.
This fiscal year, the Group continued conducting on-site audits in cooperation with suppliers in order to build and strengthen
relationships of trust.
Audits are conducted by teams made up primarily of personnel from the Purchasing Department and Quality Assurance
Division, and in some cases employees from manufacturing technology and design divisions also participate. Audits are
conducted with the aim of enhancing the quality of raw materials and secondary materials.
Relationship with Shareholders
Support for Events
Implementation of Supplier Evaluations and On-Site Audits
Relationship with Suppliers
Relationship with Local Communities and Society
I put on uniform created by supporters and ran the Nerima Kobushi Half Marathon with five others. I ran as hard as I could under the spring sun along the course with b looming magno l i as and che r r y t r ees and shou ts o f encou ragemen t f r om my colleagues. When I initially took up long distance running, I hadn’ t intended to compete in the event, but I was able to achieve a sense of excitement and accomplishment d i f fe ren t f rom my work , and I fe l t phys ica l l y and menta l l y re f reshed. I hope to contribute to society in the future through good communications with other employees and the local community.Masahiro Hirata, PCB Sales Division, Taiyo Ink Mfg. Co., Ltd.
My Participation in a Half Marathon
Voice of the Employee
Designated Japan ’s nat iona l but ter f ly , the great purp le emperor (Sasak ia
charonda) is found in nettle trees (Celtis sinensis), on which it feeds during the
larval stage and on which adults deposit eggs. The butterfly inhabits the densely
wooded areas in the town of Ranzan in Saitama Prefecture, including on two
species of oak tree, Quercus serrata and Quercus acutissima, which produce the
sap on which the adult butterflies feed.
Taiyo Ink undertakes protection activities in conjunction with the town, for instance
by creating an environment within our Ranzan Facility site in which the butterflies
can easily pass the winter. Employees also take an active part in the volunteer
activity of creating secondary forest.
Protection of Great Purple Emperor, Japan’s National Butterfly
Environmental Protection ActivitiesTaiyo Holdings introduced an employee stock ownership plan (ESOP; a trust-type employee incentive plan)
with the aim of enhancing its employee compensation programs by making use of its own stock.
Under the plan, Taiyo Holdings designates employees who meet certain requirements as beneficiaries of a
trust that our company created by contributing capital acquired for the company’s shares. Company shares
are granted to employees at no cost during certain periods according to the number of years of employment
and work skills.
Grant ing shares effect ively increases wages and makes employees into company shareholders. This is
expected to enhance employee awareness of the company ’s f inanc ia l resul ts and share pr ice and to
encourage the implementation of business operations with the aim of improving financial results.
Employee Stock Ownership Plan Introduced
CSR
28 29TAIYO HOLDINGS CO., LTD. Annual Report 2015TAIYO HOLDINGS CO., LTD. Annual Report 2015
Construction of Sound Management StructuresWe have a holding company structure. Having Group management
and strategic functions, the holding company aims to develop and
improve our strategies while optimizing the allocation of resources.
The operating subsidiaries under the holding company can act
promptly and autonomously. This system enables us to respond
better to customers across various markets while also speeding up
decision making and boosting operational efficiency. Its aim is to
increase profits and help us build corporate value.
Basic Thinking on Corporate GovernanceIn line with our Management Philosophy and Basic Management
Policy, we aim to prosper together with our customers, regional
communities, shareholders, employees, business partners, and
other stakeholders. We also bel ieve i t is necessary for us to
embrace social responsibilities as well as seek to generate profits.
To this end, we seek to promote management transparency and to
fulfill our disclosure obligations to support the Company’s continued
prosperity.
Corporate Governance Structures
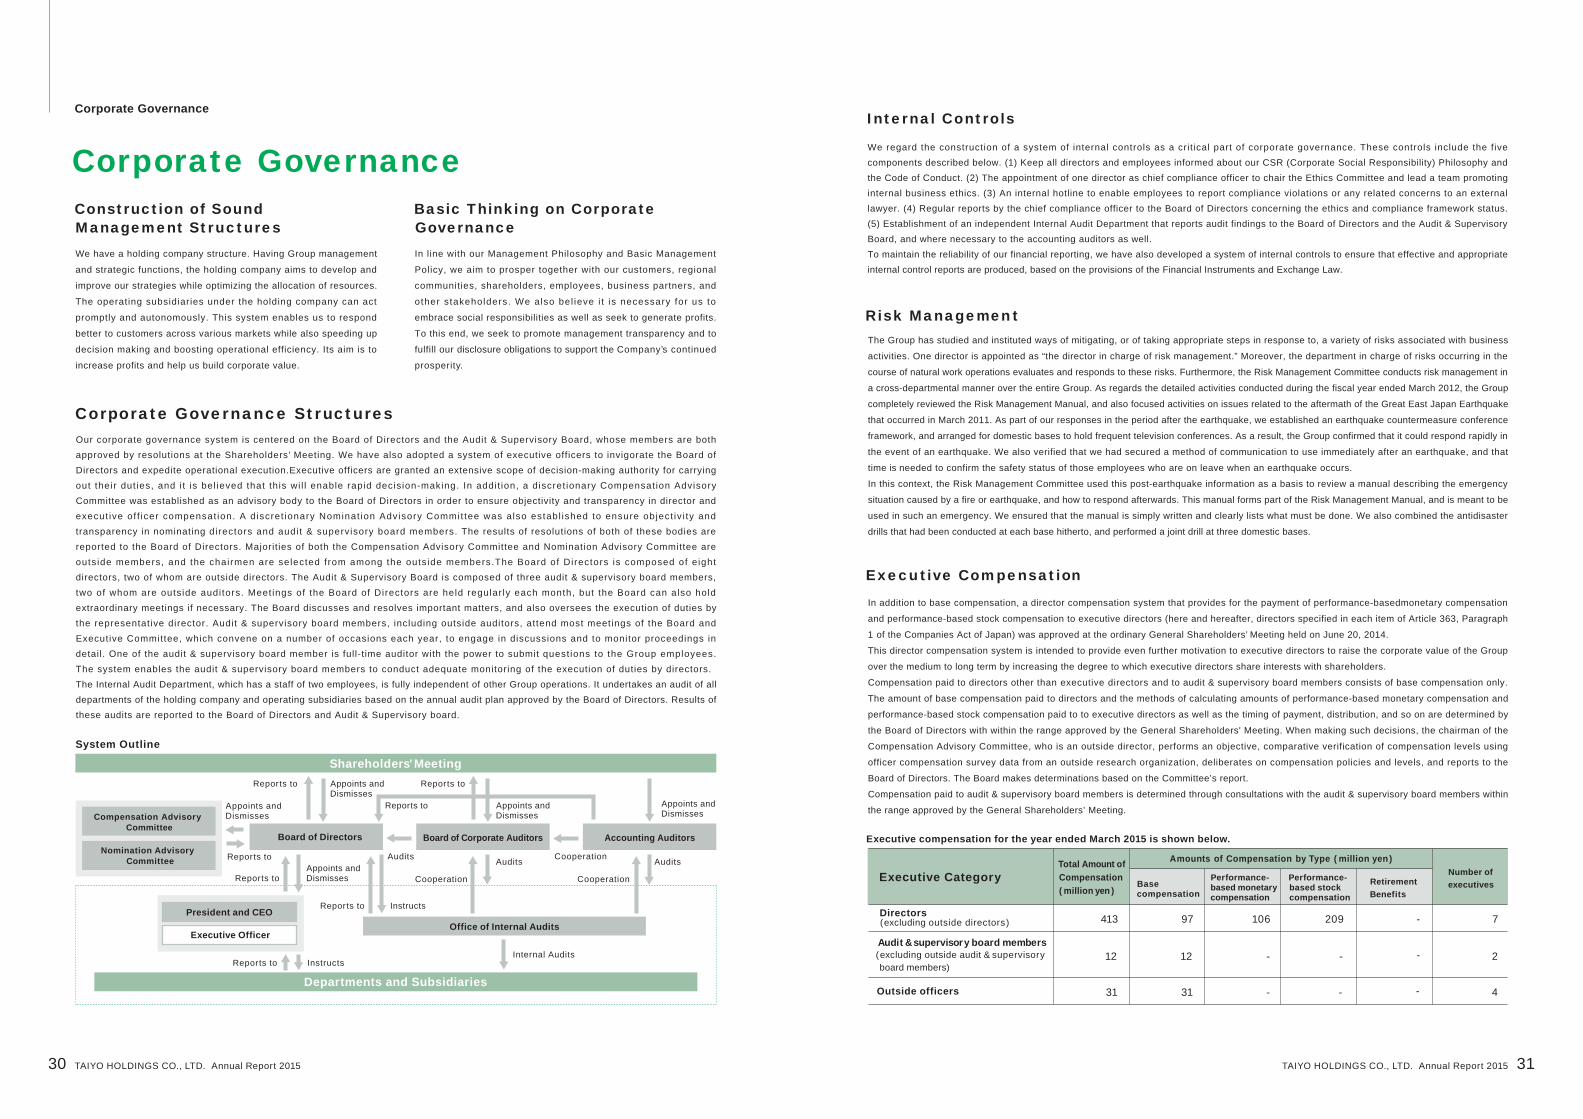
System Outline
Our corporate governance system is centered on the Board of Directors and the Audit & Supervisory Board, whose members are both approved by resolutions at the Shareholders’ Meeting. We have also adopted a system of executive officers to invigorate the Board of Directors and expedite operational execution.Executive officers are granted an extensive scope of decision-making authority for carrying out their dut ies, and i t is bel ieved that this wi l l enable rapid decision-making. In addit ion, a discret ionary Compensation Advisory Committee was established as an advisory body to the Board of Directors in order to ensure objectivity and transparency in director and execut ive of f icer compensat ion. A discret ionary Nominat ion Advisory Commit tee was also establ ished to ensure object iv i ty and transparency in nominating directors and audit & supervisory board members. The results of resolutions of both of these bodies are reported to the Board of Directors. Majorit ies of both the Compensation Advisory Committee and Nomination Advisory Committee are outs ide members, and the chairmen are selected from among the outside members.The Board of Directors is composed of e ight directors, two of whom are outside directors. The Audit & Supervisory Board is composed of three audit & supervisory board members, two of whom are outside auditors. Meetings of the Board of Directors are held regular ly each month, but the Board can also hold extraordinary meetings if necessary. The Board discusses and resolves important matters, and also oversees the execution of duties by the representative director. Audit & supervisory board members, including outside auditors, attend most meetings of the Board and Executive Committee, which convene on a number of occasions each year, to engage in discussions and to monitor proceedings in detail. One of the audit & supervisory board member is full-t ime auditor with the power to submit quest ions to the Group employees. The system enables the audit & supervisory board members to conduct adequate monitoring of the execution of duties by directors. The Internal Audit Department, which has a staff of two employees, is fully independent of other Group operations. It undertakes an audit of all departments of the holding company and operating subsidiaries based on the annual audit plan approved by the Board of Directors. Results of these audits are reported to the Board of Directors and Audit & Supervisory board.
Internal Controls
We regard the construction of a system of internal controls as a crit ical part of corporate governance. These controls include the five components described below. (1) Keep all directors and employees informed about our CSR (Corporate Social Responsibility) Philosophy and the Code of Conduct. (2) The appointment of one director as chief compliance officer to chair the Ethics Committee and lead a team promoting internal business ethics. (3) An internal hotline to enable employees to report compliance violations or any related concerns to an external lawyer. (4) Regular reports by the chief compliance officer to the Board of Directors concerning the ethics and compliance framework status. (5) Establishment of an independent Internal Audit Department that reports audit findings to the Board of Directors and the Audit & Supervisory Board, and where necessary to the accounting auditors as well. To maintain the reliability of our financial reporting, we have also developed a system of internal controls to ensure that effective and appropriate internal control reports are produced, based on the provisions of the Financial Instruments and Exchange Law.
Executive Compensation
Executive CategoryTotal Amount ofCompensation ( million yen )
Amounts of Compensation by Type ( million yen)
Directors (excluding outside directors)
Executive compensation for the year ended March 2015 is shown below.
413
12
31
97
12
31
106
-
-
209
-
-
7
2
4
-
-
-
Audit & supervisory board members (excluding outside audit & supervisoryboard members)
Appoints and Dismisses
Appoints and Dismisses
Instructs
Appoints and Dismisses
Reports to Appoints and Dismisses
Appoints and Dismisses
Reports to
Reports to
Reports to Instructs
Reports to
AuditsReports to
Outside officers
In addition to base compensation, a director compensation system that provides for the payment of performance-basedmonetary compensation
and performance-based stock compensation to executive directors (here and hereafter, directors specified in each item of Article 363, Paragraph
1 of the Companies Act of Japan) was approved at the ordinary General Shareholders’ Meeting held on June 20, 2014.
This director compensation system is intended to provide even further motivation to executive directors to raise the corporate value of the Group
over the medium to long term by increasing the degree to which executive directors share interests with shareholders.
Compensation paid to directors other than executive directors and to audit & supervisory board members consists of base compensation only.
The amount of base compensation paid to directors and the methods of calculating amounts of performance-based monetary compensation and
performance-based stock compensation paid to to executive directors as well as the timing of payment, distribution, and so on are determined by
the Board of Directors with within the range approved by the General Shareholders' Meeting. When making such decisions, the chairman of the
Compensation Advisory Committee, who is an outside director, performs an objective, comparative verification of compensation levels using
officer compensation survey data from an outside research organization, deliberates on compensation policies and levels, and reports to the
Board of Directors. The Board makes determinations based on the Committee’s report.
Compensation paid to audit & supervisory board members is determined through consultations with the audit & supervisory board members within
the range approved by the General Shareholders’ Meeting.
Risk Management The Group has studied and instituted ways of mitigating, or of taking appropriate steps in response to, a variety of risks associated with business
activities. One director is appointed as “the director in charge of risk management.” Moreover, the department in charge of risks occurring in the
course of natural work operations evaluates and responds to these risks. Furthermore, the Risk Management Committee conducts risk management in
a cross-departmental manner over the entire Group. As regards the detailed activities conducted during the fiscal year ended March 2012, the Group
completely reviewed the Risk Management Manual, and also focused activities on issues related to the aftermath of the Great East Japan Earthquake
that occurred in March 2011. As part of our responses in the period after the earthquake, we established an earthquake countermeasure conference
framework, and arranged for domestic bases to hold frequent television conferences. As a result, the Group confirmed that it could respond rapidly in
the event of an earthquake. We also verified that we had secured a method of communication to use immediately after an earthquake, and that
time is needed to confirm the safety status of those employees who are on leave when an earthquake occurs.
In this context, the Risk Management Committee used this post-earthquake information as a basis to review a manual describing the emergency
situation caused by a fire or earthquake, and how to respond afterwards. This manual forms part of the Risk Management Manual, and is meant to be
used in such an emergency. We ensured that the manual is simply written and clearly lists what must be done. We also combined the antidisaster
drills that had been conducted at each base hitherto, and performed a joint drill at three domestic bases.
Corporate Governance
Base compensation
Performance- based monetary compensation
Performance-based stock compensation
Retirement Benefits
Number of executives
Shareholders' Meeting
Departments and Subsidiaries
Board of Directors
Office of Internal Audits
Compensation Advisory Committee
Nomination Advisory Committee
Board of Corporate Auditors Accounting Auditors
President and CEO
Executive Officer
Cooperation
Internal Audits
Cooperation Cooperation
Audits Audits
Reports to
Corporate Governance
30 31TAIYO HOLDINGS CO., LTD. Annual Report 2015TAIYO HOLDINGS CO., LTD. Annual Report 2015

Financial Section
Front row ( left to right )
Eiji TakeharaDirector
Masahisa KakinumaDirector
Eiji SatoPresident and CEO
Seiki KashimaManaging Director
Takayuki MoritaDirector
Takato KawaharaDirector
Back row ( left to right )
Haruomi YoshimotoAudit & Supervisory Board Member
Isamu MoriOutside Director
Masayuki HizumeOutside Director
Akihito SakaiOutside Audit & Supervisory Board Member
Kiyoshi EndoOutside Audit & Supervisory Board Member
DirectorsEiji Sato
Seiki Kashima
Masahisa Kakinuma
Takayuki Morita
Eiji Takehara
Takato Kawahara
Masayuki Hizume
Isamu Mori
President and CEO
Managing Director
Director
Director
Director
Director
Outside Director
Outside Director
( As of June 19, 2015)
Audit & Supervisory Board MembersAkihito Sakai
Kiyoshi Endo
Haruomi Yoshimoto
Outside Audit & Supervisory Board Member
Outside Audit & Supervisory Board Member
Audit & Supervisory Board Member
34 Six-Year Summary
36 Management’s Discussion and Analysis
40 Consolidated Balance Sheet
42 Consolidated Statement of Income
43 Consolidated Statement of Comprehensive Income
44 Consolidated Statement of Changes in Equity
46 Consolidated Statement of Cash Flows
48 Notes to Consolidated Financial Statements
76 Independent Auditor’s Report
Board of Directors and Audit & Supervisory Board Members
32 33TAIYO HOLDINGS CO., LTD. Annual Report 2015TAIYO HOLDINGS CO., LTD. Annual Report 2015

Six-Year Summary
TAIYO HOLDINGS CO., LTD. and Consolidated SubsidiariesThe years ended March 31
For the Year : Net salesCost of salesSelling, general and administrative expenses Operating incomeNet incomeDepreciation and amortizationNet cash provided by operating activitiesNet cash used in (provided by) investing activities Net cash provided by (used in) financing activities
¥ 35,05624,123
6,0894,8433,0101,2613,126
(70)(2,366)
2010 2011 2012 20142013 2015
Millions of Yen
Thousands of Shares
¥ 40,36628,428
6,5575,3813,4031,1274,575
758(3,696)
¥ 39,797
5,9344,0402,5031,0462,793
(1,343)(2,979)
¥ 36,18425,319
6,4794,3863,3681,0046,109
(2,478)(2,314)
¥ 44,22528,349
8,3077,5694,9311,1817,020
(3,839)2,350
¥ 48,26028,86510,1409,2556,6671,4129,233
(2,913)(9,920)
At year-end : Total assetsProperty, plant and equipment, net Total liabilitiesMinority interestsTotal equity
43,70413,954
8,018679
35,685
42,85113,050
8,664696
34,186
40,70312,546
7,227478
33,476
44,02312,664
7,213605
36,810
58,36914,37615,713
2,04642,656
61,24216,86519,9292,238
41,312
Per share data : Basic net incomeCash dividends applicable to the year Net assets
¥ 116.0890.00
1,349.61
¥ 131.78115.00
1,316.53
¥ 98.3890.00
1,297.18
¥ 132.3890.00
1,423.26
¥ 193.83120.00
1,596.45
¥ 264.0590.00
1,703.14
Ratios : Ratio of operating income to net sales Return on equityEquity ratio
Common stock : Number of shares issued
See notes to consolidated financial statements.
13.8%8.7
80.1
13.3%9.9
78.2
10.2%7.5
81.1
12.1%9.7
82.2
17.1%12.869.6
19.2%16.763.8
27,464,000 27,464,000 27,464,000 27,464,000 27,464,000 27,464,000
Net Sales( Millions of Yen)
Operating Income
( Years ended March 31)
50,000
40,000
30,000
20,000
10,000
02011 2012 2013 2014 2015
40,36644,225
48,260
39,797
36,184
Operating Income and Operating Income Ratio( Millions of Yen)
( Years ended March 31)
10,000
8,000
6,000
4,000
2,000
0
30
24
18
12
6
02011 2012 2013 2014 2015
5,381
7,569
9,255
4,0404,386
Operating Income Ratio
Net Income and Net Income Per Share( Millions of Yen)
( Years ended March 31)
7,000
6,000
5,000
4,000
3,000
2,000
1,000
0
350
300
250
200
150
100
50
02011 2012 2013 2014 2015
3,403
4,931
6,667
3,368
Net Income Per Share
Net Income
2,503131.78
13.3
10.212.1
17.1
19.2
Return on Equity( Millions of Yen)(Yen)(%)
( Years ended March 31)
20,0
15,0
10,0
5,0
02011 2012 2013 2014 2015
9.9 9.77.5
12.8
16.7
98.38
132.38
193.83
264.05
Financial Section
34 35TAIYO HOLDINGS CO., LTD. Annual Report 2015TAIYO HOLDINGS CO., LTD. Annual Report 2015

Analysis of operating resultsIn the global economy during the fiscal year ended March 31, 2015, the U.S. economy has been on solid upward trends, backed by bullish market confidence and a boost in consumer spending, and the European economy also showed signs of a recovery. On the other hand, in the Chinese economy, the speed for economic expansion slowed down, although the market sentiment of manufacturing industry temporarily recovered against the backdrop of the government’s economic stimulus measures, etc. In the Japanese economy, the economic slump after the consumption tax hike has been fading and the economy remained on a moderate recovery track on the back of improvement in employment and income environment.In the electronics components industry, in which the Group operates, demand for materials for smartphones, servers, and vehicle installation parts remained firm. Under these conditions, net sales for the current fiscal year amounted to 48,260 million yen (up 9.1% year on year).In the PWB (printed wiring board) materials market, the sales volume increased, reflecting firm sales of rigid board materials and PKG (semiconductor packages) board materials. The sales amount also increased year on year due to the favorable effect of foreign currency exchange rate. As a result, net sales of PWB materials were 44,475 million yen (up 16.3% year on year).In the FPD (flat panel display) materials market, mainly consisting of PDP (plasma display panel) materials, sales volume decreased due to the effect of important clients withdrawing from the PDP business. As a result, net sales of FPD materials were 1,976 million yen (down 56.6% year on year).As a result, operating income amounted to 9,254 million yen (up 22.3% year on year) with ordinary income at 9,529 million yen (up 21.7% year on year) and net income at 6,667 million yen (up 35.2% year on year).
The following are sales results by product group category for the fiscal year ended March 31, 2015.
Management’s Discussion and Analysis
The consolidated company comprising the Japan segment is Taiyo Ink
Mfg. Co., Ltd., a manufacturing and marketing subsidiary.
Both the sales volume and the sales amount increased year on year due
to f i rm performance of high funct ion products such as PKG board
materials, mainly for smartphones.
As a result, net sales amounted to 15,786 million yen (up 12.7% year on
year) with segment profit at 2,466 million yen (up 29.4% year on year).
Sales results by product group category
The operating environment in the next fiscal year ending March 31, 2016 is expected that demand for small-sized information terminals such as smartphones and tablet devices, servers and vehicle installation parts continues to be strong in the electronics components industry in which the Group operates.Under these circumstances, the Group will continue to strengthen its marketing capability, expand the proportion of raw materials that it procures from overseas markets and improve productivity. At the same time, it will actively promote the development and marketing of new products with the ultimate goal of increasing its market share and expanding earnings.
Cash and deposits decreased approx. 1,300 million yen, notes and accounts receivable - trade increased approx. 1,200 million yen, merchandise and finished goods increased approx. 100 million yen, and prepaid expenses increased approx. 100 million yen.
Consolidated forecasts for the next fiscal year
a. Positions of assets, liabilities and net assets1. Japan
The consolidated companies comprising the China segment are Taiyo
Ink (Suzhou) Co . , L td . and Ons ta t i c I nk (Shenzhen) Co . , L td . ,
2. China (including Hong Kong)
Results by segment are as follows.
Previous fiscalyear results
Current fiscalyear results
Compared to the previous fiscal year
Change Rate of change (%)Name of product group category
Rigid board materialsPKG board and flexible board materialsBuild-up board materials
PWB materials
PDP materialsFPD materials
Other related products
29,2357,9651,025
4,554 1,976 (2,577) (56.6)
1,443 1,808 365 25.3
33,5399,8441,091
4,3041,878
65
14.723.6
6.4
Total 48,26044,224 9.14,035
manufacturing and marketing subsidiaries, and Taiyo Ink International
(HK) Ltd and Taiyo Ink Trading (Shenzhen) Co. , L td. , market ing
subsidiaries operating mainly in the southern China region. Onstatic Ink
( Shenzhen ) Co., Ltd. is a subsidiary of Onstatic Technology Co., Ltd.
In the PWB materials market, both the sales volume and the sales amount
increased year on year. This ref lected not only the consol idat ion,
effective from the first quarter ended June 30, 2014, of the statement of
income of Onstatic Ink (Shenzhen) Co., Ltd., for which profit and loss was
accounted for under the equity method in the first quarter ended June 30,
2013, but also strong sales main ly of mater ia ls re lated to vehic le
installation parts and smartphones.
As a result, net sales amounted to 20,421 million yen (up 14.8% year on
year) wi th segment prof i t a t 3 ,507 mi l l ion yen (up 34.0% year on
year).
The consolidated company comprising the Korea segment is Taiyo
Ink Co., (Korea) Ltd., a manufacturing and marketing subsidiary.
In the FPD materials market, both the sales volume and the sales
amount decreased year on year, due to the effect of important clients
withdrawing from the PDP business. On the other hand, demand was
strong for the high function PKG board materials used in smartphones,
which have a high-profit margin, and profit increased year on year.
As a result, net sales amounted to 9,199 million yen (down 13.2% year on
year ) with segment profit at 1,212 million yen ( up 12.9% year on year ).
The consol idated companies compris ing the Taiwan segment are
manufacturing and marketing subsidiaries Taiwan Taiyo Ink Co., Ltd., and
Onstatic Technology Co., Ltd. (and another three subsidiaries).
In the PWB materials market, both the sales volume and the sales amount
increased year on year. This reflected not only the consolidation, effective
from the first quarter ended June 30, 2014, of the statement of income of
Onstatic Technology Co., Ltd. (and another three subsidiaries), for which
profit and loss was accounted for under the equity method in the first
quarter ended June 30, 2013, but also strong demand for materials for
vehicle installation parts, servers and smart phones.
As a result, net sales amounted to 9,614 million yen (up 14.5% year on
year) with segment profit at 1,763 million yen (up 23.5% year on year).
3. Taiwan
4. Korea
The consolidated companies comprising the operations in areas other
than the above are Taiyo America, Inc. and Taiyo Ink International
(Singapore) Pte Ltd.
At Taiyo America, exports performed strongly.
Taiyo Ink Internat ional (Singapore) performed steadi ly due to the
expansion of the market of material for vehicle installation parts.
As a result, net sales amounted to 4,140 million yen (up 17.5% year on
year) with segment profit at 555 million yen (up 22.5% year on year).
5. Other
Net sales(Millions of yen)
Operating income(Millions of yen)
Ordinary income(Millions of yen)
Profit attributable to owners of parent
(Millions of yen)
Net income per share
(yen)
For the fiscal year ending March 31, 2016 (Forecast)
For the fiscal year ended March 31, 2015 (Actual results)
Rate of change (%)
51,500 10,200 10,300 7,000 305.12
48,260 9,254 9,529 6,667 264.05
6.7 10.2 8.1 5.0 15.6
(Millions of yen)
The following shows the positions of assets, liabilities and net assets as of March 31, 2015.
Analysis of financial position
As of March 31, 2014(Mill ions of yen)
As of March 31, 2015(Millions of yen)
Main factors(comparison with the end of the previous fiscal year)
Change(Millions of yen)
Current assets 37,798 37,942 144
Non-current assets 20,570 23,298 2,728
Total assets 58,369 61,241 2,872
Construction in progress increased approx. 1,500 million yen, buildings and structures increased approx. 400 million yen, machinery and equipment increased approx. 400 million yen, and net defined benefit asset increased approx. 300 million yen.
Financial Section
36 37TAIYO HOLDINGS CO., LTD. Annual Report 2015TAIYO HOLDINGS CO., LTD. Annual Report 2015

Equity ratio: (Net assets - Minority interests) / Total assets
Equity ratio on mark-to-market basis: Total market capitalization / Total assets
Interest-bearing debt to cash flow ratio: Interest-bearing debt / Cash flow
Interest coverage ratio: Operating cash flow / Interest paid
(1) The above indicators are calculated based on consolidated financial figures.
(2) Total market capitalization is calculated based on total number of issued shares at the fiscal year end (excluding treasury shares) × stock market price at the fiscal year end
(3) Net cash provided by (used in) operating activities stated in the consolidated statement of cash flows is used for “Cash flows.” “Interest paid” are the amounts stated under interest expenses paid in the consolidated statement of cash flows.
Our Group is reliant on the manufacture and sale of PWB materials, and SR in particular, as a major source of our income. If radical technological developments, such as electronic parts that do not use PWBs or PWBs that do not use SR, were to be widely adopted, this would result in a significant decrease in demand for our products.From the viewpoint of product characteristics, operability, and economic viability, there is little possibility that such technological innovations will be widely adopted in the near future. However, the Company considers it as important issue in the field of research and development to find possible new methods for PWBs.
a. Technological innovation risks
In order for our Group to maintain a superior competitive position, efforts are being made to protect the products and technology we develop through patents and intellectual property. However, in the event a patent application, etc. does not result in the granting of rights or a third-party requests invalidation, insufficient protection of our rights as a Group may result. Moreover, infringing the intellectual property rights owned by a third-party could impact the performance of our Group as a result of the payment of royalties or large amounts of damages.
b. Risks associated with patentsOur ratio of overseas sales to net sales is high and there are many instances when we calculate product prices in foreign currencies. Accordingly, our business performance is affected by fluctuations in exchange rates, with a highly appreciated yen normally leading to reduced income and profits.
f. Risk of exchange rate fluctuations
PWB manufacturing is shifting to other Asian countries, especially China, and we are engaged in continuing price wars with rival companies including local companies as well as other Japanese firms regarding SR. There is also pressure to lower SR prices which has resulted from price competition in the PWB market. Because of this, there is a possibility that the price of our main product, SR, may drop thus affecting the performance of our Group.
g. Risk of price fluctuations in key products
Demand for our Group’s main products is influenced by electronic components market trends, which may affect the performance of our Group.
h. Risks related to fluctuations in product demand
The Group has many customers and, although we do not concentrate an excessive amount of receivables on specific customers, the deterioration of the financial position of customers and the resulting bad debt may affect the performance of our Group.
i. Credit risks related to receivables
Due to the state of the oil market, the prices of certain raw materials have risen, which may affect the performance of our Group.
j. Risks related to the soaring cost of raw materials
The Group procures many of its raw materials from external raw material manufacturers. Problems at these raw material manufacturers or a lack of supplies that hinder the Group’s production activities may affect the performance of the Group.
d. Risk related to procurement of raw materials
Our Group conducts manufacturing activities in Japan, Taiwan, Korea, China, and the United States. Sales of our Group’s products particularly in China, Taiwan, Korea, ASEAN countries, and other Asian markets are expanding. Accordingly, terrorist activities, destabilization of the political si tuat ion, economic f luctuat ions, the outbreak of earthquakes and contagion, unforeseen changes to legal, regulatory or tax systems, and other country-specific risks could impact on the business strategies and performance of our Group.
e. Country-specific risks related to business deployment overseas
Our Group has manufacturing bases in Japan, Taiwan, Korea, China and the United States. In the event that any of our manufacturing bases is damaged by a natural disaster and manufacturing functions are obstructed, manufacturing and supply functions would be switched to another manufacturing base as an emergency measure. However, this would require some preparation and adjustment and our business would be affected in the interim.
c. Risk of major production facilities being affected by a disaster
b. Cash flow positionThe following is the position of cash flows for the fiscal year ended March 31, 2015.
Income before income taxes and minority interests provided approx. 9,900 million yen, depreciation provided approx. 1,400 million yen and income taxes paid used approx. 2,100 million yen
Fiscal year ended March 31, 2015(Millions of yen) Main factors
Net cash provided by (used in) operating activities 9,232
Purchase of property, plant and equipment used approx. 2,700 million yen, payment into time deposits used approx. 2,200 million yen, proceeds from withdrawal of time deposits provided approx. 1,600 million yen and proceeds from sales of investment securities provided approx. 700 million yen.
Net cash provided by (used in) investing activities (2,913)
Purchase of treasury shares used approx. 9,200 million yen, proceeds from long-term loans payable provided approx. 6,600 million yen, repayments of long-term loans payable used approx. 4,900 million yen and cash dividends paid used approx. 2,300 million yen.
Net cash provided by (used in) financing activities (9,919)
Net increase (decrease) in cash and cash equivalents (2,154)
Cash and cash equivalentsat end of period 18,183
c. Trend of indicatorsThe following is the transition of cash flow indicators.
Fiscal year endedMarch 31, 2011
Fiscal year endedMarch 31, 2012
Fiscal year endedMarch 31, 2013
Fiscal year endedMarch 31, 2014
Fiscal year endedMarch 31, 2015
Equity ratio (%) 78.2 81.1 82.2 69.6 63.8Equity ratio on mark-to-market basis (%) 152.0 138.7 156.0 133.1 158.3
1,350.2 992.5 3,850.3 331.3 302.2
Interest-bearing debt to cash flow ratio (year)
Interest coverage ratio ( t imes)
– – – 0.9 1.0
Long-term loans payable increased approx. 2,000 million yen, accounts payable - other increased approx. 600 million yen, income taxes payable increased approx. 600 million yen, current portion of long-term loans payable increased approx. 300 million yen, and deferred tax liabilities increased approx. 400 million yen.
As of March 31, 2014(Mill ions of yen)
As of March 31, 2015(Millions of yen)
Main factors(comparison with the end ofthe previous fiscal year)
Change(Millions of yen)
Total liabilities 15,713 4,21519,929
Total net assets 42,655 41,312 (1,343)
Total liabilities and net assets 58,369 61,241 2,872
Treasury shares increased approx. 9,200 million yen due to share buyback, net income increased approx. 6,700 million yen, foreign currency translation adjustment increased approx. 3,000 million yen, cash dividends paid of approx. 2,300 million yen, and retained earnings increased approx. 400 mill ion yen due to change in accounting policies.
The Company regards profit distribution to shareholders in cash as an important policy and will effectuate a continuous, stable profit distribution at high levels. We use the dividend on equity ratio as our target index, keeping this figure at least 5% of consolidated financial results for the mid-to long-term. In accordance with this policy, the Company paid an interim dividend of 45 yen per share.
As already announced, we also plan to pay a year-end dividend of 45 yen and this will be placed on the agenda of the next General Meeting of Shareholders. This will result in an annual dividend of 90 yen per share for the current fiscal year.In addition, in the current fiscal year, the Company acquired treasury shares worth 9,200 million yen through the resolution at the Board of Directors’ meeting. As a result, returns to shareholders, as a basis of the current fiscal year, amounted to 11,377 million yen (or the ratio of 170.6%), and the ratio of returns to shareholders on a cumulative basis for the five fiscal periods from the fiscal year ended March 31, 2011 to the fiscal year ended March 31, 2015 was 111.5%. In the aforementioned calculation, the dividend amounts and the amount used for the acquisition of treasury shares pertaining to the Employee Stock O wnership Plan (“ESOP”) trust for granting stock were excluded. Concerning dividends of the next fiscal year, we plan to pay an interim dividend of 55 yen and a year-end dividend of 55 yen, and this will result in an annual dividend of 110 yen per share and a rate of return to shareholders of 36.1%.
Basic policy on profit distribution and dividends for the current fiscal year and next fiscal year
The following are the main risks that may influence the business development of the Company.
Risk factors
Financial Section
38 39TAIYO HOLDINGS CO., LTD. Annual Report 2015TAIYO HOLDINGS CO., LTD. Annual Report 2015

CURRENT ASSETS:
Consolidated Balance Sheet
ASSETS
Cash and cash equivalents ( Note 13)
Time deposits (Note 13)
Notes and accounts receivable—trade (Notes 4 and 13)
Marketable securities (Note 3)
Inventories (Note 5)
Consumption taxes receivable
Deferred tax assets (Note 11)
Other current assets
Allowance for doubtful accounts (Note 13)
¥ 18,183
1,584
13,112
4,527
169
100
609
(341)
¥ 20,338
811
11,891
1
4,388
151
91
400
( 273 )
2015 2014
Mill ions of Yen
Thousands of U.S. Dollars
( Note 1 )
TAIYO HOLDINGS CO., LTD. and Consolidated SubsidiariesMarch 31, 2015
TAIYO HOLDINGS CO., LTD. Annual Report 2015
Total current assets
$ 151,273
13,178
109,085
37,662
1,406
832
5,067
(2,837)
2015
315,666 37,943 37,798
CURRENT LIABILITIES:
LIABILITIES AND EQUITY
Short-term bank loans (Notes 8 and 13)
Current portion of long-term debt (Notes 8 and 13)
Notes and accounts payable—trade (Note 13)
Accounts payable—other (Note 13)
Income taxes payable (Note 13)
Accrued expenses
Deferred tax liabilities (Note 11)
Other current liabilities
¥ 730
340
5,661
2,033
1,139
702
403
49
¥ 534
5,433
1,394
563
654
287
71
2015 2014
Mill ions of Yen
Thousands of U.S. Dollars
( Note 1 )
Total current l iabil i t ies 11,057
$ 6,073
2,829
47,096
16,913
9,476
5,840
3,353
408
2015
91,9888,936
COMMITMENTS AND CONTINGENT LIABILITIES (Note 15)
Shareholders' equity:Common stock—authorized, 50,000,000 shares;issued, 27,464,000 shares in 2015 and 2014
Capital surplus
Retained earnings
Treasury stock—at cost, 4,521,990 shares in 2015 and 2,026,110 shares in 2014
EQUITY (Notes 10 and 20):
6,135
7,144
36,997
(14,599)
51,040
59,434
307,796
(121,456 )
6,135
7,102
32,257
( 5,373)
Total shareholders' equity 35,677 296,81440,121
TOTAL ¥ 61,242 ¥ 58,369 $ 509,501
Valuation difference on available-for-sale securities
Foreign currency translation adjustments
Remeasurements of defined benefit plans (Note 9)
Total accumulated other comprehensive income
Minority interests
Accumulated other comprehensive income:
111
3,332
(46)
3,397
2,238
235
329
(75)
489
2,046
923
27,721
(383)
28,261
18,619Total equity 41,312 343,69442,656
PROPERTY, PLANT, AND EQUIPMENT (Note 6 ) :
Land
Buildings and structures—net
Machinery, equipment, and vehicles—net
Tools, furniture, and fixtures—net
Construction in progress
4,342
8,014
1,970
747
1,792
4,237
7,626
1,608
657
248
Total property, plant, and equipment 16,865
36,123
66,672
16,389
6,215
14,909
140,30814,376
See notes to consolidated financial statements.
INVESTMENTS AND OTHER ASSETS:Investment securities (Notes 3 and 13)
Investments in unconsolidated subsidiaries (Note 13)
Goodwill
Software
Net defined benefit asset (Note 9)
Deferred tax assets (Note 11)
Other assets
Allowance for doubtful accounts
362
39
4,850
306
340
63
475
( 1 )
749
19
4,745
236
16
431
( 1 )
Total investments and other assets 6,434
3,012
324
40,349
2,546
2,828
524
3,952
( 8 )
53,5276,195
TOTAL ¥ 61,242 ¥ 58,369 $ 509,501
Total long-term liabil i t ies 8,873 73,8196,777
LONG-TERM LIABILITIES:Long-term debt (Notes 8 and 13)
Liability for retirement benefits (Note 9)
Asset retirement obligations
Accrued liability for stock benefits
Deferred tax liabilities (Note 11)
Other long-term liabilities (Note 9)
7,686
10
56
42
1,070
9
5,658
327
55
702
35
63,944
83
466
349
8,902
75
40 41TAIYO HOLDINGS CO., LTD. Annual Report 2015
Financial Section

NET SALESCOST OF SALES
SELLING, GENERAL, AND ADMINISTRATIVE EXPENSES (Note 12)
Consolidated Statement of Income Consolidated Statement of Comprehensive Income
Gross profit
¥48,26028,865
19,395
10,140 84,359
$ 401,498240,142
¥44,22528,349
NET INCOME BEFORE MINORITY INTERESTSMINORITY INTERESTS IN NET INCOME
NET INCOME
6,972305
58,0032,537
5,200269
15,876
8,307
INCOME BEFORE INCOME TAXES AND MINORITY INTERESTS 9,920 82,5297,594
Operating income 9,255 76,9977,569
Other income—net 665 5,53225
2015 2014
Mill ions of Yen
Thousands of U.S. Dollars
( Note 1 )
TAIYO HOLDINGS CO., LTD. and Consolidated SubsidiariesYear Ended March 31, 2015
161,356
2015
PER SHARE OF COMMON STOCK ( Notes 2.t and 18 ) :
¥ 264.0590.00
$ 2.200.75
¥ 193.83120.00
Yen U.S. Dollars
OTHER INCOME (EXPENSES):Interest and dividend incomeInterest expenseForeign exchange gain—netSubsidy incomeRefunded consumption taxesCommission for purchase of treasury sharesGain on sales of investment securitiesLoss on valuation of golf club membershipEquity in earnings of associated companiesLoss on impairment of long-lived assets (Note 7)Loss on step acquisitions (Note 19)Gain on liquidation of subsidiaries and affiliatesOther—net
Basic net incomeCash dividends applicable to the year
126(30)127
528
(52)387(15)
89
150 (33)
24
13(279)
(73)59
164
1,048(250)1,057
42233
(433)3,220(125)
740
INCOME TAXES (Note 11):CurrentDeferred
2,671277
1,909485
22,2212,305
Total income taxes 2,948 24,526 2,394
¥ 6,667 ¥ 4,931 $ 55,466
NET INCOME BEFORE MINORITY INTERESTS ¥ 6,972 $ 58,003¥ 5,200
COMPREHENSIVE INCOME ¥ 10,200 $ 84,859¥ 8,090
2015 2014
Mill ions of Yen
Thousands of U.S. Dollars
( Note 1 )
TAIYO HOLDINGS CO., LTD. and Consolidated SubsidiariesYear Ended March 31, 2015
2015
OTHER COMPREHENSIVE INCOME ( Note 17) :Valuation difference on available-for-sale securit ies
Foreign currency translation adjustments
Remeasurements of defined benefit plans
(125)
3,324
29
(1,040)
27,654
242
100
2,790
COMPREHENSIVE INCOME ATTRIBUTABLE TO:Owners of the parent
Minority interests
¥ 9,651
549
¥ 7,560
530
$ 80,2914,568
Total other comprehensive income 26,8563,228 2,890
See notes to consolidated financial statements.
See notes to consolidated financial statements.
42 43TAIYO HOLDINGS CO., LTD. Annual Report 2015
Financial Section
TAIYO HOLDINGS CO., LTD. Annual Report 2015
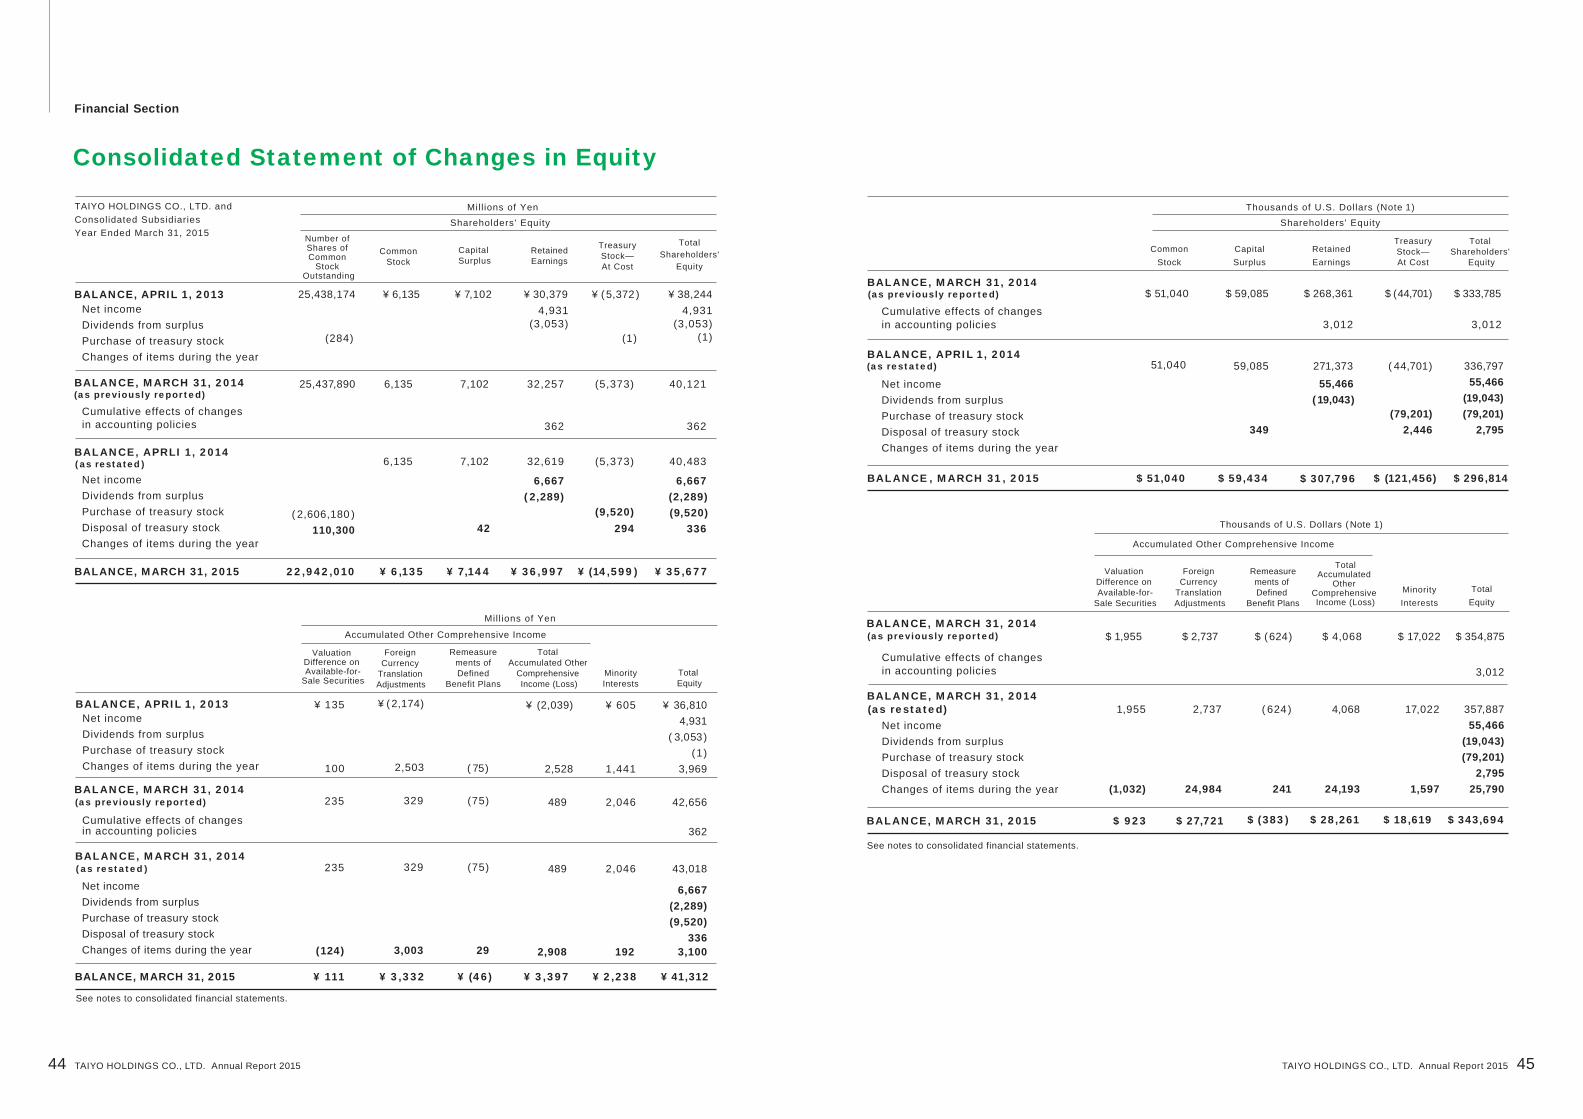
Consolidated Statement of Changes in Equity
25,438,174 ¥ 6,135
(284)
4,931(3,053)
(1)
4,931(3,053)
(1)
25,437,890 6,135 7,102 32,257 (5,373) 40,121
22,942,010 ¥ 6,135 ¥ 7,144 ¥ 36,997 ¥ (14,599) ¥ 35,677
362 362
¥ 7,102 ¥ 30,379 ¥ ( 5,372 ) ¥ 38,244BALANCE, APRIL 1, 2013
BALANCE, MARCH 31, 2014(as previously reported)
Net incomeDividends from surplusPurchase of treasury stockChanges of items during the year
Cumulative effects of changes in accounting policies
Number of Shares of Common
Stock Outstanding
CommonStock
CapitalSurplus
RetainedEarnings
TreasuryStock—At Cost
TotalShareholders'
Equity
TAIYO HOLDINGS CO., LTD. and Consolidated SubsidiariesYear Ended March 31, 2015
See notes to consolidated financial statements.
See notes to consolidated financial statements.
Mill ions of Yen
Shareholders' Equity
¥ 135
100
¥ ( 2,174)
2,503 ( 75)
¥ (2,039)
2,528
¥ 605
1,441
¥ 36,8104,931
( 3,053)(1)
3,969
Mill ions of Yen
Accumulated Other Comprehensive Income
BALANCE, APRIL 1, 2013
Valuation Difference on Available-for-
Sale Securities
ForeignCurrency
TranslationAdjustments
Remeasurements of Defined
Benefit Plans
Total Accumulated Other
Comprehensive Income (Loss)
MinorityInterests
Total Equity
6,135 7,102 32,619
6,667( 2,289)
6,667(2,289)(9,520)
336 ( 2,606,180 )
110,300 42 294 (9,520)
(5,373) 40,483BALANCE, APRLI 1, 2014(as restated)
BALANCE, MARCH 31, 2015
Net incomeDividends from surplusPurchase of treasury stockDisposal of treasury stockChanges of items during the year
Net incomeDividends from surplusPurchase of treasury stockChanges of items during the year
235 329 (75) 489 2,046 42,656
235 329 (75) 489 2,046 43,018
6,667(2,289)(9,520)
336 (124) 3,003 29 2,908 192 3,100
362
BALANCE, MARCH 31, 2014(as previously reported)
Cumulative effects of changesin accounting policies
BALANCE, MARCH 31, 2014(as restated)
Net incomeDividends from surplusPurchase of treasury stockDisposal of treasury stockChanges of items during the year
3,012
3,012
3,012
$ 51,040 $ 59,434 $ 307,796 $ (121,456) $ 296,814
$ 51,040
$ 1,955 $ 2,737 $ (624) $ 4,068 $ 17,022 $ 354,875
1,955
(1,032)
2,737
24,984
( 624 )
241
4,068
24,193
17,022
1,597
357,88755,466
(19,043)(79,201)
2,79525,790
$ 59,085 $ 268,361 $ (44,701) $ 333,785
51,040 59,085
349
271,373 ( 44,701)
(79,201)2,446
55,466( 19,043)
336,79755,466
(19,043)(79,201)
2,795
Thousands of U.S. Dollars (Note 1)
Shareholders' Equity
BALANCE, MARCH 31, 2014(as previously reported)
BALANCE, APRIL 1, 2014(as restated)
Cumulative effects of changes in accounting policies
CommonStock
CapitalSurplus
RetainedEarnings
TreasuryStock—At Cost
Total Shareholders'
Equity
BALANCE , MARCH 31, 2015
Net incomeDividends from surplusPurchase of treasury stockDisposal of treasury stockChanges of items during the year
¥ 111 ¥ 3,332 ¥ (46) ¥ 3,397 ¥ 2,238 ¥ 41,312BALANCE, MARCH 31, 2015
Thousands of U.S. Dollars ( Note 1)
Accumulated Other Comprehensive Income
Valuation Difference on Available-for-
Sale Securities
Foreign Currency
Translation Adjustments
Remeasurements of Defined
Benefit Plans
TotalAccumulated
Other Comprehensive Income (Loss)
MinorityInterests
TotalEquity
Cumulative effects of changesin accounting policies
BALANCE, MARCH 31, 2014(as restated)
BALANCE, MARCH 31, 2014(as previously reported)
Net incomeDividends from surplusPurchase of treasury stockDisposal of treasury stockChanges of items during the year
$ 923 $ 27,721 $ (383) $ 28,261 $ 18,619 $ 343,694BALANCE, MARCH 31, 2015
44 45TAIYO HOLDINGS CO., LTD. Annual Report 2015
Financial Section
TAIYO HOLDINGS CO., LTD. Annual Report 2015
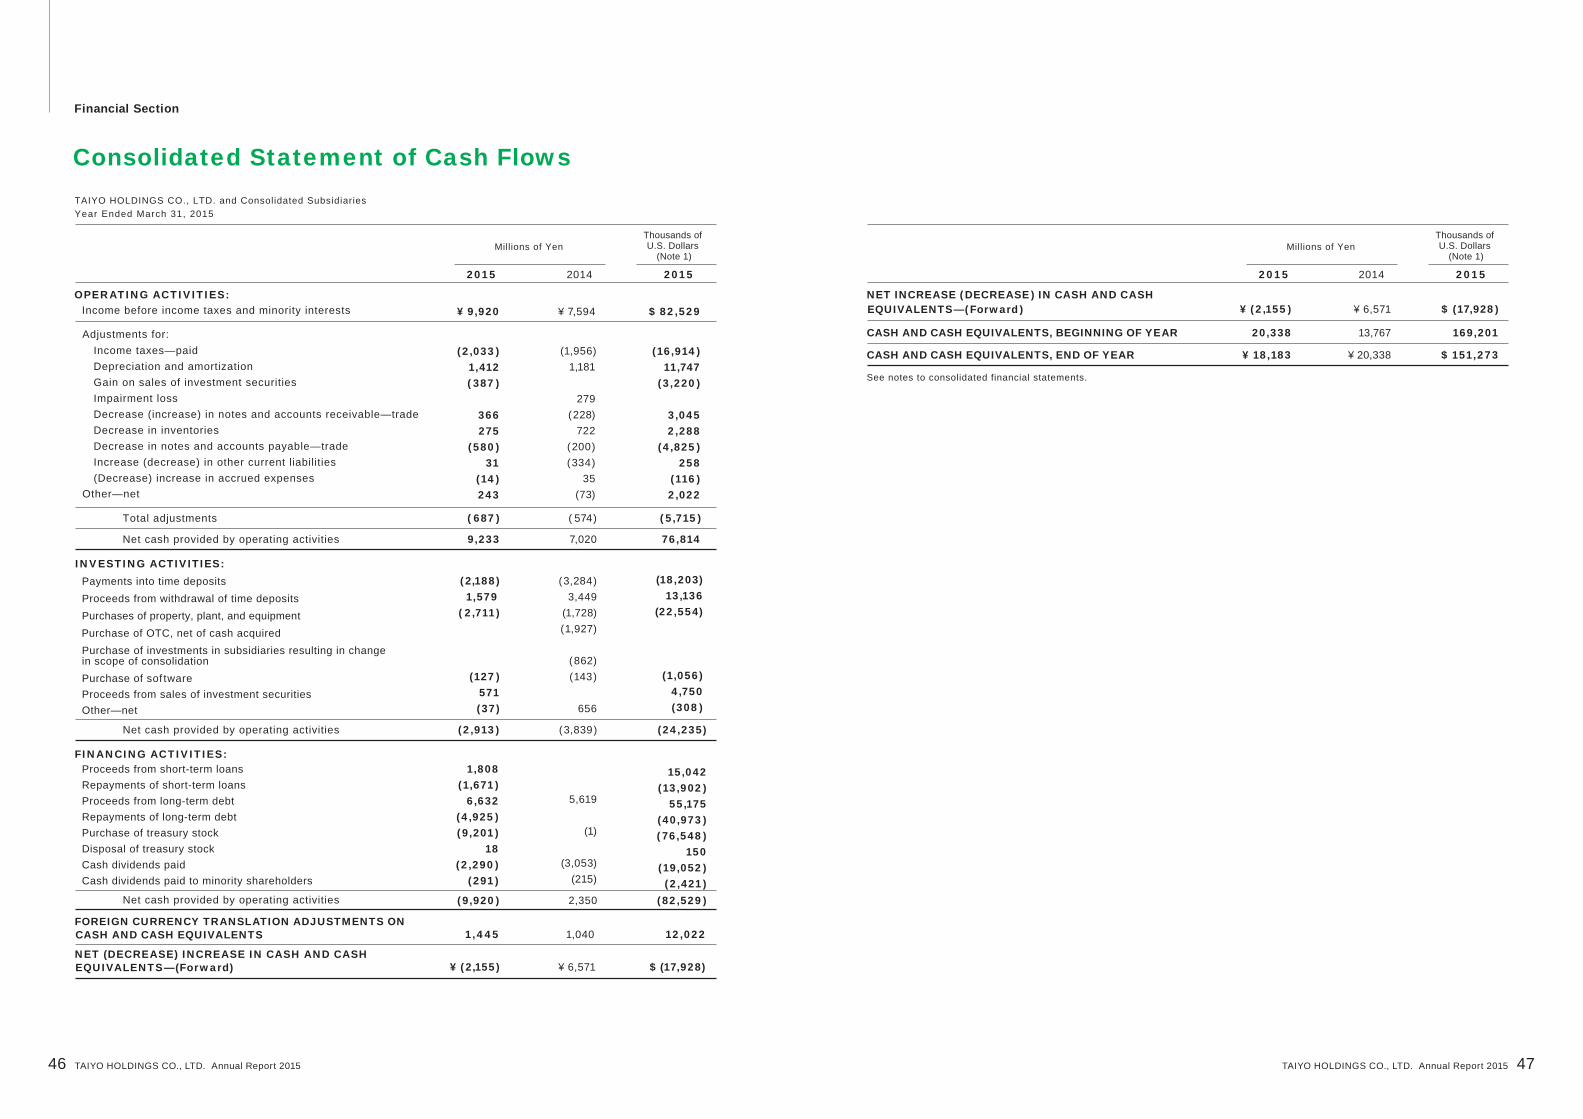
(1,956)1,181
279(228)
722(200)(334)
35(73)
1,445 12,022
Consolidated Statement of Cash Flows
¥ 9,920 ¥ 7,594 $ 82,529
Millions of YenThousands of U.S. Dollars
(Note 1)
OPERATING ACTIVITIES:Income before income taxes and minority interests
Total adjustments
Adjustments for: Income taxes—paid Depreciation and amortization Gain on sales of investment securities Impairment loss Decrease (increase) in notes and accounts receivable—trade Decrease in inventories Decrease in notes and accounts payable—trade Increase (decrease) in other current liabilities (Decrease) increase in accrued expensesOther—net
2015 2014 2015
TAIYO HOLDINGS CO., LTD. and Consolidated SubsidiariesYear Ended March 31, 2015
See notes to consolidated financial statements.
(2,188)1,579
( 2,711)
(127)571(37)
(3,284)3,449
(1,728)(1,927)
(862)(143)
656
(18,203)13,136
(22,554)
(1,056)4,750(308)
1,808 (1,671)
6,632(4,925)(9,201)
18(2,290)
(291)
15,042(13,902)
55,175(40,973)(76,548)
150(19,052)(2,421)
INVESTING ACTIVITIES:
(16,914)11,747
(3,220)
3,0452,288
(4,825)258
(116)2,022
( 687) ( 574) (5,715)
Net cash provided by operating activities 9,233 7,020 76,814
(2,913) (3,839) (24,235)
Payments into time depositsProceeds from withdrawal of time depositsPurchases of property, plant, and equipmentPurchase of OTC, net of cash acquiredPurchase of investments in subsidiaries resulting in change in scope of consolidationPurchase of sof twareProceeds from sales of investment securitiesOther—net
FINANCING ACTIVITIES:Proceeds from short-term loansRepayments of short-term loansProceeds from long-term debtRepayments of long-term debtPurchase of treasury stockDisposal of treasury stockCash dividends paidCash dividends paid to minority shareholders
¥ (2,155) ¥ 6,571 $ (17,928)
Millions of YenThousands of U.S. Dollars
(Note 1)
NET INCREASE (DECREASE) IN CASH AND CASH EQUIVALENTS—(Forward)
2015 2014 2015
20,338 13,767 169,201CASH AND CASH EQUIVALENTS, BEGINNING OF YEAR
¥ 18,183 ¥ 20,338 $ 151,273CASH AND CASH EQUIVALENTS, END OF YEAR
Net cash provided by operating activities
(9,920) 2,350 (82,529)Net cash provided by operating activities
FOREIGN CURRENCY TRANSLATION ADJUSTMENTS ON CASH AND CASH EQUIVALENTS
5,619
(1)
(3,053)(215)
1,040
¥ (2,155) $ (17,928)NET (DECREASE) INCREASE IN CASH AND CASH EQUIVALENTS—(Forward) ¥ 6,571
(2,033)1,412(387)
366275
(580)31
(14)243
46 47TAIYO HOLDINGS CO., LTD. Annual Report 2015
Financial Section
TAIYO HOLDINGS CO., LTD. Annual Report 2015
Notes to Consolidated Financial StatementsTAIYO HOLDINGS CO., LTD. and Consolidated SubsidiariesYear Ended March 31, 2015
1. BASIS OF PRESENTING CONSOLIDATED FINANCIAL STATEMENTSThe accompanying consolidated financial statements have
been prepared in accordance with the provisions set forth
in the Japanese Financial Instruments and Exchange Act
and its related accounting regulations and in accordance
with accounting principles generally accepted in Japan
("Japanese GAAP"), which are different in certain respects
a s t o a p p l i c a t i o n a n d d i s c l o s u r e r e q u i r e m e n t s o f
Internat ional Financial Report ing Standards.
In preparing these consol idated f inancial statements,
certain reclassifications and rearrangements have been
made to the consol idated f inancial statements issued
domestical ly in order to present them in a form that is
more fami l ia r to readers outs ide Japan. In add i t ion,
certain reclassi f icat ions have been made in the 2014
2. SUMMARY OF SIGNIFICANT ACCOUNTING POLICIES
a. ConsolidationThe consolidated financial statements as of March 31, 2015, include the accounts of the Company and its 14
significant (14 as of March 31, 2014) subsidiaries (collectively, the "Group").
Under the control and influence concepts, those companies in which the Company, directly or indirectly, is able
to exercise control over operations are fully consolidated and those companies over which the Group has the
ability to exercise significant influence are accounted for using the equity method.
b. Unification of Accounting Policies Applied to Foreign Subsidiaries for the Consolidated Financial Statements
In May 2006, the Accounting Standards Board of Japan ("ASBJ") issued ASBJ Practical Issues Task Force (PITF)
No. 18, "Practical Solution on Unification of Accounting Policies Applied to Foreign Subsidiaries for the Consolidated
Financial Statements." PITF No. 18 prescribes (1) the accounting policies and procedures applied to a parent
company and its subsidiaries for similar transactions and events under similar circumstances should in principle be
unified for the preparation of the consolidated financial statements; (2) financial statements prepared by foreign
subsidiaries in accordance with either International Financial Reporting Standards or the accounting principles
generally accepted in the United States of America tentatively may be used for the consolidation process; (3)
however, the following items should be adjusted in the consolidation process so that net income is accounted for in
accordance with Japanese GAAP, unless they are not material : (a) amort izat ion of goodwil l ; (b) scheduled
amortization of actuarial gain or loss of pensions that has been recorded in equity through other comprehensive
income; (c) expensing capitalized development costs of research and development ("R&D"); (d) cancellation of the
fair value model accounting for property, plant, and equipment and investment properties, and incorporation of the
cost model accounting; and (e) exclusion of minority interests from net income, if included.
c. Business Combinations
In October 2003, the Business Accounting Counci l issued a statement of opinion, "Accounting for Business
Combinations," and in December 2005, the ASBJ issued ASBJ Statement No. 7, "Accounting Standard for Business
Divestitures" and ASBJ Guidance No. 10, "Guidance for Accounting Standard for Business Combinations and
Business Divestitures." The accounting standard for business combinations al lowed companies to apply the
pooling-of-interests method of accounting only when certain specific criteria were met such that the business
combination was essentially regarded as a uniting-of-interests. For business combinations that did not meet the
uniting-of-interests criteria, the business combination was considered to be an acquisition and the purchase method
of accounting was required. This standard also prescribed the accounting for combinations of entities under common
control and for joint ventures.
Investments in the remaining two (one as of March 31, 2014) unconsolidated subsidiaries are stated at cost. If the
equi ty method of account ing had been appl ied to the investments in these companies, the ef fect on the
accompanying consolidated financial statements would not be material.
The excess of the cost of an acquisition over the fair value of the net assets of the acquired subsidiary at the date of
acquisition is being amortized on a straight-line basis over a period of 5 or 20 years.
There are no investments in associated companies accounted for using the equity method in 2015 and 2014.
All significant intercompany balances and transactions have been eliminated in consolidation. All material unrealized
profit included in assets resulting from transactions within the Group is eliminated.
The fiscal years of two (three as of March 31, 2014) consolidated subsidiaries closed their accounts on December 31.
To prepare the Company's consolidated financial statements, Taiyo Ink (Suzhou) Co., Ltd. and Taiyo Ink Trading
(Shenzhen) Co., Ltd., prepared a set of accounts with a closing date of March 31 and these were used for
consolidation purposes. The Company used the financial statements of OTC whose fiscal year ends on December 31
for consolidation since the difference of fiscal year ends between the Company and OTC is no more than three
months. The necessary adjustments for significant transactions, if any, during the intervening period are made on
consolidation.
As OTC owns 5 subsidiaries, the total number of consolidated subsidiaries is 14.On February 20, 2015, one subsidiary of OTC was liquidated.
(Names of Consolidated Subsidiaries)
TAIYO INK MFG. CO., LTD.
TAIWAN TAIYO INK CO., LTD.
TAIYO INK CO., (KOREA) LTD.
TAIYO INK (SUZHOU) CO., LTD.
TAIYO AMERICA, INC.
TAIYO INK INTERNATIONAL (SINGAPORE) PTE LTD.
TAIYO INK INTERNATIONAL (HK) LTD.
TAIYO INK TRADING (SHENZHEN) CO., LTD.
ONSTATIC TECHNOLOGY CO., LTD. ("OTC")
conso l idated f inanc ia l s ta tements to conform to the
classifications used in 2015.
The conso l idated f inanc ia l s ta tements are s ta ted in
Japanese yen, the currency of the country in which Taiyo
Holdings Co., Ltd. (the "Company"), is incorporated and
operates. The translation of Japanese yen amounts into
U.S. dollar amounts is included solely for the convenience
of readers outside Japan and has been made at the rate of
¥120.2 to $1, the approximate rate of exchange at March
31, 2015. Such translation should not be construed as
representations that the Japanese yen amounts could be
converted into U.S. dollars at that or any other rate.
48 49TAIYO HOLDINGS CO., LTD. Annual Report 2015
Financial Section
TAIYO HOLDINGS CO., LTD. Annual Report 2015

d. Cash Equivalents
Cash equivalents are short-term investments that are readi ly convert ible into cash and that are exposed to
insignificant risk of changes in value.
Cash equivalents include time deposits, certificates of deposit, commercial paper, and bond funds, all of which
mature or become due within three months of the date of acquisition.
f. Marketable and Investment Securities
The Company classifies all marketable and investment securities as available-for-sale securities, which are reported at fair
value, with unrealized gains and losses, net of applicable taxes, reported in a separate component of equity.
Nonmarketable available-for-sale securities are stated at cost determined using the moving-average method. For
other-than-temporary decl ines in fair value, investment securities are reduced to net realizable value by a charge
to income.
g. Allowance for Doubtful Accounts
The allowance for doubtful accounts is provided for at the aggregate amounts of estimated credit losses based
on the individual f inancial review of doubtful or troubled accounts and a general reserve for other accounts
based on the Company's historical credit loss experience of a certain past period.
h. Property, Plant, and Equipment
Property, plant, and equipment are stated at cost.
Buildings are depreciated principally using the straight-line method, while property, plant, and equipment other than
buildings are depreciated principally using the declining-balance method over the estimated useful lives of the assets.
The ranges of useful lives for major categories are as follows:
e. Inventories
Inventories are principally stated at the lower of cost, determined by the moving-average method, or net selling value.
i. Long-Lived Assets
The Group reviews its long-lived assets for impairment whenever events or changes in circumstance indicate the carrying amount of an asset or asset group may not be recoverable. An impairment loss would be recognized if the carrying amount of an asset or asset group exceeds the sum of the undiscounted future cash flows expected to result from the continued use and eventual disposition of the asset or asset group. The impairment loss would be measured as the amount by which the carrying amount of the asset exceeds its recoverable amount, which is the higher of the discounted cash flows from the continued use and eventual disposition of the asset or the net selling price at disposition.
j. SoftwareSoftware for internal use is amortized using the straight-l ine method over the estimated useful l i fe of mainly five years.
l. Accrued BonusesThe Company and certain consolidated subsidiaries provide accrued bonuses for employees, directors, and corporate auditors based on future projections for the current f iscal year.
m. Accrued Liability for Stock BenefitsThe Company accrues liability for stock benefits to be granted to employees in accordance with the " Rules on Distribution of Shares" based on the projected stock benefit liability.
n. Retirement and Pension PlansThe benefit formula basis is used to attribute expected benefits to periods of services in calculating projected benefit obligations.Prior service costs are amortized using the straight-l ine method over f ive years. Actuarial gains (losses) are amortized using the straight-line method over five years from the following year after incurrence. Unrecognized actuarial gains (losses) and unrecognized prior service cost are accounted for as remeasurements of defined benefit plans before tax in accumulated other comprehensive income.The main clause of Art icle 35 of the "Accounting Standard for Retirement Benefits" (ASBJ Statement No. 26 issued on May 17, 2012, hereinafter "Retirement Benefits Accounting Standard") and the main clause of Article 67 of the "Guidance on Accounting Standard for Retirement Benefits" (ASBJ Guidance No. 25 issued on March 26, 2015, hereinafter "Retirement Benefits Guidance") were adopted from the current fiscal year. Accordingly, the calculation methods of projected benefit obligation and service cost were changed. Specifically, the method of determining the portion of projected benefit obligations attributed to periods was changed from the straight- line method to the benefit formula basis. In addition, the method of determining the discount rates applied in the calcu lat ion of pro jected benef i t ob l igat ion was changed f rom the method us ing the average per iod up to estimated benefit payment date to the method using the single weighted-average discount rate that reflects the estimated period and amount of benefit payment in each period.The Retirement Benefits Accounting Standard and other standards were applied in accordance with the transitional treatment set forth in Article 37 of the Retirement Benefits Accounting Standard, and the effects of the change in calculation methods of projected benefit obligations and service cost were added to or deducted from retained earnings as of April 1, 2014.As a result, net defined benefit liability decreased by ¥317 million ($2,637 thousand), net defined benefit asset increased by ¥245 million ($2,038 thousand), and retained earnings increased by ¥362 million ($3,012 thousand), as of April 1, 2014. Also, operating income and income before income taxes and minority interest for the year ended March 31, 2015, decreased by ¥25 million ($208 thousand).
k. R&D CostsR&D costs are charged to income as incurred.
In December 2008, the ASBJ issued a revised accounting standard for business combinations, ASBJ Statement No. 21,
"Accounting Standard for Business Combinations." Major accounting changes under the revised accounting standard are
as follows: (1) The revised standard requires accounting for business combinations only by the purchase method. As a
result, the pooling-of-interests method of accounting is no longer allowed. (2) The previous accounting standard accounts
for R&D costs to be charged to income as incurred. Under the revised standard, in-process R&D acquired in a business
combination is capitalized as an intangible asset. (3) The previous accounting standard provided for a bargain purchase
gain (negative goodwill) to be systematically amortized over a period not exceeding 20 years. Under the revised standard,
the acquirer recognizes the bargain purchase gain in profit or loss on the acquisition date immediately after reassessing
and confirming that all of the assets acquired and all of the liabilities assumed have been identified after a review of the
procedures used in the purchase allocation. This standard was applicable to business combinations undertaken on or af ter
April 1, 2010. The Company adopted this standard on April 1, 2010.
Buildings and structures: From 7 to 60 yearsMachinery, equipment, and vehicles: From 4 to 10 yearsTools, furniture, and fixtures: From 3 to 8 years
50 51TAIYO HOLDINGS CO., LTD. Annual Report 2015
Financial Section
TAIYO HOLDINGS CO., LTD. Annual Report 2015

o. Asset Retirement Obligations
In March 2008, the ASBJ published the accounting standard for asset retirement obligations, ASBJ Statement
No. 18, "Account ing Standard for Asset Ret i rement Obl igat ions" and ASBJ Guidance No. 21, "Guidance on
Accounting Standard for Asset Retirement Obligations." Under these accounting standards, an asset retirement
obligation is defined as a legal obligation imposed either by law or contract that results from the acquisit ion,
construct ion, development, and the normal operat ion of a tangib le f ixed asset and is associated wi th the
re t i rement o f such tangib le f ixed asset . The asset re t i rement ob l igat ion is recognized as the sum of the
d iscounted cash f lows required for the future asset ret i rement and is recorded in the per iod in which the
obligation is incurred if a reasonable estimate can be made. If a reasonable estimate of the asset retirement
obl igat ion cannot be made in the per iod the asset ret i rement obl igat ion is incurred, the l iabi l i ty should be
recognized when a reasonable estimate of asset retirement obligation can be made. Upon initial recognition of a
l iabi l i ty for an asset ret irement obl igation, an asset ret irement cost is capital ized by increasing the carrying
amount of the related f ixed asset by the amount of the l iabi l i ty. The asset ret i rement cost is subsequent ly
allocated to expense through depreciation over the remaining useful l ife of the asset. Over time, the liability is
accreted to its present value each period. Any subsequent revisions to the timing or the amount of the original
estimate of undiscounted cash flows are reflected as an increase or a decrease in the carrying amount of the
liability and the capitalized amount of the related asset retirement cost.
p. Income Taxes
The provision for income taxes is computed based on the pretax income included in the consolidated statement
of income. The asset and l iabi l i ty approach is used to recognize deferred tax assets and l iabi l i t ies for the
expected future tax consequences of temporary differences between the carrying amounts and the tax bases of
assets and l iabi l i t ies. Deferred taxes are measured by apply ing current ly enacted income tax rates to the
temporary differences.
The Group fi les a tax return under the consolidated corporate tax system, which allows companies to base tax
payments on the combined profit or losses of the parent company and its wholly owned domestic subsidiaries.
q. Foreign Currency Transactions
Al l shor t - term and long- term monetary rece ivab les and payables denominated in fore ign cur renc ies are
t ranslated in to Japanese yen at the exchange rates at the consol idated balance sheet date. The fore ign
exchange gains and losses from translation are recognized in the consolidated statement of income.
r. Foreign Currency Financial Statements
The balance sheet accounts of the consolidated foreign subsidiaries are translated into Japanese yen at the current
exchange rates as of the consolidated balance sheet date, except for equity, which is translated at the historical
exchange rates. Differences arising from such translation are shown as "Foreign currency translation adjustments"
under accumulated other comprehensive income in a separate component of equity. Revenue and expense accounts
of consolidated foreign subsidiaries are translated into Japanese yen at the average exchange rates.
s. Derivative Financial Instruments
The Company enters into derivative financial instruments to manage foreign exchange risks and interest rate risks. The Company uses long-term borrowings denominated in foreign currency to reduce foreign currency risks arising from investments in foreign subsidiaries. The Company also uses interest rate swap contracts for the purpose of hedging the interest rate risk associated with the underlying borrowings.All derivative financial instruments are recognized at fair value in the consolidated balance sheet. For derivatives used for hedging purpose, the gains and losses are deferred until the hedge item is recognized. The Company records in "Foreign currency translation adjustments" the gains or losses on the derivative financial instruments that are designated as hedging instruments for investments in foreign subsidiaries. Exceptional treatment is applied for interest rate swap contracts which qualify for hedge accounting and meet specific matching criteria.The Company evaluates effectiveness of hedging activities for investments in foreign subsidiary by referring the accumulated gains or losses on the hedging instruments and the related hedged items from the commencement of the hedging transactions. The Company omits the assessment of hedge effectiveness of interest rate swaps which qualify for hedge accounting and meet specific criteria.
t. Per Share Information
Basic net earnings per share ("EPS") is computed by dividing net income available to common shareholders by the weighted average number of common shares outstanding for the period.Diluted net EPS is not disclosed because it is antidilutive.Cash dividends per share presented in the accompanying consolidated statement of income are dividends applicable to the respective years, including dividends to be paid at the end of the year.
u. Accounting Changes and Error Corrections
In December 2009, the ASBJ issued ASBJ Statement No. 24, "Accounting Standard for Accounting Changes and Error Corrections" and ASBJ Guidance No. 24, "Guidance on Accounting Standard for Accounting Changes and Error Corrections." Accounting treatments under this standard and guidance are as follows: (1) Changes in Accounting Policies—When a new accounting policy is applied with revision of accounting standards, the new policy is applied retrospectively, unless the revised accounting standards include specific transitional provisions. When the revised accounting standards include specific transitional provisions, an entity shall comply with the specific transitional provisions. (2) Changes in Presentation—When the presentation of consolidated financial statements is changed, prior-period consolidated financial statements are reclassified in accordance with the new presentation. (3) Changes in Accounting Estimates—A change in an accounting estimate is accounted for in the period of the change if the change affects that period only and is accounted for prospectively if the change affects both the period of the change and future periods. (4) Corrections of Prior-Period Errors—When an error in prior-period consolidated financial statements is discovered, those consolidated statements are restated. This accounting standard and the guidance are applicable to accounting changes and corrections of prior-period errors, which are made from the beginning of fiscal years beginning on or after April 1, 2011.
In addition, net assets per share as of March 31, 2015, increased ¥11.82 ($0.10) and net income per share for the year
ended March 31, 2015, decreased by ¥0.98 ($0.01).
Liability for directors and corporate auditors is recorded to account for the payments of their retirement benefits based on
the internal rules.
The Company, at the meeting of the board of directors held on April 22, 2010, resolved to abolish the directors' retirement
benefits system, and the agenda item regarding lump sum payments resulting from said abolishment was approved at the
64th general meeting of shareholders held on June 29, 2010. These payments will be effected as retirement benefits paid
at the time of retirement according to the period of service up to the abolishment of the system.
52 53TAIYO HOLDINGS CO., LTD. Annual Report 2015
Financial Section
TAIYO HOLDINGS CO., LTD. Annual Report 2015

v. Employee Stock Ownership Plan
The Company has applied the "Practical Solution on Transactions of Delivering the Company's Own Stock to
Employees etc. through Trusts (Practical Issue Task Force (PITF) No. 30 issued on March 26, 2015)" for the
year ended March 31, 2015.
w. Accounting Standards Issued but Not Yet Adopted
"Accounting Standard for Business Combinations" (ASBJ Statement No. 21, September 13, 2013)
"Accounting Standard for Consolidated Financial Statements" (ASBJ Statement No. 22, September 13, 2013)
"Accounting Standard for Business Divestitures" (ASBJ Statement No. 7, September 13, 2013)
"Accounting Standard for Earnings Per Share" (ASBJ Statement No. 2, September 13, 2013)
"Guidance on Accounting Standards for Business Combinations and Business Divestitures" (ASBJ Guidance No. 10, September 13, 2013)
"Guidance on Accounting Standard for Earnings Per Share" (ASBJ Guidance No. 4, September 13, 2013)
At the board of directors' meeting held on May 2, 2014, a resolution was made to introduce the Employee Stock Ownership
Plan ("ESOP") trust for granting stock as an employee incentive plan. The purpose of this incentive plan is (i) to increase
employee commitment and encourage involvement in the management of the business; ( i i) to raise morale and give
employees an incentive to behave in ways that will contribute to the Company's long-term performance and stock price; and
(iii) to improve the mid- and long-term corporate value of the Company.
Under this plan, the Company establishes a trust for persons who satisfy the beneficiary requirements from among
employees, and entrust money necessary for acquisition of the Company's shares. The trustee of the trust will acquire
the Company's shares, to be distributed to employees in the future, from the Company in accordance with the "Rules on
Distr ibution of Shares." Afterward, the trustee wil l grant a certain number of the Company's shares to beneficiaries
based on "qual i f ication grade etc." during the trust term. Beneficiaries wil l assume no cost in this regard since the
underlying funds in the trust are fully contributed by the Company.
Assets and liabilities in relation to the trust are recorded in the consolidated balance sheet, and gains and losses therefrom
are recorded in the consolidated statement of income.
(1) Outline of transactions
The Company's shares held by the trust were accounted for as treasury stock in net assets at book value (that do not include
transaction costs paid to acquire the shares) in the trust. Under the trust, the book value and the number of shares of
treasury stocks as of March 31, 2015, were ¥301 million and 98,760 shares, respectively.
(2) The Company's shares held by the trust
These accounting standards have been revised in relation to transactions such as the acquisition of additional shares of
a subsidiary. The revisions primarily pertain to (i) treatment of changes in the parent company's ownership interest in a
subsidiary when the parent company retains control over the subsidiary, (ii) the treatment of acquisition costs, (ii i) the
presentation of net income and the change in presentation from minority interests to non controlling interests, and (iv)
the process for the t reatments of prov is ional account ing and other changes re lated to t ransact ions such as the
acquisition of additional shares of a subsidiary.
(1) Overview
These accounting standards are effective from the year beginning on April 1, 2015. The revised standards for provisional
accounting treatment are effective for a business combination which will be carried out on or after April 1, 2015.
(2) Scheduled date of application
The impact of adopting the accounting standards and relevant regulat ions on consol idated f inancial statements is
currently under assessment.
(3) Effect of the adoption of accounting standards
3. MARKETABLE AND INVESTMENT SECURITIES
¥ 350 ¥ 7311
$ 2,912
Millions of YenThousands of U.S. Dollars
Noncurrent:Marketable equity securitiesGovernment and corporate bonds
2015 2014 2015
Marketable and investment securities as of March 31, 2015 and 2014, consisted of the following:
¥ 350 ¥ 732 $ 2,912Total
Total
¥ 188 ¥ 350¥ 164 ¥ 2
¥ 188 ¥ 350¥ 164 ¥ 2
Millions of Yen
Securities classified as available for sale:Equity securitiesDebt securities
CostUnrealized
GainsUnrealized
LossesFair
ValueMarch 31, 2015
The costs and aggregate fair values of marketable and investment securities as of March 31, 2015 and 2014, were as follows:
Total
¥ 3651
¥ 7311
¥ 374 ¥ 8
Securities classified as available for sale:Equity securitiesDebt securities
March 31, 2014
¥ 366 ¥ 732¥ 374 ¥ 8
54 55TAIYO HOLDINGS CO., LTD. Annual Report 2015
Financial Section
TAIYO HOLDINGS CO., LTD. Annual Report 2015
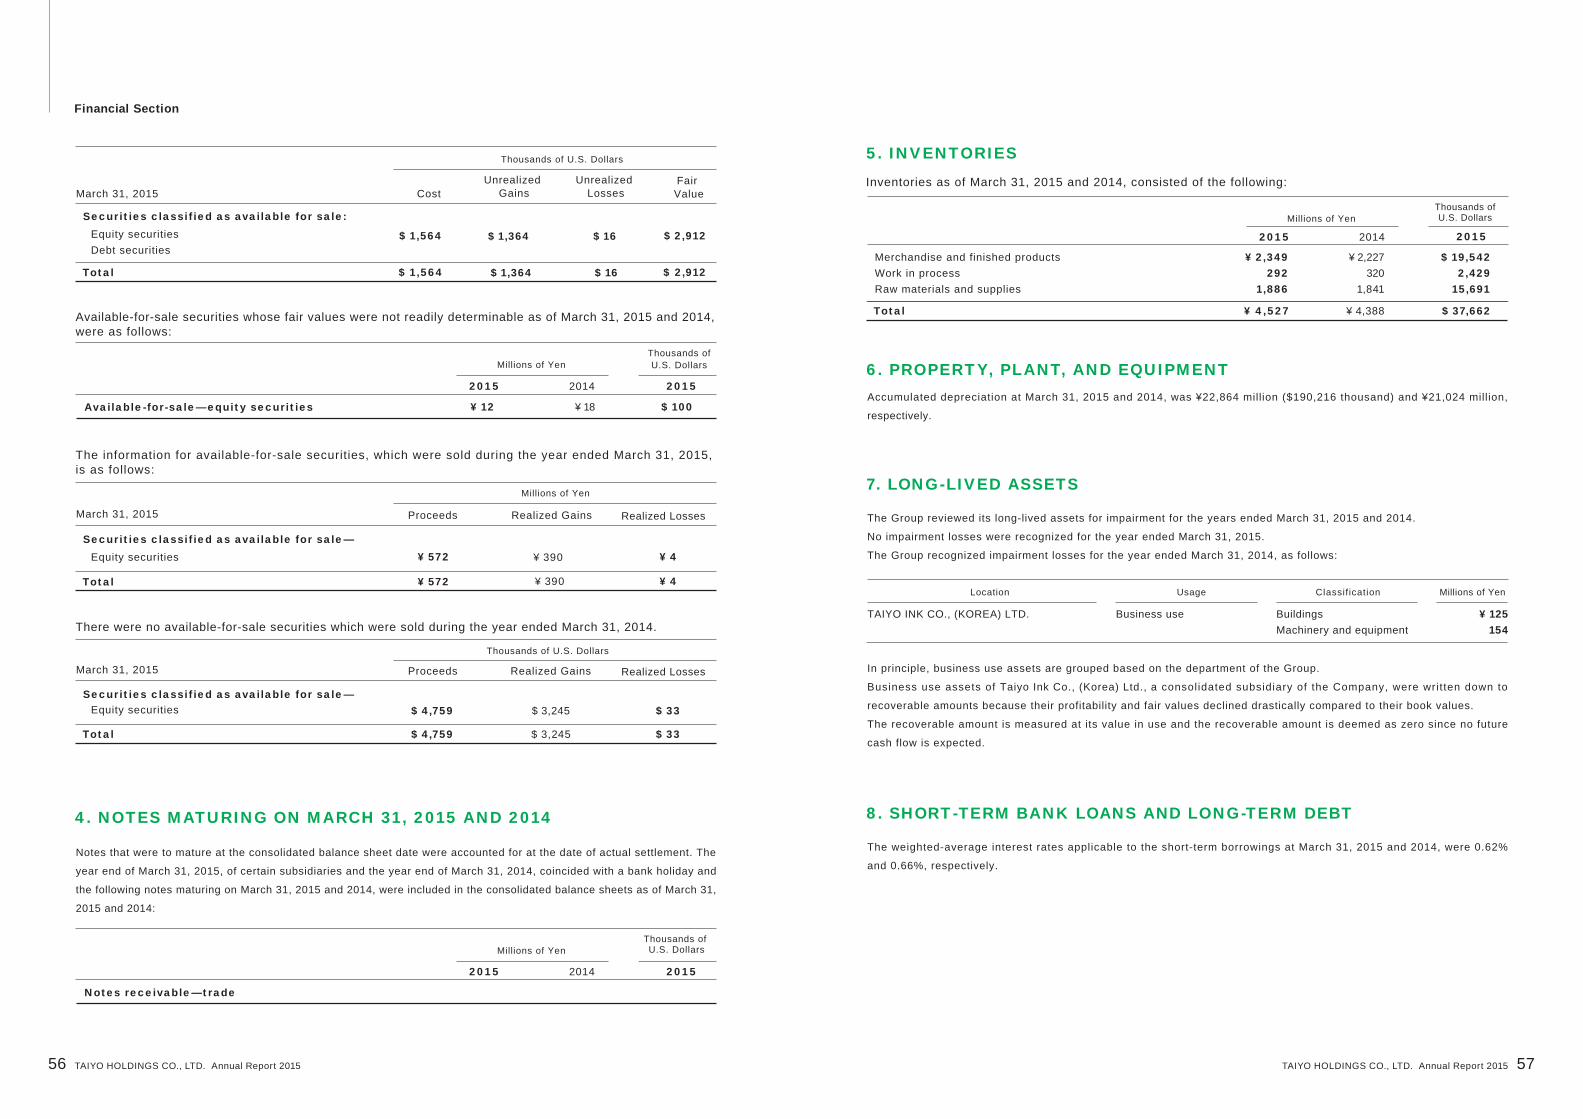
4. NOTES MATURING ON MARCH 31, 2015 AND 2014
¥ 2,349292
1,886
$ 19,5422,429
15,691
¥ 2,227320
1,841
Millions of YenThousands of U.S. Dollars
Merchandise and finished productsWork in processRaw materials and supplies
2015 2014 2015
Inventories as of March 31, 2015 and 2014, consisted of the following:
¥ 4,527 ¥ 4,388 $ 37,662Total
¥ 12 ¥ 18 $ 100
Millions of YenThousands of U.S. Dollars
Available-for-sale—equity securities
2015 2014 2015
Available-for-sale securities whose fair values were not readily determinable as of March 31, 2015 and 2014,were as follows:
Millions of YenThousands of U.S. Dollars
Notes receivable—trade
2015 2014 2015
The information for available-for-sale securities, which were sold during the year ended March 31, 2015, is as follows:
¥ 125154
Location Usage Millions of YenClassification
TAIYO INK CO., (KOREA) LTD. Business use BuildingsMachinery and equipment
Total
$ 1,564 $ 2,912$ 1,364 $ 16
$ 1,564 $ 2,912$ 1,364 $ 16
Thousands of U.S. Dollars
Securities classified as available for sale:Equity securitiesDebt securities
Cost Unrealized
GainsUnrealized
LossesFair
ValueMarch 31, 2015
Total
¥ 572
¥ 572
¥ 4
¥ 4
¥ 390
¥ 390
Millions of Yen
Securities classified as available for sale—Equity securities
Proceeds Realized Gains Realized LossesMarch 31, 2015
There were no available-for-sale securities which were sold during the year ended March 31, 2014.
Total
$ 4,759 $ 3,245 $ 33
$ 4,759 $ 3,245 $ 33
Thousands of U.S. Dollars
Securities classified as available for sale—Equity securities
Proceeds Realized Gains Realized LossesMarch 31, 2015
Notes that were to mature at the consolidated balance sheet date were accounted for at the date of actual settlement. The
year end of March 31, 2015, of certain subsidiaries and the year end of March 31, 2014, coincided with a bank holiday and
the following notes maturing on March 31, 2015 and 2014, were included in the consolidated balance sheets as of March 31,
2015 and 2014:
6. PROPERTY, PLANT, AND EQUIPMENTAccumulated depreciation at March 31, 2015 and 2014, was ¥22,864 million ($190,216 thousand) and ¥21,024 million,
respectively.
7. LONG-LIVED ASSETS
The Group reviewed its long-lived assets for impairment for the years ended March 31, 2015 and 2014.
No impairment losses were recognized for the year ended March 31, 2015.
The Group recognized impairment losses for the year ended March 31, 2014, as follows:
8. SHORT-TERM BANK LOANS AND LONG-TERM DEBT
The weighted-average interest rates applicable to the short-term borrowings at March 31, 2015 and 2014, were 0.62%
and 0.66%, respectively.
In principle, business use assets are grouped based on the department of the Group.
Business use assets of Taiyo Ink Co., (Korea) Ltd., a consolidated subsidiary of the Company, were written down to
recoverable amounts because their profitability and fair values declined drastically compared to their book values.
The recoverable amount is measured at its value in use and the recoverable amount is deemed as zero since no future
cash flow is expected.
5. INVENTORIES
56 57TAIYO HOLDINGS CO., LTD. Annual Report 2015
Financial Section
TAIYO HOLDINGS CO., LTD. Annual Report 2015
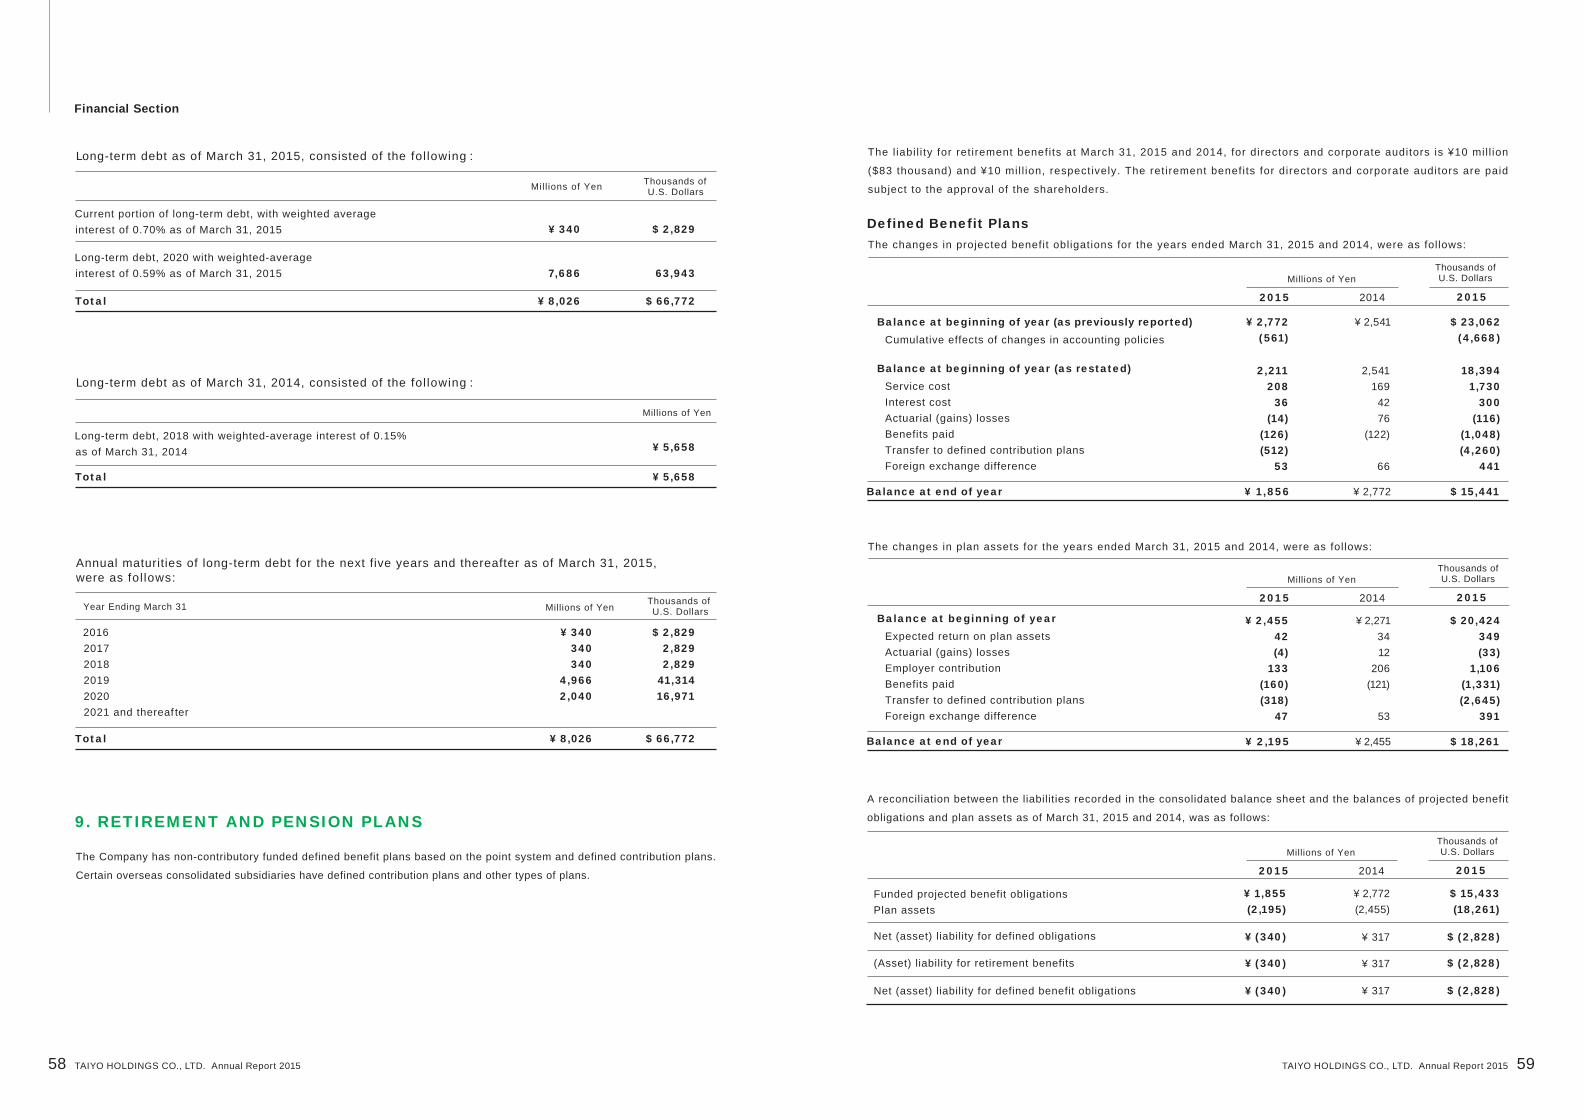
¥ 2,541
18,3941,730
300(116)
(1,048)(4,260)
441
¥ 1,856 ¥ 2,772 $ 15,441Balance at end of year
9. RETIREMENT AND PENSION PLANS
Mill ions of Yen Thousands of U.S. Dollars
Long-term debt as of March 31, 2015, consisted of the fol lowing :
Total
¥ 340 $ 2,829
7,686 63,943
¥ 8,026 $ 66,772
Current portion of long-term debt, with weighted average interest of 0.70% as of March 31, 2015
Long-term debt, 2020 with weighted-average interest of 0.59% as of March 31, 2015
Millions of Yen
Long-term debt as of March 31, 2014, consisted of the fol lowing :
Total
¥ 5,658
¥ 5,658
Long-term debt, 2018 with weighted-average interest of 0.15% as of March 31, 2014
Thousands of U.S. DollarsMillions of YenYear Ending March 31
Annual maturities of long-term debt for the next five years and thereafter as of March 31, 2015, were as fol lows:
Total
¥ 340340340
4,9662,040
$ 2,8292,8292,829
41,31416,971
$ 66,772¥ 8,026
201620172018201920202021 and thereaf ter
The Company has non-contributory funded defined benefit plans based on the point system and defined contribution plans.
Certain overseas consolidated subsidiaries have defined contribution plans and other types of plans.
The l iabi l i ty for ret irement benefits at March 31, 2015 and 2014, for directors and corporate auditors is ¥10 mil l ion
($83 thousand) and ¥10 mil l ion, respectively. The retirement benefits for directors and corporate auditors are paid
subject to the approval of the shareholders.
The changes in projected benefit obligations for the years ended March 31, 2015 and 2014, were as follows:
Defined Benefit Plans
¥ 2,772(561)
$ 23,062(4,668)
2,211208
36(14)
(126)(512)
53
2,541169
4276
(122)
66
Millions of YenThousands of U.S. Dollars
2015 2014 2015
Balance at beginning of year (as previously reported)Cumulative effects of changes in accounting policies
Balance at beginning of year (as restated)Service costInterest costActuarial (gains) lossesBenefits paidTransfer to defined contribution plansForeign exchange difference
$ 20,424349(33)
1,106(1,331)(2,645)
391
¥ 2,195 ¥ 2,455 $ 18,261Balance at end of year
The changes in plan assets for the years ended March 31, 2015 and 2014, were as follows:
¥ 2,45542(4)
133(160)(318)
47
¥ 2,2713412
206(121)
53
Millions of YenThousands of U.S. Dollars
2015 2014 2015
Balance at beginning of yearExpected return on plan assetsActuarial (gains) lossesEmployer contributionBenefits paidTransfer to defined contribution plansForeign exchange difference
$ 15,433(18,261)
$ (2,828)
$ (2,828)
A reconciliation between the liabilities recorded in the consolidated balance sheet and the balances of projected benefit
obligations and plan assets as of March 31, 2015 and 2014, was as follows:
¥ 1,855(2,195)
¥ (340)
¥ 2,772(2,455)
¥ 317
¥ (340) ¥ 317
$ (2,828)¥ (340) ¥ 317
Millions of YenThousands of U.S. Dollars
2015 2014 2015
Funded projected benefit obligationsPlan assets
Net (asset) liability for defined obligations
(Asset) liability for retirement benefits
Net (asset) liability for defined benefit obligations
58 59TAIYO HOLDINGS CO., LTD. Annual Report 2015
Financial Section
TAIYO HOLDINGS CO., LTD. Annual Report 2015

The components of net periodic benefit costs for the years ended March 31, 2015 and 2014, were as follows:
The expected long-term rate of return on plan assets is determined considering the current and expected distribution of plan
assets and the current and expected long-term rate of return derived from various components of plan assets.
¥ 56 $ 466Total
$ 1,730299
(349)27583
¥ 245 ¥ 179 $ 2,038Net periodic benefit costs
¥ 20836
(42)3310
¥ 16942
(34)(8)10
Millions of YenThousands of U.S. Dollars
2015 2014 2015
Service costInterest costExpected return on plan assetsRecognized actuarial gains (losses)Amortization of prior service cost
Amounts recognized in other comprehensive income (before income tax effect) in respect of defined benefit plans before tax for the years ended March 31, 2015 and 2014, were as follows:
$ 38383
¥ 4610
Millions of YenThousands of U.S. Dollars
2015 2014 2015
Actuarial lossesPrior service cost
¥ (59) $ (491)Total
Amounts recognized in accumulated other comprehensive income (before income tax effect) in respect of defined benefit plans before tax as of March 31, 2015 and 2014, were as follows:
$ (150)(341)
¥ (18) (41)
¥ (115)
¥ (64) (51)
Millions of YenThousands of U.S. Dollars
2015
2015 2014
2014 2015
Unrecognized actuarial lossesUnrecognized prior service cost
Plan assets as of March 31, 2015 and 2014, consisted of the following:
Total
100% 100%
100% 100%
General account
2015 2014
Assumptions used for the years ended March 31, 2015 and 2014, were set for th as follows:
0.645%
1.0
14.12
1.2%
1.0
14.12
Discount rate
Projected rate of salary increases
Expected long-term rate of return on plan assets
Defined Contribution PlansThe required contr ibut ion amount to the def ined contr ibut ion plans by the Company and i ts certa in consol idated
subsidiaries at March 31, 2015 and 2014, is ¥46 million ($383 thousand) and ¥30 million, respectively.
10. EQUITYJapanese companies are subject to the Companies Act of Japan (the "Companies Act"). The significant provisions in the
Companies Act that affect financial and accounting matters are summarized below:
a. Dividends
Under the Companies Act, companies can pay dividends at any time during the fiscal year in addition to the year-end
dividend upon resolution at the shareholders' meeting. For companies that meet certain criteria, including (1) having a
board of directors; (2) having independent auditors; (3) having a board of corporate auditors; and (4) the term of
service of the directors is prescribed as one year rather than two years of normal term by its articles of incorporation,
the board of directors may declare dividends (except for dividends in kind) at any time during the fiscal year if the
company has prescribed so in its articles of incorporation. The Company meets all the above criteria.
The Companies Act permits companies to distribute dividends in kind (noncash assets) to shareholders subject to a
certain limitation and additional requirements.
Semiannual interim dividends may also be paid once a year upon resolution by the board of directors if the articles of
incorporation of the Company so stipulate. The Companies Act provides certain limitations on the amounts available
for dividends or the purchase of treasury stock. The limitation is defined as the amount available for distribution to the
shareholders, but the amount of net assets after dividends must be maintained at no less than ¥3 million.
b. Increases/Decreases and Transfer of Common Stock, Reserve, and Surplus
The Companies Act requires that an amount equal to 10% of dividends must be appropriated as a legal reserve
(a component of retained earnings) or as additional paid-in capital (a component of capital surplus) depending on
the equity account that was charged upon the payment of such dividends until the total of aggregate amount of
legal reserve and additional paid-in capital equals 25% of the common stock.
Under the Companies Act, the total amount of addit ional paid- in capital and legal reserve may be reversed
without limitation.
The Companies Act also provides that common stock, legal reserve, addit ional paid-in capital, other capital
surplus, and retained earnings can be transferred among the accounts under certain conditions upon resolution
of the shareholders.
60 61TAIYO HOLDINGS CO., LTD. Annual Report 2015
Financial Section
TAIYO HOLDINGS CO., LTD. Annual Report 2015

$ 25 832 399 225 807 116
2,155
548 626 (133) (1,107)(171)
415 3,452455
(1,725) (14,351) (1,337)
4,559Total deferred tax assetsLess valuation allowance
¥ (1,310) ¥ (882) $ (10,899)Net deferred tax liabilities
29.71% 31.52%Actual effective tax rate
¥ 310048279714
259
¥ 8996721
96
272
Millions of YenThousands of U.S. Dollars
2015 2014 2015
Total deferred tax assets, net of valuation allowance
2015 2014
35.52%(13.31)
0.85(0.10)
3.674.89
(2.57)(0.34)
1.10
37.87%(14.75)
0.95(0.12)
2.865.53
(1.82)(0.92)
1.92
Normal effective statutory tax rateTax rates difference relating to overseas subsidiariesElimination of dividend incomeDeduction of foreign corporation tax carried forwardUndistributed earnings of associated companiesNondeductible withholding income tax of dividendsTax exemption for experiments and research expenses and otherValuation allowanceOther
A reconci l iat ion between the normal effect ive statutory tax rates and the actual effect ive tax rates ref lected in the
accompanying consolidated statement of income for the year ended March 31, 2015, with the corresponding figures
for 2014, is as follows:
The "Act on Partial Revision of the Income Tax Act" (Act No. 9 of 2015) and "Act on Partial Revision of the Local Tax Act" (Act No.
2 of 2015) were promulgated on March 31, 2015. Accordingly, the normal effective statutory tax rates used to calculate deferred
tax assets and deferred tax liabilities were changed to 32.95% for temporary differences which are expected to reverse in the
fiscal year beginning on April 1, 2015, and 32.18% for those in the fiscal year beginning on April 1, 2016.
The effects of this change are immaterial.
12. R&D COSTSR&D costs charged to income for the years ended March 31, 2015 and 2014, were ¥2,213 million ($18,411 thousand) and
¥1,594 mill ion, respectively.
13. FINANCIAL INSTRUMENTS AND RELATED DISCLOSURES
11. INCOME TAXESThe Company and its domestic subsidiaries are subject to Japanese national and local income taxes, which, in the
aggregate, resulted in normal effective statutory tax rates of approximately 36% and 38% for the years ended March 31,
2015 and 2014, respectively.
The tax effects of significant temporary differences, which resulted in deferred tax assets and liabilities as of March 31, 2015
and 2014, are as follows:
c. Treasury Stock and Treasury Stock Acquisition Rights
The Companies Act also provides for companies to purchase treasury stock and dispose of such treasury stock
by resolut ion of the board of directors. The amount of treasury stock purchased cannot exceed the amount
available for distribution to the shareholders, which is determined by a specific formula.
Under the Companies Act, stock acquisition rights are presented as a separate component of equity.
The Companies Act also provides that companies can purchase both treasury stock acquisi t ion r ights and
treasury stock. Such treasury stock acquisi t ion r ights are presented as a separate component of equi ty or
deducted directly from stock acquisition rights.
Deferred tax assets:Retirement benefitsUnrealized profitDeduction of foreign corporation tax carried forwardAllowance for doubtful accountsAccrued expensesAccrued liability for stock benefitsOther
(1,480)(24)(52)
(115)(54)
(12,313)(200)(432)(957)(449)
(1,083)(57)
(130)
(67)
Deferred tax liabilities:Undistributed earnings of associated companiesReserve for technique and developmentValuation difference on available-for-sale securitiesNet defined benefit assetsOther
Total deferred tax liabilities
The Group's pol icy is to fund operations internal ly wherever possible. With large-scale capital projects, the Group
borrows funds from banks or arranges other types of funding, depending on market conditions.
Short-term surplus funds are managed conservatively using only financial instruments that provide high security.
The Group employs der ivat ives to mit igate known future r isks, but does not use such instruments for speculat ive
purposes as a matter of policy.
(1) Summary of Financial Instruments Status
a. Group policy for financial instruments
Operating receivables, such as trade notes and trade accounts, are exposed to credit r isks relat ing to the Group's
customers. Operating receivables denominated in foreign currencies that arise in the course of conducting overseas
business are additionally exposed to exchange rate fluctuation risk.
b. Nature and extent of risks arising from financial instruments
62 63TAIYO HOLDINGS CO., LTD. Annual Report 2015
Financial Section
TAIYO HOLDINGS CO., LTD. Annual Report 2015
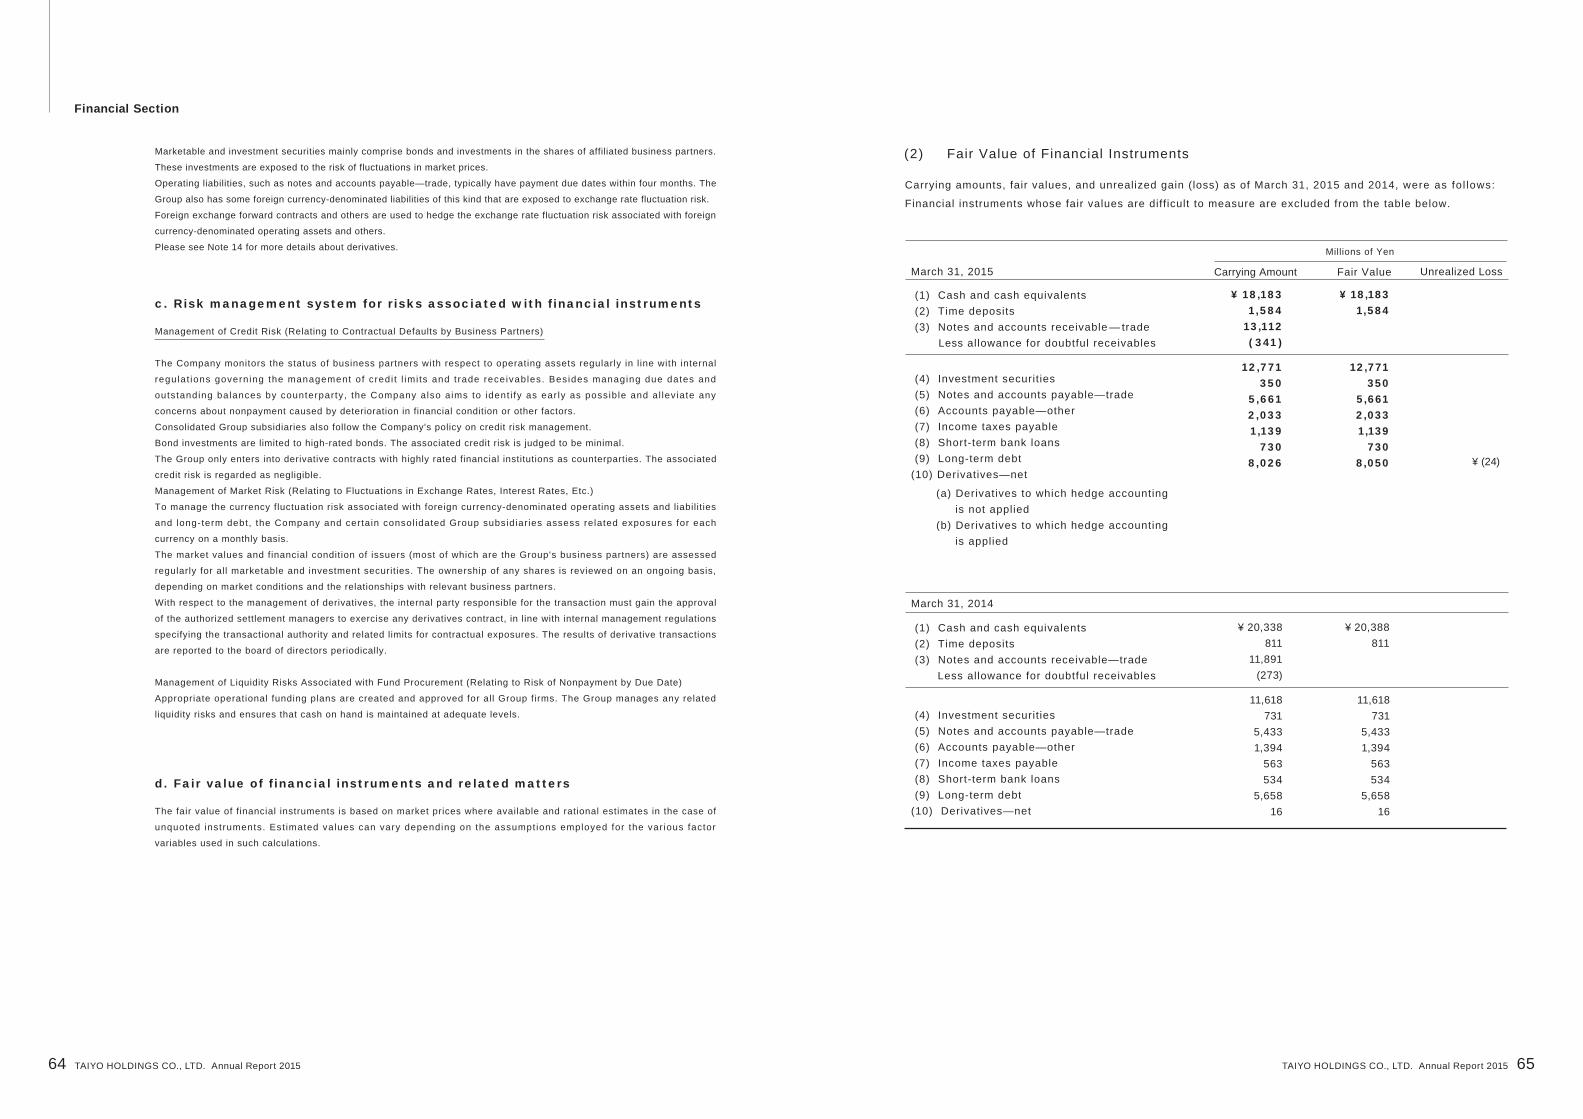
(2) Fair Value of Financial Instruments
Management of Credit Risk (Relating to Contractual Defaults by Business Partners)
The Company monitors the status of business partners with respect to operating assets regularly in l ine with internal
regulat ions governing the management of credi t l imi ts and t rade receivables. Besides managing due dates and
outstanding balances by counterparty, the Company also aims to ident i fy as ear ly as possib le and al lev iate any
concerns about nonpayment caused by deterioration in financial condition or other factors.
Consolidated Group subsidiaries also follow the Company's policy on credit risk management.
Bond investments are limited to high-rated bonds. The associated credit risk is judged to be minimal.
The Group only enters into derivative contracts with highly rated financial institutions as counterparties. The associated
credit risk is regarded as negligible.
Management of Market Risk (Relating to Fluctuations in Exchange Rates, Interest Rates, Etc.)
To manage the currency fluctuation risk associated with foreign currency-denominated operating assets and liabilities
and long-term debt, the Company and certain consol idated Group subsidiar ies assess related exposures for each
currency on a monthly basis.
The market values and financial condition of issuers (most of which are the Group's business partners) are assessed
regularly for all marketable and investment securities. The ownership of any shares is reviewed on an ongoing basis,
depending on market conditions and the relationships with relevant business partners.
With respect to the management of derivatives, the internal party responsible for the transaction must gain the approval
of the authorized settlement managers to exercise any derivatives contract, in line with internal management regulations
specifying the transactional authority and related limits for contractual exposures. The results of derivative transactions
are reported to the board of directors periodically.
Management of Liquidity Risks Associated with Fund Procurement (Relating to Risk of Nonpayment by Due Date)
Appropriate operational funding plans are created and approved for all Group firms. The Group manages any related
liquidity risks and ensures that cash on hand is maintained at adequate levels.
c. Risk management system for risks associated with financial instruments
Marketable and investment securities mainly comprise bonds and investments in the shares of affiliated business partners.
These investments are exposed to the risk of fluctuations in market prices.
Operating liabilities, such as notes and accounts payable—trade, typically have payment due dates within four months. The
Group also has some foreign currency-denominated liabilities of this kind that are exposed to exchange rate fluctuation risk.
Foreign exchange forward contracts and others are used to hedge the exchange rate fluctuation risk associated with foreign
currency-denominated operating assets and others.
Please see Note 14 for more details about derivatives.
The fair value of financial instruments is based on market prices where available and rational estimates in the case of
unquoted instruments. Est imated values can vary depending on the assumptions employed for the var ious factor
variables used in such calculations.
d. Fair value of financial instruments and related matters
Carrying amounts, fair values, and unrealized gain (loss) as of March 31, 2015 and 2014, were as fo l lows:
Financial instruments whose fair values are diff icult to measure are excluded from the table below.
¥ 18,1831,584
13,112( 341)
12,771350
5,6612,0331,139
7308,026
12,771350
5,6612,0331,139
7308,050 ¥ (24)
¥ 18,1831,584
Millions of Yen
Carrying AmountMarch 31, 2015 Fair Value Unrealized Loss
(1) Cash and cash equivalents (2) Time deposits (3) Notes and accounts receivable — trade Less allowance for doubtful receivables
(a) Derivatives to which hedge accounting is not applied(b) Derivatives to which hedge accounting is applied
(4) Investment securit ies (5) Notes and accounts payable—trade (6) Accounts payable—other (7) Income taxes payable (8) Short-term bank loans (9) Long-term debt(10) Derivatives—net
¥ 20,338811
11,891(273)
11,618731
5,4331,394
563534
5,658 16
11,618731
5,4331,394
563534
5,658 16
¥ 20,388811
March 31, 2014
(1) Cash and cash equivalents (2) Time deposits (3) Notes and accounts receivable—trade Less allowance for doubtful receivables
(4) Investment securit ies (5) Notes and accounts payable—trade (6) Accounts payable—other (7) Income taxes payable (8) Short-term bank loans (9) Long-term debt(10) Derivatives—net
64 65TAIYO HOLDINGS CO., LTD. Annual Report 2015
Financial Section
TAIYO HOLDINGS CO., LTD. Annual Report 2015

(1) Cash and cash equivalents, (2) Time deposits, and (3) Notes and accounts receivable—trade
The fair values of cash and deposit and receivables approximate carrying values due to the short maturity of these instruments.
(4) Investment securities
The fair values of investment securities are measured at the quoted market price of the stock exchange for the equity instruments and at
the quoted price obtained from the financial institution for certain debt instruments. Fair value information for investment securities by
classification is included in Note 4.
(5) Notes and accounts payable—trade, (6) Accounts payable—other, (7) Income taxes payable, and (8) Short-term bank loans
The fair values of the above approximate carrying values due to the short maturity of these instruments.
(9) Long-term debt
For long-term debt with floating interest rates, the fair values approximate carrying value due to the variable interest rate which reflects
the market rate in a short period of time and the fact that the credit status of the Company has not changed drastically since the
execution of borrowings. For long-term debt with interest rate swap contracts to which hedge accounting is applied, the fair values are
calculated by discounting the total amount of principal and interest at interest rates based on the expected rate of new debts.
(10) Derivatives
Please see Note 14.
1. Measurement of fair value of financial instruments
2. Carrying amounts of financial instruments whose fair values cannot be reliably determined
Notes:
The amount of allowance for doubtful receivables is deducted from receivables.
The value of assets and liabil i t ies arising from derivatives is shown at net value.
$ 151,27313,178
109,085(2,837)
106,2482,912
47,09616,9139,4766,073
66,772
106,2482,912
47,09616,9139,4766,073
66,972 $ (200 )
$ 151,27313,178
Thousands of U.S. Dollars
Carrying AmountMarch 31, 2015
March 31, 2015
Fair Value Unrealized Loss
(1) Cash and cash equivalents (2) Time deposits (3) Notes and accounts receivable—trade Less allowance for doubtful receivables Investment securit ies—unlisted securit ies
Investments in unconsolidated subsidiaries:
(a) Derivatives to which hedge accounting is not applied
(b) Derivatives to which hedge accounting is applied
(4) Investment securit ies (5) Notes and accounts payable—trade (6) Accounts payable—other (7) Income taxes payable (8) Short-term bank loans (9) Long-term debt(10) Derivatives—net
$ 100 ¥ 12 ¥ 18
32439 19
Millions of Yen
Millions of Yen
Thousands of U.S. Dollars
2015 2014 2015
Unlisted securitiesInvestment in partnership
3. Maturity analysis for financial assets and securities with contractual maturities
Cash and cash equivalentsTime depositsNotes and accounts receivable—tradeGovernment and corporate bonds
¥ 18,1831,584
13,112
March 31, 2014
Cash and cash equivalentsTime depositsNotes and accounts receivable—tradeGovernment and corporate bonds
¥ 20,338 811
11,891 1
Due in One Year or Less
Due after One Year through
Five Years
March 31, 2015
Cash and cash equivalentsTime depositsNotes and accounts receivable—tradeGovernment and corporate bonds
$ 151,27313,178
109,085
Due in One Year or Less
Due after One Year through
Five Years
Thousands of U.S. Dollars
Please see Note 8 for annual maturities of long-term debt.
66 67TAIYO HOLDINGS CO., LTD. Annual Report 2015
Financial Section
TAIYO HOLDINGS CO., LTD. Annual Report 2015

Unrealized Gain ( Loss)
Contract Amount Due
after One YearFair
Value
FairValue
14. DERIVATIVE FINANCIAL INSTRUMENTSDerivative transactions to which hedge accounting is not applied as of March 31, 2015 and 2014, were as follows:
15. CONTINGENT LIABILITIESThe Group's contingent liabilities as of March 31, 2015 and 2014, were as follows:
The fair value of derivative transactions is measured at the quoted price obtained from the financial institution.
Derivative transactions to which hedge accounting is applied as of March 31, 2015, were as follows:
Interest rate swaps to which exceptional treatment is applied are accounted for together with long-term debt designated
as a hedged item. Therefore, their fair values are included in the fair value of long-term debt.
There were no derivative transactions to which hedge accounting is applied as of March 31, 2014
¥ 74539
Millions of Yen
March 31, 2015
Foreign exchange forward contracts:Selling U.S. dollarBuying yen
Hedged Item
FairValue
Contract Amount
Contract Amount Due
after One Year
Long-termdebt ¥ 3,400 ¥ 3,060
Millions of Yen
March 31, 2015
Interest rate swaps—Floating rate receipt, fixed-rate payment
Contract Amount
Contract Amount
Unrealized Gain (Loss)
Contract Amount Due
after One Year
$ 6,198324
$ 8$ 8
Thousands of U.S. Dollars
March 31, 2015
Foreign exchange forward contracts:Selling U.S. dollarBuying yen
¥ 3,340397
¥ (10)(6)
¥ (10)(6)
March 31, 2014
Foreign exchange forward contracts:Selling U.S. dollarBuying yen
Hedged Item
FairValue
Contract Amount
Contract Amount Due
after One Year
Long -termdebt $ 28,286 $ 25,458
Thousands of U.S. Dollars
March 31, 2015
Interest rate swaps—Floating rate receipt, fixed-rate payment
Notes:
$ 241
¥ 3,228 $ 26,856¥ 2,890
¥ 29 ¥ 26
Millions of YenThousands of U.S. Dollars
2015 2014 2015
Total other comprehensive income
Export bill discount
Millions of YenThousands of U.S. Dollars
2015 2014 2015
16. BUSINESS COMBINATIONSPlease see Note 20 for information about business combinations.
17. OTHER COMPREHENSIVE INCOMEComponents of other comprehensive income for the years ended March 31, 2015 and 2014, were as follows:
$ (1,689)649
(1,040)
¥ 156(56)100
Valuation difference on available-for-sale securities:Gain arising during the yearIncome tax effect
¥ (203)78
(125)
27,6542,790
Foreign currency translation adjustments—Gain arising during the year 3,324
Remeasurements of defined benefit plans:Gain arising during the yearIncome tax effect
56( 27)
29
466 ( 224)
242
Thousands of SharesMillions of Yen Yen U.S. Dollars
Year Ended March 31, 2015
18. NET INCOME PER SHAREA reconcil iation of the differences between basic and diluted net EPS for the years ended March 31, 2015 and 2014,
was as follows:
Net Income EPSWeighted-
Average Shares
Basic EPS—Net income available to common shareholders ¥ 6,667 25,249 ¥ 264.05 $ 2.20
¥ 4,931 25,438 ¥ 193.83
Year Ended March 31, 2014
Basic EPS—Net income available to common shareholders
68 69TAIYO HOLDINGS CO., LTD. Annual Report 2015
Financial Section
TAIYO HOLDINGS CO., LTD. Annual Report 2015

Diluted net EPS is not disclosed as there were no dilutive securities.
The Company's shares owned by the ESOP trust are inc luded in t reasury stock. The ESOP trust owned 84,474
weighted-average shares of the Company for the year ended March 31, 2015.
Notes:
¥ 862Purchase of investments in subsidiaries resulting in change in scope of consolidation
Millions of YenThousands of U.S. Dollars
¥ 1,037 $ 8,627
Millions of Yen
Current assets
Noncurrent assets
Goodwill
Current liabilities
Noncurrent liabilities
Minority interests in consolidated subsidiaries
Valuation difference
Subtotal
Acquisition costs before consolidation
Valuation by equity method before consolidation
Loss on step acquisition
Total acquisition costs
Cash and cash equivalents held by acquired companies
19. SUPPLEMENTAL CASH FLOW INFORMATION
There was no supplemental cash flow information to be disclosed for the year ended March 31, 2015.
The Company acquired and newly consolidated OTC and six companies during the year ended March 31, 2014.
In the third quarter of the year ended March 31, 2014, one subsidiary of OTC was liquidated.
The deta i ls of assets and l iabi l i t ies of these companies at the date of consol idat ion and reconci l ia t ion between
acquisition costs of the shares and net payment for the acquisition are as follows:
20. SUBSEQUENT EVENTSThe appropriation of retained earnings as of March 31, 2015, approved at the Company's shareholders' meeting held on
June 19, 2015, is as follows:
( Business Combination through Share Exchange )
¥ 4,998
414
3,330
(1,359)
(118)
(1,943)
(24)
5,298
(2,669)
(73)
73
2,629
(1,767)
Year-end cash dividends, ¥45 ($0.37) per share
Millions of YenThousands of U.S. Dollars
¥ 491 $ 4,085Consideration for acquisition—Acquisition costs—ordinary shares of Taiyo Holdings Co., Ltd.
a. Overview of Business Combination
b. Acquisition Cost and Breakdown
(1) Name of acquired company and description of business
The Company believes that it can leverage management resources in a complementary and effective manner with the
combination of Chugai Kasei 's basic technology related to organic compounds and the Company's well established
sales network by making Chugai Kasei its wholly owned subsidiary.
This combination will enable the Company to respond faster and more flexibly to customer needs by offering options for
new business development, strengthening competitiveness, and deploying its product in new markets.
(2) Purpose of the business combination
April 30, 2015 (acquisition date for the purpose of the consolidation)
(3) Date of the business combination
Share exchange
(4) Legal form of the business combination
TAIYO HOLDINGS CO., LTD.
(5) Name of the company after the business combination
The Company was selected as the acquir ing company by comprehensively considering several factors, such as a
relatively large percentage of voting rights of its shareholders, the difference in the scale of the business and so on, as
well as the fact that the Company became a wholly owning parent company.
(7) Grounds for determination of the acquiring company
100%
(6) Acquired voting rights
Name of acquired company:
Description of business:
CHUGAI KASEI CO., LTD. ("Chugai Kasei")
Manufacturing and distribution of dyes, pigments, chemical products and inks
70 71TAIYO HOLDINGS CO., LTD. Annual Report 2015
Financial Section
TAIYO HOLDINGS CO., LTD. Annual Report 2015
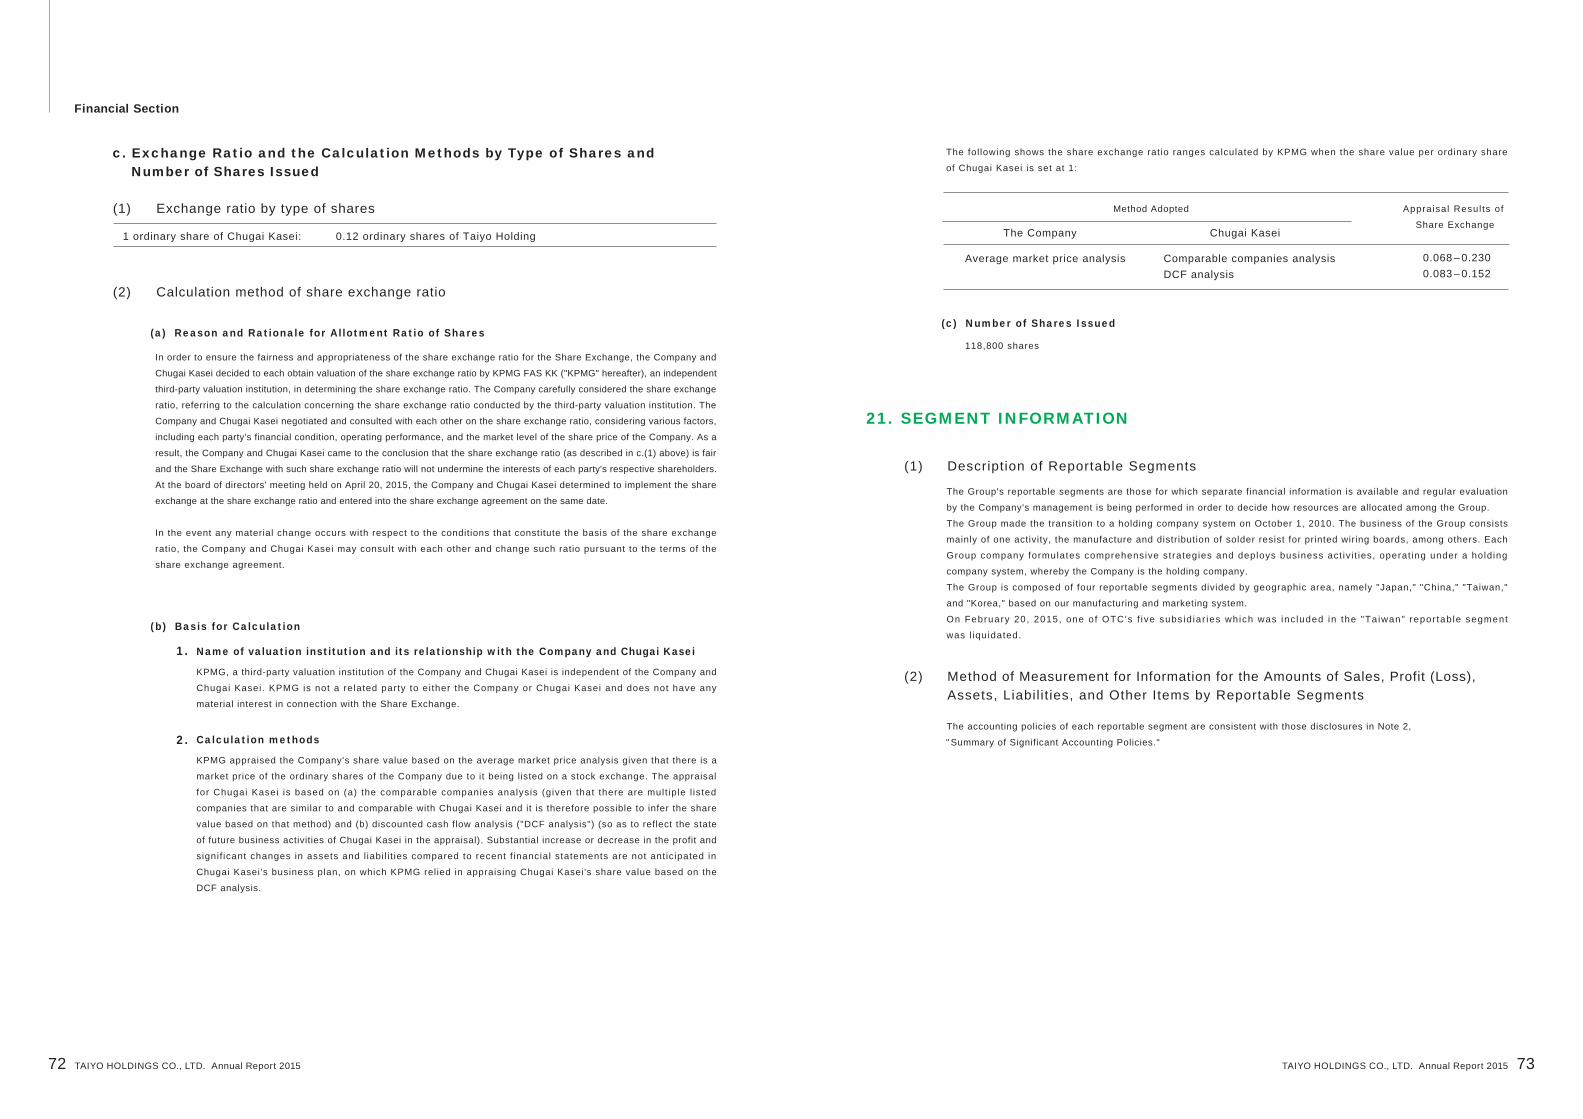
The Group's reportable segments are those for which separate financial information is available and regular evaluation
by the Company's management is being performed in order to decide how resources are allocated among the Group.
The Group made the transition to a holding company system on October 1, 2010. The business of the Group consists
mainly of one activity, the manufacture and distribution of solder resist for printed wiring boards, among others. Each
Group company formulates comprehensive strategies and deploys business act iv i t ies, operat ing under a holding
company system, whereby the Company is the holding company.
The Group is composed of four reportable segments divided by geographic area, namely "Japan," "China," "Taiwan,"
and "Korea," based on our manufacturing and marketing system.
On February 20, 2015, one o f OTC's f ive subs id iar ies which was inc luded in the "Ta iwan" repor tab le segment
was l iquidated.
(1) Description of Reportable Segments
The accounting policies of each reportable segment are consistent with those disclosures in Note 2,
" Summary of Significant Accounting Policies."
(2) Method of Measurement for Information for the Amounts of Sales, Profit (Loss), Assets, Liabil it ies, and Other Items by Reportable Segments
c. Exchange Ratio and the Calculation Methods by Type of Shares and Number of Shares Issued
In order to ensure the fairness and appropriateness of the share exchange ratio for the Share Exchange, the Company and
Chugai Kasei decided to each obtain valuation of the share exchange ratio by KPMG FAS KK ("KPMG" hereafter), an independent
third-party valuation institution, in determining the share exchange ratio. The Company carefully considered the share exchange
ratio, referring to the calculation concerning the share exchange ratio conducted by the third-party valuation institution. The
Company and Chugai Kasei negotiated and consulted with each other on the share exchange ratio, considering various factors,
including each party's financial condition, operating performance, and the market level of the share price of the Company. As a
result, the Company and Chugai Kasei came to the conclusion that the share exchange ratio (as described in c.(1) above) is fair
and the Share Exchange with such share exchange ratio will not undermine the interests of each party's respective shareholders.
At the board of directors' meeting held on April 20, 2015, the Company and Chugai Kasei determined to implement the share
exchange at the share exchange ratio and entered into the share exchange agreement on the same date.
In the event any material change occurs with respect to the conditions that constitute the basis of the share exchange
ratio, the Company and Chugai Kasei may consult with each other and change such ratio pursuant to the terms of the
share exchange agreement.
The fol lowing shows the share exchange ratio ranges calculated by KPMG when the share value per ordinary share
of Chugai Kasei is set at 1:
(2) Calculation method of share exchange ratio
(a) Reason and Rationale for Allotment Ratio of Shares118,800 shares
(c) Number of Shares Issued
(b) Basis for Calculation
(1) Exchange ratio by type of shares
1 ordinary share of Chugai Kasei: 0.12 ordinary shares of Taiyo Holding
Name of valuation institution and its relationship with the Company and Chugai Kasei
KPMG, a third-party valuation institution of the Company and Chugai Kasei is independent of the Company and
Chugai Kasei. KPMG is not a related party to either the Company or Chugai Kasei and does not have any
material interest in connection with the Share Exchange.
1.
Calculation methods
KPMG appraised the Company's share value based on the average market price analysis given that there is a
market price of the ordinary shares of the Company due to it being listed on a stock exchange. The appraisal
for Chugai Kasei is based on (a) the comparable companies analysis (given that there are mult iple l isted
companies that are similar to and comparable with Chugai Kasei and it is therefore possible to infer the share
value based on that method) and (b) discounted cash flow analysis ("DCF analysis") (so as to reflect the state
of future business activities of Chugai Kasei in the appraisal). Substantial increase or decrease in the profit and
signif icant changes in assets and l iabi l i t ies compared to recent f inancial statements are not anticipated in
Chugai Kasei's business plan, on which KPMG relied in appraising Chugai Kasei's share value based on the
DCF analysis.
2.
Method Adopted Appraisal Resul ts of
Share Exchange
Average market price analysis Comparable companies analysisDCF analysis
0.068 – 0.2300.083 – 0.152
The Company Chugai Kasei
21. SEGMENT INFORMATION
72 73TAIYO HOLDINGS CO., LTD. Annual Report 2015
Financial Section
TAIYO HOLDINGS CO., LTD. Annual Report 2015

(3) Information about Sales, Profit (Loss), Assets, Liabilities, and Other Items by Reportable Segments
22. RELATED-PARTY DISCLOSURES
Millions of Yen
Other TotalReconcili-
ations
Reconcili-ations
Reconcili-ations
Consolidated
Total sales
Sales:External customersIntersegment
¥ 9,4116,375
¥ 15,786 ¥ 20,421 ¥ 9,614 ¥ 9,200 ¥ 55,021 ¥ 4,141 ¥ 59,162 ¥ (10,902)
¥ (10,902)
¥ 48,260
¥ 18,8371,584
¥ 7,1422,472
¥ 8,836364
¥ 44,22610,795
¥ 4,034107
¥ 48,26010,902
¥ 48,260
Other items:Depreciation 399 238 207 154 998 15 1,013 399 1,412
Increase in property, plant, and equipment and intangible assets 2,034 414 99 108 2,655 17 2,672 649 3,321
Segment prof i tSegment assets
¥ 2,46712,618
¥ 3,50815,079
¥ 1,76314,683
¥ 1,2128,613
¥ 8,95050,993
¥ 5552,419
¥ 9,50553,412
¥ (250)7,830
¥ 9,25561,242
Reportable Segments
Japan China Taiwan Korea TotalYear Ended March 31, 2015
Millions of Yen
Other Total Consolidated
Total sales
Sales:External customersIntersegment
¥ 8,6985,307
¥ 14,005 ¥ 17,791 ¥ 8,399 ¥ 10,600 ¥ 50,795 ¥ 3,525 ¥ 54,320 ¥ (10,095) ¥ 44,225
¥ 16,2031,588
¥ 5,5752,824
¥ 10,312288
¥ 40,78810,007
¥ 3,43788
¥ 44,225 10,095
¥ 44,225¥ (10,095)
Other items:Depreciation 243 210 194 203 850 15 865 317 1,182
Increase in property,plant, and equipmentand intangible assets 1,267 275 171 444 2,157 10 2,167 389 2,556
Segment prof i tSegment assets
¥ 1,9067,897
¥ 2,61712,369
¥ 1,42813,000
¥ 1,0747,625
¥ 7,02540,891
¥ 453 2,053
¥ 7,47842,944
¥ 91 15,425
¥ 7,56958,369
Reportable Segments
Japan China Taiwan Korea TotalYear Ended March 31, 2014
Thousands of U.S. Dollars
Other Total Consolidated
Total sales
Sales:External customersIntersegment
$ 78,29453,037
$ 131,331 $ 169,892 $ 79,983 $ 76,539 $ 457,745 $ 34,451 $ 492,196
$ 156,71413,178
$ 59,41720,566
$ 73,5113,028
$ 367,93689,809
$ 33,562889
$ 401,49890,698
$ 401,498
$ 401,498
$ (90,698)
$ (90,698)
Other items:Depreciation 3,320 1,980 1,722 1,281 8,303 125 8,428 3,319 11,747
Increase in property,plant, and equipmentand intangible assets 16,922 3,444 824 898 22,088 142 22,230 5,399 27,629
Segment profitSegment assets
$ 20,524104,975
$ 29,185125,449
$ 14,667122,155
$ 10,08371,656
$ 74,459424,235
$ 4,61820,124
$ 79,077444,359
$ (2,080)65,142
$ 76,997509,501
Reportable Segments
Japan China Taiwan Korea TotalYear Ended March 31, 2015
(a) The "China" segment covers local subsidiaries in China and Hong Kong.
(b) The "Other" segment is not included in reportable segments and covers the business activities of local subsidiaries in the U.S. and other Asian countries.
(c) Depreciation does not include goodwill amortization.
(d) The "Taiwan" and "China " segments include sales and operating income of OTC (including OTC's four subsidiaries). As one of its subsidiaries is not engaged in any business activities, the subsidiary is not included in the segments above.
(e) Segment profit of "Reconciliations" includes unallocated segment loss of ¥65 million ($541 thousand) and unallocated segment income of ¥133 million, which is mainly composed of the income or loss concerning the holding company in 2015 and 2014, respectively.
(f) Segment assets of "Reconciliations" include unallocated segment assets of ¥17,141 million ($142,604 thousand) and ¥23,714 million, which are mainly composed of the assets concerning the holding company in 2015 and 2014, respectively.
The Company determined the per share value of the Company's stock, taking into consideration certain discount factors, based on the average closing price of the Company's ordinary shares traded on the first section of the Tokyo Stock Exchange for the three-month-period up to the business day proceeding the day on which the resolution by the board of directors of the Company was made.
There were no transactions of the Company with related parties for the fiscal year ended March 31, 2014.
Notes:
Notes:
Transactions of the Company with related parties for the fiscal year ended March 31, 2015, were as follows:
Nature of related party:Name:Location:Capital amount:Business:Voting shares of the Company:Description of transaction:Transaction amount:
Other related entity (shareholder)KOWA CO., LTD.Tokyo, Japan¥ 27 million ($225 thousand)Investments in securities and real estates17.6%Purchase of treasury stock¥ 9,195 million ($76,498 thousand)
74 75TAIYO HOLDINGS CO., LTD. Annual Report 2015
Financial Section
TAIYO HOLDINGS CO., LTD. Annual Report 2015

TAIWAN TAIYO INK CO., LTD. No.7, Datong 2nd Rd., Guanyin Industry Park, Guanyin Dist., Taoyuan City 32849, Taiwan ( R.O.C.)PHONE: 886-3-483-3230 FAX: 886-3-483-3240 http://www.taiyoink.com.tw
ONSTATIC TECHNOLOGY CO., LTD.7F., No. 1, Ren’ ai Rd., Yingge Dist., New Taipei City 239, Taiwan, R.O.C.PHON E: 886-2-26777481 FAX: 886-2-26777484 http://www.otcink.com.tw
Domestic Network
Production and Marketing Subsidiaries
TAIYO HOLDINGS CO., LTD. Head Office2-7-1 Hazawa, Nerima-ku, Tokyo 176-8508, JapanPHONE: 81-3-5999-1511 FAX: 81-3-5999-1501
CHUGAI KASEI CO., LTD.
TAIYO INK MFG. CO., LTD.
Taiwan
TAIYO INK MFG. CO., ( KOREA ) LTD.166, Manhae-ro, Danwon-gu, Ansan-City, Gyeonggi-do, KoreaPHONE: 82-31-491-9250 FAX: 82-31-491-7671 http://www.taiyoink.co.kr
Korea
China
TAIYO AMERICA, INC. 2675 Antler Drive, Carson City, NV 89701, U.S.A.PHONE: 1-775-885-9959 FAX: 1-775-885-9972 http://www.taiyo-america.com
USA
TAIYO INK INTERNATIONAL (SINGAPORE) PTE LTD. 133 New Bridge Road #09-08 Chinatown Point, Singapore 059413PHONE: 65-6372-1141 FAX: 65-6372-1151
Marketing or Technical Support SubsidiariesSingapore
TAIYO INK INTERNATIONAL (HK) LTD.Room 2305, 23/F, The Metropolis Tower, 10 Metropolis Drive, Hunghom, Kowloon, Hong KongPHONE: 852-2735-0636 FAX: 852-2375-7332
Hong Kong
TAIYO INK TRADING (SHENZHEN) CO., LTD.Rm1509, Office Tower, Shun Hing Square Di Wang Comm. Centre, 5002 Shen Nan Dong Road, Shenzhen city, Guangdong, PRCPHONE: 86-755-2583-4787 FAX: 86-755-8207-0989
China
TAIYO INK (THAILAND) CO., LTD.1199 Piyavan Tower, 14F/Room 14C Phaholyothin Rd, Samsen-Nai, Phayathai, Bangkok 10400, Thailand PHONE: 66-2-619-5670 FAX: 66-2-619-7527
Thailand
900 Hirasawa, Ranzan-machi, Hiki-gun, Saitama 355-0215, JapanPHONE: 81-493-61-2711 FAX: 81-493-61-2701
TAIYO GREEN ENERGY CO., LTD.388 Ohkura, Ranzan-machi, Hiki-gun, Saitama 355-0222, JapanPHONE: 81-493-62-9001 FAX: 81-493-62-2330
Global NetworkCompany
TAIWAN TAIYO INK CO., LTD.
TAIYO INK MFG. CO., (KOREA) LTD.
TAIYO INK (SUZHOU) CO., LTD.
TAIYO AMERICA, INC.
ONSTATIC TECHNOLOGY CO., LTD.
ONSTATIC INK (SHENZHEN) CO., LTD.
TAIYO INK INTERNATIONAL(SINGAPORE) PTE LTD
TAIYO INK INTERNATIONAL(HK) LIMITED
TAIYO INK TRADING (SHENZHEN) CO., LTD
TAIYO INK (THAILAND) CO., LTD.
Business Description
Manufacture and marketing of PWB materials
Manufacture and marketing of PWB and FPD materials
Manufacture and marketing of PWB materials
Manufacture and marketing of PWB materials
Manufacture and marketing of PWB materials
Manufacture and marketing of PWB materials
Marketing of PWB materials
Marketing of PWB materials
Marketing of PWB materials
Technical support for PWB materials
TAIYO HOLDINGS CO., LTD. Ranzan Facility388 Ohkura, Ranzan-machi, Hiki-gun, Saitama 355-0222, JapanPHONE: 81-493-62-7777 FAX: 81-493-62-2330
TAIYO INK (SUZHOU) CO., LTD. No. 26 Taishan Road, Suzhou New District , Suzhou City, Jiangsu, P.R. ChinaPHONE: 86-512-6665-5550 FAX: 86-512-6665-5011 http://www.taiyoink.com.cn
ONSTATIC INK (SHENZHEN) CO., LTD.Building No. 38, Western Industrial Zone, Sha-Yi Village, Sha-Jing Town, Shenzhen, Guangdong, China PHONE: 86-755-8173-7288 FAX: 86-755-8173-7282
*1 ONSTATIC INK (SHENZHEN) CO.,LTD. is a wholly-owned subsidiary of ONSTATIC TECHNOLOGY CO., LTD.
Voting Shares Held
99.8%
90.4%
100.0%
100.0%
69.2%
*1
100.0%
100.0%
100.0%
100.0%
35-3 Akaizawa, Nihonmatsu-shi, Fukushima 964-0982, JapanPHONE: 81-243-22-6050 FAX: 81-243-22-6070
Independent Auditor’s Report
76 77
Domestic and Global Network
TAIYO HOLDINGS CO., LTD. Annual Report 2015TAIYO HOLDINGS CO., LTD. Annual Report 2015
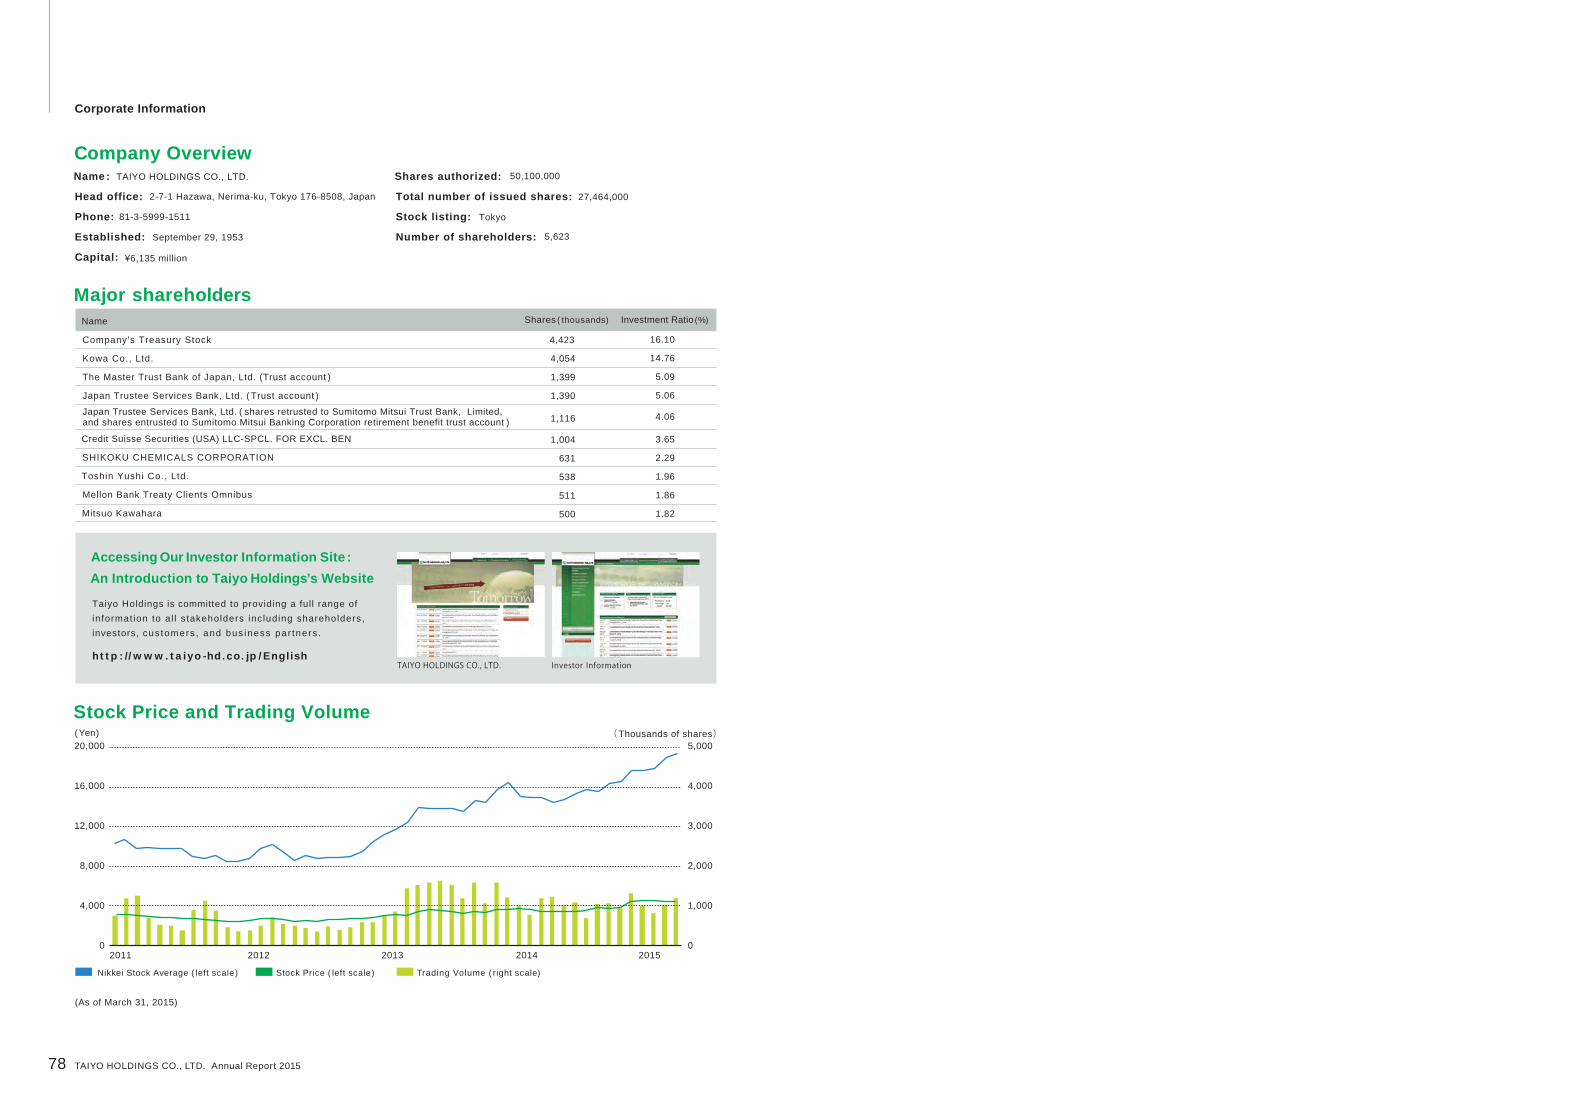
Nikkei Stock Average ( left scale) Stock Price ( left scale) Trading Volume ( right scale)
Major shareholders
Stock Price and Trading Volume
Name
Company's Treasury Stock
Kowa Co., Ltd.
The Master Trust Bank of Japan, Ltd. (Trust account )
Japan Trustee Services Bank, Ltd. ( Trust account )
Japan Trustee Services Bank, Ltd. ( shares retrusted to Sumitomo Mitsui Trust Bank, Limited, and shares entrusted to Sumitomo Mitsui Banking Corporation retirement benefit trust account )
Credit Suisse Securities (USA) LLC-SPCL. FOR EXCL. BEN
SHIKOKU CHEMICALS CORPORATION
Toshin Yushi Co., Ltd.
Mellon Bank Treaty Clients Omnibus
Mitsuo Kawahara
20,000
16,000
12,000
8,000
4,000
02011 2012 2013 2014 2015
5,000
4,000
3,000
2,000
1,000
0
(Yen) (Thousands of shares)
Shares ( thousands)
4,423
4,054
1,399
1,390
1,116
1,004
631
538
511
500
Investment Ratio (%)
16.10
14.76
5.09
5.06
4.06
3.65
2.29
1.96
1.86
1.82
Company Overview
Accessing Our Investor Information Site : An Introduction to Taiyo Holdings’s Website
Name :
Head office:
Phone:
Established:
Capital:
TAIYO HOLDINGS CO., LTD.
2-7-1 Hazawa, Nerima-ku, Tokyo 176-8508, Japan
81-3-5999-1511
September 29, 1953
¥6,135 million
Shares authorized:
Total number of issued shares:
Stock listing:
Number of shareholders:
50,100,000
Tokyo
27,464,000
5,623
Taiyo Holdings is committed to providing a full range of informat ion to al l stakeholders including shareholders,investors, cus tomers , and bus iness par tners .
http : // www.taiyo-hd.co. jp / EnglishTAIYO HOLDINGS CO., LTD. Investor Information
(As of March 31, 2015)
Corporate Information
78 TAIYO HOLDINGS CO., LTD. Annual Report 2015