takara bio inc. and consolidated subsidiaries...foreign currency translation adjustments (1,088) 21...
TRANSCRIPT

Takara Bio Inc. and Consolidated Subsidiaries
Consolidated Financial Statements for the Year Ended March 31, 2019, and Independent Auditor's Report


- 2 -
Takara Bio Inc. and Consolidated Subsidiaries
Consolidated Balance Sheet March 31, 2019
Millions of Yen
Thousands of U.S. Dollars
(Note 1)
ASSETS 2019 2018 2019 CURRENT ASSETS:
Cash and cash equivalents (Note 13) ¥ 9,464 ¥ 10,051 $ 85,261 Marketable securities (Notes 4 and 13) 2,000 2,000 18,018 Time deposits (Note 13) 7,569 7,485 68,189 Notes and accounts receivable:
Trade (Note 13) 8,604 8,031 77,513 Other 195 221 1,756 Allowance for doubtful accounts (Note 13) (41 ) (42 ) (369 )
Inventories (Note 5) 6,736 6,011 60,684 Prepaid expenses and other current assets 745 756 6,711
Total current assets 35,275 34,516 317,792
PROPERTY, PLANT AND EQUIPMENT (Note 6):
Land 6,213 6,588 55,972 Buildings and structures 11,775 12,825 106,081 Machinery, equipment and vehicles 5,510 7,561 49,639 Tools, furniture and fixtures 6,890 7,080 62,072 Lease assets (Note 12) 15 16 135 Construction in progress 4,784 63 43,099
Total property, plant and equipment 35,190 34,135 317,027 Accumulated depreciation (13,785 ) (15,601 ) (124,189 )
Net property, plant and equipment 21,404 18,534 192,828
INVESTMENTS AND OTHER ASSETS:
Investment securities (Notes 4 and 13) 2 2 18 Goodwill 7,598 8,259 68,450 Technology assets 3,858 4,670 34,756 Trademarks 605 618 5,450 Long-term prepaid expenses 684 800 6,162 Asset for retirement benefits (Note 7) 91 95 819 Deferred tax assets (Note 11) 839 472 7,558 Other assets 679 700 6,117
Total investments and other assets 14,360 15,619 129,369
TOTAL ¥ 71,040 ¥ 68,670 $ 640,000
See notes to consolidated financial statements.
Millions of Yen
Thousands of U.S. Dollars
(Note 1)
LIABILITIES AND EQUITY 2019 2018 2019 CURRENT LIABILITIES:
Notes and accounts payable (Note 13): Trade ¥ 1,536 ¥ 1,875 $ 13,837 Construction and other 2,039 1,900 18,369
Accrued income taxes (Notes 11 and 13) 391 431 3,522 Accrued expenses 1,351 1,031 12,171 Other current liabilities (Note 14) 698 506 6,288
Total current liabilities 6,017 5,745 54,207
LONG-TERM LIABILITIES:
Liability for retirement benefits (Note 7) 667 659 6,009 Other long-term liabilities 260 307 2,342
Total long-term liabilities 927 966 8,351
COMMITMENTS (Notes 12 and 14) EQUITY (Note 8):
Common stock, authorized, 400,000,000 shares; issued, 120,415,600 shares in 2019 and 2018 14,965 14,965 134,819
Capital surplus 32,893 32,893 296,333 Retained earnings 15,401 12,285 138,747 Accumulated other comprehensive income:
Foreign currency translation adjustments 964 2,042 8,684 Defined retirement benefit plans (Note 7) (215 ) (334 ) (1,936 )
Total 64,009 61,852 576,657 Noncontrolling interests 85 106 765
Total equity 64,095 61,959 577,432
TOTAL ¥ 71,040 ¥ 68,670 $ 640,000

- 3 -
Takara Bio Inc. and Consolidated Subsidiaries
Consolidated Statement of Income Year Ended March 31, 2019
Millions of Yen
Thousands of U.S. Dollars
(Note 1)
2019 2018 2019 NET SALES ¥ 35,841 ¥ 32,312 $ 322,891 COST OF SALES (Notes 7 and 12) 15,155 13,657 136,531
Gross profit 20,685 18,655 186,351
SELLING, GENERAL AND ADMINISTRATIVE EXPENSES (Notes 7, 10, and 12) 15,221 15,099 137,126
Operating income 5,463 3,555 49,216
OTHER INCOME (EXPENSES):
Interest income 89 77 801 Subsidy income 94 197 846 Foreign exchange (loss) gain (29 ) 5 (261 ) Interest expense (19 ) Loss on sales and disposals of property, plant and
equipment (98 ) (54 ) (882 ) Impairment loss (Note 6) (696 ) (446 ) (6,270 ) Gain on sale of businesses (Note 3) 90 810 Casualty insurance income 54 486 Loss on disaster (131 ) (1,180 ) Compensation payment (60 ) (540 ) Other, net 45 44 405
Other expenses, net (640 ) (194 ) (5,765 )
INCOME BEFORE INCOME TAXES 4,823 3,361 43,450 INCOME TAXES (Note 11):
Current 1,453 1,155 13,090 Deferred (303 ) (132 ) (2,729 )
Total income taxes 1,149 1,023 10,351
NET INCOME 3,673 2,338 33,090 NET INCOME ATTRIBUTABLE TO NONCONTROLLING
INTERESTS 15 3 135
NET INCOME ATTRIBUTABLE TO OWNERS
OF THE PARENT ¥ 3,657 ¥ 2,335 $ 32,945
Yen U.S. Dollars
(Note 1)
PER SHARE OF COMMON STOCK (Notes 2.s and 16):
Basic net income ¥30.38 ¥19.39 $0.27 Cash dividends applicable to the year 7.00 4.50 0.06
See notes to consolidated financial statements.

- 4 -
Takara Bio Inc. and Consolidated Subsidiaries
Consolidated Statement of Comprehensive Income
Year Ended March 31, 2019
Millions of Yen
Thousands of U.S. Dollars
(Note 1)
2019 2018 2019 NET INCOME ¥ 3,673 ¥ 2,338 $ 33,090 OTHER COMPREHENSIVE INCOME (LOSS) (Note 15):
Foreign currency translation adjustments (1,088 ) 21 (9,801 ) Defined retirement benefit plans 119 95 1,072
Total other comprehensive income (loss) (968 ) 117 (8,720 )
COMPREHENSIVE INCOME ¥ 2,705 ¥ 2,455 $ 24,369
TOTAL COMPREHENSIVE INCOME ATTRIBUTABLE TO:
Owners of the parent ¥2,699 ¥2,449 $24,315 Noncontrolling interests 5 5 45
See notes to consolidated financial statements.

- 5 -
Takara Bio Inc. and Consolidated Subsidiaries
Consolidated Statement of Changes in Equity Year Ended March 31, 2019
Thousands Millions of Yen
Accumulated Other Comprehensive
Income
Number of Shares of
Common Stock Outstanding
Common Stock
Capital Surplus
Retained Earnings
Foreign Currency Translation
Adjustments
Defined Retirement
Benefit Plans Total Noncontrolling
Interests Total Equity
BALANCE, APRIL 1, 2017 120,415 ¥ 14,965 ¥ 32,893 ¥ 10,432 ¥ 2,023 ¥ (429 ) ¥ 59,884 ¥ 100 ¥ 59,985
Net income attributable to owners of the parent 2,335 2,335 2,335 Cash dividends, ¥4.0 per share (481 ) (481 ) (481 ) Capital decrease of consolidated subsidiaries (0 ) (0 ) 0 Net change in the year 19 95 114 5 120
BALANCE, MARCH 31, 2018 120,415 14,965 32,893 12,285 2,042 (334 ) 61,852 106 61,959
Net income attributable to owners of the parent 3,657 3,657 3,657 Cash dividends, ¥4.5 per share (541 ) (541 ) (541 ) Net change in the year (1,078 ) 119 (958 ) (21 ) (979 )
BALANCE, MARCH 31, 2019 120,415 ¥ 14,965 ¥ 32,893 ¥ 15,401 ¥ 964 ¥ (215 ) ¥ 64,009 ¥ 85 ¥ 64,095
Thousands of U.S. Dollars (Note 1)
Accumulated Other Comprehensive
Income
Common
Stock Capital Surplus
Retained Earnings
Foreign Currency Translation
Adjustments
Defined Retirement
Benefit Plans Total Noncontrolling
Interests Total Equity
BALANCE, MARCH 31, 2018 $ 134,819 $ 296,333 $ 110,675 $ 18,396 $ (3,009 ) $ 557,225 $ 954 $ 558,189
Net income attributable to owners of the parent 32,945 32,945 32,945 Cash dividends, $0.04 per share (4,873 ) (4,873 ) (4,873 ) Net change in the year (9,711 ) 1,072 (8,630 ) (189 ) (8,819 )
BALANCE, MARCH 31, 2019 $ 134,819 $ 296,333 $ 138,747 $ 8,684 $ (1,936 ) $ 576,657 $ 765 $ 577,432
See notes to consolidated financial statements.
- 6 -
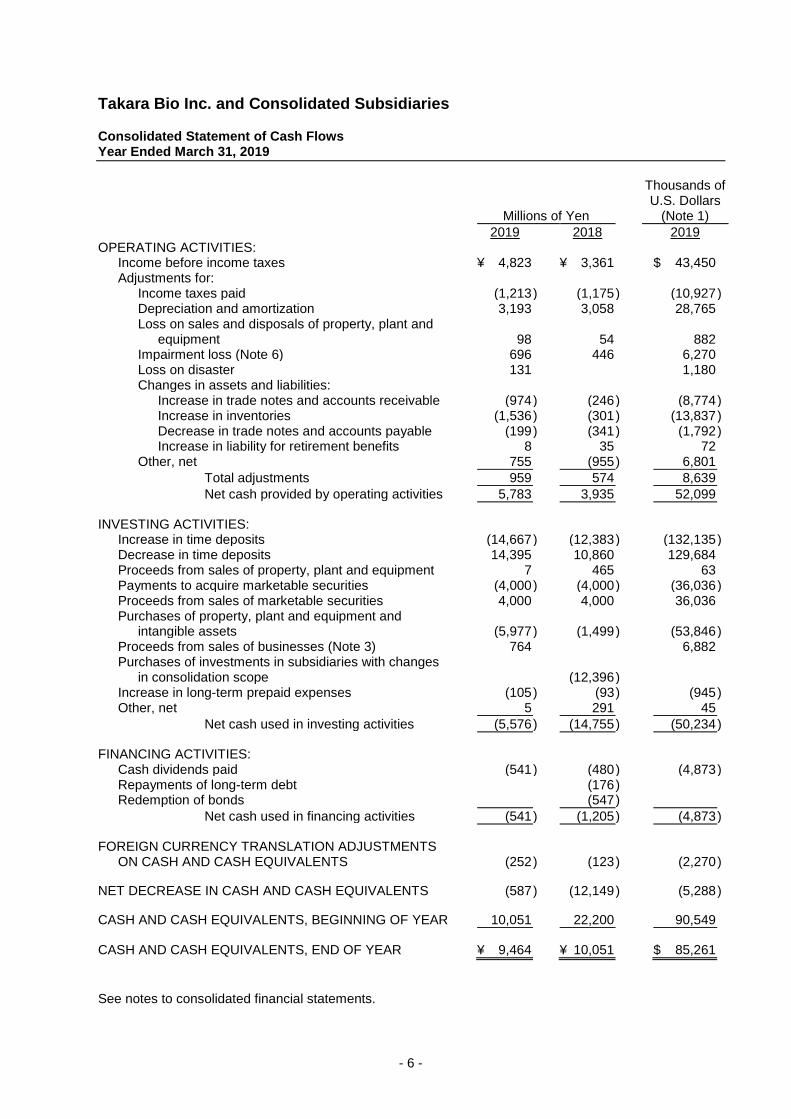
Takara Bio Inc. and Consolidated Subsidiaries
Consolidated Statement of Cash Flows Year Ended March 31, 2019
Millions of Yen
Thousands of U.S. Dollars
(Note 1)
2019 2018 2019 OPERATING ACTIVITIES:
Income before income taxes ¥ 4,823 ¥ 3,361 $ 43,450 Adjustments for:
Income taxes paid (1,213 ) (1,175 ) (10,927 ) Depreciation and amortization 3,193 3,058 28,765 Loss on sales and disposals of property, plant and
equipment 98 54 882 Impairment loss (Note 6) 696 446 6,270 Loss on disaster 131 1,180 Changes in assets and liabilities:
Increase in trade notes and accounts receivable (974 ) (246 ) (8,774 ) Increase in inventories (1,536 ) (301 ) (13,837 ) Decrease in trade notes and accounts payable (199 ) (341 ) (1,792 ) Increase in liability for retirement benefits 8 35 72
Other, net 755 (955 ) 6,801
Total adjustments 959 574 8,639
Net cash provided by operating activities 5,783 3,935 52,099
INVESTING ACTIVITIES: Increase in time deposits (14,667 ) (12,383 ) (132,135 ) Decrease in time deposits 14,395 10,860 129,684 Proceeds from sales of property, plant and equipment 7 465 63 Payments to acquire marketable securities (4,000 ) (4,000 ) (36,036 ) Proceeds from sales of marketable securities 4,000 4,000 36,036 Purchases of property, plant and equipment and
intangible assets (5,977 ) (1,499 ) (53,846 ) Proceeds from sales of businesses (Note 3) 764 6,882 Purchases of investments in subsidiaries with changes
in consolidation scope (12,396 ) Increase in long-term prepaid expenses (105 ) (93 ) (945 ) Other, net 5 291 45
Net cash used in investing activities (5,576 ) (14,755 ) (50,234 )
FINANCING ACTIVITIES: Cash dividends paid (541 ) (480 ) (4,873 ) Repayments of long-term debt (176 ) Redemption of bonds (547 )
Net cash used in financing activities (541 ) (1,205 ) (4,873 )
FOREIGN CURRENCY TRANSLATION ADJUSTMENTS ON CASH AND CASH EQUIVALENTS (252 ) (123 ) (2,270 )
NET DECREASE IN CASH AND CASH EQUIVALENTS (587 ) (12,149 ) (5,288 )
CASH AND CASH EQUIVALENTS, BEGINNING OF YEAR 10,051 22,200 90,549
CASH AND CASH EQUIVALENTS, END OF YEAR ¥ 9,464 ¥ 10,051 $ 85,261
See notes to consolidated financial statements.

- 7 -
Takara Bio Inc. and Consolidated Subsidiaries
Notes to Consolidated Financial Statements Year Ended March 31, 2019
1. BASIS OF PRESENTATION OF THE CONSOLIDATED FINANCIAL STATEMENTS
The accompanying consolidated financial statements have been prepared in accordance with the provisions set forth in the Japanese Financial Instruments and Exchange Act and its related accounting regulations and in accordance with accounting principles generally accepted in Japan ("Japanese GAAP"), which are different in certain respects as to the application and disclosure requirements of International Financial Reporting Standards.
In preparing these consolidated financial statements, certain reclassifications and rearrangements have been made to the consolidated financial statements issued domestically in order to present them in a form which is more familiar to readers outside Japan. In addition, certain reclassifications have been made in the 2018 consolidated financial statements to conform to the classifications used in 2019.
The consolidated financial statements are stated in Japanese yen, the currency of the country in which Takara Bio Inc. (the "Company") is incorporated and operates. Japanese yen figures of less than a million yen are rounded down to the nearest million yen, except for per share data. The translations of Japanese yen amounts into U.S. dollar amounts are included solely for the convenience of readers outside Japan and have been made at the rate of ¥111 to $1, the approximate rate of exchange at March 31, 2019. U.S. dollar figures of less than a thousand dollars are rounded down to the nearest thousand dollars, except for per share data. Such translations should not be construed as representations that the Japanese yen amounts could be converted into U.S. dollars at that or any other rate.
2. SUMMARY OF SIGNIFICANT ACCOUNTING POLICIES
a. Consolidation – The consolidated financial statements as of March 31, 2019, include the accounts of the Company and its 8 (11 in 2018) subsidiaries (together, the "Group").
Under the control and influence concepts, those companies in which the Company, directly or indirectly, is able to exercise control over operations are fully consolidated.
The investment in the remaining unconsolidated subsidiary is stated at cost. If the equity method of accounting had been applied to the investment in the company, the effect on the accompanying consolidated financial statements would not be material.
All significant intercompany balances and transactions have been eliminated in consolidation. All material unrealized profit included in assets resulting from transactions within the Group is also eliminated.
b. Unification of Accounting Policies Applied to Foreign Subsidiaries for the Consolidated Financial Statements – Under Accounting Standards Board of Japan ("ASBJ") Practical Issues Task Force ("PITF") No. 18, "Practical Solution on Unification of Accounting Policies Applied to Foreign Subsidiaries for the Consolidated Financial Statements," the accounting policies and procedures applied to a parent company and its subsidiaries for similar transactions and events under similar circumstances should in principle be unified for the preparation of the consolidated financial statements. However, financial statements prepared by foreign subsidiaries in accordance with either International Financial Reporting Standards or generally accepted accounting principles in the United States of America (Financial Accounting Standards Board Accounting Standards Codification—"FASB ASC") tentatively may be used for the consolidation process, except for the following items that should be adjusted in the consolidation process so that net income is accounted for in accordance with Japanese GAAP, unless they are not material: (a) amortization of goodwill; (b) scheduled amortization of actuarial gain or loss of pensions that has been recorded in equity through other comprehensive income; (c) expensing capitalized development costs of R&D; and (d) cancellation of the fair value model of accounting for property, plant and equipment and investment properties and incorporation of the cost model of accounting.

- 8 -
c. Business Combinations – Business combinations are accounted for using the purchase method. Acquisition-related costs, such as advisory fees or professional fees, are accounted for as expenses in the periods in which the costs are incurred. If the initial accounting for a business combination is incomplete by the end of the reporting period in which the business combination occurs, an acquirer shall report in its financial statements provisional amounts for the items for which the accounting is incomplete. During the measurement period, which shall not exceed one year from the acquisition, the acquirer shall retrospectively adjust the provisional amounts recognized at the acquisition date to reflect new information obtained about facts and circumstances that existed as of the acquisition date and that would have affected the measurement of the amounts recognized as of that date. Such adjustments shall be recognized as if the accounting for the business combination had been completed at the acquisition date. A parent's ownership interest in a subsidiary might change if the parent purchases or sells ownership interests in its subsidiary. The carrying amount of noncontrolling interest is adjusted to reflect the change in the parent's ownership interest in its subsidiary while the parent retains its controlling interest in its subsidiary. Any difference between the fair value of the consideration received or paid and the amount by which the noncontrolling interest is adjusted is accounted for as capital surplus as long as the parent retains control over its subsidiary.
d. Cash Equivalents – Cash equivalents are short-term investments that are readily convertible into cash and exposed to insignificant risk of changes in value. Cash equivalents include time deposits, all of which mature or become due within three months of the date of acquisition.
e. Marketable and Investment Securities – The Group's marketable and investment securities consist of held-to-maturity debt securities and available-for-sale securities. Marketable and investment securities are classified and accounted for, depending on management's intent, as follows: (1) held-to-maturity debt securities are reported at amortized cost; and (2) marketable available-for-sale securities are reported at fair value, with unrealized gains and losses, net of applicable taxes, reported in a separate component of equity. The cost of securities sold is determined by the moving-average method. Nonmarketable available-for-sale securities are stated at cost, determined by the moving-average method.
For other-than-temporary declines in fair value, marketable and investment securities are reduced to net realizable value by a charge to income.
f. Inventories – Inventories are stated principally at the lower of cost, determined by the weighted-average method, or net selling value (see Note 5).
g. Property, Plant and Equipment – Property, plant and equipment are stated at cost. Depreciation of property, plant and equipment of the Company and its subsidiaries is computed principally by the straight-line method. The range of useful lives is principally from 6 to 60 years for buildings and structures, from 4 to 10 years for machinery, equipment and vehicles, and from 2 to 20 years for tools, furniture and fixtures.
h. Goodwill – The excess of the cost of an acquisition over the fair value of the net assets of an acquired subsidiary at the date of acquisition is recorded as goodwill and amortized on a straight-line basis over a certain period, not exceeding 20 years.
Takara Bio USA, Inc., the Company's consolidated subsidiary, records goodwill according to FASB ASC 350, "Intangibles – Goodwill and Other." Under ASC 350, goodwill is tested locally for impairment at least annually. Additionally the goodwill is amortized on a straight-line basis over a period of 20 years in the Group's consolidated financial statements in accordance with ASBJ PITF No. 18, which was subsequently revised in February 2010 and March 2015 to reflect revisions of the relevant Japanese GAAP or accounting standards in other jurisdictions issued by ASBJ as described in Note 2.b.

- 9 -
i. Long-Lived Assets – The Group reviews its long-lived assets for impairment whenever events or changes in circumstance indicate the carrying amount of an asset or asset group may not be recoverable. An impairment loss is recognized if the carrying amount of an asset or asset group exceeds the sum of the undiscounted future cash flows expected to result from the continued use and eventual disposition of the asset or asset group. The impairment loss would be measured as the amount by which the carrying amount of the asset exceeds its recoverable amount, which is the higher of the discounted cash flows from the continued use and eventual disposition of the asset or the net selling price at disposition.
j. Retirement and Pension Plans – The employees' retirement benefits programs of the Company and certain subsidiaries consist of an unfunded lump-sum severance payment plan, a defined benefit pension plan and a defined contribution pension plan as described in Note 7.
The Group accounted for the liability for retirement benefits based on the projected benefit obligations and plan assets at the consolidated balance sheet date. The projected benefit obligations are attributed to periods on a benefit formula basis. Actuarial gains and losses and past service costs that are yet to be recognized in profit or loss are recognized within accumulated other comprehensive income after adjusting for tax effects, and are recognized in profit or loss over 10 years, no longer than the expected average remaining service period of the employees.
k. Allowance for Doubtful Accounts – Allowance for doubtful accounts is stated in amounts considered to be appropriate based on the Group's past credit loss experience and an evaluation of potential losses in the receivables outstanding.
l. Asset Retirement Obligations – An asset retirement obligation is recorded for a legal obligation imposed either by law or contract that results from the acquisition, construction, development, and normal operation of a tangible fixed asset and is associated with the retirement of such tangible fixed asset. The asset retirement obligation is recognized as the sum of the discounted cash flows required for the future asset retirement and is recorded in the period in which the obligation is incurred if a reasonable estimate can be made. If a reasonable estimate of the asset retirement obligation cannot be made in the period the asset retirement obligation is incurred, the liability should be recognized when a reasonable estimate of the asset retirement obligation can be made. Upon initial recognition of a liability for an asset retirement obligation, an asset retirement cost is capitalized by increasing the carrying amount of the related fixed asset by the amount of the liability. The asset retirement cost is subsequently allocated to expense through depreciation over the remaining useful life of the asset. Over time, the liability is accreted to its present value each period. Any subsequent revisions to the timing or the amount of the original estimate of undiscounted cash flows are reflected as an adjustment to the carrying amount of the liability and the capitalized amount of the related asset retirement cost.
m. Research and Development Costs – Research and development costs are charged to income as incurred.
n. Leases – Finance lease transactions are capitalized by recognizing lease assets and lease obligations in the balance sheet.
o. Income Taxes – The provision for income taxes is computed based on the pretax income included in the consolidated statement of income. The asset and liability approach is used to recognize deferred tax assets and liabilities for the expected future tax consequences of temporary differences between the carrying amounts and the tax bases of assets and liabilities. Deferred taxes are measured by applying currently enacted income tax rates to the temporary differences.

- 10 -
On February 16, 2018, the ASBJ issued ASBJ Statement No. 28, "Partial Amendments to Accounting Standard for Tax Effect Accounting," which requires deferred tax assets and deferred tax liabilities to be classified as investments and other assets and long-term liabilities, respectively. Deferred tax assets were previously classified as current assets and investments and other assets, and deferred tax liabilities were previously classified as current liabilities and long-term liabilities under the previous accounting standard. The revised accounting standard is effective for annual periods beginning on or after April 1, 2018. As a result, deferred tax assets in current assets on the consolidated balance sheet in the fiscal year ended March 31, 2018, have decreased by ¥515 million and deferred tax assets in investments and other assets have increased by ¥332 million. Additionally, deferred tax liabilities in noncurrent liabilities, have decreased by ¥183 million. Total assets have decreased by ¥183 million as compared with before the change as the deferred tax assets and deferred tax liabilities of the same taxable entity are offset against each other.
p. Foreign Currency Transactions – All short-term and long-term monetary receivables and payables denominated in foreign currencies are translated into Japanese yen at the exchange rates at the consolidated balance sheet date. The foreign exchange gains and losses from translation are recognized in the consolidated statement of income to the extent that they are not hedged by forward exchange contracts.
q. Foreign Currency Financial Statements – The balance sheet accounts of the consolidated foreign subsidiaries are translated into Japanese yen at the current exchange rate as of the balance sheet date except for equity, which is translated at the historical rate. Differences arising from such translation are shown as "Foreign currency translation adjustments" under accumulated other comprehensive income in a separate component of equity. Revenue and expense accounts of consolidated foreign subsidiaries are translated into Japanese yen at the average exchange rate.
r. Derivative and Hedging Activities – The Group uses derivative financial instruments to manage its exposures to fluctuations in foreign currency exchange rates. Foreign currency forward contracts and non-deliverable forwards are utilized by the Group to reduce foreign currency exchange rate risks. The Group does not enter into derivatives for trading or speculative purposes.
Derivative financial instruments are classified and accounted for as follows: (1) all derivatives are recognized as either assets or liabilities and measured at fair value, and gains or losses on derivative transactions are recognized in the consolidated statement of income; and (2) for derivatives used for hedging purposes, if such derivatives qualify for hedge accounting because of high correlation and effectiveness between the hedging instruments and the hedged items, gains or losses on derivatives are deferred until maturity of the hedged transactions.
Foreign currency forward contracts are utilized to hedge foreign currency exposures in collection of certain receivables and payments of certain purchases and royalties. Payables denominated in foreign currencies are translated at the contracted rates if the forward contracts qualify for hedge accounting.
s. Per Share Information – Basic net income per share is computed by dividing net income attributable to common shareholders by the weighted-average number of common shares outstanding for the period.
Cash dividends per share presented in the accompanying consolidated statement of income are dividends applicable to the respective fiscal years, including dividends to be paid after the end of the year.

- 11 -
t. New Accounting Pronouncements
(1) The Company On March 30, 2018, the ASBJ issued ASBJ Statement No. 29, "Accounting Standard for Revenue Recognition," and ASBJ Guidance No. 30, "Implementation Guidance on Accounting Standard for Revenue Recognition." The core principle of the standard and guidance is that an entity should recognize revenue to depict the transfer of promised goods or services to customers in an amount that reflects the consideration to which the entity expects to be entitled in exchange for those goods or services. An entity should recognize revenue in accordance with that core principle by applying the following steps:
Step 1: Identify the contract(s) with a customer Step 2: Identify the performance obligations in the contract Step 3: Determine the transaction price Step 4: Allocate the transaction price to the performance obligations in the contract Step 5: Recognize revenue when (or as) the entity satisfies a performance obligation
The accounting standard and guidance are effective for annual periods beginning on or after April 1, 2021.
The Company expects to apply the accounting standard and guidance for annual periods beginning on or after April 1, 2021, and is in the process of measuring the effects of applying the accounting standard and guidance in future applicable periods.
(2) Foreign subsidiaries The IASB issued IFRS, 16 Leases, concurrently with the introduction of ASU 2016-02 into the FASB's Accounting Standards Codification. These accounting standards require lessees to recognize a right-of-use asset and a lease liability in the statement of financial position. Foreign consolidated subsidiaries will apply IFRS 16 for annual periods beginning on or after April 1, 2019, and ASU 2016-02 for annual periods beginning on or after April 1, 2020. The Company is in the process of measuring the effects of applying the accounting standard and guidance in future applicable periods.
3. BUSINESS COMBINATIONS
(Business Divestiture of Functional Food Business)
The Group's functional food business has been succeeded to Shionogi Healthcare Co., Ltd. pursuant to the company split with the effective date of January 1, 2019.
a. Outline of the business divestiture
(1) Name of the purchasing company and outline of the divested business
Name of the purchasing company: Shionogi Healthcare Co., Ltd. (Shionogi Healthcare) Outline of the divested business: Functional food business
(2) Major reason for the business divestiture
"Takara Bio Medium-Term Management Plan 2020" started in 2017 and aims to promote three businesses: Bioindustry, Gene Therapy, and AgriBio businesses, to enhance the Group's standing as a global industrial company for regenerative medicine products and to achieve prodigious growth.

- 12 -
Under the plan, the Group engaged in business in line with its growth strategy. Through activities based on recent progress in the business environment, it is considerably more important in creating high corporate value, with the aim of fulfilling "selection and concentration" in business operation to achieve the plan. With this background, the Company has been seeking a company to continue the functional food business, maximizing the use of corporate resources such as research achievements, etc., accumulated in the business. As a result of discussion and negotiations with Shionogi Healthcare, a group company of Shionogi & Co., Ltd., regarding strengthening the functional food business, the Company has decided to implement a business reorganization by company split.
(3) Date of business divestiture January 1, 2019
(4) Legal form and others of business divestiture Absorption-type company split with the Company as the splitting company and Shionogi Healthcare as the successor company in consideration for cash only.
b. Accounting treatment
(1) The amount of gain on transfer
Millions of
Yen Thousands of U.S. Dollars
Gain on sale of business ¥76 $684
(2) Book values of assets and liabilities of the transferred business
Millions of
Yen Thousands of U.S. Dollars
Current assets ¥ 400 $ 3,603 Non-current assets 143 1,288
Total amount of assets ¥ 544 $ 4,900
Current liabilities ¥ 12 $ 108 Non-current liabilities 0 0
Total amount of liabilities ¥ 12 $ 108
(3) Accounting treatment
We recognized the amount of gain or loss on the transfer of the business as the difference between the fair value of assets, including cash received as the consideration, and the amount of equity for the transferred business.

- 13 -
c. Supplemental cash flow information The breakdown of transferred assets and liabilities and reconciliation between consideration of business transfer, proceeds from sale of businesses, and net of cash and cash equivalents transferred was as follows:
Millions of
Yen Thousands of U.S. Dollars
Current assets ¥ 400 $ 3,603 Non-current assets 143 1,288 Current liabilities (12 ) (108 ) Non-current liabilities (0 ) (0 ) Noncontrolling interests (4 ) (36 ) Gain on sale of business 76 684
Consideration of business transfer 603 5,432 Cash and cash equivalents (1 ) (9 )
Proceeds from sale of businesses, net ¥ 602 $ 5,423
d. Reportable segment in which the divested business was included AgriBio
e. Approximate amount of gain or loss of the divested business, included in the consolidated statement of income, for the year ended March 31, 2019:
Millions of
Yen Thousands of U.S. Dollars
Sales ¥409 $3,684 Operating income 6 54
(Business Divestiture of Mushroom Business)
The Group's mushroom business has been transferred to Yukiguni Maitake Co., Ltd. with the effective date of March 1, 2019.
a. Outline of the business divestiture
(1) Name of the purchasing company and outline of the divested business
Name of the purchasing company: Yukiguni Maitake Co., Ltd. (Yukiguni Maitake) Outline of the divested business: Mushroom business
(2) Major reason for the business divestiture
"Takara Bio Medium-Term Management Plan 2020" started in 2017 and aims to promote three businesses: Bioindustry, Gene Therapy, and AgriBio businesses, to enhance the Group's standing as a global industrial company for regenerative medicine products and to achieve prodigious growth. Under the plan, the Group engaged in business in line with its growth strategy. Through activities based on recent progress in the business environment, it is considerably more important in creating high corporate value, with the aim of fulfilling "selection and concentration" in business operation to achieve the plan. With this background, the Company has been seeking a company to continue the business of manufacturing and selling mushrooms (such as Honshimeji mushrooms and Hatakeshimeji mushrooms) with the utmost use of corporate resources accumulated. As a result of discussion and negotiations with Yukiguni Maitake, which has Japan's top share in the Maitake mushroom market, and expanding the production and sales for various mushrooms, the Company has decided to implement a business transfer.

- 14 -
(3) Date of business divestiture March 1, 2019
(4) Legal form and others of business divestiture Business transfer in consideration for cash only
b. Accounting treatment
(1) The amount of gain on transfer
Millions of
Yen Thousands of U.S. Dollars
Gain on sale of business ¥14 $126
(2) Book values of assets and liabilities of the transferred business
Millions of
Yen Thousands of U.S. Dollars
Current assets ¥ 347 $ 3,126 Non-current assets 194 1,747
Total amount of assets ¥ 541 $ 4,873
Current liabilities ¥ 337 $ 3,036 Non-current liabilities 0 0
Total amount of liabilities ¥ 337 $ 3,036
In the fiscal year ended March 31, 2019, we recognized ¥655 million ($5,900 thousand) as an impairment loss on transferred property to be sold with a net recoverable value less than its carrying value.
(3) Accounting treatment We recognized the amount of gain or loss on the transfer of the business as the difference between the fair value of assets, including cash received as the consideration, and the amount of equity for the transferred business.
c. Supplemental cash flow information The breakdown of transferred assets and liabilities and reconciliation between consideration of business transfer, proceeds from sale of businesses, and net of cash and cash equivalents transferred was as follows:
Millions of
Yen Thousands of U.S. Dollars
Current assets ¥ 347 $ 3,126 Non-current assets 194 1,747 Current liabilities (337 ) (3,036 ) Non-current liabilities (0 ) (0 ) Non-controlling interests (22 ) (198 ) Gain on sale of business 14 126
Consideration of business transfer 195 1,756 Cash and cash equivalents (33 ) (297 )
Proceeds from sale of businesses, net ¥ 162 $ 1,459

- 15 -
d. Reportable segment in which the divested business was included AgriBio
e. Approximate amount of gain or loss of the divested business, included in the consolidated statement of income, for the year ended March 31, 2019:
Millions of
Yen Thousands of U.S. Dollars
Sales ¥ 1,417 $ 12,765 Operating income (36 ) (324 )
4. MARKETABLE AND INVESTMENT SECURITIES
Marketable and investment securities as of March 31, 2019 and 2018, consisted of the following:
Millions of Yen Thousands of U.S. Dollars
2019 2018 2019
Current: Trust beneficiary rights ¥2,000 ¥2,000 $18,018
Non-current:
Nonmarketable equity securities ¥2 ¥2 $18
The cost and aggregate fair values of marketable and investment securities at March 31, 2019 and 2018, were as follows:
Millions of Yen
Cost Unrealized
Gains Unrealized
Losses Fair
Value
March 31, 2019 Securities classified as:
Held-to-maturity ¥2,000 ¥2,000 March 31, 2018 Securities classified as:
Held-to-maturity ¥2,000 ¥2,000
Thousands of U.S. Dollars
Cost Unrealized
Gains Unrealized
Losses Fair
Value
March 31, 2019 Securities classified as:
Held-to-maturity $18,018 $18,018

- 16 -
5. INVENTORIES
Inventories at March 31, 2019 and 2018, consisted of the following:
Millions of Yen Thousands of U.S. Dollars
2019 2018 2019
Finished products and merchandise ¥ 4,523 ¥ 4,484 $ 40,747 Work in process 706 334 6,360 Raw materials and supplies 1,506 1,192 13,567
Total ¥ 6,736 ¥ 6,011 $ 60,684
6. LONG-LIVED ASSETS
Impairment Loss
The impairment losses of long-lived assets for the years ended March 31, 2019 and 2018, were as follows:
March 31, 2019 Millions of Yen
Asset Type and Impairment Loss
Utilization Location
Building and
Structures
Machinery, Equipment
and Vehicles
Tools, Furniture
and Fixtures Land
Other Assets Total
Idle property (Buildings and facilities) Osaki Town, Kagoshima Pref. ¥ 28 ¥ 12 ¥ 0 ¥ 41 Property to be transferred (Land, buildings
and others) Kyotamba Town, Kyoto Pref. 262 183 1 ¥ 200 ¥ 5 655
Total ¥ 291 ¥ 196 ¥ 1 ¥ 200 ¥ 5 ¥ 696
March 31, 2018
Millions of Yen
Asset Type and Impairment Loss
Utilization Location
Building and
Structures
Machinery, Equipment
and Vehicles
Tools, Furniture
and Fixtures Land
Other Assets Total
Idle property (Land and R&D facilities) Yokkaichi City, Mie Pref. ¥ 151 ¥ 24 ¥ 1 ¥ 269 ¥ 446
Total ¥ 151 ¥ 24 ¥ 1 ¥ 269 ¥ 446
March 31, 2019
Thousands of U.S. Dollars
Asset Type and Impairment Loss
Utilization Location
Building and
Structures
Machinery, Equipment
and Vehicles
Tools, Furniture
and Fixtures Land
Other Assets Total
Idle property (Buildings and facilities) Osaki Town, Kagoshima Pref. $ 252 $ 108 $ 0 $ 369 Property to be transferred (Land, buildings
and others) Kyotamba Town, Kyoto Pref. 2,360 1,648 9 $ 1,801 $ 45
5,900
Total $ 2,621 $ 1,765 $ 9 $ 1,801 $ 45 $ 6,270

- 17 -
(1) Reason for recognizing impairment loss
In the fiscal year ended March 31, 2019, the Company recognized an impairment loss on properties not to be transferred upon transfer of functional food business to Shionogi Healthcare, to the recoverable amount as they were not likely to be used in the future. Also, the Company recognized an impairment loss on properties to be transferred upon transfer of mushroom business to Yukiguni Maitake, to the recoverable amount as they were likely to occur loss on transfer.
In the fiscal year ended March 31, 2018, the Company recognized an impairment loss on idle assets that were not likely to be used in the future as of March 31, 2018.
(2) Method of calculating recoverable amount
In the fiscal year ended March 31, 2019, the recoverable amount of idle properties were measured at value in use of zero, as no future cash flow was expected. As for properties to be transferred, the recoverable amount were measured at net selling price, which was based on planned transfer price.
In the fiscal year ended March 31, 2018, the recoverable amount of idle properties were measured at net selling price, which was based on the appraisal value of real estate or reasonable estimation of the value of the assets.
7. RETIREMENT AND PENSION PLANS
The Company and certain foreign subsidiaries have severance payment plans for employees.
The Company and the subsidiaries have unfunded lump-sum severance payment plans, defined benefit pension plans, and defined contribution pension plans. Under the lump-sum payment plans, employees terminating their employment are entitled to certain lump-sum severance payments based on their rate of pay at the time of termination, length of service, and certain other factors. Under the defined benefit corporate pension plans, employees terminating their employment are entitled to certain lump-sum severance payments or pension payments based on their length of service and certain other factors. In most circumstances, if the termination is caused by retirement at the mandatory retirement age, employees are entitled to greater payments than in other cases.
Some subsidiaries apply the simplified method to calculate liabilities for retirement benefits and retirement benefit costs.
(1) The changes in defined benefit obligations for the years ended March 31, 2019 and 2018, were as follows:
Millions of Yen Thousands of U.S. Dollars
2019 2018 2019
Balance at beginning of year ¥ 1,297 ¥ 1,216 $ 11,684 Current service cost 112 103 1,009 Interest cost 4 4 36 Actuarial losses 7 0 63 Benefits paid (80 ) (36 ) (720 ) Others (4 ) 8 (36 )
Balance at end of year ¥ 1,336 ¥ 1,297 $ 12,036

- 18 -
(2) The changes in plan assets for the years ended March 31, 2019 and 2018, were as follows:
Millions of Yen Thousands of U.S. Dollars
2019 2018 2019
Balance at beginning of year ¥ 733 ¥ 635 $ 6,603 Expected return on plan assets 14 12 126 Actuarial (losses) gains (8 ) 42 (72 ) Contributions from the employer 67 62 603 Benefits paid (40 ) (25 ) (360 ) Others (4 ) 5 (36 )
Balance at end of year ¥ 761 ¥ 733 $ 6,855
(3) Reconciliation between the liability recorded in the consolidated balance sheet and the balances
of defined benefit obligations and plan assets for the years ended March 31, 2019 and 2018, were as follows:
Millions of Yen Thousands of U.S. Dollars
2019 2018 2019
Funded defined benefit obligations ¥ 669 ¥ 638 $ 6,027 Plan assets (761 ) (733 ) (6,855 )
Total (91 ) (94 ) (819 ) Unfunded defined benefit obligations 666 658 6,000
Net liability arising from defined benefit
obligations ¥ 575 ¥ 564 $ 5,180
Millions of Yen Thousands of U.S. Dollars
2019 2018 2019
Liability for retirement benefits ¥ 667 ¥ 659 $ 6,009 Asset for retirement benefits (91 ) (95 ) (819 )
Net liability arising from defined benefit obligations ¥ 575 ¥ 564 $ 5,180
(4) The components of net periodic benefit costs for the years ended March 31, 2019 and 2018,
were as follows:
Millions of Yen Thousands of U.S. Dollars
2019 2018 2019
Service cost ¥ 112 ¥ 103 $ 1,009 Interest cost 4 4 36 Expected return on plan assets (14 ) (12 ) (126 ) Recognized actuarial losses 70 80 630 Amortization of prior service cost (26 ) (26 ) (234 )
Net periodic benefit costs ¥ 146 ¥ 148 $ 1,315

- 19 -
(5) Amounts recognized in other comprehensive income (before income tax effect) in respect of defined retirement benefit plans for the years ended March 31, 2019 and 2018, were as follows:
Millions of Yen Thousands of U.S. Dollars
2019 2018 2019
Prior service cost ¥ (26 ) ¥ (26 ) $ (234 ) Actuarial losses 54 121 486
Total ¥ 27 ¥ 95 $ 243
(6) Amounts recognized in accumulated other comprehensive income (before income tax effect) in
respect of defined retirement benefit plans as of March 31, 2019 and 2018, were as follows:
Millions of Yen Thousands of U.S. Dollars
2019 2018 2019
Unrecognized prior service cost ¥ 53 ¥ 80 $ 477 Unrecognized actuarial gains (360 ) (415 ) (3,243 )
Total ¥ (307 ) ¥ (334 ) $ (2,765 )
(7) Plan assets
a. Components of plan assets Plan assets as of March 31, 2019 and 2018, consisted of the following:
2019 2018 Debt investments 54 % 55 % General account of insurance company 28 28 Equity investments 14 13 Cash and cash equivalents 2 2 Others 2 2
Total 100 % 100 %
b. Method of determining the expected rate of return on plan assets
The expected rate of return on plan assets is determined considering the long-term rates of return which are expected currently and in the future from the various components of the plan assets.
(8) Assumptions used for the years ended March 31, 2019 and 2018, were set forth as follows:
2019 2018 Discount rate:
Defined benefit 0.377% 0.377% Lump-sum pension distribution 0.382% 0.382% Expected rate of return on plan assets 2.000% 2.000% Average rate of increase in salary 4.200% 4.200%
(9) Contributions paid to the defined contribution pension plan were ¥128 million ($1,153 thousand)
and ¥134 million for the years ended March 31, 2019 and 2018, respectively.

- 20 -
8. EQUITY
Japanese companies are subject to the Companies Act of Japan (the "Companies Act"). The significant provisions in the Companies Act that affect financial and accounting matters are summarized below:
(a) Dividends
Under the Companies Act, companies can pay dividends at any time during the fiscal year in addition to the year-end dividend upon resolution at the shareholders' meeting. For companies that meet certain criteria including (1) having a Board of Directors, (2) having independent auditors, (3) having an Audit & Supervisory Board, and (4) the term of service of the directors being prescribed as one year rather than the normal two-year term by its articles of incorporation, the Board of Directors may declare dividends (except for dividends-in-kind) at any time during the fiscal year if the company has prescribed so in its articles of incorporation. However, the Company does not meet all the above criteria.
The Companies Act permits companies to distribute dividends-in-kind (non-cash assets) to shareholders subject to a certain limitation and additional requirements.
Semiannual interim dividends may also be paid once a year upon resolution by the Board of Directors if the articles of incorporation of the company so stipulate. The Companies Act provides certain limitations on the amounts available for dividends or the purchase of treasury stock. The limitation is defined as the amount available for distribution to the shareholders, but the amount of net assets after dividends must be maintained at no less than ¥3 million.
(b) Increases/decreases and transfer of common stock, reserve, and surplus
The Companies Act requires that an amount equal to 10% of dividends must be appropriated as a legal reserve (a component of retained earnings) or as additional paid-in capital (a component of capital surplus), depending on the equity account charged upon the payment of such dividends, until the aggregate amount of legal reserve and additional paid-in capital equals 25% of the common stock. Under the Companies Act, the total amount of additional paid-in capital and legal reserve may be reversed without limitation. The Companies Act also provides that common stock, legal reserve, additional paid-in capital, other capital surplus and retained earnings can be transferred among the accounts within equity under certain conditions upon resolution of the shareholders.
(c) Treasury stock and treasury stock acquisition rights
The Companies Act also provides for companies to purchase treasury stock and dispose of such treasury stock by resolution of the Board of Directors. The amount of treasury stock purchased cannot exceed the amount available for distribution to the shareholders, which is determined by a specific formula. Under the Companies Act, stock acquisition rights are presented as a separate component of equity. The Companies Act also provides that companies can purchase both treasury stock acquisition rights and treasury stock. Such treasury stock acquisition rights are presented as a separate component of equity or deducted directly from stock acquisition rights.
9. RELATED PARTY DISCLOSURES
The Company is majority-owned by Takara Holdings Inc., which is listed on the first section of the Tokyo Stock Exchange.
10. RESEARCH AND DEVELOPMENT COSTS
Research and development costs charged to income were ¥4,337 million ($39,072 thousand) and ¥4,653 million for the years ended March 31, 2019 and 2018, respectively.

- 21 -
11. INCOME TAXES
The Company and its domestic subsidiaries are subject to Japanese national and local income taxes, which, in the aggregate, resulted in normal effective statutory tax rates of approximately 30.0% and 31.0% for each of the years ended March 31, 2019 and 2018, respectively. Foreign subsidiaries are subject to income taxes of the countries where they operate.
The tax effects of significant temporary differences and tax loss carryforwards which resulted in deferred tax assets and liabilities at March 31, 2019 and 2018, are as follows:
Millions of Yen Thousands of U.S. Dollars
2019 2018 2019
Deferred tax assets: Tax loss carryforwards ¥ 944 ¥ 1,320 $ 8,504 Inventories 116 125 1,045 Impairment loss 277 321 2,495 Unrealized profit on sales of inventories 343 299 3,090 Reconciliation related to retirement benefits 92 100 828 Accrued bonuses 138 76 1,243 Retirement benefits 155 68 1,396 Depreciation 38 42 342 Expenses incurred upon acquisition 200 204 1,801 Research and development costs 168 166 1,513 Tax credit for research and development
costs 91 119 819 Other 258 240 2,324
Total of tax loss carryforwards and temporary differences 2,825 3,085 25,450
Less valuation allowance for tax loss carryforwards (*) (176 ) (270 ) (1,585 )
Less valuation allowance for temporary differences (**) (332 ) (774 ) (2,990 )
Total valuation allowance (508 ) (1,045 ) (4,576 )
Deferred tax assets ¥ 2,316 ¥ 2,039 $ 20,864
Deferred tax liabilities:
Intangible assets ¥ 1,123 ¥ 1,336 $ 10,117 Undistributed profit of foreign subsidiaries 211 169 1,900 Other 142 61 1,279
Deferred tax liabilities ¥ 1,477 ¥ 1,567 $ 13,306
Net deferred tax assets ¥ 839 ¥ 472 $ 7,558
Notes: * The decrease in valuation from the prior year mainly consisted of a decrease in deferred tax assets related to tax loss carryforwards of ¥158 million ($1,423 thousand) of the subsidiaries due to the transfer of the mushroom business.
** The decrease in valuation from the prior year was mainly due to the decrease in valuation allowance for impairment loss of the Company of ¥224 million ($2,018 thousand).

- 22 -
The expiration of tax loss carryforwards, the related valuation allowances and the resulting net deferred tax assets as of March 31, 2019 and 2018, were as follows:
Millions of Yen
March 31, 2019 1 Year or
Less
After 1 Year through 2 Years
After 2 Years through 3 Years
After 3 Years through 4 Years
After 4 Years through 5 Years
After 5 Years Total
Deferred tax assets
relating to tax loss carryforwards ¥ 944 ¥ 944
Less valuation allowances for tax loss carryforwards (176 ) (176 )
Net deferred tax assets relating to tax loss carryforwards 768 768
Millions of Yen
March 31, 2018 1 Year or
Less
After 1 Year through 2 Years
After 2 Years through 3 Years
After 3 Years through 4 Years
After 4 Years through 5 Years
After 5 Years Total
Deferred tax assets
relating to tax loss carryforwards ¥ 37 ¥ 30 ¥ 19 ¥ 52 ¥ 1,180 ¥ 1,320
Less valuation allowances for tax loss carryforwards (37 ) (30 ) (19 ) (52 ) (131 ) (270 )
Net deferred tax assets relating to tax loss carryforwards 1,049 1,049
Thousands of U.S. Dollars
March 31, 2019 1 Year or
Less
After 1 Year through 2 Years
After 2 Years through 3 Years
After 3 Years through 4 Years
After 4 Years through 5 Years
After 5 Years Total
Deferred tax assets
relating to tax loss carryforwards $ 8,504 $ 8,504
Less valuation allowances for tax loss carryforwards (1,585 ) (1,585 )
Net deferred tax assets relating to tax loss carryforwards 6,918 6,918
Net deferred tax assets relating to tax loss carryforwards mainly consist of tax carryforwards arising from acquisitions of subsidiaries in the United States in 2017. The Company determined that it is recoverable considering the prospects for future taxable income, and does not recognize valuation allowances.

- 23 -
A reconciliation between the normal effective statutory tax rates and the actual effective tax rates reflected in the accompanying consolidated statement of income for the years ended March 31, 2019 and 2018, is as follows:
2019 2018
Normal effective statutory tax rate in Japan 30.0 % 31.0 % Expenses not deductible for income tax purposes 0.6 1.2 Per capita rate of local tax 0.2 0.3 Tax credit for research and development costs (2.8 ) (2.8 ) Valuation allowance (8.5 ) (8.7 ) Tax rate difference of subsidiaries (2.2 ) (0.7 ) Elimination of unrealized profit on sales of inventories 0.4 (3.2 ) Amortization of goodwill 3.1 4.5 Foreign withholding tax 2.5 4.4 Uncertainty in income taxes (0.4 ) 3.0 Other, net 0.9 1.4
Actual effective tax rate 23.8 % 30.4 %
12. LEASES
The Group leases certain machinery, computer equipment, and other assets.
Total rental expense for the years ended March 31, 2019 and 2018, was ¥502 million ($4,522 thousand) and ¥578 million, respectively.
The minimum rental commitments under noncancelable operating leases at March 31, 2019, were as follows:
Millions of
Yen Thousands of U.S. Dollars
Due within one year ¥ 249 $ 2,243 Due after one year 602 5,423
Total ¥ 852 $ 7,675
13. FINANCIAL INSTRUMENTS AND RELATED DISCLOSURES
(1) Group policy for financial instruments
Cash surpluses, if any, are invested in low-risk financial assets. Derivatives are used, not for speculative purposes, but to hedge foreign currency exchange rate risk associated with certain assets and liabilities denominated in foreign currencies.
(2) Nature and extent of risks arising from financial instruments
Receivables such as trade notes and trade accounts are exposed to customer credit risk. Although receivables in foreign currencies are exposed to the market risk of fluctuation in foreign currency exchange rates, the position, net of payables in foreign currencies, is hedged by using forward foreign currency contracts.
Marketable and investment securities, mainly held-to-maturity securities, are exposed to the issuer's credit risk.
Payment terms of payables, such as trade notes and trade accounts, are generally within three months. Although payables in foreign currencies are exposed to the market risk of fluctuation in foreign currency exchange rates, those risks are netted against the balance of receivables denominated in the same foreign currency and are hedged by foreign currency contracts as noted above.
- 24 -
Derivatives mainly include foreign currency forward contracts, nondeliverable forwards, and currency options which are used to hedge foreign exchange risk associated with certain assets and liabilities denominated in foreign currencies. Please see Note 14 for more details about derivatives.
(3) Risk management for financial instruments
Credit risk management
Credit risk is the risk of economic loss arising from a counterparty's failure to repay or service debt according to the contractual terms. The Group manages its credit risk from receivables on the basis of internal guidelines, which include the monitoring of payment terms and balances of major customers by each business administration department to identify the default risk of customers at an early stage. With respect to held-to-maturity financial investments, the Group manages exposure to credit risk by limiting investments to high credit rated bonds in accordance with its internal guidelines.
Market risk management (foreign exchange risk)
Foreign currency trade receivables and payables are exposed to market risk resulting from fluctuations in foreign currency exchange rates. Such foreign exchange risk is hedged principally by foreign currency forward contracts.
Derivative transactions are performed and managed with the approval of the prescribed authority based on the internal guidelines.
Liquidity risk management
Liquidity risk comprises the risk that the Group cannot meet its contractual obligations in full on their maturity dates. The Group manages its liquidity risk by holding adequate volumes of liquid assets, along with adequate financial planning by the corporate finance department.
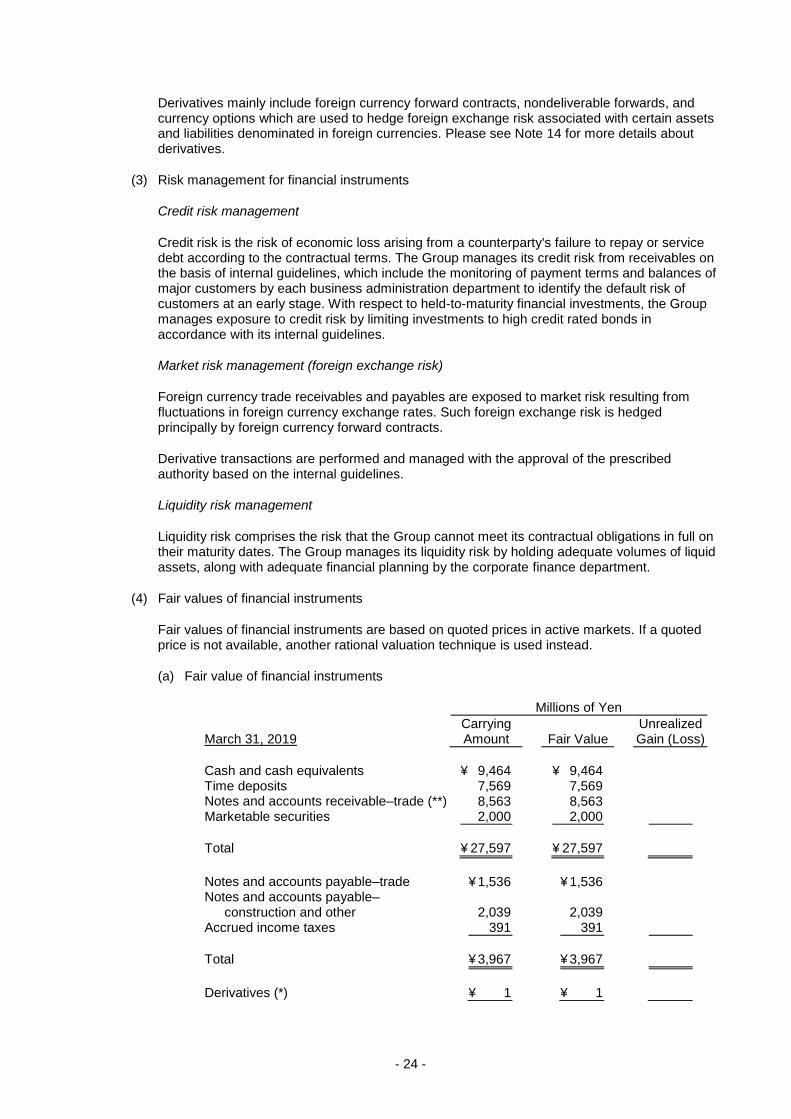
(4) Fair values of financial instruments
Fair values of financial instruments are based on quoted prices in active markets. If a quoted price is not available, another rational valuation technique is used instead.
(a) Fair value of financial instruments
Millions of Yen
March 31, 2019 Carrying Amount Fair Value
Unrealized Gain (Loss)
Cash and cash equivalents ¥ 9,464 ¥ 9,464 Time deposits 7,569 7,569 Notes and accounts receivable–trade (**) 8,563 8,563 Marketable securities 2,000 2,000
Total ¥ 27,597 ¥ 27,597
Notes and accounts payable–trade ¥ 1,536 ¥ 1,536 Notes and accounts payable–
construction and other 2,039 2,039 Accrued income taxes 391 391
Total ¥ 3,967 ¥ 3,967
Derivatives (*) ¥ 1 ¥ 1

- 25 -
Millions of Yen
March 31, 2018 Carrying Amount Fair Value
Unrealized Gain (Loss)
Cash and cash equivalents ¥ 10,051 ¥ 10,051 Time deposits 7,485 7,485 Notes and accounts receivable–trade (**) 7,988 7,988 Marketable securities 2,000 2,000
Total ¥ 27,526 ¥ 27,526
Notes and accounts payable–trade ¥ 1,875 ¥ 1,875 Notes and accounts payable–
construction and other 1,900 1,900 Accrued income taxes 431 431
Total ¥ 4,207 ¥ 4,207
Derivatives (*) ¥ 0 ¥ 0
Thousands of U.S. Dollars
March 31, 2019 Carrying Amount Fair Value
Unrealized Gain (Loss)
Cash and cash equivalents $ 85,261 $ 85,261 Time deposits 68,189 68,189 Notes and accounts receivable–trade (**) 77,144 77,144 Marketable securities 18,018 18,018
Total $ 248,621 $ 248,621
Notes and accounts payable–trade $ 13,837 $ 13,837 Notes and accounts payable–
construction and other 18,369 18,369 Accrued income taxes 3,522 3,522
Total $ 35,738 $ 35,738
Derivatives (*) $ 9 $ 9
Notes: * Assets and liabilities arising from derivative transactions are shown at net
value with amounts in parentheses representing the net liability position. ** Allowance for doubtful accounts is netted against notes and accounts
receivable–trade.
Cash and cash equivalents, time deposits, and notes and accounts receivable–trade
The carrying values of cash and cash equivalents, time deposits, and notes and accounts receivable–trade approximate fair value because of their short maturities.
Marketable securities
The fair values of marketable securities are measured at the quoted price obtained from the financial institution for certain debt instruments. The carrying values of certificates of deposit approximate fair value because of their short maturities. Fair value information for marketable and investment securities by classification is included in Note 4.
Notes and accounts payable (trade and construction and other) and accrued income taxes
The carrying values of notes and accounts payable and accrued income taxes approximate fair value because of their short maturities.
- 26 -
Derivatives
Fair value information for derivatives is included in Note 14.
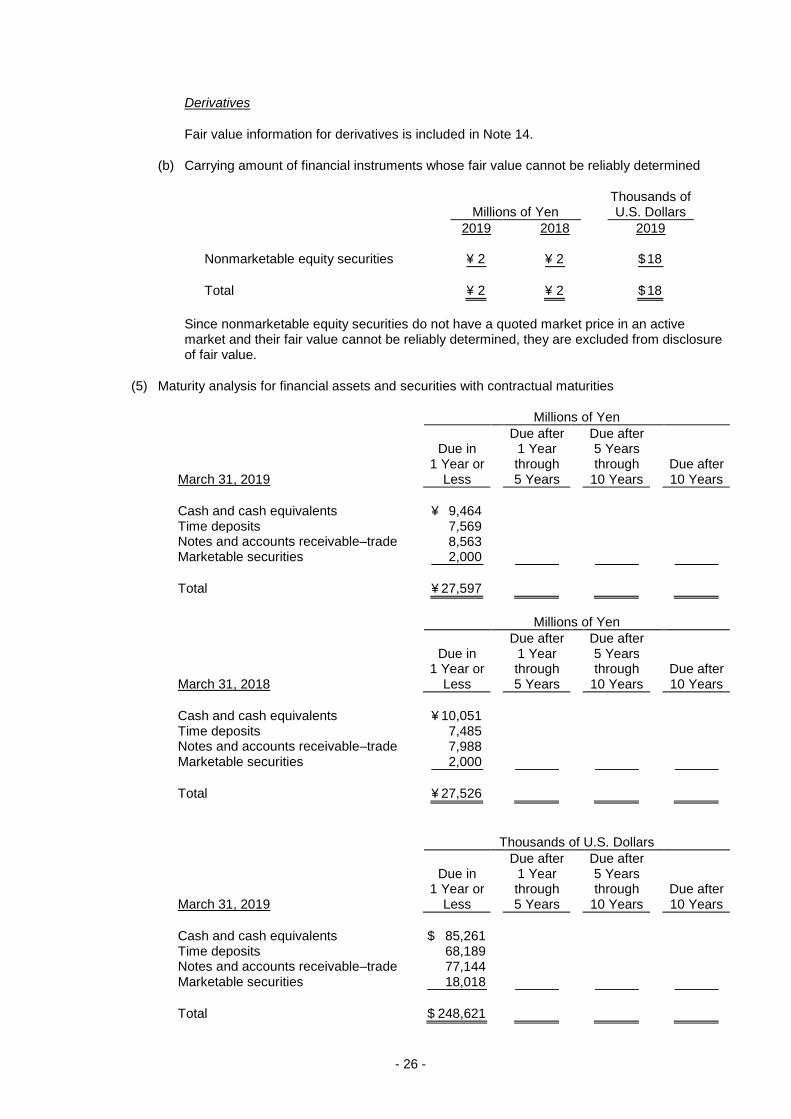
(b) Carrying amount of financial instruments whose fair value cannot be reliably determined
Millions of Yen Thousands of U.S. Dollars
2019 2018 2019
Nonmarketable equity securities ¥ 2 ¥ 2 $ 18
Total ¥ 2 ¥ 2 $ 18
Since nonmarketable equity securities do not have a quoted market price in an active market and their fair value cannot be reliably determined, they are excluded from disclosure of fair value.
(5) Maturity analysis for financial assets and securities with contractual maturities
Millions of Yen
March 31, 2019
Due in 1 Year or
Less
Due after 1 Year through 5 Years
Due after 5 Years through
10 Years Due after 10 Years
Cash and cash equivalents ¥ 9,464 Time deposits 7,569 Notes and accounts receivable–trade 8,563 Marketable securities 2,000
Total ¥ 27,597
Millions of Yen
March 31, 2018
Due in 1 Year or
Less
Due after 1 Year through 5 Years
Due after 5 Years through
10 Years Due after 10 Years
Cash and cash equivalents ¥ 10,051 Time deposits 7,485 Notes and accounts receivable–trade 7,988 Marketable securities 2,000
Total ¥ 27,526
Thousands of U.S. Dollars
March 31, 2019
Due in 1 Year or
Less
Due after 1 Year through 5 Years
Due after 5 Years through
10 Years Due after 10 Years
Cash and cash equivalents $ 85,261 Time deposits 68,189 Notes and accounts receivable–trade 77,144 Marketable securities 18,018
Total $ 248,621
- 27 -
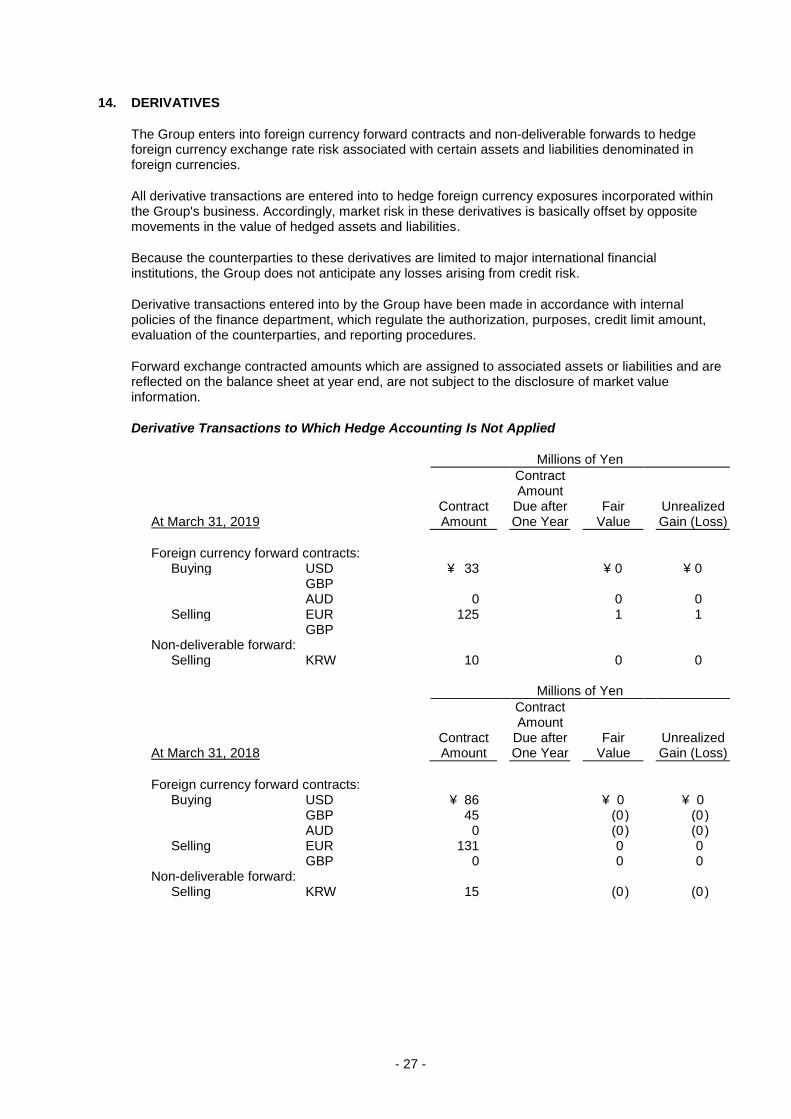
14. DERIVATIVES
The Group enters into foreign currency forward contracts and non-deliverable forwards to hedge foreign currency exchange rate risk associated with certain assets and liabilities denominated in foreign currencies.
All derivative transactions are entered into to hedge foreign currency exposures incorporated within the Group's business. Accordingly, market risk in these derivatives is basically offset by opposite movements in the value of hedged assets and liabilities.
Because the counterparties to these derivatives are limited to major international financial institutions, the Group does not anticipate any losses arising from credit risk.
Derivative transactions entered into by the Group have been made in accordance with internal policies of the finance department, which regulate the authorization, purposes, credit limit amount, evaluation of the counterparties, and reporting procedures.
Forward exchange contracted amounts which are assigned to associated assets or liabilities and are reflected on the balance sheet at year end, are not subject to the disclosure of market value information.
Derivative Transactions to Which Hedge Accounting Is Not Applied
Millions of Yen
At March 31, 2019 Contract Amount
Contract Amount
Due after One Year
Fair Value
Unrealized Gain (Loss)
Foreign currency forward contracts:
Buying USD ¥ 33 ¥ 0 ¥ 0 GBP AUD 0 0 0 Selling EUR 125 1 1 GBP
Non-deliverable forward: Selling KRW 10 0 0
Millions of Yen
At March 31, 2018 Contract Amount
Contract Amount
Due after One Year
Fair Value
Unrealized Gain (Loss)
Foreign currency forward contracts:
Buying USD ¥ 86 ¥ 0 ¥ 0 GBP 45 (0 ) (0 ) AUD 0 (0 ) (0 ) Selling EUR 131 0 0 GBP 0 0 0
Non-deliverable forward: Selling KRW 15 (0 ) (0 )

- 28 -
Thousands of U.S. Dollars
At March 31, 2019 Contract Amount
Contract Amount
Due after One Year
Fair Value
Unrealized Gain (Loss)
Foreign currency forward contracts:
Buying USD $ 297 $ 0 $ 0 GBP AUD 0 0 0 Selling EUR 1,126 9 9 GBP
Non-deliverable forward: Selling KRW 90 0 0
Derivative Transactions to Which Hedge Accounting is Applied
Millions of Yen
At March 31, 2019 Hedged
Item Contract Amount
Contract Amount
Due after One Year
Fair Value
Foreign currency forward contracts:
Buying USD Payables ¥6 ¥(0)
Millions of Yen
At March 31, 2018 Hedged
Item Contract Amount
Contract Amount
Due after One Year
Fair Value
Foreign currency forward contracts:
Buying USD Payables ¥6 ¥(0)
Thousands of U.S. Dollars
At March 31, 2019 Hedged
Item Contract Amount
Contract Amount
Due after One Year
Fair Value
Foreign currency forward contracts:
Buying USD Payables $54 $(0)
The fair value of derivative transactions is measured at the quoted price obtained from the financial institution.

- 29 -
15. OTHER COMPREHENSIVE INCOME (LOSS)
The components of other comprehensive income (loss) for the years ended March 31, 2019 and 2018, were as follows:
Millions of Yen Thousands of U.S. Dollars
2019 2018 2019
Foreign currency translation adjustments: Adjustments arising during the year ¥ (1,088 ) ¥ 21 $ (9,801 )
Total ¥ (1,088 ) ¥ 21 $ (9,801 )
Defined retirement benefits plans:
Adjustments arising during the year ¥ (16 ) ¥ 41 $ (144 ) Reclassification adjustments to profit 43 53 387
Amount before income tax effect 27 95 243 Income tax effect 92 828
Total ¥ 119 ¥ 95 $ 1,072
Total other comprehensive income ¥ (968 ) ¥ 117 $ (8,720 )
16. NET INCOME PER SHARE
The basis of computation for basic net income per share ("EPS") for the years ended March 31, 2019 and 2018, is as follows:
Millions of Yen Thousands of Shares Yen
U.S. Dollars
Net Income Attributable to Owners of the
Parent
Weighted-Average Shares EPS
For the year ended March 31, 2019:
Basic EPS
Net income available to common shareholders ¥ 3,657 120,415 ¥ 30.38 $ 0.27
For the year ended March 31, 2018:
Basic EPS
Net income available to common shareholders ¥ 2,335 120,415 ¥ 19.39
Diluted net income per share is not disclosed because no dilutive securities are outstanding for the years ended March 31, 2019 and 2018.

- 30 -
17. SUBSEQUENT EVENTS
(Appropriations of Retained Earnings)
On May 14, 2019, the Board of Directors of the Company resolved to propose cash dividends of ¥7 ($0.06) per share to shareholders of record as of March 31, 2019, or a total of ¥842 million ($7,585 thousand), for approval at the general shareholders' meeting to be held on June 21, 2019.
18. SEGMENT INFORMATION
Under ASBJ Statement No. 17, "Accounting Standard for Disclosures about Segments of an Enterprise and Related Information," and ASBJ Guidance No. 20, "Guidance on Accounting Standard for Disclosures about Segments of an Enterprise and Related Information," an entity is required to report financial and descriptive information about its reportable segments. Reportable segments are operating segments or aggregations of operating segments that meet specified criteria. Operating segments are components of an entity about which separate financial information is available and such information is evaluated regularly by the chief operating decision-maker in deciding how to allocate resources and in assessing performance. Generally, segment information is required to be reported on the same basis as is used internally for evaluating operating segment performance and deciding how to allocate resources to operating segments.
(1) Description of reportable segments
The Group's reportable segments are those for which separate financial information is available, and regular evaluation by the Company's management is being performed in order to decide how resources are allocated among the Group. As such, the Group's reportable segments consist of Bioindustry, Gene Therapy, and AgriBio segments.
The Bioindustry segment consists of the businesses for research reagents (for genetic, cellular and protein engineering reagents), scientific instruments, contracted services and compensation for gene related patents.
The Gene Therapy segment consists of the businesses for licensing fees for development and sales relating to the gene therapy products and investigational products.
The AgriBio segment consists of the businesses for functional foods, functional food R&D contracting, compensation for patents, relating to functional foods, mushrooms, and compensation for patents relating to mushrooms.
The Company's functional food business and mushroom business in AgriBio segment have been transferred on January 1, 2019 and March 1, 2019, respectively.
(2) Methods of measurement for the amounts of sales, profit (loss), assets, and other items for each reportable segment
The accounting policies of each reportable segment are consistent with those disclosed in Note 2, "Summary of Significant Accounting Policies."
Segment profit in the segment information below is based on operating income. Amounts of inter-segment transactions are based on the prevailing market prices.

- 31 -
(3) Information about sales, profit (loss), assets, and other items
Millions of Yen
2019
Bioindustry Gene
Therapy AgriBio Total Reconciliations Consolidated
Sales:
Sales to external customers ¥ 31,575 ¥ 2,443 ¥ 1,822 ¥ 35,841 ¥ 35,841 Intersegment sales or transfers 5 5 ¥ (5 )
Total ¥ 31,575 ¥ 2,443 ¥ 1,827 ¥ 35,846 ¥ (5 ) ¥ 35,841
Segment profit (loss) ¥ 7,100 ¥ 506 ¥ (29 ) ¥ 7,578 ¥ (2,114 ) ¥ 5,463 Segment assets 57,514 3,212 60,727 10,313 71,040 Other:
Depreciation 2,262 229 73 2,566 125 2,691 Amortization of goodwill 502 502 502 Increase in property, plant and
equipment and intangible assets 4,880 1,035 23 5,939 62 6,002
Millions of Yen
2018
Bioindustry Gene
Therapy AgriBio Total Reconciliations Consolidated
Sales:
Sales to external customers ¥ 29,568 ¥ 500 ¥ 2,243 ¥ 32,312 ¥ 32,312 Intersegment sales or transfers 7 7 ¥ (7 )
Total ¥ 29,568 ¥ 500 ¥ 2,251 ¥ 32,320 ¥ (7 ) ¥ 32,312
Segment profit (loss) ¥ 6,683 ¥ (1,322 ) ¥ 107 ¥ 5,467 ¥ (1,912 ) ¥ 3,555 Segment assets 52,185 2,594 2,165 56,946 11,724 68,670 Other:
Depreciation 2,049 300 90 2,441 127 2,568 Amortization of goodwill 489 489 489 Increase in property, plant and
equipment and intangible assets 1,302 118 32 1,453 85 1,539
Thousands of U.S. Dollars
2019
Bioindustry
Gene Therapy AgriBio Total Reconciliations Consolidated
Sales:
Sales to external customers $ 284,459 $ 22,009 $ 16,414 $ 322,891 $ 322,891 Intersegment sales or transfers 45 45 $ (45 )
Total $ 284,459 $ 22,009 $ 16,459 $ 322,936 $ (45 ) $ 322,891
Segment profit (loss) $ 63,963 $ 4,558 $ (261 ) $ 68,270 $ (19,045 ) $ 49,216 Segment assets 518,144 28,936 547,090 92,909 640,000 Other:
Depreciation 20,378 2,063 657 23,117 1,126 24,243 Amortization of goodwill 4,522 4,522 4,522 Increase in property, plant and
equipment and intangible assets 43,963 9,324 207 53,504 558 54,072
Note:
1. Reconciliations of segment profit include unallocated operating expenses of ¥(2,114) million ($(19,045) thousand) and ¥(1,912) million for the years ended March 31, 2019 and 2018, respectively, consisting principally of fundamental research and development expenses and administrative expenses.

- 32 -
(4) Information about products and services is as follows:
Millions of Yen
2019
Bioindustry Gene
Therapy AgriBio Total
Sales to external customers ¥31,575 ¥2,443 ¥1,822 ¥35,841
Millions of Yen
2018
Bioindustry Gene
Therapy AgriBio Total
Sales to external customers ¥29,568 ¥500 ¥2,243 ¥32,312
Thousands of U.S. Dollars
2019
Bioindustry Gene
Therapy AgriBio Total
Sales to external customers $284,459 $22,009 $16,414 $322,891
(5) Information about geographical areas is as follows:
(a) Sales
Millions of Yen
2019
Japan USA China Other Asia Europe Other Total
¥16,101 ¥7,945 ¥6,227 ¥1,994 ¥3,328 ¥244 ¥35,841
Millions of Yen
2018
Japan USA China Other Asia Europe Other Total
¥14,266 ¥7,240 ¥5,524 ¥1,754 ¥3,257 ¥268 ¥32,312
Thousands of U.S. Dollars
2019
Japan USA China Other Asia Europe Other Total
$145,054 $71,576 $56,099 $17,963 $29,981 $2,198 $322,891
(b) Property, plant and equipment
Millions of Yen
2019
Japan USA China Other Asia Europe Total
¥19,016 ¥285 ¥1,828 ¥204 ¥69 ¥21,404
Millions of Yen
2018
Japan USA China Other Asia Europe Total
¥15,745 ¥421 ¥2,068 ¥220 ¥78 ¥18,534

- 33 -
Thousands of U.S. Dollars
2019
Japan USA China Other Asia Europe Total
$171,315 $2,567 $16,468 $1,837 $621 $192,828
(6) Information about impairment losses
Millions of Yen
2019
Bioindustry Gene
Therapy AgriBio Reconciliations Consolidated
Impairment loss ¥696 ¥696
Millions of Yen
2018
Bioindustry Gene
Therapy AgriBio Reconciliations Consolidated
Impairment loss ¥446 ¥446
Thousands of U.S. Dollars
2019
Bioindustry Gene
Therapy AgriBio Reconciliations Consolidated
Impairment loss $6,270 $6,270
Note: The amount of "Reconciliations" is impairment loss of corporate assets which does not
belong to the reportable segments.
(7) Information about amortization of goodwill and goodwill at March 31, 2019 and 2018, is as follows.
Millions of Yen
2019
Bioindustry Gene
Therapy AgriBio Total Reconciliations Consolidated
Amortization of goodwill ¥ 502 ¥ 502 ¥ 502
Goodwill at March 31, 2019 7,598 7,598 7,598
Millions of Yen
2018
Bioindustry Gene
Therapy AgriBio Total Reconciliations Consolidated
Amortization of goodwill ¥ 489 ¥ 489 ¥ 489
Goodwill at March 31, 2018 8,259 8,259 8,259
Thousands of U.S. Dollars
2019
Bioindustry Gene
Therapy AgriBio Total Reconciliations Consolidated
Amortization of goodwill $ 4,522 $ 4,522 $ 4,522
Goodwill at March 31, 2019 68,450 68,450 68,450
* * * * * *