taking profitability insights to the next level: cost-to ...sapevents.be/fid/presentations/2.1 _ fid...
TRANSCRIPT

Taking profitability insights to the next level: Cost-to-Serve on HANA
Michel Haesendonckx & Filip HanssensApril 20, 2016

Agenda
Approach & architecture
The case
Context
Concluding remarks
Get to know us

About Delaware Consulting

• Founded in 1981; has been part of Bekaert, Andersen and Deloitte
• Independent partnership since 2003 with 124 professionals
History
Suzhou
2005
Antwerp
Global Delivery Center Harbin
2006
2007
Atlanta
Delaware Consulting
International
Den Bosch
Lyon
2009
MergerAlliance
Consulting
Wavre
Shanghai
2010
2011
Singapore
Nantes
New partnership Netherlands
Luxembourg
2013
2014
New York
Paris
Manila
2015
1250
professionals
worldwide
HungaryDubai
Malaysia
BeijingHong Kong
2008
Delaware Information
Solutions
2003
Independent partnership
2012
MergerB&M

International Presence1250+
professionals
€155 miorevenue
24 offices 13 countries
USA FranceThe Netherlands
BelgiumLuxembourg
Hungary
ChinaSingaporeMalaysia
PhilippinesHong Kong
UAEBrazil
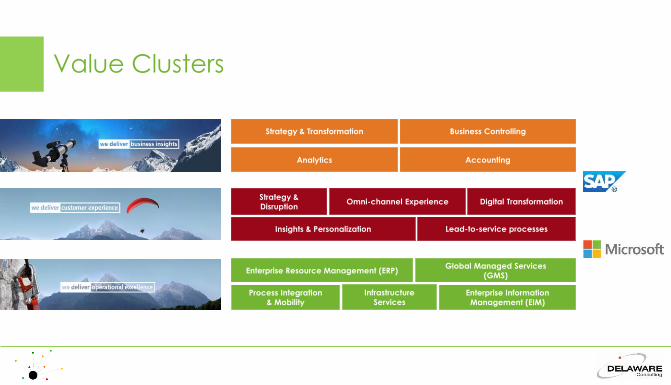
Value Clusters
Strategy & Transformation Business Controlling
Analytics Accounting
Strategy &
DisruptionDigital TransformationOmni-channel Experience
Lead-to-service processesInsights & Personalization
Enterprise Resource Management (ERP)
Process Integration
& MobilityEnterprise Information
Management (EIM)
Global Managed Services
(GMS)
Infrastructure
Services

Context
The business environment is dynamic and complex.
Higher manufacturing and raw materials costs,
shrinking margins and increased demand for service
require accurate revenue ,cost, net profitability and efficiency strategies
for products, services, customers and business models.

The business environment is dynamic and complex.
Higher manufacturing and raw materials costs,
shrinking margins and increased demand for service
require accurate revenue ,cost, net profitability and efficiency strategies
for products, services, customers and business models.
• Customer, product, vendor, channel and segment profitability
• Category management
• SKU rationalization
• Pricing
• Profit-based growth strategies
Maximize Profit
• Process improvement
• Capacity utilization
• Resource planning
• Staffing
• Benchmarking
• Best practices
• Reward efficiency
IncreaseOperational Efficiency
• Partner negotiations
• Allocations
• Unit cost
• Cost-to-serve
• Strategic sourcing
• IT chargeback
• Shared services
Decrease Costs

Cost to serve on SAP HANA
• Possibility to create full P&L if revenue, COGS,… is modelled
Including price waterfall(discounts, rebates, freegoods, …)
• Reflecting causality to a maximum extent
(multiple businessdimensions involved)
Model all customer and supply chain related processes
Standard costs On SAP HANA
• Easy to understand logic, applied on different business dimensions (customer, invoice, delivery, …)
• No fluctuations in costs across periods
• Supported by external benchmarking (per sales unit, country, region,…)
• Easy integration with ERP and other applications (as source and potentially as target)
• Connection to Lumira, Web Intelligence and other SAP BI Tools
• Real time reporting

The Business Case

The Business Case: Company specifics
Company
Mid sized
Sales unit in multiple European countries
B2B and B2CBelgian
Home equipment
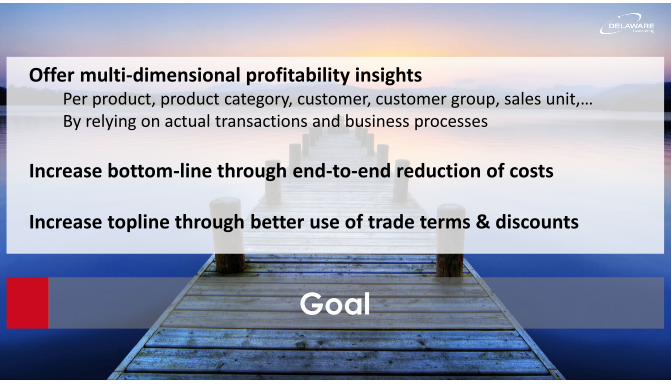
Goal
Offer multi-dimensional profitability insightsPer product, product category, customer, customer group, sales unit,…By relying on actual transactions and business processes
Increase bottom-line through end-to-end reduction of costs
Increase topline through better use of trade terms & discounts
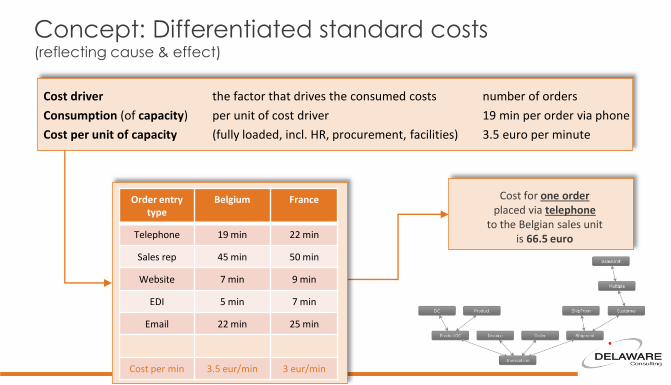
Concept: Differentiated standard costs(reflecting cause & effect)
Cost driver the factor that drives the consumed costs number of orders
Consumption (of capacity) per unit of cost driver 19 min per order via phone
Cost per unit of capacity (fully loaded, incl. HR, procurement, facilities) 3.5 euro per minute
Order entry type
Belgium France
Telephone 19 min 22 min
Sales rep 45 min 50 min
Website 7 min 9 min
EDI 5 min 7 min
Email 22 min 25 min
Cost per min 3.5 eur/min 3 eur/min
Cost for one order placed via telephone
to the Belgian sales unit is 66.5 euro

Concept: building up the P&L
Process Cost Object Cost influenced by Driver Differentiation
Net Turnover Invoice LineEUR amount provided by ERP on the
level of an invoice lineNet turnover None
Cogs material Invoice LineEUR amount provided by ERP on the
level of an invoice lineCogs material None
Sales Back Office -Order entry
OrderPenalisation based on number of
orders per entry type and sales unit# Orders
Sales unit and order entry type
Penalisation working capital
InvoicePenalisation based on number of days
outstanding combined with net turnover (WACC driven)
Days overdue * net turnover
None
Sales Representative
CustomerPenalisation based on number of
customer visits depending on sales unit
# Customer visits Sales unit
…

How to obtain ?
Cost driver the factor that drives the consumed costs number of orders
Consumption (of capacity) per unit of cost driver 19 min per order via phone
Cost per unit of capacity (fully loaded, incl. HR, procurement, facilities) 3.5 euro per minute
Differentiated standard costs
• Ad hoc analysis based on actual resources spent:
– business process analysis
– ad hoc calculation of cost per unit capacity available
• Excluding any over or under capacity (link with pricing)
• Fully loaded cost
• External benchmarking
– E.g. 3rd party logistics provider, carrier, forwarder,…
Cost per unit capacity
• Historical primary cost registrations increased with support costs from HR, facilities, corporate communications,…
– By introducing internal service catalogue
• => Upfront reservation of capacity @ stable rate
• => leverage controllability & planning for capacity
Standard cost can be validated by checking for variances on the cost center providing capacity

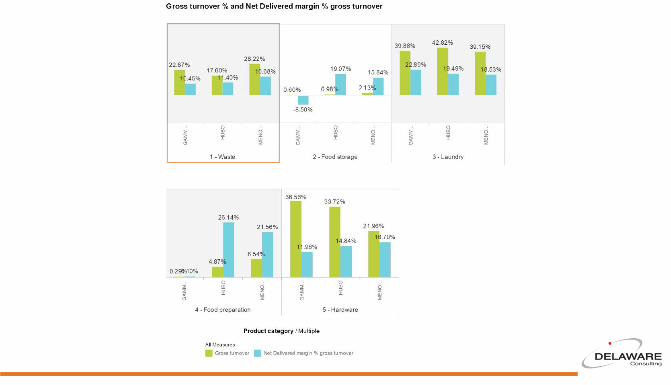
Which insights ?
1. Whalebone
2. Top 10 - BE
3. High level comparison customers
4. Comparison customers product category
5. Bottom customer


What did the customer learn ?
• Revisit sales process - centralize order intake
• Overcapacity
• Deliver to central DC
• Take initiative to define a standard product portfolio at the client
• SKU rationalization – Reduce number of SKU’s in BE
• Align discount policy with order complexity
Defin
ing actio
ns !

Approach and architecture

Project phasing
Intake value chain
Define business dimensions
Business processworkshops
Data requestdefinitions
Setup of standard cost model
Transform & Load
Calculate & Validate
Value ID
1 2 3 4 5 6 7 8

Project phasing
Focus on customer driven processesUnderstanding of • Revenue components
Gross turnover => Net turnover (discounts on invoice, off invoice)
• Direct costs: driven by order line, customers
• Indirect costs
Inventory of processes executed within departments
Intake value chain
Iterations based on• Data structures• Processes interviews to introduce
cause and effect correctly• Required insightsDefine business
dimensions
With key users• Which processes?• Cost drivers and differentiation in
complexity triggered• Differentiated standard times• Standard cost per unit capacity
supplied
Business processworkshops
Setup of standard cost model
• Activities/processes• Business dimensions • Differentiated standard times
& standard costs
Value ID
• Identify profit potential by benchmarking internally
• Best in class comparison
• Which attributes are required to model processes?
• Data type• Expected valuesData request
definitions
Transform & Load
• Low risk on typical data integrity pitfall
• Load data
Calculate & Validate
• Run the model• Validate outcome and check
for variances• Iterative calculations
1 2 3 4 5 6 7 8

Architecture
FIORI(incl Delaware specific apps)
Business Objects WebI & Design Studio(Reporting & Dashboards)
BO Analysis for Office(Excel)
DSO by Region
DSO
BO LumiraSelf-Service
S/4 HANA (or SoH)
HANA
HANA Live / Custom views
SAP BW
HANA
Views
Additional sources
CTS logic
DATA MERGE WITHOUT PHYSICAL TRANSFER
DATA TRANSFER DATA TRANSFER

Concluding remarks
Stable multi-dimensional actionable insights based on true complexity encountered
In a quick-start framework without typical resource to activity allocation
Leveraging available data and the SAP HANA development platform
Based on what Experience ?

Thank you!
Michel Haesendonckx Filip Hanssens
Performance Management Expert
Finance & Performance Management LeadSolution Lead SAP S/4 HANA Program