taking stock of the california linked
TRANSCRIPT


Taking Stock of the California Linked Learning District Initiative Technical Supplement to the Fourth-Year Evaluation Report February 2014 Submitted to: Kevin Rafter, Ph.D. Manager, Research and Evaluation The James Irvine Foundation 575 Market Street, Suite 3400 San Francisco, CA 94105 Prepared by: SRI International Center for Education Policy Suggested citation: Arshan, N., Warner, M., Caspary, K., Tyler, N., Escobar, J. R., Biscocho, F., & Black, A. (2014). Taking stock of the California Linked Learning District Initiative: Technical supplement to the fourth-year evaluation report. Menlo Park, CA: SRI International.

Contents List of Exhibits ............................................................................................................................. iii Chapter 1: Introduction ............................................................................................................... 1
Chapter 2: Extant Student Data and Value Added Methods ................................................ 3
Background and District Context .......................................................................................... 3
Data Sources and Descriptive Statistics ................................................................................ 6
Data Challenges...................................................................................................................... 11
Methodology ........................................................................................................................... 40
Chapter 3: Survey Methods .................................................................................................... 125
Survey Sample ...................................................................................................................... 125
Survey Administration ........................................................................................................ 127
Survey Response Rate ......................................................................................................... 127
Survey Analysis .................................................................................................................... 128
Survey Results ...................................................................................................................... 129
References ................................................................................................................................. 149
SRI International i

SRI International ii

List of Exhibits Exhibit 2-1 Certified Pathways Included in Analysis, by District .................................... 5
Exhibit 2-2 Data Elements ....................................................................................................... 7
Exhibit 2-3 Antioch Demographic Descriptive Statistics—Overall Sample .................. 13
Exhibit 2-4 Antioch Standardized Testing Descriptive Statistics—Overall Sample .... 14
Exhibit 2-5 Antioch Engagement and School Success Descriptive Statistics— Overall Sample ................................................................................................... 15
Exhibit 2-6 Long Beach Demographic Descriptive Statistics—Overall Sample............ 16
Exhibit 2-7 Long Beach Standardized Testing Descriptive Statistics— Overall Sample ................................................................................................... 17
Exhibit 2-8 Long Beach Engagement and School Success Descriptive Statistics—Overall Sample ................................................................................................... 18
Exhibit 2-9 Los Angeles Demographic Descriptive Statistics—Overall Sample........... 19
Exhibit 2-10 Los Angeles Standardized Testing Descriptive Statistics— Overall Sample ................................................................................................... 20
Exhibit 2-11 Los Angeles Engagement and School Success Descriptive Statistics—Overall Sample ................................................................................................... 21
Exhibit 2-12 Montebello Demographic Descriptive Statistics—Overall Sample ............ 22
Exhibit 2-13 Montebello Standardized Testing Descriptive Statistics— Overall Sample ................................................................................................... 23
Exhibit 2-14 Montebello Engagement and School Success Descriptive Statistics—Overall Sample ................................................................................................... 24
Exhibit 2-15 Oakland Demographic Descriptive Statistics—Overall Sample ................. 25
Exhibit 2-16 Oakland Standardized Testing Descriptive Statistics—Overall Sample ... 26
Exhibit 2-17 Oakland Engagement and School Success Descriptive Statistics— Overall Sample ................................................................................................... 27
Exhibit 2-18 Pasadena Demographic Descriptive Statistics—Overall Sample ............... 28
Exhibit 2-19 Pasadena Standardized Testing Descriptive Statistics— Overall Sample ................................................................................................... 29
Exhibit 2-20 Pasadena Engagement and School Success Descriptive Statistics— Overall Sample ................................................................................................... 30
Exhibit 2-21 Porterville Demographic Descriptive Statistics—Overall Sample .............. 31
Exhibit 2-22 Porterville Standardized Testing Descriptive Statistics— Overall Sample ................................................................................................... 32
SRI International iii

Exhibit 2-23 Porterville Engagement and School Success Descriptive Statistics— Overall Sample ................................................................................................... 33
Exhibit 2-24 Sacramento Demographic Descriptive Statistics—Overall Sample ........... 34
Exhibit 2-25 Sacramento Standardized Testing Descriptive Statistics— Overall Sample ................................................................................................... 35
Exhibit 2-26 Sacramento Engagement and School Success Descriptive Statistics—Overall Sample ................................................................................................... 36
Exhibit 2-27 West Contra Costa Demographic Descriptive Statistics— Overall Sample ................................................................................................... 37
Exhibit 2-28 West Contra Costa Standardized Testing Descriptive Statistics— Overall Sample ................................................................................................... 38
Exhibit 2-29 West Contra Costa Engagement and School Success Descriptive Statistics—Overall Sample ................................................................................ 39
Exhibit 2-30 Antioch Demographic Descriptive Statistics—Analytic Sample ................ 41
Exhibit 2-31 Antioch Standardized Testing Descriptive Statistics— Analytic Sample ................................................................................................. 42
Exhibit 2-32 Antioch Engagement and School Success Descriptive Statistics— Analytic Sample ................................................................................................. 43
Exhibit 2-33 Long Beach Demographic Descriptive Statistics—Analytic Sample .......... 44
Exhibit 2-34 Long Beach Standardized Testing Descriptive Statistics— Analytic Sample ................................................................................................. 45
Exhibit 2-35 Long Beach Engagement and School Success Descriptive Statistics—Analytic Sample ................................................................................................. 46
Exhibit 2-36 Los Angeles Demographic Descriptive Statistics—Analytic Sample ......... 47
Exhibit 2-37 Los Angeles Standardized Testing Descriptive Statistics— Analytic Sample ................................................................................................. 48
Exhibit 2-38 Los Angeles Engagement and School Success Descriptive Statistics—Analytic Sample ................................................................................................. 49
Exhibit 2-39 Montebello Demographic Descriptive Statistics—Analytic Sample .......... 50
Exhibit 2-40 Montebello Standardized Testing Descriptive Statistics— Analytic Sample ................................................................................................. 51
Exhibit 2-41 Montebello Engagement and School Success Descriptive Statistics—Analytic Sample ................................................................................................. 52
Exhibit 2-42 Oakland Demographic Descriptive Statistics—Analytic Sample ............... 53
Exhibit 2-43 Oakland Standardized Testing Descriptive Statistics— Analytic Sample ................................................................................................. 54
SRI International iv

Exhibit 2-44 Oakland Engagement and School Success Descriptive Statistics— Analytic Sample ................................................................................................. 55
Exhibit 2-45 Pasadena Demographic Descriptive Statistics—Analytic Sample .............. 56
Exhibit 2-46 Pasadena Standardized Testing Descriptive Statistics— Analytic Sample ................................................................................................. 57
Exhibit 2-47 Pasadena Engagement and School Success Descriptive Statistics— Analytic Sample ................................................................................................. 58
Exhibit 2-48 Porterville Demographic Descriptive Statistics—Analytic Sample ............ 59
Exhibit 2-49 Porterville Standardized Testing Descriptive Statistics— Analytic Sample ................................................................................................. 60
Exhibit 2-50 Porterville Engagement and School Success Descriptive Statistics—Analytic Sample ................................................................................................. 61
Exhibit 2-51 Sacramento Demographic Descriptive Statistics—Analytic Sample .......... 62
Exhibit 2-52 Sacramento Standardized Testing Descriptive Statistics— Analytic Sample ................................................................................................. 63
Exhibit 2-53 Sacramento Engagement and School Success Descriptive Statistics—Analytic Sample ................................................................................................. 64
Exhibit 2-54 West Contra Costa Demographic Descriptive Statistics— Analytic Sample ................................................................................................. 65
Exhibit 2-55 West Contra Costa Standardized Testing Descriptive Statistics— Analytic Sample ................................................................................................. 66
Exhibit 2-56 West Contra Costa Engagement and School Success Descriptive Statistics—Analytic Sample .............................................................................. 67
Exhibit 2-57 Control Variables Used in Each Model ........................................................... 69
Exhibit 2-58 Antioch Value Added Standardized Testing Outcomes .............................. 72
Exhibit 2-59 Antioch Value Added Engagement and School Success Outcomes........... 73
Exhibit 2-60 Long Beach Value Added Standardized Testing Outcomes ....................... 74
Exhibit 2-61 Long Beach Value Added Engagement and School Success Outcomes .... 75
Exhibit 2-62 Los Angeles Value Added Standardized Testing Outcomes ...................... 76
Exhibit 2-63 Los Angeles Value Added Engagement and School Success Outcomes ... 77
Exhibit 2-64 Oakland Value Added Standardized Testing Outcomes ............................. 78
Exhibit 2-65 Oakland Value Added Engagement and School Success Outcomes ......... 79
Exhibit 2-66 Pasadena Value Added Standardized Testing Outcomes ........................... 80
Exhibit 2-67 Pasadena Value Added Engagement and School Success Outcomes ........ 81
Exhibit 2-68 Porterville Value Added Standardized Testing Outcomes ......................... 82
SRI International v

Exhibit 2-69 Porterville Value Added Engagement and School Success Outcomes ...... 83
Exhibit 2-70 Sacramento Value Added Standardized Testing Outcomes ....................... 84
Exhibit 2-71 Sacramento Value Added Engagement and School Success Outcomes .... 85
Exhibit 2-72 West Contra Costa Value Added Standardized Testing Outcomes ........... 86
Exhibit 2-73 West Contra Costa Value Added Engagement and School Success Outcomes ............................................................................................................. 87
Exhibit 2-74 Antioch Value Added Estimates for All Pathway Types ............................. 88
Exhibit 2-75 Long Beach Value Added Estimates for All Pathway Types ...................... 92
Exhibit 2-76 Los Angeles Value Added Estimates for All Pathway Types ..................... 96
Exhibit 2-77 Montebello Value Added Estimates for All Pathway Types ..................... 100
Exhibit 2-78 Oakland Value Added Estimates for All Pathway Types .......................... 104
Exhibit 2-79 Pasadena Value Added Estimates for All Pathway Types ........................ 107
Exhibit 2-80 Porterville Value Added Estimates for All Pathway Types ...................... 111
Exhibit 2-81 Sacramento Value Added Estimates for All Pathway Types .................... 116
Exhibit 2-82 West Contra Costa Value Added Estimates for All Pathway Types ........ 120
Exhibit 3-1 Pathways Surveyed, by District ..................................................................... 126
Exhibit 3-2 Student Survey Response Rates ..................................................................... 127
Exhibit 3-2 Student Survey Response Rates (concluded) ............................................... 128
Exhibit 3-3 Survey Data for Question 2: School climate set by adults ......................... 130
Exhibit 3-4 Survey Data for Question 3: School climate set by students ..................... 130
Exhibit 3-5 Survey Data for Question 4: Personal connection to school ...................... 131
Exhibit 3-6 Survey Data for Question 5: Non-cognitive skill development (Exhibit 5-2 in Fourth-Year Evaluation Report)........................................... 131
Exhibit 3-7 Survey Data for Question 6: College and career readiness skill development (Exhibit 5-1 and 5-2 in Fourth-Year Evaluation Report) .... 132
Exhibit 3-8 Survey Data for Question 7a: Students who report they would be most likely to talk with a teacher about a problem in class ....................... 133
Exhibit 3-9 Survey Data for Question 7b: Students who report they would be most likely to talk with no adult at their school about a problem with classmates or friends .............................................................................. 133
Exhibit 3-10 Survey Data for Question 7c: Students who report they would be most likely to talk with a counselor about plans after high school .......... 134
Exhibit 3-11 Survey Data for Question 8: Students reporting that there are counselors at their school ................................................................................ 134
SRI International vi

Exhibit 3-12 Survey Data for Question 9: Students reporting having the same counselor throughout high school ................................................................. 135
Exhibit 3-13 Survey Data for Question 10: Frequency of students’ interactions with counselors ................................................................................................ 135
Exhibit 3-14 Survey Data for Question 11: Types of support provided by counselors .................................................................................................... 136
Exhibit 3-15 Survey Data for Question 12: Types of support provided by teachers (Exhibit 3-5 in Fourth-Year Evaluation Report)........................................... 137
Exhibit 3-16 Survey Data for Question 13: Enrollment in advanced coursework ........ 138
Exhibit 3-17 Survey Data for Question 14: Frequency with which teachers make coursework relevant ........................................................................................ 139
Exhibit 3-18 Survey Data for Question 15: Frequency with which teachers make coursework challenging .................................................................................. 140
Exhibit 3-19 Survey Data for Question 16: Work-based learning participation (Exhibit 3-1 in Fourth-Year Evaluation Report)........................................... 141
Exhibit 3-20 Survey Data for Question 17: Course grades linked to work-based learning experiences ........................................................................................ 142
Exhibit 3-21 Survey Data for Question 18: Experiences with work-based learning .... 142
Exhibit 3-22 Survey Data for Question 19: Satisfaction with work-based learning experiences ........................................................................................................ 143
Exhibit 3-23 Survey Data for Question 20: Perceived preparation for college and/or career .................................................................................................... 143
Exhibit 3-24 Survey Data for Question 21: Projected completion of a-g requirements ..................................................................................................... 144
Exhibit 3-25 Survey Data for Question 22: Plans to complete technical or trade school ....................................................................................................... 144
Exhibit 3-26 Survey Data for Question 23: Highest level of education expected ......... 145
Exhibit 3-27 Survey Data for Question 24: Pathway influence on student goals (pathway students only) ................................................................................. 145
Exhibit 3-28 Survey Data for Question 25: Future job or career interest known .......... 146
Exhibit 3-29 Survey Data for Question 27: Student Gender ............................................ 146
Exhibit 3-30 Survey Data for Question 28: Student Grade ............................................... 146
Exhibit 3-31 Survey Data for Question 29: Student Ethnicity.......................................... 147
Exhibit 3-32 Survey Data for Question 30: Highest level of education completed by a parent or guardian ................................................................................... 148
SRI International vii

Exhibit 3-33 Survey Data for Question 31: Highest level of education completed by a second parent or guardian ..................................................................... 148
SRI International viii

Chapter 1: Introduction This document is a technical supplement to SRI International’s fourth annual evaluation report (referred to throughout this supplement as “the report”) on the progress of the California Linked Learning District Initiative (Guha et. al, 2014). This document provides information and data supporting the analysis of student engagement and achievement outcomes and the student survey.
Linked Learning aims to increase student engagement in school and ultimately improve high school graduation rates and increase successful transitions to a full range of postsecondary education opportunities, particularly for low-income and disadvantaged youth. In the report, we examined indicators of pathway students’ engagement in school, their progress toward high school graduation and college eligibility, and their gains in knowledge, statistically adjusting for their background characteristics and prior achievement.
The report demonstrates that, compared with similar peers, students in certified pathways make significantly more progress toward graduation each year, though these differences in student behavior do not seem to lead to higher scores on standardized tests of English language arts and mathematics content knowledge. The most notable differences between pathway students and similar peers in their district are in the number of high school credits accumulated.
Also relevant to the success of the Linked Learning approach are the 21st century skills and productive behaviors that students may gain from their pathway experiences. In particular, recent research has focused on the importance of academic mindsets such as a sense of belonging, self-efficacy, a belief that ability and competence grow with effort, and perceived value and relevance of academic tasks for meeting future goals in predicting the perseverance and academic behaviors leading to student success in school (Farrington et al., 2012). Although these mindsets are influenced by many factors outside school, we surveyed 11th-graders about the extent to which they felt high school had helped them improve related skills and behaviors. In our student survey, pathway students were more likely than comparison students to report that high school has helped them develop professional competencies such as collaboration and presentation skills as well as a greater sense of self-efficacy and the value of school. Regardless of whether all pathway students experience high school with a specific career goal in mind, equipping students with broadly applicable 21st century skills while nurturing productive behaviors may better engage students during high school and ultimately lead to their long-term postsecondary success.
The next two chapters will provide information on methods and more details on findings for both extant student data and student survey analyses.
SRI International 1

SRI International 2
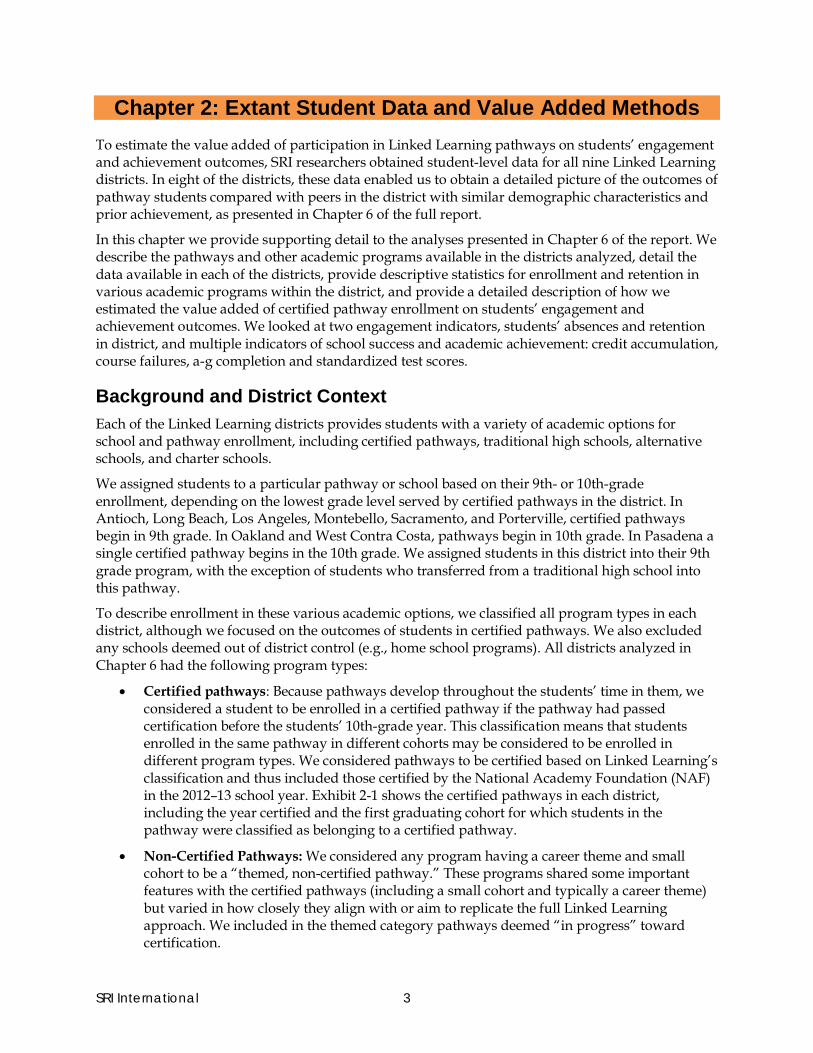
Chapter 2: Extant Student Data and Value Added Methods To estimate the value added of participation in Linked Learning pathways on students’ engagement and achievement outcomes, SRI researchers obtained student-level data for all nine Linked Learning districts. In eight of the districts, these data enabled us to obtain a detailed picture of the outcomes of pathway students compared with peers in the district with similar demographic characteristics and prior achievement, as presented in Chapter 6 of the full report.
In this chapter we provide supporting detail to the analyses presented in Chapter 6 of the report. We describe the pathways and other academic programs available in the districts analyzed, detail the data available in each of the districts, provide descriptive statistics for enrollment and retention in various academic programs within the district, and provide a detailed description of how we estimated the value added of certified pathway enrollment on students’ engagement and achievement outcomes. We looked at two engagement indicators, students’ absences and retention in district, and multiple indicators of school success and academic achievement: credit accumulation, course failures, a-g completion and standardized test scores.
Background and District Context Each of the Linked Learning districts provides students with a variety of academic options for school and pathway enrollment, including certified pathways, traditional high schools, alternative schools, and charter schools.
We assigned students to a particular pathway or school based on their 9th- or 10th-grade enrollment, depending on the lowest grade level served by certified pathways in the district. In Antioch, Long Beach, Los Angeles, Montebello, Sacramento, and Porterville, certified pathways begin in 9th grade. In Oakland and West Contra Costa, pathways begin in 10th grade. In Pasadena a single certified pathway begins in the 10th grade. We assigned students in this district into their 9th grade program, with the exception of students who transferred from a traditional high school into this pathway.
To describe enrollment in these various academic options, we classified all program types in each district, although we focused on the outcomes of students in certified pathways. We also excluded any schools deemed out of district control (e.g., home school programs). All districts analyzed in Chapter 6 had the following program types:
• Certified pathways: Because pathways develop throughout the students’ time in them, we considered a student to be enrolled in a certified pathway if the pathway had passed certification before the students’ 10th-grade year. This classification means that students enrolled in the same pathway in different cohorts may be considered to be enrolled in different program types. We considered pathways to be certified based on Linked Learning’s classification and thus included those certified by the National Academy Foundation (NAF) in the 2012–13 school year. Exhibit 2-1 shows the certified pathways in each district, including the year certified and the first graduating cohort for which students in the pathway were classified as belonging to a certified pathway.
• Non-Certified Pathways: We considered any program having a career theme and small cohort to be a “themed, non-certified pathway.” These programs shared some important features with the certified pathways (including a small cohort and typically a career theme) but varied in how closely they align with or aim to replicate the full Linked Learning approach. We included in the themed category pathways deemed “in progress” toward certification.
SRI International 3

• Traditional high school: We classified schools with neither an intentional cohort nor a career theme in this category.
• Alternative schools: We classified schools for struggling students (e.g., credit recovery programs) or students with special needs (e.g., English language learners) into one group. In Long Beach, the alternative schools category also encompassed freshman academies within three high schools that enrolled students who had not yet selected a pathway or program. Long Beach has begun to phase out freshman academies at two high schools, but one school has decided to maintain a model where all students enroll in the freshman academy and all their pathways begin in 10th grade, after the students have been exposed to each program and career theme.
There were two additional program types that do not exist in all districts:
• IB/ Honors programs: Long Beach provides a small number of academic pathways that share a small cohort experience with the Linked Learning model but do not have a strong career theme. These programs are also among the more academically rigorous in the district, with minimum recommended GPAs and sometimes minimum test scores, middle school curriculum, and/or recommendations for entry.
• Non-pathway at wall-to-wall schools: Several districts have at least one high school where all students should be assigned a pathway designation (these schools are commonly referred to as “wall-to-wall schools”), but not all the students in the school had a flag identifying their pathway. We designated any students at these wall-to-wall schools without a pathway flag as “non-pathway at wall-to-wall schools.” We included these students in the descriptive demographic tables, but excluded them from the outcomes analysis.
SRI International 4

Exhibit 2-1 Certified Pathways Included in Analysis, by District
District High School Certified Pathway First Cohort Certified
Antiocha Dozier-Libbey Medical HS
Health Science and Medical Technology
Class of 2013
Long Beachb California Academy of Math and
Science
Engineering and BioScience
Class of 2013
Jordan HS
Architecture, Construction and Engineering
Class of 2013
Millikan HS
Community of Musicians, Performers, Artists, and Social Scientists (COMPASS)
Class of 2013
Millikan HS
PEACE Academy
Class of 2013
Los Angeles
Robert F. Kennedy Community
Schools Complex
Los Angeles High School for the Arts
Class of 2014
Miguel Contreras Learning Complex
Los Angeles School of Global Studies
Class of 2014
Oakland LIFE Academy
Life Academy of Health and Bioscience
Class of 2014
Media College Preparatory
Media Academy
Class of 2014
Skyline HS
Education Academy
Class of 2014 Pasadena
John Muir HS
Arts, Entertainment, Mediac
Class of 2013
John Muir HS
Business and Entrepreneurship Academy
Class of 2013
John Muir HS
Engineering and Environmental Science Academy
Class of 2015
Pasadena HS
Creative Arts, Media, and Design Academy
Class of 2013 Porterville
Granite Hills HS
Digital Communication and Design
Class of 2015
Harmony Magnet
Engineering Academyd
Class of 2013
Harmony Magnet
Performing Arts Academyd
Class of 2014
Monache HS
Multimedia Technology Academy
Class of 2014
Porterville HS
Partnership Academy of Business
Class of 2013
Porterville HS
Partnership Academy of Health Sciences
Class of 2014 Sacramento A. A. Benjamin Health Professions HS
Health Professions
Class of 2014
Hiram W. Johnson HS
Business Corporate Academy
Class of 2015
New Technology HS
School of Design
Class of 2014
School of Engineering and Sciences
Engineering and Science
Class of 2015
The MET
Learning Through Internship
Class of 2015
SRI International 5

Exhibit 2-1 Certified Pathways Included in Analysis, by District (concluded)
District High School Certified Pathway First Cohort Certified
West Contra Costae
Richmond HS
Engineering Academy
Class of 2014
Richmond HS
Law Academy
Class of 2014
Richmond HS
Multimedia Academy
Class of 2014 a The two pathways certified in the 2012–13 school year will be included when Class of 2015 data is available for Antioch. b Because the one additional pathway in Long Beach certified in 2012-13 starts in the 10th grade (the Media and Communication pathway at Jordan High School), it will be included when 10th-grade data is available for the Class of 2015. c Includes students enrolled in the Graphic Communications pathway. d Pathway flags were unavailable for Harmony Magnet for the 2010–11 and 2011–12 school year. Both pathways are modeled jointly in these two school years. e The Health Academy at De Anza High School will be included when 10th-grade data is available for the Class of 2015.
Data Sources and Descriptive Statistics The research team received student-level data from a third party, the Institute for Evidence-Based Change (IEBC). The research team requested 7th- through 11th- grade data for the class of 2013 (students who started 9th grade in the 2009–10 school year) in Antioch, Long Beach, Pasadena, and Porterville and 7th- through 9th- or 10th-grade data for the classes of 2014 and 2015, respectively (students who began high school in 2010–11 and 2011–12) in all nine districts. In Exhibit 2-2 we describe each data element used in the analysis.
SRI International 6
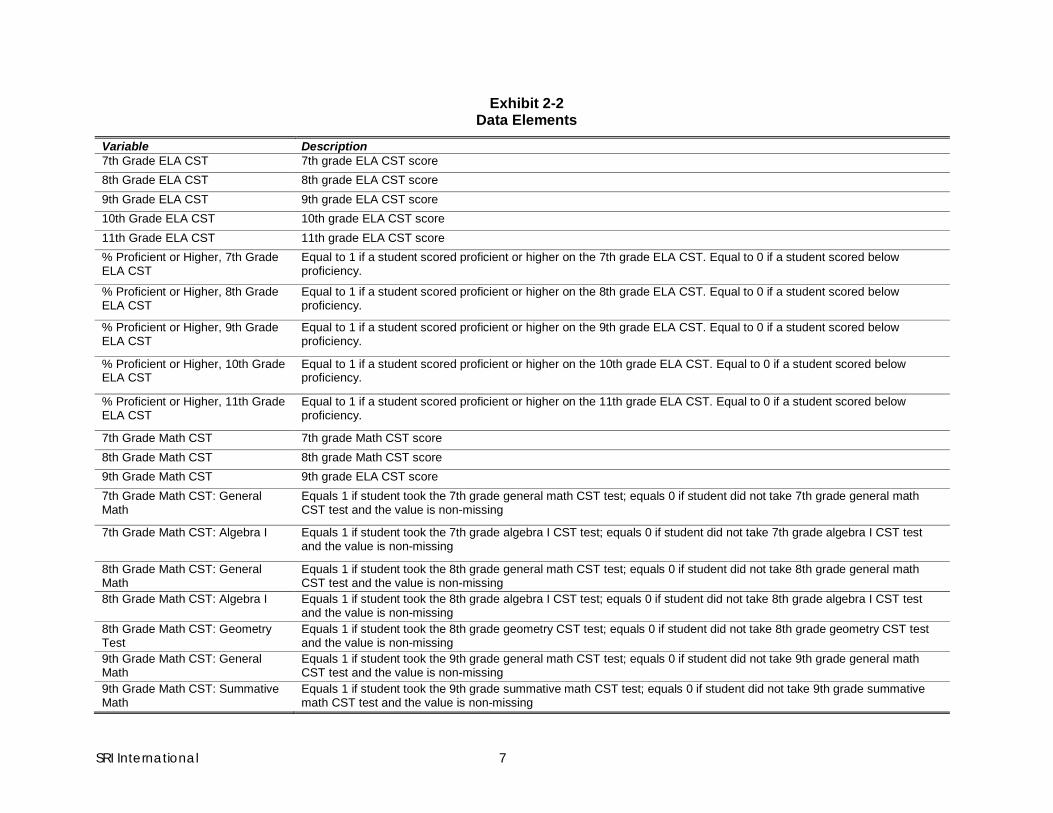
Exhibit 2-2 Data Elements
Variable Description 7th Grade ELA CST 7th grade ELA CST score 8th Grade ELA CST 8th grade ELA CST score 9th Grade ELA CST 9th grade ELA CST score 10th Grade ELA CST 10th grade ELA CST score 11th Grade ELA CST 11th grade ELA CST score % Proficient or Higher, 7th Grade ELA CST
Equal to 1 if a student scored proficient or higher on the 7th grade ELA CST. Equal to 0 if a student scored below proficiency.
% Proficient or Higher, 8th Grade ELA CST
Equal to 1 if a student scored proficient or higher on the 8th grade ELA CST. Equal to 0 if a student scored below proficiency.
% Proficient or Higher, 9th Grade ELA CST
Equal to 1 if a student scored proficient or higher on the 9th grade ELA CST. Equal to 0 if a student scored below proficiency.
% Proficient or Higher, 10th Grade ELA CST
Equal to 1 if a student scored proficient or higher on the 10th grade ELA CST. Equal to 0 if a student scored below proficiency.
% Proficient or Higher, 11th Grade ELA CST
Equal to 1 if a student scored proficient or higher on the 11th grade ELA CST. Equal to 0 if a student scored below proficiency.
7th Grade Math CST 7th grade Math CST score 8th Grade Math CST 8th grade Math CST score 9th Grade Math CST 9th grade ELA CST score 7th Grade Math CST: General Math
Equals 1 if student took the 7th grade general math CST test; equals 0 if student did not take 7th grade general math CST test and the value is non-missing
7th Grade Math CST: Algebra I Equals 1 if student took the 7th grade algebra I CST test; equals 0 if student did not take 7th grade algebra I CST test and the value is non-missing
8th Grade Math CST: General Math
Equals 1 if student took the 8th grade general math CST test; equals 0 if student did not take 8th grade general math CST test and the value is non-missing
8th Grade Math CST: Algebra I Equals 1 if student took the 8th grade algebra I CST test; equals 0 if student did not take 8th grade algebra I CST test and the value is non-missing
8th Grade Math CST: Geometry Test
Equals 1 if student took the 8th grade geometry CST test; equals 0 if student did not take 8th grade geometry CST test and the value is non-missing
9th Grade Math CST: General Math
Equals 1 if student took the 9th grade general math CST test; equals 0 if student did not take 9th grade general math CST test and the value is non-missing
9th Grade Math CST: Summative Math
Equals 1 if student took the 9th grade summative math CST test; equals 0 if student did not take 9th grade summative math CST test and the value is non-missing
SRI International 7

Variable Description 9th Grade Math CST: Integrated Math
Equals 1 if student took the 9th grade integrated math CST test; equals 0 if student did not take 9th grade integrated math CST test and the value is non-missing
9th Grade Math CST: Geometry Test
Equals 1 if student took the 9th grade geometry CST test; equals 0 if student did not take 9th grade geometry CST test and the value is non-missing
9th Grade Math CST: Algebra II Equals 1 if student took the 9th grade algebra II CST test; equals 0 if student did not take 9th grade algebra II CST test and the value is non-missing
% Taking Algebra or Higher in 8th grade
Equals 1 if student took the 8th grade math CST test for any of the following subjects: algebra I, intermediate math I, geometry, intermediate math II, algebra II, or intermediate math III; equal to 0 if student took the 8th grade math CST test in general math or summative high school math and value is non-missing
Class Fail Indicator, 7th Grade Equals 1 if student failed a semester course in 7th grade; equals 0 if student did not fail any courses and value was non-missing
Class Fail Indicator, 8th Grade Equals 1 if student failed a semester course in 8th grade; equals 0 if student did not fail any courses and value was non-missing
Number of F's Received in the 9th Grade
The number of semester F's received in the 9th grade
Number of F's Received in the 10th Grade
The number of semester F's received in the 10th grade
Number of F's Received in the 11th Grade
The number of semester F's received in the 11th grade
Number of Credits Accumulated in the 9th Grade
Sum of credits for all classes in which students received a passing grade by the end of 9th grade
Number of Credits Accumulated in the 10th Grade
Sum of credits for all classes in which students received a passing grade by the end of 10th grade
Number of Credits Accumulated in the 11th Grade
Sum of credits for all classes in which students received a passing grade by the end of 11th grade
7th Grade GPA 7th Grade Academic, unweighted GPA. Plusses or minuses are ignored 8th Grade GPA 8th Grade Academic, unweighted GPA. Plusses or minuses are ignored 9th Grade GPA 9th Grade Academic, unweighted GPA. Plusses or minuses are ignored 10th Grade GPA 10th Grade Academic, unweighted GPA. Plusses or minuses are ignored 11th Grade GPA 11th Grade Academic, unweighted GPA. Plusses or minuses are ignored On Track to Complete a-g Course Requirements in 9th Grade
This variable equals 1 if, in the 9th grade, a student has received a C or better in two semesters each of a "b" class and a "c" class and four additional courses that count towards any a-g requirement. We use the grade-level classes suggested by Transcript Evaluation Services to determine what coursework students should have completed by the end of each grade. Our a-g on track indicator does not include courses above the number required for UC admission (e.g., more than two semesters of “g” courses). We also exclude a-g courses taken in middle school since we lack consistent course data for grades prior to the 9th. We assume that students who consistently take math CSTs beyond Algebra I (i.e., Geometry, Algebra II) have successfully completed two semesters of math (c) curriculum in middle school.
SRI International 8

Variable Description On Track to Complete a-g Course Requirements in 10th Grade
This variable equals 1 if, by the end of the 10th grade, a student has received a C or better in four semesters each of a "b" class and a "c" class and six additional semesters that count towards any a-g requirement. We use the grade-level classes suggested by Transcript Evaluation Services to determine what coursework students should have completed by the end of each grade. Our a-g on track indicator does not include courses above the number required for UC admission (e.g., more than two semesters of “g” courses). We also exclude a-g courses taken in middle school since we lack consistent course data for grades prior to the 9th. We assume that students who consistently take math CSTs beyond Algebra I (i.e., Geometry, Algebra II) have successfully completed two semesters of math (c) curriculum in middle school.
On Track to Complete a-g Course Requirements in 11th Grade
This variable equals 1 if, by the end of the 11th grade, a student has received a C or better in six semesters each of a "b" class and a "c" class, two semesters each of “a,” “d,” and “e” classes, as well as 4 additional a-g approved classes. We use the grade-level classes suggested by Transcript Evaluation Services to determine what coursework students should have completed by the end of each grade. Our a-g on track indicator does not include courses above the number required for UC admission (e.g., more than two semesters of “g” courses). We also exclude a-g courses taken in middle school since we lack consistent course data for grades prior to the 9th. We assume that students who consistently take math CSTs beyond Algebra I (i.e., Geometry, Algebra II) have successfully completed two semesters of math (c) curriculum in middle school.
Days Absent in the 9th Grade Number of days absent in 9th grade Days Absent in the 10th Grade Number of days absent in 10th grade Days Absent in the 11th Grade Number of days absent in 11th grade Retention in District From 9th to 10th Grade
Equal to 1 if evidence of student retained in district from 9th to 10th grade. Students are considered present in the district if they have a non-missing value for 10th grade ELA CST, 10th Grade GPA or 10th Grade school or pathway enrollment. This variable is only defined for students in the Classes of 2013 and 2014.
Retention in District From 9th to 11th Grade
Equal to 1 if evidence of student retained in district from 9th to 10th grade. Students are considered present in the district if they have a non-missing value for 11th grade ELA CST, 11th Grade GPA or 11th Grade school or pathway enrollment. This variable is only defined for students in the Class of 2013.
California High School Exit Exam, ELA
10th grade ELA California High School Exit Exam score (CAHSEE)
Passed California High School Exit Exam, ELA
Equal to 1 if a student score 350 or above on the ELA CAHSEE. Equal to 0 if student scored below 350 on the ELA CAHSEE
California High School Exit Exam, Mathematics
10th grade Math CHASEE score
Passed California High School Exit Exam, Mathematics
Equal to 1 if a student score 350 or above on the Math CAHSEE. Equal to 0 if student scored below 350 on the math CAHSEE
Passed California High School Exit Exam
Equal to 1 if student passed both the math and ELA CAHSEE; equal to zero if student took both exams but did not pass one or both
Female Equal to 1 if student is female; equal to zero if student is male Low SES Equal to 1 if student is part of the National School Lunch Program or their parent's education level is not higher than high
school graduate; equal to 0 if student is not part of the National School Lunch Program and their parent's education level is higher than a high school graduate and the value is non-missing
SRI International 9

Variable Description White Equal to 1 if student is White, Non-Latino; equal to 0 if student is not White and the value is non-missing Latino Equal to 1 if student is Latino; equal to 0 if student is not Latino and the value is non-missing African American Equal to 1 if student is African American, Non-Latino; equal to 0 if student is not African American and the value is
non-missing Asian Group 1 Equal to 1 if student is of Chinese, Japanese, Korean, Vietnamese, Indian, or Filipino descent (groups with higher than
national average high school graduation rates); equal to 0 if student is not from any of these ethnic groups and the value is non-missing
Asian Group 2 Equal to 1 if student is of Laotian, Cambodian, Hmong, Hawaiian, Guamanian, Samoan, or Tahitian descent (groups with lower than national average high school graduation rates); equal to 0 if student is not from any of these ethnic groups and the value is non-missing
Other Race/ Ethnicity Equal to 1 if student is American Indian, Alaskan Native, or ethnicity unknown; equal to 0 if student's ethnicity is known and is not American Indian or Alaskan Native
Gifted and Talented Equal to 1 if student is gifted and talented; equal to 0 if student is not gifted and talented and the value is non-missing Special Education Equal to 1 if student is in special education; equal to 0 if the student is not in special education and the value is non-
missing English Language Learner Equal to 1 if student is classified as an English language learner; equal to 0 if student is not classified as an English
language learner and the value is non-missing Redesignated Fluent English Proficient
Equal to 1 if student is reclassified as proficient in English; equal to 0 if student is not classified as reclassified as proficient in English and the value is non-missing
Initially Fluent English Proficient Equal to 1 if student has a home language other than English, but who is initially classified as proficient in English; equal to 0 if student was not initially classified as proficient in English and the value is non-missing
Class of 2013 A student in the 9th grade in the 2009–10 school year (Class of 2013 if graduates on time) Class of 2014 A student in the 9th grade in the 2010–11 school year (Class of 2014 if graduates on time)
SRI International 10

Data Challenges Providing all the specific data elements needed for the analysis posed a challenge for districts, which often house data elements in different data systems and are still developing systems for flagging and tracking pathway students. A number of gaps in the data meant that analysis based on student-level data was not possible in some cases or must be interpreted with caution.
• Antioch was unable to provide accurate data in this year of the evaluation. The evaluation team therefore included the data from last year’s analysis (9th- and 10th-grade data for the class of 2013 and 9th-grade data for the class of 2014). These data have several gaps. First, Antioch was unable to provide pathway flags for students in 2009–10 (i.e., 9th grade for the class of 2013). Because the only certified pathway in Antioch is a stand-alone school, we were still able to estimate a certified pathway effect in Antioch but could not identify students enrolled in the one non-certified pathway in 2009–10. Additionally, because there was a large proportion of students with credits earned but a failing grade in the student data from Antioch, we recalculated credits earned assuming that each class indicated five credits attempted, with these credits awarded when students earned a non-failing course grade.
• Porterville could only provide prior achievement data for students who attended middle schools in the district, so in our student outcome analysis we could not include the approximately 50% of high school students who entered the district in high school from feeder districts. Additionally, the pathway flags submitted for Harmony Magnet—a wall-to-wall pathway school housing two certified pathways—did not identify which pathway students in the classes of 2014 and 2015 were enrolled. The evaluation team treated the entire school as a single certified pathway for the purposes of this analysis.
• Each district’s data contained some records where students were listed as attending a pathway not housed at their school of record. In such cases, we assumed the school assignment was correct and recoded the students’ pathway accordingly.
• Each district data set included a few more minor omissions. The evaluation team was unable to estimate models predicting the a-g on-track indicator in Sacramento because of issues with the course data file; in Antioch, Pasadena, Porterville and West Contra Costa, problems with the absence data prevented an analysis of this outcome. We detail the control variables included in each district in the methodology section.
In addition to these data issues, a few facets of Linked Learning implementation limited the analysis of outcomes in three districts:
• In both Oakland and West Contra Costa, pathways do not begin until 10th grade. Analyses in these districts therefore included only outcomes beginning in the 10th grade, limiting the sample in these districts to students from the class of 2014.
• Montebello has not yet put a pathway through certification, and the results for the certified pathways were therefore not included in the main analyses. The results for other program types are presented in this technical supplement.
In Exhibits 2-3 though 2-29, below, we display descriptive statistics for students in each district, both the overall mean for the district and the students enrolled in each pathway type. These tables present the sample sizes, means (for continuous variables) or percents (for dichotomous variables),
SRI International 11

and, for continuous variables, standard deviations for all students in the district, regardless of inclusion in the analytic sample. We provide these overall descriptive statistics to allow for an understanding of certified pathway enrollment in comparison to the district as a whole. The tables show student demographics, standardized test scores, and school achievement, respectively.
SRI International 12

Exhibit 2-3 Antioch Demographic Descriptive Statistics—Overall Sample
Overall
Certified Pathway
Non-Certified Pathway
Traditional High School
Alternative School
Na 3,210 354 345 2,376 135
% Class of 2013 49 46 30 53 44
% Class of 2014 51 54 70 47 56
% Class of 2015 0 0 0 0 0
% Female 50 64 46 48 48
% Low SES 52 47 39 54 58
% White 26 25 32 25 35
% Latino 34 38 28 35 30
% African American 26 16 28 27 29
% Asian Group 1b 8 14 10 8 0
% Asian Group 2c 4 6 2 4 4
% Other Race / Ethnicity 2 1 2 2 3
% Gifted and Talented 3 3 6 2 1
% Special Education 11 6 6 12 12
% English Language Learner 10 10 3 11 9 a Sample size will differ by cell. b Asian groups with higher than national average high school graduation rates. c Asian groups with lower than national average high school graduation rates.
SRI International 13

Exhibit 2-4 Antioch Standardized Testing Descriptive Statistics—Overall Sample
Overall Certified Pathway
Non-Certified Pathway
Traditional High School
Alternative School
Na 3,210 354 345 2,376 135
7th Grade ELA CST 340 360 364 334 315
SD (55) (52) (48) (55) (49) % Proficient or Higher, ELA CST 46 59 63 41 26
8th Grade ELA CST 342 364 366 336 311
SD (57) (55) (54) (56) (55) % Proficient or Higher, ELA CST 45 58 62 41 23
% Taking Algebra or Higher 37 49 53 34 12 9th Grade
ELA CST 351 376 373 345 311 SD (58) (49) (52) (58) (57)
% Proficient or Higher, ELA CST 54 72 68 50 26 10th Grade
ELA CST 340 355 359 336 309 SD (53) (50) (51) (53) (60)
% Proficient or Higher, ELA CST 44 55 64 40 30 Math CAHSEE 379 391 385 377 359
SD (37) (32) (39) (37) (30) % Passing, Math CAHSEE 78 92 81 75 61
ELA CAHSEE 382 397 393 379 368 SD (36) (30) (31) (37) (41)
% Passing, ELA CAHSEE 81 94 90 78 68 11th Grade
ELA CST - - - - - SD - - - - -
% Proficient or Higher, ELA CST - - - - - % Passing, EAP ELA - - - - -
a Sample size will differ by cell.
SRI International 14
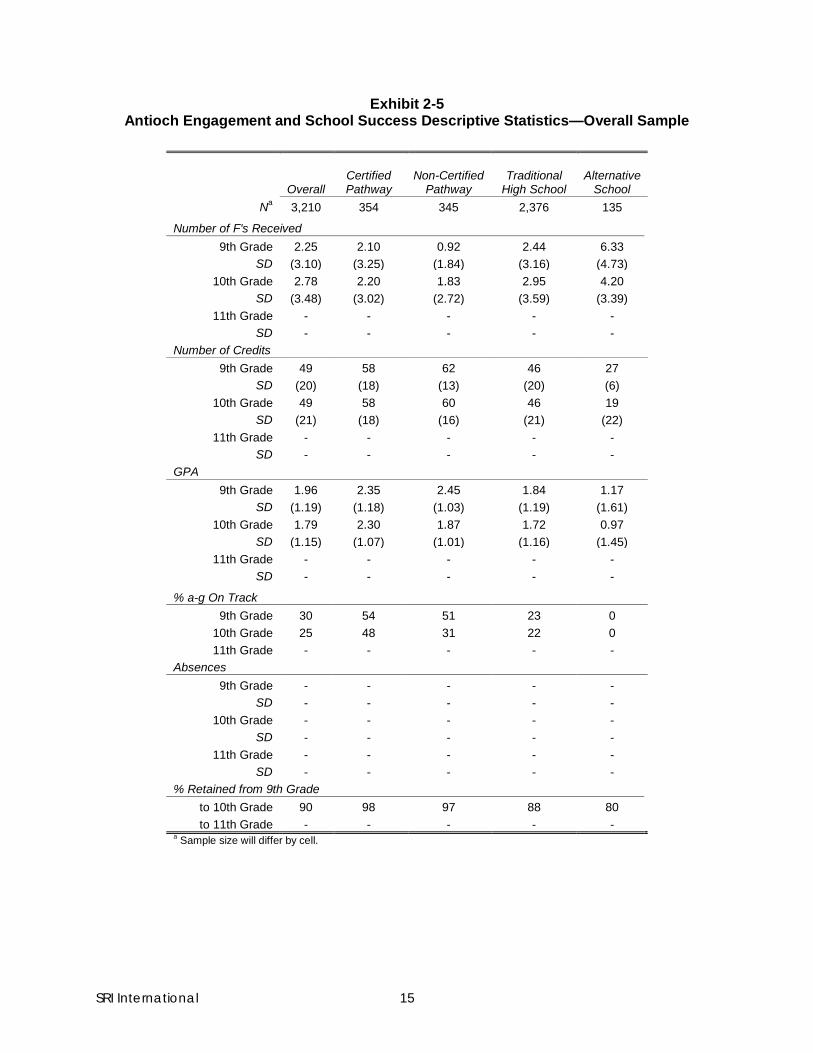
Exhibit 2-5 Antioch Engagement and School Success Descriptive Statistics—Overall Sample
Overall Certified Pathway
Non-Certified Pathway
Traditional High School
Alternative School
Na 3,210 354 345 2,376 135
Number of F's Received 9th Grade 2.25 2.10 0.92 2.44 6.33
SD (3.10) (3.25) (1.84) (3.16) (4.73) 10th Grade 2.78 2.20 1.83 2.95 4.20
SD (3.48) (3.02) (2.72) (3.59) (3.39) 11th Grade - - - - -
SD - - - - - Number of Credits
9th Grade 49 58 62 46 27 SD (20) (18) (13) (20) (6)
10th Grade 49 58 60 46 19 SD (21) (18) (16) (21) (22)
11th Grade - - - - - SD - - - - -
GPA 9th Grade 1.96 2.35 2.45 1.84 1.17
SD (1.19) (1.18) (1.03) (1.19) (1.61) 10th Grade 1.79 2.30 1.87 1.72 0.97
SD (1.15) (1.07) (1.01) (1.16) (1.45) 11th Grade - - - - -
SD - - - - -
% a-g On Track 9th Grade 30 54 51 23 0
10th Grade 25 48 31 22 0 11th Grade - - - - -
Absences 9th Grade - - - - -
SD - - - - - 10th Grade - - - - -
SD - - - - - 11th Grade - - - - -
SD - - - - - % Retained from 9th Grade
to 10th Grade 90 98 97 88 80 to 11th Grade - - - - -
a Sample size will differ by cell.
SRI International 15

Exhibit 2-6 Long Beach Demographic Descriptive Statistics—Overall Sample
Overall Certified Pathway
Non-Certified Pathway
IB/ Honors Program
Traditional High School
Alternative Schoola
Non-Pathway at Wall-to-Wall
Nb 20,167 1,809 8,988 1,987 3,463 2,715 1,205
% Class of 2013 34 34 39 36 32 22 28
% Class of 2014 33 33 32 37 36 30 34
% Class of 2015 32 33 28 27 32 48 38
% Female 50 53 49 62 51 45 40
% Low SES 73 60 77 48 64 93 77
% White 15 22 11 29 26 2 9
% Latino 52 51 51 38 50 68 48
% African American 17 12 20 9 12 21 27
% Asian Group 1c 11 12 12 19 8 5 7
% Asian Group 2d 4 2 5 5 3 4 6
% Other Race / Ethnicity 1 0 1 0 1 1 2
% Gifted and Talented - - - - - - -
% Special Education 8 2 7 1 7 9 36
% English Language Learner 19 5 18 4 17 36 36 a In Long Beach this primarily refers to Freshman Academies. b Sample size will differ by cell. c Asian groups with higher than national average high school graduation rates. d Asian groups with lower than national average high school graduation rates.
SRI International 16

Exhibit 2-7 Long Beach Standardized Testing Descriptive Statistics—Overall Sample
Overall
Certified Pathway
Non-Certified Pathway
IB/ Honors Program
Traditional High School
Alternative Schoola
Non-Pathway at Wall-to-Wall
Nb 20,167 1,809 8,988 1,987 3,463 2,715 1,205 7th Gradec
ELA CST 348 374 340 417 362 310 296 SD (59) (44) (50) (43) (59) (46) (60)
% Proficient or Higher, ELA CST 49 70 43 95 61 20 25 8th Graded
ELA CST 352 377 347 417 364 315 300 SD (62) (48) (54) (53) (63) (48) (63)
% Proficient or Higher, ELA CST 51 72 47 89 59 23 31 % Taking Algebra or Higher 31 39 30 57 32 20 9
9th Grade ELA CST 350 387 342 415 357 310 301
SD (61) (52) (51) (50) (62) (48) (56) % Proficient or Higher, ELA CST 50 76 45 91 57 21 26
10th Grade ELA CST 341 373 329 397 344 297 287
SD (59) (52) (52) (48) (60) (46) (50) % Proficient or Higher, ELA CST 45 66 35 87 48 15 21
Math CAHSEE 385 402 377 421 389 365 352 SD (36) (32) (33) (28) (36) (30) (35)
% Passing, Math CAHSEE 83 96 80 98 86 68 48 ELA CAHSEE 383 401 376 415 391 359 342
SD (36) (29) (32) (27) (36) (29) (38) % Passing, ELA CAHSEE 82 97 80 98 87 65 40
11th Grade ELA CST 342 371 324 399 349 296 279
SD (63) (55) (57) (49) (64) (51) (53) % Proficient or Higher, ELA CST 46 65 33 86 53 15 18
% Passing, EAP ELA 37 55 24 77 48 8 7 a In Long Beach this primarily refers to Freshman Academies. b Sample size will differ by cell. c 7th grade CST scores missing for Class of 2014 and Class of 2015. d 8th grade CST scores missing for Class of 2013.
SRI International 17

Exhibit 2-8 Long Beach Engagement and School Success Descriptive Statistics—Overall Sample
Overall Certified Pathway
Non-Certified Pathway
IB/ Honors Program
Traditional High School
Alternative Schoola
Non-Pathway at Wall-to-Wall
Nb 20,167 1,809 8,988 1,987 3,463 2,715 1,205
Number of F's Received 9th Grade 1.87 0.73 1.89 0.57 2.03 3.20 2.11
SD (2.83) (1.78) (2.69) (1.85) (3.23) (3.18) (2.84) 10th Grade 1.63 0.73 1.92 0.57 1.24 3.04 2.18
SD (2.66) (1.68) (2.78) (1.66) (2.30) (3.26) (3.20) 11th Grade 1.01 0.59 1.26 0.36 0.76 1.78 1.25
SD (1.94) (1.31) (2.08) (1.25) (1.61) (2.65) (2.35) Number of Credits
9th Grade 54 65 52 65 57 44 44 SD (17) (14) (16) (10) (19) (17) (19)
10th Grade 56 67 53 65 57 44 49 SD (16) (13) (16) (11) (15) (18) (19)
11th Grade 58 62 55 66 59 53 53 SD (14) (11) (14) (10) (11) (18) (17)
GPA 9th Grade 2.14 2.62 2.01 3.11 2.19 1.57 1.92
SD (1.14) (0.99) (1.05) (0.93) (1.20) (1.01) (1.20) 10th Grade 2.25 2.77 2.07 2.97 2.38 1.54 2.05
SD (1.06) (0.91) (1.01) (0.89) (1.00) (0.96) (1.13) 11th Grade 2.46 2.73 2.22 3.13 2.64 2.04 2.28
SD (0.92) (0.82) (0.87) (0.74) (0.85) (0.91) (1.00)
% a-g On Track 9th Grade 33 59 24 80 41 14 6
10th Grade 30 53 20 72 36 7 5 11th Grade 28 42 16 67 30 4 7
Absences 9th Grade 6.77 4.39 6.51 3.74 5.76 11.06 8.53
SD (9.46) (6.15) (8.81) (5.14) (7.60) (13.24) (11.47) 10th Grade 7.89 5.68 8.03 5.26 6.35 12.92 12.66
SD (10.65) (6.60) (10.57) (8.13) (7.75) (14.65) (16.04) 11th Grade 8.47 7.42 9.41 5.35 6.35 14.02 11.94
SD (11.03) (8.53) (11.55) (7.81) (7.25) (16.15) (17.91) % Retained from 9th Grade
to 10th Grade 93 97 93 97 93 87 84 to 11th Grade 93 94 87 93 83 75 79
a In Long Beach this primarily refers to Freshman Academies. b Sample size will differ by cell.
SRI International 18

Exhibit 2-9
Los Angeles Demographic Descriptive Statistics—Overall Sample
Overall Certified Pathway
Non-Certified Pathway
Traditional High School
Non-Pathway at Wall-to-Wall
Na 6,387 403 3,932 2,036 16
% Class of 2014 50 51 45 60 13
% Class of 2015 50 49 55 40 88
% Female 48 54 51 43 56
% Low SES 85 85 84 87 94
% White 2 0 3 2 0
% Latino 86 93 86 86 81
% African American 3 1 3 2 13
% Asian 8 5 8 10 0
% Other Race / Ethnicity 1 1 1 1 6
% Gifted and Talented 10 8 11 8 19
% Special Education 8 3 8 8 6
% English Language Learner 35 34 32 41 31 a Sample size will differ by cell.
SRI International 19

Exhibit 2-10 Los Angeles Standardized Testing Descriptive Statistics—Overall Sample
Overall Certified Pathway
Non-Certified Pathway
Traditional High School
Non-Pathway at Wall-to-Wall
Na 6,387 403 3,932 2,036 16
7th Grade ELA CST 320 321 322 316 313
SD (53) (50) (54) (50) (56) % Proficient or Higher, ELA CST 30 28 32 26 17
8th Grade ELA CST 324 322 327 318 303
SD (55) (51) (56) (52) (60) % Proficient or Higher, ELA CST 32 30 34 26 14
% Taking Algebra or Higher 66 70 67 65 57 9th Grade
ELA CST 330 332 334 320 310 SD (54) (47) (55) (51) (80)
% Proficient or Higher, ELA CST 36 36 39 30 21 10th Grade
ELA CST 335 332 338 328 - SD (50) (49) (52) (50) -
% Proficient or Higher, ELA CST 37 34 39 32 - Math CAHSEE 383 383 384 379 -
SD (34) (32) (34) (34) - % Passing, Math CAHSEE 82 86 83 79 -
ELA CAHSEE 375 377 377 370 - SD (33) (28) (33) (34) -
% Passing, ELA CAHSEE 79 83 82 74 - a Sample size will differ by cell.
SRI International 20

Exhibit 2-11 Los Angeles Engagement and School Success Descriptive Statistics—Overall Sample
Overall Certified Pathway
Non-Certified Pathway
Traditional High School
Non-Pathway at Wall-to-Wall
Na 6,387 403 3,932 2,036 16
Number of F's Received 9th Grade 2.36 0.86 2.53 2.31 5.50
SD (3.26) (1.80) (3.40) (3.12) (3.60) 10th Grade 1.60 0.89 1.81 1.56 -
SD (2.59) (1.96) (2.73) (2.47) - Number of Credits
9th Grade 57 70 57 55 36 SD (19) (16) (20) (18) (25)
10th Grade 63 68 61 60 - SD (15) (18) (17) (15) -
GPA 9th Grade 2.27 2.71 2.23 2.26 1.10
SD (1.02) (0.79) (1.03) (1.02) (0.89) 10th Grade 2.50 2.69 2.42 2.47 -
SD (0.92) (0.88) (0.93) (0.95) -
% a-g On Track 9th Grade 34 37 37 29 13
10th Grade 32 27 31 30 - Absences
9th Grade 7.75 4.87 7.66 8.39 18.94 SD (11.93) (6.48) (11.95) (12.57) (13.75)
10th Grade 8.36 5.60 8.06 10.02 - SD (12.99) (8.23) (11.91) (15.19) -
% Retained from 9th Grade
to 10th Grade 94 97 97 90 100 a Sample size will differ by cell.
SRI International 21

Exhibit 2-12
Montebello Demographic Descriptive Statistics—Overall Sample
Overall Non-Certified
Pathway Traditional
High School Alternative
School
Na 3,405 108 3,269 28
% Class of 2013 0 0 0 0
% Class of 2014 54 56 53 64
% Class of 2015 46 44 47 36
% Female 45 44 45 21
% Low SES 93 93 93 96
% White 2 3 2 0
% Latino 92 95 92 79
% African American 0 0 0 4
% Asian Group 1b 3 2 3 0
% Asian Group 2c 0 0 0 0
% Other Race / Ethnicity 2 0 2 18
% Gifted and Talented 10 8 10 0
% Special Education 11 7 11 25
% English Language Learner 25 21 25 48 a Sample size will differ by cell. b Asian groups with higher than national average high school graduation rates. c Asian groups with lower than national average high school graduation rates.
SRI International 22

Exhibit 2-13 Montebello Standardized Testing Descriptive Statistics—Overall Sample
Overall Non-Certified
Pathway Traditional
High School Alternative
School Na
3,405 108 3,269 28 7th Grade
ELA CST - - - - SD - - - -
% Proficient or Higher, ELA CST - - - - 8th Grade
ELA CST 336 351 336 282 SD (59) (55) (59) (41)
% Proficient or Higher, ELA CST 39 44 39 0 % Taking Algebra or Higher 24 34 23 7
9th Grade ELA CST 332 348 332 287
SD (58) (52) (58) (55) % Proficient or Higher, ELA CST 38.11 46.30 37.90 23.81
10th Grade ELA CST 329 335 329 258
SD (57) (48) (57) (37) % Proficient or Higher, ELA CST 36 36 37 0
Math CAHSEE 372 374 372 339 SD (37) (32) (37) (33)
% Passing, Math CAHSEE 70 80 69 40 ELA CAHSEE 369 375 369 315
SD (36) (29) (36) (31) % Passing, ELA CAHSEE 71 85 70 17
a Sample size will differ by cell.
SRI International 23

Exhibit 2-14 Montebello Engagement and School Success Descriptive Statistics—Overall Sample
Overall Non-Certified
Pathway Traditional
High School Alternative
School Na 3,405 108 3,269 28
Number of F's Received 9th Grade 2.27 0.76 2.33 1.36
SD (2.67) (1.21) (2.69) (1.86) 10th Grade 2.44 1.10 2.50 1.43
SD (2.52) (1.45) (2.55) (1.65) Number of Credits
9th Grade 30 22 30 6 SD (19) (15) (19) (10)
10th Grade 35 22 36 11 SD (21) (16) (21) (19)
GPA 9th Grade 1.58 1.74 1.57 0.83
SD (1.13) (1.07) (1.13) (1.09) 10th Grade 1.71 2.02 1.71 1.20
SD (1.06) (1.09) (1.06) (1.15)
% a-g On Track 9th Grade 12 11 13 0
10th Grade 11 4 12 0 Absences
9th Grade 8.47 5.71 8.61 0.00 SD (10.12) (5.93) (10.24) (0.00)
10th Grade 8.37 6.96 8.40 14.00 SD (9.95) (7.36) (9.97) (19.18)
% Retained from 9th Grade to 10th Grade 87 100 86 83
a Sample size will differ by cell.
SRI International 24

Exhibit 2-15 Oakland Demographic Descriptive Statistics—Overall Sample
Overall Certified Pathway
Non-Certified Pathway
Traditional High School
Alternative School
Na 1,990 158 1,014 758 60
% Class of 2013 0 0 0 0 0
% Class of 2014 100 100 100 100 100
% Class of 2015 0 0 0 0 0
% Female 48 54 50 46 40
% Low SES 84 92 84 83 93
% White 8 4 9 9 0
% Latino 33 56 37 23 33
% African American 37 27 31 45 55
% Asian Group 1b 11 7 11 13 0
% Asian Group 2c 10 6 12 8 5
% Other Race / Ethnicity 1 0 0 1 7
% Gifted and Talented 14 13 16 12 5
% Special Education 11 9 8 15 10
% English Language Learner 24 27 28 20 17 a Sample size will differ by cell. b Asian groups with higher than national average high school graduation rates. c Asian groups with lower than national average high school graduation rates.
SRI International 25

Exhibit 2-16 Oakland Standardized Testing Descriptive Statistics—Overall Sample
Overall
Certified Pathway
Non-Certified Pathway
Traditional High School
Alternative School
Na 1,990 158 1,014 758 60
7th Grade ELA CST - - - - -
SD - - - - - % Proficient or Higher, ELA CST - - - - -
8th Grade ELA CST 331 325 338 325 303
SD (62) (60) (63) (62) (54) % Proficient or Higher, ELA CST 37 30 41 35 23
% Taking Algebra or Higher 76 88 75 76 60 9th Grade
ELA CST 331 340 336 326 285 SD (64) (54) (65) (65) (45)
% Proficient or Higher, ELA CST 38 40 42 34 17 10th Grade
ELA CST 317 328 320 314 280 SD (61) (54) (63) (60) (46)
% Proficient or Higher, ELA CST 33 33 34 33 7 Math CAHSEE 372 373 377 366 345
SD (41) (40) (41) (41) (34) % Passing, Math CAHSEE 68 71 72 63 45
ELA CAHSEE 367 374 371 362 350 SD (40) (36) (40) (41) (33)
% Passing, ELA CAHSEE 68 80 72 62 50 11th Grade
ELA CST - - - - - SD - - - - -
% Proficient or Higher, ELA CST - - - - - % Passing, EAP ELA - - - - -
a Sample size will differ by cell.
SRI International 26

Exhibit 2-17 Oakland Engagement and School Success Descriptive Statistics—Overall Sample
Overall Certified Pathway
Non-Certified Pathway
Traditional High School
Alternative School
Na 1,990 158 1,014 758 60
Number of F's Received 9th Grade 2.08 2.15 1.74 2.38 4.74
SD (3.13) (3.11) (2.86) (3.36) (3.63) 10th Grade 2.41 3.06 2.02 2.87 1.23
SD (3.31) (3.71) (2.98) (3.59) (2.05) 11th Grade - - - - -
SD - - - - - Number of Credits
9th Grade 48 56 49 47 23 SD (18) (18) (17) (17) (16)
10th Grade 52 60 54 48 16 SD (20) (24) (17) (20) (15)
11th Grade - - - - - SD - - - - -
GPA 9th Grade 2.19 2.38 2.32 2.03 1.13
SD (1.20) (1.22) (1.20) (1.17) (0.94) 10th Grade 2.10 2.18 2.25 1.89 1.66
SD (1.17) (1.26) (1.14) (1.18) (0.90) 11th Grade - - - - -
SD - - - - -
% a-g On Track 9th Grade 39 50 42 33 8
10th Grade 30 31 34 26 4 11th Grade - - - - -
Absences 9th Grade 8.35 7.90 7.74 9.25 8.64
SD (12.63) (10.73) (12.26) (13.35) (13.81) 10th Grade 8.74 7.05 7.89 10.75 2.15
SD (13.26) (10.10) (11.03) (16.11) (12.96) 11th Grade - - - - -
SD - - - - - a Sample size will differ by cell.
SRI International 27

Exhibit 2-18 Pasadena Demographic Descriptive Statistics—Overall Sample
Overall Certified Pathway
Non-Certified Pathway
Traditional High School
Alternative School
Non-Pathway at Wall-to-Wall
Na 4,329 1,013 294 2,851 55 116
% Class of 2013 35 31 31 37 18 48
% Class of 2014 33 31 44 32 47 42
% Class of 2015 32 39 26 31 35 9
% Female 48 51 48 48 25 34
% Low SES 80 86 89 77 72 85
% White 12 7 4 15 9 3
% Latino 61 63 66 59 56 56
% African American 20 26 26 18 20 28
% Asian Group 1b 4 3 3 5 2 2
% Asian Group 2c 1 0 1 1 0 0
% Other Race / Ethnicity 2 1 0 2 13 12
% Gifted and Talented 12 7 6 15 2 1
% Special Education 10 9 9 9 24 35
% English Language Learner 15 18 15 14 26 19 a Sample size will differ by cell. b Asian groups with higher than national average high school graduation rates. c Asian groups with lower than national average high school graduation rates.
SRI International 28

Exhibit 2-19 Pasadena Standardized Testing Descriptive Statistics—Overall Sample
Overall
Certified Pathway
Non-Certified Pathway
Traditional High School
Alternative School
Non-Pathway at Wall-to-Wall
N 4,329 1,013 294 2,851 55 116 7th Grade
ELA CST 341 331 330 347 314 297 sd (59) (53) (52) (61) (63) (51)
% Proficient or Higher, ELA CST 44 36 34 49 26 28 8th Grade
ELA CST 345 334 334 352 307 302 sd (61) (57) (53) (62) (56) (60)
% Proficient or Higher, ELA CST 47 37 35 52 20 39 % Taking Algebra or Higher 50 50 53 52 25 15
9th Grade ELA CST 349 337 336 356 301 317
sd (59) (55) (55) (60) (57) (63) % Proficient or Higher, ELA CST 51 41 43 56 27 54
10th Grade ELA CST 342 330 330 349 275 310
sd (55) (51) (51) (55) (53) (55) % Proficient or Higher, ELA CST 45 35 38 50 12 55
Math CAHSEE 383 375 378 387 335 366 sd (36) (33) (33) (36) (37) (36)
% Passing, Math CAHSEE 81 78 81 83 13 63 ELA CAHSEE 382 376 372 385 330 358
sd (35) (34) (33) (35) (41) (44) % Passing, ELA CAHSEE 82 79 76 85 27 56
11th Grade ELA CST 338 322 313 346 332 311
sd (61) (57) (58) (61) (63) (65) % Proficient or Higher, ELA CST 43 29 27 48 50 53
% Passing, EAP ELA 32 21 21 37 - 25 a Sample size will differ by cell.
SRI International 29
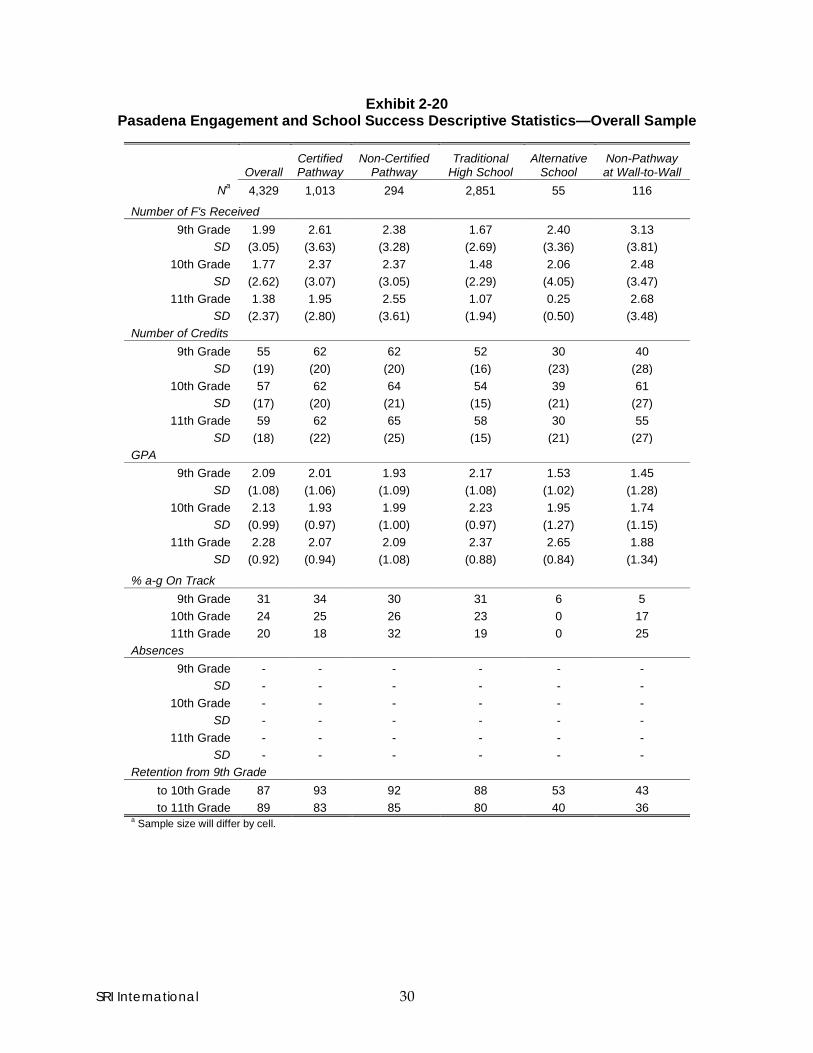
Exhibit 2-20 Pasadena Engagement and School Success Descriptive Statistics—Overall Sample
Overall Certified Pathway
Non-Certified Pathway
Traditional High School
Alternative School
Non-Pathway at Wall-to-Wall
Na 4,329 1,013 294 2,851 55 116
Number of F's Received 9th Grade 1.99 2.61 2.38 1.67 2.40 3.13
SD (3.05) (3.63) (3.28) (2.69) (3.36) (3.81) 10th Grade 1.77 2.37 2.37 1.48 2.06 2.48
SD (2.62) (3.07) (3.05) (2.29) (4.05) (3.47) 11th Grade 1.38 1.95 2.55 1.07 0.25 2.68
SD (2.37) (2.80) (3.61) (1.94) (0.50) (3.48) Number of Credits
9th Grade 55 62 62 52 30 40 SD (19) (20) (20) (16) (23) (28)
10th Grade 57 62 64 54 39 61 SD (17) (20) (21) (15) (21) (27)
11th Grade 59 62 65 58 30 55 SD (18) (22) (25) (15) (21) (27)
GPA 9th Grade 2.09 2.01 1.93 2.17 1.53 1.45
SD (1.08) (1.06) (1.09) (1.08) (1.02) (1.28) 10th Grade 2.13 1.93 1.99 2.23 1.95 1.74
SD (0.99) (0.97) (1.00) (0.97) (1.27) (1.15) 11th Grade 2.28 2.07 2.09 2.37 2.65 1.88
SD (0.92) (0.94) (1.08) (0.88) (0.84) (1.34)
% a-g On Track 9th Grade 31 34 30 31 6 5
10th Grade 24 25 26 23 0 17 11th Grade 20 18 32 19 0 25
Absences 9th Grade - - - - - -
SD - - - - - - 10th Grade - - - - - -
SD - - - - - - 11th Grade - - - - - -
SD - - - - - - Retention from 9th Grade
to 10th Grade 87 93 92 88 53 43 to 11th Grade 89 83 85 80 40 36
a Sample size will differ by cell.
SRI International 30

Exhibit 2-21 Porterville Demographic Descriptive Statistics—Overall Sample
Overall Certified Pathway
Non-Certified Pathway
Traditional High School
Alternative School
Non-Pathway at Wall-to-Walla
Nb 5,264 869 417 3,837 134 7
% Class of 2013 34 19 31 37 37 -
% Class of 2014 33 38 35 32 41 -
% Class of 2015 33 44 33 31 22 -
% Female 48 50 49 48 46 -
% Low SES 76 67 73 78 81 -
% White 21 23 24 19 34 -
% Latino 71 68 68 72 57 -
% African American 1 1 0 1 1 -
% Asian Group 1c 2 3 2 2 1 -
% Asian Group 2d 2 1 2 2 0 -
% Other Race / Ethnicity 4 3 3 4 7 -
% Gifted and Talented 4 7 4 3 1 -
% Special Education 4 1 3 5 6 -
% English Language Learner 19 10 14 21 17 - a Cell size less than ten, not reported. b Sample size will differ by cell. c Asian groups with higher than national average high school graduation rates. d Asian groups with lower than national average high school graduation rates.
SRI International 31

Exhibit 2-22 Porterville Standardized Testing Descriptive Statistics—Overall Sample
Overall
Certified Pathway
Non-Certified Pathway
Traditional High School
Alternative School
Non-Pathway at Wall-to-Walla
Nb 5,264 869 417 3,837 134 7 7th Grade
ELA CST 340 370 352 333 323 - SD (51) (49) (48) (50) (50) -
% Proficient or Higher, ELA CST 41 64 49 36 24 - 8th Grade
ELA CST 342 375 355 335 317 - SD (54) (51) (53) (52) (55) -
% Proficient or Higher, ELA CST 44 66 53 39 26 - % Taking Algebra or Higher 42 41 39 42 43 -
9th Grade ELA CST 347 375 361 338 324 -
SD (54) (49) (51) (53) (55) - % Proficient or Higher, ELA CST 49 68 64 42 31 -
10th Grade ELA CST 338 364 352 331 315 -
SD (51) (46) (47) (50) (49) - % Proficient or Higher, ELA CST 41 63 50 35 31 -
Math CAHSEE 381 402 388 376 354 - SD (35) (31) (30) (34) (33) -
% Passing, Math CAHSEE 82 97 91 79 51 - ELA CAHSEE 375 395 384 370 359 -
SD (34) (28) (31) (33) (32) - % Passing, ELA CAHSEE 80 95 89 75 58 -
11th Grade ELA CST 336 360 368 329 303 -
SD (53) (52) (47) (51) (44) - % Proficient or Higher, ELA CST 40 58 63 35 12 -
% Passing, EAP ELA 27 40 40 23 0 - a Cell size less than ten, not reported. b Sample size will differ by cell.
SRI International 32

Exhibit 2-23 Porterville Engagement and School Success Descriptive Statistics—Overall Sample
Overall Certified Pathway
Non-Certified Pathway
Traditional High School
Alternative School
Non-Pathway at Wall-to-Walla
Nb 5,264 869 417 3,837 134 7
Number of F's Received 9th Grade 1.52 0.59 0.96 1.77 2.41 -
SD (2.31) (1.26) (1.79) (2.45) (3.00) - 10th Grade 1.78 0.93 1.14 2.04 1.41 -
SD (2.58) (1.81) (1.87) (2.73) (2.24) - 11th Grade 1.09 0.89 0.69 1.17 0.77 -
SD (1.94) (1.84) (1.18) (2.01) (1.77) - Number of Credits
9th Grade 56 66 62 54 34 - SD (17) (8) (10) (17) (23) -
10th Grade 59 66 66 57 43 - SD (18) (10) (12) (18) (26) -
11th Grade 62 66 68 61 40 - SD (18) (12) (9) (18) (25) -
GPA 9th Grade 2.14 2.59 2.37 2.01 1.95 -
SD (0.99) (0.86) (0.89) (0.99) (1.07) - 10th Grade 2.03 2.46 2.23 1.91 2.35 -
SD (0.99) (0.92) (0.92) (0.99) (1.00) - 11th Grade 2.30 2.64 2.53 2.22 2.70 -
SD (0.84) (0.87) (0.84) (0.82) (0.69) -
% a-g On Track 9th Grade 25 46 33 19 7 -
10th Grade 21 40 21 18 12 - 11th Grade 17 36 21 15 4 -
Absences 9th Grade 5.44 3.68 6.08 5.76 7.57 -
SD (8.29) (4.52) (7.17) (9.01) (13.52) - 10th Grade 5.48 4.44 4.98 5.70 10.16 -
SD (8.14) (6.22) (5.74) (8.61) (13.01) - 11th Grade 5.52 3.68 4.80 5.83 7.20 -
SD (8.93) (4.83) (4.79) (9.63) (11.55) - % Retained from 9th Grade
to 10th Grade 90 97 97 89 67 - to 11th Grade 92 95 91 81 53 -
a Cell size less than ten, not reported. b Sample size will differ by cell.
SRI International 33

Exhibit 2-24 Sacramento Demographic Descriptive Statistics—Overall Sample
Overall Certified Pathway
Non-Certified Pathway
Traditional High School
Alternative Schoola
Nb 6,058 556 938 4,555 9
% Class of 2013 0 0 0 0 -
% Class of 2014 52 35 67 51 -
% Class of 2015 48 65 33 49 -
% Female 49 52 53 48 -
% Low SES 78 84 75 78 -
% White 20 21 26 18 -
% Latino 35 41 32 35 -
% African American 18 25 14 18 -
% Asian Group 1c 12 5 11 13 -
% Asian Group 2d 14 7 15 14 -
% Other Race / Ethnicity 2 2 2 2 -
% Gifted and Talented 15 7 14 16 -
% Special Education 11 9 8 11 -
% English Language Learner 21 20 22 21 - a Cell size less than ten, not reported. b Sample size will differ by cell. c Asian groups with higher than national average high school graduation rates. d Asian groups with lower than national average high school graduation rates.
SRI International 34
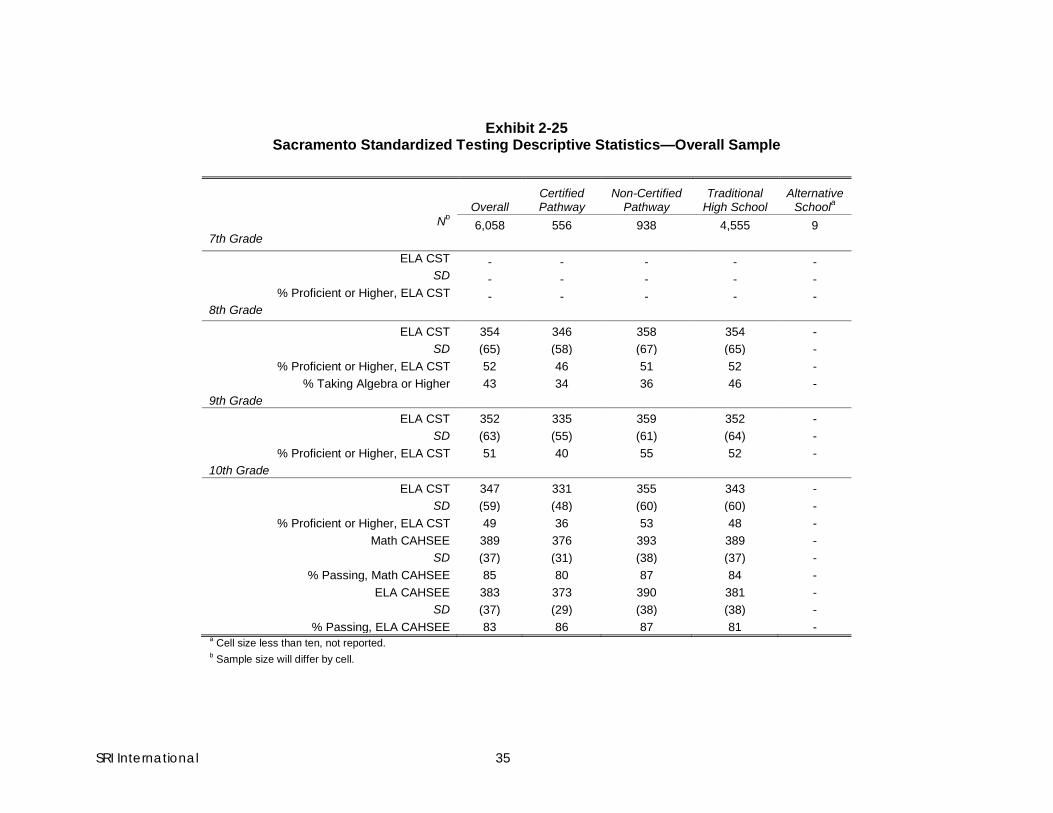
Exhibit 2-25
Sacramento Standardized Testing Descriptive Statistics—Overall Sample
Overall Certified Pathway
Non-Certified Pathway
Traditional High School
Alternative Schoola
Nb 6,058 556 938 4,555 9
7th Grade ELA CST - - - - -
SD - - - - - % Proficient or Higher, ELA CST - - - - -
8th Grade ELA CST 354 346 358 354 -
SD (65) (58) (67) (65) - % Proficient or Higher, ELA CST 52 46 51 52 -
% Taking Algebra or Higher 43 34 36 46 - 9th Grade
ELA CST 352 335 359 352 - SD (63) (55) (61) (64) -
% Proficient or Higher, ELA CST 51 40 55 52 - 10th Grade
ELA CST 347 331 355 343 - SD (59) (48) (60) (60) -
% Proficient or Higher, ELA CST 49 36 53 48 - Math CAHSEE 389 376 393 389 -
SD (37) (31) (38) (37) - % Passing, Math CAHSEE 85 80 87 84 -
ELA CAHSEE 383 373 390 381 - SD (37) (29) (38) (38) -
% Passing, ELA CAHSEE 83 86 87 81 - a Cell size less than ten, not reported. b Sample size will differ by cell.
SRI International 35

Exhibit 2-26 Sacramento Engagement and School Success Descriptive Statistics—Overall Sample
Overall Certified Pathway
Non-Certified Pathway
Traditional High School
Alternative Schoola
Nb 6,058 556 938 4,555 9
Number of F's Received 9th Grade 1.63 1.85 2.18 1.49 -
SD (2.65) (2.72) (2.99) (2.54) - 10th Grade 1.38 1.86 1.29 1.30 -
SD (2.38) (2.65) (2.32) (2.33) - Number of Credits
9th Grade 52 55 51 52 - SD (16) (18) (18) (16) -
10th Grade 55 54 57 53 - SD (15) (18) (16) (15) -
GPA 9th Grade 2.36 2.20 2.18 2.41 -
SD (1.13) (1.06) (1.21) (1.11) - 10th Grade 2.37 2.21 2.53 2.36 -
SD (1.03) (1.05) (1.05) (1.02) -
% a-g On Track 9th Grade 39 22 40 40 -
10th Grade - - - - - Absences
9th Grade 6.48 7.12 6.66 6.36 - SD (7.95) (8.58) (8.01) (7.85) -
10th Grade 6.47 7.93 5.72 6.89 - SD (8.02) (8.73) (7.15) (9.03) -
% Retained from 9th Grade to 10th Grade 86 89 87 85 -
a Cell size less than ten, not reported. b Sample size will differ by cell.
SRI International 36

Exhibit 2-27 West Contra Costa Demographic Descriptive Statistics—Overall Sample
Overall Certified Pathway
Non-Certified Pathway
Traditional High School
Alternative School
Na 1,862 218 603 973 68
% Class of 2013 0 0 0 0 0
% Class of 2014 100 100 100 100 100
% Class of 2015 0 0 0 0 0
% Female 47 31 56 46 46
% Low SES 76 98 84 66 88
% White 10 0 9 13 10
% Latino 47 84 52 35 49
% African American 23 6 21 27 32
% Asian Group 1b 11 5 8 15 3
% Asian Group 2c 9 4 10 10 4
% Other Race / Ethnicity 0 0 0 0 1
% Gifted and Talented 11 6 12 12 3
% Special Education 13 12 9 16 10
% English Language Learner 27 48 29 22 26 a Sample size will differ by cell. b Asian groups with higher than national average high school graduation rates. c Asian groups with lower than national average high school graduation rates
SRI International 37
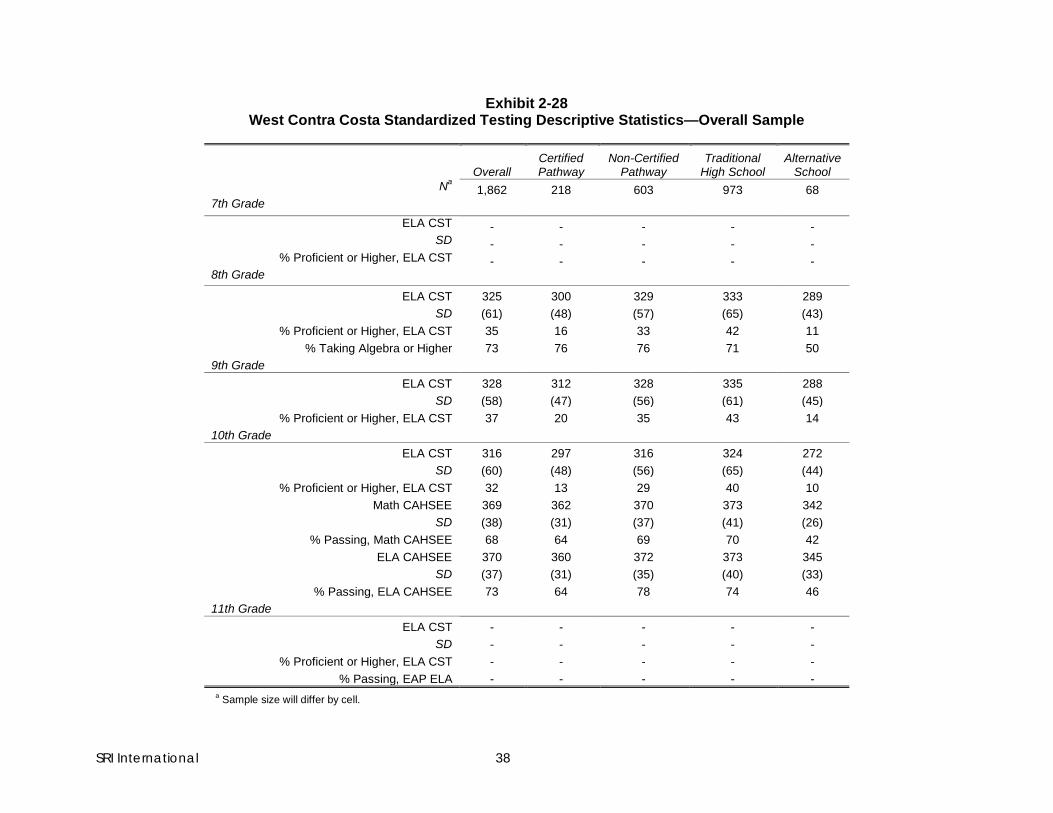
Exhibit 2-28 West Contra Costa Standardized Testing Descriptive Statistics—Overall Sample
Overall
Certified Pathway
Non-Certified Pathway
Traditional High School
Alternative School
Na 1,862 218 603 973 68
7th Grade ELA CST - - - - -
SD - - - - - % Proficient or Higher, ELA CST - - - - -
8th Grade ELA CST 325 300 329 333 289
SD (61) (48) (57) (65) (43) % Proficient or Higher, ELA CST 35 16 33 42 11
% Taking Algebra or Higher 73 76 76 71 50 9th Grade
ELA CST 328 312 328 335 288 SD (58) (47) (56) (61) (45)
% Proficient or Higher, ELA CST 37 20 35 43 14 10th Grade
ELA CST 316 297 316 324 272 SD (60) (48) (56) (65) (44)
% Proficient or Higher, ELA CST 32 13 29 40 10 Math CAHSEE 369 362 370 373 342
SD (38) (31) (37) (41) (26) % Passing, Math CAHSEE 68 64 69 70 42
ELA CAHSEE 370 360 372 373 345 SD (37) (31) (35) (40) (33)
% Passing, ELA CAHSEE 73 64 78 74 46 11th Grade
ELA CST - - - - - SD - - - - -
% Proficient or Higher, ELA CST - - - - - % Passing, EAP ELA - - - - -
a Sample size will differ by cell.
SRI International 38

Exhibit 2-29 West Contra Costa Engagement and School Success Descriptive Statistics—Overall
Sample
Overall Certified Pathway
Non-Certified Pathway
Traditional High School
Alternative School
Na 1,862 218 603 973 68
Number of F's Received 9th Grade 2.07 1.72 1.93 2.05 5.81
SD (2.84) (2.61) (2.65) (2.85) (3.19) 10th Grade 1.85 1.83 1.73 1.89 4.00
SD (2.76) (2.77) (2.58) (2.87) (1.90) 11th Grade - - - - -
SD - - - - - Number of Credits
9th Grade 50 52 52 50 23 SD (17) (14) (15) (18) (17)
10th Grade 51 51 54 50 11 SD (18) (14) (15) (19) (9)
11th Grade - - - - - SD - - - - -
GPA 9th Grade 2.11 2.09 2.17 2.14 0.72
SD (1.14) (1.02) (1.10) (1.17) (0.73) 10th Grade 2.09 2.04 2.11 2.12 0.52
SD (1.14) (1.04) (1.08) (1.18) (0.55) 11th Grade - - - - -
SD - - - - -
% a-g On Track 9th Grade 36 36 37 37 0
10th Grade 28 28 27 30 0 11th Grade - - - - -
Absences 9th Grade 8.28 7.88 6.74 16.18 18.85
SD (11.52) (10.77) (9.38) (17.94) (15.05) 10th Grade 11.16 11.44 12.31 10.28 -
SD (11.46) (11.60) (11.86) (11.08) - 11th Grade - - - - -
SD - - - - - a Sample size will differ by cell.
SRI International 39

Methodology In Chapter 6 of the report we present value-added estimates of certified pathway enrollment on students’ absences, retention in district, credit accumulation, course failures, a-g completion and standardized test scores. These value-added results estimate the extent to which students who enroll in Linked Learning certified pathways perform differently on these outcomes, on average, as compared to similar peers who enroll in other programs in the same district, accounting for the demographics and prior achievement of each student. In this section we describe the process by which we derived these estimates, beginning with how we determined the analytic sample of students for each outcome. We then present descriptive statistics by district for the analytic sample including demographics, prior achievement, and outcomes. Note that all descriptive statistics are based on the analytic sample for the models predicting 9th grade CST and, as such, will vary slightly for other 9th grade outcomes and significantly for models in 10th and 11th grade, which include fewer cohorts of students. Finally, we describe the methodology by which we estimated the value-added results and the estimates themselves.
Analytic Sample In all districts but Los Angeles, the analytic sample was determined by the number of cases with nonmissing values for all control variables and outcomes. In Los Angeles, an additional restriction applied: only high schools that were originally in Local District 4 and ended up in the innovation subdistrict were included, since the district reorganized during the period under study. Note that the analytic sample varied slightly among outcomes, even within the same district, for several reasons. When using retention in the district into the 10th grade as an outcome, the 10% or so of students who left the district between 9th and 10th grade were included in this model but not in any other 10th-grade outcomes. Additionally, the logistic models dropped some programs because of lack of variation in the outcome. Rather than exclude these programs from all analyses, we chose to allow the sample size of the estimates to vary slightly between models. We additionally dropped any programs with fewer than 10 students, as we deemed these programs too small to accurately estimate a value-added effect. We also dropped any non-pathway students in a wall-to-wall school.
In Exhibits 2-30 through 2-56 we present the descriptive statistics for the analytic sample used to predict the 9th grade CST scores. Note that the loss of students missing prior achievement scores in either the 7th and/or 8th grade drove the most dramatic differences between the overall district numbers and the analytic sample. The sample size changes most dramatically in Porterville, where we do not have middle school achievement data for students attending any of the feeder districts outside of Porterville Unified. The district does not provide this middle school achievement data from feeder districts to IEBC.
SRI International 40

Exhibit 2-30 Antioch Demographic Descriptive Statistics—Analytic Sample
Overall Certified Pathway
Non-Certified Pathway
Traditional High School
Alternative School
na 2,064 267 258 1,490 49
% Class of 2013 48 44 26 52 49
% Class of 2014 52 56 74 48 51
% Class of 2015 0 0 0 0 0
% Female 50 63 43 49 49
% Low SES 54 51 40 57 69
% White 27 21 29 27 45
% Latino 38 42 30 39 33
% African American 20 16 26 20 14
% Asian Group 1b 10 14 11 9 0
% Asian Group 2c 4 6 2 4 6
% Other Race / Ethnicity 2 2 2 2 2
% Gifted and Talented 4 4 7 3 0
% Special Education 3 2 2 3 0
% English Language Learner 10 9 3 11 14 a Reported sample sizes refer to models predicting 9th grade CST scores. The sample sizes will vary for other grades, which may not include all cohorts. b Asian groups with higher than national average high school graduation rates. c Asian groups with lower than national average high school graduation rates.
SRI International 41

Exhibit 2-31 Antioch Standardized Testing Descriptive Statistics—Analytic Sample
Overall
Certified Pathway
Non-Certified Pathway
Traditional High School
Alternative School
na 2,064 267 258 1,490 49 7th Grade
ELA CST 346 363 366 340 323 SD (52) (50) (45) (52) (43)
% Proficient or Higher, ELA CST 49 60 65 44 27 8th Grade
ELA CST 348 366 371 342 318 SD (56) (55) (52) (55) (58)
% Proficient or Higher, ELA CST 48 60 66 44 24 % Taking Algebra or Higher 52 62 67 49 27
9th Grade ELA CST 359 376 374 354 325
SD (55) (49) (50) (55) (49) % Proficient or Higher, ELA CST 59 74 70 55 24
10th Grade ELA CST 344 359 364 340 314
SD (52) (45) (47) (53) (51) % Proficient or Higher, ELA CST 47 59 68 43 29
Math CAHSEE 386 395 391 384 369 SD (35) (30) (34) (36) (25)
% Passing, Math CAHSEE 85 96 89 83 77 ELA CAHSEE 390 401 399 388 382
SD (32) (28) (27) (32) (35) % Passing, ELA CAHSEE 88 96 95 87 85
11th Grade ELA CST - - - - -
SD - - - - - % Proficient or Higher, ELA CST - - - - -
% Passing, EAP ELA - - - - - a Reported sample sizes refer to models predicting 9th grade CST scores. The sample sizes will vary for other grades, which may not include all cohorts.
SRI International 42

Exhibit 2-32 Antioch Engagement and School Success Descriptive Statistics—Analytic Sample
Overall Certified Pathway
Non-Certified Pathway
Traditional High School
Alternative School
na 2,064 267 258 1,490 49
Number of F's Received 9th Grade 1.99 1.91 0.96 2.17 1.00
SD (2.98) (3.03) (1.92) (3.08) 10th Grade 2.56 2.11 1.67 2.72 3.20
SD (3.42) (2.91) (2.61) (3.56) (3.27) 11th Grade - - - - -
SD - - - - - Number of Credits
9th Grade 53 59 63 50 30 SD (18) (17) (11) (18)
10th Grade 51 58 61 49 33 SD (20) (17) (14) (20) (23)
11th Grade - - - - - SD - - - - -
GPA 9th Grade 2.10 2.39 2.44 1.99 3.00
SD (1.17) (1.13) (1.01) (1.18) 10th Grade 1.91 2.34 1.93 1.84 1.73
SD (1.14) (1.01) (0.99) (1.16) (1.76) 11th Grade - - - - -
SD - - - - -
% a-g On Track 9th Grade 36 56 51 30 0
10th Grade 30 49 27 28 0 11th Grade - - - - -
Absences 9th Grade - - - - -
SD - - - - - 10th Grade - - - - -
SD - - - - - 11th Grade - - - - -
SD - - - - - % Retained from 9th Grade
to 10th Grade 92 97 99 91 83 to 11th Grade - - - - -
a Reported sample sizes refer to models predicting 9th grade CST scores. The sample sizes will vary for other grades, which may not include all cohorts.
SRI International 43

Exhibit 2-33 Long Beach Demographic Descriptive Statistics—Analytic Sample
Overall Certified Pathway
Non-Certified Pathway
IB/ Honors Program
Traditional High School
Alternative Schoola
nb 15,449 1,309 7,552 1,758 2,819 2,011
% Class of 2013 35 34 40 36 32 19
% Class of 2014 32 31 31 36 35 28
% Class of 2015 33 35 29 28 33 52
% Female 51 54 49 61 51 43
% Low SES 74 64 79 51 65 96
% White 16 25 11 28 27 2
% Latino 54 56 52 39 52 73
% African American 15 10 19 8 10 17
% Asian Group 1c 11 7 13 19 8 5
% Asian Group 2d 4 2 5 5 3 4
% Other Race / Ethnicity 0 0 0 0 1 0
% Gifted and Talented - - - - - -
% Special Education 6 3 7 1 6 10
% English Language Learner 18 7 18 4 16 39 a In Long Beach this primarily refers to Freshman Academies. b Reported sample sizes refer to models predicting 9th grade CST scores. The sample sizes will vary for other grades, which may not include all cohorts. c Asian groups with higher than national average high school graduation rates. d Asian groups with lower than national average high school graduation rates.
SRI International 44

Exhibit 2-34 Long Beach Standardized Testing Descriptive Statistics—Analytic Sample
2
Overall
Certified Pathway
Non-Certified Pathway
IB/ Honors Program
Traditional High School
Alternative Schoola
nb 15,449 1,309 7,552 1,758 2,819 2,011 7th Gradec
ELA CST 352 374 341 417 364 311 SD (57) (45) (50) (43) (59) (47)
% Proficient or Higher, ELA CST 51 70 43 95 61 20 8th Graded
ELA CST 357 377 348 418 365 316 SD (60) (48) (53) (52) (63) (47)
% Proficient or Higher, ELA CST 53 72 48 90 60 22 % Taking Algebra or Higher 38 51 33 62 38 24
9th Grade ELA CST 353 374 342 415 361 310
SD (59) (47) (51) (50) (61) (47) % Proficient or Higher, ELA CST 52 69 45 91 59 20
10th Grade ELA CST 343 360 329 396 347 295
SD (57) (46) (51) (49) (59) (43) % Proficient or Higher, ELA CST 46 58 36 87 50 13
Math CAHSEE 387 394 377 422 391 364 SD (35) (29) (32) (28) (35) (28)
% Passing, Math CAHSEE 85 95 81 98 87 68 ELA CAHSEE 385 394 376 415 393 359
SD (35) (26) (32) (27) (36) (28) % Passing, ELA CAHSEE 84 96 80 98 88 65
11th Grade ELA CST 344 359 323 398 352 298
SD (61) (54) (57) (49) (62) (49) % Proficient or Higher, ELA CST 47 57 33 85 55 15
% Passing, EAP ELA 37 46 23 77 48 7 a In Long Beach this primarily refers to Freshman Academies. b Reported sample sizes refer to models predicting 9th grade CST scores. The sample sizes will vary for other grades, which may not include all cohorts. c 7th grade CST scores missing for Class of 2014 and Class of 2015. d 8th grade CST scores missing for Class of 2013.
SRI International 45

Exhibit 2-35 Long Beach Engagement and School Success Descriptive Statistics—Analytic Sample
Overall Certified Pathway
Non-Certified Pathway
IB/ Honors Program
Traditional High School
Alternative Schoola
nb 15,449 1,309 7,552 1,758 2,819 2,011
Number of F's Received 9th Grade 1.80 0.84 1.82 0.55 1.89 3.26
SD (2.76) (1.89) (2.62) (1.81) (3.09) (3.19) 10th Grade 1.59 0.92 1.91 0.56 1.14 3.11
SD (2.60) (1.88) (2.77) (1.61) (2.19) (3.24) 11th Grade 1.00 0.68 1.28 0.38 0.72 1.75
SD (1.92) (1.37) (2.11) (1.29) (1.57) (2.59) Number of Credits
9th Grade 55 63 52 65 58 44 SD (17) (14) (16) (10) (18) (17)
10th Grade 56 64 53 65 58 43 SD (16) (13) (16) (11) (15) (17)
11th Grade 58 61 55 66 59 53 SD (13) (12) (15) (10) (11) (17)
GPA 9th Grade 2.16 2.47 2.02 3.11 2.24 1.55
SD (1.12) (0.97) (1.04) (0.92) (1.19) (0.98) 10th Grade 2.25 2.58 2.07 2.96 2.41 1.48
SD (1.04) (0.90) (1.00) (0.89) (0.99) (0.92) 11th Grade 2.45 2.59 2.21 3.11 2.67 2.03
SD (0.91) (0.81) (0.87) (0.75) (0.83) (0.89)
% a-g On Track 9th Grade 35 53 24 80 43 13
10th Grade 31 41 19 72 37 6 11th Grade 27 29 16 67 31 4
Absences 9th Grade 6.40 4.71 6.24 3.64 5.47 10.60
SD (8.87) (6.51) (8.33) (5.11) (6.82) (12.92) 10th Grade 7.49 5.96 7.89 5.29 6.03 12.74
SD (10.04) (7.10) (10.32) (8.11) (7.30) (14.73) 11th Grade 8.09 7.37 9.26 5.43 6.16 12.07
SD (10.20) (8.78) (11.49) (7.95) (6.88) (12.16) % Retained from 9th Grade
to 10th Grade 94 97 94 97 95 90 to 11th Grade 94 94 89 94 87 79
a In Long Beach this primarily refers to Freshman Academies. b Reported sample sizes refer to models predicting 9th grade CST scores. The sample sizes will vary for other grades, which may not include all cohorts.
SRI International 46

Exhibit 2-36 Los Angeles Demographic Descriptive Statistics—Analytic Sample
Overall Certified Pathway
Non-Certified Pathway
Traditional High School
na 6,371 403 3,932 2,036
% Class of 2014 50 51 45 60
% Class of 2015 50 49 55 40
% Female 48 54 51 43
% Low SES 85 85 84 87
% White 2 0 3 2
% Latino 86 93 86 86
% African American 3 1 3 2
% Asian 8 5 8 10
% Other Race / Ethnicity 1 1 1 1
% Gifted and Talented 10 8 11 8
% Special Education 8 3 8 8
% English Language Learner 35 34 32 41 a Reported sample sizes refer to models predicting 9th grade CST scores. The sample sizes will vary for other
grades, which may not include all cohorts.
SRI International 47

Exhibit 2-37 Los Angeles Standardized Testing Descriptive Statistics—Analytic Sample
Overall Certified Pathway
Non-Certified Pathway
Traditional High School
na 6,371 403 3,932 2,036
7th Grade
ELA CST 320 321 322 316
SD (53) (50) (54) (50)
% Proficient or Higher, ELA CST 30 28 32 26
8th Grade
ELA CST 324 322 327 318
SD (55) (51) (56) (52)
% Proficient or Higher, ELA CST 32 30 34 26
% Taking Algebra or Higher 66 70 67 65
9th Grade
ELA CST 330 332 334 320
SD (54) (47) (55) (51)
% Proficient or Higher, ELA CST 36 36 39 30
10th Grade
ELA CST 335 332 338 328
SD (50) (49) (52) (50)
% Proficient or Higher, ELA CST 37 34 39 32
Math CAHSEE 383 383 384 379
SD (34) (32) (34) (34)
% Passing, Math CAHSEE 82 86 83 79
ELA CAHSEE 375 377 377 370
SD (33) (28) (33) (34)
% Passing, ELA CAHSEE 79 83 82 74 a Reported sample sizes refer to models predicting 9th grade CST scores. The sample sizes will vary for other grades, which may not include all cohorts.
SRI International 48

Exhibit 2-38 Los Angeles Engagement and School Success Descriptive Statistics—Analytic Sample
Overall Certified Pathway
Non-Certified Pathway
Traditional High School
na 6,371 403 3,932 2,036
Number of F's Received
9th Grade 2.35 0.86 2.53 2.31
SD (3.26) (1.80) (3.40) (3.12)
10th Grade 1.60 0.89 1.81 1.56
SD (2.59) (1.96) (2.73) (2.47)
Number of Credits
9th Grade 57 70 57 55
SD (19) (16) (20) (18)
10th Grade 63 68 61 60
SD (15) (18) (17) (15)
GPA
9th Grade 2.27 2.71 2.23 2.26
SD (1.02) (0.79) (1.03) (1.02)
10th Grade 2.50 2.69 2.42 2.47
SD (0.92) (0.88) (0.93) (0.95)
% a-g On Track
9th Grade 34 37 37 29
10th Grade 32 27 31 30
Absences
9th Grade 7.72 4.87 7.66 8.39
SD (11.91) (6.48) (11.95) (12.57)
10th Grade 8.36 5.60 8.06 10.02
SD (12.99) (8.23) (11.91) (15.19)
% Retained from 9th Grade
to 10th Grade 94 97 97 90 a Reported sample sizes refer to models predicting 9th grade CST scores. The sample sizes will vary for other grades, which may not include all cohorts.
SRI International 49

Exhibit 2-39
Montebello Demographic Descriptive Statistics—Analytic Sample
Overall Non-Certified
Pathway Traditional
High School Alternative
Schoola
nb 2,484 94 2,384 6
% Class of 2013 0 0 0 -
% Class of 2014 53 56 52 -
% Class of 2015 47 44 48 -
% Female 46 41 46 -
% Low SES 94 93 95 -
% White 2 3 2 -
% Latino 94 95 94 -
% African American 0 0 0 -
% Asian Group 1c 3 2 3 -
% Asian Group 2d 0 0 0 -
% Other Race / Ethnicity 0 0 0 -
% Gifted and Talented 13 10 13 -
% Special Education 10 4 10 -
% English Language Learner 23 18 23 - a Cell size less than ten, not reported. b Reported sample sizes refer to models predicting 9th grade CST scores. The sample sizes will vary for other grades, which may not include all cohorts. c Asian groups with higher than national average high school graduation rates. d Asian groups with lower than national average high school graduation rates.
SRI International 50

Exhibit 2-40
Montebello Standardized Testing Descriptive Statistics—Analytic Sample
Overall Non-Certified
Pathway Traditional
High School Alternative
Schoola
nb 2,484 94 2,384 6
7th Grade ELA CST - - - -
SD - - - - % Proficient or Higher, ELA CST - - - -
8th Grade ELA CST 337 350 337 -
SD (59) (54) (59) - % Proficient or Higher, ELA CST 39 43 39 -
% Taking Algebra or Higher 31 38 31 - 9th Grade
ELA CST 336 351 335 - SD (58) (52) (58) -
% Proficient or Higher, ELA CST 40 48 40 - 10th Grade
ELA CST 331 337 331 - SD (57) (45) (58) -
% Proficient or Higher, ELA CST 38 38 38 - Math CAHSEE 374 377 374 -
SD (37) (31) (37) - % Passing, Math CAHSEE 72 85 71 -
ELA CAHSEE 372 378 371 - SD (35) (27) (36) -
% Passing, ELA CAHSEE 73 90 72 - a Cell size less than ten, not reported. b Reported sample sizes refer to models predicting 9th grade CST scores. The sample sizes will vary for other grades, which may not include all cohorts.
SRI International 51

Exhibit 2-41 Montebello Engagement and School Success Descriptive Statistics—Analytic Sample
Overall Non-Certified
Pathway Traditional
High School Alternative
Schoola
nb 2,484 94 2,384 6
Number of F's Received 9th Grade 2.41 0.66 2.48 -
SD (2.71) (1.04) (2.73) - 10th Grade 2.47 1.06 2.54 -
SD (2.53) (1.35) (2.55) - Number of Credits
9th Grade 32 22 33 - SD (19) (16) (19) -
10th Grade 36 22 37 - SD (20) (16) (20) -
GPA 9th Grade 1.59 1.75 1.59 -
SD (1.12) (1.09) (1.12) - 10th Grade 1.73 2.02 1.72 -
SD (1.05) (1.08) (1.05) -
% a-g On Track 9th Grade 14 13 14 -
10th Grade 13 4 13 - Absences
9th Grade 8.20 5.43 8.33 - SD (9.63) (5.94) (9.75) -
10th Grade 8.34 6.51 8.44 - SD (10.10) (7.08) (10.24) -
% Retained from 9th Grade to 10th Grade 92 100 92 -
a Cell size less than ten, not reported. b Reported sample sizes refer to models predicting 9th grade CST scores. The sample sizes will vary for other grades, which may not include all cohorts.
SRI International 52

Exhibit 2-42 Oakland Demographic Descriptive Statistics—Analytic Sample
Overall Certified Pathway
Non-Certified Pathway
Traditional High School
Alternative School
na 1,358 123 692 526 17
% Class of 2013 0 0 0 0 0
% Class of 2014 100 100 100 100 100
% Class of 2015 0 0 0 0 0
% Female 50 55 53 47 35
% Low SES 86 93 86 84 94
% White 8 3 8 9 0
% Latino 36 62 40 25 35
% African American 32 24 27 40 59
% Asian Group 1b 13 5 13 14 0
% Asian Group 2c 11 7 13 11 0
% Other Race / Ethnicity 0 0 0 1 6
% Gifted and Talented 18 15 20 16 18
% Special Education 5 3 3 8 0
% English Language Learner 22 26 24 18 12 a Reported sample sizes refer to models predicting 9th grade CST scores. The sample sizes will vary for other grades, which may not include all cohorts. b Asian groups with higher than national average high school graduation rates. c Asian groups with lower than national average high school graduation rates.
SRI International 53

Exhibit 2-43 Oakland Standardized Testing Descriptive Statistics—Analytic Sample
Overall
Certified Pathway
Non-Certified Pathway
Traditional High School
Alternative School
na 1,358 123 692 526 17 7th Grade
ELA CST - - - - - SD - - - - -
% Proficient or Higher, ELA CST - - - - - 8th Grade
ELA CST 337 333 342 331 322 SD (61) (58) (61) (61) (49)
% Proficient or Higher, ELA CST 40 34 42 37 29 % Taking Algebra or Higher 97 99 98 95 100
9th Grade ELA CST 338 341 343 332 301
SD (62) (51) (62) (64) (49) % Proficient or Higher, ELA CST 41 40 45 36 18
10th Grade ELA CST 324 330 327 319 301
SD (60) (54) (61) (60) (55) % Proficient or Higher, ELA CST 35 33 37 34 15
Math CAHSEE 377 379 382 371 355 SD (40) (37) (39) (40) (40)
% Passing, Math CAHSEE 74 78 79 67 58 ELA CAHSEE 373 379 377 367 362
SD (37) (32) (36) (39) (38) % Passing, ELA CAHSEE 76 87 79 69 67
11th Grade ELA CST - - - - -
SD - - - - - % Proficient or Higher, ELA CST - - - - -
% Passing, EAP ELA - - - - - a Reported sample sizes refer to models predicting 9th grade CST scores. The sample sizes will vary for other grades, which may not
include all cohorts.
SRI International 54

Exhibit 2-44 Oakland Engagement and School Success Descriptive Statistics—Analytic Sample
Overall Certified Pathway
Non-Certified Pathway
Traditional High School
Alternative School
na 1,358 123 692 526 17
Number of F's Received 9th Grade 1.82 1.85 1.49 2.18 6.43
SD (2.82) (2.72) (2.53) (3.09) (3.36) 10th Grade 2.35 2.95 1.86 2.87 3.00
SD (3.27) (3.67) (2.84) (3.61) (2.94) 11th Grade - - - - -
SD - - - - - Number of Credits
9th Grade 51 59 52 49 27 SD (16) (15) (15) (16) (15)
10th Grade 53 62 56 49 8 SD (19) (24) (16) (20) (7)
11th Grade - - - - - SD - - - - -
GPA 9th Grade 2.29 2.49 2.44 2.07 0.73
SD (1.16) (1.13) (1.15) (1.14) (0.56) 10th Grade 2.15 2.24 2.32 1.90 0.71
SD (1.16) (1.24) (1.10) (1.17) (0.89) 11th Grade - - - - -
SD - - - - -
% a-g On Track 9th Grade 45 54 48 38 0
10th Grade 35 33 39 31 0 11th Grade - - - - -
Absences 9th Grade 7.01 7.41 6.28 7.86 7.31
SD (9.51) (10.34) (8.16) (10.70) (13.05) 10th Grade 7.83 6.17 6.87 9.77 0.00
SD (12.19) (7.52) (9.73) (15.58) (0.00) 11th Grade - - - - -
SD - - - - - a Reported sample sizes refer to models predicting 9th grade CST scores. The sample sizes will vary for other grades, which may not include all cohorts.
SRI International 55

Exhibit 2-45 Pasadena Demographic Descriptive Statistics—Analytic Sample
Overall Certified Pathway
Non-Certified Pathway
Traditional High School
Alternative School
na 3,027 722 223 2,064 18
% Class of 2013 33 28 29 35 11
% Class of 2014 33 32 45 32 61
% Class of 2015 34 40 26 33 28
% Female 51 53 53 50 28
% Low SES 83 89 88 80 78
% White 10 6 3 13 11
% Latino 66 68 69 66 72
% African American 18 23 25 16 11
% Asian Group 1b 4 2 3 5 6
% Asian Group 2c 0 0 0 1 0
% Other Race / Ethnicity 0 0 0 0 0
% Gifted and Talented 17 9 9 20 6
% Special Education 6 6 5 6 6
% English Language Learner 14 18 12 12 28 a Reported sample sizes refer to models predicting 9th grade CST scores. The sample sizes will vary for other grades, which may not include all cohorts. b Asian groups with higher than national average high school graduation rates. c Asian groups with lower than national average high school graduation rates.
SRI International 56

Exhibit 2-46 Pasadena Standardized Testing Descriptive Statistics—Analytic Sample
Overall
Certified Pathway
Non-Certified Pathway
Traditional High School
Alternative School
na 3,027 722 223 2064 18 7th Grade
ELA CST 345 334 335 350 328 sd (58) (53) (51) (60) (54)
% Proficient or Higher, ELA CST 46 38 37 50 28 8th Grade
ELA CST 349 338 337 354 329 sd (60) (55) (54) (61) (47)
% Proficient or Higher, ELA CST 48 39 38 53 28 % Taking Algebra or Higher 66 65 63 67 61
9th Grade ELA CST 354 340 340 361 332
sd (58) (54) (54) (58) (53) % Proficient or Higher, ELA CST 53 43 46 58 45
10th Grade ELA CST 347 334 335 353 307
sd (53) (49) (48) (53) (53) % Proficient or Higher, ELA CST 48 38 40 52 22
Math CAHSEE 387 380 381 390 353 sd (35) (32) (32) (35) (48)
% Passing, Math CAHSEE 86 84 85 87 29 ELA CAHSEE 386 380 377 389 361
sd (32) (31) (28) (33) (35) % Passing, ELA CAHSEE 87 85 83 88 57
11th Grade ELA CST 344 330 321 350 332
sd (60) (54) (53) (61) (63) % Proficient or Higher, ELA CST 45 35 30 49 50
% Passing, EAP ELA 34 24 22 38 -
a Reported sample sizes refer to models predicting 9th grade CST scores. The sample sizes will vary for other grades, which may not include all cohorts.
SRI International 57

Exhibit 2-47 Pasadena Engagement and School Success Descriptive Statistics—Analytic Sample
Overall Certified Pathway
Non-Certified Pathway
Traditional High School
Alternative School
na 3,027 722 223 2064 18
Number of F's Received 9th Grade 1.79 2.44 2.16 1.51 2.89
SD (2.86) (3.47) (3.01) (2.55) (2.68) 10th Grade 1.66 2.25 2.09 1.42 2.20
SD (2.53) (2.99) (2.90) (2.26) (3.97) 11th Grade 1.32 1.80 2.37 1.09 0.50
SD (2.34) (2.82) (3.43) (2.00) (0.71)
Number of Credits 9th Grade 56 64 63 53 31
SD (17) (19) (20) (14) (17) 10th Grade 57 63 67 55 35
SD (16) (18) (18) (14) (14) 11th Grade 60 64 66 58 48
SD (17) (20) (24) (14) (4) GPA
9th Grade 2.17 2.05 1.99 2.23 1.52 SD (1.04) (1.02) (1.07) (1.04) (1.04)
10th Grade 2.18 1.97 2.09 2.26 1.82 SD (0.97) (0.95) (0.97) (0.96) (1.28)
11th Grade 2.31 2.13 2.12 2.37 2.80 SD (0.89) (0.92) (1.07) (0.86) (0.08)
% a-g On Track 9th Grade 33 35 31 33 11
10th Grade 25 26 28 24 0 11th Grade 21 20 33 20 0
Absences 9th Grade - - - - -
SD - - - - - 10th Grade - - - - -
SD - - - - - 11th Grade - - - - -
SD - - - - - Retention from 9th Grade
to 10th Grade 94 96 93 94 77 to 11th Grade 92 88 88 87 100
a Reported sample sizes refer to models predicting 9th grade CST scores. The sample sizes will vary for other grades, which may not include all cohorts.
SRI International 58
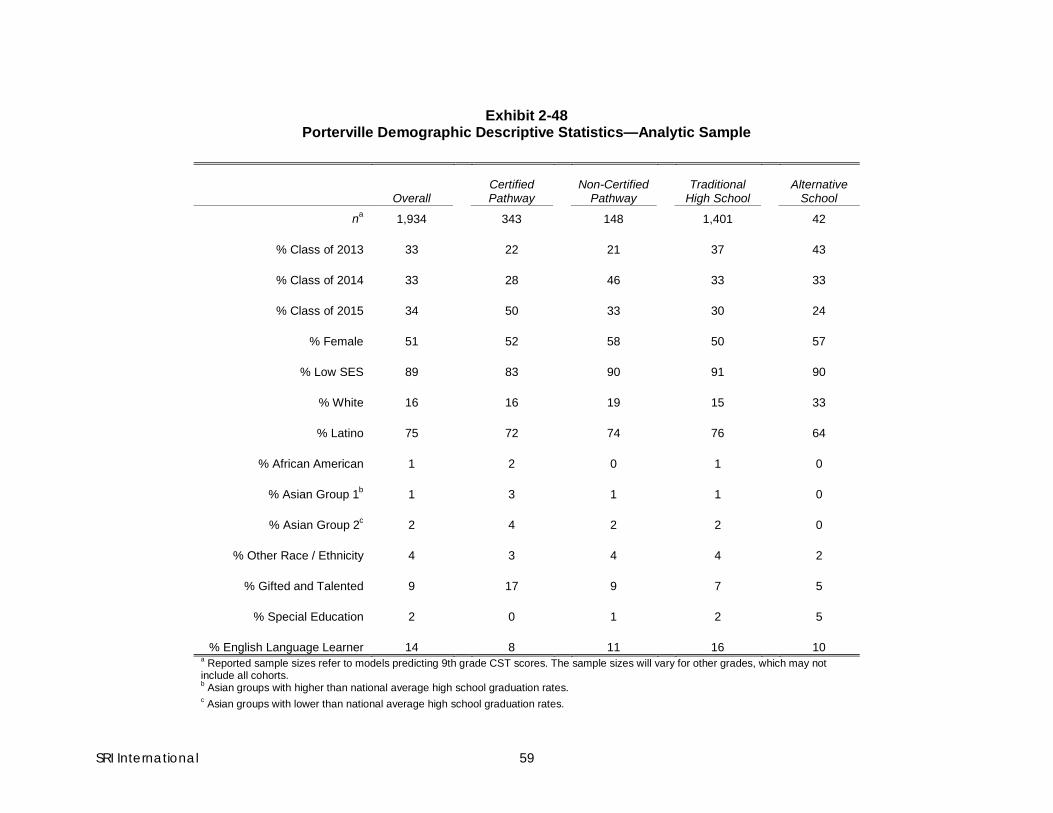
Exhibit 2-48
Porterville Demographic Descriptive Statistics—Analytic Sample
Overall Certified Pathway
Non-Certified Pathway
Traditional High School
Alternative School
na 1,934 343 148 1,401 42
% Class of 2013 33 22 21 37 43
% Class of 2014 33 28 46 33 33
% Class of 2015 34 50 33 30 24
% Female 51 52 58 50 57
% Low SES 89 83 90 91 90
% White 16 16 19 15 33
% Latino 75 72 74 76 64
% African American 1 2 0 1 0
% Asian Group 1b 1 3 1 1 0
% Asian Group 2c 2 4 2 2 0
% Other Race / Ethnicity 4 3 4 4 2
% Gifted and Talented 9 17 9 7 5
% Special Education 2 0 1 2 5
% English Language Learner 14 8 11 16 10 a Reported sample sizes refer to models predicting 9th grade CST scores. The sample sizes will vary for other grades, which may not include all cohorts. b Asian groups with higher than national average high school graduation rates. c Asian groups with lower than national average high school graduation rates.
SRI International 59

Exhibit 2-49 Porterville Standardized Testing Descriptive Statistics—Analytic Sample
Overall
Certified Pathway
Non-Certified Pathway
Traditional High School
Alternative School
na 1,934 343 148 1,401 42 7th Grade
ELA CST 343 370 353 336 320 SD (50) (49) (48) (48) (49)
% Proficient or Higher, ELA CST 43 64 49 38 19 8th Grade
ELA CST 346 376 356 339 319 SD (52) (51) (50) (50) (52)
% Proficient or Higher, ELA CST 46 66 55 40 21 % Taking Algebra or Higher 99 100 100 99 95
9th Grade ELA CST 352 377 361 345 318
SD (51) (51) (46) (49) (50) % Proficient or Higher, ELA CST 51 67 65 46 24
10th Grade ELA CST 341 366 350 336 311
SD (49) (48) (46) (47) (54) % Proficient or Higher, ELA CST 42 65 49 37 31
Math CAHSEE 385 404 387 382 361 SD (33) (33) (30) (31) (38)
% Passing, Math CAHSEE 86 96 89 84 56 ELA CAHSEE 378 395 385 375 365
SD (31) (30) (29) (30) (33) % Passing, ELA CAHSEE 85 95 93 82 69
11th Grade ELA CST 338 355 358 334 282
SD (49) (56) (59) (46) (43) % Proficient or Higher, ELA CST 40 55 52 37 0
% Passing, EAP ELA 25 38 32 23 0 a Reported sample sizes refer to models predicting 9th grade CST scores. The sample sizes will vary for other grades, which may not include all cohorts.
SRI International 60

Exhibit 2-50 Porterville Engagement and School Success Descriptive Statistics—Analytic Sample
Overall Certified Pathway
Non-Certified Pathway
Traditional High School
Alternative School
na 1,934 343 148 1,401 42
Number of F's Received 9th Grade 1.52 0.77 1.08 1.73 2.32
SD (2.27) (1.51) (1.97) (2.39) (2.79) 10th Grade 1.95 1.14 1.56 2.14 1.79
SD (2.62) (2.06) (2.18) (2.71) (2.73) 11th Grade 1.16 1.27 1.07 1.16 0.60
SD (2.01) (2.36) (1.60) (1.99) (1.26) Number of Credits
9th Grade 58 65 63 56 35 SD (15) (9) (11) (15) (21)
10th Grade 59 65 63 58 41 SD (17) (11) (14) (18) (26)
11th Grade 61 64 66 61 35 SD (18) (15) (9) (18) (18)
GPA 9th Grade 2.11 2.53 2.23 2.00 1.93
SD (0.97) (0.91) (0.89) (0.96) (1.14) 10th Grade 1.95 2.39 2.06 1.85 2.30
SD (0.99) (0.97) (0.91) (0.97) (1.11) 11th Grade 2.26 2.50 2.27 2.21 2.66
SD (0.85) (0.94) (0.99) (0.83) (0.56)
% a-g On Track 9th Grade 25 43 33 21 10
10th Grade 20 39 18 17 8 11th Grade 16 33 11 13 0
Absences 9th Grade 5.02 3.40 5.85 5.37 0.00
SD (6.59) (4.31) (7.39) (6.92) (0.00) 10th Grade 5.18 4.29 5.39 5.30 6.60
SD (6.63) (4.96) (6.78) (6.87) (5.22) 11th Grade 5.05 3.24 6.77 5.17 10.60
SD (6.58) (3.94) (6.43) (6.72) (15.44) % Retained from 9th Grade
to 10th Grade 94 98 97 94 75 to 11th Grade 93 97 94 89 56
a Reported sample sizes refer to models predicting 9th grade CST scores. The sample sizes will vary for other grades, which may not include all cohorts.
SRI International 61

Exhibit 2-51 Sacramento Demographic Descriptive Statistics—Analytic Sample
Overall Certified Pathway
Non-Certified Pathway
Traditional High School
na 4,828 426 702 3,700
% Class of 2013 0 0 0 0
% Class of 2014 51 36 69 49
% Class of 2015 49 64 31 51
% Female 50 53 54 49
% Low SES 79 86 79 79
% White 19 19 23 19
% Latino 36 42 34 36
% African American 17 24 14 16
% Asian Group 1b 13 5 12 14
% Asian Group 2c 14 9 16 15
% Other Race / Ethnicity 1 1 1 1
% Gifted and Talented 18 9 18 19
% Special Education 10 9 9 10
% English Language Learner 20 19 21 19 a Reported sample sizes refer to models predicting 9th grade CST scores. The sample sizes will vary for other grades, which may not include all cohorts. b Asian groups with higher than national average high school graduation rates. c Asian groups with lower than national average high school graduation rates.
SRI International 62

Exhibit 2-52 Sacramento Standardized Testing Descriptive Statistics—Analytic Sample
Overall Certified Pathway
Non-Certified Pathway
Traditional High School
na 4,828 426 702 3,700
7th Grade ELA CST - - - -
SD - - - - % Proficient or Higher, ELA CST - - - -
8th Grade ELA CST 354 346 358 354
SD (65) (58) (67) (65) % Proficient or Higher, ELA CST 52 46 51 52
% Taking Algebra or Higher 54 44 47 56 9th Grade
ELA CST 354 338 361 354 SD (62) (54) (61) (63)
% Proficient or Higher, ELA CST 53 41 56 53 10th Grade
ELA CST 349 329 358 345 SD (59) (49) (60) (59)
% Proficient or Higher, ELA CST 50 37 55 48 Math CAHSEE 391 376 395 390
SD (37) (33) (38) (37) % Passing, Math CAHSEE 86 76 87 86
ELA CAHSEE 384 372 391 383 SD (37) (30) (38) (37)
% Passing, ELA CAHSEE 84 84 87 82 a Reported sample sizes refer to models predicting 9th grade CST scores. The sample sizes will vary for other grades, which may not include all cohorts.
SRI International 63

Exhibit 2-53 Sacramento Engagement and School Success Descriptive Statistics—Analytic Sample
Overall Certified Pathway
Non-Certified Pathway
Traditional High School
na 4,828 426 702 3,700
Number of F's Received 9th Grade 1.58 1.79 2.13 1.44
SD (2.61) (2.67) (3.03) (2.50) 10th Grade 1.35 1.87 1.31 1.26
SD (2.33) (2.66) (2.35) (2.26) Number of Credits
9th Grade 53 55 52 53 SD (15) (17) (16) (15)
10th Grade 55 54 56 54 SD (14) (17) (16) (14)
GPA 9th Grade 2.39 2.21 2.24 2.44
SD (1.11) (1.05) (1.20) (1.09) 10th Grade 2.38 2.22 2.52 2.38
SD (1.03) (1.06) (1.05) (1.01)
% a-g On Track 9th Grade 41 24 43 43
10th Grade - - - - Absences
9th Grade 6.27 6.84 6.40 6.18 SD (7.79) (8.05) (7.74) (7.77)
10th Grade 6.22 7.67 5.57 6.60 SD (7.80) (7.84) (7.17) (8.89)
% Retained from 9th Grade to 10th Grade 90 90 91 89
a Reported sample sizes refer to models predicting 9th grade CST scores. The sample sizes will vary for other grades, which may not include all cohorts.
SRI International 64

Exhibit 2-54 West Contra Costa Demographic Descriptive Statistics—Analytic Sample
Overall Certified Pathway
Non-Certified Pathway
Traditional High School
Alternative School
na 1,351 187 495 637 32
% Class of 2013 0 0 0 0 0
% Class of 2014 100 100 100 100 100
% Class of 2015 0 0 0 0 0
% Female 48 30 57 47 53
% Low SES 77 98 85 64 81
% White 9 1 8 12 6
% Latino 48 84 51 35 47
% African American 20 6 20 23 41
% Asian Group 1b 13 5 9 19 0
% Asian Group 2c 10 4 11 12 6
% Other Race / Ethnicity 0 1 0 0 0
% Gifted and Talented 14 7 14 17 6
% Special Education 7 7 6 7 9
% English Language Learner 26 46 28 19 19 a Reported sample sizes refer to models predicting 9th grade CST scores. The sample sizes will vary for other grades, which may not include all cohorts. b Asian groups with higher than national average high school graduation rates. c Asian groups with lower than national average high school graduation rates.
SRI International 65

Exhibit 2-55 West Contra Costa Standardized Testing Descriptive Statistics—Analytic Sample
Overall
Certified Pathway
Non-Certified Pathway
Traditional High School
Alternative School
na 1,351 187 495 637 32 7th Grade
ELA CST - - - - - SD - - - - -
% Proficient or Higher, ELA CST - - - - - 8th Grade
ELA CST 331 302 332 340 296 SD (59) (47) (56) (61) (49)
% Proficient or Higher, ELA CST 37 17 34 46 16 % Taking Algebra or Higher 90 84 88 94 63
9th Grade ELA CST 333 315 332 342 290
SD (56) (46) (55) (59) (46) % Proficient or Higher, ELA CST 38 20 38 45 16
10th Grade ELA CST 323 300 321 334 276
SD (59) (48) (54) (62) (45) % Proficient or Higher, ELA CST 34 14 30 44 7
Math CAHSEE 375 364 374 380 347 SD (37) (31) (36) (38) (23)
% Passing, Math CAHSEE 75 67 74 79 57 ELA CAHSEE 376 363 376 381 350
SD (34) (30) (32) (36) (35) % Passing, ELA CAHSEE 80 69 83 82 60
11th Grade ELA CST - - - - -
SD - - - - - % Proficient or Higher, ELA CST - - - - -
% Passing, EAP ELA - - - - - a Reported sample sizes refer to models predicting 9th grade CST scores. The sample sizes will vary for other grades, which may not include all cohorts.
SRI International 66
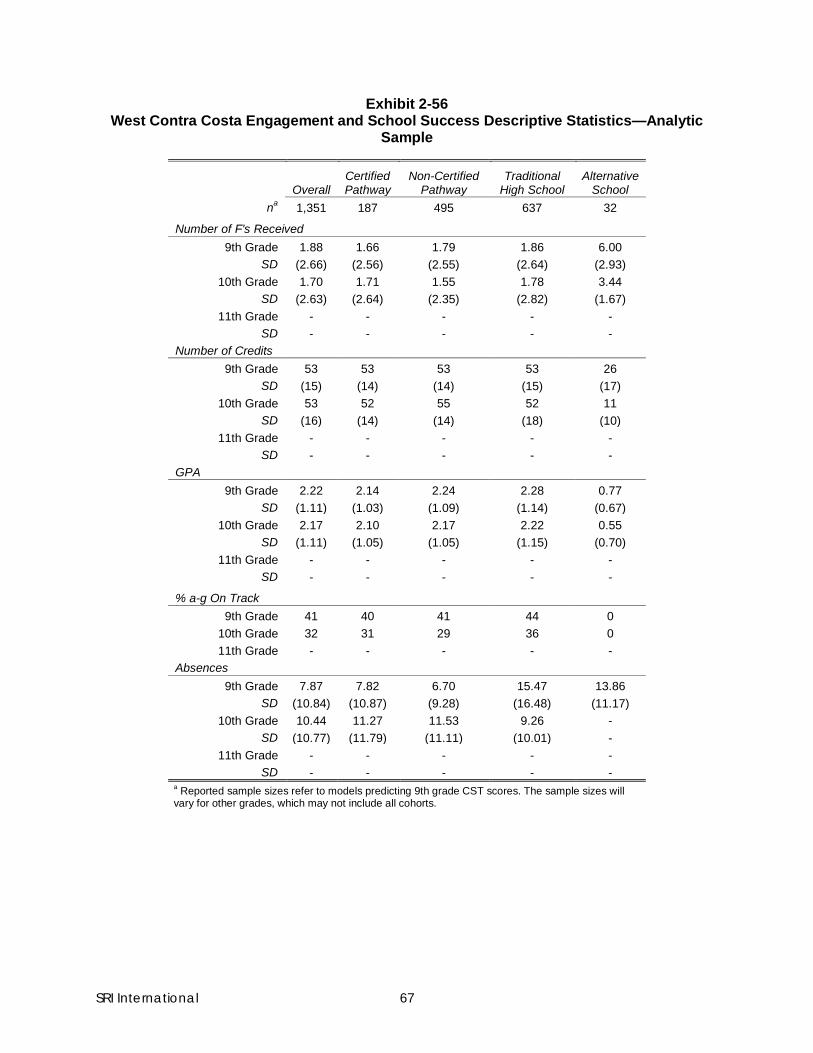
Exhibit 2-56 West Contra Costa Engagement and School Success Descriptive Statistics—Analytic
Sample
Overall Certified Pathway
Non-Certified Pathway
Traditional High School
Alternative School
na 1,351 187 495 637 32
Number of F's Received 9th Grade 1.88 1.66 1.79 1.86 6.00
SD (2.66) (2.56) (2.55) (2.64) (2.93) 10th Grade 1.70 1.71 1.55 1.78 3.44
SD (2.63) (2.64) (2.35) (2.82) (1.67) 11th Grade - - - - -
SD - - - - - Number of Credits
9th Grade 53 53 53 53 26 SD (15) (14) (14) (15) (17)
10th Grade 53 52 55 52 11 SD (16) (14) (14) (18) (10)
11th Grade - - - - - SD - - - - -
GPA 9th Grade 2.22 2.14 2.24 2.28 0.77
SD (1.11) (1.03) (1.09) (1.14) (0.67) 10th Grade 2.17 2.10 2.17 2.22 0.55
SD (1.11) (1.05) (1.05) (1.15) (0.70) 11th Grade - - - - -
SD - - - - -
% a-g On Track 9th Grade 41 40 41 44 0
10th Grade 32 31 29 36 0 11th Grade - - - - -
Absences 9th Grade 7.87 7.82 6.70 15.47 13.86
SD (10.84) (10.87) (9.28) (16.48) (11.17) 10th Grade 10.44 11.27 11.53 9.26 -
SD (10.77) (11.79) (11.11) (10.01) - 11th Grade - - - - -
SD - - - - - a Reported sample sizes refer to models predicting 9th grade CST scores. The sample sizes will vary for other grades, which may not include all cohorts.
SRI International 67

Value-Added Analysis Once we obtained the correct analytic sample for each model, we centered all control variables around the mean of the analytic sample (standardizing continuous variables, centering indicator variables). The availability of control variables varied by district (and sometimes by outcome), as we did not have all prior achievement variables for all districts and cohorts. Exhibit 2-57 lists the control variables used in each model. We used quadratic and cubic terms for the middle school CST scores in models predicting continuous outcomes. We squared/ cubed the standardized terms, then re-centered them. This centering meant that we estimated outcomes for the student in each district who is average on all control variables.
SRI International 68

Exhibit 2-57 Control Variables Used in Each Model
Antioch Long
Beach Los
Angeles Montebello Oakland Pasadena Porterville Sacramento West Contra
Costa All Models Female X X X X X X X X X Low SES X X X X X X X X X Race/Ethnicity X X X X X X X X X Gifted and Talented X X X X X X X X Special Education X X X X X X X X X English Language Learner X X X X X X X X X 7th Grade GPA X 8th Grade GPA X 7th Grade Math CST X Xa X X X 8th Grade Math CST X Xb X X X X X X X 9th Grade Math CST X X 7th Grade ELA CST X Xa X X X 8th Grade ELA CST X Xb X X X X X X X 9th Grade ELA CST X X 7th grade math CST test taken X Xa X X X 8th grade math CST test takenc X Xb X X X X X X X 9th grade math CST test taken X X Models Predicting 9th Grade Outcomes Only
Class of 2013 X X X X Class of 2014 X X X X X X Models Predicting 10th Grade Outcomes Only
Class of 2013 X X X Class of 2014 X X X
Models Predicting Failures Only
Failed one or more class in 7th grade X Failed one or more class in 8th grade X X
a Class of 2013 only. b Classes of 2014 and 2015 only. c All students in the analytic sample in Porterville took the same math CST exam.
SRI International 69

We begin by explaining the procedure to estimate the value-added scores for models predicting continuous outcome variables (in this case the standardized test scores and credits accumulated), then explain the differences when estimating a fixed effect model for the other outcomes.
To estimate the value-added scores for models predicting continuous outcome variables, we regressed the outcome variable (score Y for student i in pathway s) on a vector of centered control variables representing the demographics and prior achievement of student i (𝑋𝑖). We used a vector of indicators for the student’s pathway (𝜂𝑠) to predict the fixed effects of each pathway:
𝑌𝑖𝑠 = 𝛽 + 𝑿𝒊𝝀 + 𝜼𝒔 + 𝜇𝑖 Next, we calculated the individual value-added estimate for each pathway/ school by adding the individual fixed effect for that pathway/school to the constant term (𝛽). For each pathway s, 𝛽 + 𝜂𝑠 predicts the average value of Y for a student with a value of zero for all other covariates. Since we centered the covariates at the sample means, this term predicts the test score for an “average” student in the sample.
To predict the overall district average, we weighted each pathway’s predicted average outcome by the size of the pathway enrollment. We summed these weighted values, providing us with the predicted average outcome for an “average” student in the district, without regard to pathway or school enrollment.
To predict the outcomes for the certified pathways, we multiplied the individual estimates for the certified pathways by the percent of certified pathway students in the sample enrolled in that particular pathway. We summed these weighted values, giving us the predicted outcome for the average student in that district, if that student enrolls in a certified pathway.
Our final step in predicting the value-added score was to compare this predicted outcome for the average student in that district, if enrolled in a certified pathway, to the district average for this student. To do so, we subtracted the predicted district outcome from the predicted outcome for students in a certified pathway. We performed this test using the lincom command in Stata, which tests the difference against zero. The null hypothesis in this case is that the average student in a district performs no differently in a certified pathway than they do without regard to pathway enrollment. We refer to this difference as the “value-added” score.
We made some modifications for models predicting binary (on track to complete a-g; at least conditionally college ready on the EAP exam, retained in district to 10th or 11th grade) and count (number of F’s, days absent) outcomes. We used logistic regression to predict binary outcomes. Although binary indicators for categories can provide biased estimates of fixed effects when predicted as dummy variables, the sample sizes of our pathways were large enough to preclude this problem.
For models predicting count data we began by testing the fit of a Poisson regression. The goodness-of-fit test was significant for this model (p < .001), however, indicating that this data exhibits overdispersion. We therefore used a negative binomial model, which models count data while allowing for an individual error term (Kennedy, 2003). For both types of models, we first transformed the estimates into probabilities or counts before combining the scores of different pathways or schools. Finally, we performed significance testing of these combined estimates using the nlcom command in Stata, for non-linear combinations of estimates.
We present all value-added estimates for certified pathways in Exhibits 2-58 through 2-73. All certified pathway value-added estimates are presented, along with their significance level and the associated standard error. Note that continuous variables (credits, CST and CAHSEE scores) have been standardized and value-added scores should therefore be interpreted in standard deviation
SRI International 70

units. Count data (absences, number of F’s) should be interpreted as counts of the outcome variable (that is, .5 could be interpreted as half a day or failing .5 few classes). Binary outcomes (on-track indicator, retention in district, passing the EAP exam) should be interpreted as percentage points (.05 indicates 5 percentage points more likely to have a value of 1 in the outcome).
We present several other numbers, for the sake of better interpreting the outcomes. We report the adjusted mean for the outcome in the analytic sample (i.e., the mean outcome for the average student in the district, against which the value-added point estimate is tested). For continuous variables this adjusted mean should be zero, as the outcome variable is standardized. Given that we estimate these models using OLS, a student who has the average on all control variables (which have also been centered) will be predicted to have an average value on all continuous outcomes. We also present the overall mean in the analytic sample, which has neither been standardized nor adjusted for the “average” student. Finally, we present the standard deviation of the outcome variable for continuous and count outcomes.
SRI International 71

Exhibit 2-58 Antioch Value Added Standardized Testing Outcomes
9th Grade 10th Grade 11th Grade
ELA CST (Std.)
VAM 0.07 * 0.02 - SE (0.03) (0.06) -
Adjusted Mean 0.00 0.00 -
Mean in Analytic Sample 359.18 344.25 - SD (54.60) (52.15) -
n 1,906 835 -
ELA CAHSEE (Std.)
VAM - 0.08 - SE - (0.05) -
Adjusted Mean - 0.00 -
Mean in Analytic Sample - 390.31 - SD - (31.96) -
n - 859 -
Math CAHSEE (Std.)
VAM - 0.01 - SE - (0.05) -
Adjusted Mean - 0.00 -
Mean in Analytic Sample - 386.10 - SD - (35.11) -
n - 865 -
ELA EAP
VAM - - - SE - - -
Adjusted Mean - - -
Mean in Analytic Sample - - - n - - -
Note: *p < .05, **p < .01, ***p < .001
SRI International 72

Exhibit 2-59 Antioch Value Added Engagement and School Success Outcomes
9th Grade 10th Grade 11th Grade
Absences
VAM - - - SE - - -
Adjusted Mean - - -
Mean in Analytic Sample - - - SD - - -
n - - -
Retention
VAM - 0.05 ** - SE - (0.02) -
Adjusted Mean - 0.93 -
Mean in Analytic Sample - 0.92 - n - 918 -
Number of F's Received
VAM 0.29 * 0.24 - SE (0.13) (0.27) -
Adjusted Mean 1.26 1.85 -
Mean in Analytic Sample 1.99 2.56 - SD (2.98) (3.42) -
n 1,907 821 -
Number of Credits (Std.)
VAM 0.19 *** 0.21 ** - SE (0.05) (0.08) -
Adjusted Mean 0.00 0.00 -
Mean in Analytic Sample 52.69 51.22 - SD (17.82) (19.68) -
n 1,907 821 -
a-g On Track
VAM 0.17 *** 0.14 ** - SE (0.04) (0.05) -
Adjusted Mean 0.29 0.22 -
Mean in Analytic Sample 0.36 0.31 - n 1,906 820 -
Note: *p < .05, **p < .01, ***p < .001
SRI International 73

Exhibit 2-60 Long Beach Value Added Standardized Testing Outcomes
9th Grade 10th Grade 11th Grade
ELA CST (Std.)
VAM 0.04 ** 0.04 0.04 SE (0.01) (0.02) (0.03)
Adjusted Mean 0.00 0.00 0.00
Mean in Analytic Sample 352.57 341.03 339.37 SD (59.15) (57.70) (62.40)
n 15,183 9,311 4,533
ELA CAHSEE (Std.)
VAM - -0.03 - SE - (0.02) -
Adjusted Mean - 0.00 -
Mean in Analytic Sample - 384.41 - SD - (34.89) -
n - 9,398 -
Math CAHSEE (Std.)
VAM - -0.06 *** - SE - (0.02) -
Adjusted Mean - 0.00 -
Mean in Analytic Sample - 386.13 - SD - (35.59) -
n - 9,392 -
ELA EAP
VAM -
- 0.04 SE -
- (0.03)
Adjusted Mean -
- 0.24
Mean in Analytic Sample -
- 0.36 n -
- 4,357
Note: *p < .05, **p < .01, ***p < .001
SRI International 74

Exhibit 2-61 Long Beach Value Added Engagement and School Success Outcomes
9th Grade 10th Grade 11th Grade
Absences
VAM -0.56 ** -0.51 * -0.13 SE (0.20) (0.25) (0.43)
Adjusted Mean 5.77 6.93 7.68
Mean in Analytic Sample 6.40 7.49 8.28 SD (8.86) (10.04) (10.48)
n 9,764 8,835 3,960
Retention
VAM - 0.01 0.03 * SE - (0.01) (0.01)
Adjusted Mean - 0.95 0.90
Mean in Analytic Sample - 0.94 0.89 n - 10,265 5,378
Number of F's Received
VAM -0.16 * -0.01 -0.02 SE (0.07) (0.05) (0.08)
Adjusted Mean 0.94 0.93 0.71
Mean in Analytic Sample 1.80 1.61 1.05 SD (2.76) (2.61) (1.95)
n 15,416 9,405 4,552
Number of Credits (Std.)
VAM 0.23 *** 0.31 *** 0.14 ** SE (0.02) (0.03) (0.05)
Adjusted Mean 0.00 0.00 0.00
Mean in Analytic Sample 54.58 55.71 57.60 SD (16.72) (16.05) (14.04)
n 15,406 9,400 4,527
a-g On Track
VAM 0.09 *** 0.06 ** -0.02 SE (0.02) (0.02) (0.01)
Adjusted Mean 0.23 0.16 0.11
Mean in Analytic Sample 0.35 0.30 0.25 n 15,340 9,347 4,482
Note: *p < .05, **p < .01, ***p < .001
SRI International 75

Exhibit 2-62 Los Angeles Value Added Standardized Testing Outcomes
9th Grade 10th Grade
ELA CST (Std.)
VAM 0.07 * -0.02 SE (0.03) (0.05)
Adjusted Mean 0.00 0.00
Mean in Analytic Sample 332.73 335.36 SD (51.62) (49.98)
n 4,935 1,794
ELA CAHSEE (Std.)
VAM 0.06 SE (0.05)
Adjusted Mean 0.00
Mean in Analytic Sample 376.16 SD (31.22)
n 1,724
Math CAHSEE (Std.)
VAM 0.06 SE (0.04)
Adjusted Mean 0.00
Mean in Analytic Sample 384.01 SD (33.22)
n 1,730 Note: *p < .05, **p < .01, ***p < .001
SRI International 76

Exhibit 2-63
Los Angeles Value Added Engagement and School Success Outcomes
9th Grade 10th Grade
Absences
VAM -2.28 * -2.32 *** SE (0.98) (0.54)
Adjusted Mean 6.81 7.75
Mean in Analytic Sample 7.34 8.38 SD (11.36) (12.87)
n 4,986 2,269
Retention
VAM 0.01 SE (0.01)
Adjusted Mean 0.97
Mean in Analytic Sample 0.96 n 1,658
Number of F's Received
VAM -1.23 -1.09 *** SE (0.98) (0.12)
Adjusted Mean 1.83 2.04
Mean in Analytic Sample 2.37 2.56 SD (3.29) (3.42)
n 4,962 2,366
Number of Credits (Std.)
VAM 0.69 *** 0.50 *** SE (0.04) (0.06)
Adjusted Mean 0.00 0.00
Mean in Analytic Sample 58.28 54.97 SD (18.33) (20.90)
n 4,961 2,366
a-g On Track
VAM 0.13 *** 0.06 SE (0.03) (0.03)
Adjusted Mean 0.58 0.29
Mean in Analytic Sample 0.55 0.34 n 4,961 2,362
Note: *p < .05, **p < .01, ***p < .001
SRI International 77

Exhibit 2-64
Oakland Value Added Standardized Testing Outcomes
9th Grade 10th Grade
ELA CST (Std.)
VAM - 0.16 ** SE - (0.05)
Adjusted Mean - 0.00
Mean in Analytic Sample - 324.70 SD - (60.29)
n - 1,230
ELA CAHSEE (Std.)
VAM - 0.22 *** SE - (0.04)
Adjusted Mean - 0.00
Mean in Analytic Sample - 373.46 SD - (36.91)
n - 1,250
Math CAHSEE (Std.)
VAM - 0.20 *** SE - (0.05)
Adjusted Mean - 0.00
Mean in Analytic Sample - 377.47 SD - (39.77)
n - 1,247 Note: *p < .05, **p < .01, ***p < .001
SRI International 78

Exhibit 2-65 Oakland Value Added Engagement and School Success Outcomes
9th Grade 10th Grade
Absences
VAM - -2.06 *** SE - (0.58)
Adjusted Mean - 6.87
Mean in Analytic Sample - 7.79 SD - (12.20)
n - 1,288
Retention
VAM - - SE - -
Adjusted Mean - -
Mean in Analytic Sample - - n - -
Number of F's Received
VAM - 0.09 SE - (0.17)
Adjusted Mean - 1.42
Mean in Analytic Sample - 2.34 SD - (3.27)
n - 1,273
Number of Credits (Std.)
VAM - 0.59 *** SE - (0.08)
Adjusted Mean - 0.00
Mean in Analytic Sample - 53.61 SD - (18.84)
n - 1,270
a-g On Track
VAM - 0.05 SE - (0.05)
Adjusted Mean - 0.31
Mean in Analytic Sample - 0.36
n - 1,263 Note: *p < .05, **p < .01, ***p < .001
SRI International 79

Exhibit 2-66 Pasadena Value Added Standardized Testing Outcomes
9th Grade 10th Grade 11th Grade
ELA CST (Std.)
VAM -0.06 ** -0.13 *** -0.11 * SE (0.02) (0.03) (0.05)
Adjusted Mean 0.00 0.00 0.00
Mean in Analytic Sample 354.11 347.37 344.24 SD (57.54) (52.70) (59.70)
n 2,937 1,808 809
ELA CAHSEE (Std.)
VAM - -0.04 -
se - (0.03) -
Adjusted Mean - 0.00 -
Mean in Analytic Sample - 385.81 - SD - (32.41) -
n - 1,832 -
Math CAHSEE (Std.)
VAM - -0.09 ** -
se - (0.03) -
Adjusted Mean - 0.00 -
Mean in Analytic Sample - 386.97 - SD - (34.47) -
n - 1,824 -
ELA EAP
VAM -
- -0.07 *
se -
- (0.04)
Adjusted Mean -
- 0.25
Mean in Analytic Sample -
- 0.34 n -
- 723
Note: *p < .05, **p < .01, ***p < .001
SRI International 80

Exhibit 2-67
Pasadena Value Added Engagement and School Success Outcomes
9th Grade 10th Grade 11th Grade
Absences
VAM - - - SE - - -
Adjusted Mean - - -
Mean in Analytic Sample - - - SD - - -
n - - -
Retention
VAM - 0.01 0.01 SE - (0.01) (0.02)
Adjusted Mean - 0.95 0.90
Mean in Analytic Sample - 0.94 0.87 n - 1,981 990
Number of F's Received
VAM 0.26 0.31 0.18 SE (0.91) (0.97) (4.20)
Adjusted Mean 1.07 1.13 0.81
Mean in Analytic Sample 1.78 1.66 1.32 SD (2.86) (2.52) (2.34)
n 2,971 1,847 858
Number of Credits (Std.)
VAM 0.64 *** 0.39 *** 0.32 *** SE (0.04) (0.04) (0.07)
Adjusted Mean 0.00 0.00 0.00
Mean in Analytic Sample 56.30 57.55 59.96 SD (16.71) (16.21) (16.60)
n 2,987 1,847 854
a-g On Track
VAM 0.08 ** 0.06 ** 0.06 SE (0.02) (0.02) (0.03)
Adjusted Mean 0.29 0.18 0.15
Mean in Analytic Sample 0.33 0.25 0.21 n 2,972 1,826 839
Note: *p < .05, **p < .01, ***p < .001
SRI International 81

Exhibit 2-68 Porterville Value Added Standardized Testing Outcomes
9th Grade 10th Grade 11th Grade
ELA CST (Std.)
VAM 0.01 0.08 -0.09 SE (0.03) (0.05) (0.07)
Adjusted Mean 0.00 0.00 0.00
Mean in Analytic Sample 352.12 341.18 337.72 SD (50.66) (48.65) (49.17)
n 1,823 1,105 495
ELA CAHSEE (Std.)
VAM - 0.13 ** - SE - (0.05) -
Adjusted Mean - 0.00 -
Mean in Analytic Sample - 378.32 - SD - (30.66) -
n - 1,103 -
Math CAHSEE (Std.)
VAM - 0.15 *** - SE - (0.04) -
Adjusted Mean - 0.00 -
Mean in Analytic Sample - 384.91 - SD - (32.73) -
n - 1,109 -
ELA EAP
VAM -
- 0.01 SE -
- (0.06)
Adjusted Mean -
- 0.15
Mean in Analytic Sample -
- 0.25 n -
- 433
Note: *p < .05, **p < .01, ***p < .001
SRI International 82

Exhibit 2-69 Porterville Value Added Engagement and School Success Outcomes
9th Grade 10th Grade 11th Grade
Absences
VAM - - - SE - - -
Adjusted Mean - - -
Mean in Analytic Sample - - - SD - - -
n - - -
Retention
VAM - 0.01 0.07 *** SE - (0.01) (0.02)
Adjusted Mean - 0.96 0.90
Mean in Analytic Sample - 0.94 0.88 n - 1,186 613
Number of F's Received
VAM -0.35 *** -0.31 * 0.12 SE (0.08) (0.15) (12.15)
Adjusted Mean 1.15 1.49 0.78
Mean in Analytic Sample 1.51 1.95 1.20 SD (2.26) (2.62) (2.04)
n 1,888 1,161 533
Number of Credits (Std.)
VAM 0.24 *** 0.11 -0.06 SE (0.05) (0.07) (0.11)
Adjusted Mean 0.00 0.00 0.00
Mean in Analytic Sample 57.78 58.81 61.54 SD (14.97) (17.14) (17.55)
n 1,887 1,160 528
a-g On Track
VAM 0.02 0.05 0.02 SE (0.02) (0.03) (0.03)
Adjusted Mean 0.16 0.13 0.06
Mean in Analytic Sample 0.26 0.21 0.16 n 1,835 1,132 523
Note: *p < .05, **p < .01, ***p < .001
SRI International 83

Exhibit 2-70 Sacramento Value Added Standardized Testing Outcomes
9th Grade 10th Grade
ELA CST (Std.)
VAM -0.06 * -0.02 SE (0.03) (0.05)
Adjusted Mean 0.00 0.00
Mean in Analytic Sample 354.39 347.21 SD (62.07) (59.14)
n 4,638 2,075
ELA CAHSEE (Std.)
VAM - -0.05 SE - (0.04)
Adjusted Mean - 0.00
Mean in Analytic Sample - 383.59 SD - (37.11)
n - 2,094
Math CAHSEE (Std.)
VAM - 0.01 SE - (0.04)
Adjusted Mean - 0.00
Mean in Analytic Sample - 390.22 SD - (36.99)
n - 2,103 Note: *p < .05, **p < .01, ***p < .001
SRI International 84

Exhibit 2-71 Sacramento Value Added Engagement and School Success Outcomes
9th Grade 10th Grade
Absences
VAM -0.05 0.17 SE (0.31) (0.57)
Adjusted Mean 5.60 5.78
Mean in Analytic Sample 6.27 6.46 SD (7.79) (8.52)
n 4,427 2,068
Retention
VAM - 0.02 SE - (0.02)
Adjusted Mean - 0.91
Mean in Analytic Sample - 0.89 n - 2,365
Number of F's Received
VAM -0.02 0.17 SE (0.06) (0.15)
Adjusted Mean 0.87 0.88
Mean in Analytic Sample 1.58 1.31 SD (2.61) (2.31)
n 4,731 2,153
Number of Credits (Std.)
VAM 0.31 *** 0.17 * SE (0.04) (0.08)
Adjusted Mean 0.00 0.00
Mean in Analytic Sample 53.31 54.17 SD (15.29) (14.97)
n 4,729 2,152
a-g On Track
VAM -0.05 - SE (0.05) -
Adjusted Mean 0.38 -
Mean in Analytic Sample 0.41 - n 2,376 -
Note: *p < .05, **p < .01, ***p < .001
SRI International 85

Exhibit 2-72 West Contra Costa Value Added Standardized Testing Outcomes
9th Grade 10th Grade
ELA CST (Std.)
VAM - -0.04
se - (0.04)
Adjusted Mean - 0.00
Mean in Analytic Sample - 324.11 SD - (58.31)
n - 1,270
ELA CAHSEE (Std.)
VAM - 0.00
se - (0.05)
Adjusted Mean - 0.00
Mean in Analytic Sample - 376.17 SD - (33.77)
n - 1,288
Math CAHSEE (Std.)
VAM - -0.02
se - (0.05)
Adjusted Mean - 0.00
Mean in Analytic Sample - 375.00 SD - (36.64)
n - 1,292 Note: *p < .05, **p < .01, ***p < .001
SRI International 86

Exhibit 2-73 West Contra Costa Value Added Engagement and School Success Outcomes
9th Grade 10th Grade
Absences
VAM - 0.22 SE - (0.56)
Adjusted Mean - 9.62
Mean in Analytic Sample - 10.36 SD - (10.56)
n - 1,264
Retention
VAM - - SE - -
Adjusted Mean - -
Mean in Analytic Sample - - n - -
Number of F's Received
VAM - -0.30 SE - (9.80)
Adjusted Mean - 0.87
Mean in Analytic Sample - 1.66 SD - (2.60)
n - 1,298
Number of Credits (Std.)
VAM - 0.14 * SE - (0.07)
Adjusted Mean - 0.00
Mean in Analytic Sample - 53.64 SD - (15.65)
n - 1,295
a-g On Track
VAM - 0.17 ** SE - (0.05)
Adjusted Mean - 0.27
Mean in Analytic Sample - 0.33 n - 1,288
Note: *p < .05, **p < .01, ***p < .001
SRI International 87

Value-Added Estimates for All Pathway Types In Exhibits 2-74 through 2-82, we present the value-added estimates for all pathway types. These graphs show the point estimates and a standard error bar representing the 95% confidence interval for these estimates. These point estimates are compared to the district average, represented on these charts by a line at 0. We present the mean value (which varies by grade) in the X-axis value labels. As with the value-added estimates above, value-added estimates for continuous variables are estimated in standard deviation units. Value-added estimates for count data can be interpreted in counts (number of days, number of course failures). Binary variables estimates can be interpreted in percentage points.
Exhibit 2-74 Antioch Value Added Estimates for All Pathway Types
SRI International 88

SRI International 89

SRI International 90
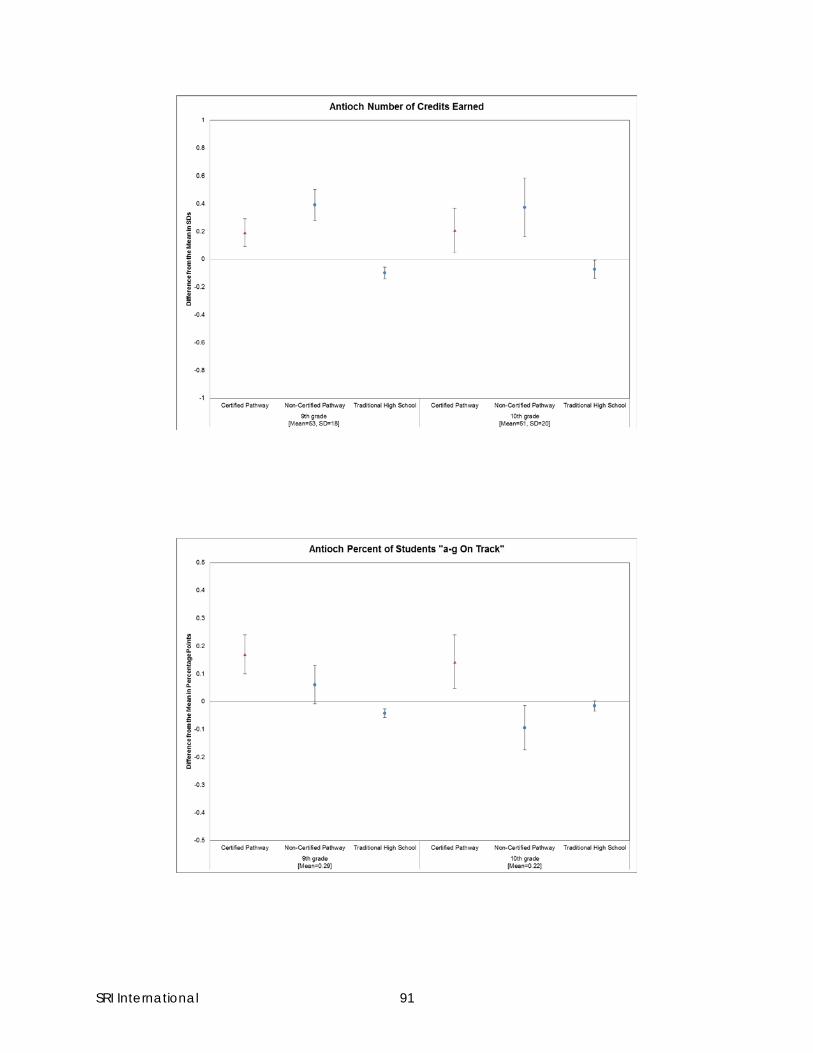
SRI International 91
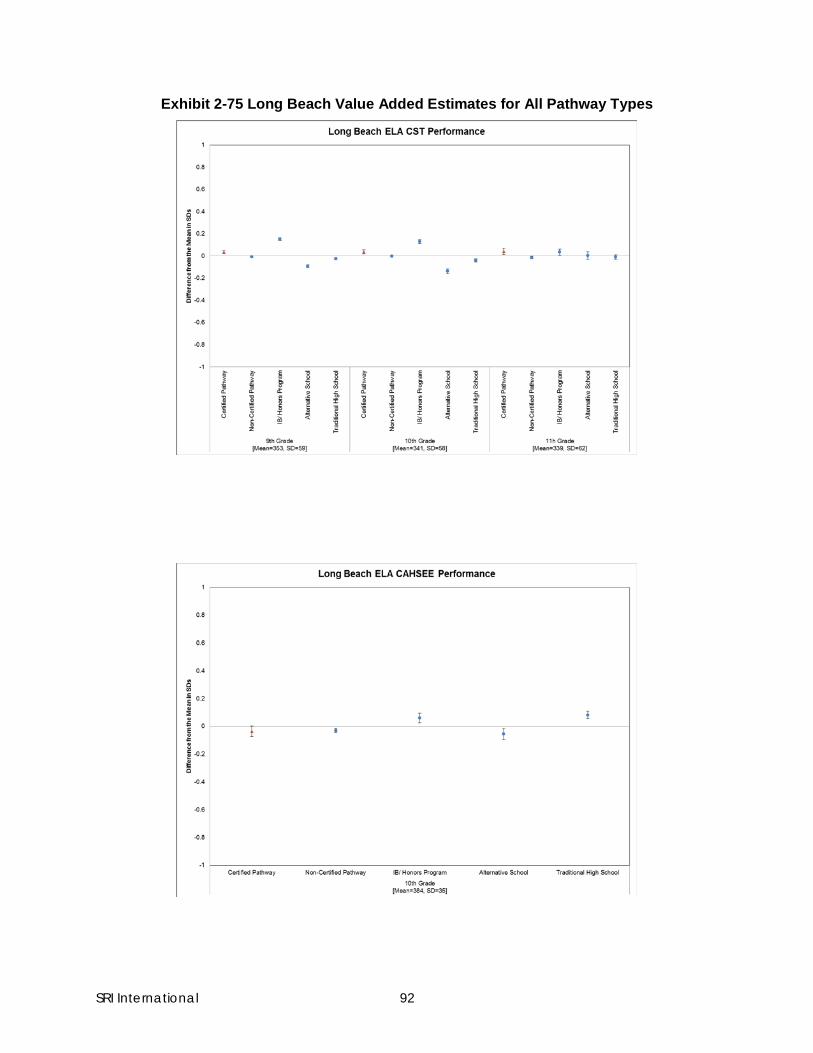
Exhibit 2-75 Long Beach Value Added Estimates for All Pathway Types
SRI International 92

SRI International 93
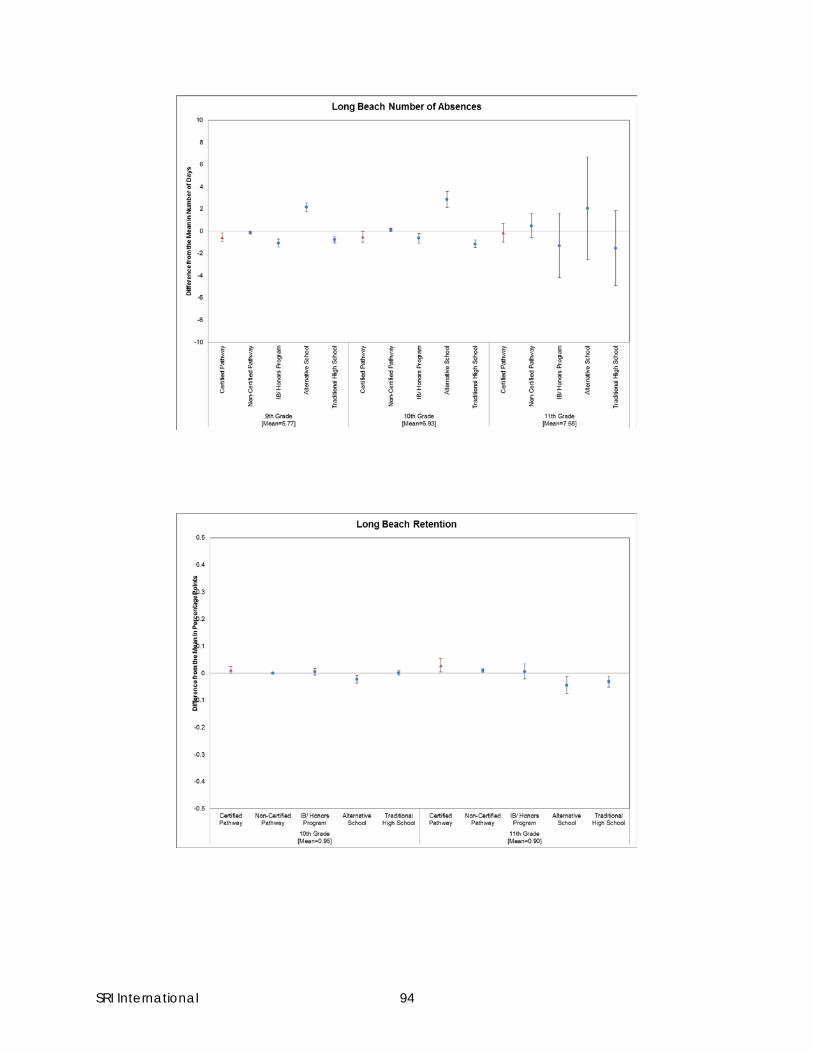
SRI International 94

SRI International 95

Exhibit 2-76 Los Angeles Value Added Estimates for All Pathway Types
SRI International 96

SRI International 97

SRI International 98

SRI International 99

Exhibit 2-77 Montebello Value Added Estimates for All Pathway Types
SRI International 100

SRI International 101

Note: In the interest of comparability, the y-axis range for each variable is set to be consistent across districts. Consequently, in Montebello, error bars for 9th and 10th grade number of F’s received in Non-Certified Pathways extend beyond the exhibit range (9th grade SE = 59.5; 10th grade SE = 23.8).
SRI International 102

SRI International 103

Exhibit 2-78 Oakland Value Added Estimates for All Pathway Types
SRI International 104

SRI International 105

SRI International 106

Exhibit 2-79 Pasadena Value Added Estimates for All Pathway Types
SRI International 107

SRI International 108

SRI International 109

Note: In the interest of comparability, the y-axis range for each variable is set to be consistent across districts. Consequently, in Pasadena, error bars for 11th grade number of F’s received in Certified and Non-Certified Pathways extend beyond the exhibit range (Certified Pathway SE = 4.2; Non-Certified Pathway SE = 11.9)
SRI International 110

Exhibit 2-80 Porterville Value Added Estimates for All Pathway Types
SRI International 111
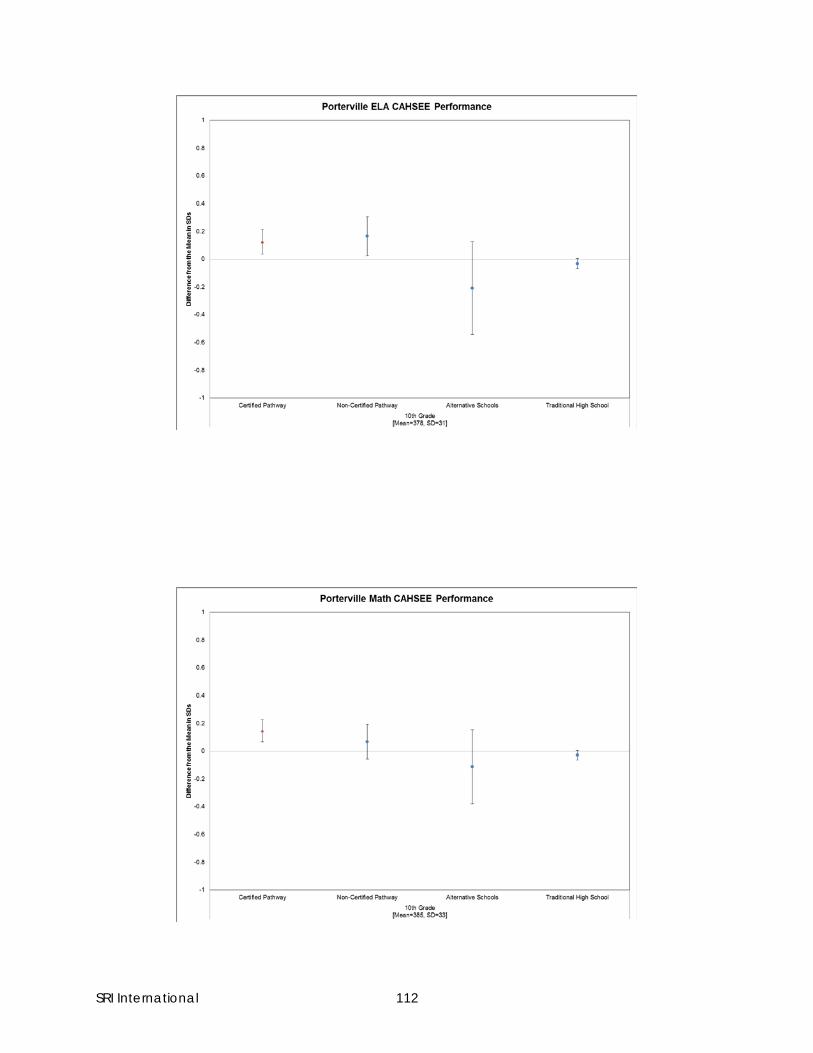
SRI International 112

SRI International 113

Note: In the interest of comparability, the y-axis range for each variable is set to be consistent across districts. Consequently, in Porterville, error bars for 11th grade number of F’s received in Certified and Non-Certified Pathways extend beyond the exhibit range (Certified Pathway SE = 12.2; Non-Certified Pathway SE = 15.2).
SRI International 114

SRI International 115

Exhibit 2-81 Sacramento Value Added Estimates for All Pathway Types
SRI International 116

SRI International 117

SRI International 118

SRI International 119

Exhibit 2-82 West Contra Costa Value Added Estimates for All Pathway Types
SRI International 120

SRI International 121

Note: In the interest of comparability, the y-axis range for each variable is set to be consistent across districts. Consequently, in West Contra Costa, error bars for number of F’s received in Certified Pathways and Traditional High Schools extend beyond the exhibit range (Certified Pathway SE = 9.8; Traditional High School SE = 3.7).
SRI International 122

SRI International 123

SRI International 124

Chapter 3: Survey Methods In spring 2013, the research team surveyed 11th-grade pathway and comparison students to provide an update on students’ perceptions of school climate, their sources of support and advising, the skills they perceived to have gained in high school, their experiences with work-based learning and integrated instruction, and their postsecondary plans as well as their sense of preparation for college or career. In this chapter we provide details about the sample and response rates for the survey, followed by summaries of the results for each survey item, including the items report on in Chapters 3 and 5 of the full report.
Survey Sample For the spring 2013 survey, we sampled 11th-grade pathway and comparison students in the Linked Learning districts.
Pathway Sample: We surveyed 11th-graders in all pathways certified as of the 2011-12 school year across the nine Linked Learning districts (Exhibit 3-1). Montebello was the only district that had no certified pathways as of 2011–12, so we surveyed 11th-graders there in the four pathways the district identified as being most developed. In all districts except Long Beach, we sampled all students enrolled in 11th grade in these pathways. Because so many 11th-graders are enrolled in the four certified pathways in Long Beach (590), we sampled half the students in each of those pathways.
Comparison Sample: We determined the number of comparison students to sample based on the number needed to achieve sufficient power (80%) to detect a difference in means of .30 standard deviations for a continuous outcome variable or a difference in proportion of .15 on a dichotomous outcome variable between pathway and comparison students. We sampled comparison students from the same school where the numbers of students not enrolled in pathways were sufficient. Otherwise, the team selected comparison schools based on their similarity to the size, achievement level, and demographics of the pathway schools. We avoided charter schools and schools with special themes or programs whenever possible. Where districts had implemented wall-to-wall pathways in all schools, we sampled comparison students from selected pathways or small learning communities that were in the earliest stages of development or least aligned with the Linked Learning approach. Within comparison schools, we selected a sample of students that were academically similar to pathway students.
SRI International 125

Exhibit 3-1
Pathways Surveyed, by District
District Pathways Surveyed, 2012–13 Antioch Health Science and Medical Technology at Dozier-Libbey Medical High School Los Angeles Los Angeles High School of the Arts
Los Angeles School of Global Studies Long Beach Architecture, Construction and Engineering Academy
California Academy of Math and Science
The Community of Musicians, Performers, Artists, and Social Scientists (COMPASS)
PEACE Academy Montebello Creative Arts and Technology School (CATS)
Culinary Hospitality Opportunities Pathway (CHOP)
Developing Resourceful Individuals who Value Education Now (DRIVEN)
Innovation, Child Development, Academia, Resources for Family, and Education (iCARE)
Oakland Education Academy
Life Academy of Health and Bioscience
Media College Preparatory Pasadena Arts, Entertainment and Media Academy
Business and Entrepreneurship Academy
Creative Arts, Media and Design Academy Porterville Engineering Academy
Multimedia Technology Academy
Partnership Academy of Business
Partnership Academy of Health Science
Performing Arts Academy Sacramento Health Professions High School
New Technology High School West Contra Costa Engineering Academy
Law Academy
Multimedia Academy
Note: All pathways were certified as of the 2011–12 school year except those in Montebello.
SRI International 126

Survey Administration We worked with the Linked Learning director of each district to identify district and/or school liaisons to help coordinate survey administration. We asked schools to provide enrollment numbers for pathway and for non-pathway classes. We then randomly sampled classrooms until we met our targeted sample size. We verified enrollment numbers with each teacher at the time of survey administration. Districts chose paper or online administration, and in some cases this varied by school within districts.
SRI researchers traveled to four of the nine districts to administer the surveys in person to reduce the burden on school staff. In the other five districts, we trained and supported district staff in administering the surveys using SRI protocols. We followed up with teachers wherever there were significant numbers of students absent on the day of administration to ensure a high response rate in all districts.
Survey Response Rate SRI surveyed 1,656 11th-graders in certified pathways and 2,488 comparison students, excluding Montebello. We achieved an overall response rate of 83% of surveys fielded. Exhibit 3-2 displays response rates for both pathway and comparison students in each district, as well as the overall response rate across the district
Exhibit 3-2 Student Survey Response Rates
Surveys Fielded Response Rate (%)
Antioch
Pathway 148 99% Comparison 328 82 Total 476 87
Long Beach
Pathway 298 92 Comparison 175 88 Total 473 90
Los Angeles
Pathway 175 78 Comparison 326 76 Total 501 77
Montebelloa
Pathway 99 75 Comparison N/A N/A Total 99 75
Oakland
Pathway 164 62 Comparison 472 69 Total 636 67
SRI International 127
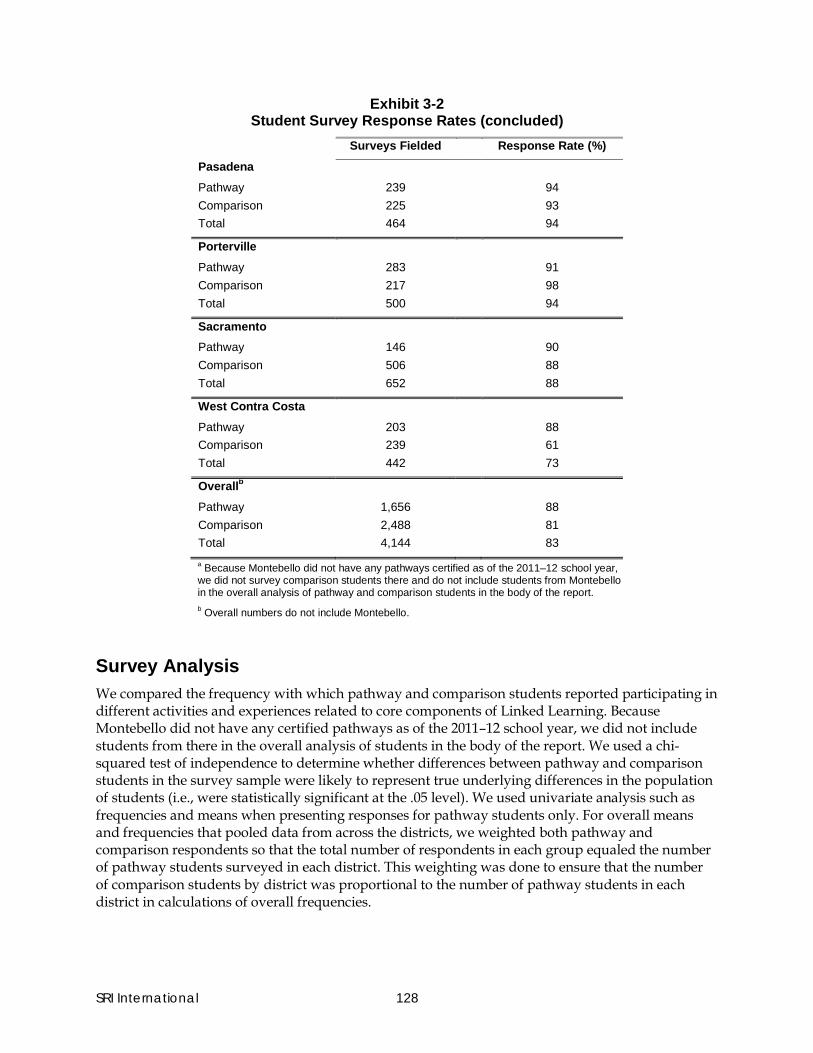
Exhibit 3-2 Student Survey Response Rates (concluded)
Surveys Fielded Response Rate (%)
Pasadena
Pathway 239 94 Comparison 225 93 Total 464 94
Porterville
Pathway 283 91 Comparison 217 98 Total 500 94
Sacramento
Pathway 146 90 Comparison 506 88 Total 652 88
West Contra Costa
Pathway 203 88 Comparison 239 61 Total 442 73
Overallb
Pathway 1,656 88 Comparison 2,488 81 Total 4,144 83 a Because Montebello did not have any pathways certified as of the 2011–12 school year, we did not survey comparison students there and do not include students from Montebello in the overall analysis of pathway and comparison students in the body of the report. b Overall numbers do not include Montebello.
Survey Analysis We compared the frequency with which pathway and comparison students reported participating in different activities and experiences related to core components of Linked Learning. Because Montebello did not have any certified pathways as of the 2011–12 school year, we did not include students from there in the overall analysis of students in the body of the report. We used a chi-squared test of independence to determine whether differences between pathway and comparison students in the survey sample were likely to represent true underlying differences in the population of students (i.e., were statistically significant at the .05 level). We used univariate analysis such as frequencies and means when presenting responses for pathway students only. For overall means and frequencies that pooled data from across the districts, we weighted both pathway and comparison respondents so that the total number of respondents in each group equaled the number of pathway students surveyed in each district. This weighting was done to ensure that the number of comparison students by district was proportional to the number of pathway students in each district in calculations of overall frequencies.
SRI International 128

Survey Results The following tables provide a summary of the results to all the survey items, including those cited in the full report. In these exhibits, the notation SE is used to denote standard error of the percent, n denotes the sample size, X2 denotes the chi-square statistic, df denotes degrees of freedom and p denotes the p-value.
SRI International 129

Exhibit 3-3 Survey Data for Question 2: School climate set by adults
2. Thinking about the adults you know at your school (teachers, guidance counselors, or other school staff). During this school year (2012-2013), how many adults at your school do the following?
Pathway Comparison
Percent SE Percent SE n Weighted n X2 df p
2a. Treat me with respect 41 (1.4) 29 (1.4) 3441 3868 37.9 1 <.0001
2b. Encourage me to continue my education after high school 54 (1.4) 41 (1.5) 3428 3851 39.3 1 <.0001
2c. Make sure students know how they can get help if they fall behind in their classes 31 (1.3) 21 (1.3) 3424 3850 28.6
1 <.0001
2d. Care about how well I'm doing in school 28 (1.2) 16 (1.1) 3434 3858 52.1 1 <.0001
2e. Expect me to do my best all of the time 51 (1.4) 38 (1.5) 3413 3828 38.8 1 <.0001
Note: Percent represents students that responded “All” rather than “None," "A Few," "About half," or "Most."
Exhibit 3-4 Survey Data for Question 3: School climate set by students
3. How many students in your current class do the following?
Pathway Comparison
Percent SE Percent SE n Weighted n X2 df p
3a. Treat each other with respect 58 (1.3) 41 (1.5) 3442 3869 74.0
1 <.0001
3b. See what they learn in high school as useful for the future 46 (1.4) 26 (1.4) 3431 3851 89.9
1 <.0001
3c. Think it's important to get good grades in school 64 (1.3) 48 (1.5) 3438 3862 61.6
1 <.0001
3d. Help each other with school work 57 (1.4) 39 (1.5) 3431 3858 75.0
1 <.0001 Note: Percent represents students that responded “Most" or "All" rather than “None," "A Few," or "About half."
SRI International 130

Exhibit 3-5 Survey Data for Question 4: Personal connection to school
4. To what extent do you agree or disagree with the following statements?
Pathway Comparison
Percent SE Percent SE n Weighted n X2 df p
4a. I feel like I belong at this school. 86 (0.9) 80 (1.2) 3425 3854 13.0
1 0.0003
4b. At least one adult at my school knows me well. 77 (1.2) 72 (1.4) 3422 3850 8.6
1 0.0034 Note: Percent represents students that responded “Agree" or "Strongly agree" rather than "Strongly disagree" or "Disagree."
Exhibit 3-6 Survey Data for Question 5: Non-cognitive skill development (Exhibit 5-2 in Fourth-Year Evaluation Report)
5. To what extent do you think your experiences in high school have helped you in the following areas?
Pathway Comparison
Percent SE Percent SE n Weighted n X2 df p
5a. Believe I can learn something really hard if I try 58 (1.4) 47 (1.5) 3437 3859 28.9 1 <.0001
5b. Believe I can reach my goals if I work hard enough 66 (1.3) 54 (1.5) 3433 3852 38.3 1 <.0001
5c. Learn to manage my time better 39 (1.4) 30 (1.4) 3419 3835 20.0 1 <.0001
5d. Believe that if I want to learn something well I can 56 (1.4) 47 (1.5) 3428 3844 21.8 1 <.0001
5e. See the benefits of doing well in school 65 (1.3) 54 (1.5) 3413 3826 26.7 1 <.0001
5f. Figure out what career I want 30 (1.3) 20 (1.3) 3429 3849 30.7 1 <.0001
5g. Understand what kind of education I need for the career I want 42 (1.4) 28 (1.4) 3435 3854 46.1 1 <.0001
Note: Percent represents students that responded “A lot” rather than “Somewhat,” “A little,” “Not at all,” or “Don’t” know.”
SRI International 131

Exhibit 3-7 Survey Data for Question 6: College and career readiness skill development (Exhibit 5-1 and 5-2 in Fourth-Year Evaluation
Report)
6. To what extent do you think high school has helped you improve your abilities in the following areas?
Pathway Comparison
Percent SE Percent SE n Weighted n X2 df p
6a. Communicate with adults outside of your family 40 (1.3) 29 (1.4) 3418 3830 31.6 1 <.0001
6b. Make a public presentation or perform in front of a group 51 (1.4) 31 (1.4) 3403 3815 97.2 1 <.0001
6c. Write a letter to apply for a job or create a resume 40 (1.3) 22 (1.3) 3376 3794 80.6 1 <.0001
6d. Conduct web searches to answer a question (for example, using Google or Bing) 57 (1.4) 43 (1.5) 3422 3841 44.9
1 <.0001
6e. Judge if you can trust the results of a web search 42 (1.4) 26 (1.3) 3405 3817 68.2 1 <.0001
6f. Summarize information from multiple sources 50 (1.4) 38 (1.5) 3410 3828 34.5 1 <.0001
6g. Get along with people from different backgrounds 67 (1.3) 57 (1.5) 3404 3814 26.9 1 <.0001
6h. Work with people in a professional setting 56 (1.4) 33 (1.4) 3403 3817 120.8 1 <.0001
6i. Work in a group to achieve a shared goal 62 (1.3) 39 (1.5) 3405 3819 128.8 1 <.0001
6j. Accept responsibility for the quality of your work 69 (1.3) 57 (1.5) 3406 3820 37.8 1 <.0001
6k. Know expectations for behavior in a workplace or at a job 65 (1.3) 51 (1.5) 3407 3825 48.6 1 <.0001
6l. Use information to make good decisions 64 (1.3) 52 (1.5) 3417 3835 34.6 1 <.0001
Note: Percent represents students that responded “A lot” rather than “Somewhat,” “A little,” “Not at all,” or “Don’t know.”
SRI International 132

Exhibit 3-8 Survey Data for Question 7a: Students who report they would be most likely to talk with a teacher about a problem in class
7. Thinking about adults in your school:
Pathway Comparison
Percent SE Percent SE n Weighted n X2 df p
7a. Who are you most likely to talk with if you are having a problem in class? 58 (1.4) 45 (1.5) 3370 3798 37.2
1 <.0001
Note: Percent represents students that responded “Teachers" rather than “Principal," Assistant Principal," "Other adult at my school" or "No adult at my school."
Exhibit 3-9 Survey Data for Question 7b: Students who report they would be most likely to talk with no adult at their school about a
problem with classmates or friends
7. Thinking about adults in your school:
Pathway Comparison
Percent SE Percent SE n Weighted n X2 df p
7b. Who are you most likely to talk with if you are having a problem with other students such as friends or classmates? 39 (1.4) 47 (1.5) 3374 3790 15.1
1 0.0001
Note: Percent represents students that responded “No adult at my school" rather than "Principal," "Assistant Principal," "Teacher," "Counselor," or "Other adult at my school."
SRI International 133

Exhibit 3-10 Survey Data for Question 7c: Students who report they would be most likely to talk with a counselor about plans after high
school
7. Thinking about adults in your school:
Pathway Comparison
Percent SE Percent SE n Weighted n X2 df p
7c. Who are you most likely to talk with about your plans after high school? 40 (1.4) 44 (1.6) 3356 3776 3.4 1 0.0654
Note: Percent represents students that responded “Counselor" rather than "Principal," "Assistant Principal," "Teacher," "Other adult at my school" or "No adult at my school."
Exhibit 3-11 Survey Data for Question 8: Students reporting that there are counselors at their school
8. Are there counselors at your school?
Pathway Comparison
Percent SE Percent SE n Weighted n X2 df p
Yes 95 (0.6) 96 (0.5) 3416 3837 3.6
1 0.0590 Note: Percent represents students that responded “Yes" rather than "No" or “Don’t know.”
SRI International 134

Exhibit 3-12 Survey Data for Question 9: Students reporting having the same counselor throughout high school
9. Have you had the same counselor for the whole time you have been at this high school?
Pathway Comparison
Percent SE Percent SE n Weighted n X2 df p
Yes 63 (1.3) 53 (1.5) 3416 3838 23.2
1 <.0001 Note: Percent represents students that responded “Yes" rather than "No" or “Don’t know.”
Exhibit 3-13 Survey Data for Question 10: Frequency of students’ interactions with counselors
10. During this school year (2012-13), how frequently have you met with your counselor?
Pathway Comparison
Percent SE Percent SE n Weighted n X2 df p
A few times a year/About once a month/At least once a week 53 (1.4) 58 (1.5) 3259 3669 5.7 1 0.0174 Note: Percent represents students that responded “A few times this year," "About once a month," or "At least once a week" rather than "Never" or "Once or twice this year.”
SRI International 135

Exhibit 3-14 Survey Data for Question 11: Types of support provided by counselors
11. During this school year (2012-13), has a counselor at your school helped you understand the following?
Pathway Comparison
Percent SE Percent SE n Weighted n X2 df p
11a. High school graduation requirements 65 (1.3) 65 (1.4) 3250 3649 0.0
1 0.9648
11b. What I want to do after I graduate from high school 34 (1.4) 31 (1.5) 3245 3648 2.2
1 0.1389
11c. What kind of education or training I will need after HS to help prepare me for my possible career 34 (1.4) 32 (1.5) 3237 3637 1.5
1 0.2283
11d. What high school courses I will need to get into college 56 (1.4) 56 (1.5) 3241 3644 0.1
1 0.7720
11e. How to choose a 2- or 4- year college 38 (1.4) 38 (1.6) 3233 3636 0.0
1 0.8474
11f. How to choose a career training program or trade school (such as information and technology (IT) school, automotive school, cooking school, beauty school, etc.) 25 (1.3) 22 (1.4) 3236 3633 1.9
1 0.1661
11g. Financial aid options (how to pay for college or a training program). 28 (1.3) 30 (1.6) 3240 3638 0.6
1 0.4265 Note: Percent represents students that responded “A lot” rather than “Not at all" or "A little."
SRI International 136

Exhibit 3-15 Survey Data for Question 12: Types of support provided by teachers (Exhibit 3-5 in Fourth-Year Evaluation Report)
12. During this school year (2012-13), has at least one teacher at your school helped you understand the following?
Pathway Comparison Percent SE Percent SE n Weighted n X2 df p
12a. High school graduation requirements. 63 (1.3) 51 (1.5) 3401 3814 30.7 1 <.0001
12b. What I want to do after I graduate from high school 43 (1.4) 29 (1.4) 3390 3802 46.6 1 <.0001
12c. What kind of education or training I will need after high school to help prepare me for my possible career 42 (1.4) 29 (1.4) 3386 3796 43.0
1 <.0001
12d. High school courses I will need to get into college 53 (1.4) 44 (1.5) 3395 3805 19.0 1 <.0001
12e. How to choose a 2- or 4- year college 41 (1.4) 32 (1.5) 3377 3786 22.8 1 <.0001
12f. How to choose a career training program or trade school (such as information and technology (IT) school, automotive school, cooking school, beauty school, etc.) 29 (1.3) 22 (1.4) 3390 3796 10.4
1 0.0013
12g. Financial aid options (i.e., how to pay for college or a training program). 31 (1.3) 27 (1.5) 3391 3800 4.3
1 0.0390
Note: Percent represents students that responded “A lot” rather than “Not at all" or "A little."
SRI International 137

Exhibit 3-16 Survey Data for Question 13: Enrollment in advanced coursework
13. Since you started high school have you enrolled in any of the following kinds of courses?
Pathway Comparison Percent SE Percent SE n Weighted n X2 df p
13a. Advanced Placement 38 (1.3) 44 (1.5) 3364 3752 9.1 1 0.0026
13b. International Baccalaureate (IB) 2 (0.4) 4 (0.8) 3263 3617 6.5 1 0.0106
13c. Honors course 40 (1.4) 45 (1.6) 3318 3688 5.7 1 0.0169
13d. Course that gives you credits that can transfer to college (including classes taken at a community college or university but NOT including AP or IB classes) 31 (1.3) 24 (1.4) 3279 3654 12.5
1 0.0004
Note: Percent represents students that responded “Yes" rather than “No."
SRI International 138

Exhibit 3-17 Survey Data for Question 14: Frequency with which teachers make coursework relevant
14. Since the beginning of this school year (2012-13), how often has at least one of your teachers done the following?
Pathway Comparison
Percent SE Percent SE n Weighted n X2 df p
14a. Discussed how to apply what you are learning in class to the real world 49 (1.4) 41 (1.5) 3404 3812 17.0
1 <.0001
14b. Explained how what you learn in one class relates to what you learn in another class 52 (1.4) 42 (1.5) 3400 3806 23.7
1 <.0001
14c. Explained how what you learn in class could be applied to what you might do after school 53 (1.4) 45 (1.5) 3400 3805 15.5
1 <.0001
14d. Asked you to use tools or equipment (such as computers or machinery) that you might use in a job 55 (1.4) 42 (1.5) 3397 3804 36.6
1 <.0001
Note: Percent represents students that responded “About once a month," About twice a month" or "At least once a week" rather than "Never," "Once or twice this year" or "A few times this year."
SRI International 139

Exhibit 3-18 Survey Data for Question 15: Frequency with which teachers make coursework challenging
15. Since the beginning of this school year (2012-13), how often has at least one of your teachers done the following?
Pathway Comparison
Percent SE Percent SE n Weighted n X2 df p
15a. Required you to work on a project that lasted for 2 weeks or longer 37 (1.3) 23 (1.3) 3382 3784 53.6
1 <.0001
15b. Required you to work with other students on projects 55 (1.4) 43 (1.5) 3378 3780 30.9
1 <.0001
15c. Challenged you to understand difficult topics 62 (1.3) 54 (1.5) 3366 3762 17.8
1 <.0001 15d. Provided a rubric for an assignment so you know how you will be graded 63 (1.3) 50 (1.5) 3371 3764 36.7
1 <.0001
Note: Percent represents students that responded “About once a month," "About twice a month," or "At least once a week" rather than "Never," "Once or twice this year" or "A few times this year."
SRI International 140

Exhibit 3-19 Survey Data for Question 16: Work-based learning participation (Exhibit 3-1 in Fourth-Year Evaluation Report)
16. During this school year (2012-13), have you participated in any of the following work-based learning experiences as part of your high school program?
Pathway Comparison Percent SE Percent SE n Weighted n X2 df p
16a. Listening to guest speakers from a particular industry of profession. 79 (1.1) 65 (1.5) 3371 3769 57.3
1 <.0001
16b. Participating in career explorations field trips arranged by your school such as company tours or job shadowing (visits to work places to observe one worker or many workers) 48 (1.4) 26 (1.4) 3365 3763
112.3
1 <.0001
16c. Community service (volunteer work arranged by your school to support your local community) 50 (1.4) 36 (1.6) 3368 3764 42.2
1 <.0001
16d. Cooperative education (work experience that is part of a career-themed class and for which you earn class credit) 41 (1.4) 27 (1.5) 3367 3760 47.3
1 <.0001
16e. Internship (work experience arranged or required by your school, but not necessarily part of a career-themed class) 33 (1.3) 17 (1.3) 3369 3767 65.0
1 <.0001
16f. Mentoring (a school-arranged match with an adult for career advice and support) 30 (1.3) 22 (1.4) 3372 3763 21.0
1 <.0001
16g. School-based enterprise (working in a business run by students or teachers from your school, such as a school store) 27 (1.2) 21 (1.3) 3364 3760 12.2
1 0.0005
16h. Career-related student competitions (for example, a marketing campaign or fundraiser) 40 (1.4) 30 (1.5) 3369 3768 25.0
1 <.0001
16i. Mentoring or tutoring another student on a regular basis as arrange by your school. 30 (1.3) 24 (1.4) 3362 3755 9.4
1 0.0021
16 all. Any of the work-based learning opportunities listed in "a-i" above 89 (0.9) 76 (1.3) 3459 3896 67.7
1 <.0001 Note: Percent represents students that responded “Yes” rather than “No.”
SRI International 141

Exhibit 3-20 Survey Data for Question 17: Course grades linked to work-based learning experiences
17. Does your performance or participation in any of the work-based learning experiences in Question 16 affect your grade in at least one of your high school classes?
Pathway Comparison
Percent SE Percent SE n Weighted n X2 df p
Yes 48 (1.5) 42 (1.8) 2708 3104 6.0 1 0.0142 Note: Percent represents students that responded “Yes” rather than “No.”
Exhibit 3-21 Survey Data for Question 18: Experiences with work-based learning
18. Thinking about your work-based learning experience(s) from Question 16, how often have you done the following during this school year (2012-13)?
Pathway Comparison
Percent SE Percent SE n Weighted n X2 df p
18a. Tied your work-based learning experience(s) back to a school project or other classwork 28 (1.3) 17 (1.4) 2628 3077 25.9
1 <.0001
18b. Used tools or equipment (such as computers or machinery) 46 (1.5) 35 (1.8) 2614 3064 23.4
1 <.0001 Note: Percent represents students that responded “Most of the time" or "Always" rather than "Never," "Rarely," or "Sometimes."
SRI International 142

Exhibit 3-22 Survey Data for Question 19: Satisfaction with work-based learning experiences
19. Thinking back to your previous work-based learning experience(s) from Question 16, how satisfied were you overall with these experiences during this school year (2012-13)?
Pathway Comparison
Percent SE Percent SE n Weighted n X2 df p
Satisfied/Very Satisfied 58 (1.5) 41 (1.8) 2605 3054 50.5
1 <.0001 Note: Percent represents students that responded “Satisfied" or "Very Satisfied" rather than "Not at all satisfied" or "Somewhat satisfied."
Exhibit 3-23
Survey Data for Question 20: Perceived preparation for college and/or career
20. Do you think high school will prepare you for the following?
Pathway Comparison
Percent SE Percent SE n Weighted n X2 df p
20a. College 92 (0.7) 87 (1.0) 3348 3761 15.0
1 0.0001
20b. Job or career of my choice 79 (1.2) 69 (1.4) 3278 3670 27.8
1 <.0001 Note: Percent represents students that responded “Yes” rather than “No."
SRI International 143

Exhibit 3-24 Survey Data for Question 21: Projected completion of a-g requirements
21. By the end of high school, do you think you will complete the course required to enter the University of California and California State University systems (referred to as the a-g courses)?
Pathway Comparison
Percent SE Percent SE n Weighted n X2 df p
Yes 70 (1.3) 66 (1.4) 3371 3777 6.2 1 0.0130 Note: Percent represents students that responded “Yes” rather than “No" or “Don’t know.”
Exhibit 3-25 Survey Data for Question 22: Plans to complete technical or trade school
22. Do you plan to complete any kind of technical or trade school (for example, information and technology (IT) school, automotive school, cooking school, beauty school, etc.)?
Pathway Comparison
Percent SE Percent SE n Weighted n X2 df p
Yes 37 (1.3) 38 (1.5) 3347 3750 0.2 1 0.6300 Note: Percent represents students that responded “Yes” rather than “No."
SRI International 144

Exhibit 3-26 Survey Data for Question 23: Highest level of education expected
23. What is the highest level of education you think you will complete in your lifetime?
Pathway Comparison
Percent SE Percent SE n Weighted n X2 df p
Degree from a 2-year community college/Degree from a 4-year college/Graduate degree 95 (0.6) 92 (0.8) 3359 3769 11.2
1 0.0008
Note: Percent represents students that responded “Degree from a 2-year community college," "Degree from a 4-year college" or "Graduate degree" rather than "Less than high school" or "High school diploma."
Exhibit 3-27 Survey Data for Question 24: Pathway influence on student goals (pathway students only)
24. To what extent do you feel your experiences in a pathway, academy or career/industry-themed school has influenced your goals?
Pathway
Percent SE n Weighted n Helped me know that I want to continue my education or training beyond high school 51 (1.4) 1365 1839
Note: Percent represents students that responded “A lot” rather than “Not at all," "A little" or "Somewhat."
SRI International 145

Exhibit 3-28 Survey Data for Question 25: Future job or career interest known
25. Do you know what job or career you want to have in the future?
Pathway Comparison
Percent SE Percent SE n Weighted n X2 df p
Yes 73 (1.2) 73 (1.4) 3346 3750 0.0 1 0.9483 Note: Percent represents students that responded “Yes” rather than “No."
Exhibit 3-29 Survey Data for Question 27: Student Gender
27. Are you male or female?
Pathway Comparison
Percent SE Percent SE n Weighted n X2 df p
Are you male or female? 49 (1.4) 51 (1.5) 3356 3763 1.1 1 0.3014 Note: Percent represents students that responded “Male" rather than “Female."
Exhibit 3-30 Survey Data for Question 28: Student Grade
28. What grade are you in?
Pathway Comparison
Percent SE Percent SE n Weighted n X2 df p
What grade are you in? 99 (0.3) 98 (0.5) 3365 3774 1.8 1 0.1781 Note: Percent represents students that responded “11th grade" rather than “9th grade," "10th grade" or "12th grade."
SRI International 146

Exhibit 3-31 Survey Data for Question 29: Student Ethnicity
29. What is your race/ethnicity?
Pathway Comparison
Percent SE Percent SE n Weighted n X2 df p
29a. Latino 66 (1.3) 50 (1.6) 3324 3729 56.5
1 <.0001
29b. American Indian 0 (0.1) 0 (0.1) 3324 3729 0.1
1 0.8207
29c. Asian 6 (0.7) 14 (1.2) 3324 3729 31.4
1 <.0001
29d. Black 8 (0.7) 11 (1.0) 3324 3729 9.4
1 0.0022
29e. Pacific Islander 0 (0.2) 1 (0.3) 3324 3729 1.9
1 0.1706
29f. White 11 (0.9) 9 (0.8) 3324 3729 1.6
1 0.2076
29g. Multi 7 (0.7) 11 (1.0) 3324 3729 11.2
1 0.0008
29h. Other 2 (0.4) 4 (0.6) 3324 3729 6.2
1 0.0131 Note: Percent represents students that responded “Yes” rather than "No."
SRI International 147

Exhibit 3-32
Survey Data for Question 30: Highest level of education completed by a parent or guardian
30. Think of one of your parents or guardians. What is the highest level of school this person completed?
Pathway Comparison
Percent SE Percent SE n Weighted n X2 df p
Didn't graduate high school 25 (1.2) 21 (1.3) 3295 3707 3.9
1 0.0470 Note: Percent represents students that responded “Did not graduate from high school" rather than "Graduated from high school," "Went to college, but did not graduate," "Graduated from a 2-year college or technical/trade school," "Graduated from a 4-year college," Earned a graduate degree" or "Don't know."
Exhibit 3-33 Survey Data for Question 31: Highest level of education completed by a second parent or guardian
31. If you have a second parent or guardian, what is the highest level of school this person completed?
Pathway Comparison
Percent SE Percent SE n Weighted n X2 df p
Didn't graduate high school 28 (1.3) 24 (1.4) 3259 3673 4.5
1 0.0341 Note: Percent represents students that responded “Did not graduate from high school" rather than "Graduated from high school," "Went to college, but did not graduate," "Graduated from a 2-year college or technical/trade school," "Graduated from a 4-year college," Earned a graduate degree," "Don't know" or "Do not have a second parent or guardian."
SRI International 148

References Farrington, C. A., Roderick, M., Allensworth, E., Nagaoka, J., Keyes, T. S., Johnson, D. W., &
Beechum, N. O. (2012). Teaching adolescents to become learners. The role of noncognitive factors in shaping school performance: A critical literature review. IL: University of Chicago Consortium on Chicago School Research.
Guha, R., Adelman, N., Arshan, N., Bland, J., Caspary, K., Padilla, C., Patel, D., Tse, V., Black, A., & Biscocho, F. (2013). Taking stock of the California Linked Learning District Initiative. Fourth-year evaluation report. Menlo Park, CA: SRI International.
Kennedy, Peter. 2003. A Guide to Econometrics, Fifth Edition. The MIT Press, Cambridge, MA.
SRI International 149