talent: the future of st. louis metro in the knowledge...
TRANSCRIPT

Talent: The Future of
Metro St. Louis in the
Knowledge Economy
2 | Talent: The Future of Metro St. Louis in the Knowledge Economy
Contents
Preface ...................................................................................................................................................................................3
1. Today’s Challenges: St. Louis and the Great Recession ....................................................................................... 4
2. Regional Collaboration: A New Approach for a New Economy .................................................................... 10
3. Talent Development, Job Creation, and Economic Growth: A Virtuous Circle for the Future ................ 12
4. The St. Louis Metro Economy ............................................................................................................................... 18
5. Opportunity: Financial and Information Services ............................................................................................ 28
6. Opportunity: Sustainable Technologies ............................................................................................................... 42
7. Opportunity: Health Science and Services ......................................................................................................... 53
8. The Forces of Continuous Change ....................................................................................................................... 69
9. A New Regional Framework for Talent Development ..................................................................................... 76
10. Leveraging Resources: The Importance of Partnerships ................................................................................100
11. Recommendations .................................................................................................................................................106
Supplemental reports published under separate cover:
St. Louis Regional Chamber & Growth Association
June 2011
The views and opinions expressed in this report are those of the author and do not necessarily represent the views and opinions of the funders or partners.
Talent: The Future of Metro St. Louis in the Knowledge Economy
CHAPTER 1
RCGA | 3
Talented people are capable of many things. They:
Preface
Have developed their “natural ability to do something well” (The Dictionary)
Demonstrate the knowledge, skills, and abilities to perform jobs in demand in today’s economy (O*Net)
Exhibit a “recurring pattern of thought, feeling, or behavior that can be productively applied” in the workplace (Gallup Management Journal)
Are “a good fit” with the culture of the organization or situation in which they work (St. Louis area employers)
Can think creatively (The Economist)
Have a continuing “hunger for learning” (Malcolm Gladwell).
Without talent, the St. Louis metro economy cannot thrive in the competitive global marketplace of which we are a part.
4 | Talent: The Future of Metro St. Louis in the Knowledge Economy
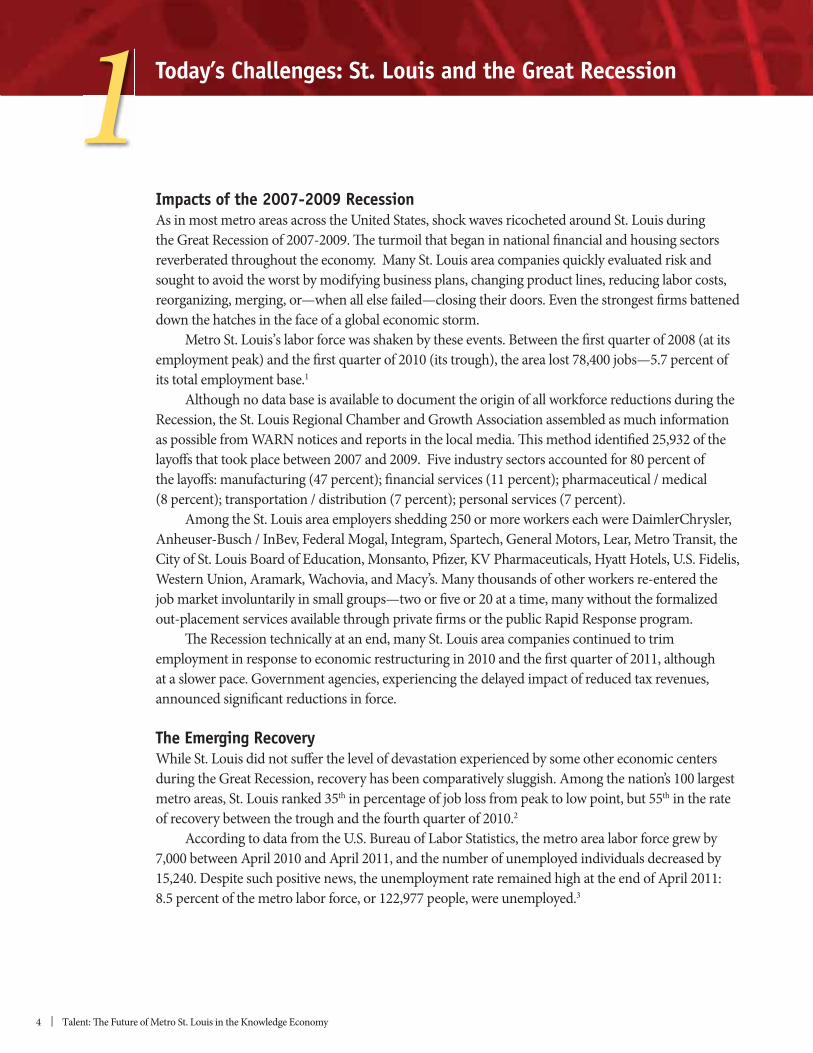
Impacts of the 2007-2009 Recession
reverberated throughout the economy. Many St. Louis area companies quickly evaluated risk and sought to avoid the worst by modifying business plans, changing product lines, reducing labor costs, reorganizing, merging, or—when all else failed—closing their doors. Even the strongest firms battened down the hatches in the face of a global economic storm.
employment peak) and the first quarter of 2010 (its trough), the area lost 78,400 jobs—5.7 percent of its total employment base.1 Although no data base is available to document the origin of all workforce reductions during the Recession, the St. Louis Regional Chamber and Growth Association assembled as much information
layoffs that took place between 2007 and 2009. Five industry sectors accounted for 80 percent of the layoffs: manufacturing (47 percent); financial services (11 percent); pharmaceutical / medical (8 percent); transportation / distribution (7 percent); personal services (7 percent). Among the St. Louis area employers shedding 250 or more workers each were DaimlerChrysler,
job market involuntarily in small groups—two or five or 20 at a time, many without the formalized
The Recession technically at an end, many St. Louis area companies continued to trim employment in response to economic restructuring in 2010 and the first quarter of 2011, although at a slower pace. Government agencies, experiencing the delayed impact of reduced tax revenues, announced significant reductions in force.
The Emerging Recovery
during the Great Recession, recovery has been comparatively sluggish. Among the nation’s 100 largest metro areas, St. Louis ranked 35th in percentage of job loss from peak to low point, but 55th in the rate of recovery between the trough and the fourth quarter of 2010.2
7,000 between April 2010 and April 2011, and the number of unemployed individuals decreased by 15,240. Despite such positive news, the unemployment rate remained high at the end of April 2011: 8.5 percent of the metro labor force, or 122,977 people, were unemployed.3
Today’s Challenges: St. Louis and the Great Recession1
RCGA | 5
CHAPTER 1
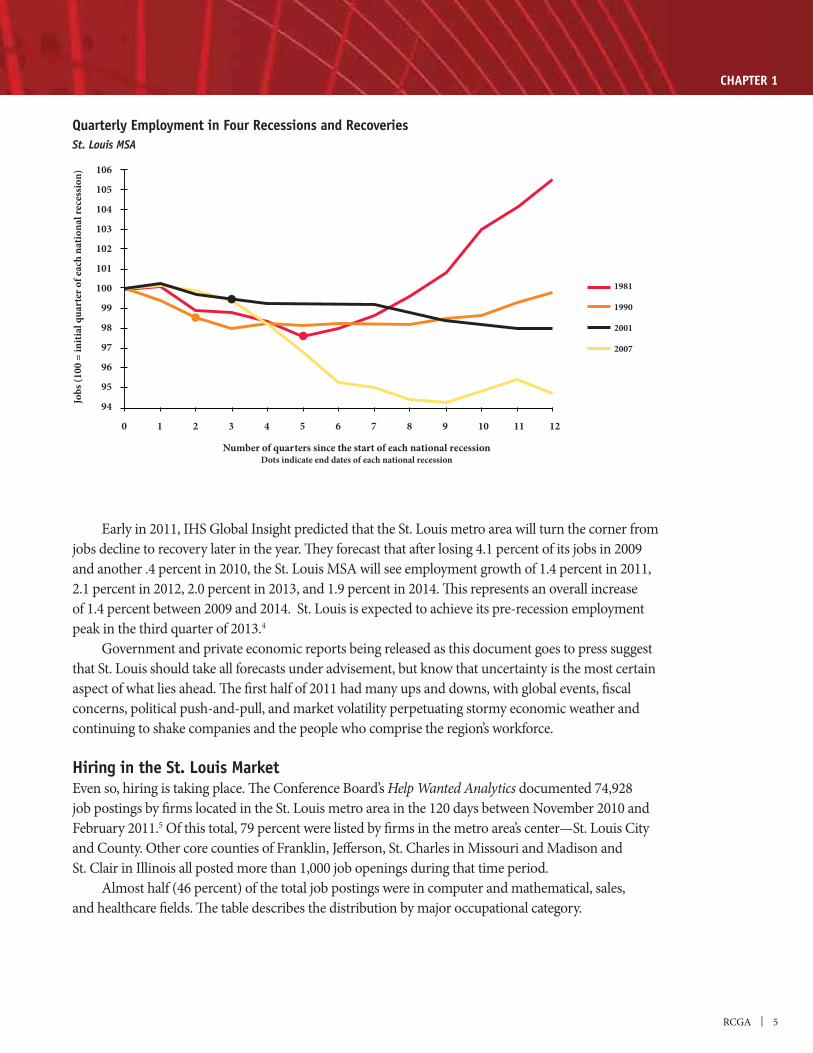
Early in 2011, IHS Global Insight predicted that the St. Louis metro area will turn the corner from jobs decline to recovery later in the year. They forecast that after losing 4.1 percent of its jobs in 2009 and another .4 percent in 2010, the St. Louis MSA will see employment growth of 1.4 percent in 2011, 2.1 percent in 2012, 2.0 percent in 2013, and 1.9 percent in 2014. This represents an overall increase
peak in the third quarter of 2013.4 Government and private economic reports being released as this document goes to press suggest that St. Louis should take all forecasts under advisement, but know that uncertainty is the most certain aspect of what lies ahead. The first half of 2011 had many ups and downs, with global events, fiscal
continuing to shake companies and the people who comprise the region’s workforce.
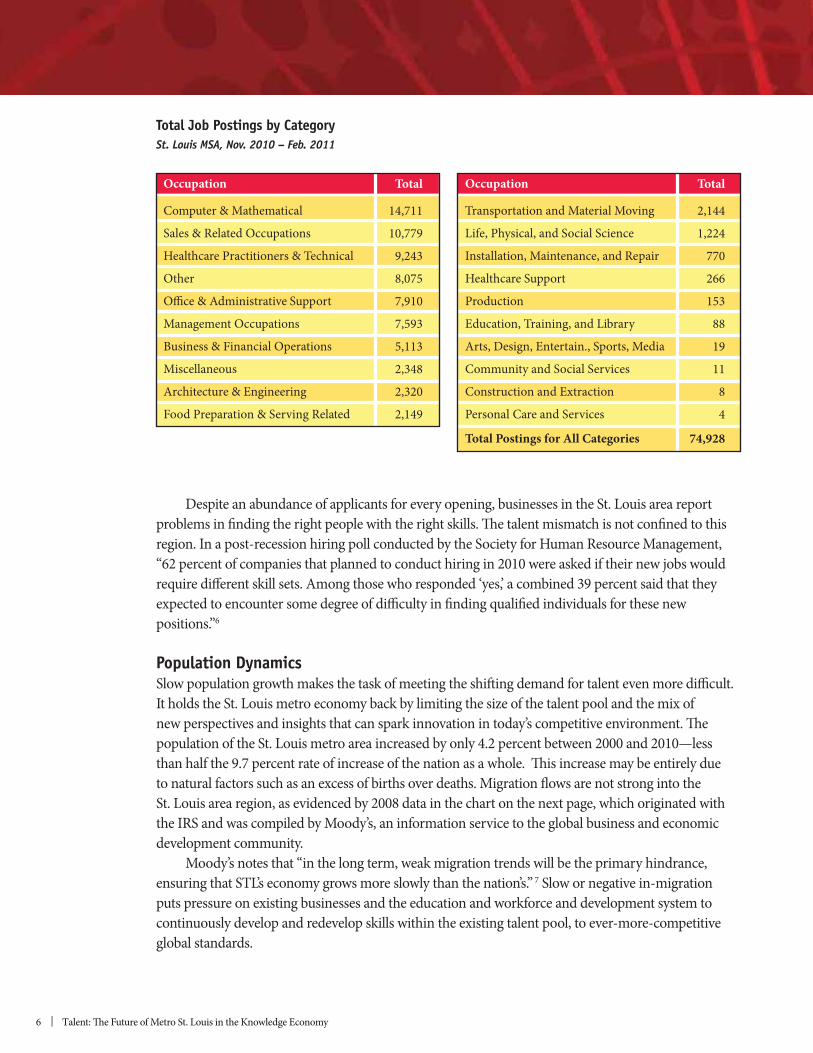
Hiring in the St. Louis MarketHelp Wanted Analytics documented 74,928
job postings by firms located in the St. Louis metro area in the 120 days between November 2010 and February 2011.5 Of this total, 79 percent were listed by firms in the metro area’s center—St. Louis City and County. Other core counties of Franklin, Jefferson, St. Charles in Missouri and Madison and St. Clair in Illinois all posted more than 1,000 job openings during that time period. Almost half (46 percent) of the total job postings were in computer and mathematical, sales, and healthcare fields. The table describes the distribution by major occupational category.
0 1 2 3 4 5 6 7 8 9 10 11 12
106
105
104
103
102
101
100
99
98
97
96
95
94Jobs
(100
= in
itial
qua
rter
of e
ach
natio
nal r
eces
sion)
Number of quarters since the start of each national recessionDots indicate end dates of each national recession
1981
1990
2001
2007
Quarterly Employment in Four Recessions and RecoveriesSt. Louis MSA
6 | Talent: The Future of Metro St. Louis in the Knowledge Economy
Total
2,144
1,224
770
266
153
88
19
11
8
4
74,928
Occupation
Transportation and Material Moving
Life, Physical, and Social Science
Installation, Maintenance, and Repair
Healthcare Support
Production
Education, Training, and Library
Arts, Design, Entertain., Sports, Media
Community and Social Services
Construction and Extraction
Personal Care and Services
Total Postings for All Categories
Total
14,711
10,779
9,243
8,075
7,910
7,593
5,113
2,348
2,320
2,149
Occupation
Computer & Mathematical
Sales & Related Occupations
Healthcare Practitioners & Technical
Other
Office & Administrative Support
Management Occupations
Business & Financial Operations
Miscellaneous
Architecture & Engineering
Food Preparation & Serving Related
Total Job Postings by CategorySt. Louis MSA, Nov. 2010 – Feb. 2011
Despite an abundance of applicants for every opening, businesses in the St. Louis area report problems in finding the right people with the right skills. The talent mismatch is not confined to this
“62 percent of companies that planned to conduct hiring in 2010 were asked if their new jobs would require different skill sets. Among those who responded ‘yes,’ a combined 39 percent said that they expected to encounter some degree of difficulty in finding qualified individuals for these new positions.”6
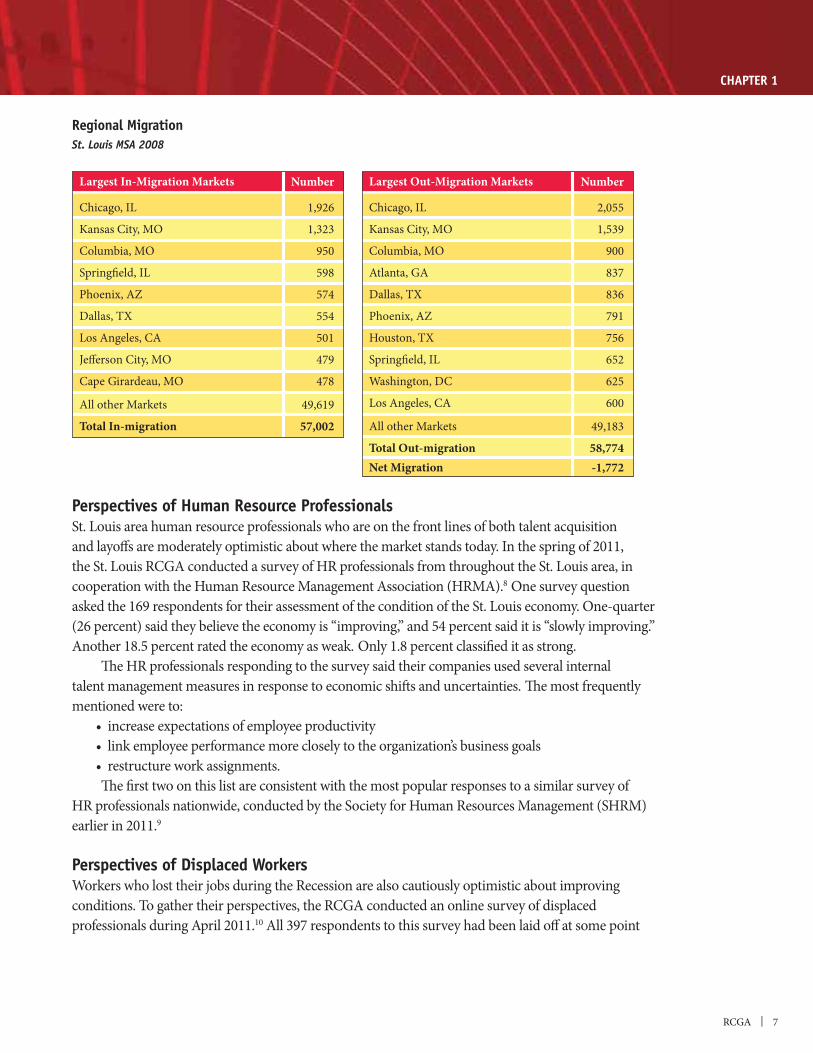
Population DynamicsSlow population growth makes the task of meeting the shifting demand for talent even more difficult. It holds the St. Louis metro economy back by limiting the size of the talent pool and the mix of new perspectives and insights that can spark innovation in today’s competitive environment. The population of the St. Louis metro area increased by only 4.2 percent between 2000 and 2010—less than half the 9.7 percent rate of increase of the nation as a whole. This increase may be entirely due to natural factors such as an excess of births over deaths. Migration flows are not strong into the St. Louis area region, as evidenced by 2008 data in the chart on the next page, which originated with the IRS and was compiled by Moody’s, an information service to the global business and economic development community. Moody’s notes that “in the long term, weak migration trends will be the primary hindrance, ensuring that STL’s economy grows more slowly than the nation’s.” 7
puts pressure on existing businesses and the education and workforce and development system to
global standards.
RCGA | 7
CHAPTER 1
Number
2,055
1,539
900
837
836
791
756
652
625
600
49,183
58,774-1,772
Largest Out-Migration Markets
Chicago, IL
Kansas City, MO
Columbia, MO
Atlanta, GA
Dallas, TX
Phoenix, AZ
Houston, TX
Springfield, IL
Washington, DC
Los Angeles, CA
All other Markets
Total Out-migrationNet Migration
Number
1,926
1,323
950
598
574
554
501
479
478
49,619
57,002
Largest In-Migration Markets
Chicago, IL
Kansas City, MO
Columbia, MO
Springfield, IL
Phoenix, AZ
Dallas, TX
Los Angeles, CA
Jefferson City, MO
Cape Girardeau, MO
All other Markets
Total In-migration
Regional MigrationSt. Louis MSA 2008
Perspectives of Human Resource ProfessionalsSt. Louis area human resource professionals who are on the front lines of both talent acquisition and layoffs are moderately optimistic about where the market stands today. In the spring of 2011, the St. Louis RCGA conducted a survey of HR professionals from throughout the St. Louis area, in cooperation with the Human Resource Management Association (HRMA).8 One survey question
(26 percent) said they believe the economy is “improving,” and 54 percent said it is “slowly improving.” Another 18.5 percent rated the economy as weak. Only 1.8 percent classified it as strong. The HR professionals responding to the survey said their companies used several internal talent management measures in response to economic shifts and uncertainties. The most frequently mentioned were to:
The first two on this list are consistent with the most popular responses to a similar survey of HR professionals nationwide, conducted by the Society for Human Resources Management (SHRM) earlier in 2011.9
Perspectives of Displaced Workers
conditions. To gather their perspectives, the RCGA conducted an online survey of displaced professionals during April 2011.10 All 397 respondents to this survey had been laid off at some point
8 | Talent: The Future of Metro St. Louis in the Knowledge Economy
Less than half (43 percent) of the respondents agreed that the region’s economic outlook is better now than it was one year ago. The percentages varied between those who had gone back to work and
that the economy had improved, compared to 38 percent of those still trying to find new work. The 236 individuals who provided information about the length of time they had been looking for work described a wide range of experiences. Almost 32 percent said that they found work within six months, but another 34 percent looked for more than one year. One of every ten (10.6 percent) indicated that they have been in and out of several jobs during the past three years.
The Future: Strengths, Weaknesses, Opportunities, and Threats
Recession, the sluggish and uncertain recovery, the complex global environment, and slow population growth in St. Louis all represent significant external threats and internal weaknesses for the future.
not been for the region to throw up our collective hands in resignation; rather it has been to chart a new path forward to ensure that the St. Louis metro economy has the talent it needs to fuel a better future—building on the internal strengths and external opportunities we have identified. The rest of this report presents the research, the players, the process, and the learnings that carved that path. Section 2 identifies the business leaders and the many public and private sector partners that formed the core leadership of this planning process. They are among our most important strengths.
talent strategy and how we sought to connect it to the Greater St. Louis Economic Development Plan
the partners, building on key strengths and overcoming the weakness of previously fragmented
Section 3 articulates the vision of a more economically competitive region, names our key competitors in the national marketplace of talent and jobs, and provides baseline numbers for the
of economic vitality’ as a symbol of the inextricable relationship between talent development, job creation, and economic growth and point to the importance of coordinated plans as a foundation for collaboration. Section 4 defines the St. Louis metro economy in terms of population, workforce, employment, and business trends. The three sections that follow provide similar detail about the economic opportunity clusters targeted under this plan: Financial and Information Services (Section 5), Sustainable Technologies (Section 6), and Health Science and Services (Section 7). In these sections,
the fact that our greatest strengths can, in fact, become weaknesses if we do not pay careful attention to the transformation underway inside and external to them.
RCGA | 9
CHAPTER 1
Section 8 identifies 11 macro forces of continuing change that will shape and reshape workforce demand in the near future. These forces are altering the work that we do, who does it, where and how it gets done. They also are driving significant change within the higher education system that prepares
threats to future competitiveness. Section 9 brings together much of what the partners have learned in this planning process and presents an original framework for coordinated talent development. This framework is at the heart of the strategy. It describes the three elements of a great workforce and provides informational tools with which to advance them. It provides a shared reference for business, education, economic development,
Section 10 acknowledges the impact that the economic downturn has had on resources available to support talent development and points to the importance of leveraging existing programs in the
recommendations to advance economic vitality in metro St. Louis’s future. Readers who would like to know more are referred to a series of supplemental reports that have been published as separate documents. They are listed on the Contents page.
______________
1. IHS Global Insight, Inc. Summary of U.S. Metro Unemployment / Employment Forecasts.
Population Survey.” Note that April 2011 rates are preliminary. www.bls.gov/data/#unemployment.
4. IHS Global Insight, Inc. Summary of U.S. Metro Unemployment / Employment Forecasts.
Help Wanted Analytics, accessed by the Missouri Economic Research and Information Center (MERIC), February 24, 2011.
www.shrm.org
Survey of St. Louis Area HR Professionals.” This survey is described in more detail in Section 9, A New Regional Framework for Talent Development, and is available as a supplemental report.
9. Society for Human Resource Management. 2011 Workplace Forecast: The Top Workplace Trends According to HR Professionals. www.shrm.org
10. St. Louis Regional Chamber and Growth Association. “Perspectives of St. Louis Area Professionals Changing Careers in a Turbulent Economy.” May 2011. Available as a supplemental report.
10 | Talent: The Future of Metro St. Louis in the Knowledge Economy
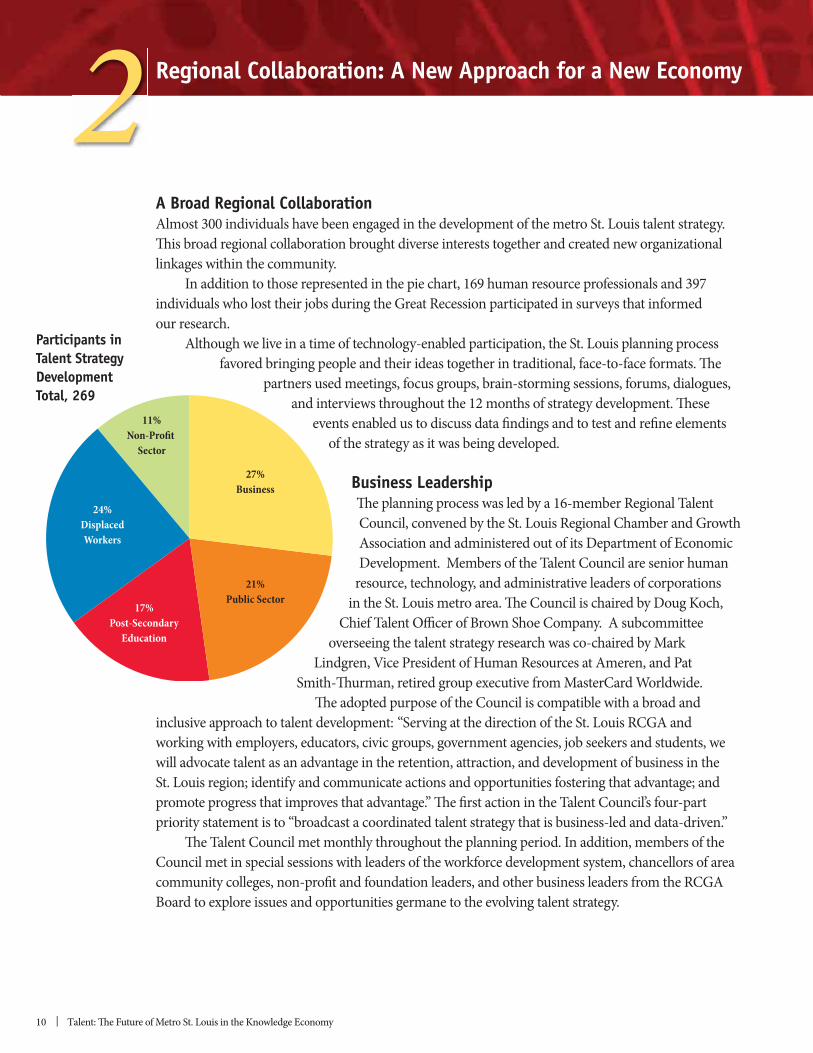
A Broad Regional CollaborationAlmost 300 individuals have been engaged in the development of the metro St. Louis talent strategy. This broad regional collaboration brought diverse interests together and created new organizational linkages within the community.
In addition to those represented in the pie chart, 169 human resource professionals and 397 individuals who lost their jobs during the Great Recession participated in surveys that informed our research.
and interviews throughout the 12 months of strategy development. These events enabled us to discuss data findings and to test and refine elements
of the strategy as it was being developed.
Business Leadership
Council, convened by the St. Louis Regional Chamber and Growth Association and administered out of its Department of Economic Development. Members of the Talent Council are senior human
resource, technology, and administrative leaders of corporations
Lindgren, Vice President of Human Resources at Ameren, and Pat
The adopted purpose of the Council is compatible with a broad and inclusive approach to talent development: “Serving at the direction of the St. Louis RCGA and working with employers, educators, civic groups, government agencies, job seekers and students, we will advocate talent as an advantage in the retention, attraction, and development of business in the St. Louis region; identify and communicate actions and opportunities fostering that advantage; and
The Talent Council met monthly throughout the planning period. In addition, members of the Council met in special sessions with leaders of the workforce development system, chancellors of area
Regional Collaboration: A New Approach for a New Economy2
27%Business
21%Public Sector
17%Post-Secondary
Education
24%DisplacedWorkers
11%Non-Profit
Sector
Participants in Talent Strategy DevelopmentTotal, 269
CHAPTER 2
RCGA | 11
Public Sector LeadershipMembers of the Talent Council, senior staff at the RCGA, and project consultants conferred with
County Partners.
implemented an innovative program for displaced workers, with special outreach to individuals transitioning into work in the targeted economic clusters of this plan: information technology, finance,
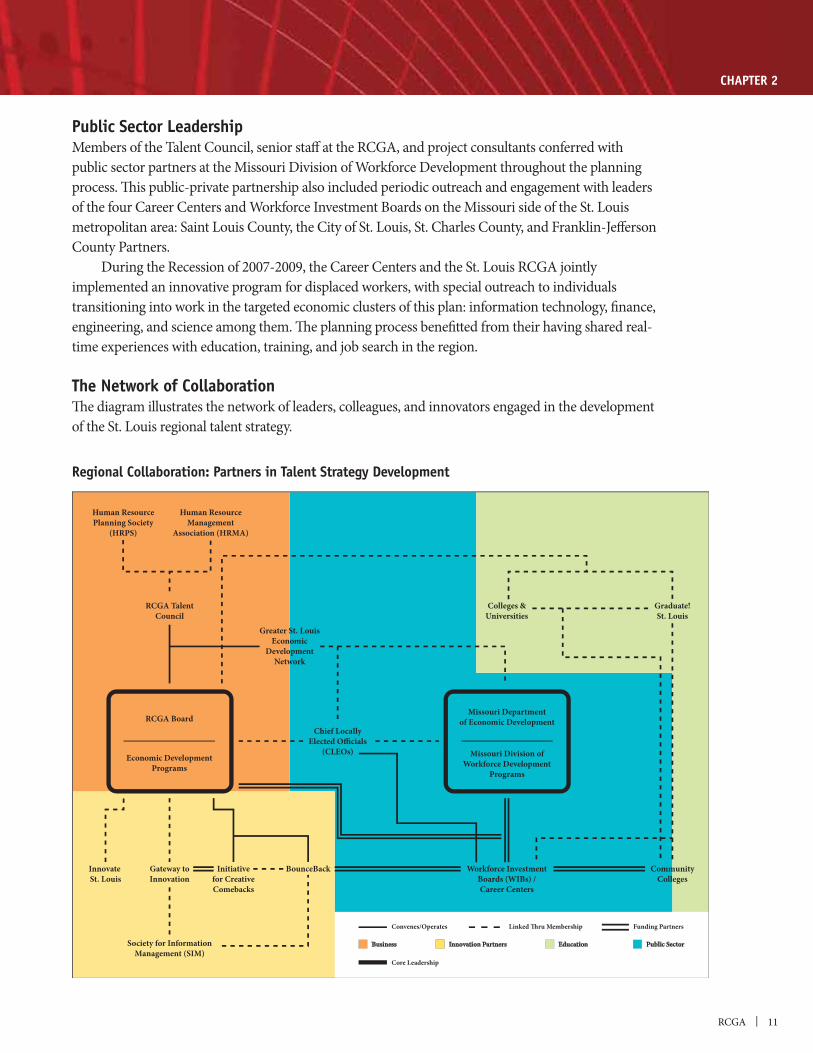
time experiences with education, training, and job search in the region. The Network of CollaborationThe diagram illustrates the network of leaders, colleagues, and innovators engaged in the development of the St. Louis regional talent strategy.
Regional Collaboration: Partners in Talent Strategy Development
Funding PartnersLinked Thru Membership
Core Leadership
Convenes/Operates
Missouri Division ofWorkforce Development
Programs
Missouri Departmentof Economic Development
Economic DevelopmentPrograms
RCGA Board
Colleges &Universities
RCGA TalentCouncil
Human ResourceManagement
Association (HRMA)
Human ResourcePlanning Society
(HRPS)
Greater St. LouisEconomic
DevelopmentNetwork
Initiativefor CreativeComebacks
Innovate St. Louis
Gateway toInnovation
Society for InformationManagement (SIM)
Chief LocallyElected Officials
(CLEOs)
BounceBack CommunityColleges
Workforce InvestmentBoards (WIBs) /Career Centers
Graduate!St. Louis
Public SectorEducationInnovation PartnersBusiness
12 | Talent: The Future of Metro St. Louis in the Knowledge Economy
Talent Development, Job Creation, and Economic Growth:
A Vision and a Virtuous Circle for the Future
A Vision for the Future It should not be surprising that metro St. Louis envisions its future in terms of its ranking in the national marketplace. Civic leaders who have been around a while speak longingly of the day when the
Today, people, jobs, products, money, and sports teams are far more mobile that they once were, and metro areas compete for all of them. In 2010, business and economic development leaders articulated a new vision for St. Louis, based on modern superlatives: “By the year 2020, Greater St. Louis will be consistently ranked among the top 10 of the 20 largest metropolitan areas in indicators of regional vitality, economic health, and the creation of community wealth.” Realizing that the region cannot get to the new vision by means of the traditional path, area
driven, and closely aligned with 21st Century economic development and job creation goals.
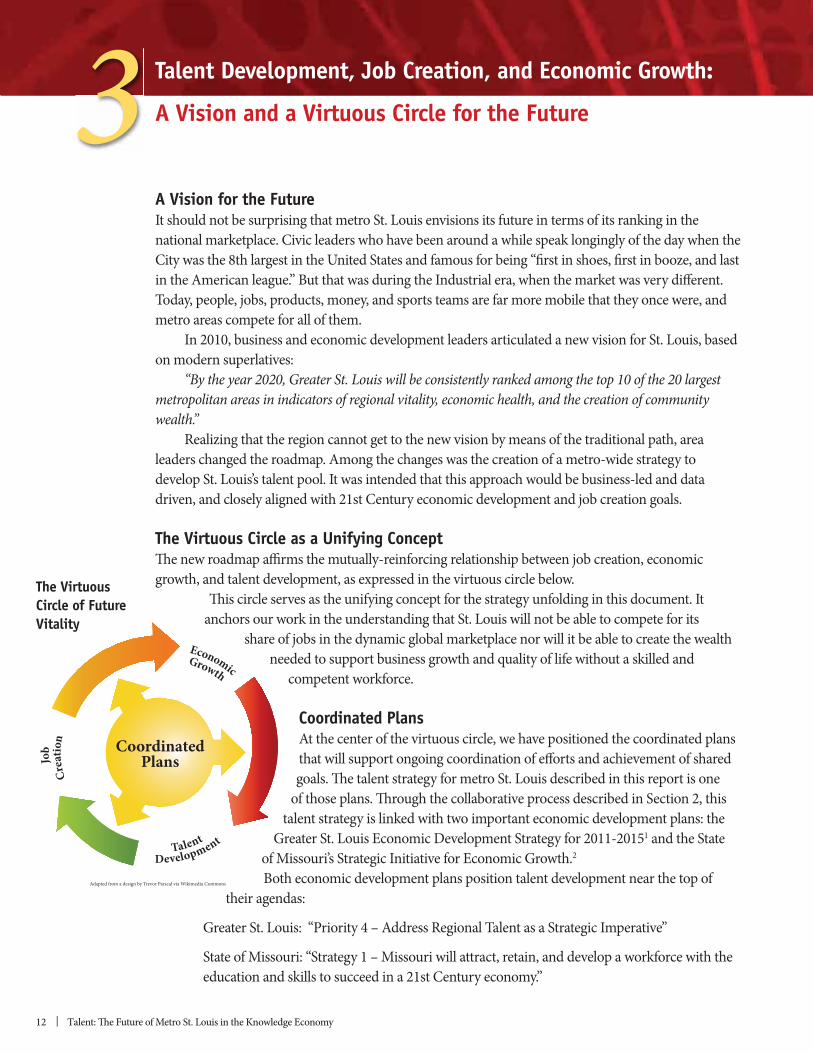
The Virtuous Circle as a Unifying Concept
growth, and talent development, as expressed in the virtuous circle below. This circle serves as the unifying concept for the strategy unfolding in this document. It
anchors our work in the understanding that St. Louis will not be able to compete for its share of jobs in the dynamic global marketplace nor will it be able to create the wealth
needed to support business growth and quality of life without a skilled and competent workforce.
Coordinated PlansAt the center of the virtuous circle, we have positioned the coordinated plans that will support ongoing coordination of efforts and achievement of shared goals. The talent strategy for metro St. Louis described in this report is one
of those plans. Through the collaborative process described in Section 2, this talent strategy is linked with two important economic development plans: the
1 and the State of Missouri’s Strategic Initiative for Economic Growth.2
their agendas:
Greater St. Louis: “Priority 4 – Address Regional Talent as a Strategic Imperative”
State of Missouri: “Strategy 1 – Missouri will attract, retain, and develop a workforce with the education and skills to succeed in a 21st Century economy.”
Adapted from a design by Trevor Parscal via Wikimedia Commons
CoordinatedPlans
DevelopmentTalent
EconomicGrowth
Job
Crea
tion
The Virtuous Circle of Future Vitality
3
RCGA | 13
CHAPTER 3
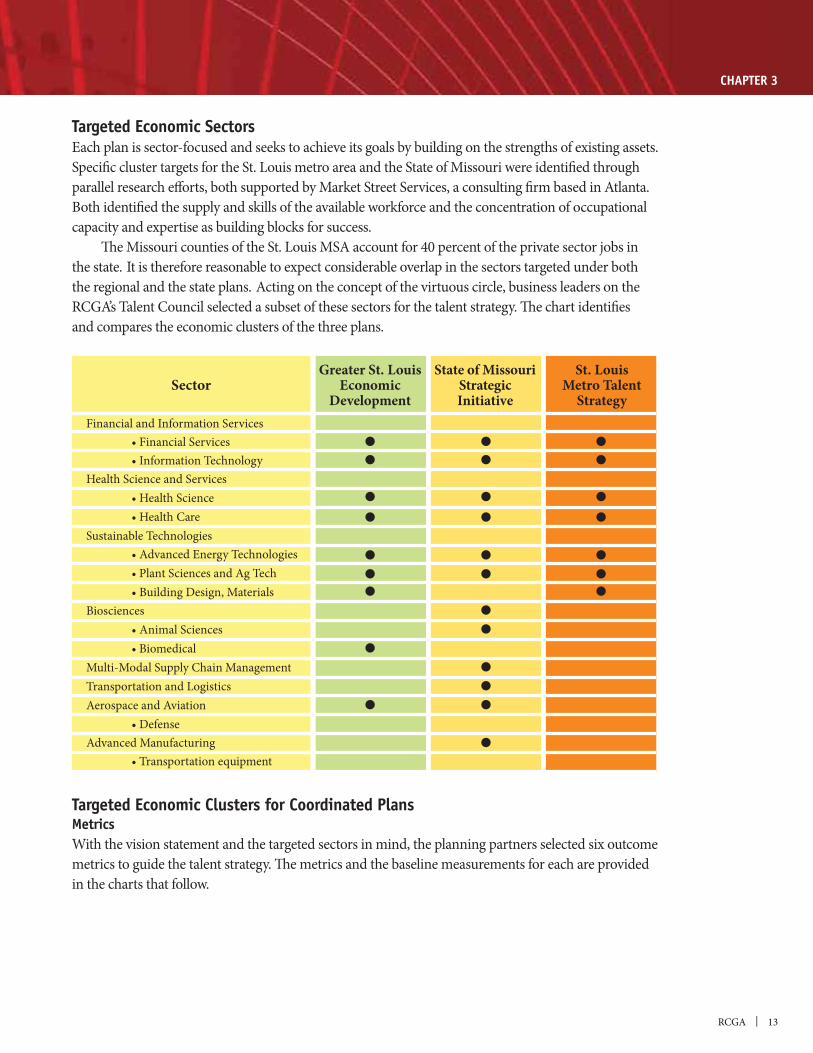
Targeted Economic Sectors
Specific cluster targets for the St. Louis metro area and the State of Missouri were identified through parallel research efforts, both supported by Market Street Services, a consulting firm based in Atlanta.
capacity and expertise as building blocks for success. The Missouri counties of the St. Louis MSA account for 40 percent of the private sector jobs in the state. It is therefore reasonable to expect considerable overlap in the sectors targeted under both the regional and the state plans. Acting on the concept of the virtuous circle, business leaders on the RCGA’s Talent Council selected a subset of these sectors for the talent strategy. The chart identifies and compares the economic clusters of the three plans.
Targeted Economic Clusters for Coordinated PlansMetrics
metrics to guide the talent strategy. The metrics and the baseline measurements for each are provided in the charts that follow.
St. LouisMetro Talent
Strategy
State of MissouriStrategicInitiative
SectorGreater St. Louis
EconomicDevelopment
Financial and Information Services Services Information TechnologyHealth Science and Services Health Science Health CareSustainable Technologies Advanced Energy Technologies t Sciences and Ag Tech Materials
ciences ciences omedicalMulti-Modal Supply Chain ManagementTransportation and LogisticsAerospace and Aviation Advanced Manufacturing Transportation equipment
14 | Talent: The Future of Metro St. Louis in the Knowledge Economy
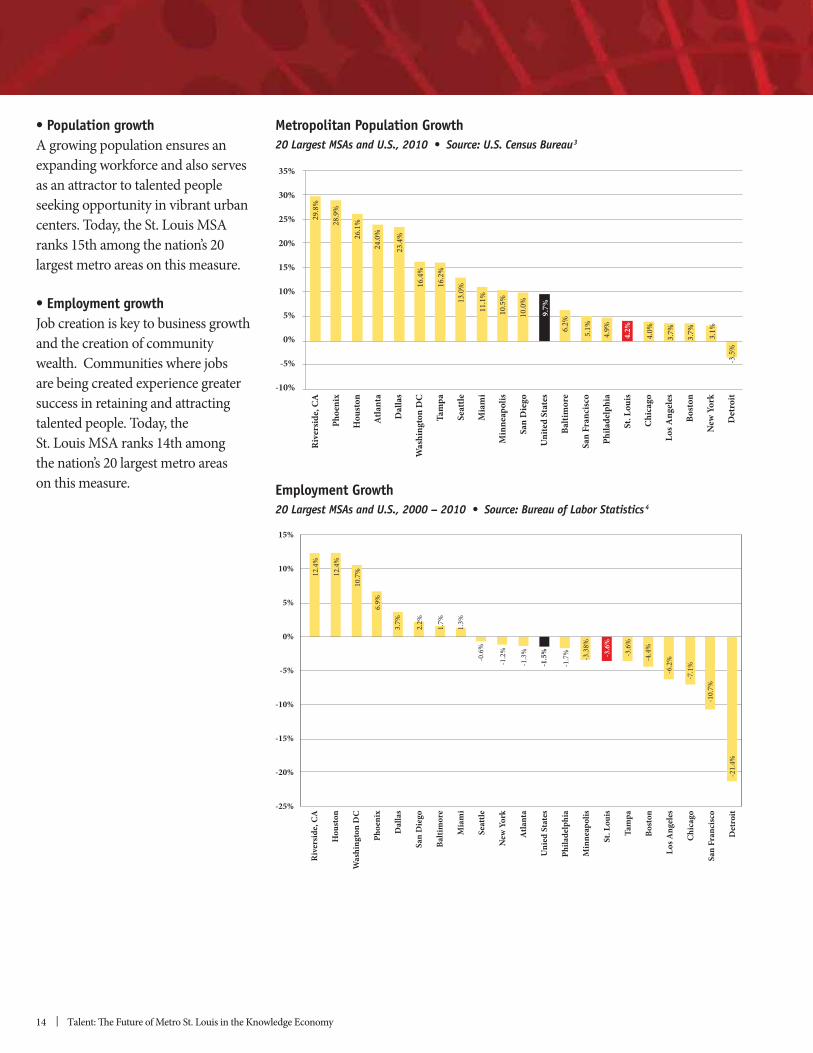
A growing population ensures an expanding workforce and also serves as an attractor to talented people seeking opportunity in vibrant urban centers. Today, the St. Louis MSA ranks 15th among the nation’s 20 largest metro areas on this measure.
Job creation is key to business growth and the creation of community wealth. Communities where jobs are being created experience greater success in retaining and attracting talented people. Today, the St. Louis MSA ranks 14th among the nation’s 20 largest metro areas on this measure.
35%
30%
25%
20%
15%
10%
5%
0%
-5%
-10%
Rive
rsid
e, C
A
Phoe
nix
Hou
ston
Atla
nta
Dal
las
Was
hing
ton
DC
Tam
pa
Seat
tle
Mia
mi
Min
neap
olis
San
Die
go
Uni
ted
Stat
es
Balti
mor
e
San
Fran
cisc
o
Phila
delp
hia
St. L
ouis
Chi
cago
Los A
ngel
es
Bost
on
New
Yor
k
Det
roit
29.8
%
28.9
%
26.1
%
24.0
%
23.4
%
16.4
%
16.2
%
13.0
%
11.1
%
10.5
%
10.0
%
9.7%
6.2%
5.1%
4.9%
4.2%
4.0%
3.7%
3.7% 3.1%
-3.5
%
Metropolitan Population Growth 3
15%
10%
5%
0%
-5%
-10%
-15%
-20%
-25%
Rive
rsid
e, C
A
Hou
ston
Was
hing
ton
DC
Phoe
nix
Dal
las
San
Die
go
Balti
mor
e
Mia
mi
Seat
tle
New
Yor
k
Atla
nta
Uni
ed S
tate
s
Phila
delp
hia
Min
neap
olis
St. L
ouis
Tam
pa
Bost
on
Los A
ngel
es
Chi
cago
San
Fran
cisc
o
Det
roit
-1.7
%
-1.5
%
-1.3
%
-1.2
%
-0.6
%
1.3%
1.7%
2.2%
3.7%
6.9%
10.7
%12.4
%
12.4
%
-4.4
%
-3.6
%
-3.6
%
-3.3
8%
-21.
4%
-10.
7%
-7.1
%
-6.2
%
Employment Growth 4
RCGA | 15
CHAPTER 3
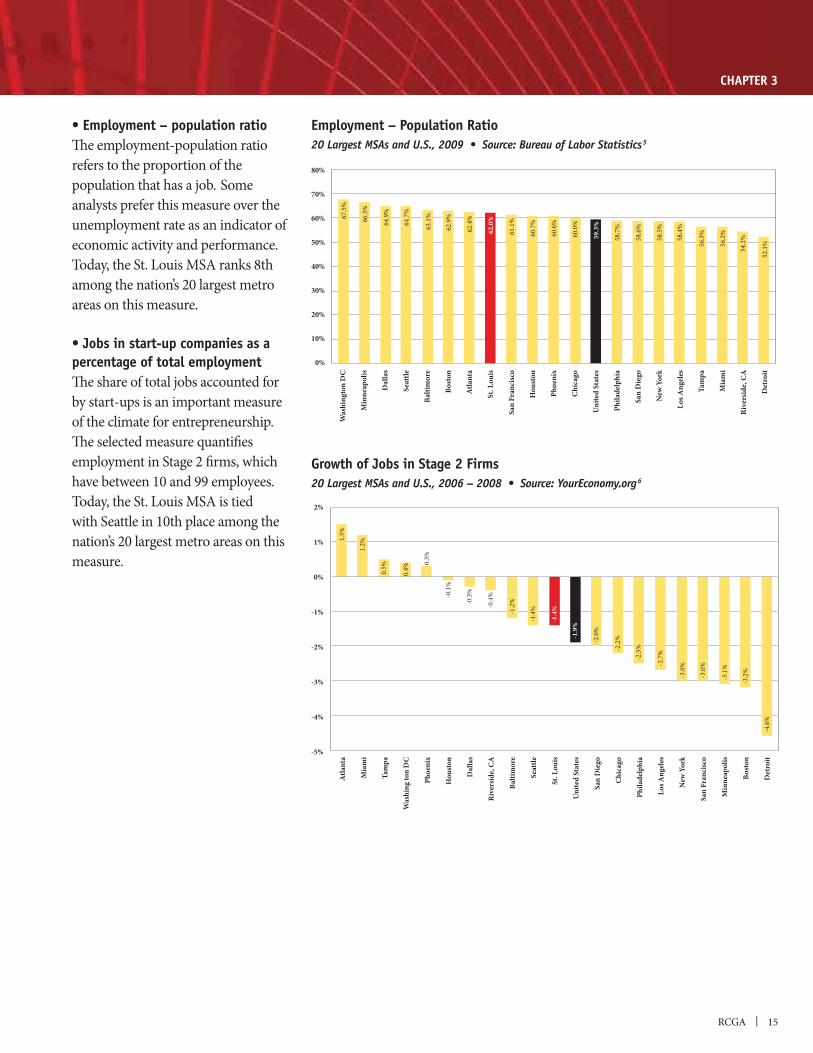
refers to the proportion of the population that has a job. Some analysts prefer this measure over the unemployment rate as an indicator of economic activity and performance. Today, the St. Louis MSA ranks 8th among the nation’s 20 largest metro areas on this measure.
percentage of total employmentThe share of total jobs accounted for
of the climate for entrepreneurship. The selected measure quantifies employment in Stage 2 firms, which have between 10 and 99 employees. Today, the St. Louis MSA is tied with Seattle in 10th place among the nation’s 20 largest metro areas on this measure.
2%
1%
0%
-1%
-2%
-3%
-4%
-5%
Atla
nta
Mia
mi
Tam
pa
Was
hing
ton
DC
Phoe
nix
Hou
ston
Dal
las
Rive
rsid
e, C
A
Balti
mor
e
Seat
tle
St. L
ouis
Uni
ted
Stat
es
San
Die
go
Chi
cago
Phila
delp
hia
Los A
ngel
es
New
Yor
k
San
Fran
cisc
o
Min
neap
olis
Bost
on
Det
roit
1.5%
1.2%
-4.6
%
-3.2
%
-3.1
%
-3.0
%
-3.0
%-2.7
%
-2.5
%-2.2
%-2.0
%
-1.9
%
-1.4
%
-1.4
%-1.2
%-0.4
%
-0.3
%-0.1
%
0.3%
0.4%0.5%
80%
70%
60%
50%
40%
30%
20%
10%
0%
Was
hing
ton
DC
Min
neap
olis
Dal
las
Sea
ttle
Bal
timor
e
Bos
ton
Atla
nta
St.
Loui
s
San
Fra
ncisc
o
Hou
ston
Pho
enix
Chi
cago
Uni
ted
Stat
es
Phi
lade
lphi
a
San
Die
go
New
Yor
k
Los
Ang
eles
Tam
pa
Mia
mi
Riv
ersid
e, C
A
Det
roit
59.3
%
60.0
%
60.6
%
60.7
%
61.1
%
62.0
%
62.4
%
62.9
%
63.1
%
64.7
%
64.9
%
66.3
%
67.5
%
52.1
%
54.2
%
56.2
%
56.3
%
58.4
%
58.5
%
58.6
%
58.7
%
5
Growth of Jobs in Stage 2 Firms 6
16 | Talent: The Future of Metro St. Louis in the Knowledge Economy
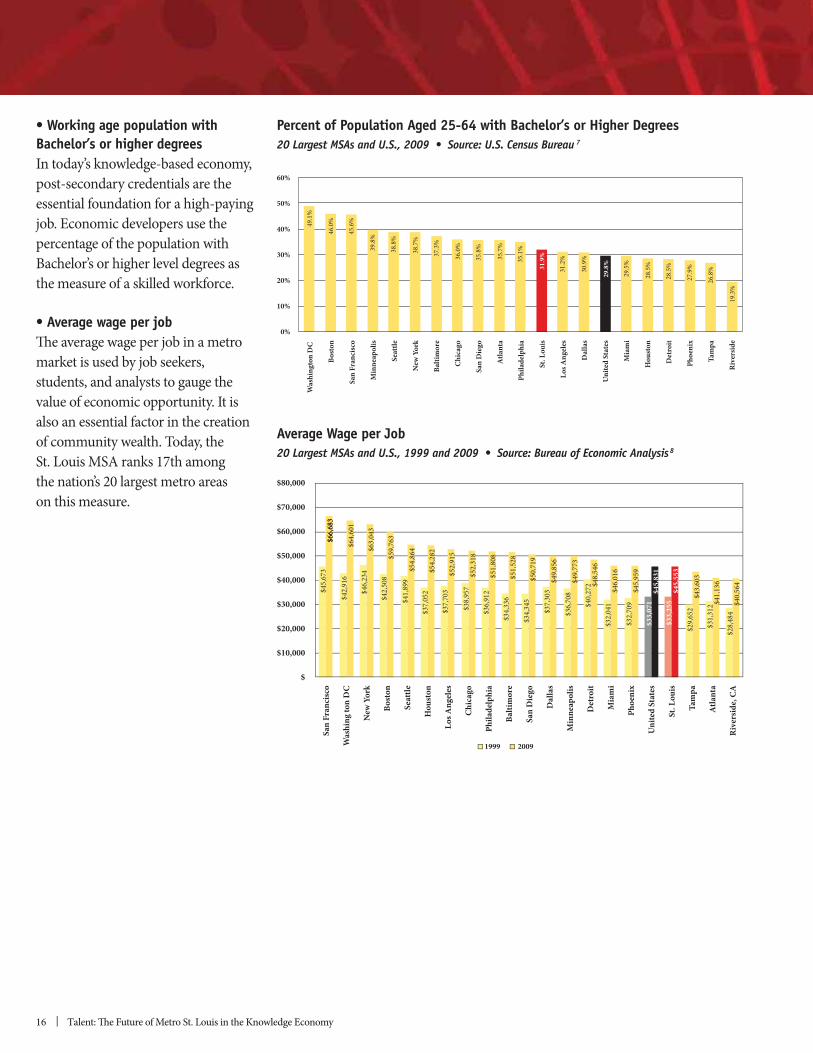
Bachelor’s or higher degrees
job. Economic developers use the percentage of the population with
the measure of a skilled workforce.
The average wage per job in a metro market is used by job seekers, students, and analysts to gauge the value of economic opportunity. It is also an essential factor in the creation of community wealth. Today, the St. Louis MSA ranks 17th among the nation’s 20 largest metro areas on this measure.
San
Fran
cisc
o
Was
hing
ton
DC
New
Yor
k
Bost
on
Seat
tle
Hou
ston
Los A
ngel
es
Chi
cago
Phila
delp
hia
Balti
mor
e
San
Die
go
Dal
las
Min
neap
olis
Det
roit
Mia
mi
Phoe
nix
Uni
ted
Stat
es
St. L
ouis
Tam
pa
Atla
nta
Rive
rsid
e, C
A
$80,000
$70,000
$60,000
$50,000
$40,000
$30,000
$20,000
$10,000
$
20091999
$45
,673
$66
,683
$42,
916
$46
,234
$42
,508
$41
,899
$37,
052
$37
,703
$38
,957
$36
,912
$34
,336
$34
,345
$37
,303
$36
,708
$40
,272
$32
,041
$32
,709
$33
,071
$33
,255
$29,
652
$31
,312
$28
,484
$64
,601
$63
,043
$59
,763
$54
,864
$54
,282
$52
,915
$52
,318
$66
,683
$51
,808
$51
,528
$50
,719
$49
,856
$49
,773
$48
,546
$46
,016
$45
,959
$45
,831
$45
,553
$43,
603
$41
,136
$40
,564
Was
hing
ton
DC
Bost
on
San
Fran
cisc
o
Min
neap
olis
Seat
tle
New
Yor
k
Balti
mor
e
Chi
cago
San
Die
go
Atla
nta
Phila
delp
hia
St. L
ouis
Los A
ngel
es
Dal
las
Uni
ted
Stat
es
Mia
mi
Hou
ston
Det
roit
Phoe
nix
Tam
pa
Rive
rsid
e
60%
50%
40%
30%
20%
10%
0%
49.1
%
46.0
%
45.6
%
39.8
%
38.8
%
38.7
%
37.3
%
36.0
%
35.8
%
35.7
%
35.1
%
31.9
%
31.2
%
30.9
%
29.8
%
29.5
%
28.5
%
28.5
%
27.9
%
26.8
%
19.3
%
Percent of Population Aged 25-64 with Bachelor’s or Higher Degrees 7
Average Wage per Job 8
RCGA | 17
CHAPTER 3
______________
1. St. Louis RCGA. “Five Core Strategies to Achieve Quality Jobs and Investment.” 2010.
2. Market Street Services, Inc. “Final Report of the Strategic Initiative for Economic Growth: State of Missouri.” 2011.
laugp.htm.
youreconomy.org/pages/ranking/?region=msa, Note: Stage 2 (10-99 employees) — At this phase, a company typically has a proven product, and survival is no longer a daily concern. Companies begin to develop infrastructure and standardize operational systems. Leaders delegate more and wear fewer hats.
acs/www/Products/.
Note: All state and local area dollar estimates are in current dollars (not adjusted for inflation).
18 | Talent: The Future of Metro St. Louis in the Knowledge Economy
The St. Louis Metro Economy
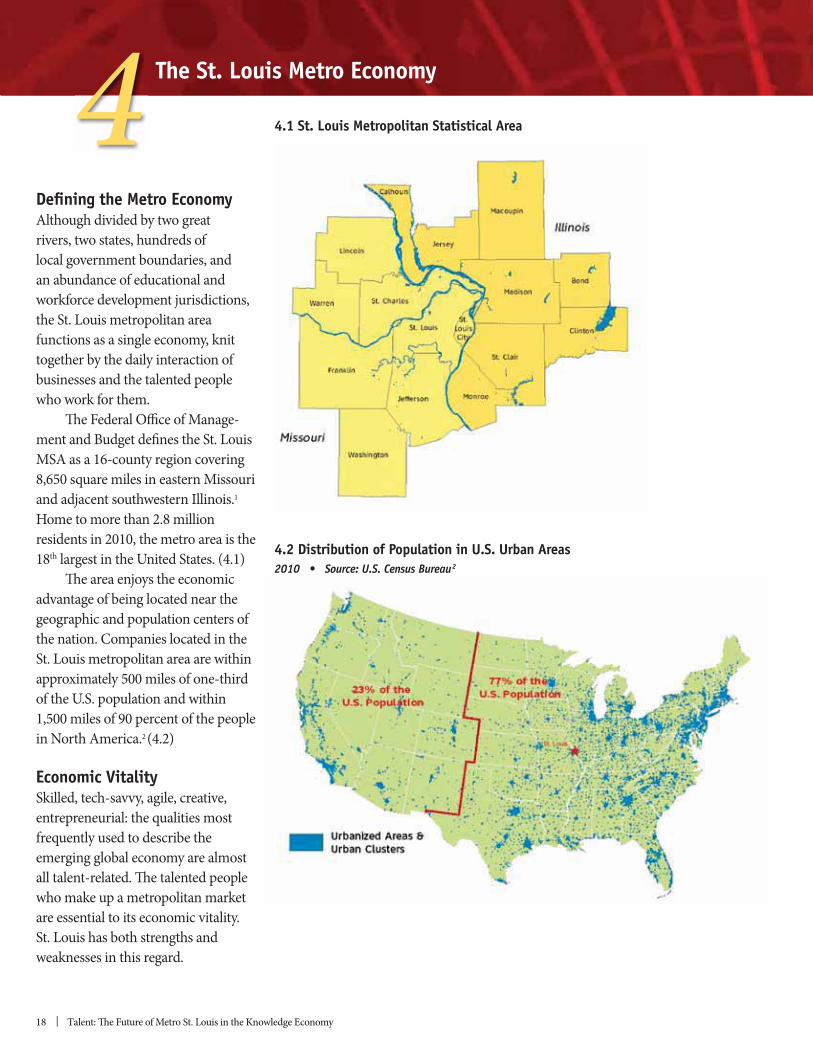
Defining the Metro EconomyAlthough divided by two great rivers, two states, hundreds of local government boundaries, and an abundance of educational and workforce development jurisdictions, the St. Louis metropolitan area functions as a single economy, knit together by the daily interaction of businesses and the talented people who work for them.
8,650 square miles in eastern Missouri and adjacent southwestern Illinois.1 Home to more than 2.8 million residents in 2010, the metro area is the 18th
The area enjoys the economic advantage of being located near the geographic and population centers of the nation. Companies located in the St. Louis metropolitan area are within
1,500 miles of 90 percent of the people in North America.2 (4.2)
Economic Vitality
entrepreneurial: the qualities most frequently used to describe the emerging global economy are almost
who make up a metropolitan market are essential to its economic vitality. St. Louis has both strengths and weaknesses in this regard.
4 4.1 St. Louis Metropolitan Statistical Area
4.2 Distribution of Population in U.S. Urban Areas2
RCGA | 19
CHAPTER 4
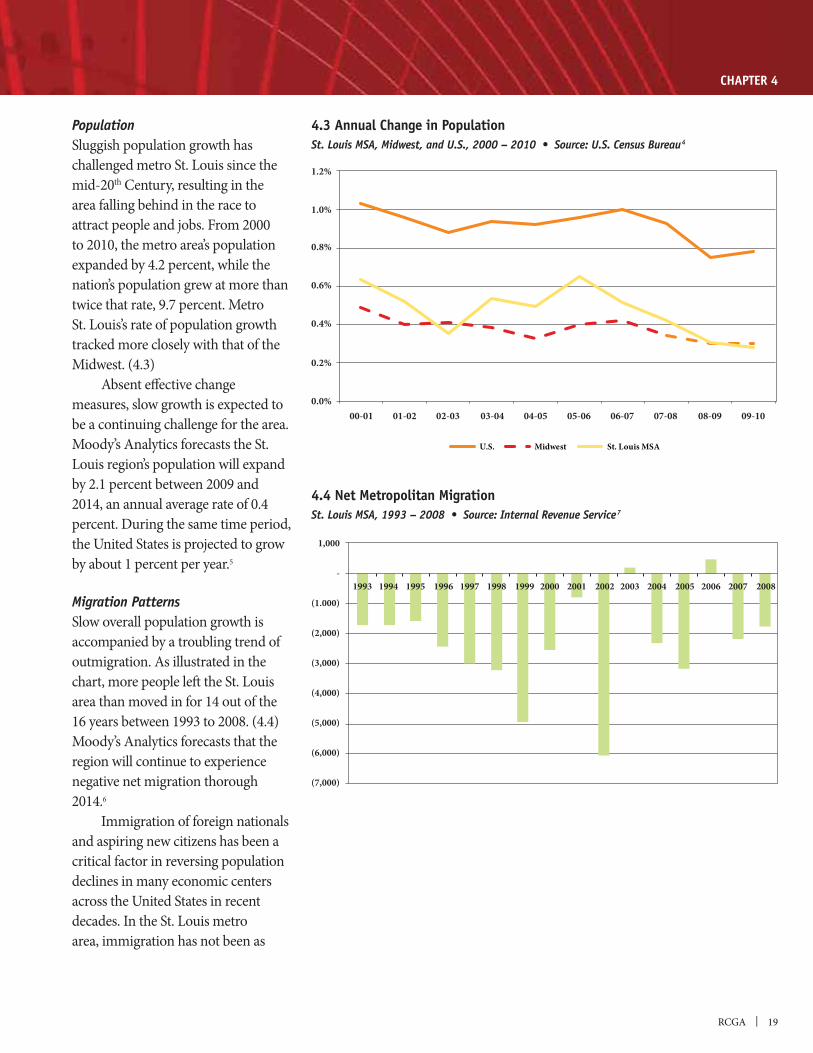
Sluggish population growth has challenged metro St. Louis since the
th Century, resulting in the area falling behind in the race to attract people and jobs. From 2000 to 2010, the metro area’s population expanded by 4.2 percent, while the nation’s population grew at more than twice that rate, 9.7 percent. Metro St. Louis’s rate of population growth tracked more closely with that of the Midwest. (4.3) Absent effective change measures, slow growth is expected to be a continuing challenge for the area. Moody’s Analytics forecasts the St. Louis region’s population will expand by 2.1 percent between 2009 and 2014, an annual average rate of 0.4 percent. During the same time period,
by about 1 percent per year.5
Migration PatternsSlow overall population growth is accompanied by a troubling trend of outmigration. As illustrated in the chart, more people left the St. Louis area than moved in for 14 out of the 16 years between 1993 to 2008. (4.4) Moody’s Analytics forecasts that the region will continue to experience negative net migration thorough 2014.6
Immigration of foreign nationals and aspiring new citizens has been a critical factor in reversing population declines in many economic centers
decades. In the St. Louis metro area, immigration has not been as
U.S. Midwest St. Louis MSA
0.0%
0.2%
0.4%
0.6%
0.8%
1.0%
1.2%
09-1008-0907-0806-0705-0604-0503-0402-0301-0200-01
4.3 Annual Change in Population 4
1,000
-
(1.000)
(2,000)
(3,000)
(4,000)
(5,000)
(6,000)
(7,000)
1993 1994 1995 1996 1997 1998 1999 2000 2001 2002 2003 2004 2005 2006 2007 2008
4.4 Net Metropolitan Migration 7
20 | Talent: The Future of Metro St. Louis in the Knowledge Economy
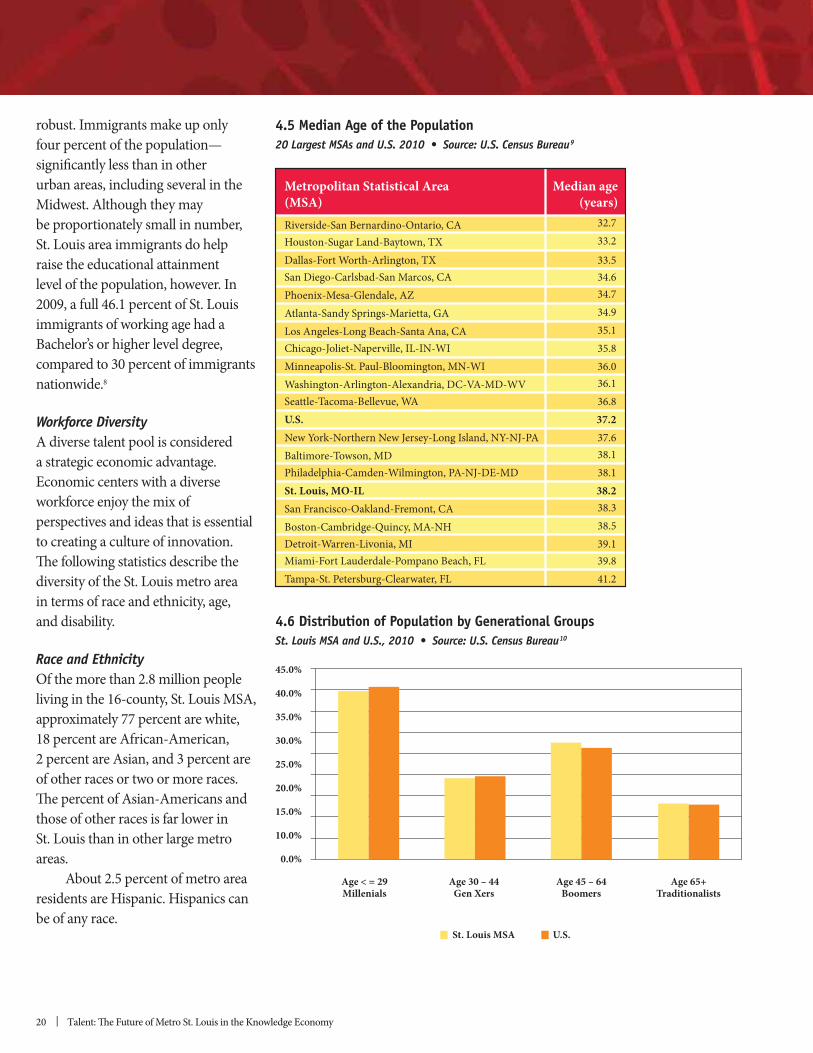
robust. Immigrants make up only four percent of the population—significantly less than in other urban areas, including several in the Midwest. Although they may be proportionately small in number, St. Louis area immigrants do help raise the educational attainment level of the population, however. In 2009, a full 46.1 percent of St. Louis immigrants of working age had a
compared to 30 percent of immigrants nationwide.8
A diverse talent pool is considered a strategic economic advantage. Economic centers with a diverse workforce enjoy the mix of perspectives and ideas that is essential to creating a culture of innovation. The following statistics describe the diversity of the St. Louis metro area in terms of race and ethnicity, age, and disability.
Of the more than 2.8 million people
approximately 77 percent are white,
2 percent are Asian, and 3 percent are of other races or two or more races.
those of other races is far lower in St. Louis than in other large metro areas. About 2.5 percent of metro area residents are Hispanic. Hispanics can be of any race.
Metropolitan Statistical Area(MSA)
Median age(years)
Riverside-San Bernardino-Ontario, CAHouston-Sugar Land-Baytown, TXDallas-Fort Worth-Arlington, TXSan Diego-Carlsbad-San Marcos, CAPhoenix-Mesa-Glendale, AZAtlanta-Sandy Springs-Marietta, GALos Angeles-Long Beach-Santa Ana, CAChicago-Joliet-Naperville, IL-IN-WIMinneapolis-St. Paul-Bloomington, MN-WIWashington-Arlington-Alexandria, DC-VA-MD-WVSeattle-Tacoma-Bellevue, WAU.S.New York-Northern New Jersey-Long Island, NY-NJ-PABaltimore-Towson, MDPhiladelphia-Camden-Wilmington, PA-NJ-DE-MDSt. Louis, MO-ILSan Francisco-Oakland-Fremont, CABoston-Cambridge-Quincy, MA-NHDetroit-Warren-Livonia, MIMiami-Fort Lauderdale-Pompano Beach, FLTampa-St. Petersburg-Clearwater, FL
32.733.2
33.534.634.734.935.135.836.036.136.837.237.638.138.138.238.338.539.139.841.2
4.5 Median Age of the Population 9
Age 65+Traditionalists
45.0%
40.0%
35.0%
30.0%
25.0%
20.0%
15.0%
10.0%
0.0%
Age 45 – 64Boomers
Age 30 – 44Gen Xers
Age < = 29Millenials
U.S.St. Louis MSA
4.6 Distribution of Population by Generational Groups 10
RCGA | 21
CHAPTER 4
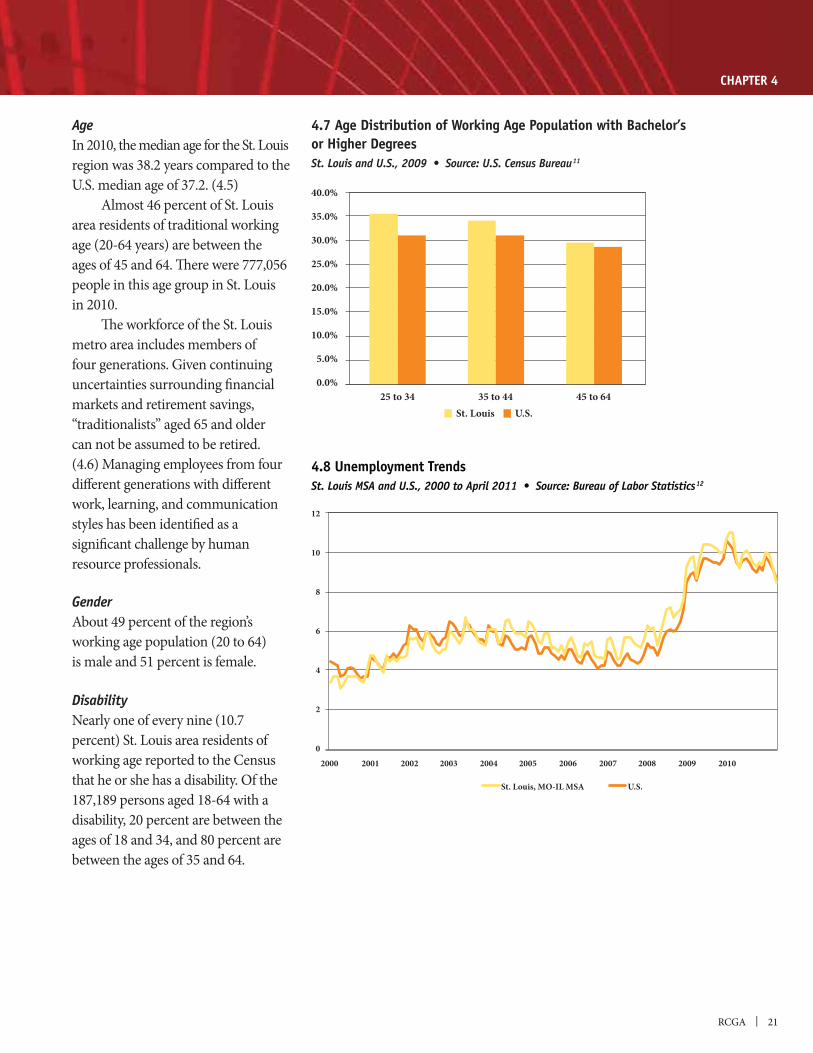
AgeIn 2010, the median age for the St. Louis region was 38.2 years compared to the
Almost 46 percent of St. Louis area residents of traditional working
ages of 45 and 64. There were 777,056 people in this age group in St. Louis in 2010. The workforce of the St. Louis metro area includes members of four generations. Given continuing uncertainties surrounding financial markets and retirement savings, “traditionalists” aged 65 and older can not be assumed to be retired. (4.6) Managing employees from four different generations with different work, learning, and communication styles has been identified as a significant challenge by human resource professionals.
GenderAbout 49 percent of the region’s working age population (20 to 64) is male and 51 percent is female.
Nearly one of every nine (10.7 percent) St. Louis area residents of working age reported to the Census that he or she has a disability. Of the
disability, 20 percent are between the ages of 18 and 34, and 80 percent are between the ages of 35 and 64.
40.0%
35.0%
30.0%
25.0%
20.0%
15.0%
10.0%
5.0%
0.0%45 to 6435 to 4425 to 34
U.S.St. Louis
4.7 Age Distribution of Working Age Population with Bachelor’s or Higher Degrees
11
20102009200820072006200520042003200220012000
U.S.St. Louis, MO-IL MSA
12
10
8
6
4
2
0
4.8 Unemployment Trends 12
22 | Talent: The Future of Metro St. Louis in the Knowledge Economy
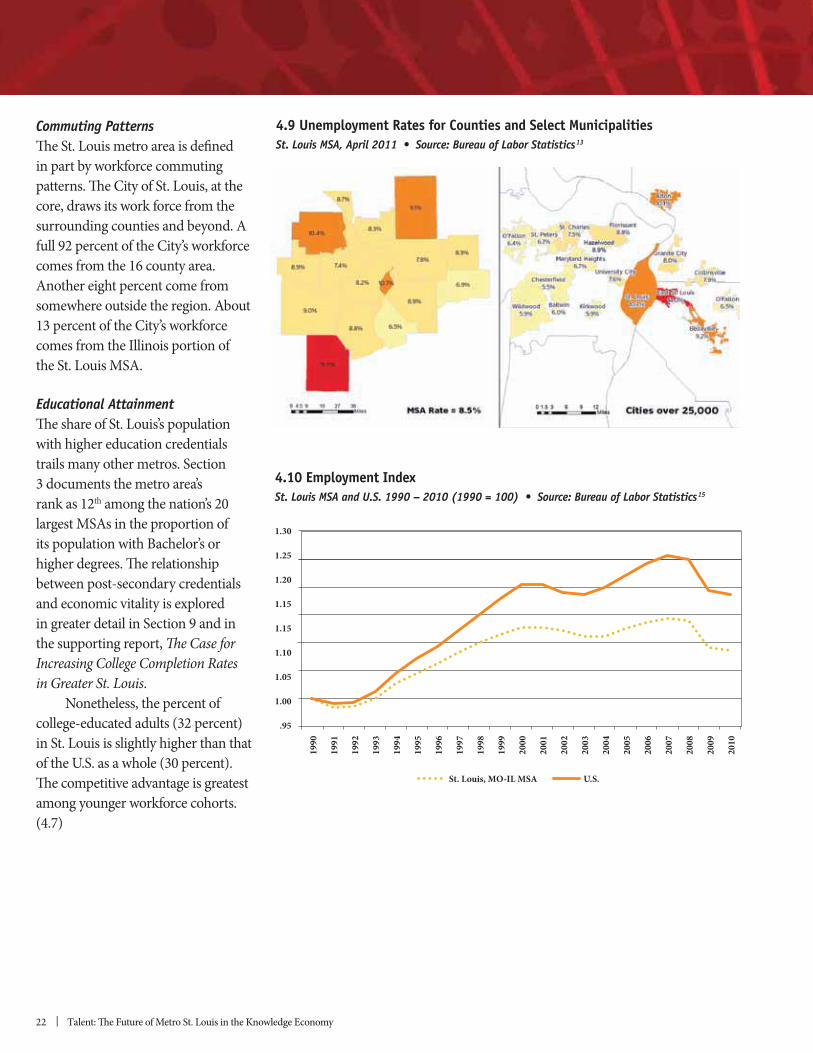
The St. Louis metro area is defined in part by workforce commuting patterns. The City of St. Louis, at the core, draws its work force from the surrounding counties and beyond. A full 92 percent of the City’s workforce comes from the 16 county area. Another eight percent come from somewhere outside the region. About 13 percent of the City’s workforce comes from the Illinois portion of the St. Louis MSA.
The share of St. Louis’s population with higher education credentials trails many other metros. Section 3 documents the metro area’s rank as 12th among the nation’s 20 largest MSAs in the proportion of
higher degrees. The relationship
and economic vitality is explored in greater detail in Section 9 and in the supporting report, The Case for Increasing College Completion Rates in Greater St. Louis. Nonetheless, the percent of
in St. Louis is slightly higher than that
The competitive advantage is greatest among younger workforce cohorts. (4.7)
4.9 Unemployment Rates for Counties and Select Municipalities 13
1.30
1.25
1.20
1.15
1.15
1.10
1.05
1.00
.95
1990
1991
1992
1993
1994
1995
1996
1997
1998
1999
2000
2001
2002
2003
2004
2005
2006
2007
2008
2009
2010
U.S.St. Louis, MO-IL MSA
4.10 Employment Index 15
RCGA | 23
CHAPTER 4
Since 2004 the unemployment rate has paralleled but slightly exceeded
area, the highest unemployment rates are found in the urban core and some of the outlying rural counties. (4.9) Labor force participation rates in the region are somewhat higher than the national rates. In 2009, the civilian labor force participation rate was 65.4 percent nationally and 69.3 percent in the St. Louis region.
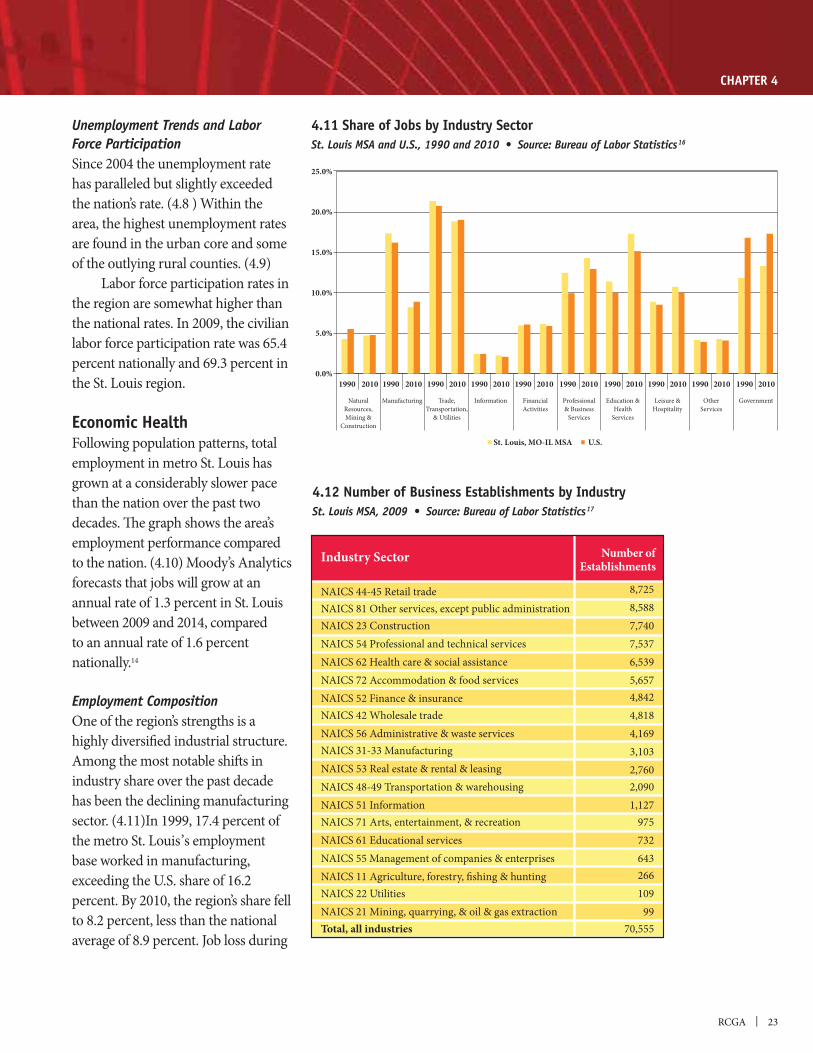
Economic HealthFollowing population patterns, total employment in metro St. Louis has grown at a considerably slower pace than the nation over the past two decades. The graph shows the area’s employment performance compared to the nation. (4.10) Moody’s Analytics forecasts that jobs will grow at an annual rate of 1.3 percent in St. Louis between 2009 and 2014, compared to an annual rate of 1.6 percent nationally.14
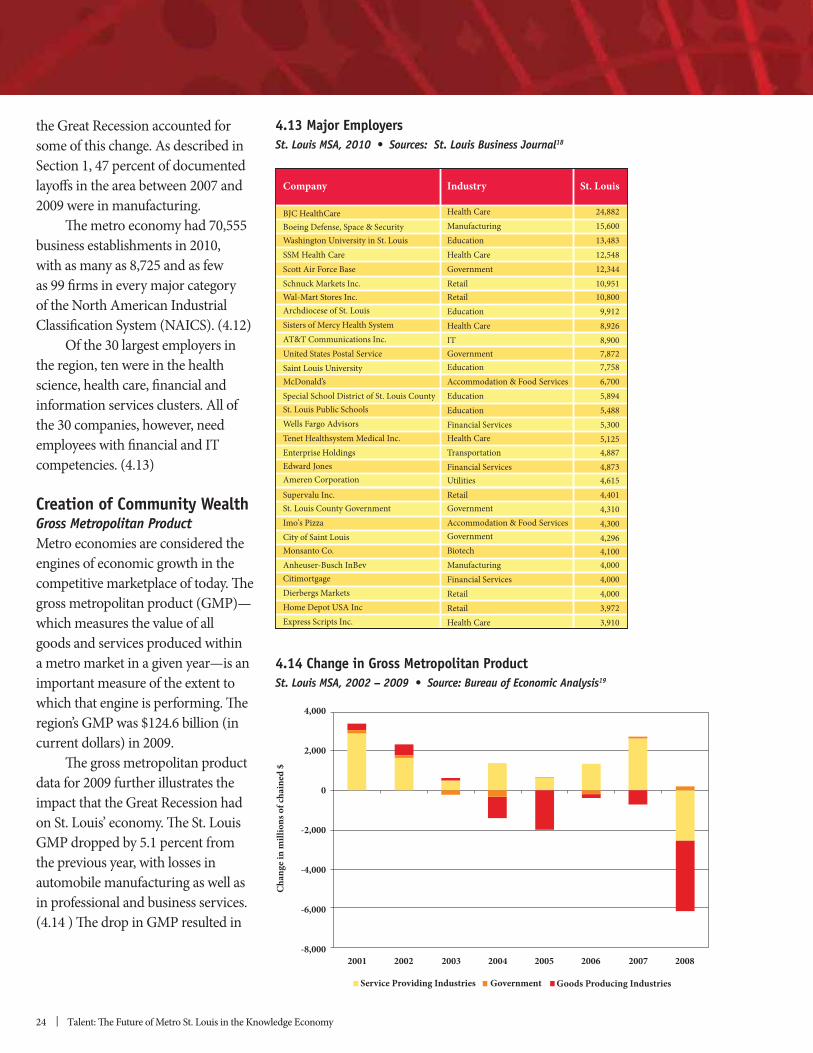
One of the region’s strengths is a highly diversified industrial structure. Among the most notable shifts in industry share over the past decade has been the declining manufacturing sector. (4.11)In 1999, 17.4 percent of the metro St. Louis’s employment base worked in manufacturing,
to 8.2 percent, less than the national average of 8.9 percent. Job loss during
U.S.St. Louis, MO-IL MSA
201019902010199020101990 201019902010199020101990 20101990201019902010199020101990
25.0%
20.0%
15.0%
10.0%
5.0%
0.0%
GovernmentOtherServices
Leisure &Hospitality
Education &Health
Services
Professional& Business
Services
FinancialActivities
InformationTrade,Transportation,
& Utilities
ManufacturingNaturalResources,Mining &
Construction
4.11 Share of Jobs by Industry Sector 16
Industry Sector Number ofEstablishments
NAICS 44-45 Retail tradeNAICS 81 Other services, except public administrationNAICS 23 ConstructionNAICS 54 Professional and technical servicesNAICS 62 Health care & social assistanceNAICS 72 Accommodation & food servicesNAICS 52 Finance & insuranceNAICS 42 Wholesale tradeNAICS 56 Administrative & waste servicesNAICS 31-33 ManufacturingNAICS 53 Real estate & rental & leasingNAICS 48-49 Transportation & warehousingNAICS 51 InformationNAICS 71 Arts, entertainment, & recreationNAICS 61 Educational servicesNAICS 55 Management of companies & enterprisesNAICS 11 Agriculture, forestry, fishing & huntingNAICS 22 UtilitiesNAICS 21 Mining, quarrying, & oil & gas extractionTotal, all industries
8,7258,5887,7407,5376,5395,6574,8424,8184,1693,1032,7602,0901,127
975732643266109
9970,555
4.12 Number of Business Establishments by Industry 17
24 | Talent: The Future of Metro St. Louis in the Knowledge Economy
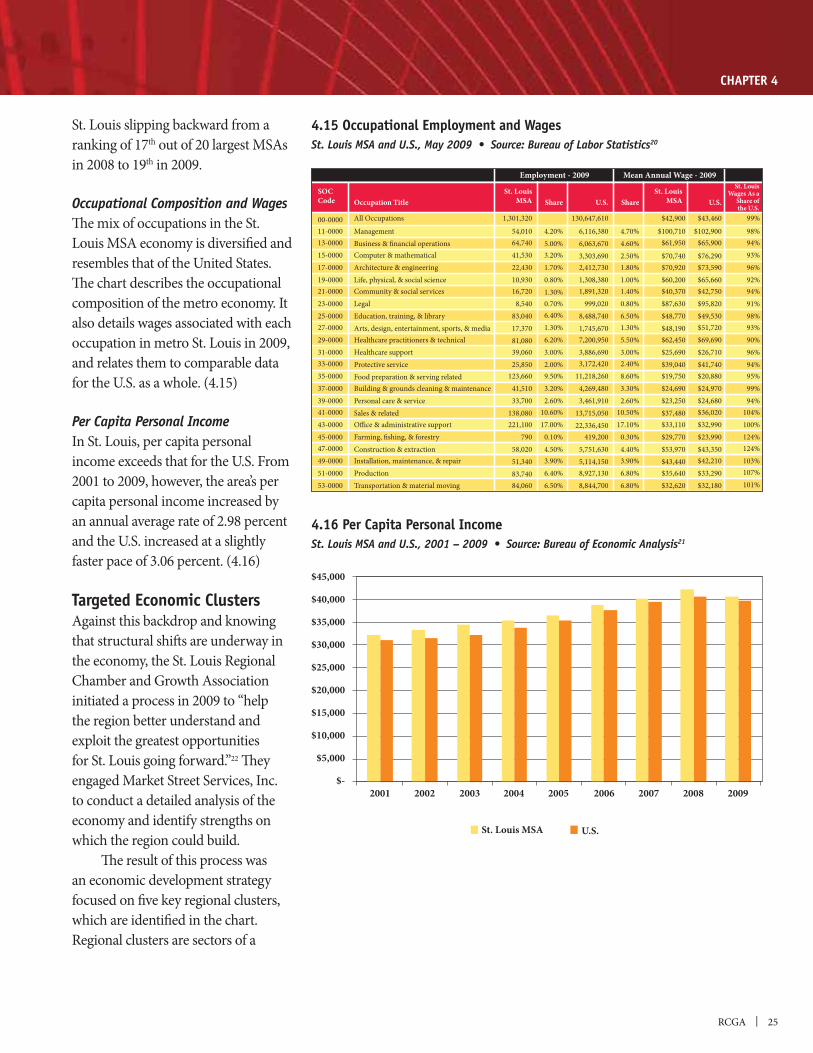
the Great Recession accounted for some of this change. As described in Section 1, 47 percent of documented layoffs in the area between 2007 and 2009 were in manufacturing. The metro economy had 70,555 business establishments in 2010, with as many as 8,725 and as few as 99 firms in every major category of the North American Industrial Classification System (NAICS). (4.12) Of the 30 largest employers in the region, ten were in the health science, health care, financial and information services clusters. All of the 30 companies, however, need employees with financial and IT competencies. (4.13)
Creation of Community Wealth
Metro economies are considered the engines of economic growth in the competitive marketplace of today. The gross metropolitan product (GMP)—which measures the value of all goods and services produced within a metro market in a given year—is an important measure of the extent to which that engine is performing. The region’s GMP was $124.6 billion (in current dollars) in 2009. The gross metropolitan product data for 2009 further illustrates the impact that the Great Recession had on St. Louis’ economy. The St. Louis GMP dropped by 5.1 percent from the previous year, with losses in automobile manufacturing as well as in professional and business services. (4.14 ) The drop in GMP resulted in
4,000
2,000
0
-2,000
-4,000
-6,000
-8,00020082007200620052004200320022001
Goods Producing IndustriesGovernmentService Providing Industries
Chan
ge in
mill
ions
of c
hain
ed $
4.14 Change in Gross Metropolitan Product 19
St. LouisIndustryCompany
BJC HealthCareBoeing Defense, Space & SecurityWashington University in St. LouisSSM Health CareScott Air Force BaseSchnuck Markets Inc.Wal-Mart Stores Inc.Archdiocese of St. LouisSisters of Mercy Health SystemAT&T Communications Inc.United States Postal Service Saint Louis UniversityMcDonald’s Special School District of St. Louis CountySt. Louis Public SchoolsWells Fargo AdvisorsTenet Healthsystem Medical Inc.Enterprise HoldingsEdward Jones Ameren Corporation
Supervalu Inc.St. Louis County GovernmentImo's Pizza City of Saint LouisMonsanto Co. Anheuser-Busch InBev CitimortgageDierbergs MarketsHome Depot USA Inc Express Scripts Inc.
Health CareManufacturingEducationHealth CareGovernmentRetailRetailEducationHealth CareITGovernmentEducationAccommodation & Food ServicesEducationEducationFinancial ServicesHealth CareTransportationFinancial ServicesUtilitiesRetailGovernmentAccommodation & Food ServicesGovernmentBiotechManufacturingFinancial ServicesRetailRetailHealth Care
24,88215,60013,48312,54812,34410,95110,800
9,9128,9268,9007,8727,7586,7005,8945,4885,3005,1254,8874,8734,6154,4014,3104,3004,2964,1004,0004,0004,0003,9723,910
18
RCGA | 25
CHAPTER 4
St. Louis slipping backward from a ranking of 17th out of 20 largest MSAs in 2008 to 19th in 2009.
The mix of occupations in the St. Louis MSA economy is diversified and
The chart describes the occupational composition of the metro economy. It also details wages associated with each occupation in metro St. Louis in 2009, and relates them to comparable data
In St. Louis, per capita personal
2001 to 2009, however, the area’s per capita personal income increased by an annual average rate of 2.98 percent
faster pace of 3.06 percent. (4.16)
Targeted Economic ClustersAgainst this backdrop and knowing that structural shifts are underway in the economy, the St. Louis Regional Chamber and Growth Association initiated a process in 2009 to “help the region better understand and exploit the greatest opportunities for St. Louis going forward.”22 They engaged Market Street Services, Inc. to conduct a detailed analysis of the economy and identify strengths on which the region could build. The result of this process was an economic development strategy focused on five key regional clusters, which are identified in the chart. Regional clusters are sectors of a
St. LouisWages As a
Share ofthe U.S.
St. LouisMSA
St. LouisMSA U.S.ShareU.S.ShareOccupation Title
SOCCode
00-000011-000013-000015-000017-000019-000021-000023-000025-000027-000029-000031-000033-000035-000037-000039-000041-000043-000045-000047-000049-000051-000053-0000
All Occupations
Management Business & financial operationsComputer & mathematicalArchitecture & engineering Life, physical, & social science Community & social services Legal Education, training, & library Arts, design, entertainment, sports, & media Healthcare practitioners & technical Healthcare support Protective service Food preparation & serving related Building & grounds cleaning & maintenance Personal care & service Sales & related Office & administrative support Farming, fishing, & forestry Construction & extraction Installation, maintenance, & repair Production Transportation & material moving
99%
98%94%93%96%92%94%91%98%93%90%96%94%95%99%94%
104%100%124%124%103%107%101%
$43,460
$102,900$65,900
$76,290$73,590$65,660$42,750$95,820$49,530$51,720$69,690$26,710$41,740$20,880$24,970$24,680$36,020$32,990$23,990$43,350$42,210$33,290$32,180
$42,900
$100,710$61,950
$70,740$70,920$60,200$40,370$87,630$48,770$48,190$62,450$25,690$39,040$19,750$24,690$23,250$37,480$33,110$29,770$53,970$43,440$35,640$32,620
130,647,610
6,116,3806,063,6703,303,6902,412,7301,308,3801,891,320
999,0208,488,7401,745,6707,200,9503,886,6903,172,420
11,218,2604,269,4803,461,910
13,715,05022,336,450
419,2005,751,6305,114,1508,927,1308,844,700
4.70%4.60%2.50%1.80%1.00%1.40%0.80%6.50%1.30%5.50%3.00%2.40%8.60%3.30%2.60%
10.50%17.10%
0.30%4.40%3.90%6.80%6.80%
4.20%5.00%3.20%1.70%0.80%1.30%0.70%6.40%1.30%6.20%3.00%2.00%9.50%3.20%2.60%
10.60%17.00%
0.10%4.50%3.90%6.40%6.50%
1,301,320
54,01064,74041,53022,43010,93016,720
8,54083,04017,37081,08039,06025,850
123,66041,51033,700
138,080221,100
79058,02051,34083,74084,060
Employment - 2009 Mean Annual Wage - 2009
4.15 Occupational Employment and Wages 20
U.S.St. Louis MSA
$45,000
$40,000
$35,000
$30,000
$25,000
$20,000
$15,000
$10,000
$5,000
$-200920082007200620052004200320022001
4.16 Per Capita Personal Income 21
26 | Talent: The Future of Metro St. Louis in the Knowledge Economy
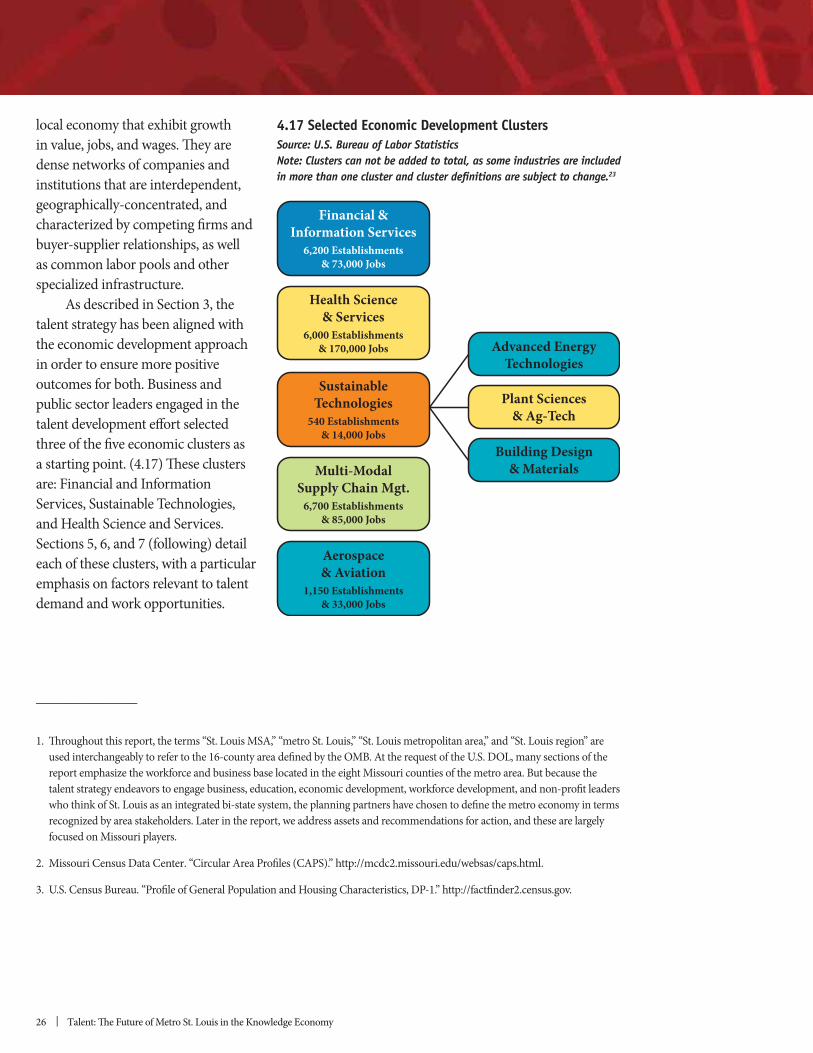
local economy that exhibit growth in value, jobs, and wages. They are dense networks of companies and institutions that are interdependent,
characterized by competing firms and
as common labor pools and other specialized infrastructure. As described in Section 3, the talent strategy has been aligned with the economic development approach in order to ensure more positive
public sector leaders engaged in the talent development effort selected three of the five economic clusters as a starting point. (4.17) These clusters are: Financial and Information Services, Sustainable Technologies, and Health Science and Services. Sections 5, 6, and 7 (following) detail each of these clusters, with a particular emphasis on factors relevant to talent demand and work opportunities.
______________
1. Throughout this report, the terms “St. Louis MSA,” “metro St. Louis,” “St. Louis metropolitan area,” and “St. Louis region” are
recognized by area stakeholders. Later in the report, we address assets and recommendations for action, and these are largely focused on Missouri players.
2. Missouri Census Data Center. “Circular Area Profiles (CAPS).” http://mcdc2.missouri.edu/websas/caps.html.
Building Design& Materials
Plant Sciences& Ag-Tech
Advanced EnergyTechnologies
Aerospace& Aviation
1,150 Establishments& 33,000 Jobs
Multi-ModalSupply Chain Mgt.
6,700 Establishments& 85,000 Jobs
SustainableTechnologies
540 Establishments& 14,000 Jobs
Health Science& Services
6,000 Establishments& 170,000 Jobs
Financial &Information Services
6,200 Establishments& 73,000 Jobs
4.17 Selected Economic Development Clusters
23
RCGA | 27
CHAPTER 4
6. Ibid.
June 2011. http://www.brookings.edu/papers/2011/06_immigrants_singer.aspx.
10. Ibid.
gov/acs/www/Products/.
Population Survey.” http://www.bls.gov/data/#unemployment.
16. Ibid.
Estimates by County.” http://data.bls.gov/pdq/querytool.jsp?survey=en.
http://www.bea.gov/regional/index.htm#gsp.
htm#gsp.
22. St. Louis Regional Chamber and Growth Association. “Five Core Strategies to Achieve Quality Jobs and Investment: 2011-2015 Campaign for a Greater St. Louis.” 2011. Page 2.
Estimates by County.” http://data.bls.gov/pdq/querytool.jsp?survey=en.. Note: Clusters cannot be added to total, as some industries are included in more than one cluster and cluster definitions are subject to change.
28 | Talent: The Future of Metro St. Louis in the Knowledge Economy
Opportunity: Financial and Information Services
IntroductionThe financial and information services cluster operates at the core of the 21st Century global economy, where the most competitive firms use the most sophisticated digital technologies to count, manage, secure, move, and account for money and information with amazing speed and accuracy. In the events leading up to the Great Recession, this cluster was not only at the core of the economy, but at the center of the storm.
Today, a number of external trends are influencing both finance and IT, with implications for the talent that is needed now and in the future. A select few of them are listed below.
geopolitical boundaries. Events in one part of the world have ramifications for what happens in others—for better or for worse.
computer security specialists are in high demand.
financial services industry, meaning that there are fewer purely local enterprises and many talent management decisions are made outside the local area.
Many of these will soon be replaced by other technologies, including biometrics.
individuals with credentialed specializations.
demand for talented people who can understand, monitor, and advise on regulatory compliance issues.
partnerships between depository institutions and retail outlets (banks, grocery stores and malls, for
5
RCGA | 29
CHAPTER 5
young people raised with digital tools; older people with paper checkbooks and fixed incomes;
corporations; and everyone in between.
systems toward shared and leased services, such as those provided in “The Cloud.” The Cloud allows businesses and individuals to access applications, content, and computing power remotely through
vendors—locally, nationally, and internationally.
skills, but, as will be discussed more fully in Section 9, having the right technical skills will not be sufficient to launch a successful career in the financial and information services cluster today. Looking
different set of skills, smart deployment of talent and the realignment of compensation structures will be critical to their ability to address the demands of this new world financial order…. Companies are looking to ascertain whether they have enough people with the necessary balance of innovation, risk, compliance, and relationship skills, and gearing their training and recruitment to bridging any gaps.” 1
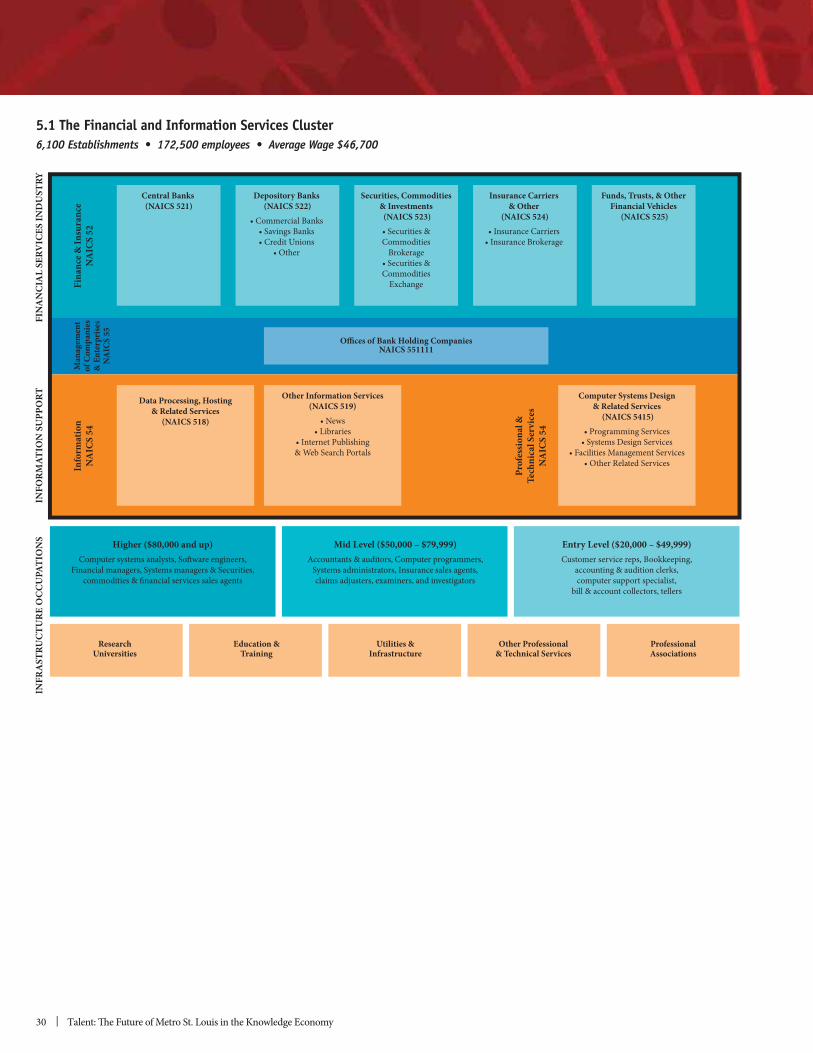
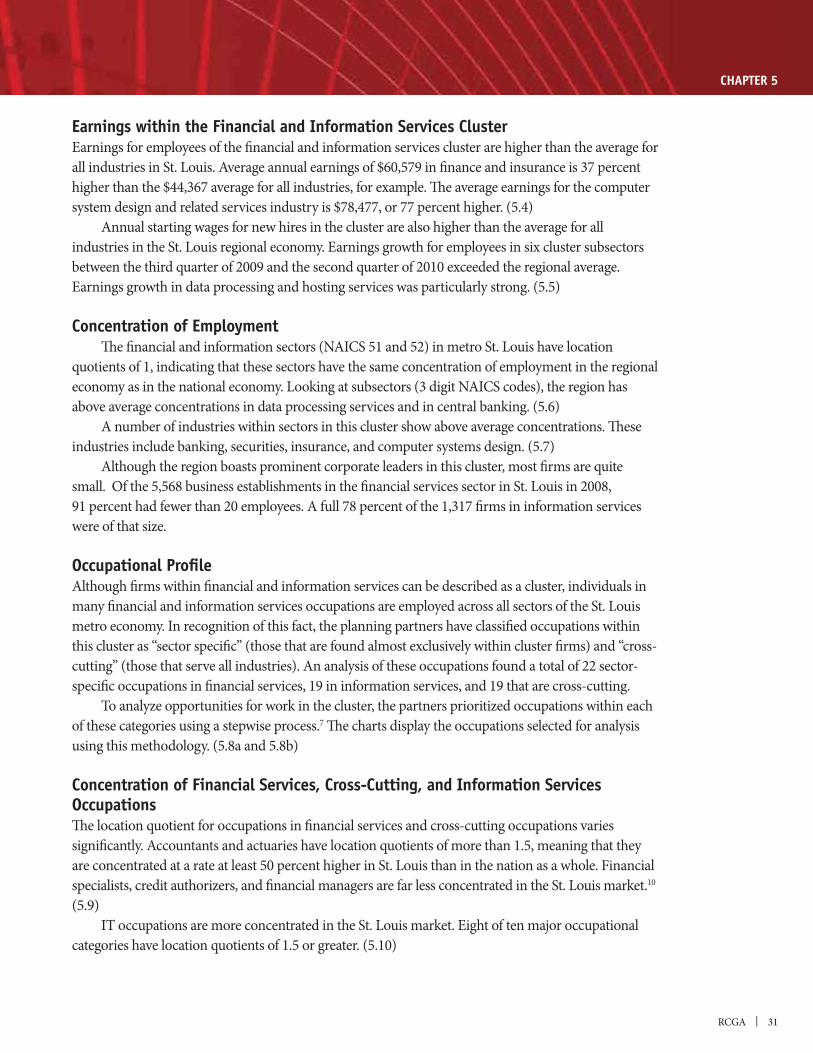
Definition of Financial and Information Services ClusterThe financial services sector is comprised of banks; securities, commodities, and investment firms; insurance carriers; funds, trusts, and other financial vehicles; and bank holding companies. The information services sector includes companies that host and process data and those that design and manage IT systems and services. (5.1) The financial services sector accounted for 5.6 percent of total employment in metro St. Louis
related activities sector demonstrated the strongest performance over this period. This sector includes banking, savings and loan and credit unions, credit card issuing and sales financing, and mortgage brokers. (5.2) These firms operate in a dynamic and interdependent environment. Employment losses in the information industry, driven by contractions in the telecommunications sector, lead the overall information sector to trail the region’s total employment performance. The cluster definition incorporates only a portion of the larger information sector. In the taxonomy of the North American Industrial Classification System, the cluster includes NAICS 52, and parts of NAICS 51, 54, and 55. (5.3)
30 | Talent: The Future of Metro St. Louis in the Knowledge Economy
Computer Systems Design& Related Services
(NAICS 5415)Se
Sy SeSe
Se
Other Information Services(NAICS 519)
Ne
gWe Se
Data Processing, Hosting& Related Services
(NAICS 518)
INFO
RMAT
ION
SU
PPO
RTFI
NA
NCI
AL
SERV
ICES
IND
UST
RY
Prof
essio
nal &
Tech
nica
l Ser
vice
sN
AIC
S 54
Info
rmat
ion
NA
ICS
54M
anag
emen
tof
Com
pani
es&
Ent
erpr
ises
NA
ICS
55
Fina
nce &
Insu
ranc
eN
AIC
S 52
Central Banks (NAICS 521)
Offices of Bank Holding CompaniesNAICS 551111
Funds, Trusts, & OtherFinancial Vehicles
(NAICS 525)
Insurance Carriers& Other
(NAICS 524)
Securities, Commodities& Investments (NAICS 523)
&
&
Ex
Depository Banks (NAICS 522)
ed
INFR
AST
RUCT
URE
ProfessionalAssociations
Other Professional& Technical Services
Utilities &Infrastructure
Education &Training
ResearchUniversities
OCC
UPA
TIO
NS Entry Level ($20,000 – $49,999)
okkeep
ppb
Mid Level ($50,000 – $79,999)A
Sy
Higher ($80,000 and up)Softw
Sy
5.1 The Financial and Information Services Cluster
RCGA | 31
CHAPTER 5
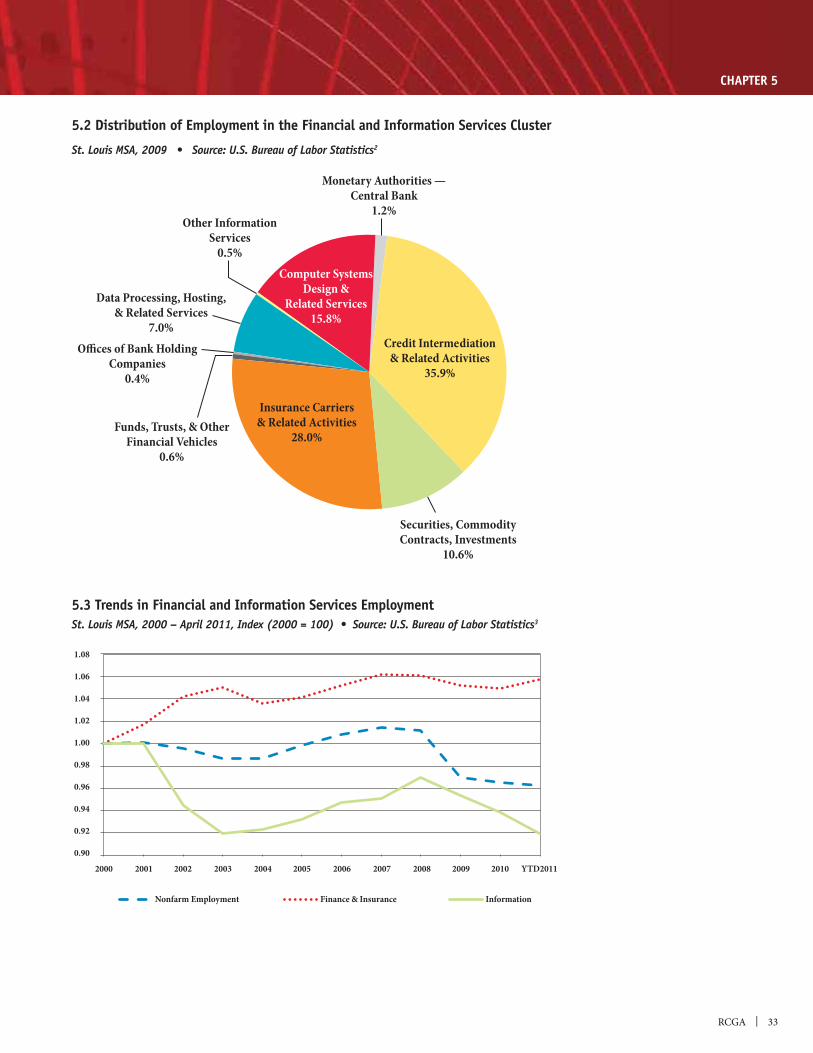
Earnings within the Financial and Information Services ClusterEarnings for employees of the financial and information services cluster are higher than the average for all industries in St. Louis. Average annual earnings of $60,579 in finance and insurance is 37 percent higher than the $44,367 average for all industries, for example. The average earnings for the computer system design and related services industry is $78,477, or 77 percent higher. (5.4) Annual starting wages for new hires in the cluster are also higher than the average for all industries in the St. Louis regional economy. Earnings growth for employees in six cluster subsectors between the third quarter of 2009 and the second quarter of 2010 exceeded the regional average. Earnings growth in data processing and hosting services was particularly strong. (5.5)
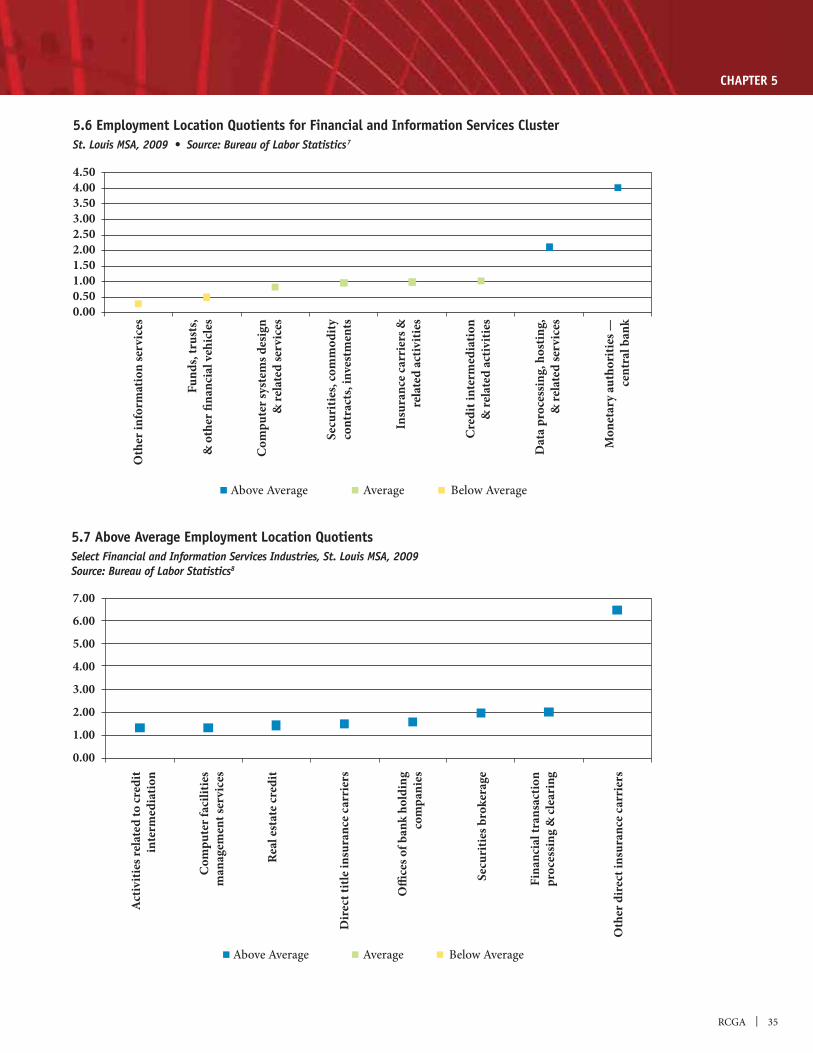
Concentration of Employment The financial and information sectors (NAICS 51 and 52) in metro St. Louis have location quotients of 1, indicating that these sectors have the same concentration of employment in the regional economy as in the national economy. Looking at subsectors (3 digit NAICS codes), the region has above average concentrations in data processing services and in central banking. (5.6) A number of industries within sectors in this cluster show above average concentrations. These industries include banking, securities, insurance, and computer systems design. (5.7) Although the region boasts prominent corporate leaders in this cluster, most firms are quite small. Of the 5,568 business establishments in the financial services sector in St. Louis in 2008, 91 percent had fewer than 20 employees. A full 78 percent of the 1,317 firms in information services were of that size.
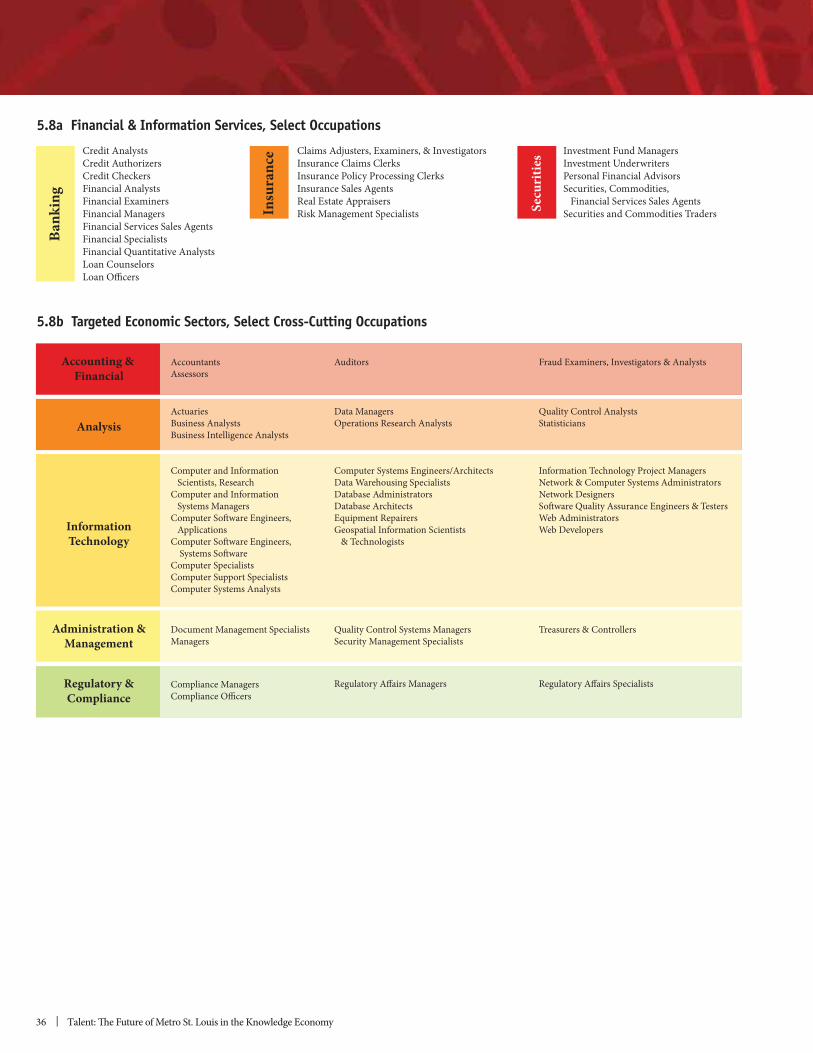
Occupational ProfileAlthough firms within financial and information services can be described as a cluster, individuals in many financial and information services occupations are employed across all sectors of the St. Louis metro economy. In recognition of this fact, the planning partners have classified occupations within
To analyze opportunities for work in the cluster, the partners prioritized occupations within each of these categories using a stepwise process.7 The charts display the occupations selected for analysis using this methodology. (5.8a and 5.8b)
Concentration of Financial Services, Cross-Cutting, and Information Services Occupations
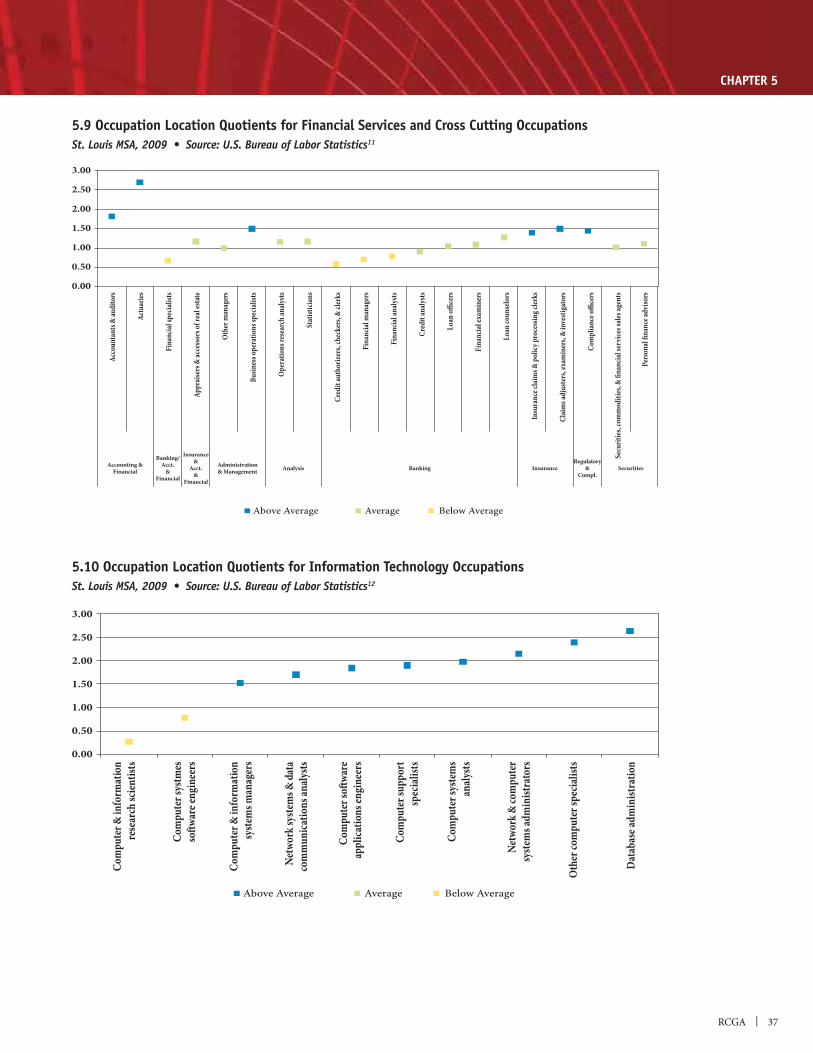
significantly. Accountants and actuaries have location quotients of more than 1.5, meaning that they are concentrated at a rate at least 50 percent higher in St. Louis than in the nation as a whole. Financial specialists, credit authorizers, and financial managers are far less concentrated in the St. Louis market.10
(5.9) IT occupations are more concentrated in the St. Louis market. Eight of ten major occupational categories have location quotients of 1.5 or greater. (5.10)

32 | Talent: The Future of Metro St. Louis in the Knowledge Economy
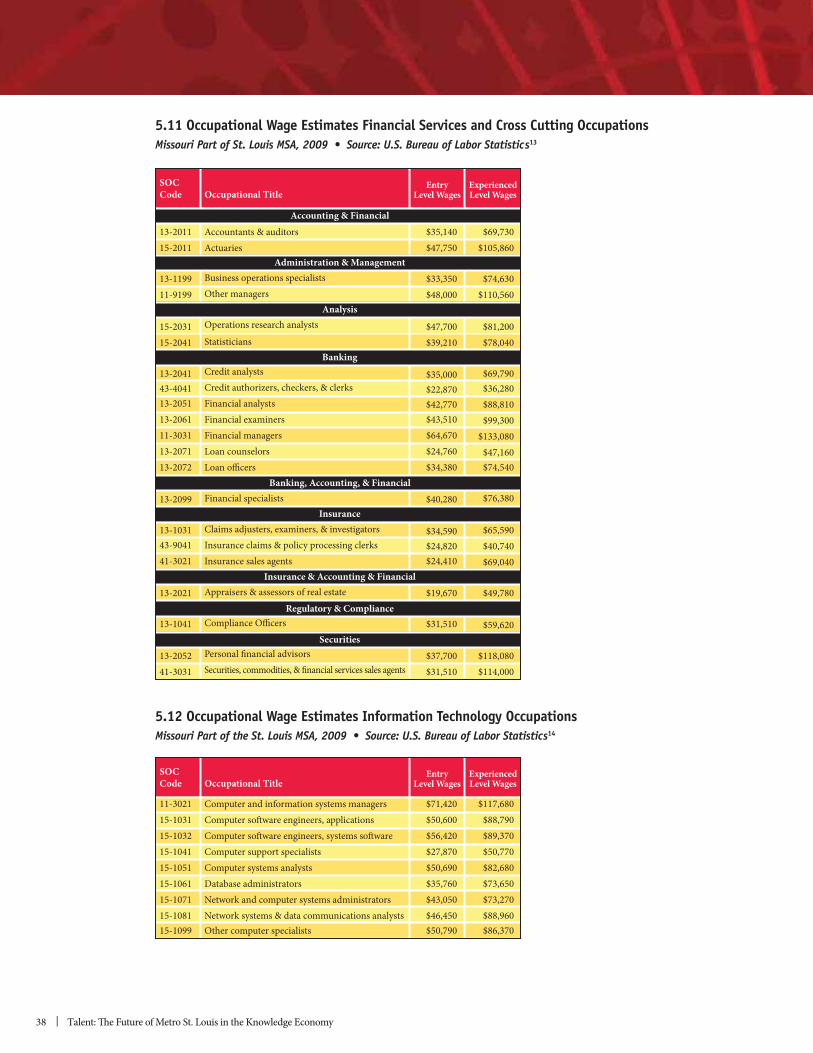
Wages for Financial Services, Cross-Cutting, and Information Services Occupations
Classification (SOC) system codes and occupational titles. (5.11) Entry level wages in IT occupations are particularly strong. Section 9 provides an example of a career pathway in which motivated and persistent individuals can enter the IT field as computer support specialists and work their way up to computer systems analyst positions with high earning potential. (5.12)
Comparison to U.S. Wages
of wages nationally. At the lower end of this range, wages for credit analysts and insurance sales agents are approximately 89 percent of national wages and, at the higher end, wages for financial examiners and real estate appraisers and assessors are about 105 percent of the national wages. St. Louis area wages for information technology occupations overall are about 91 percent of national wages. The wage differential ranges from a low of 80 percent for computer and information research scientists to 108 percent for network systems and data communication analysts.
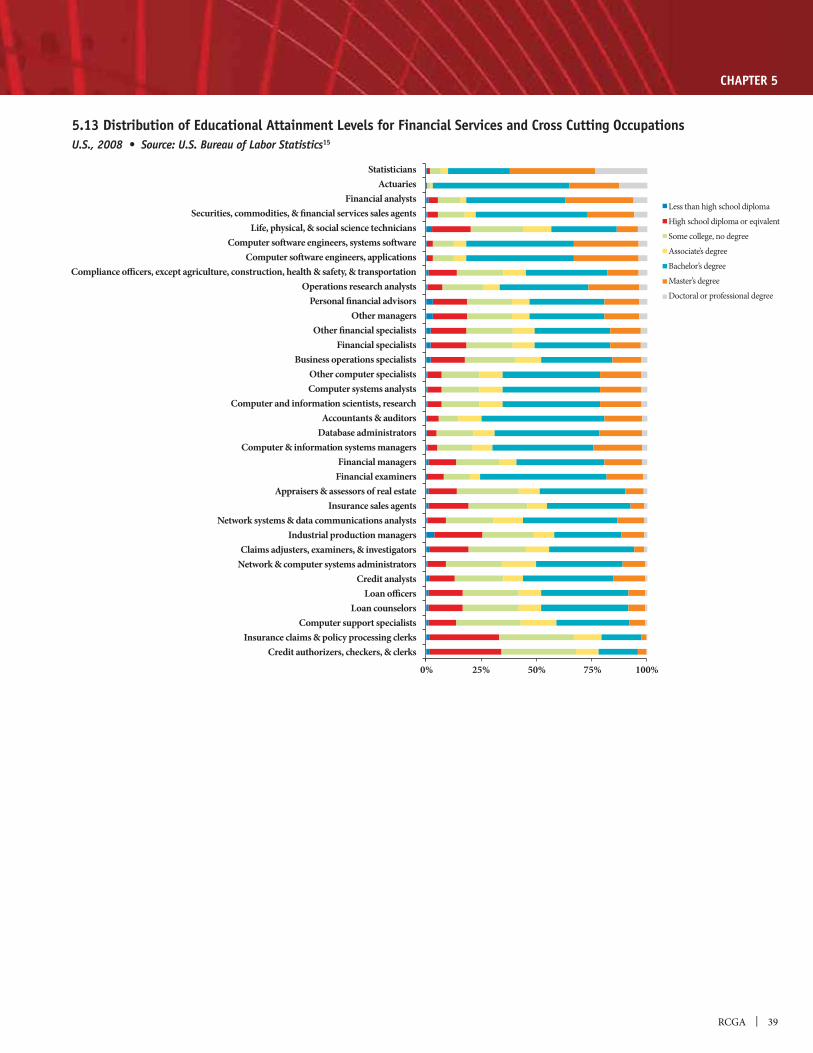
College Credentials and Financial and Information Services Occupations
and Information Center (MERIC) have these requirements. In practice at the national level, however, individuals currently working in these occupations have
some college and no degree. Among financial analysts, 31 percent have master’s degrees and 44.6
RCGA | 33
CHAPTER 5
Credit Intermediation& Related Activities
35.9%
Securities, CommodityContracts, Investments
10.6%
Insurance Carriers& Related Activities
28.0%
Computer SystemsDesign &
Related Services15.8%
Monetary Authorities —Central Bank
1.2%Other Information
Services0.5%
Data Processing, Hosting,& Related Services
7.0%Offices of Bank Holding
Companies0.4%
Funds, Trusts, & OtherFinancial Vehicles
0.6%
5.2 Distribution of Employment in the Financial and Information Services Cluster 2
1.08
1.06
1.04
1.02
1.00
0.98
0.96
0.94
0.92
0.90
YTD201120102009200820072006200520042003200220012000
Nonfarm Employment Finance & Insurance Information
5.3 Trends in Financial and Information Services Employment3
34 | Talent: The Future of Metro St. Louis in the Knowledge Economy
NAICS Industry DescriptionCodes
Avg. Earningsby Industry
All Industries 52 Finance and insurance521 Monetary authorities — central bank522 Credit intermediation and related activities523 Securities, commodity contracts, investments524 Insurance carriers and related activities525 Funds, trusts, and other financial vehicles55111 Offices of bank holding companies518 Data processing, hosting and related services519 Other information services5415 Computer systems design and related services
$44,367
$60,579$80,906$51,709$85,718$61,547$63,158$67,937
$114,426$44,787$78,477
5.4 Average Earnings by Industry Financial and Information Services Cluster 4
New HireAvg. Monthly
Earnings
Avg. QuarterlyNew Hire
Employment
Avg.Earnings
Growth (%)
Avg.MonthlyEarnings
Avg.Quarterly
EmploymentNAICS Code Industry
$2,252
$3,851$3,687$4,740$3,688$3,278$4,790$3,173$4,359$4,053
55,392
2,7081,208
3131,164
10169
361,3392,919
1.30%
-1.10%-0.40%2.00%
-2.50%3.30%6.30%3.60%5.80%2.70%
$3,827
$5,374$4,330$8,278$5,413$5,189$9,400$3,972$6,521$5,601
908,848
47,80520,022
7,12319,457
4565,262
32539,30862,252
All Employees New Hires
52522523524525518519551541
All Industries
Finance and InsuranceCredit intermediation and related activitiesSecurities, commodity contracts, investmentsInsurance carriers and related activitiesFunds, trusts, and other financial vehiclesData processing, hosting and related servicesOther information servicesManagement of companies and enterprisesProfessional, scientific and technical services
5.5 Employment and Average Earnings Financial and Information Services Cluster 5
RCGA | 35
CHAPTER 5
4.504.003.503.002.502.001.501.000.500.00
Oth
er in
form
atio
n se
rvic
es
Fund
s, tr
usts
,&
oth
er fi
nanc
ial v
ehic
les
Com
pute
r sys
tem
s des
ign
& re
late
d se
rvic
es
Secu
ritie
s, co
mm
odity
cont
ract
s, in
vest
men
ts
Insu
ranc
e car
rier
s &re
late
d ac
tiviti
es
Cred
it in
term
edia
tion
& re
late
d ac
tiviti
es
Dat
a pro
cess
ing,
hos
ting,
& re
late
d se
rvic
es
Mon
etar
y aut
hori
ties —
cent
ral b
ank
Above Average Average Below Average
5.6 Employment Location Quotients for Financial and Information Services Cluster 7
Act
iviti
es re
late
d to
cred
itin
term
edia
tion
Com
pute
r fac
ilitie
sm
anag
emen
t ser
vice
s
Real
esta
te cr
edit
Dir
ect t
itle i
nsur
ance
carr
iers
Offi
ces o
f ban
k ho
ldin
gco
mpa
nies
Secu
ritie
s bro
kera
ge
Fina
ncia
l tra
nsac
tion
proc
essi
ng &
clea
ring
Oth
er d
irec
t ins
uran
ce ca
rrie
rs7.00
6.00
5.00
4.00
3.00
2.00
1.00
0.00
Above Average Average Below Average
5.7 Above Average Employment Location Quotients
8
36 | Talent: The Future of Metro St. Louis in the Knowledge Economy
Claims Adjusters, Examiners, & InvestigatorsInsurance Claims ClerksInsurance Policy Processing ClerksInsurance Sales AgentsReal Estate Appraisers Risk Management Specialists Se
curi
ties
Insu
ranc
e
Bank
ing
Investment Fund Managers Investment UnderwritersPersonal Financial AdvisorsSecurities, Commodities, Financial Services Sales AgentsSecurities and Commodities Traders
Credit AnalystsCredit AuthorizersCredit CheckersFinancial AnalystsFinancial ExaminersFinancial ManagersFinancial Services Sales AgentsFinancial SpecialistsFinancial Quantitative Analysts Loan CounselorsLoan Officers
Regulatory &Compliance
Administration &Management
InformationTechnology
Analysis
Accounting & Financial
Compliance ManagersCompliance Officers
Regulatory Affairs Managers Regulatory Affairs Specialists
AccountantsAssessors
Auditors Fraud Examiners, Investigators & Analysts
ActuariesBusiness AnalystsBusiness Intelligence Analysts
Data ManagersOperations Research Analysts
Quality Control AnalystsStatisticians
Computer and Information Scientists, ResearchComputer and Information Systems ManagersComputer Software Engineers, ApplicationsComputer Software Engineers, Systems SoftwareComputer SpecialistsComputer Support SpecialistsComputer Systems Analysts
Computer Systems Engineers/ArchitectsData Warehousing SpecialistsDatabase AdministratorsDatabase ArchitectsEquipment RepairersGeospatial Information Scientists & Technologists
Information Technology Project ManagersNetwork & Computer Systems AdministratorsNetwork DesignersSoftware Quality Assurance Engineers & TestersWeb AdministratorsWeb Developers
Document Management SpecialistsManagers
Quality Control Systems Managers Security Management Specialists
Treasurers & Controllers
5.8a Financial & Information Services, Select Occupations
5.8b Targeted Economic Sectors, Select Cross-Cutting Occupations
RCGA | 37
CHAPTER 5
Com
puter
& in
form
atio
nre
sear
ch sc
ientis
ts
Com
puter
systm
esso
ftwar
e eng
inee
rs
Com
puter
& in
form
atio
nsy
stem
s man
ager
s
Netw
ork s
ystem
s & da
taco
mm
unica
tions
analy
sts
Com
puter
softw
are
appl
icatio
ns en
gine
ers
Com
puter
supp
ort
spec
ialist
s
Com
puter
syste
ms
analy
sts
Netw
ork &
com
puter
syste
ms a
dmin
istra
tors
Othe
r com
puter
spec
ialist
s
Data
base
adm
inist
ratio
n3.00
2.50
2.00
1.50
1.00
0.50
0.00
Above Average Average Below Average
5.10 Occupation Location Quotients for Information Technology Occupations 12
5.9 Occupation Location Quotients for Financial Services and Cross Cutting Occupations 11
Acco
unta
nts &
audi
tors
Actu
aries
Fina
ncial
spec
ialist
s
Appr
aiser
s & ac
cesso
rs of
real
estat
e
Othe
r man
ager
s
Busin
ess o
pera
tions
spec
ialist
s
Oper
atio
ns re
sear
ch an
alysts
Stat
istici
ans
Cred
it au
thor
izers
, che
cker
s, &
clerk
s
Fina
ncial
man
ager
s
Fina
ncial
analy
sts
Cred
it an
alysts
Loan
office
rs
Fina
ncial
exam
iner
s
Loan
coun
selo
rs
Insu
ranc
e clai
ms &
polic
y pro
cessi
ng cl
erks
Claim
s adj
uster
s, ex
amin
ers,
& in
vesti
gato
rs
Com
plian
ce offi
cers
Secu
rities
, com
mod
ities
, & fi
nanc
ial se
rvice
s sale
s age
nts
Pers
onal
finan
ce ad
viso
rs
3.00
2.50
2.00
1.50
1.00
0.50
0.00
Insurance&
Acct.&
Financial
Banking/Acct.
&Financial
Accounting &Financial
Regulatory&
Compl.SecuritiesInsuranceBankingAnalysisAdministration
& Management
Above Average Average Below Average
38 | Talent: The Future of Metro St. Louis in the Knowledge Economy
5.12 Occupational Wage Estimates Information Technology Occupations14
ExperiencedLevel Wages
EntryLevel Wages
SOCCode Occupational Title
$117,680 $88,790 $89,370 $50,770 $82,680 $73,650 $73,270 $88,960 $86,370
$71,420 $50,600 $56,420 $27,870 $50,690 $35,760 $43,050 $46,450 $50,790
11-302115-103115-103215-104115-105115-106115-107115-108115-1099
Computer and information systems managersComputer software engineers, applicationsComputer software engineers, systems softwareComputer support specialistsComputer systems analystsDatabase administratorsNetwork and computer systems administratorsNetwork systems & data communications analystsOther computer specialists
5.11 Occupational Wage Estimates Financial Services and Cross Cutting Occupations13
ExperiencedLevel Wages
EntryLevel Wages
SOCCode Occupational Title
13-201115-2011
13-119911-9199
15-203115-2041
13-204143-404113-205113-206111-303113-207113-2072
13-2099
13-103143-904141-3021
13-2021
13-1041
13-205241-3031
$69,730 $105,860
$74,630 $110,560
$81,200 $78,040
$69,790 $36,280 $88,810 $99,300
$133,080 $47,160 $74,540
$76,380
$65,590 $40,740 $69,040
$49,780
$59,620
$118,080 $114,000
$35,140 $47,750
$33,350 $48,000
$47,700 $39,210
$35,000 $22,870 $42,770 $43,510 $64,670 $24,760 $34,380
$40,280
$34,590 $24,820 $24,410
$19,670
$31,510
$37,700 $31,510
Accountants & auditorsActuaries
Business operations specialistsOther managers
Operations research analysts
Statisticians
Credit analystsCredit authorizers, checkers, & clerksFinancial analystsFinancial examinersFinancial managersLoan counselorsLoan officers
Financial specialists
Claims adjusters, examiners, & investigatorsInsurance claims & policy processing clerksInsurance sales agents
Appraisers & assessors of real estate
Compliance Officers
Personal financial advisorsSecurities, commodities, & financial services sales agents
Securities
Regulatory & Compliance
Insurance & Accounting & Financial
Insurance
Banking, Accounting, & Financial
Banking
Analysis
Administration & Management
Accounting & Financial
RCGA | 39
CHAPTER 5
5.13 Distribution of Educational Attainment Levels for Financial Services and Cross Cutting Occupations15
StatisticiansActuaries
Financial analystsSecurities, commodities, & financial services sales agents
Life, physical, & social science techniciansComputer software engineers, systems software
Computer software engineers, applicationsCompliance officers, except agriculture, construction, health & safety, & transportation
Operations research analystsPersonal financial advisors
Other managersOther financial specialists
Financial specialistsBusiness operations specialists
Other computer specialistsComputer systems analysts
Computer and information scientists, researchAccountants & auditors
Database administratorsComputer & information systems managers
Financial managersFinancial examiners
Appraisers & assessors of real estateInsurance sales agents
Network systems & data communications analystsIndustrial production managers
Claims adjusters, examiners, & investigatorsNetwork & computer systems administrators
Credit analystsLoan officers
Loan counselorsComputer support specialists
Insurance claims & policy processing clerksCredit authorizers, checkers, & clerks
100%75%50%25%0%
Less than high school diplomaHigh school diploma or eqivalentSome college, no degreeAssociate’s degreeBachelor’s degreeMaster’s degreeDoctoral or professional degree
40 | Talent: The Future of Metro St. Louis in the Knowledge Economy
______________
Note: Only a portion of the professional, scientific, and technical services sectors is included in the financial and information services cluster
4. The location quotient represents the ratio of an industry’s share of employment in a given area to that industry’s share of
report, employment location quotients of 1.3 or greater is considered above the national average, location quotients from 0.8 to 1.29 are identified as average, and location quotients of 0.79 or lower are considered below average.
Estimates by County” http://data.bls.gov/pdq/querytool.jsp?survey=en
6. Ibid.
7. Methodology for Occupational Analysis Three steps were taken in order to prioritize occupations for analysis within clusters in the St. Louis area: Step 1. The first step was to establish a preliminary list of occupations that define each industry cluster. Three primary sources were used to select an occupation for each cluster. Each source consisted of a predefined occupational cluster based on the
Occupational Information Network (O*NET) Career and Industry Clusters and Green Economy Sector, and MERIC’s Sustainable Technology occupation list. Occupations were placed into one of three industry clusters using the original source assignments. Occupations listed in all three sources were automatically included into the preliminary list. Occupations appearing in only one or two sources were evaluated and added to the list based on previous RCGA research and local industry knowledge. Additionally, occupations could only be included in one cluster. This process resulted in an extensive list of occupations including 61 titles for Financial and Information Services, 138 in Health Science and Services, and 123 titles listed under Sustainable Technologies. Table 1. Number of occupations at each step of the occupational analysis
Step 1 (Number of Occupations)
Step 2 (Number of Occupations)
Step 3 (Number of Occupations)
Financial and Information Services 61 41 58Sustainable Technologies 123 46 53Health Science and Services 138 95 82
*Sources: Market Street. “Occupation Clusters” Missouri Economic Research and Information Center (MERIC). “Missouri Green Jobs Report.” http://www.missourieconomy.org/occupations/green_report.stm; Occupational Information Network (O*NET). “Career Cluster.”. http://www.onetonline.org/find/career; “Industry.” http://www.onetonline.org/find/industry; “Green Economy Sector.” http://www.onetonline.org/find/green Step 2. An occupational analysis was conducted in order to identify occupations most likely to contribute to regional
occupations were evaluated on job growth, wage rates, location quotients and educational requirements. The analysis resulted in a core list of occupations for each cluster listed in Table 1.
RCGA | 41
CHAPTER 5
and older by detailed occupation, 2008. http://www.bls.gov/emp/ep_table_111.htm Step 3. Three additional steps were applied to the core occupation list: 1. Additional occupations from O*NET’s New and Emerging occupations list were added to the core listing. New and emerging
occupations were identified within high growth industries identified by the Department of Labor’s Employment Training Administration (DOL/ETA).
the list. The Career Grade Index equally weights three variables for each occupation: average wages, total openings over the
3. Only occupations with average annual wages between $35,000 and $155,000 were selected. The floor of $35,000 is
approximate amount that each
$155,000 is approximately three times the median household income for St. Louis. It is assumed that talent for occupations with higher annual salaries would be sourced outside the strategies of this plan. Sources: Occupational Information Network (O*NET). “New and Emerging.”http://www.onetonline.org/find/
Missouri Economic Research and Information Center (MERIC). “Career Grades.” http://www.missourieconomy.org/
8. The location quotient represents the ratio of an occupation’s share of employment in a given area to that occupation’s share
Throughout this report, occupation location quotients of 1.3 or greater is considered above the national average, location quotients from 0.8 to 1.29 are identified as average, and location quotients of 0.79 or lower are considered below average.
Statistics, http://www.bls.gov/oes/2009/may/oessrcma.htm
10. Ibid.
http://www.missourieconomy.org/occupations/index.stm.
12. Ibid.
http://www.bls.gov/emp/ep_table_111.htm
14. Ibid.
42 | Talent: The Future of Metro St. Louis in the Knowledge Economy
Opportunity: Sustainable Technologies
IntroductionNot unlike information technology, sustainable technology is less a discrete industry than it is a new way of doing business that is permeating all sectors. Sustainable practices are those that maximize efficiency and minimize negative impacts on the environment. In metro St. Louis, sustainability is an expressed value and a growing practice in firms in architecture, construction, retail, hospitality, agriculture, energy, information services, finance, manufacturing, and other fields. Today, St. Louisans applaud individual sustainability projects as they break old patterns and set new standards, but tomorrow, sustainability is likely to be a ‘given’ across the economy. Increasing public awareness, changing cultural norms, and innovative technologies ensure that it will be so. A number of motivating factors drive the economy toward greater use of sustainable technologies. One of these is the need to be more efficient. Sustainable practices are those that use
energy, or human potential—dulls the edge of companies operating in today’s global marketplace, where leanness and agility are essential to competitiveness. A second motivator is a concern for the environment, in particular a desire not to exploit or
on the negative impact of pollution on human health. Companies and individuals adopt practices that are less harmful to the environment because of values around people and planet, and also in response to external pressures to do so. A third motivator incorporates sustainability into a ‘triple bottom line’ approach. Entrepreneurs, small businesses, and large corporations alike are finding ways to link financial profits to environmental quality and social good. The possibilities have already blurred the lines between
suggest that this quest for ‘shared value’ has “the power to unleash the next wave of global growth.”1
run, it is likely that many of the opportunities in existing firms will not be ‘new’ jobs. Rather, they will be traditional jobs reset in changing business environments, using emerging tools and technologies, redefined by new skill and certification requirements. New job creation will likely favor the innovation sector, where inventors and entrepreneurs are
resulting in new applications that will transform conventional products and processes that were not ‘sustainable’ in the past. The St. Louis region has the benefit of being one of four pilot regions participating in Climate Prosperity, Inc., a national initiative that is “showcasing how innovation and economic development
2 The talent strategy described in this document links to the strategic framework that Climate Prosperity has developed to engage local stakeholders in creating
6
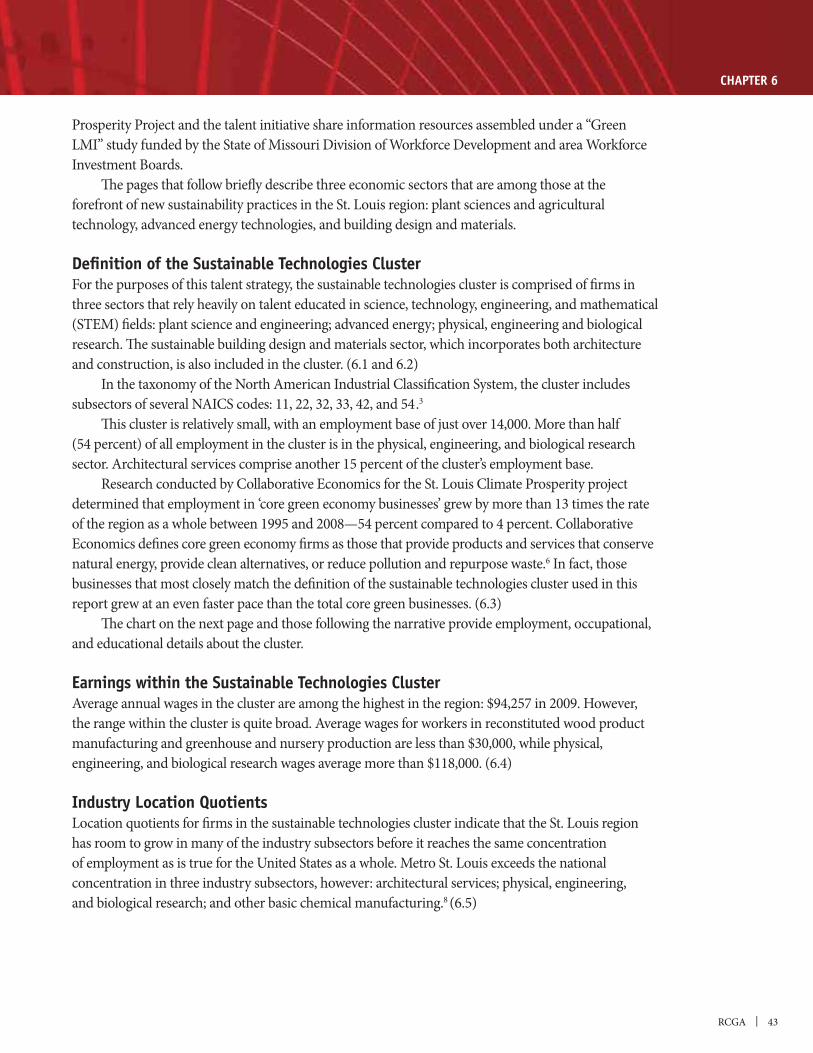
RCGA | 43
CHAPTER 6
Prosperity Project and the talent initiative share information resources assembled under a “Green
The pages that follow briefly describe three economic sectors that are among those at the forefront of new sustainability practices in the St. Louis region: plant sciences and agricultural technology, advanced energy technologies, and building design and materials.
Definition of the Sustainable Technologies ClusterFor the purposes of this talent strategy, the sustainable technologies cluster is comprised of firms in three sectors that rely heavily on talent educated in science, technology, engineering, and mathematical (STEM) fields: plant science and engineering; advanced energy; physical, engineering and biological research. The sustainable building design and materials sector, which incorporates both architecture and construction, is also included in the cluster. (6.1 and 6.2) In the taxonomy of the North American Industrial Classification System, the cluster includes subsectors of several NAICS codes: 11, 22, 32, 33, 42, and 54.3 This cluster is relatively small, with an employment base of just over 14,000. More than half (54 percent) of all employment in the cluster is in the physical, engineering, and biological research sector. Architectural services comprise another 15 percent of the cluster’s employment base. Research conducted by Collaborative Economics for the St. Louis Climate Prosperity project determined that employment in ‘core green economy businesses’ grew by more than 13 times the rate of the region as a whole between 1995 and 2008—54 percent compared to 4 percent. Collaborative Economics defines core green economy firms as those that provide products and services that conserve natural energy, provide clean alternatives, or reduce pollution and repurpose waste.6 In fact, those businesses that most closely match the definition of the sustainable technologies cluster used in this report grew at an even faster pace than the total core green businesses. (6.3) The chart on the next page and those following the narrative provide employment, occupational, and educational details about the cluster.
Earnings within the Sustainable Technologies ClusterAverage annual wages in the cluster are among the highest in the region: $94,257 in 2009. However, the range within the cluster is quite broad. Average wages for workers in reconstituted wood product manufacturing and greenhouse and nursery production are less than $30,000, while physical, engineering, and biological research wages average more than $118,000. (6.4)
Industry Location QuotientsLocation quotients for firms in the sustainable technologies cluster indicate that the St. Louis region has room to grow in many of the industry subsectors before it reaches the same concentration
concentration in three industry subsectors, however: architectural services; physical, engineering, and biological research; and other basic chemical manufacturing.8 (6.5)
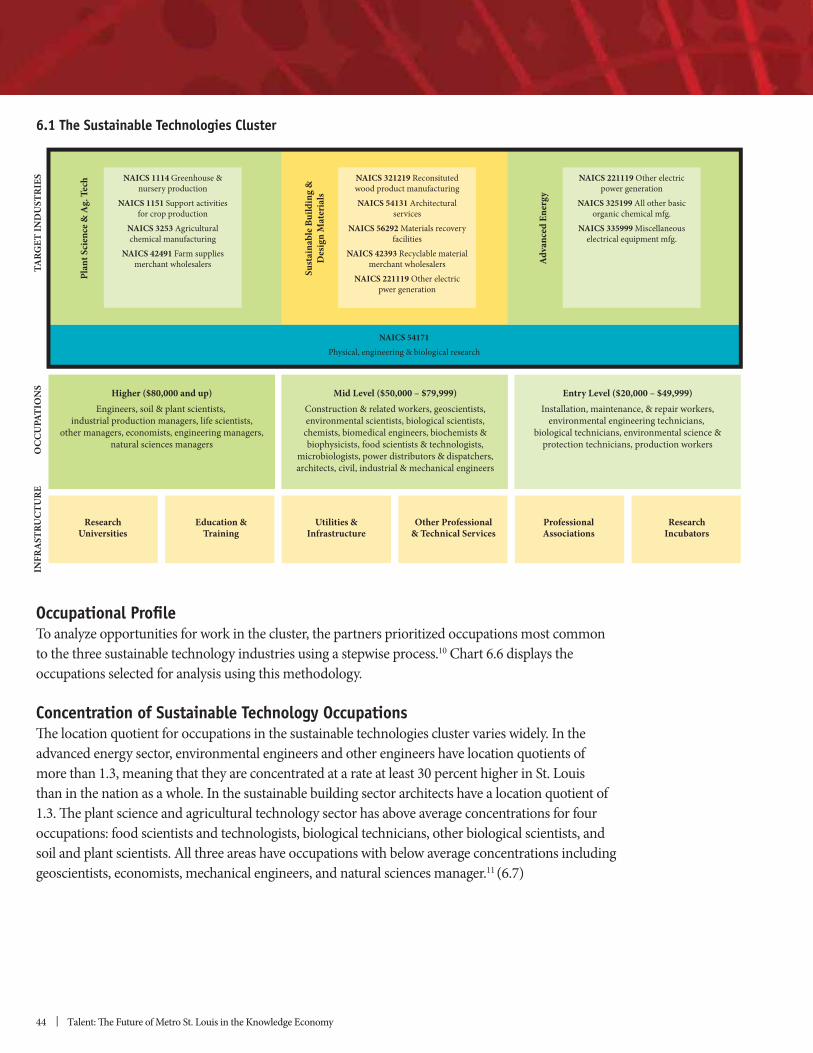
44 | Talent: The Future of Metro St. Louis in the Knowledge Economy
NAICS 54171Physical, engineering & biological research
NAICS 221119 Other electricpower generation
NAICS 325199 All other basicorganic chemical mfg.
NAICS 335999 Miscellaneouselectrical equipment mfg.
NAICS 321219 Reconsitutedwood product manufacturingNAICS 54131 Architectural
servicesNAICS 56292 Materials recovery
facilitiesNAICS 42393 Recyclable material
merchant wholesalersNAICS 221119 Other electric
pwer generation
INFR
AST
RUCT
URE
OCC
UPA
TIO
NS
TARG
ET IN
DU
STRI
ES
Adva
nced
Ene
rgy
Sust
aina
ble B
uild
ing
&D
esig
n M
ater
ials
Plan
t Sci
ence
& A
g. T
ech NAICS 1114 Greenhouse &
nursery productionNAICS 1151 Support activities
for crop productionNAICS 3253 Agriculturalchemical manufacturing
NAICS 42491 Farm suppliesmerchant wholesalers
Entry Level ($20,000 – $49,999)Installation, maintenance, & repair workers,
environmental engineering technicians, biological technicians, environmental science &
protection technicians, production workers
Mid Level ($50,000 – $79,999)Construction & related workers, geoscientists,environmental scientists, biological scientists,chemists, biomedical engineers, biochemists &biophysicists, food scientists & technologists,
microbiologists, power distributors & dispatchers,architects, civil, industrial & mechanical engineers
Higher ($80,000 and up)Engineers, soil & plant scientists,
industrial production managers, life scientists,other managers, economists, engineering managers,
natural sciences managers
ResearchIncubators
ProfessionalAssociations
Other Professional& Technical Services
Utilities &Infrastructure
Education &Training
ResearchUniversities
6.1 The Sustainable Technologies Cluster
Occupational ProfileTo analyze opportunities for work in the cluster, the partners prioritized occupations most common to the three sustainable technology industries using a stepwise process.10 Chart 6.6 displays the occupations selected for analysis using this methodology.
Concentration of Sustainable Technology OccupationsThe location quotient for occupations in the sustainable technologies cluster varies widely. In the advanced energy sector, environmental engineers and other engineers have location quotients of more than 1.3, meaning that they are concentrated at a rate at least 30 percent higher in St. Louis than in the nation as a whole. In the sustainable building sector architects have a location quotient of 1.3. The plant science and agricultural technology sector has above average concentrations for four occupations: food scientists and technologists, biological technicians, other biological scientists, and soil and plant scientists. All three areas have occupations with below average concentrations including geoscientists, economists, mechanical engineers, and natural sciences manager.11 (6.7)
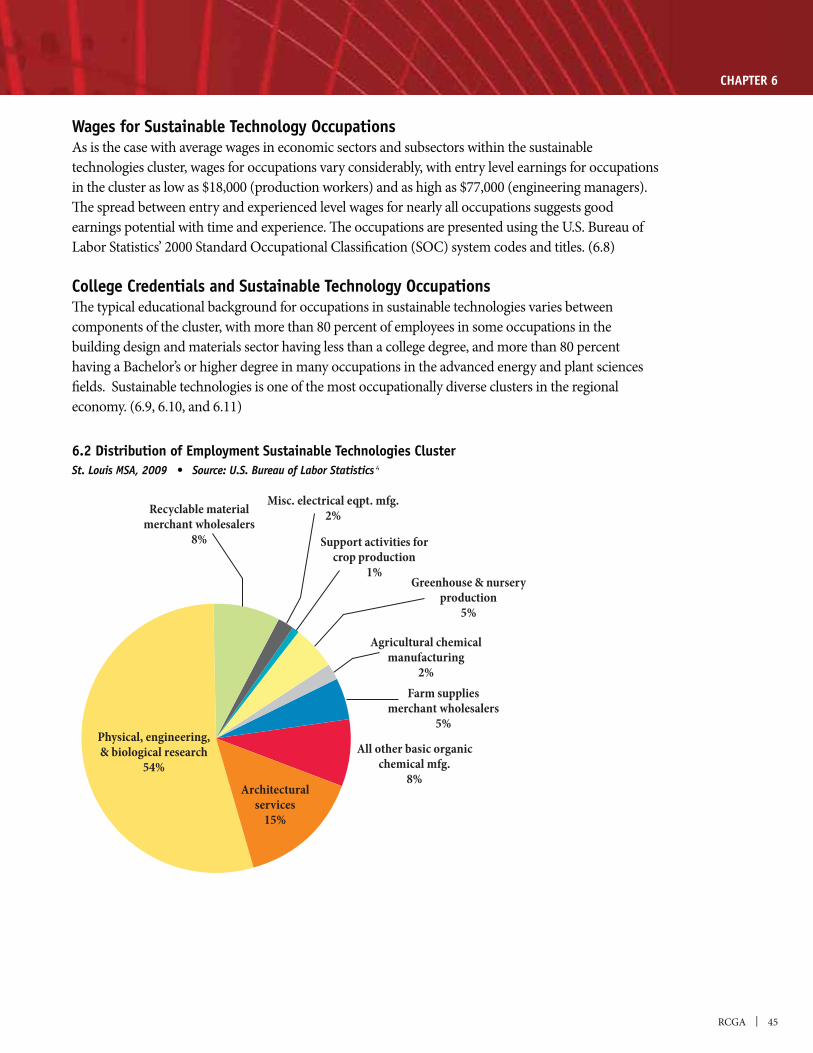
RCGA | 45
CHAPTER 6
Recyclable materialmerchant wholesalers
8%
Misc. electrical eqpt. mfg.2%
Support activities forcrop production
1%Greenhouse & nursery
production5%
Agricultural chemicalmanufacturing
2%
All other basic organicchemical mfg.
8%
Farm suppliesmerchant wholesalers
5%Physical, engineering,& biological research
54%Architectural
services15%
6.2 Distribution of Employment Sustainable Technologies Cluster4
Wages for Sustainable Technology OccupationsAs is the case with average wages in economic sectors and subsectors within the sustainable technologies cluster, wages for occupations vary considerably, with entry level earnings for occupations in the cluster as low as $18,000 (production workers) and as high as $77,000 (engineering managers). The spread between entry and experienced level wages for nearly all occupations suggests good
Labor Statistics’ 2000 Standard Occupational Classification (SOC) system codes and titles. (6.8)
College Credentials and Sustainable Technology OccupationsThe typical educational background for occupations in sustainable technologies varies between components of the cluster, with more than 80 percent of employees in some occupations in the building design and materials sector having less than a college degree, and more than 80 percent
fields. Sustainable technologies is one of the most occupationally diverse clusters in the regional economy. (6.9, 6.10, and 6.11)
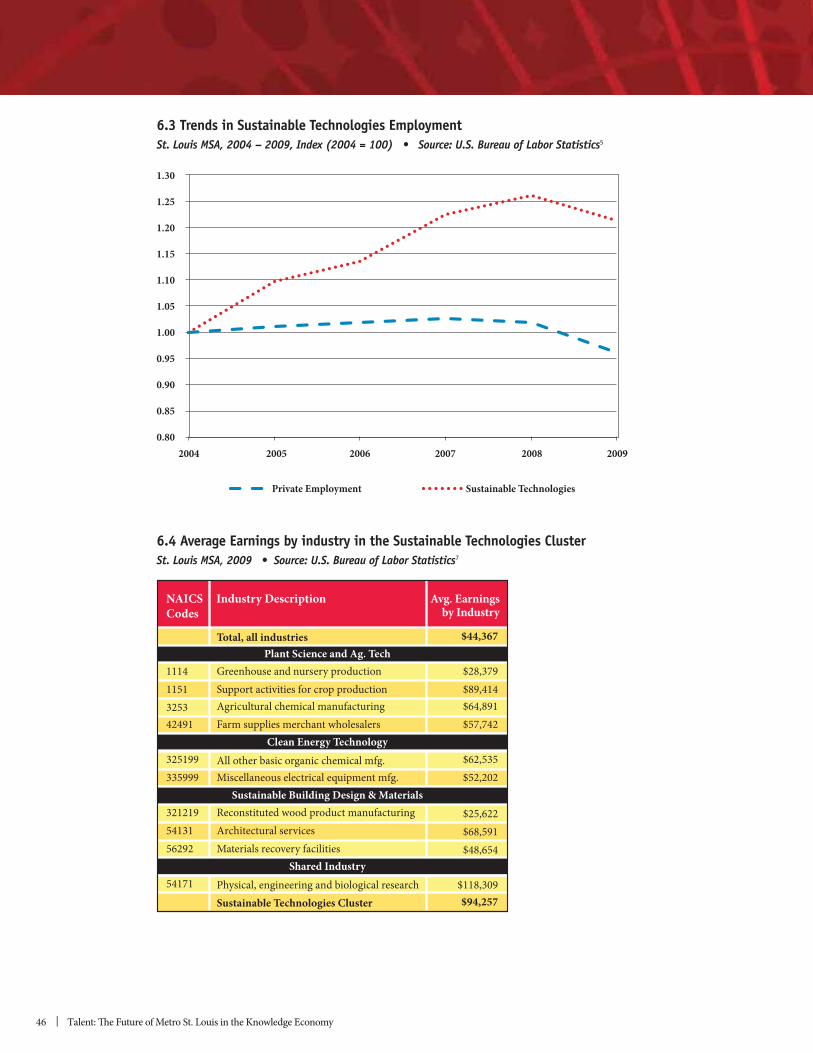
46 | Talent: The Future of Metro St. Louis in the Knowledge Economy
Private Employment Sustainable Technologies
1.30
1.25
1.20
1.15
1.10
1.05
1.00
0.95
0.90
0.85
0.80200920082007200620052004
6.3 Trends in Sustainable Technologies Employment5
NAICS Industry DescriptionCodes
Avg. Earningsby Industry
$44,367
$28,379$89,414$64,891$57,742
$62,535$52,202$67,937$25,622$68,591$48,654
$118,309 $94,257
Shared Industry
Sustainable Building Design & Materials
Clean Energy Technology
Plant Science and Ag. Tech11141151325342491
325199335999
3212195413156292
54171
Total, all industries
Greenhouse and nursery productionSupport activities for crop productionAgricultural chemical manufacturingFarm supplies merchant wholesalers
All other basic organic chemical mfg.Miscellaneous electrical equipment mfg.
Reconstituted wood product manufacturingArchitectural servicesMaterials recovery facilities
Physical, engineering and biological researchSustainable Technologies Cluster
6.4 Average Earnings by industry in the Sustainable Technologies Cluster7
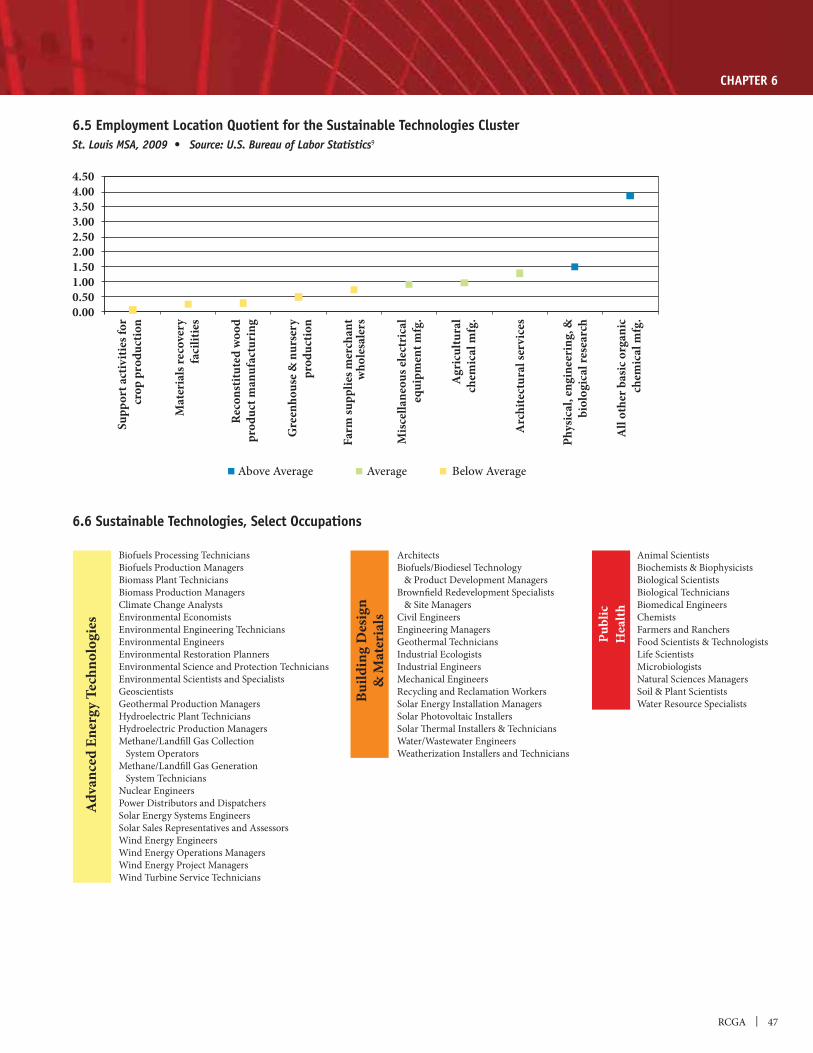
RCGA | 47
CHAPTER 6
4.504.003.503.002.502.001.501.000.500.00
Supp
ort a
ctiv
ities
for
crop
pro
duct
ion
Mat
eria
ls re
cove
ryfa
cilit
ies
Reco
nstit
uted
woo
dpr
oduc
t man
ufac
turi
ng
Gre
enho
use &
nur
sery
prod
uctio
n
Farm
supp
lies m
erch
ant
who
lesa
lers
Misc
ella
neou
s ele
ctri
cal
equi
pmen
t mfg
.
Agr
icul
tura
lch
emic
al m
fg.
Arc
hite
ctur
al se
rvic
es
Phys
ical
, eng
inee
ring
, &bi
olog
ical
rese
arch
All
othe
r bas
ic o
rgan
icch
emic
al m
fg.
Above Average Average Below Average
ArchitectsBiofuels/Biodiesel Technology & Product Development ManagersBrownfield Redevelopment Specialists & Site ManagersCivil EngineersEngineering ManagersGeothermal TechniciansIndustrial EcologistsIndustrial EngineersMechanical EngineersRecycling and Reclamation WorkersSolar Energy Installation ManagersSolar Photovoltaic InstallersSolar Thermal Installers & TechniciansWater/Wastewater EngineersWeatherization Installers and Technicians
Publ
icH
ealth
Build
ing
Des
ign
& M
ater
ials
Adv
ance
d En
ergy
Tec
hnol
ogie
s
Animal ScientistsBiochemists & BiophysicistsBiological ScientistsBiological TechniciansBiomedical EngineersChemistsFarmers and RanchersFood Scientists & TechnologistsLife ScientistsMicrobiologistsNatural Sciences ManagersSoil & Plant ScientistsWater Resource Specialists
Biofuels Processing TechniciansBiofuels Production ManagersBiomass Plant TechniciansBiomass Production ManagersClimate Change AnalystsEnvironmental EconomistsEnvironmental Engineering TechniciansEnvironmental EngineersEnvironmental Restoration PlannersEnvironmental Science and Protection TechniciansEnvironmental Scientists and SpecialistsGeoscientistsGeothermal Production ManagersHydroelectric Plant TechniciansHydroelectric Production ManagersMethane/Landfill Gas Collection System OperatorsMethane/Landfill Gas Generation System TechniciansNuclear EngineersPower Distributors and DispatchersSolar Energy Systems EngineersSolar Sales Representatives and AssessorsWind Energy EngineersWind Energy Operations ManagersWind Energy Project ManagersWind Turbine Service Technicians
6.5 Employment Location Quotient for the Sustainable Technologies Cluster9
6.6 Sustainable Technologies, Select Occupations
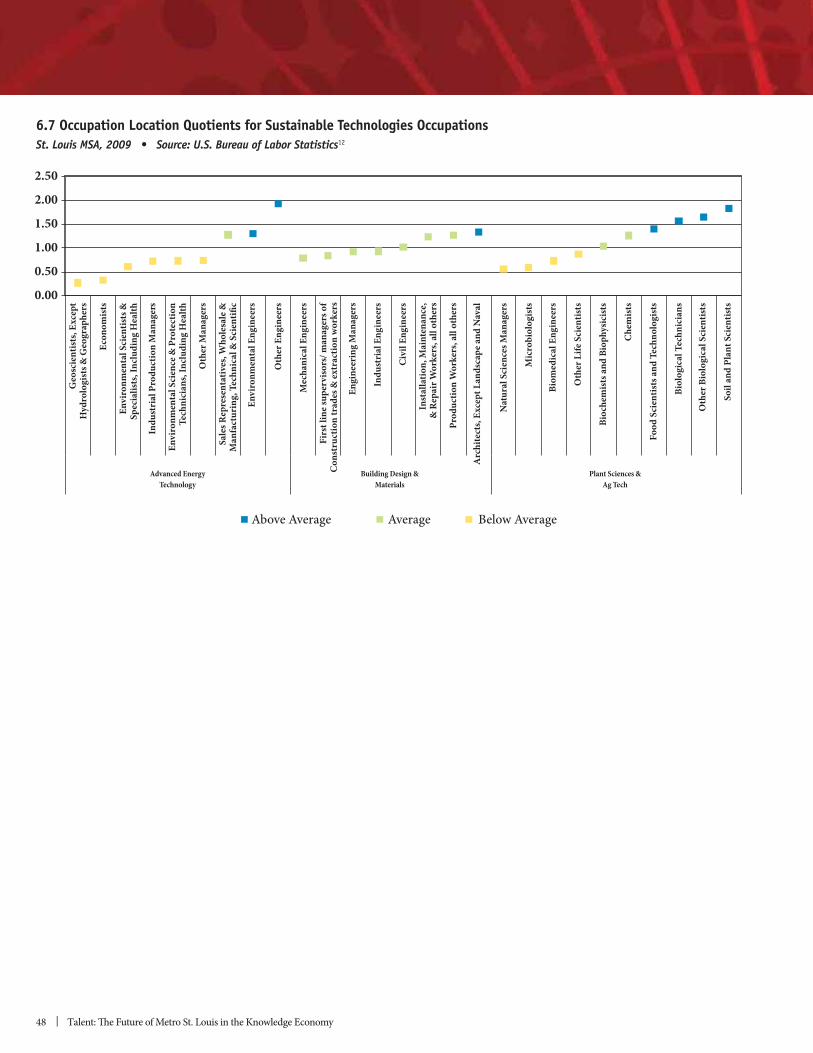
48 | Talent: The Future of Metro St. Louis in the Knowledge Economy
6.7 Occupation Location Quotients for Sustainable Technologies Occupations 12
Geo
scie
ntist
s, Ex
cept
Hyd
rolo
gist
s & G
eogr
aphe
rs
Econ
omist
s En
viro
nmen
tal S
cien
tists
&Sp
ecia
lists
, Inc
ludi
ng H
ealth
Indu
stri
al P
rodu
ctio
n M
anag
ers
Envi
ronm
enta
l Sci
ence
& P
rote
ctio
nTe
chni
cian
s, In
clud
ing
Hea
lth
Oth
er M
anag
ers
Sale
s Rep
rese
ntat
ives
, Who
lesa
le &
Man
fact
urin
g, T
echn
ical
& S
cien
tific
Envi
ronm
enta
l Eng
inee
rs
Oth
er E
ngin
eers
Mec
hani
cal E
ngin
eers
Firs
t lin
e sup
ervi
sors
/ man
ager
s of
Con
stru
ctio
n tr
ades
& ex
trac
tion
work
ers
Engi
neer
ing
Man
ager
s
Indu
stri
al E
ngin
eers
Civi
l Eng
inee
rs
Inst
alla
tion,
Mai
nten
ance
,&
Rep
air W
orke
rs, a
ll ot
hers
Prod
uctio
n W
orke
rs, a
ll ot
hers
Arc
hite
cts,
Exce
pt L
ands
cape
and
Nav
al
Nat
ural
Sci
ence
s Man
ager
s
Mic
robi
olog
ists
Biom
edic
al E
ngin
eers
Oth
er L
ife S
cien
tists
Bioc
hem
ists a
nd B
ioph
ysic
ists
Che
mist
s
Food
Sci
entis
ts an
d Te
chno
logi
sts
Biol
ogic
al T
echn
icia
ns
Oth
er B
iolo
gica
l Sci
entis
ts
Soil
and
Plan
t Sci
entis
ts
2.50
2.00
1.50
1.00
0.50
0.00
Plant Sciences &Ag Tech
Building Design &Materials
Advanced EnergyTechnology
Above Average Average Below Average
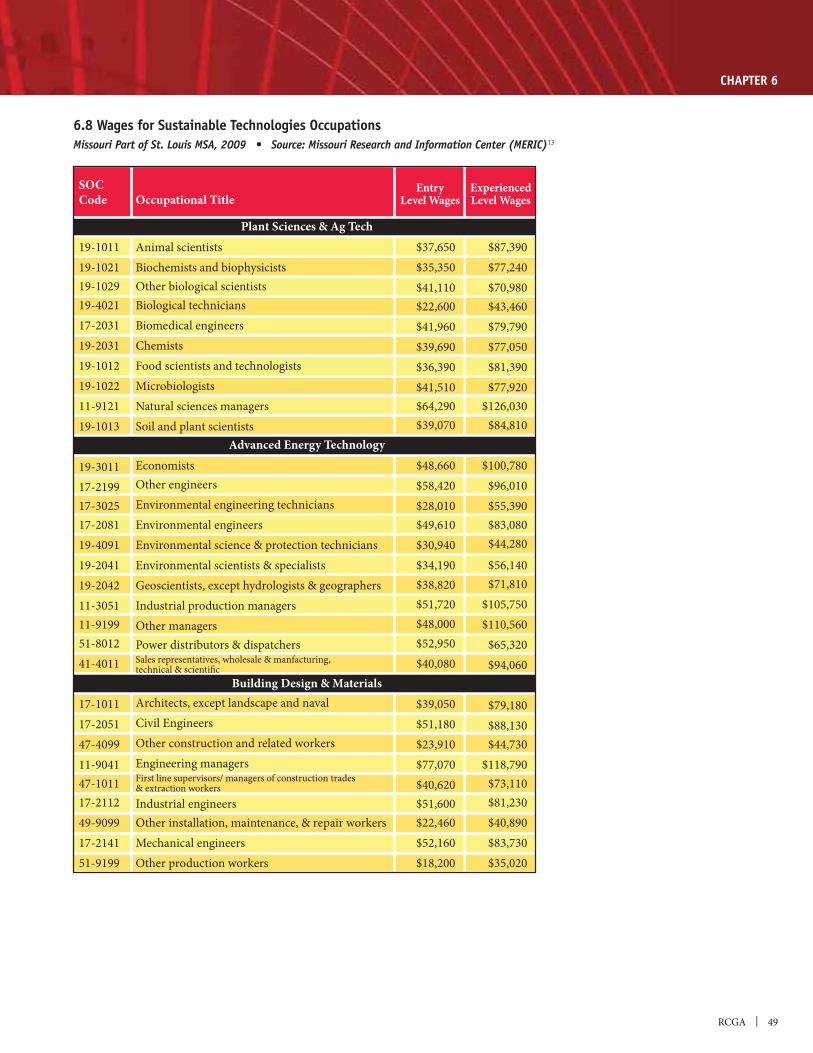
RCGA | 49
CHAPTER 6
6.8 Wages for Sustainable Technologies Occupations13
ExperiencedLevel Wages
EntryLevel Wages
SOCCode Occupational Title
Building Design & Materials
Advanced Energy Technology
Plant Sciences & Ag Tech19-101119-102119-102919-402117-203119-203119-101219-102211-912119-1013
19-301117-219917-302517-208119-409119-204119-204211-305111-919951-801241-4011
17-101117-205147-409911-904147-101117-211249-909917-214151-9199
Animal scientistsBiochemists and biophysicistsOther biological scientistsBiological techniciansBiomedical engineersChemistsFood scientists and technologistsMicrobiologistsNatural sciences managersSoil and plant scientists
Economists Other engineersEnvironmental engineering techniciansEnvironmental engineersEnvironmental science & protection techniciansEnvironmental scientists & specialistsGeoscientists, except hydrologists & geographersIndustrial production managersOther managersPower distributors & dispatchers Sales representatives, wholesale & manfacturing, technical & scientific
Architects, except landscape and navalCivil EngineersOther construction and related workersEngineering managersFirst line supervisors/ managers of construction trades & extraction workersIndustrial engineersOther installation, maintenance, & repair workersMechanical engineersOther production workers
$37,650 $35,350 $41,110 $22,600 $41,960 $39,690 $36,390 $41,510 $64,290 $39,070
$48,660 $58,420 $28,010$49,610
$30,940 $34,190$38,820
$51,720 $48,000 $52,950 $40,080
$39,050 $51,180 $23,910 $77,070 $40,620 $51,600 $22,460 $52,160 $18,200
$87,390 $77,240 $70,980 $43,460 $79,790 $77,050 $81,390 $77,920
$126,030 $84,810
$100,780 $96,010 $55,390 $83,080 $44,280
$56,140 $71,810
$105,750 $110,560
$65,320 $94,060
$79,180 $88,130$44,730
$118,790$73,110 $81,230 $40,890 $83,730 $35,020
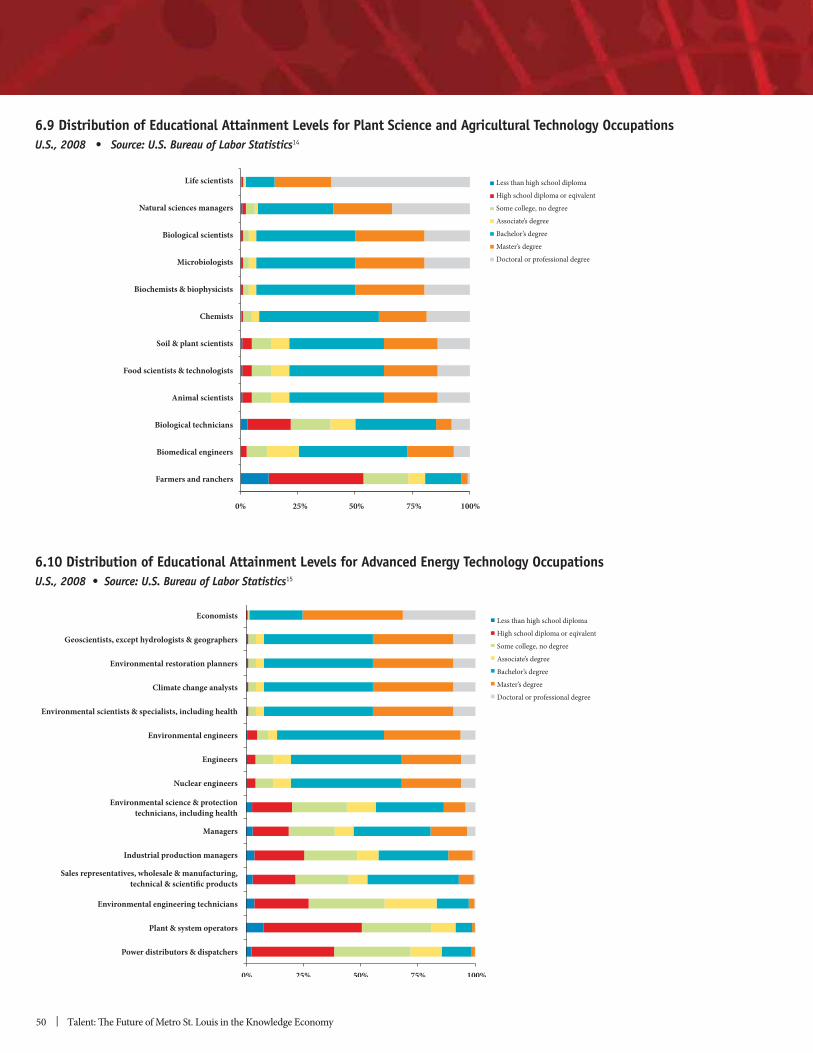
50 | Talent: The Future of Metro St. Louis in the Knowledge Economy
6.10 Distribution of Educational Attainment Levels for Advanced Energy Technology Occupations15
100%75%50%25%0%
Less than high school diploma
High school diploma or eqivalent
Some college, no degree
Associate’s degree
Bachelor’s degree
Master’s degree
Doctoral or professional degree
Economists
Geoscientists, except hydrologists & geographers
Environmental restoration planners
Climate change analysts
Environmental scientists & specialists, including health
Environmental engineers
Engineers
Nuclear engineers
Environmental science & protectiontechnicians, including health
Managers
Industrial production managers
Sales representatives, wholesale & manufacturing,technical & scientific products
Environmental engineering technicians
Plant & system operators
Power distributors & dispatchers
Less than high school diploma
High school diploma or eqivalent
Some college, no degree
Associate’s degree
Bachelor’s degree
Master’s degree
Doctoral or professional degree
Life scientists
Natural sciences managers
Biological scientists
Microbiologists
Biochemists & biophysicists
Chemists
Soil & plant scientists
Food scientists & technologists
Animal scientists
Biological technicians
Biomedical engineers
Farmers and ranchers
100%75%50%25%0%
6.9 Distribution of Educational Attainment Levels for Plant Science and Agricultural Technology Occupations14
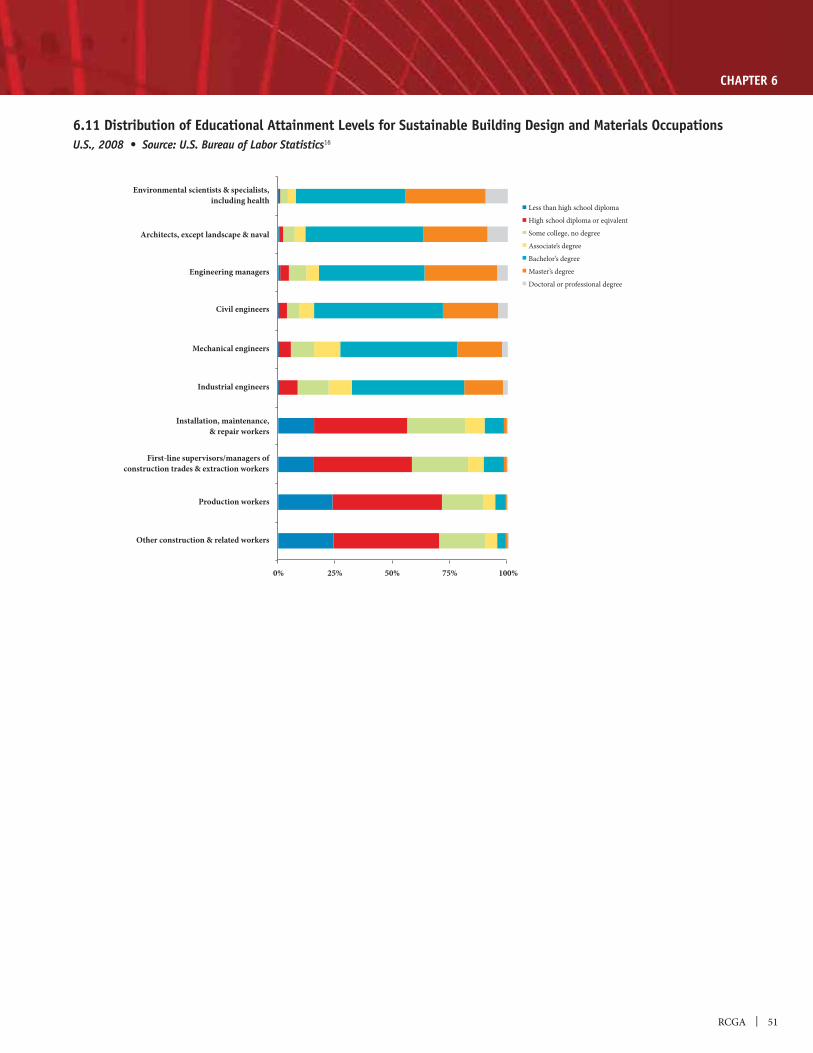
RCGA | 51
CHAPTER 6
6.11 Distribution of Educational Attainment Levels for Sustainable Building Design and Materials Occupations16
100%75%50%25%0%
Less than high school diploma
High school diploma or eqivalent
Some college, no degree
Associate’s degree
Bachelor’s degree
Master’s degree
Doctoral or professional degree
Environmental scientists & specialists,including health
Architects, except landscape & naval
Engineering managers
Civil engineers
Mechanical engineers
Industrial engineers
Installation, maintenance,& repair workers
First-line supervisors/managers ofconstruction trades & extraction workers
Production workers
Other construction & related workers
52 | Talent: The Future of Metro St. Louis in the Knowledge Economy
______________
1 Harvard Business Review.
2 See www.climateprosperityproject.org. The other three regions are Silicon Valley, CA; Portland, OR; Denver, CO.
3 NAICS 54171 Physical, engineering and biological research is also part of the health science and services cluster.
4 2009 ES 202 Estimates by County.” http://data.bls.gov/pdq/querytool.jsp?survey=en.
5 Ibid.
6 St. Louis RCGA, Climate Prosperity Collaborative. “The St. Louis Region Green Economy Profile.” 2010. http://www.stlrcga.org/documents/mm/StLouisGreenEconomy.pdf.
7 2009 ES 202 Estimates by County.” http://data.bls.gov/pdq/querytool.jsp?survey=en.
8 The location quotient represents the ratio of an industry’s share of employment in a given area to that industry’s share
Throughout this report, employment location quotients of 1.3 or greater are considered above the national average, location quotients from 0.8 to 1.29 are identified as average, and location quotients of 0.79 or lower are considered below average
9 2009 ES 202 Estimates by County.” http://data.bls.gov/pdq/querytool.jsp?survey=en.
10 See endnote 9 in Section 5 for the methodology used to select occupations.
11 The location quotient represents the ratio of an occupation’s share of employment in a given area to that occupation’s share
Throughout this report, occupation location quotients of 1.3 or greater are considered above the national average, location quotients from 0.8 to 1.29 are identified as average, and location quotients of 0.79 or lower are considered below average.
12 May 2009. http://www.bls.gov/oes/2009/may/oessrcma.htm.
13 May 2009. http://www.missourieconomy.org/occupations/index.stm.
14 occupation.” 2008. http://www.bls.gov/emp/ep_table_111.htm.
15 Ibid.
16 Ibid.
RCGA | 53
Opportunity: Health Science and Services
IntroductionHealth science and health services are two components of the largest economic cluster in metro
energy and innovation surrounding the health sector in St. Louis. The two components differ in significant ways, however. Health science in St. Louis is focused on discovery, commercialization, and manufacture of products used to combat disease and improve quality of life worldwide. The region’s health care systems, on the other hand, are more inwardly focused on the needs of area residents. It is true that major St. Louis hospitals serve patients from all over the Midwest, but health care, for the most part, finds its customers in the local market. A number of external forces are putting pressure on the health science and services fields, impacting the occupations, skills, and competencies in demand. These forces include the following:
records, replacing paper files with digital records that can be updated continuously and accessed
sector.
more are changing some job responsibilities, necessitating training within the existing healthcare workforce and increasing the demand for compliance specialists.
financing remain unclear.
affecting costs. There is considerable pressure to contain costs, driven by an awareness of the rapidly
services are contracted to vendors off shore to save costs.
problems, will drive up the demand for care.
practitioners, increasing the skill and competency requirements for some positions.
to reduce costs and improve access.
7
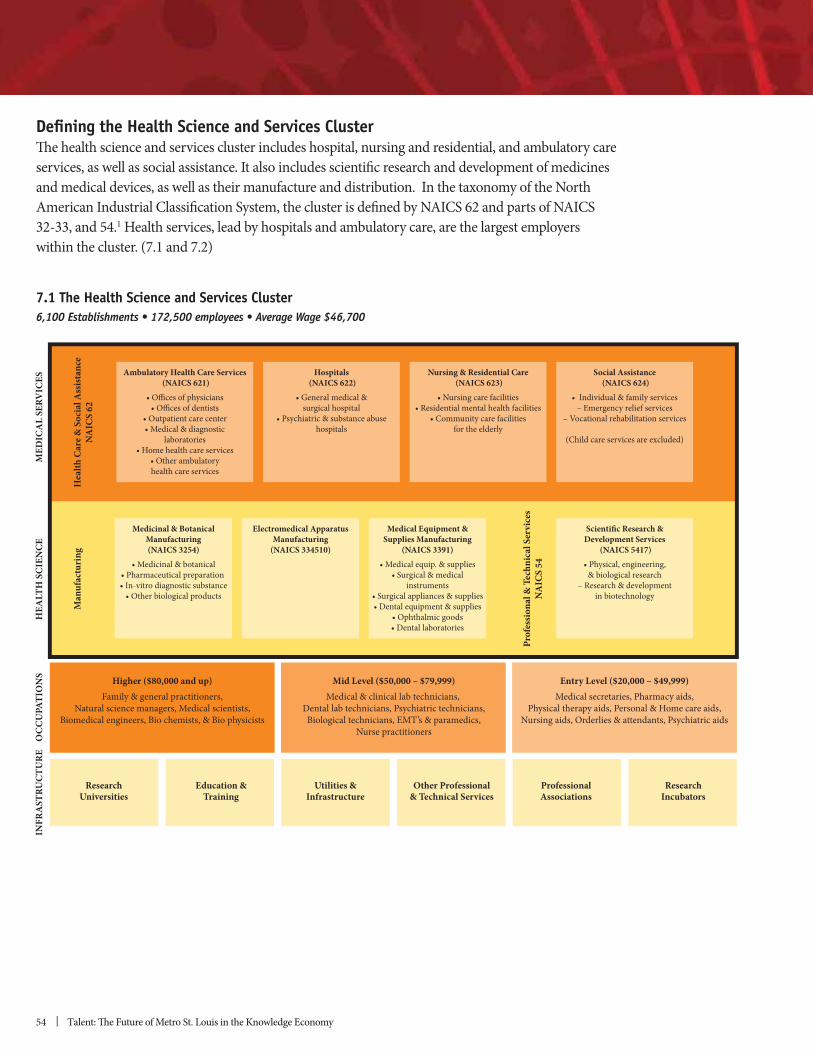
54 | Talent: The Future of Metro St. Louis in the Knowledge Economy
Defining the Health Science and Services ClusterThe health science and services cluster includes hospital, nursing and residential, and ambulatory care services, as well as social assistance. It also includes scientific research and development of medicines and medical devices, as well as their manufacture and distribution. In the taxonomy of the North American Industrial Classification System, the cluster is defined by NAICS 62 and parts of NAICS
1 Health services, lead by hospitals and ambulatory care, are the largest employers within the cluster. (7.1 and 7.2)
Scientific Research &Development Services
(NAICS 5417)
bit
biot y
Social Assistance (NAICS 624)
Vocati litati
Nursing & Residential Care (NAICS 623)
Coly
Hospitals (NAICS 622)
&al
ats
INFR
AST
RUCT
URE
OCC
UPA
TIO
NS
HEA
LTH
SCI
ENCE
MED
ICA
L SE
RVIC
ES
Prof
essio
nal &
Tec
hnic
al S
ervi
ces
NA
ICS
54
Man
ufac
turi
ngH
ealth
Car
e & S
ocia
l Ass
istan
ceN
AIC
S 62
Ambulatory Health Care Services (NAICS 621)
stists
at
laboHo
lato
Entry Level ($20,000 – $49,999)cy ,
Ho ,at at
Mid Level ($50,000 – $79,999)
at’s
ti s
Higher ($80,000 and up)Fa ti
Nat tists,ysicists
ResearchIncubators
ProfessionalAssociations
Other Professional& Technical Services
Utilities &Infrastructure
Education &Training
ResearchUniversities
Medical Equipment &Supplies Manufacturing
(NAICS 3391)
s
sbo
Medicinal & BotanicalManufacturing(NAICS 3254)
taatio
itbi
Electromedical ApparatusManufacturing
(NAICS 334510)
7.1 The Health Science and Services Cluster
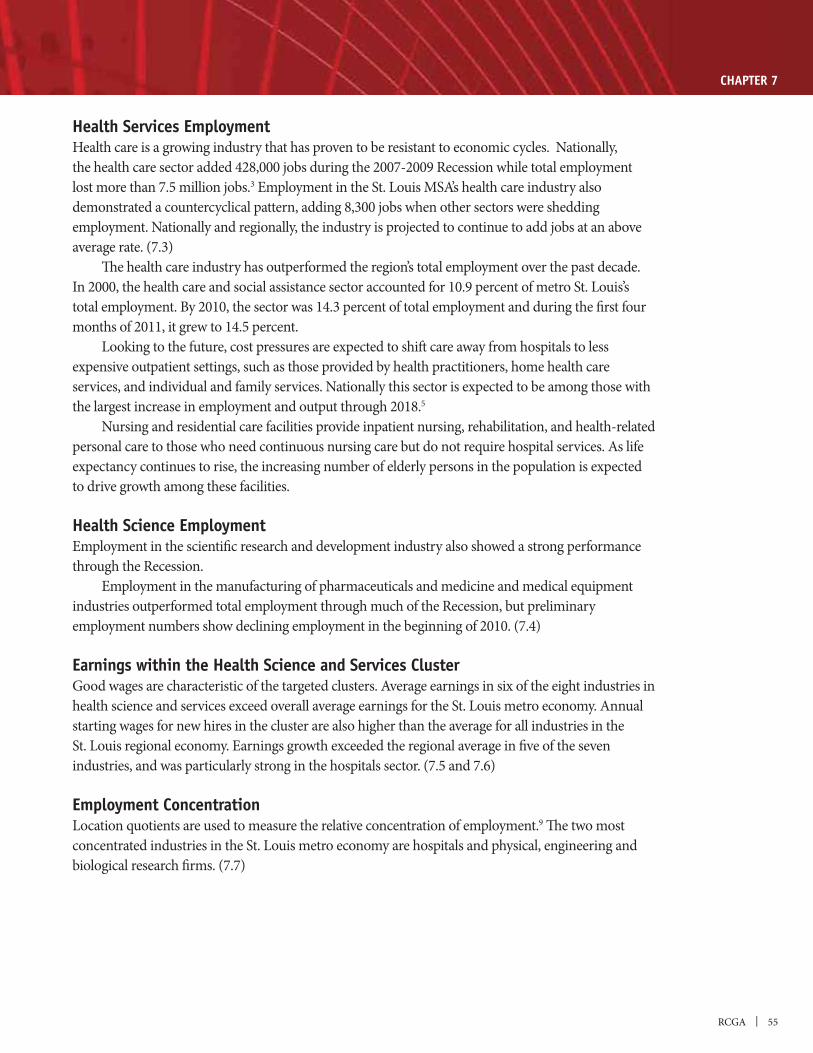
RCGA | 55
CHAPTER 7
Health Services EmploymentHealth care is a growing industry that has proven to be resistant to economic cycles. Nationally,
lost more than 7.5 million jobs.3 Employment in the St. Louis MSA’s health care industry also demonstrated a countercyclical pattern, adding 8,300 jobs when other sectors were shedding employment. Nationally and regionally, the industry is projected to continue to add jobs at an above average rate. (7.3) The health care industry has outperformed the region’s total employment over the past decade. In 2000, the health care and social assistance sector accounted for 10.9 percent of metro St. Louis’s
months of 2011, it grew to 14.5 percent. Looking to the future, cost pressures are expected to shift care away from hospitals to less expensive outpatient settings, such as those provided by health practitioners, home health care services, and individual and family services. Nationally this sector is expected to be among those with the largest increase in employment and output through 2018.5
personal care to those who need continuous nursing care but do not require hospital services. As life expectancy continues to rise, the increasing number of elderly persons in the population is expected to drive growth among these facilities.
Health Science EmploymentEmployment in the scientific research and development industry also showed a strong performance through the Recession. Employment in the manufacturing of pharmaceuticals and medicine and medical equipment industries outperformed total employment through much of the Recession, but preliminary employment numbers show declining employment in the beginning of 2010. (7.4)
Earnings within the Health Science and Services ClusterGood wages are characteristic of the targeted clusters. Average earnings in six of the eight industries in health science and services exceed overall average earnings for the St. Louis metro economy. Annual starting wages for new hires in the cluster are also higher than the average for all industries in the St. Louis regional economy. Earnings growth exceeded the regional average in five of the seven industries, and was particularly strong in the hospitals sector. (7.5 and 7.6)
Employment ConcentrationLocation quotients are used to measure the relative concentration of employment.9 The two most concentrated industries in the St. Louis metro economy are hospitals and physical, engineering and biological research firms. (7.7)
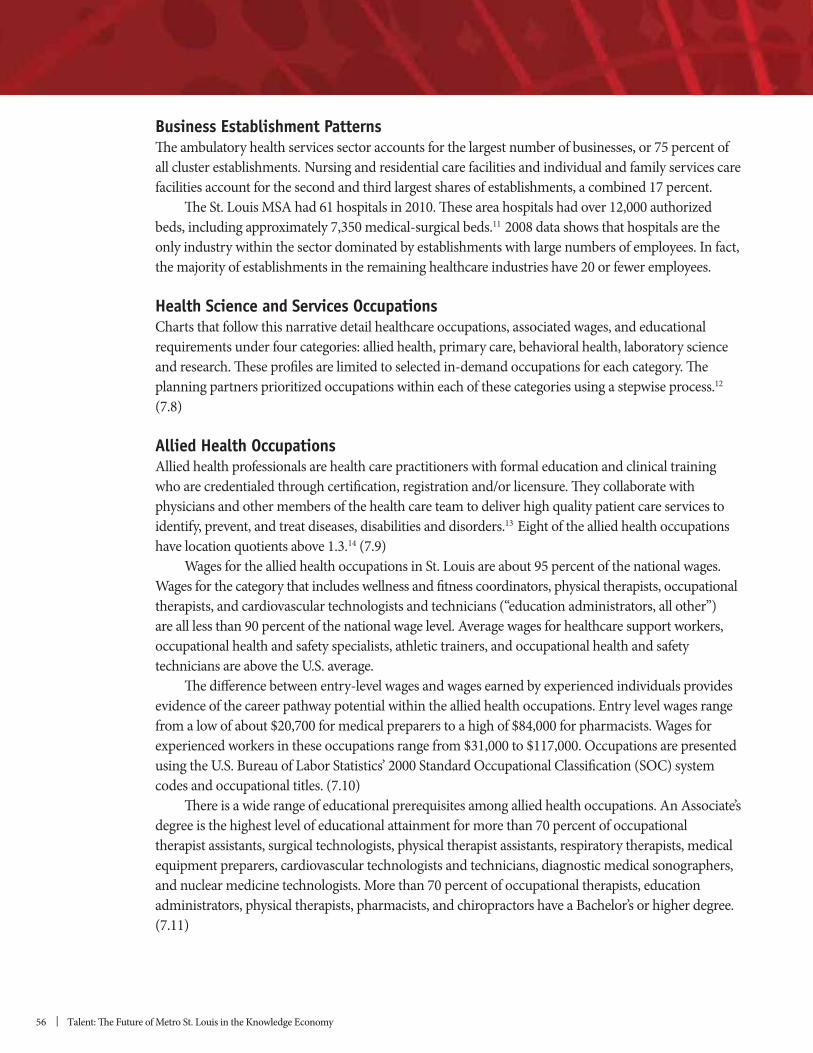
56 | Talent: The Future of Metro St. Louis in the Knowledge Economy
Business Establishment PatternsThe ambulatory health services sector accounts for the largest number of businesses, or 75 percent of all cluster establishments. Nursing and residential care facilities and individual and family services care facilities account for the second and third largest shares of establishments, a combined 17 percent. The St. Louis MSA had 61 hospitals in 2010. These area hospitals had over 12,000 authorized
11 2008 data shows that hospitals are the only industry within the sector dominated by establishments with large numbers of employees. In fact, the majority of establishments in the remaining healthcare industries have 20 or fewer employees.
Health Science and Services OccupationsCharts that follow this narrative detail healthcare occupations, associated wages, and educational requirements under four categories: allied health, primary care, behavioral health, laboratory science
planning partners prioritized occupations within each of these categories using a stepwise process.12 (7.8)
Allied Health OccupationsAllied health professionals are health care practitioners with formal education and clinical training who are credentialed through certification, registration and/or licensure. They collaborate with physicians and other members of the health care team to deliver high quality patient care services to identify, prevent, and treat diseases, disabilities and disorders.13 Eight of the allied health occupations have location quotients above 1.3.14 (7.9)
therapists, and cardiovascular technologists and technicians (“education administrators, all other”) are all less than 90 percent of the national wage level. Average wages for healthcare support workers, occupational health and safety specialists, athletic trainers, and occupational health and safety
evidence of the career pathway potential within the allied health occupations. Entry level wages range
experienced workers in these occupations range from $31,000 to $117,000. Occupations are presented
codes and occupational titles. (7.10) There is a wide range of educational prerequisites among allied health occupations. An Associate’s degree is the highest level of educational attainment for more than 70 percent of occupational therapist assistants, surgical technologists, physical therapist assistants, respiratory therapists, medical equipment preparers, cardiovascular technologists and technicians, diagnostic medical sonographers, and nuclear medicine technologists. More than 70 percent of occupational therapists, education
(7.11)
RCGA | 57
CHAPTER 7
Primary Care OccupationsPrimary care includes the physicians and health care providers that serve as a patient’s primary contact with the health care system. This category has five occupations and one has a location quotient above 1.3. The region has a concentration of family and general practitioners. The remaining primary care practitioner occupations have location quotients of less than one, indicating a concentration lower
general practitioners, health diagnosing and treating practitioners, and physicians assistants are about
and surgeons are about 10 percent higher than national wages. (7.13) In general, education requirements for primary care occupations are increasing. For example, the minimum requirement to become a registered nurse is an Associate’s degree. However, in order
Behavioral and Mental Health Occupations
counseling, and school psychologists; other psychologists; marriage and family therapists; mental health counselors; child, family, and school social workers; mental health and substance abuse social
wages than counselors and social workers. (7.15)
the counselors and therapists and 95 percent of physiologists have a Master’s or PhD. Educational attainment levels of the select occupations are depicted in the charts. (7.16)
Laboratory Science and Research Occupations
Chemists, biochemists, and biophysicists have average concentrations. Microbiologists, and biomedical engineers have concentrations below the national average. (7.17) Entry level wages range from a low of $22,600 for biological technicians to a high of $46,960 for
$79,740 for biomedical engineers. (7.18)
scientists have attained a doctoral or professional degree. (7.19)
58 | Talent: The Future of Metro St. Louis in the Knowledge Economy
1.40
1.35
1.30
1.25
1.20
1.15
1.10
1.05
1.00
0.95
0.90
Health Care & Social Assistance (Total)Hospitals
Nonfarm EmploymentAmbulatory Health Care ServicesNursing & Residential Care Facilities
YTD201120102009200820072006200520042003200220012000
Hospitals35%
Nursing &residential care
18%
Ambulatory healthcare services
29%
Scientific research& development devices
5%
Social assistance(minus child care)
9% Pharmaceutical &medicine manufacturing
2%
Medical equipment &supplies manufacturing
2%
7.2 Distribution of Employment in the Health Science and Services Cluster2
7.3 Trends in Health Services Employment4
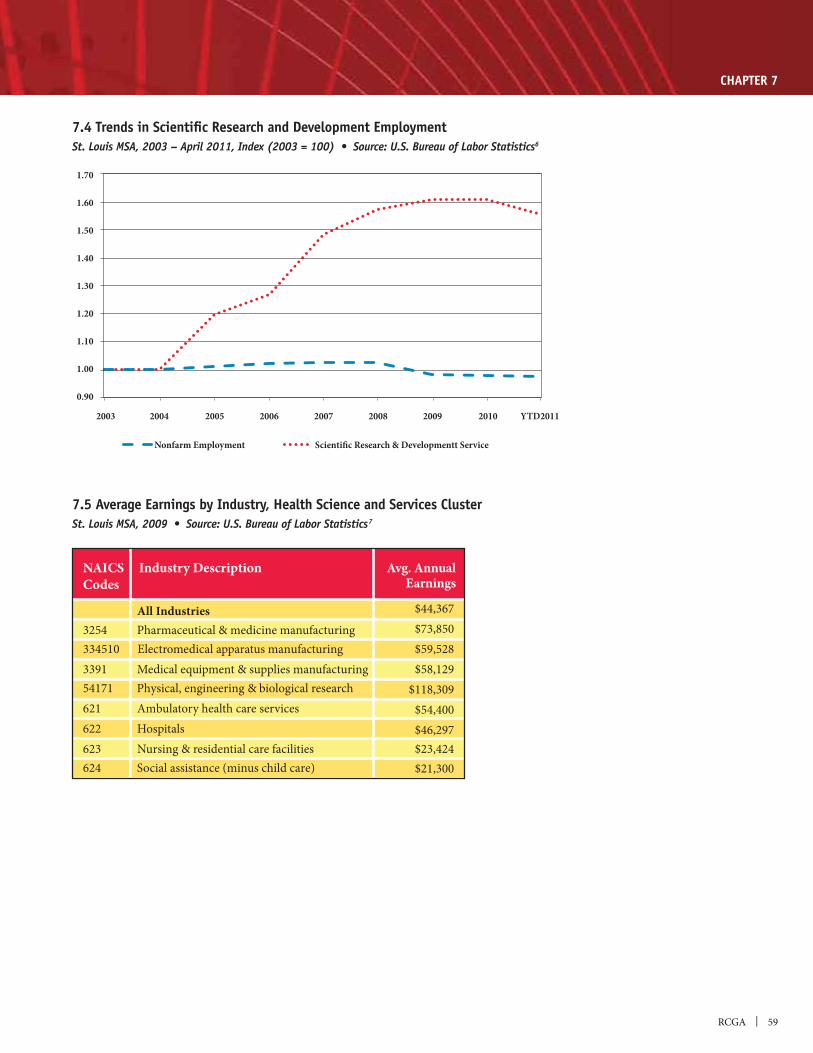
RCGA | 59
CHAPTER 7
1.70
1.60
1.50
1.40
1.30
1.20
1.10
1.00
0.90
YTD201120102009200820072006200520042003
Scientific Research & Developmentt ServiceNonfarm Employment
7.4 Trends in Scientific Research and Development Employment6
7.5 Average Earnings by Industry, Health Science and Services Cluster7
NAICS Industry DescriptionCodes
Avg. AnnualEarnings
All Industries 3254 Pharmaceutical & medicine manufacturing 334510 Electromedical apparatus manufacturing 3391 Medical equipment & supplies manufacturing54171 Physical, engineering & biological research621 Ambulatory health care services622 Hospitals623 Nursing & residential care facilities624 Social assistance (minus child care)
$44,367$73,850$59,528$58,129
$118,309$54,400$46,297$23,424$21,300
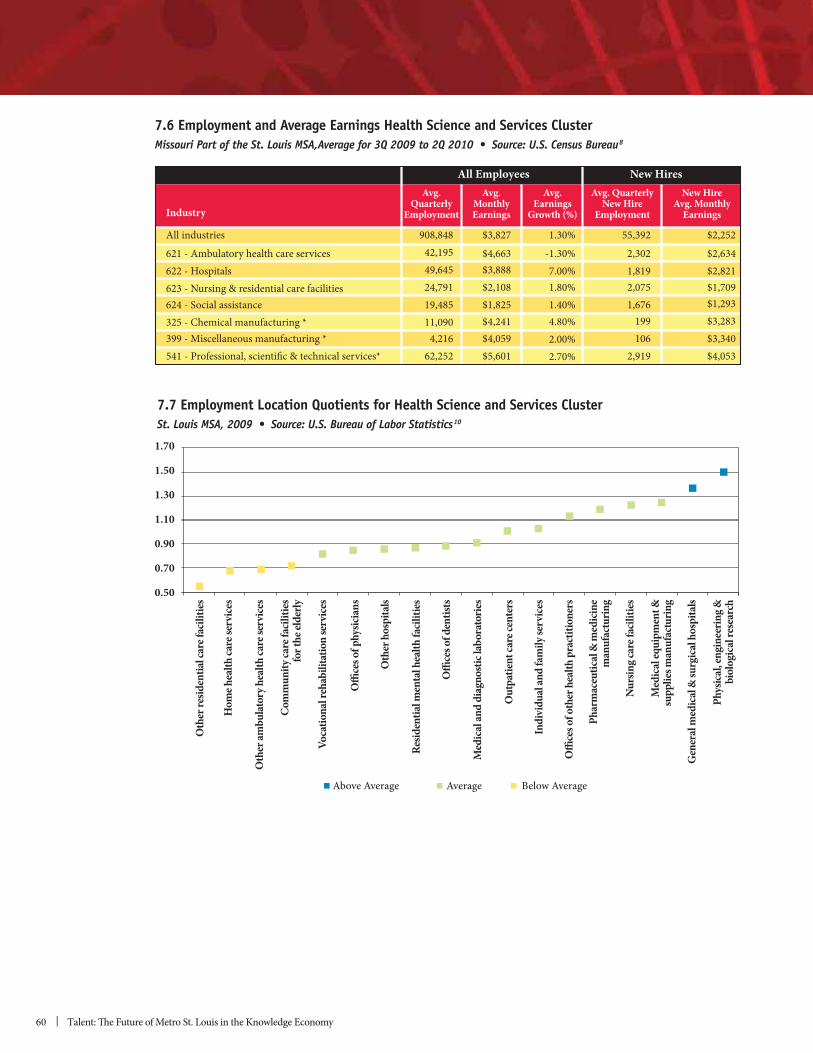
60 | Talent: The Future of Metro St. Louis in the Knowledge Economy
7.6 Employment and Average Earnings Health Science and Services Cluster8
7.7 Employment Location Quotients for Health Science and Services Cluster10
New HireAvg. Monthly
Earnings
Avg. QuarterlyNew Hire
Employment
Avg.Earnings
Growth (%)
Avg.MonthlyEarnings
Avg.Quarterly
EmploymentIndustry
All industries
621 - Ambulatory health care services622 - Hospitals623 - Nursing & residential care facilities624 - Social assistance325 - Chemical manufacturing *399 - Miscellaneous manufacturing *541 - Professional, scientific & technical services*
$2,252
$2,634$2,821$1,709$1,293$3,283$3,340$4,053
55,392
2,3021,8192,0751,676
199106
2,919
1.30%
-1.30%7.00%1.80%1.40%4.80%2.00%2.70%
908,84842,19549,64524,79119,48511,090
4,21662,252
All Employees New Hires
$3,827
$4,663$3,888$2,108$1,825$4,241$4,059$5,601
Above Average Average Below Average
1.70
1.50
1.30
1.10
0.90
0.70
0.50
Oth
er re
siden
tial c
are f
acili
ties
Hom
e hea
lth ca
re se
rvice
s
Oth
er am
bulat
ory h
ealth
care
serv
ices
Com
mun
ity ca
re fa
ciliti
esfo
r the
elde
rly
Voca
tiona
l reh
abili
tatio
n se
rvice
s
Offi
ces o
f phy
sicia
ns
Oth
er h
ospi
tals
Resid
entia
l men
tal h
ealth
facil
ities
Offi
ces o
f den
tists
Med
ical a
nd d
iagn
ostic
labo
rato
ries
Out
patie
nt ca
re ce
nter
s
Indi
vidu
al an
d fa
mily
serv
ices
Offi
ces o
f oth
er h
ealth
pra
ctiti
oner
s
Phar
mac
eutic
al &
med
icine
man
ufac
turin
g
Nurs
ing c
are f
acili
ties
Med
ical e
quip
men
t &su
pplie
s man
ufac
turin
g
Gen
eral
med
ical &
surg
ical h
ospi
tals
Phys
ical, e
ngin
eerin
g &bi
olog
ical
rese
arch
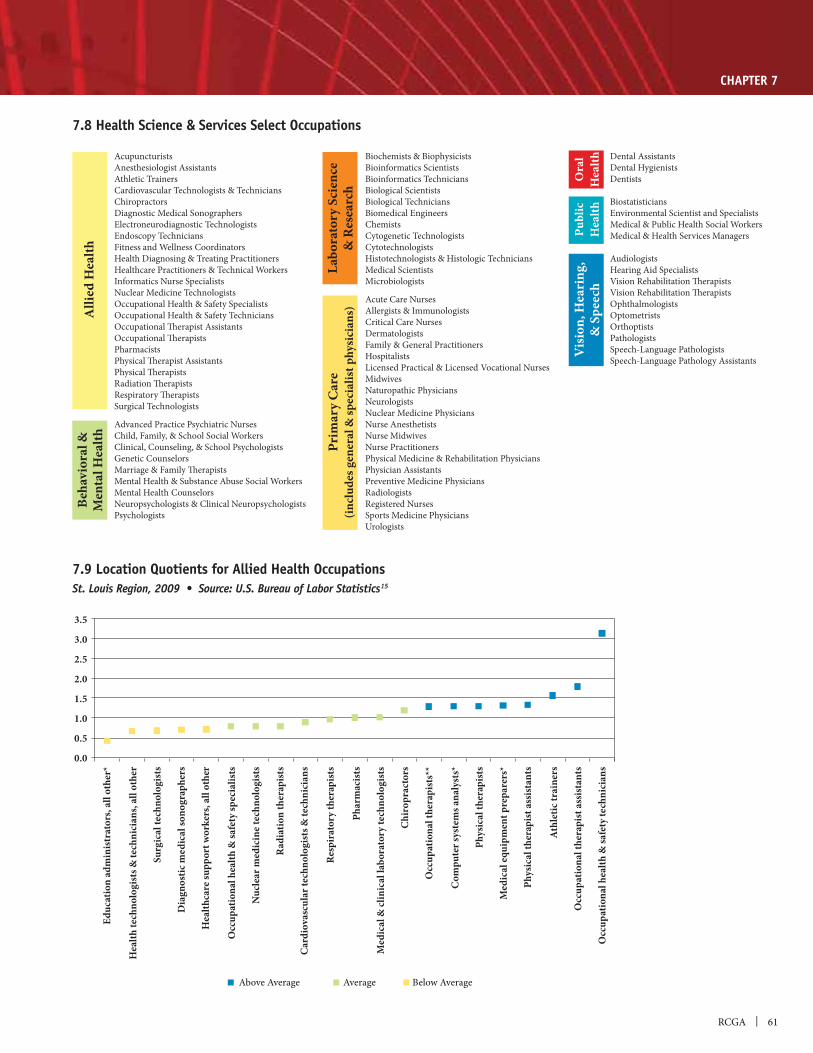
RCGA | 61
CHAPTER 7
7.8 Health Science & Services Select Occupations
Biochemists & BiophysicistsBioinformatics ScientistsBioinformatics TechniciansBiological ScientistsBiological TechniciansBiomedical EngineersChemistsCytogenetic TechnologistsCytotechnologistsHistotechnologists & Histologic TechniciansMedical ScientistsMicrobiologists Acute Care NursesAllergists & ImmunologistsCritical Care NursesDermatologistsFamily & General PractitionersHospitalistsLicensed Practical & Licensed Vocational NursesMidwivesNaturopathic PhysiciansNeurologistsNuclear Medicine PhysiciansNurse AnesthetistsNurse MidwivesNurse PractitionersPhysical Medicine & Rehabilitation PhysiciansPhysician AssistantsPreventive Medicine PhysiciansRadiologistsRegistered NursesSports Medicine PhysiciansUrologists
Vis
ion,
Hea
ring
,&
Spe
ech
Publ
icH
ealth
Ora
lH
ealth
Prim
ary
Car
e(in
clud
es g
ener
al &
spec
ialis
t phy
sici
ans)
Labo
rato
ry S
cien
ce&
Res
earc
h
Beha
vior
al &
Men
tal H
ealth
Alli
ed H
ealth
Dental AssistantsDental HygienistsDentists
BiostatisticiansEnvironmental Scientist and SpecialistsMedical & Public Health Social WorkersMedical & Health Services Managers
AudiologistsHearing Aid SpecialistsVision Rehabilitation TherapistsVision Rehabilitation TherapistsOphthalmologistsOptometristsOrthoptistsPathologistsSpeech-Language PathologistsSpeech-Language Pathology Assistants
AcupuncturistsAnesthesiologist Assistants Athletic TrainersCardiovascular Technologists & TechniciansChiropractorsDiagnostic Medical SonographersElectroneurodiagnostic TechnologistsEndoscopy TechniciansFitness and Wellness CoordinatorsHealth Diagnosing & Treating PractitionersHealthcare Practitioners & Technical WorkersInformatics Nurse SpecialistsNuclear Medicine TechnologistsOccupational Health & Safety Specialists Occupational Health & Safety TechniciansOccupational Therapist AssistantsOccupational TherapistsPharmacistsPhysical Therapist AssistantsPhysical TherapistsRadiation TherapistsRespiratory TherapistsSurgical Technologists Advanced Practice Psychiatric NursesChild, Family, & School Social Workers Clinical, Counseling, & School PsychologistsGenetic CounselorsMarriage & Family TherapistsMental Health & Substance Abuse Social WorkersMental Health CounselorsNeuropsychologists & Clinical NeuropsychologistsPsychologists
7.9 Location Quotients for Allied Health Occupations 15
Educ
atio
n ad
min
istra
tors
, all
othe
r*
Hea
lth te
chno
logi
sts &
tech
nici
ans,
all o
ther
Surg
ical
tech
nolo
gist
s
Dia
gnos
tic m
edic
al so
nogr
aphe
rs
Hea
lthca
re su
ppor
t wor
kers
, all
othe
r
Occ
upat
iona
l hea
lth &
safe
ty sp
ecia
lists
Nuc
lear
med
icin
e tec
hnol
ogist
s
Radi
atio
n th
erap
ists
Card
iova
scul
ar te
chno
logi
sts &
tech
nici
ans
Resp
irat
ory t
hera
pist
s
Phar
mac
ists
Med
ical
& cl
inic
al la
bora
tory
tech
nolo
gist
s
Chi
ropr
acto
rs
Occ
upat
iona
l the
rapi
sts*
*
Com
pute
r sys
tem
s ana
lyst
s*
Phys
ical
ther
apist
s
Med
ical
equi
pmen
t pre
pare
rs*
Phys
ical
ther
apist
assis
tant
s
Athl
etic
trai
ners
Occ
upat
iona
l the
rapi
st as
sista
nts
Occ
upat
iona
l hea
lth &
safe
ty te
chni
cian
s
3.5
3.0
2.5
2.0
1.5
1.0
0.5
0.0
Above Average Average Below Average
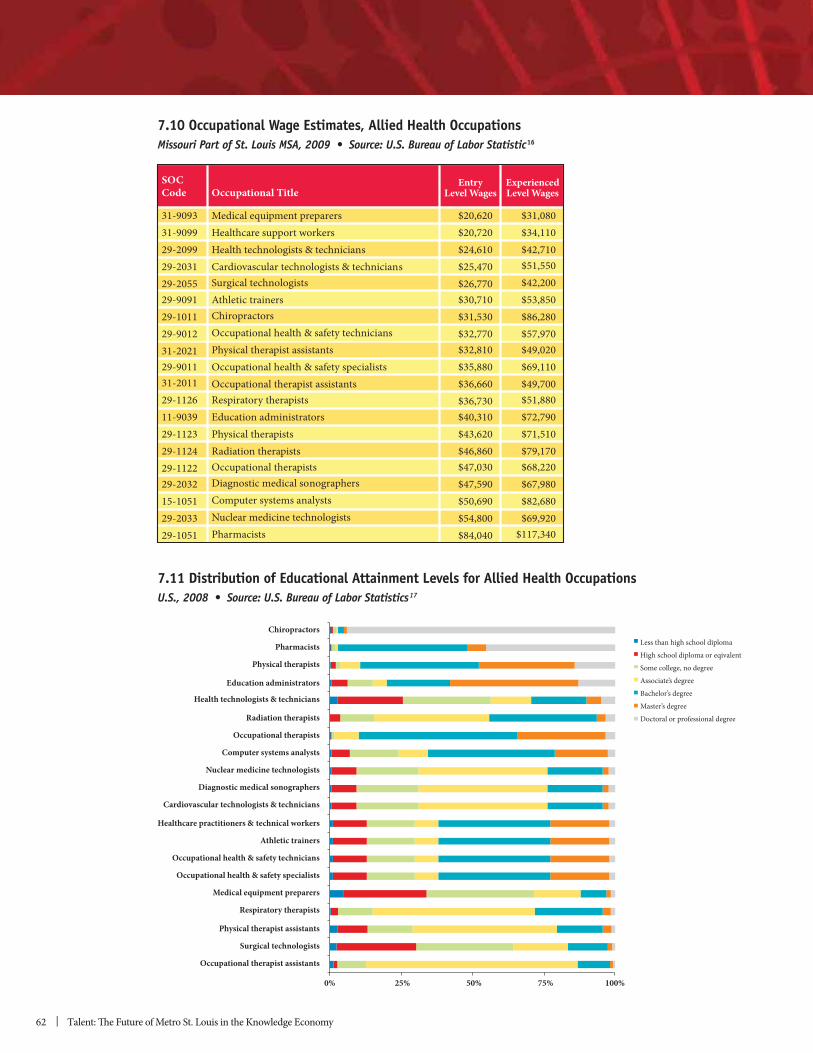
62 | Talent: The Future of Metro St. Louis in the Knowledge Economy
7.10 Occupational Wage Estimates, Allied Health Occupations16
ExperiencedLevel Wages
EntryLevel Wages
SOCCode Occupational Title
31-909331-909929-209929-203129-205529-909129-101129-901231-202129-901131-201129-112611-903929-112329-112429-112229-203215-105129-203329-1051
Medical equipment preparersHealthcare support workersHealth technologists & techniciansCardiovascular technologists & techniciansSurgical technologistsAthletic trainersChiropractorsOccupational health & safety techniciansPhysical therapist assistantsOccupational health & safety specialistsOccupational therapist assistantsRespiratory therapistsEducation administratorsPhysical therapistsRadiation therapistsOccupational therapistsDiagnostic medical sonographersComputer systems analystsNuclear medicine technologistsPharmacists
$20,620$20,720$24,610$25,470$26,770$30,710$31,530$32,770$32,810$35,880$36,660$36,730$40,310$43,620$46,860$47,030$47,590$50,690$54,800$84,040
$31,080$34,110$42,710$51,550$42,200$53,850$86,280$57,970$49,020$69,110$49,700$51,880$72,790$71,510$79,170$68,220$67,980$82,680$69,920
$117,340
7.11 Distribution of Educational Attainment Levels for Allied Health Occupations17
Less than high school diplomaHigh school diploma or eqivalentSome college, no degreeAssociate’s degreeBachelor’s degreeMaster’s degreeDoctoral or professional degree
100%75%50%25%0%
Chiropractors
Pharmacists
Physical therapists
Education administrators
Health technologists & technicians
Radiation therapists
Occupational therapists
Computer systems analysts
Nuclear medicine technologists
Diagnostic medical sonographers
Cardiovascular technologists & technicians
Healthcare practitioners & technical workers
Athletic trainers
Occupational health & safety technicians
Occupational health & safety specialists
Medical equipment preparers
Respiratory therapists
Physical therapist assistants
Surgical technologists
Occupational therapist assistants
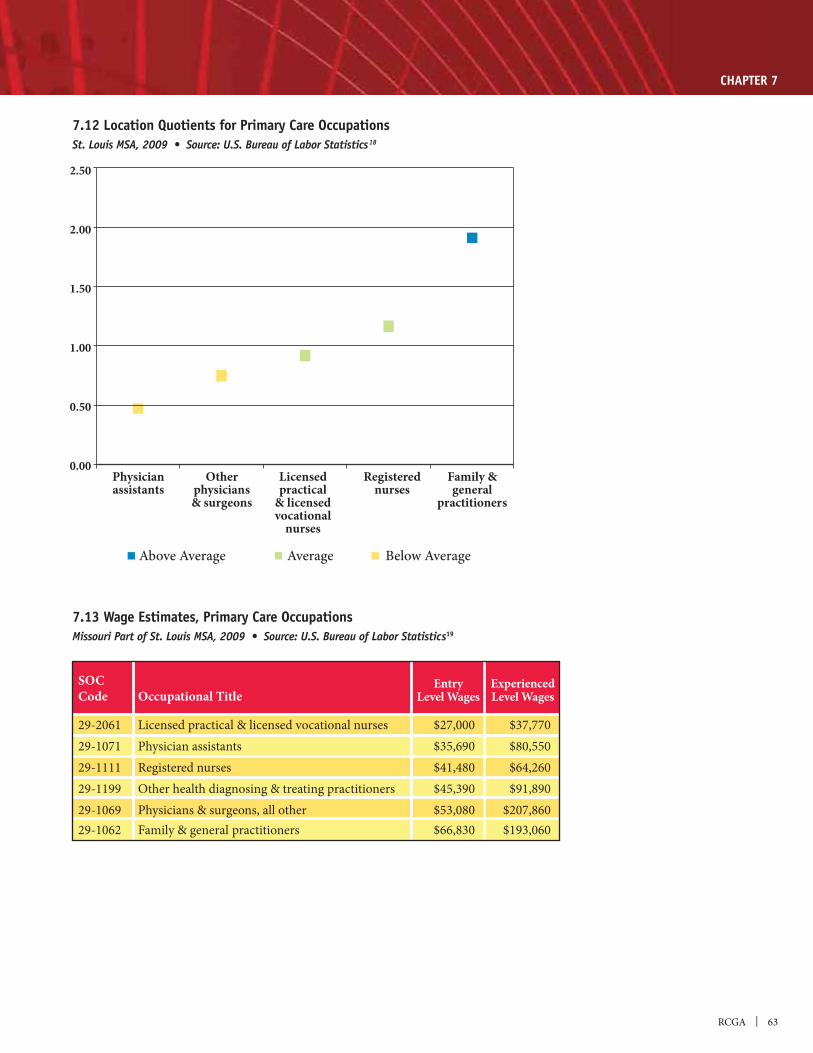
RCGA | 63
CHAPTER 7
2.50
2.00
1.50
1.00
0.50
0.00Family &general
practitioners
Registerednurses
Licensedpractical
& licensedvocational
nurses
Otherphysicians& surgeons
Physicianassistants
Above Average Average Below Average
7.12 Location Quotients for Primary Care Occupations 18
7.13 Wage Estimates, Primary Care Occupations19
ExperiencedLevel Wages
EntryLevel Wages
SOCCode Occupational Title
29-206129-107129-111129-119929-106929-1062
Licensed practical & licensed vocational nursesPhysician assistantsRegistered nursesOther health diagnosing & treating practitionersPhysicians & surgeons, all otherFamily & general practitioners
$27,000$35,690$41,480$45,390$53,080$66,830
$37,770$80,550$64,260$91,890
$207,860$193,060
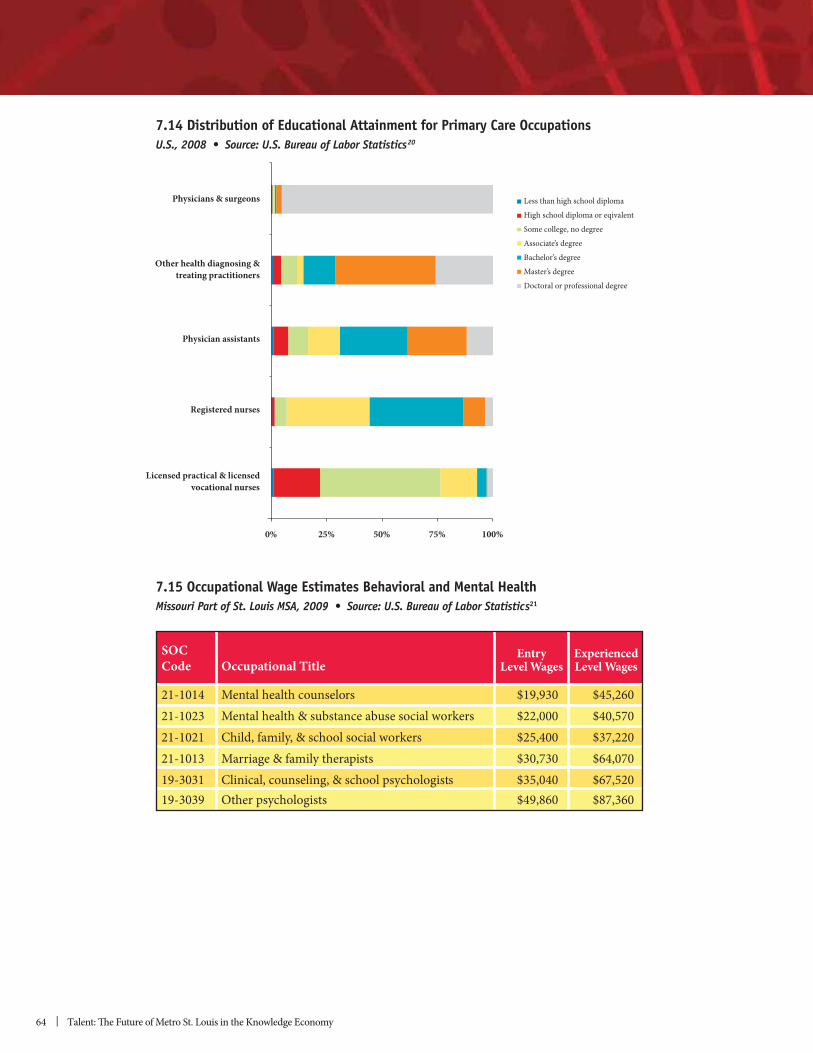
64 | Talent: The Future of Metro St. Louis in the Knowledge Economy
7.14 Distribution of Educational Attainment for Primary Care Occupations20
Less than high school diploma
High school diploma or eqivalent
Some college, no degree
Associate’s degree
Bachelor’s degree
Master’s degree
Doctoral or professional degree
100%75%50%25%0%
Physicians & surgeons
Other health diagnosing &treating practitioners
Physician assistants
Registered nurses
Licensed practical & licensedvocational nurses
7.15 Occupational Wage Estimates Behavioral and Mental Health21
ExperiencedLevel Wages
EntryLevel Wages
SOCCode Occupational Title
21-101421-102321-102121-101319-303119-3039
Mental health counselorsMental health & substance abuse social workersChild, family, & school social workersMarriage & family therapistsClinical, counseling, & school psychologistsOther psychologists
$19,930$22,000$25,400$30,730$35,040$49,860
$45,260$40,570$37,220$64,070$67,520$87,360
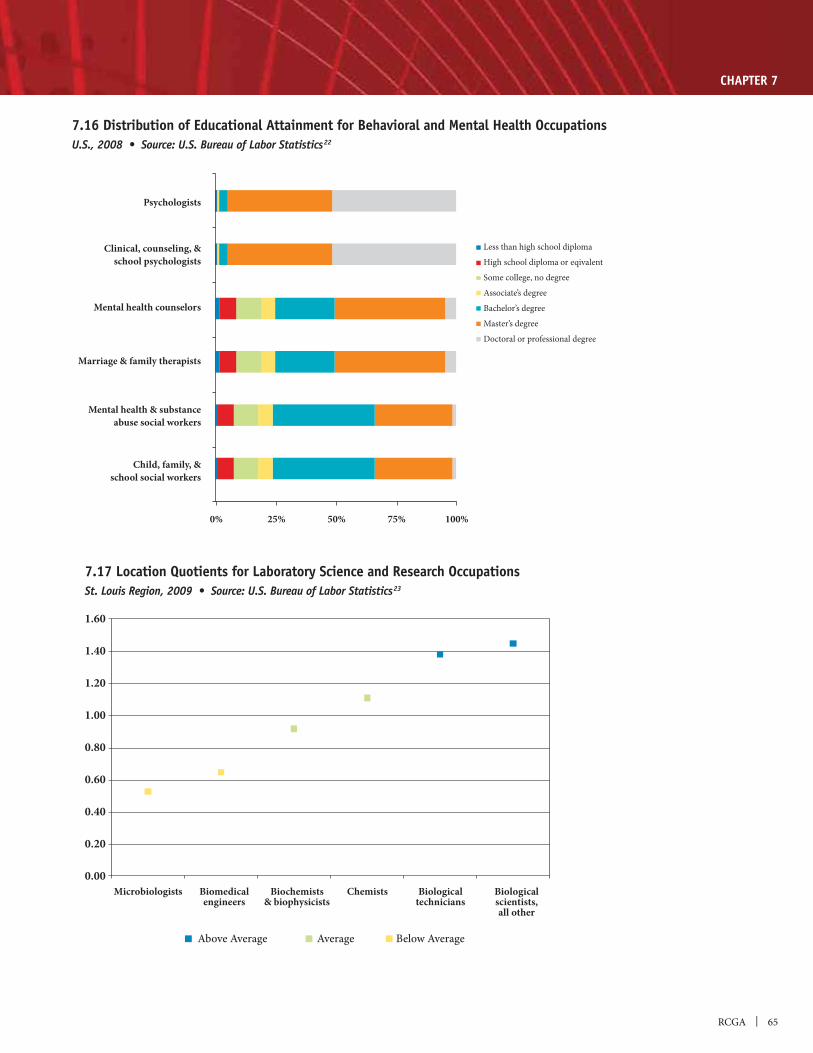
RCGA | 65
CHAPTER 7
7.17 Location Quotients for Laboratory Science and Research Occupations 23
7.16 Distribution of Educational Attainment for Behavioral and Mental Health Occupations22
1.60
1.40
1.20
1.00
0.80
0.60
0.40
0.20
0.00Microbiologists Biological
scientists,all other
Biologicaltechnicians
ChemistsBiochemists& biophysicists
Biomedicalengineers
Above Average Average Below Average
Less than high school diploma
High school diploma or eqivalent
Some college, no degree
Associate’s degree
Bachelor’s degree
Master’s degree
Doctoral or professional degree
100%75%50%25%0%
Psychologists
Clinical, counseling, &school psychologists
Mental health counselors
Marriage & family therapists
Mental health & substanceabuse social workers
Child, family, &school social workers

66 | Talent: The Future of Metro St. Louis in the Knowledge Economy
7.18 Occupational Wage Estimates, Laboratory Science and Research Occupations24
ExperiencedLevel Wages
EntryLevel Wages
SOCCode Occupational Title
19-402143-911119-102119-203129-201119-102919-102217-203119-1042
Biological techniciansStatistical assistantsBiochemists & biophysicistsChemistsMedical & clinical laboratory tchnologistsOther biological scientistsMicrobiologistsBiomedical engineersMedical scientists, except epidemiologists
$22,600$30,860$35,350$39,690$40,450$41,110$41,510$41,960$46,960
$43,460$51,430$77,240$77,050$57,070$70,980$77,920$79,790$77,150
7.19 Distribution of Educational Attainment for Laboratory Science and Research Occupations 25
Less than high school diploma
High school diploma or eqivalent
Some college, no degree
Associate’s degree
Bachelor’s degree
Master’s degree
Doctoral or professional degree
100%75%50%25%0%
Medical scientists,except epidemiologists
Other biological scientists
Microbiologists
Biochemists & biophysicists
Chemists
Biological technicians
Biomedical engineers
Medical & clinicallaboratory technologists
Statistical assistants
RCGA | 67
CHAPTER 7
______________
1. NAICS 5417, scientific research and development, is also part of the sustainable technologies cluster.
Estimates by County.” http://data.bls.gov/pdq/querytool.jsp?survey=en.
Monthly Labor Review. April 2011.
Monthly Labor Review. November 2009.
Estimates by County.” http://data.bls.gov/pdq/querytool.jsp?survey=en.
9. The location quotient represents the ratio of an industry’s share of employment in a given area to that industry’s share
Throughout this report, employment location quotients of 1.3 or greater are considered above the national average, location quotients from 0.8 to 1.29 are identified as average, and location quotients of 0.79 or lower are considered below average.
Estimates by County.” http://data.bls.gov/pdq/querytool.jsp?survey=en.
11. Analysis of data from state Certificate of Need reports: IL hospitals data:Determinations, 2008 Hospital Services,” Mar. 1, 2008. http://www.idph.state.il.us/about/hfpb/pdf/2008%20Hospital%20
MO hospitals data: October 27, 2009. http://www.dhss.mo.gov/CON/hospinv.pdf.
12. See endnote 9 in Section 5 for the methodology used to select occupations.
13. Health Professions Network. “Fact Sheet.” http://www.healthpronet.org/docs/allied_health_fact_sheet.pdf.
14. The location quotient represents the ratio of an occupation’s share of employment in a given area to that occupation’s share
Throughout this report, occupation location quotients of 1.3 or greater are considered above the national average, location quotients from 0.8 to 1.29 are identified as average, and location quotients of 0.79 or lower are considered below average.
May 2009.” http://www.bls.gov/oes/2009/may/oessrcma.htm.
68 | Talent: The Future of Metro St. Louis in the Knowledge Economy
http://www.missourieconomy.org/occupations/index.stm.
2008. http://www.bls.gov/emp/ep_table_111.htm.
May 2009.” http://www.bls.gov/oes/2009/may/oessrcma.htm.
http://www.missourieconomy.org/occupations/index.stm.
2008. http://www.bls.gov/emp/ep_table_111.htm.
http://www.missourieconomy.org/occupations/index.stm.
2008. http://www.bls.gov/emp/ep_table_111.htm.
May 2009.” http://www.bls.gov/oes/2009/may/oessrcma.htm.
http://www.missourieconomy.org/occupations/index.stm.
2008. http://www.bls.gov/emp/ep_table_111.htm.
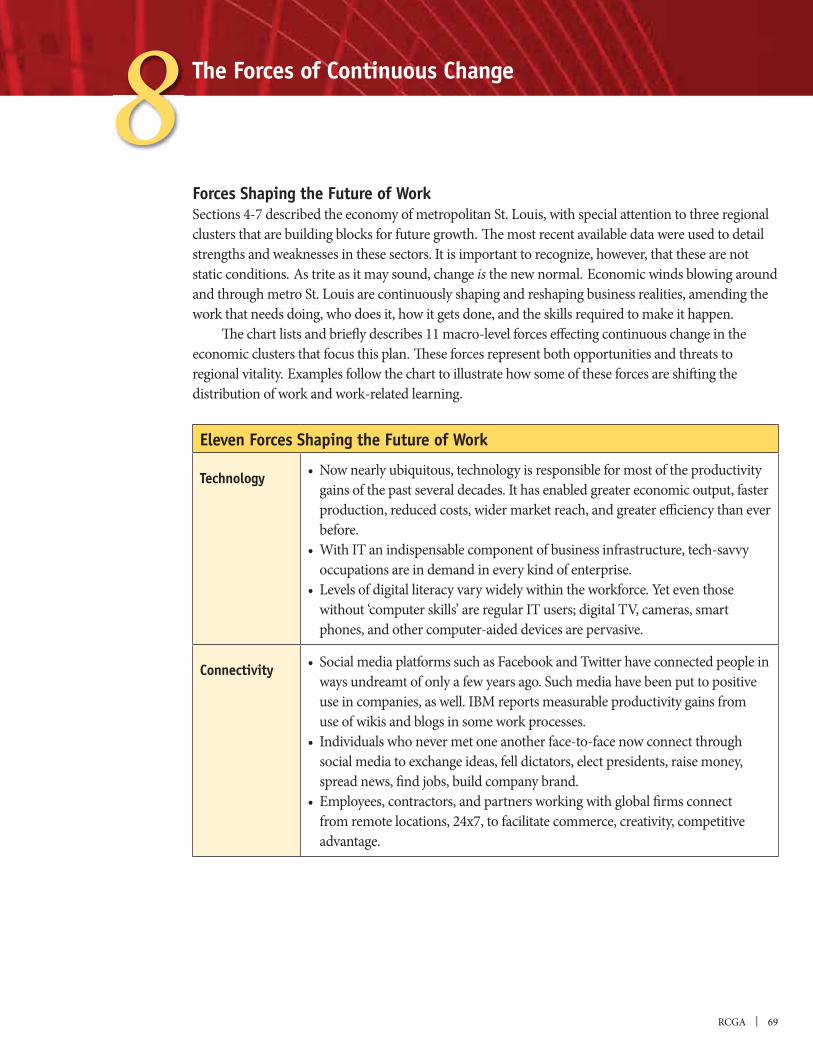
RCGA | 69
The Forces of Continuous Change
Forces Shaping the Future of Work
clusters that are building blocks for future growth. The most recent available data were used to detail strengths and weaknesses in these sectors. It is important to recognize, however, that these are not static conditions. As trite as it may sound, change is the new normal. Economic winds blowing around and through metro St. Louis are continuously shaping and reshaping business realities, amending the work that needs doing, who does it, how it gets done, and the skills required to make it happen.
economic clusters that focus this plan. These forces represent both opportunities and threats to regional vitality. Examples follow the chart to illustrate how some of these forces are shifting the
Eleven Forces Shaping the Future of Work
Technologygains of the past several decades. It has enabled greater economic output, faster production, reduced costs, wider market reach, and greater efficiency than ever before.
occupations are in demand in every kind of enterprise.
without ‘computer skills’ are regular IT users; digital TV, cameras, smart
Connectivityways undreamt of only a few years ago. Such media have been put to positive
use of wikis and blogs in some work processes.
social media to exchange ideas, fell dictators, elect presidents, raise money, spread news, find jobs, build company brand.
from remote locations, 24x7, to facilitate commerce, creativity, competitive advantage.
8
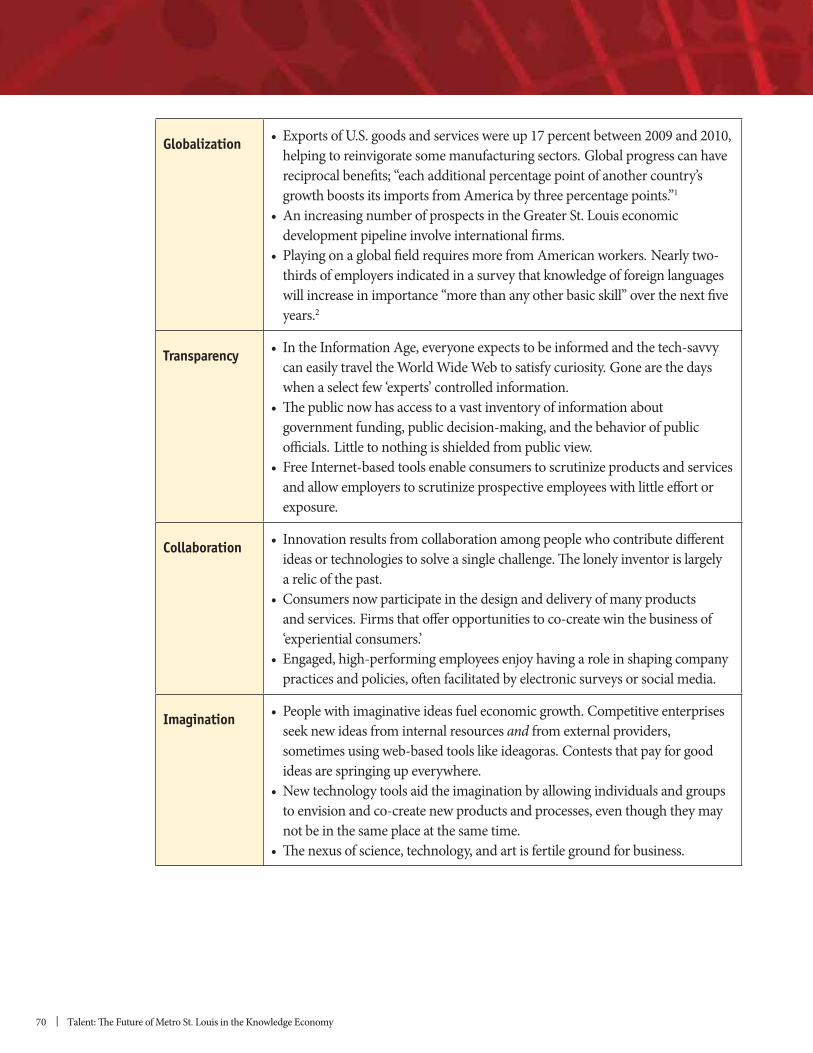
70 | Talent: The Future of Metro St. Louis in the Knowledge Economy
Globalization helping to reinvigorate some manufacturing sectors. Global progress can have reciprocal benefits; “each additional percentage point of another country’s growth boosts its imports from America by three percentage points.”1
development pipeline involve international firms.
thirds of employers indicated in a survey that knowledge of foreign languages will increase in importance “more than any other basic skill” over the next five years.2
Transparency
when a select few ‘experts’ controlled information.
officials. Little to nothing is shielded from public view.
and allow employers to scrutinize prospective employees with little effort or exposure.
Collaborationideas or technologies to solve a single challenge. The lonely inventor is largely a relic of the past.
‘experiential consumers.’
practices and policies, often facilitated by electronic surveys or social media.
Imaginationseek new ideas from internal resources and from external providers,
ideas are springing up everywhere.
not be in the same place at the same time.
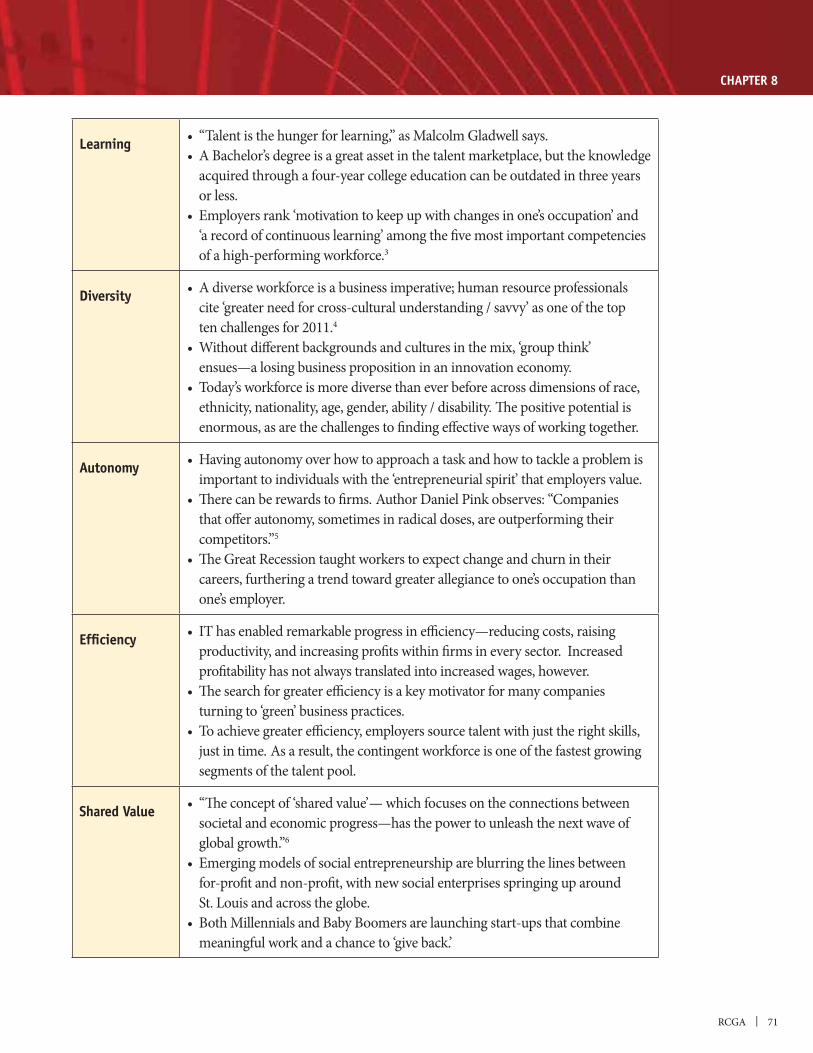
RCGA | 71
CHAPTER 8
Learning
or less.
‘a record of continuous learning’ among the five most important competencies 3
Diversity
ten challenges for 2011.4
ensues—a losing business proposition in an innovation economy.
ethnicity, nationality, age, gender, ability / disability. The positive potential is enormous, as are the challenges to finding effective ways of working together.
Autonomyimportant to individuals with the ‘entrepreneurial spirit’ that employers value.
that offer autonomy, sometimes in radical doses, are outperforming their competitors.”5
careers, furthering a trend toward greater allegiance to one’s occupation than one’s employer.
Efficiencyproductivity, and increasing profits within firms in every sector. Increased profitability has not always translated into increased wages, however.
turning to ‘green’ business practices.
just in time. As a result, the contingent workforce is one of the fastest growing segments of the talent pool.
Shared Valuesocietal and economic progress—has the power to unleash the next wave of global growth.”6
St. Louis and across the globe.
meaningful work and a chance to ‘give back.’
72 | Talent: The Future of Metro St. Louis in the Knowledge Economy
Forces of Change in the World of Work: Outsourcing and AutomationInformation Technology wove a web around the globe in the late 1980s and early ‘90s, and the world flattened (as Tom Friedman first said), allowing information, ideas, money, people, and work to move
some firms began to relocate components of production to less developed countries where the work could be done more cheaply. Often, it wasn’t necessary to move whole operations. New technologies and inexpensive transportation allowed work to be broken into discrete pieces, performed in the most
not appear that the practice will ever be fully reversed. A news report from early 2011 observed: “Companies in the tradable sector [manufacturing, ag products, minerals, energy, business and
7
of workers, but much outsourcing happens within the boundaries of the regional economy and the
supported by units within HR or procurement, which enable them to seek and secure just the right skills for the tasks at hand through external domestic vendors. The trend toward outsourcing has fueled an explosion in the contingent workforce of contractors, consultants, and professional services
internal capacity had to be built and maintained. Bloomberg BusinessWeek notes “specific examples
workforces just give them more flexibility.”8
Outsourcing is only one part of the picture when it comes to technology and the reshuffling of work, however. Automation is potentially an even bigger factor. The National Center on Education and the Economy pointed out in a 2007 report that “if someone can figure out the algorithm for a
involve routine work of this kind and are rapidly being automated.”9 This includes tasks across all industry sectors. According to a column in the Harvard Business Review, it may even include middle managers, across the board, whose jobs, in the “classic” sense “will soon disappear.”10
market has been characterized not by a general rise in the demand for skill, but by a ‘hollowing out’:
jobs we depend on to support a strong middle class—have lagged behind. And the hole in the middle has been getting wider: many of the high wage occupations that grew rapidly in the 1990s have seen
11
RCGA | 73
CHAPTER 8
12
The Center for American Progress and the Hamilton Project note that this “polarization of job opportunities” began before the Great Recession, but has been “quantitatively” changed by it.13 It is largely, they confirm, the product of “the automation of routine work and the international integration of labor markets.” These trends are expected to continue. The National Center on Education and the Economy (NCEE) concludes that by 2017 nearly all routine work will be done by machines and / or by people in
work that brings innovation and renewed value to every sector. The NCEE report says: “The best employers the world over will be looking for the most competent, most creative and most innovative people on the face of the earth and will be willing to pay them top dollar for their services. This will be true not just for the top professionals and managers, but up and down the length and breadth of the workforce. Those countries that produce the most important new products and services can capture a premium in world markets that will enable them to pay high wages to their citizens.”14
percent) of employers responding to a 2008 national survey said that “creativity / innovation is projected to increase in importance for future workforce entrants.” Relatively few of the survey
15
Forces of Change in Post-Secondary Education: Technology and Innovation
has not only changed many economic sectors, it has transformed them by lowering costs, increasing access, and delivering the personalized, customized, and interactive experiences that customers have come to expect. Higher education, however, has yet to experience the kind of disruption and
‘Google’ or ‘Apple’ of Higher Education?”16
Although they are still down market, the drivers of educational transformation appear to already be at work. The first wave of change was propelled by online learning, the ‘technology enabler’
tens of thousands of students—many of them adults who were not previously enrolled in school. According to researchers at the Center for American Progress and the Innosight Institute, “roughly 10 percent of students in 2003 took at least one online course. That fraction grew to 25 percent in 2008, was nearly 30 percent in the fall of 2009, and we project it will be 50 percent in 2014.”17
Online educational options are also transforming talent development and management programs offered by employers. A 2011 survey administered by the Society for Human Resource Management (SHRM) found that “… more than half of HR professionals said they were expanding
applications (51 percent).”18
74 | Talent: The Future of Metro St. Louis in the Knowledge Economy
and degrees, and there has been a notable increase in the number of proprietary schools competing
added real value to the choices available to students; others have not. This has raised public concern
education.19 The second wave of innovation in education is driven by use of the Internet to deliver learning content outside of traditional college structures. Innovative programs package content into short modules and deliver it over the Internet at very low or no cost, in malleable formats, with continuous
‘edupreneurs’ creating such solutions are like round pegs in the square holes of existing accreditation systems, and while adaptation may be lengthy and difficult, changes such as these are on the horizon. “There is now an entire ecosystem of venture capitalists, social entrepreneurs, angel investors and
20
These and other innovations in talent development will continue to influence the educational
transformed from an art into something much closer to a science, look for learning to become highly
to one that takes full advantage of the economies of scale and scope. And as is true in every other industry, look for quality to go up and cost to go down.”21
______________
1. Observation from President Obama’s Council on Economic Advisors, cited in “Rustbelt Recovery.” The Economist. March 12, 2011.
Resource Management. Are They Really Ready to Work? Employers’ Perspectives on the Basic Knowledge and Skills of New Entrants to the 21st Century Workforce. 2006.
3. St. Louis RCGA. The Competencies of a High-Performing Workforce: Findings from a Survey of St. Louis Area HR Professionals. 2011.
4. Society for Human Resource Management. SHRM Workplace Forecast: The Top Workplace Trends According to HR Professionals February 2011. Page 4.
5. Daniel Pink. Drive: The Surprising Truth About What Motivates Us
Harvard Business Review.
The Washington Post. March 12, 2011.
Bloomberg BusinessWeek. May 23, 2007.
RCGA | 75
CHAPTER 8
9. National Center on Education and the Economy. Tough Choices or Tough Times: The Report of the New Commission on the Skills of the American Workforce. 2007. www.skillscommission.org.
10. Lynda Gratton, “The End of the Middle Manager.” Harvard Business Review.
The New York Times, March 6, 2011.
www.newamerica.net
The Polarization of Job Opportunities in the U.S. Labor Market. Center for American Progress and The Hamilton Project. April 2010.
14. Tough Choices or Tough Times. Page 7.
Resource Management. Are They Really Ready to Work? Employers’ Perspectives on the Basic Knowledge and Skills of New Entrants to the 21st Century Workforce. 2006. Page 10.
College 2.0: Transforming Higher Education through Greater Innovation and Smarter Regulation. May 2011.
Disrupting College: How Disruptive Innovation Can Deliver Quality and Affordability to Postsecondary Education. February 2011.
18. Society for Human Resource Management, SHRM Workplace Forecast: The Top Workplace Trends According to HR Professionals. February 2011.
19. Author’s notes from spoken remarks by Joshua Lewis, Salmon River Capital, at a forum “Degrees of Change: Private Sector
20. Steven Pearlstein, “Mark them tardy to the revolution.” The Washington Post. May 29, 2011.
21. Ibid.
76 | Talent: The Future of Metro St. Louis in the Knowledge Economy
A New Regional Framework for Talent Development
IntroductionIt is time for a new approach to talent. The days are long behind us when a high school diploma and a strong Midwestern work ethic guaranteed a job in the factory and a steady ladder to a gold watch. Almost nothing in that era of St. Louis history is the same anymore: not the diploma, the guarantee, the factory, the steady ladder—not even the gold watch.
working life before easing out of the labor force through a phased retirement or an encore career.
More than traditional education and workforce systems can do alone. Today, talent development is everyone’s business. This section presents a new framework for talent development that brings everyone into the process. It is built on three essential elements. The planning partners believe that if business,
organizational players adopt and share this approach, it will focus our collective efforts and allow us to act together effectively. If fully implemented, this framework can guide significant progress toward the vision of regional competitive advantage expressed in Section 3.
Three Elements in a New Regional Framework
Century demands is at once:
1) Prepared to work Being prepared to work in today’s knowledge economy requires educational credentials beyond the high school level. Coming out of the Great Recession into a new growth cycle, the American workforce is noticeably behind in educational preparedness.
2) Equipped to performPost-secondary credentials are the necessary foundation for work, but they are not necessarily sufficient. Employers describe a college degree as “the ticket to get in the door” to a good job, but not an adequate guarantee that the bearer has the desired skills.
3) Positioned to advanceCareer-long development is important not only to individuals seeking to advance, but to the companies where they work. To fill the most valued roles, firms seek talented people who have traveled a developmental path on which they earned credentials and accumulated the knowledge, skills, and experiences required for high performance over time.
9
RCGA | 77
CHAPTER 9
The talent development framework presented here has been constructed on these broad qualities. The details have been honed with input from relevant stakeholders. Each emanates from priorities expressed by the business and economic development communities, focuses on the region’s targeted economic sectors, has been reviewed and shaped by representatives of higher education and workforce development, and encourages a coordinated response on the part of the larger community. Although listed in numerical order, the three elements of talent development presented here may not always unfold in sequence. They may overlap and progress concurrently in the growth of any talented individual or cohorts of individuals. The pages that follow describe each.
#1. Great Talent is Prepared to Work: The Importance of Post-Secondary Credentials
the high school level. Coming out of the Great Recession into a new growth cycle, the American workforce is noticeably behind in educational preparedness.
The Economic Development ImperativeThe economic development community is sounding the alarm with repeated messages such as this
had the largest percentage of adults between ages 25 and 34 with a high school diploma and college
Cooperation and Development] countries have nearly doubled since then, and they have largely
degrees now lags behind that of many countries.”1 This issue is near the top of the economic challenges facing St. Louis, where only 32 percent of
jobs. The chart presented in Section 3 documents the region’s standing as 12th among the nation’s 20 largest metro areas on this indicator. Moody’s, a firm that provides economic research services to the business community, noted in a recent publication: “In the long run, St. Louis will struggle to attract professional and tech firms unless its educational attainment can catch up to the competition.”2
Business InterestsMembers of the St. Louis business community affirm the need to grow the region’s pool of college graduates. The 169 human resource professionals who responded to a survey administered by the St. Louis RCGA and the Human Resource Management Association (HRMA) in preparation for this
in value to their company’s performance and 3.59 in importance to the individual’s career. The highest ratings were given by HR staff in companies with more than 2000 employees. The average rating given
and 4.13 (for the individual’s career).
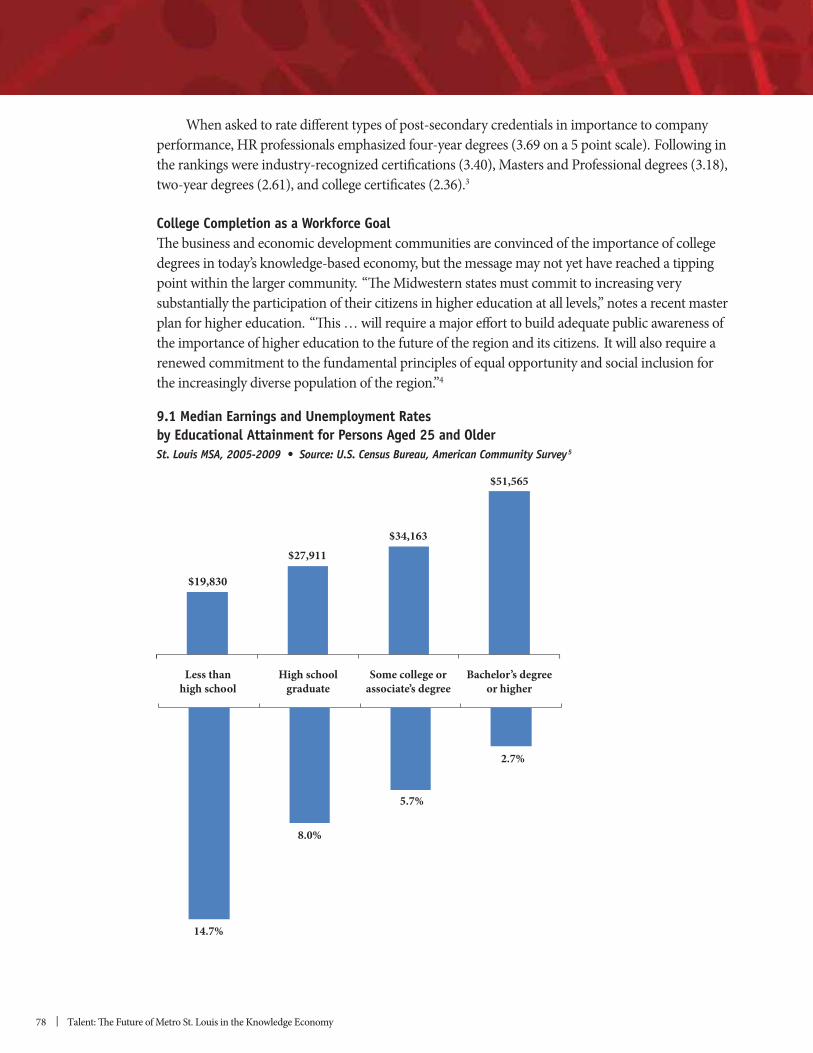
78 | Talent: The Future of Metro St. Louis in the Knowledge Economy
3
College Completion as a Workforce GoalThe business and economic development communities are convinced of the importance of college
point within the larger community. “The Midwestern states must commit to increasing very substantially the participation of their citizens in higher education at all levels,” notes a recent master plan for higher education. “This … will require a major effort to build adequate public awareness of the importance of higher education to the future of the region and its citizens. It will also require a renewed commitment to the fundamental principles of equal opportunity and social inclusion for the increasingly diverse population of the region.”4
Bachelor’s degreeor higher
Some college orassociate’s degree
High schoolgraduate
Less thanhigh school
$51,565
$34,163$27,911
$19,830
2.7%
5.7%
8.0%
14.7%
9.1 Median Earnings and Unemployment Rates by Educational Attainment for Persons Aged 25 and Older
5
RCGA | 79
CHAPTER 9
A convincing argument for college completion can be made from the workforce perspective, using a number of metrics.
According to recent research on skills and employment in the national economy, the “simple comparison of the wage gap between college and high school graduates probably understates significantly the real growth in compensation for college graduates relative to high school graduates in recent decades. College graduates work more hours per week and more weeks per year than high school graduates, spend less time unemployed, and receive a disproportionate share of
each grown over the past several decades.”6
mathematics, business, health, and the physical sciences. The lowest earners had majored in biology and life science, humanities and liberal arts, arts, education, and psychology / social work.7
Post-Secondary Credentials for Middle-Skill Jobs
significant. The National Skills Coalition argues in a 2007 report that “overall… the demand for
the economy…. This is particularly true for jobs that require an Associate’s degree or some particular vocational training or certification.”9 As illustrated by charts appearing later in this Section, sectors
include the health care, financial and information services, and sustainable technology clusters targeted in this plan. Certifications are increasingly valuable currency in the knowledge economy, accounting for a
the double benefit of access to “growth and opportunities in incremental steps” and, in some fields, “the earnings power commonly associated with traditional degrees.”10
the ultimate test of the value of certifications, the relatively high rating that these credentials received in the St. Louis survey of HR professionals cited earlier suggests that the demand in this region is good.
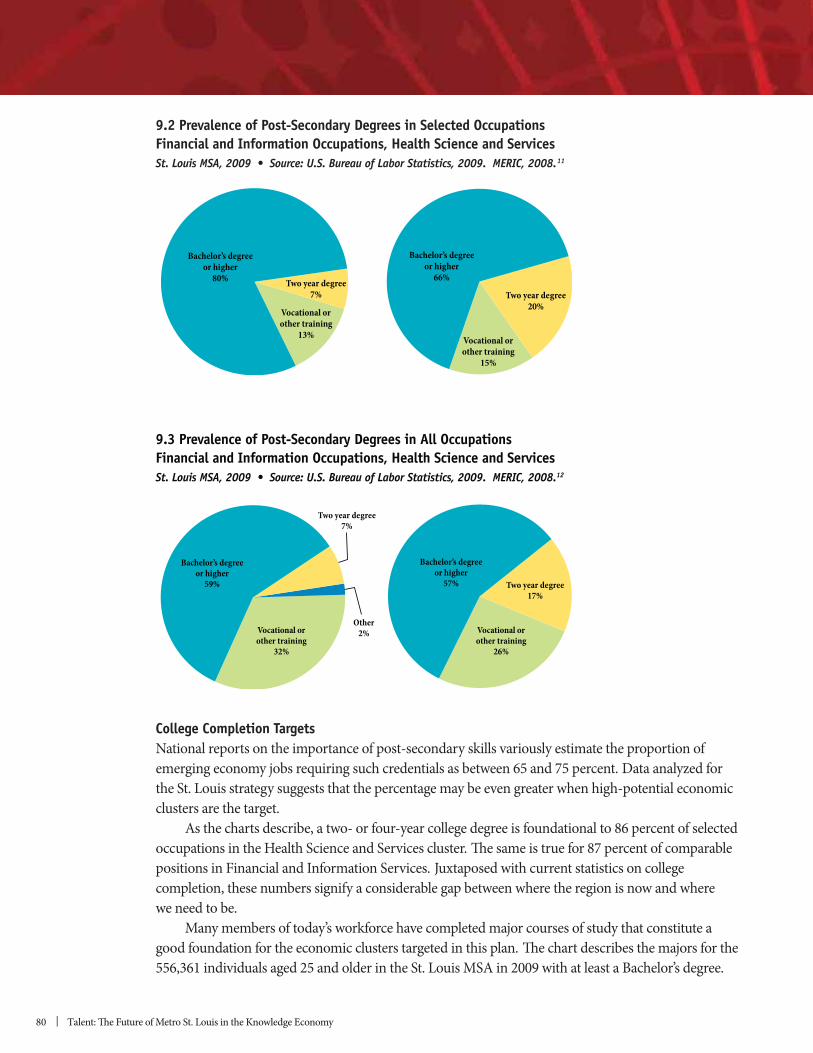
80 | Talent: The Future of Metro St. Louis in the Knowledge Economy
College Completion Targets
emerging economy jobs requiring such credentials as between 65 and 75 percent. Data analyzed for
clusters are the target.
occupations in the Health Science and Services cluster. The same is true for 87 percent of comparable positions in Financial and Information Services. Juxtaposed with current statistics on college completion, these numbers signify a considerable gap between where the region is now and where we need to be. Many members of today’s workforce have completed major courses of study that constitute a good foundation for the economic clusters targeted in this plan. The chart describes the majors for the
9.2 Prevalence of Post-Secondary Degrees in Selected OccupationsFinancial and Information Occupations, Health Science and Services
11
Bachelor’s degreeor higher
66%
Bachelor’s degreeor higher
80%
Two year degree20%
Two year degree7%
Vocational orother training
13% Vocational orother training
15%
9.3 Prevalence of Post-Secondary Degrees in All OccupationsFinancial and Information Occupations, Health Science and Services
12
Bachelor’s degreeor higher
57%
Bachelor’s degreeor higher
59%
Two year degree7%
Vocational orother training
26%
Vocational orother training
32%
Two year degree17%
Other2%
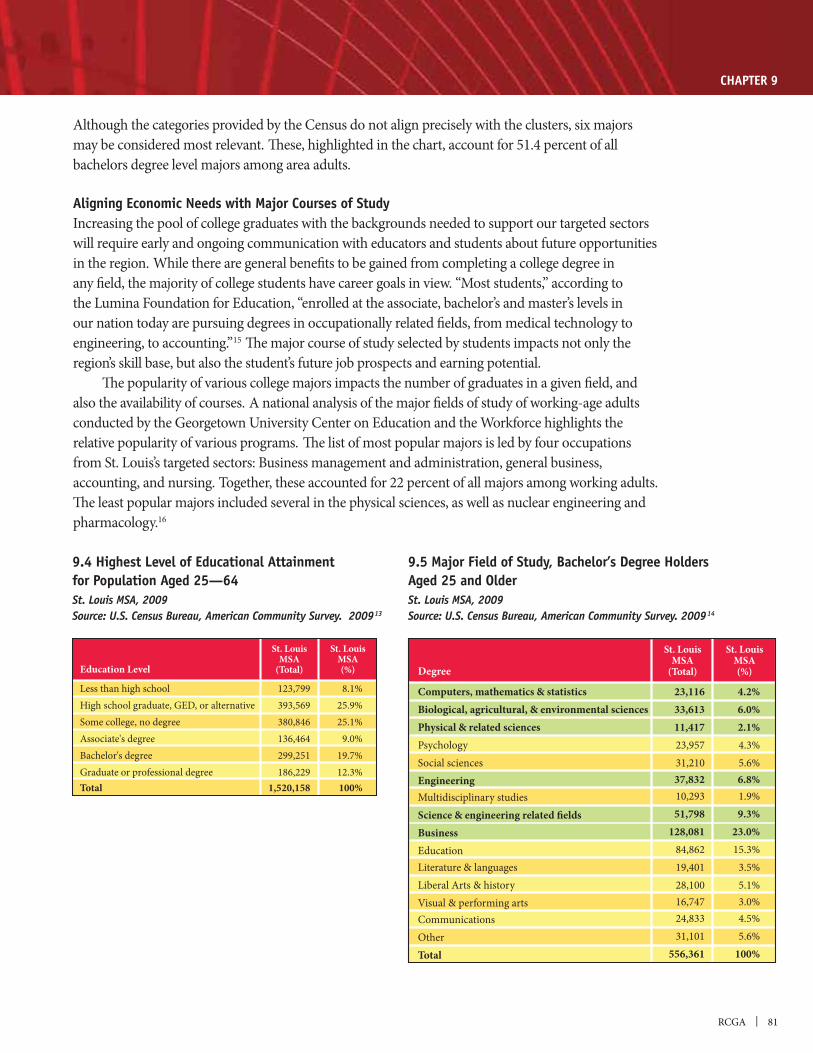
RCGA | 81
CHAPTER 9
Although the categories provided by the Census do not align precisely with the clusters, six majors may be considered most relevant. These, highlighted in the chart, account for 51.4 percent of all bachelors degree level majors among area adults.
Increasing the pool of college graduates with the backgrounds needed to support our targeted sectors will require early and ongoing communication with educators and students about future opportunities
any field, the majority of college students have career goals in view. “Most students,” according to the Lumina Foundation for Education, “enrolled at the associate, bachelor’s and master’s levels in our nation today are pursuing degrees in occupationally related fields, from medical technology to engineering, to accounting.”15 The major course of study selected by students impacts not only the region’s skill base, but also the student’s future job prospects and earning potential. The popularity of various college majors impacts the number of graduates in a given field, and
relative popularity of various programs. The list of most popular majors is led by four occupations
accounting, and nursing. Together, these accounted for 22 percent of all majors among working adults. The least popular majors included several in the physical sciences, as well as nuclear engineering and pharmacology.16
Aged 25 and OlderSt. Louis MSA, 2009
14
St. LouisMSA(%)
St. LouisMSA
(Total)Education Level
Less than high schoolHigh school graduate, GED, or alternativeSome college, no degreeAssociate's degreeBachelor's degreeGraduate or professional degreeTotal
123,799393,569380,846136,464299,251186,229
1,520,158
8.1%25.9%25.1%
9.0%19.7%12.3%100%
St. LouisMSA(%)
St. LouisMSA
(Total)Degree
Computers, mathematics & statisticsBiological, agricultural, & environmental sciencesPhysical & related sciencesPsychologySocial sciencesEngineeringMultidisciplinary studiesScience & engineering related fieldsBusinessEducationLiterature & languagesLiberal Arts & historyVisual & performing artsCommunicationsOtherTotal
23,11633,61311,41723,95731,21037,83210,29351,798
128,08184,86219,40128,10016,74724,83331,101
556,361
4.2%6.0%2.1%4.3%5.6%6.8%1.9%9.3%
23.0%15.3%
3.5%5.1%3.0%4.5%5.6%
100%
9.4 Highest Level of Educational Attainment for Population Aged 25—64St. Louis MSA, 2009
13
82 | Talent: The Future of Metro St. Louis in the Knowledge Economy
Regional Assets for Post-Secondary Education
educational institutions listed in the charts.
certifications and stackable college certificates that are awarded at technical schools, colleges, universities, and online learning institutions serving the St. Louis region every year. These credentials are valued currency in the talent marketplace of the knowledge economy. In addition to those listed, the region is served by colleges and universities in other parts of Missouri and Illinois, as depicted in the map. Among those serving the highest percentage of St. Louis
Challenges to SuccessDespite having a solid base on which to build, the St. Louis area faces considerable challenges if we are
demographics in the student population and the rising cost of college.
As is true for higher education across the nation, the college student population of the St. Louis area is older than what was once considered “traditional” and students are more likely to be balancing work and school at the same time than has been true in the past. Nearly half (49 percent) of students enrolled in area colleges in 2009 were aged 25 and older. More than half (53 percent) of students in
students.20 Partly as a result of the many challenges facing students who are trying to juggle school, work, family life, and other responsibilities at the same time, there are more adults in the St. Louis area who
one academic year.21
preparation of this report identified several barriers from their own experience that are borne out by national research on the subject of college completion.22 These barriers include:
attend college)
than one school in pursuit of a degree, and 35 percent attend two or more)23

RCGA | 83
CHAPTER 9
9.6 Enrollment and Degrees Awarded for Four Year Colleges and UniversitiesSt. Louis MSA, 2009-2010
17
TotalDegreesAwarded
TotalEnrollmentSchool Name
Aquinas Institute of TheologyBarnes-Jewish College Goldfarb School of NursingBlackburn CollegeBrown Mackie CollegeChamberlain College of NursingColumbia College - St. LouisConcordia SeminaryCovenant Theological SeminaryEden Theological SeminaryFontbonne UniversityGreenville CollegeHarris-Stowe State UniversityHickey CollegeITT Technical Institute - ArnoldITT Technical Institute - Earth CityKenrick Glennon SeminaryLindenwood UniversityLogan College of ChiropracticMaryville UniversityMcKendree UniversityMidwest UniversityMissouri Baptist UniversityMissouri CollegeMissouri TechPrincipia CollegeRanken Technical CollegeSanford-Brown College - FentonSanford-Brown College - Saint PetersSouthern Illinois University at EdwardsvilleSt. Louis Christian CollegeSt. Louis College of PharmacySt. Louis UniversityStevens College of Business & ArtsUniversity of Missouri-St. LouisUniversity of Phoenix - St. LouisVatterott College - North ParkVatterott College - Sunset HillsWashington UniversityWebster UniversityTotal
244634607106
3,5451,441
472807209
2,8631,5761,886
480903
1,001115
10,4081,1113,5343,284
3004,836
920135527
2,0391,044
77913,940
3331,233
16,317200
16,534605
1,7071,052
13,5758,126
119,428
72360122
01,438
110126145
38856468142212259234
292,698
524819908
68780128
31102392215259
2,99673
1793,097
842,886
121130154
3,8632,100
27,218
9.7 Enrollment and Degrees Awarded for Two-Year Colleges St. Louis MSA, 2009-2010
18
TotalDegreesAwarded
TotalEnrollmentSchool Name
Anthem College- Maryland HeightsAnthem College- FentonEast Central CollegeJefferson CollegeKaskaskia CollegeLecole CulinaireLewis & Clark Community CollegeLutheran School of NursingMidwest InstituteSanford-Brown College - CollinsvilleSanford-Brown College- HazelwoodSouthwestern Illinois CollegeSt Louis College of Health CareersSt Louis College of Health Careers - FentonSt. Charles Community CollegeSt. Louis Community College - Florissant ValleySt. Louis Community College - Forest ParkSt. Louis Community College - MeramecSt. Louis Community College - WildwoodVatterott College-O'Fallon CampusTotal
346446
4,2035,7885,337
6148,179
160191612929
14,440340200
7,8147,2108,207
11,1861,401
39277,995
101182374671527169644
01124
1771,338
1126
655522588901
4738
7,006
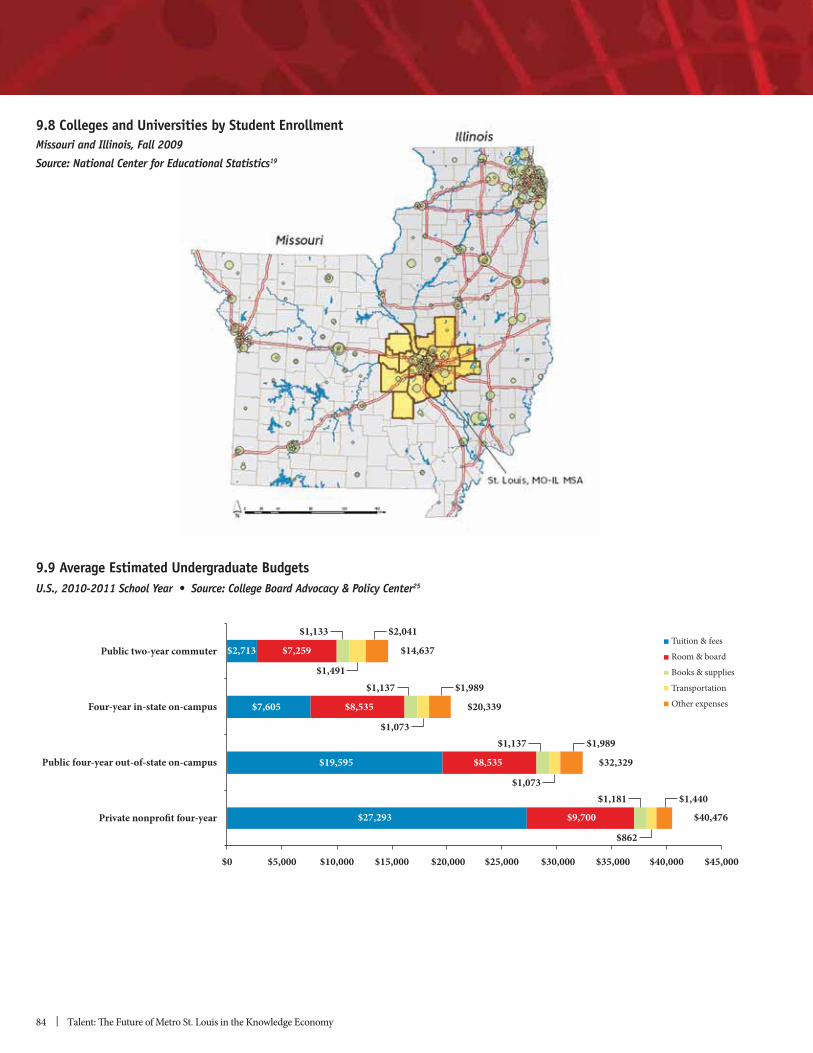
84 | Talent: The Future of Metro St. Louis in the Knowledge Economy
9.8 Colleges and Universities by Student Enrollment
19
Tuition & fees
Room & board
Books & supplies
Transportation
Other expenses
$45,000$40,000$35,000$30,000$25,000$20,000$15,000$10,000$5,000$0
Public two-year commuter
Four-year in-state on-campus
Public four-year out-of-state on-campus
Private nonprofit four-year
$2,713
$8,535$7,605
$8,535$19,595
$9,700$27,293
$7,259
$1,073
$1,137 $1,989
$20,339
$1,491
$1,133 $2,041
$14,637
$1,073
$1,137 $1,989
$32,329
$862
$1,181 $1,440
$40,476
9.9 Average Estimated Undergraduate Budgets25
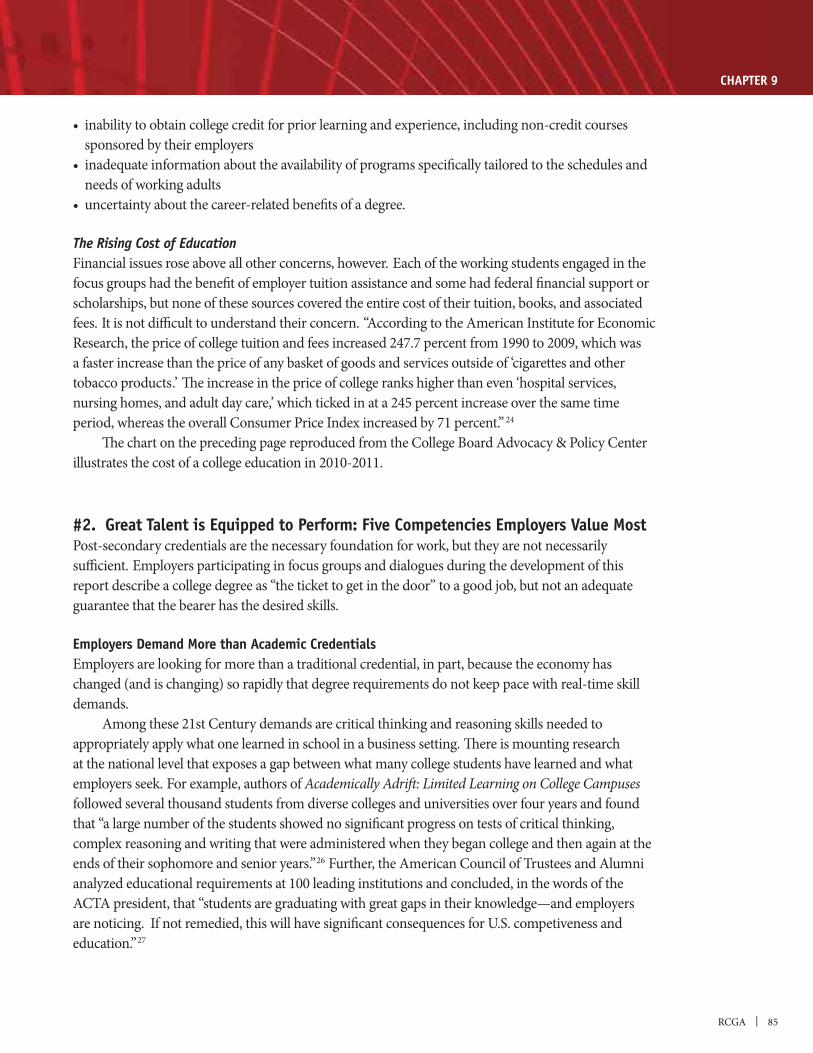
RCGA | 85
CHAPTER 9
sponsored by their employers
needs of working adults
Financial issues rose above all other concerns, however. Each of the working students engaged in the focus groups had the benefit of employer tuition assistance and some had federal financial support or scholarships, but none of these sources covered the entire cost of their tuition, books, and associated fees. It is not difficult to understand their concern. “According to the American Institute for Economic Research, the price of college tuition and fees increased 247.7 percent from 1990 to 2009, which was a faster increase than the price of any basket of goods and services outside of ‘cigarettes and other tobacco products.’ The increase in the price of college ranks higher than even ‘hospital services, nursing homes, and adult day care,’ which ticked in at a 245 percent increase over the same time period, whereas the overall Consumer Price Index increased by 71 percent.” 24
#2. Great Talent is Equipped to Perform: Five Competencies Employers Value Most
sufficient. Employers participating in focus groups and dialogues during the development of this report describe a college degree as “the ticket to get in the door” to a good job, but not an adequate guarantee that the bearer has the desired skills.
Employers Demand More than Academic CredentialsEmployers are looking for more than a traditional credential, in part, because the economy has
demands. Among these 21st Century demands are critical thinking and reasoning skills needed to appropriately apply what one learned in school in a business setting. There is mounting research at the national level that exposes a gap between what many college students have learned and what employers seek. For example, authors of Academically Adrift: Limited Learning on College Campuses followed several thousand students from diverse colleges and universities over four years and found that “a large number of the students showed no significant progress on tests of critical thinking, complex reasoning and writing that were administered when they began college and then again at the ends of their sophomore and senior years.”26 Further, the American Council of Trustees and Alumni analyzed educational requirements at 100 leading institutions and concluded, in the words of the ACTA president, that “students are graduating with great gaps in their knowledge—and employers
education.”27
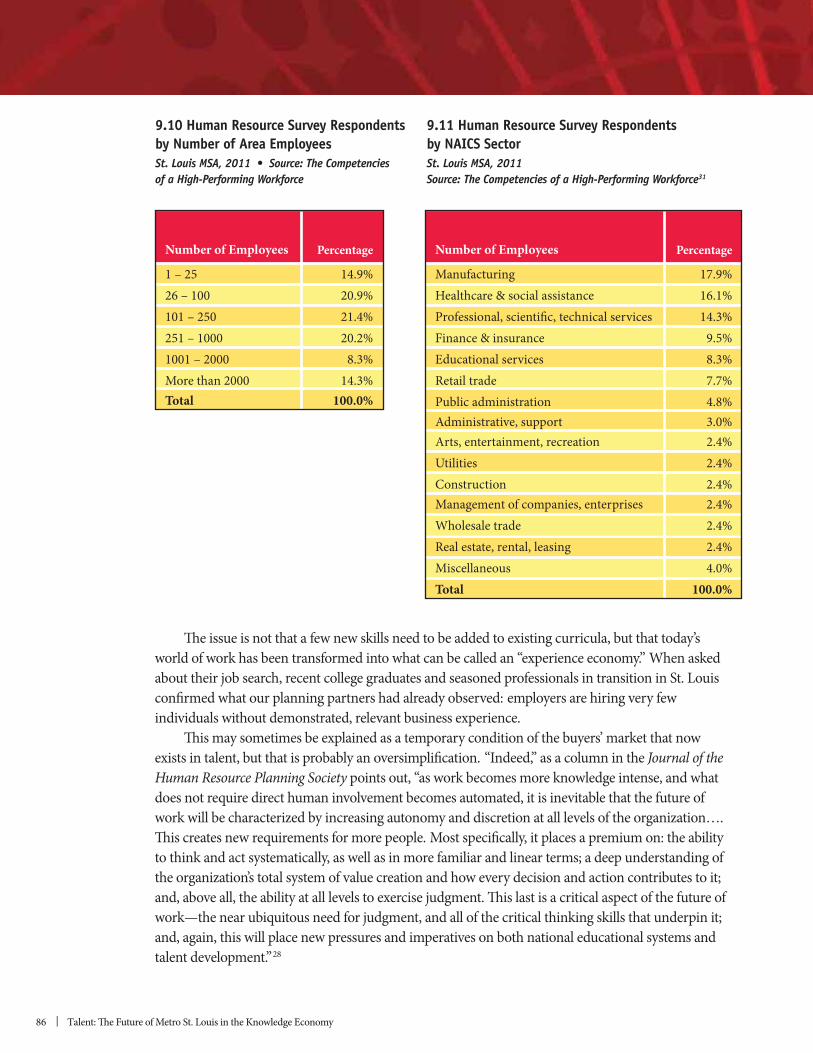
86 | Talent: The Future of Metro St. Louis in the Knowledge Economy
The issue is not that a few new skills need to be added to existing curricula, but that today’s
about their job search, recent college graduates and seasoned professionals in transition in St. Louis confirmed what our planning partners had already observed: employers are hiring very few individuals without demonstrated, relevant business experience. This may sometimes be explained as a temporary condition of the buyers’ market that now exists in talent, but that is probably an oversimplification. “Indeed,” as a column in the Journal of the Human Resource Planning Society points out, “as work becomes more knowledge intense, and what does not require direct human involvement becomes automated, it is inevitable that the future of work will be characterized by increasing autonomy and discretion at all levels of the organization…. This creates new requirements for more people. Most specifically, it places a premium on: the ability to think and act systematically, as well as in more familiar and linear terms; a deep understanding of the organization’s total system of value creation and how every decision and action contributes to it; and, above all, the ability at all levels to exercise judgment. This last is a critical aspect of the future of work—the near ubiquitous need for judgment, and all of the critical thinking skills that underpin it; and, again, this will place new pressures and imperatives on both national educational systems and talent development.”28
PercentageNumber of Employees
1 – 2526 – 100101 – 250251 – 10001001 – 2000More than 2000Total
14.9%20.9%21.4%20.2%
8.3%14.3%
100.0%
PercentageNumber of Employees
ManufacturingHealthcare & social assistanceProfessional, scientific, technical servicesFinance & insuranceEducational servicesRetail tradePublic administrationAdministrative, supportArts, entertainment, recreationUtilitiesConstructionManagement of companies, enterprisesWholesale tradeReal estate, rental, leasingMiscellaneous Total
17.9%16.1%14.3%
9.5%8.3%7.7%4.8%3.0%2.4%2.4%2.4%2.4%2.4%2.4%4.0%
100.0%
9.10 Human Resource Survey Respondents by Number of Area Employees
9.11 Human Resource Survey Respondents by NAICS Sector St. Louis MSA, 2011
31
RCGA | 87
CHAPTER 9
Recent national research has identified several important skills that are not consistently taught in high school or college. A 2006 report Are They Really Ready to Work?the Society for Human Resources Management, the Partnership for 21st Century Skills, and Corporate
enable new entrants to the workforce to use the basic knowledge acquired in school to perform in the workplace—on all educational levels trump basic knowledge and skills such as Reading Comprehension and Mathematics. In other words,” the report says, “while the ‘three R’s’ are still fundamental to any new workforce entrant’s ability to do the job, employers emphasize that applied skills like Teamwork / Collaboration and Critical Thinking are ‘very important’ to success at work.”29
critical / analytical thinking, oral communications, time management, and written communications.30
St. Louis Area Survey of HR Professionals To further focus our regional talent framework, the St. Louis planning partners have identified five competencies that employers in our market value most.
conducted at the national and local level regarding competencies employers seek (the reports cited above provide examples). Secondly, we studied competency models developed by state and federal agencies, as well as the knowledge, skills, and abilities described in the O*Net occupational classification system. Third, we gathered the direct experiences of colleagues who are career counselors, workforce development specialists, educators, economic developers, and professionals currently in the job market in the St. Louis area.
verify and further define this list, the planning partners reached out to the St. Louis Human Resource Management Association (HRMA), who agreed to join us in developing and implementing a poll of human resource professionals about the talent attributes most important in the firms they represent. The resulting survey was available online to HR professionals throughout metro St. Louis
membership base of 250 completed the survey. As indicated in the charts that follow, the survey sample included small and large firms, and companies from a variety of economic sectors. The full survey results are detailed in a separate report, The Competencies of a High-Performing Workforce: Findings from a Survey of St. Louis Area HR Professionals. The survey described the draft competencies generated from earlier research and asked respondents to rank, detail, and add to them.
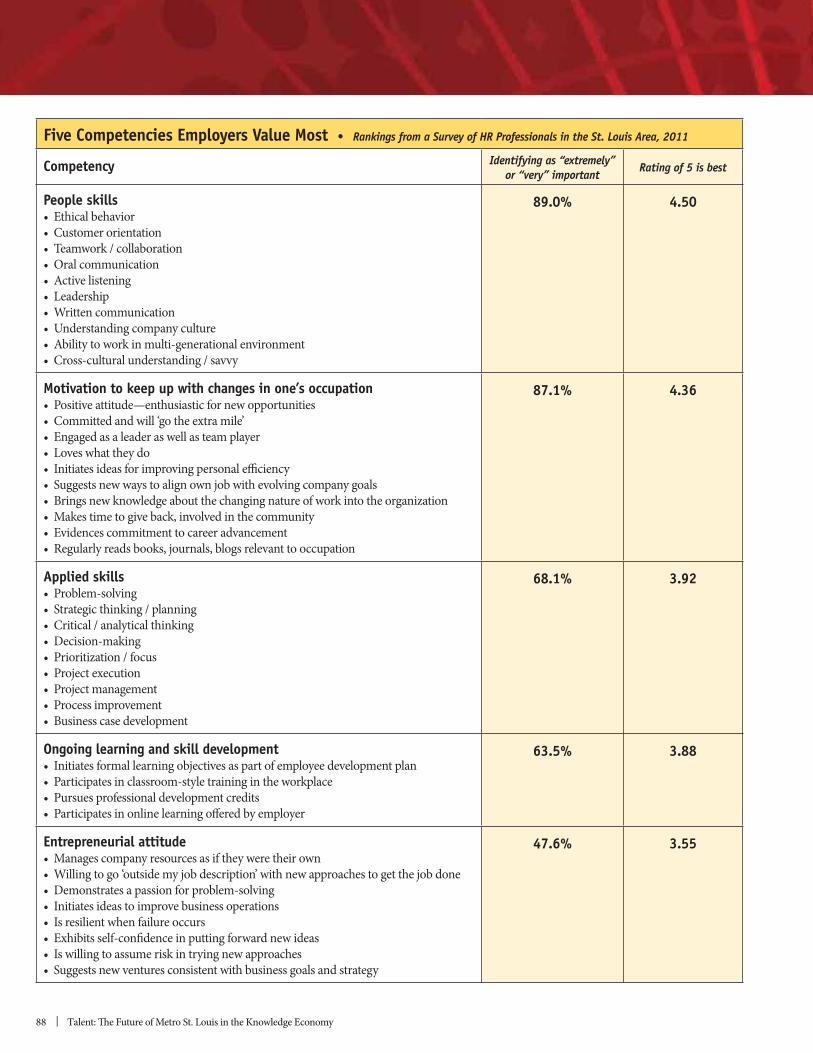
88 | Talent: The Future of Metro St. Louis in the Knowledge Economy
Five Competencies Employers Value Most
Competency
People skills 89.0% 4.50
Motivation to keep up with changes in one’s occupation 87.1% 4.36
Applied skills 68.1% 3.92
Ongoing learning and skill development 63.5% 3.88
Entrepreneurial attitude 47.6% 3.55
RCGA | 89
CHAPTER 9
The Workforce Competencies Employers Value MostThe chart lists the five competencies given the highest ratings by HR respondents. It provides the percentage of total respondents who designated each competency as “extremely” or “very” important. Following each one are the competency attributes that received an average rating of 3.0 (“important”) or higher on a scale of 5.
Five Competencies Important Across the Workforce
directors, or senior professionals. In today’s dynamic economy, they pertain across the entire workforce. The specifics and the degree may vary from one occupation to the next, but the broad attributes are the same. A recent Time magazine article expressed it this way: “In the future, more will be expected
collaborative, and far less secure work world…. Companies will be looking for people who can help them solve problems before they even happen, identify opportunities that are barely visible on the horizon. This extends from workers on the shop floor to software developers in the IT department to contract energy monitors, and more.”32
#3. Great Talent is Positioned to Advance: Pathways Linking Individual and Business Success
companies where they work. To fill the most valued roles, firms seek talented people who have traveled a developmental path on which they earned credentials and accumulated the knowledge, skills, and experiences required for high performance over time.
The Employers’ Dilemma Employers in today’s competitive global economy seek to have the right people with the right skills
this quest as “a common definition of talent management.”33 As has been described, having the right
the competencies and experience that employers value most.
“Companies rarely know what they will be building five years out and what skills they will need to make that happen; they also don’t know if the people they have in their pipelines are going to be around….”34 This is one of the realities behind employers’ widely adopting the practice of ‘outside
as was a principal practice in the industrial era, but many also increasingly meet changing demands
external pool of experienced people looking for new opportunities. Combine shifting skill demands and outside hiring practices with the accelerating pace of job
mobile talent marketplace in which businesses operate today.
90 | Talent: The Future of Metro St. Louis in the Knowledge Economy
Regional Talent Management
to those of a business: having the right people in the talent pool with the right skills available to meet
be met by individuals who are already in the workforce and who comprise the vast majority of the talent that will be available to metro St. Louis region over the next ten years. To frame the system needed to ensure that regional talent management objectives are met, the planning partners propose a new career pathway model that acknowledges the highly dynamic nature of today’s economy and that highlights multiple milestones where companies, educational institutions, and talented people can engage in talent development planning. The pathways are oriented towards critical occupations, or “business drivers,” as identified by firms in the St. Louis market. From the vantage point of individual members of the workforce, these business drivers represent career “destinations,” with multiple steps along the way.
Identifying Critical Occupations: Business DriversTo draft model pathways for consideration by the stakeholders, the planning partners first sought to identify critical occupations from the business perspective. Critical occupations are not necessarily
where future openings are likely to be.
creation and economic growth on the virtuous circle at the center of this plan. The planning partners
consider to be the most critical to future business growth and development?
Human Resource Planning Society (HRPS) to identify short lists of critical occupations that could
menus of occupations most likely to be considered critical. 35 These lists — which are displayed in
from each sector with which to start.
RCGA | 91
CHAPTER 9
The selected occupations were Nurse Practitioners, Computer Systems Analysts, and Compliance Managers. Only the first of these business drivers is unique to a single sector. The other two are part
www.careeronestop.org.
Developing Occupational Pathways: Talent Destinations
workforce perspective, they are considered ‘destinations.’ None of the selected occupations is
intentional career development pathway that combines experience, the key competencies identified earlier, ongoing skill development, and additional educational certifications or degrees. Each step on the pathway is associated with greater responsibility and higher earnings, and fosters the sense of accomplishment that encourages talented people to achieve more. The charts on the pages that follow were created by the partners to describe various pathways to each of the three critical destination occupations.
Implementation of the Career Pathways ModelThe three diagrams are prototypes of a product that can be oriented to any occupational ‘driver’ or ‘destination.’ The product provides a flexible tool that can be used by business, workforce development, economic development, higher education, and individuals wishing to advance their own careers.
important to the regional talent strategy:
1) businesses identify the critical occupations, the level of demand they have, and the timeline in which demand must be met
2) businesses specify the credentials, skills, experience required—using existing information as a starting point
businesses to implement talent development programs geared to the critical occupation, as well as
The pathways model can also be used by economic developers working with prospective
Next Steps
of the recommendations provided in Section 11.
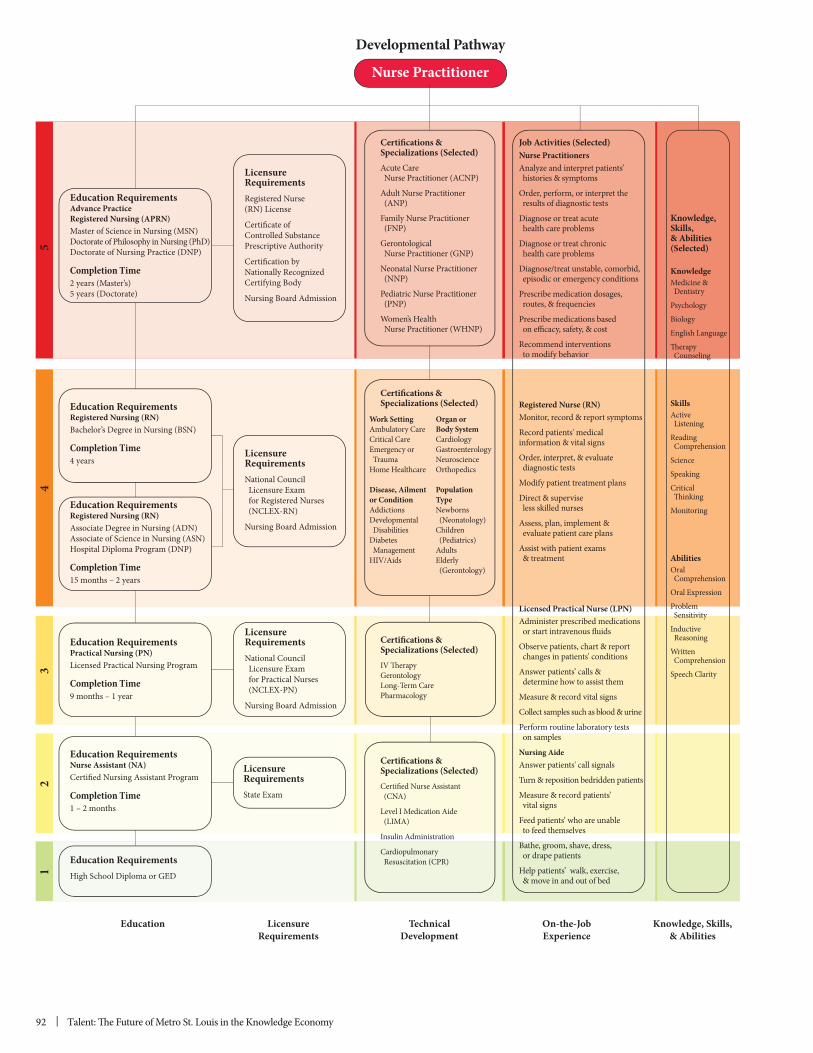
92 | Talent: The Future of Metro St. Louis in the Knowledge Economy
54
32
1
Knowledge, Skills,& Abilities
On-the-JobExperience
TechnicalDevelopment
LicensureRequirements
Nurse Practitioner
Education
Education RequirementsHigh School Diploma or GED
Education RequirementsNurse Assistant (NA)Certified Nursing Assistant Program
Completion Time1 – 2 months
Education RequirementsRegistered Nursing (RN)Associate Degree in Nursing (ADN)Associate of Science in Nursing (ASN)Hospital Diploma Program (DNP)
Completion Time15 months – 2 years
Education RequirementsPractical Nursing (PN)Licensed Practical Nursing Program
Completion Time9 months – 1 year
Education RequirementsRegistered Nursing (RN)Bachelor’s Degree in Nursing (BSN)
Completion Time4 years
Education RequirementsAdvance PracticeRegistered Nursing (APRN)Master of Science in Nursing (MSN)Doctorate of Philosophy in Nursing (PhD)Doctorate of Nursing Practice (DNP)
Completion Time2 years (Master’s)5 years (Doctorate)
LicensureRequirementsState Exam
LicensureRequirementsNational Council Licensure Exam for Practical Nurses (NCLEX-PN)
Nursing Board Admission
LicensureRequirementsNational Council Licensure Exam for Registered Nurses (NCLEX-RN)
Nursing Board Admission
LicensureRequirementsRegistered Nurse(RN) License
Certificate ofControlled SubstancePrescriptive Authority
Certification byNationally RecognizedCertifying Body
Nursing Board Admission
Certifications &Specializations (Selected)Certified Nurse Assistant (CNA)
Level I Medication Aide (LIMA)
Insulin Administration
Cardiopulmonary Resuscitation (CPR)
Certifications &Specializations (Selected)IV TherapyGerontologyLong-Term CarePharmacology
Certifications &Specializations (Selected)
Knowledge,Skills,& Abilities (Selected)
KnowledgeMedicine & Dentistry
Psychology
Biology
English Language
Therapy Counseling
SkillsActive Listening
Reading Comprehension
Science
Speaking
Critical Thinking
Monitoring
AbilitiesOral Comprehension Oral Expression Problem Sensitivity Inductive Reasoning Written Comprehension Speech Clarity
Job Activities (Selected)Nurse PractitionersAnalyze and interpret patients’ histories & symptoms
Order, perform, or interpret the results of diagnostic tests
Diagnose or treat acute health care problems
Diagnose or treat chronic health care problems
Diagnose/treat unstable, comorbid, episodic or emergency conditions
Prescribe medication dosages, routes, & frequencies
Prescribe medications based on efficacy, safety, & cost
Recommend interventions to modify behavior
Registered Nurse (RN)Monitor, record & report symptoms
Record patients' medicalinformation & vital signs
Order, interpret, & evaluate diagnostic tests
Modify patient treatment plans
Direct & supervise less skilled nurses
Assess, plan, implement & evaluate patient care plans
Assist with patient exams & treatment
Licensed Practical Nurse (LPN)Administer prescribed medications or start intravenous fluids Observe patients, chart & report changes in patients' conditions
Answer patients’ calls & determine how to assist them
Measure & record vital signs
Collect samples such as blood & urine
Perform routine laboratory tests on samples
Nursing AideAnswer patients' call signals
Turn & reposition bedridden patients
Measure & record patients’ vital signs Feed patients’ who are unable to feed themselves
Bathe, groom, shave, dress, or drape patients
Help patients’ walk, exercise, & move in and out of bed
Certifications &Specializations (Selected)Acute Care Nurse Practitioner (ACNP)
Adult Nurse Practitioner (ANP)
Family Nurse Practitioner (FNP)
Gerontological Nurse Practitioner (GNP)
Neonatal Nurse Practitioner (NNP)
Pediatric Nurse Practitioner (PNP)
Women’s Health Nurse Practitioner (WHNP)
Organ orBody SystemCardiologyGastroenterologyNeuroscienceOrthopedics
PopulationTypeNewborns (Neonatology)Children (Pediatrics)AdultsElderly (Gerontology)
Work SettingAmbulatory CareCritical CareEmergency or TraumaHome Healthcare
Disease, Ailmentor ConditionAddictions Developmental DisabilitiesDiabetes ManagementHIV/Aids
Developmental Pathway
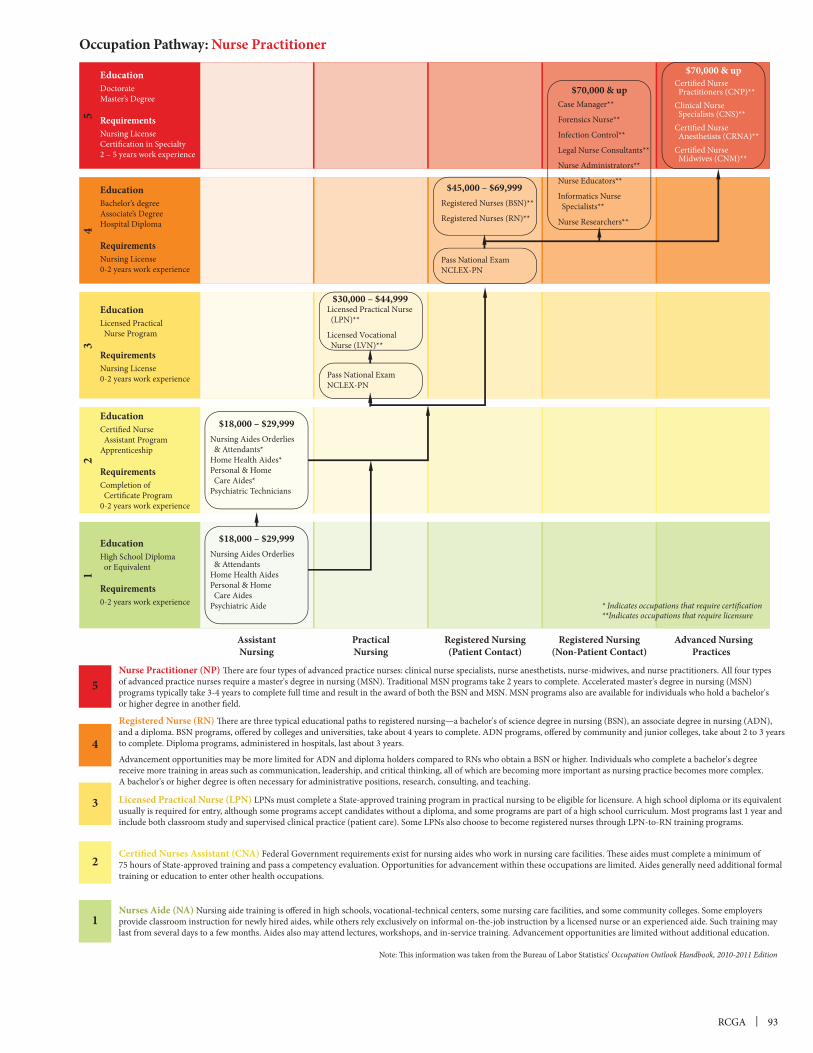
RCGA | 93
CHAPTER 95
12
43
Advanced NursingPractices
Registered Nursing(Non-Patient Contact)
Registered Nursing(Patient Contact)
PracticalNursing
AssistantNursing
Occupation Pathway: Nurse Practitioner
EducationHigh School Diploma or Equivalent
Requirements0-2 years work experience
EducationCertified Nurse Assistant ProgramApprenticeship
RequirementsCompletion of Certificate Program0-2 years work experience
EducationLicensed Practical Nurse Program
RequirementsNursing License0-2 years work experience
EducationBachelor’s degreeAssociate’s DegreeHospital Diploma
RequirementsNursing License0-2 years work experience
EducationDoctorateMaster’s Degree
RequirementsNursing LicenseCertification in Specialty2 – 5 years work experience
Nursing Aides Orderlies & Attendants*Home Health Aides*Personal & Home Care Aides*Psychiatric Technicians
$18,000 – $29,999
Nursing Aides Orderlies & AttendantsHome Health AidesPersonal & Home Care AidesPsychiatric Aide
$18,000 – $29,999
Certified Nurse Practitioners (CNP)**Clinical Nurse Specialists (CNS)**Certified Nurse Anesthetists (CRNA)**Certified Nurse Midwives (CNM)**
$70,000 & up
Case Manager**
Forensics Nurse**
Infection Control**
Legal Nurse Consultants**
Nurse Administrators**
Nurse Educators**
Informatics Nurse Specialists**
Nurse Researchers**
$70,000 & up
Pass National ExamNCLEX-PN
Licensed Practical Nurse (LPN)**
Licensed Vocational Nurse (LVN)**
$30,000 – $44,999
Pass National ExamNCLEX-PN
Registered Nurses (BSN)**
Registered Nurses (RN)**
$45,000 – $69,999
* Indicates occupations that require certification **Indicates occupations that require licensure
1
2
3
4
5
Nurses Aide (NA) Nursing aide training is offered in high schools, vocational-technical centers, some nursing care facilities, and some community colleges. Some employers provide classroom instruction for newly hired aides, while others rely exclusively on informal on-the-job instruction by a licensed nurse or an experienced aide. Such training may last from several days to a few months. Aides also may attend lectures, workshops, and in-service training. Advancement opportunities are limited without additional education.
Certified Nurses Assistant (CNA) Federal Government requirements exist for nursing aides who work in nursing care facilities. These aides must complete a minimum of 75 hours of State-approved training and pass a competency evaluation. Opportunities for advancement within these occupations are limited. Aides generally need additional formal training or education to enter other health occupations.
Licensed Practical Nurse (LPN) LPNs must complete a State-approved training program in practical nursing to be eligible for licensure. A high school diploma or its equivalent usually is required for entry, although some programs accept candidates without a diploma, and some programs are part of a high school curriculum. Most programs last 1 year and include both classroom study and supervised clinical practice (patient care). Some LPNs also choose to become registered nurses through LPN-to-RN training programs.
Registered Nurse (RN) There are three typical educational paths to registered nursing—a bachelor's of science degree in nursing (BSN), an associate degree in nursing (ADN), and a diploma. BSN programs, offered by colleges and universities, take about 4 years to complete. ADN programs, offered by community and junior colleges, take about 2 to 3 years to complete. Diploma programs, administered in hospitals, last about 3 years.
Advancement opportunities may be more limited for ADN and diploma holders compared to RNs who obtain a BSN or higher. Individuals who complete a bachelor's degree receive more training in areas such as communication, leadership, and critical thinking, all of which are becoming more important as nursing practice becomes more complex. A bachelor's or higher degree is often necessary for administrative positions, research, consulting, and teaching.
Nurse Practitioner (NP) There are four types of advanced practice nurses: clinical nurse specialists, nurse anesthetists, nurse-midwives, and nurse practitioners. All four types of advanced practice nurses require a master's degree in nursing (MSN). Traditional MSN programs take 2 years to complete. Accelerated master's degree in nursing (MSN) programs typically take 3-4 years to complete full time and result in the award of both the BSN and MSN. MSN programs also are available for individuals who hold a bachelor's or higher degree in another field.
Note: This information was taken from the Bureau of Labor Statistics’ Occupation Outlook Handbook, 2010-2011 Edition
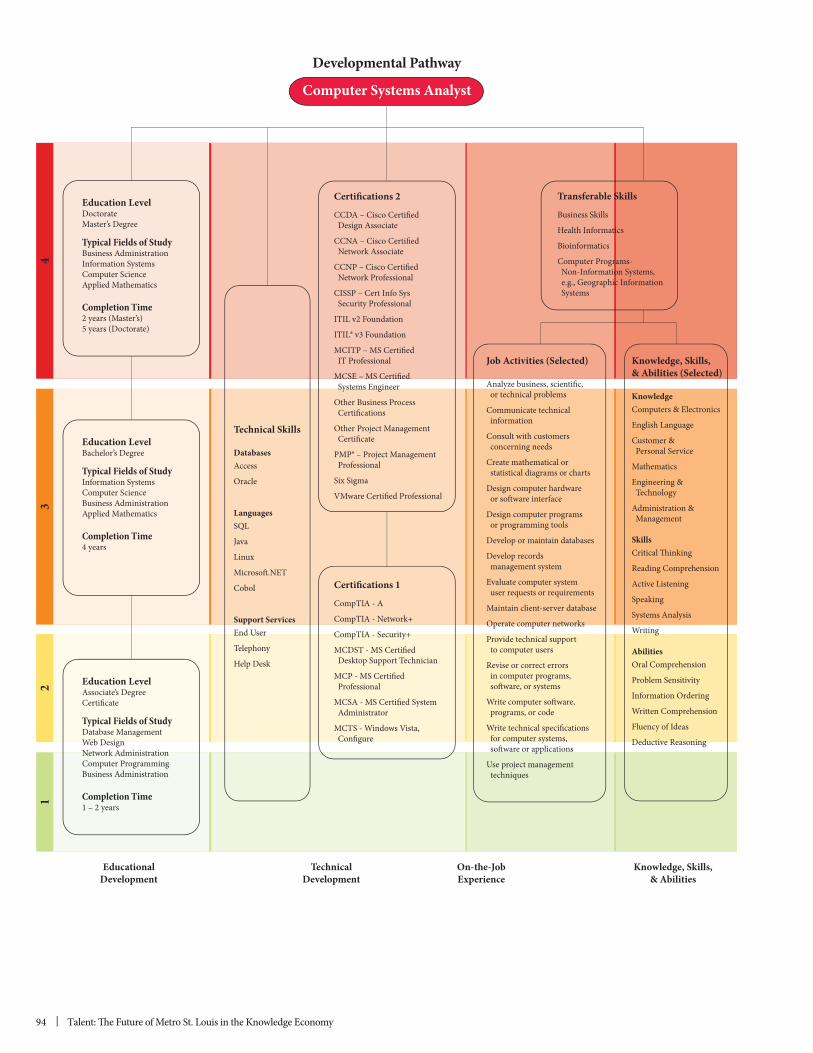
94 | Talent: The Future of Metro St. Louis in the Knowledge Economy
43
21
Knowledge, Skills,& Abilities
On-the-JobExperience
TechnicalDevelopment
EducationalDevelopment
Developmental Pathway
Education LevelAssociate’s DegreeCertificate
Typical Fields of StudyDatabase ManagementWeb DesignNetwork AdministrationComputer ProgrammingBusiness Administration
Completion Time1 – 2 years
Education LevelBachelor’s Degree
Typical Fields of StudyInformation SystemsComputer ScienceBusiness AdministrationApplied Mathematics
Completion Time4 years
Technical Skills
DatabasesAccess
Oracle
LanguagesSQL
Java
Linux
Microsoft.NET
Cobol
Support ServicesEnd User
Telephony
Help Desk
Certifications 1
CompTIA - A
CompTIA - Network+
CompTIA - Security+
MCDST - MS Certified Desktop Support Technician
MCP - MS Certified Professional
MCSA - MS Certified System Administrator
MCTS - Windows Vista, Configure
Certifications 2
CCDA – Cisco Certified Design Associate
CCNA – Cisco Certified Network Associate
CCNP – Cisco Certified Network Professional
CISSP – Cert Info Sys Security Professional
ITIL v2 Foundation
ITIL® v3 Foundation
MCITP – MS Certified IT Professional
MCSE – MS Certified Systems Engineer
Other Business Process Certifications
Other Project Management Certificate
PMP® – Project Management Professional
Six Sigma
VMware Certified Professional
Education LevelDoctorateMaster’s Degree
Typical Fields of StudyBusiness AdministrationInformation SystemsComputer ScienceApplied Mathematics
Completion Time2 years (Master’s)5 years (Doctorate)
Computer Systems Analyst
Transferable Skills
Business Skills
Health Informatics
Bioinformatics
Computer Programs- Non-Information Systems, e.g., Geographic Information Systems
Knowledge, Skills,& Abilities (Selected)
KnowledgeComputers & Electronics
English Language
Customer & Personal Service
Mathematics
Engineering & Technology
Administration & Management
Skills Critical Thinking
Reading Comprehension
Active Listening
Speaking
Systems Analysis
Writing
AbilitiesOral Comprehension
Problem Sensitivity
Information Ordering
Written Comprehension
Fluency of Ideas
Deductive Reasoning
Job Activities (Selected)
Analyze business, scientific, or technical problems
Communicate technical information
Consult with customers concerning needs
Create mathematical or statistical diagrams or charts
Design computer hardware or software interface
Design computer programs or programming tools
Develop or maintain databases
Develop records management system
Evaluate computer system user requests or requirements
Maintain client-server database
Operate computer networks
Provide technical support to computer users
Revise or correct errors in computer programs, software, or systems
Write computer software, programs, or code
Write technical specifications for computer systems, software or applications
Use project management techniques
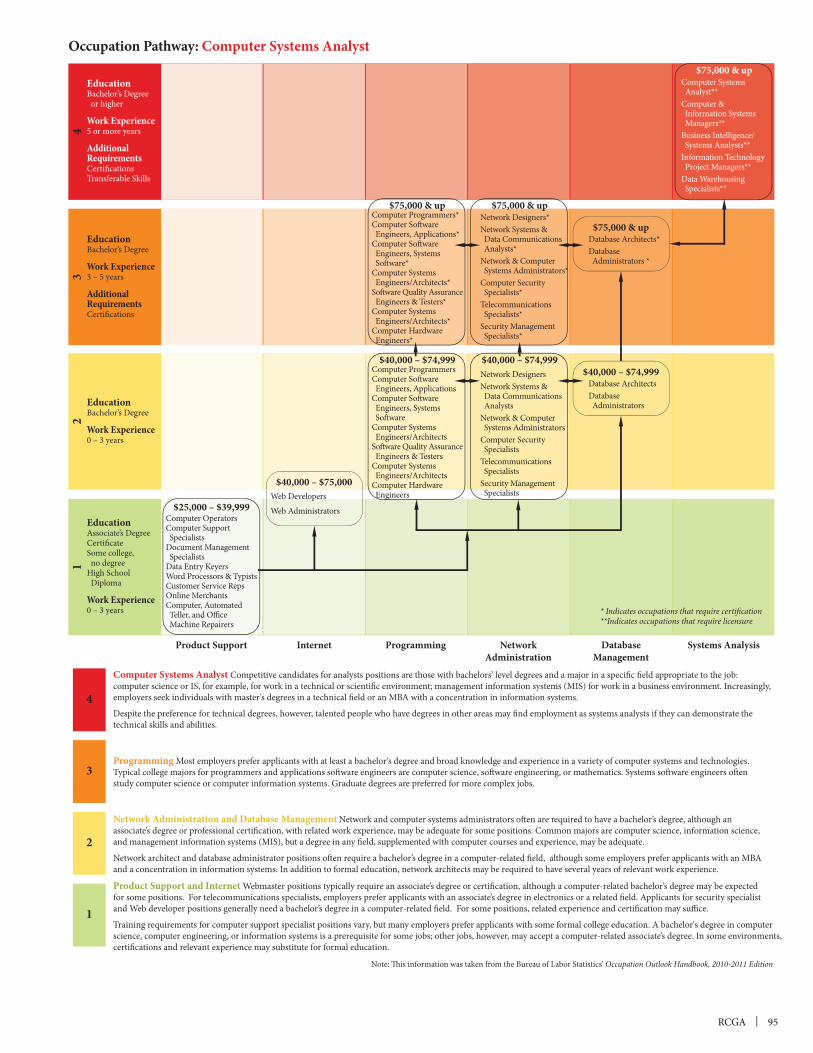
RCGA | 95
CHAPTER 94
32
Systems AnalysisDatabaseManagement
NetworkAdministration
ProgrammingInternetProduct Support
Occupation Pathway: Computer Systems Analyst
EducationAssociate’s DegreeCertificateSome college, no degreeHigh School Diploma
Work Experience0 – 3 years
EducationBachelor’s Degree
Work Experience0 – 3 years
EducationBachelor’s Degree
Work Experience3 – 5 years
AdditionalRequirementsCertifications
EducationBachelor’s Degree or higher
Work Experience5 or more years
Additional RequirementsCertificationsTransferable Skills
Computer OperatorsComputer Support SpecialistsDocument Management SpecialistsData Entry KeyersWord Processors & TypistsCustomer Service RepsOnline MerchantsComputer, Automated Teller, and Office Machine Repairers
$25,000 – $39,999
Network Designers*Network Systems & Data Communications Analysts*Network & Computer Systems Administrators*Computer Security Specialists*Telecommunications Specialists*Security Management Specialists*
$75,000 & up
Network DesignersNetwork Systems & Data Communications AnalystsNetwork & Computer Systems Administrators Computer Security SpecialistsTelecommunications SpecialistsSecurity Management Specialists
$40,000 – $74,999
* Indicates occupations that require certification **Indicates occupations that require licensure
1
2
3
4
Product Support and Internet Webmaster positions typically require an associate’s degree or certification, although a computer-related bachelor’s degree may be expected for some positions. For telecommunications specialists, employers prefer applicants with an associate’s degree in electronics or a related field. Applicants for security specialist and Web developer positions generally need a bachelor’s degree in a computer-related field. For some positions, related experience and certification may suffice.
Training requirements for computer support specialist positions vary, but many employers prefer applicants with some formal college education. A bachelor's degree in computer science, computer engineering, or information systems is a prerequisite for some jobs; other jobs, however, may accept a computer-related associate’s degree. In some environments, certifications and relevant experience may substitute for formal education.
Network Administration and Database Management Network and computer systems administrators often are required to have a bachelor’s degree, although an associate’s degree or professional certification, with related work experience, may be adequate for some positions. Common majors are computer science, information science, and management information systems (MIS), but a degree in any field, supplemented with computer courses and experience, may be adequate.
Network architect and database administrator positions often require a bachelor’s degree in a computer-related field, although some employers prefer applicants with an MBA and a concentration in information systems. In addition to formal education, network architects may be required to have several years of relevant work experience.
Programming Most employers prefer applicants with at least a bachelor's degree and broad knowledge and experience in a variety of computer systems and technologies. Typical college majors for programmers and applications software engineers are computer science, software engineering, or mathematics. Systems software engineers often study computer science or computer information systems. Graduate degrees are preferred for more complex jobs.
Computer Systems Analyst Competitive candidates for analysts positions are those with bachelors’ level degrees and a major in a specific field appropriate to the job: computer science or IS, for example, for work in a technical or scientific environment; management information systems (MIS) for work in a business environment. Increasingly, employers seek individuals with master's degrees in a technical field or an MBA with a concentration in information systems.
Despite the preference for technical degrees, however, talented people who have degrees in other areas may find employment as systems analysts if they can demonstrate the technical skills and abilities.
1
Web DevelopersWeb Administrators
$40,000 – $75,000
Computer Programmers*Computer Software Engineers, Applications*Computer Software Engineers, Systems Software*Computer Systems Engineers/Architects*Software Quality Assurance Engineers & Testers*Computer Systems Engineers/Architects*Computer Hardware Engineers*
$75,000 & up
Computer ProgrammersComputer Software Engineers, ApplicationsComputer Software Engineers, Systems SoftwareComputer Systems Engineers/ArchitectsSoftware Quality Assurance Engineers & Testers Computer Systems Engineers/Architects Computer Hardware Engineers
$40,000 – $74,999
Database Architects Database Administrators
$40,000 – $74,999
Database Architects*Database Administrators *
$75,000 & up
Computer Systems Analyst**Computer & Information Systems Managers**Business Intelligence/ Systems Analysts**Information Technology Project Managers**Data Warehousing Specialists**
$75,000 & up
Note: This information was taken from the Bureau of Labor Statistics’ Occupation Outlook Handbook, 2010-2011 Edition
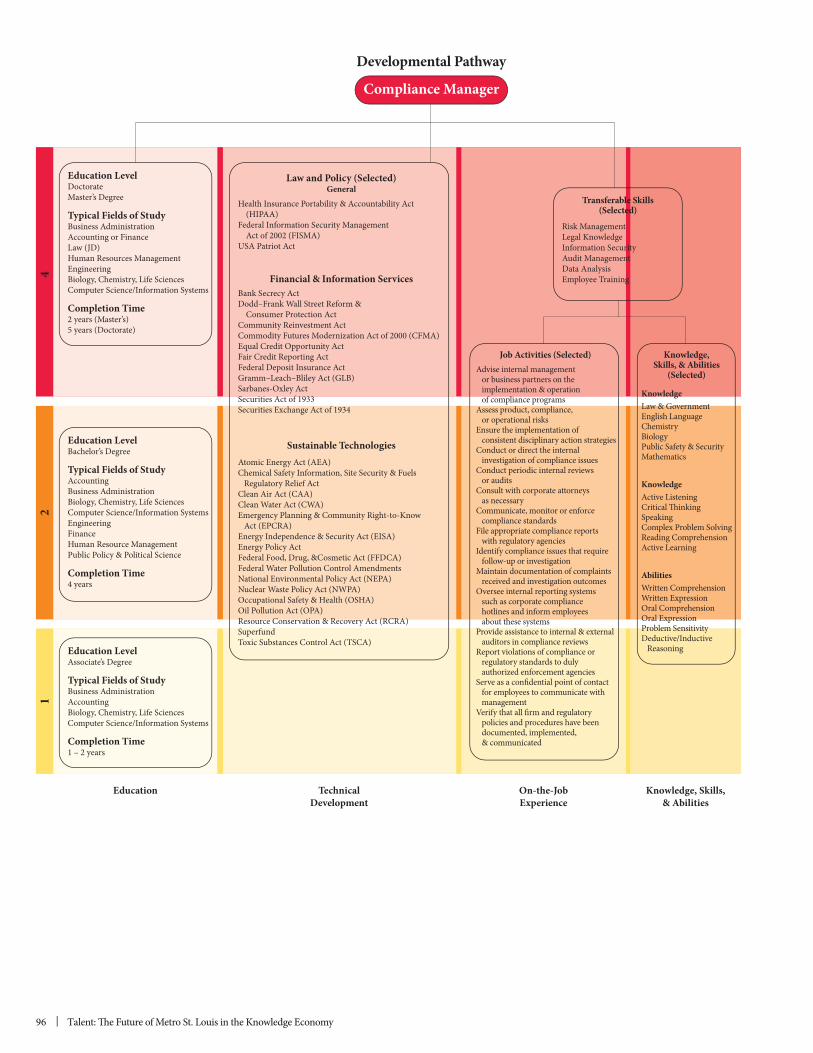
96 | Talent: The Future of Metro St. Louis in the Knowledge Economy
42
1
Knowledge, Skills,& Abilities
On-the-JobExperience
TechnicalDevelopment
Compliance Manager
Education
Atomic Energy Act (AEA)Chemical Safety Information, Site Security & Fuels Regulatory Relief ActClean Air Act (CAA)Clean Water Act (CWA) Emergency Planning & Community Right-to-Know Act (EPCRA)Energy Independence & Security Act (EISA)Energy Policy ActFederal Food, Drug, &Cosmetic Act (FFDCA)Federal Water Pollution Control Amendments National Environmental Policy Act (NEPA)Nuclear Waste Policy Act (NWPA)Occupational Safety & Health (OSHA)Oil Pollution Act (OPA)Resource Conservation & Recovery Act (RCRA)SuperfundToxic Substances Control Act (TSCA)
Sustainable Technologies
Bank Secrecy ActDodd–Frank Wall Street Reform & Consumer Protection Act Community Reinvestment ActCommodity Futures Modernization Act of 2000 (CFMA) Equal Credit Opportunity ActFair Credit Reporting ActFederal Deposit Insurance Act Gramm–Leach–Bliley Act (GLB) Sarbanes-Oxley ActSecurities Act of 1933Securities Exchange Act of 1934
Financial & Information Services
Health Insurance Portability & Accountability Act (HIPAA) Federal Information Security Management Act of 2002 (FISMA)USA Patriot Act
Risk ManagementLegal KnowledgeInformation Security Audit ManagementData AnalysisEmployee Training
Education LevelDoctorateMaster’s Degree Typical Fields of StudyBusiness AdministrationAccounting or FinanceLaw (JD)Human Resources Management EngineeringBiology, Chemistry, Life SciencesComputer Science/Information Systems
Completion Time2 years (Master’s)5 years (Doctorate)
Education LevelBachelor’s Degree Typical Fields of StudyAccounting Business AdministrationBiology, Chemistry, Life SciencesComputer Science/Information SystemsEngineeringFinanceHuman Resource Management Public Policy & Political Science
Completion Time4 years
Education LevelAssociate’s Degree Typical Fields of StudyBusiness AdministrationAccounting Biology, Chemistry, Life SciencesComputer Science/Information Systems
Completion Time1 – 2 years
KnowledgeLaw & GovernmentEnglish LanguageChemistry BiologyPublic Safety & SecurityMathematics
KnowledgeActive ListeningCritical ThinkingSpeaking Complex Problem SolvingReading ComprehensionActive Learning
AbilitiesWritten ComprehensionWritten ExpressionOral ComprehensionOral ExpressionProblem Sensitivity Deductive/Inductive Reasoning
Advise internal management or business partners on the implementation & operation of compliance programs Assess product, compliance, or operational risks Ensure the implementation of consistent disciplinary action strategies Conduct or direct the internal investigation of compliance issues Conduct periodic internal reviews or audits Consult with corporate attorneys as necessary Communicate, monitor or enforce compliance standards File appropriate compliance reports with regulatory agencies Identify compliance issues that require follow-up or investigation Maintain documentation of complaints received and investigation outcomes Oversee internal reporting systems such as corporate compliance hotlines and inform employees about these systems Provide assistance to internal & external auditors in compliance reviews Report violations of compliance or regulatory standards to duly authorized enforcement agencies Serve as a confidential point of contact for employees to communicate with management Verify that all firm and regulatory policies and procedures have been documented, implemented, & communicated
Developmental Pathway
Law and Policy (Selected)General
Job Activities (Selected) Knowledge,Skills, & Abilities
(Selected)
Transferable Skills(Selected)
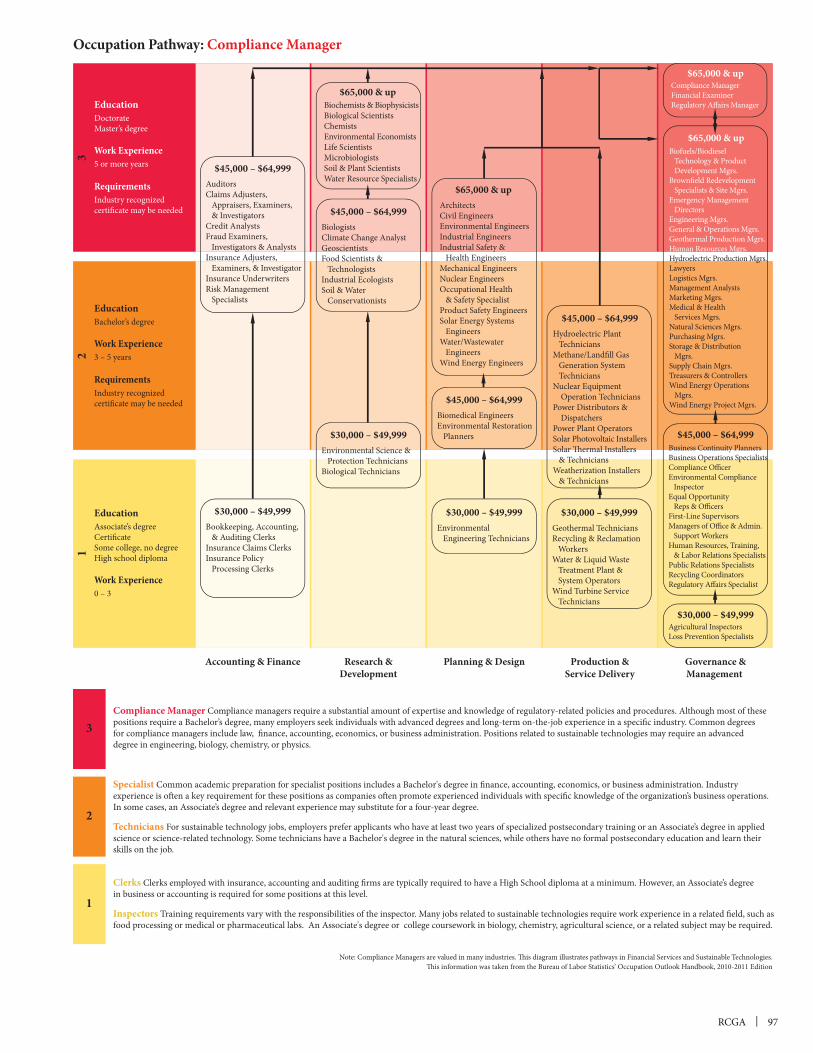
RCGA | 97
CHAPTER 91
EducationAssociate’s degreeCertificateSome college, no degreeHigh school diploma
Work Experience0 – 3
2
EducationBachelor’s degree
Work Experience3 – 5 years
RequirementsIndustry recognizedcertificate may be needed
3
EducationDoctorateMaster’s degree
Work Experience5 or more years
RequirementsIndustry recognizedcertificate may be needed
Governance &Management
Production &Service Delivery
Planning & DesignResearch &Development
Accounting & Finance
Occupation Pathway: Compliance Manager
AuditorsClaims Adjusters, Appraisers, Examiners, & InvestigatorsCredit AnalystsFraud Examiners, Investigators & AnalystsInsurance Adjusters, Examiners, & InvestigatorInsurance UnderwritersRisk Management Specialists
$45,000 – $64,999
Environmental Science & Protection Technicians Biological Technicians
$30,000 – $49,999
Bookkeeping, Accounting, & Auditing ClerksInsurance Claims ClerksInsurance Policy Processing Clerks
$30,000 – $49,999
$65,000 & up
Biochemists & Biophysicists Biological ScientistsChemistsEnvironmental EconomistsLife ScientistsMicrobiologistsSoil & Plant ScientistsWater Resource Specialists
$65,000 & up
ArchitectsCivil Engineers Environmental EngineersIndustrial Engineers Industrial Safety & Health EngineersMechanical EngineersNuclear EngineersOccupational Health & Safety SpecialistProduct Safety EngineersSolar Energy Systems EngineersWater/Wastewater Engineers Wind Energy Engineers
$65,000 & up
3
1
2
Clerks Clerks employed with insurance, accounting and auditing firms are typically required to have a High School diploma at a minimum. However, an Associate’s degree in business or accounting is required for some positions at this level. Inspectors Training requirements vary with the responsibilities of the inspector. Many jobs related to sustainable technologies require work experience in a related field, such as food processing or medical or pharmaceutical labs. An Associate's degree or college coursework in biology, chemistry, agricultural science, or a related subject may be required.
Specialist Common academic preparation for specialist positions includes a Bachelor's degree in finance, accounting, economics, or business administration. Industry experience is often a key requirement for these positions as companies often promote experienced individuals with specific knowledge of the organization’s business operations. In some cases, an Associate’s degree and relevant experience may substitute for a four-year degree.
Technicians For sustainable technology jobs, employers prefer applicants who have at least two years of specialized postsecondary training or an Associate’s degree in applied science or science-related technology. Some technicians have a Bachelor's degree in the natural sciences, while others have no formal postsecondary education and learn their skills on the job.
Compliance Manager Compliance managers require a substantial amount of expertise and knowledge of regulatory-related policies and procedures. Although most of these positions require a Bachelor’s degree, many employers seek individuals with advanced degrees and long-term on-the-job experience in a specific industry. Common degrees for compliance managers include law, finance, accounting, economics, or business administration. Positions related to sustainable technologies may require an advanced degree in engineering, biology, chemistry, or physics.
This information was taken from the Bureau of Labor Statistics’ Occupation Outlook Handbook, 2010-2011 EditionNote: Compliance Managers are valued in many industries. This diagram illustrates pathways in Financial Services and Sustainable Technologies.
BiologistsClimate Change AnalystGeoscientistsFood Scientists & TechnologistsIndustrial EcologistsSoil & Water Conservationists
$45,000 – $64,999
Geothermal TechniciansRecycling & Reclamation Workers Water & Liquid Waste Treatment Plant & System OperatorsWind Turbine Service Technicians
$30,000 – $49,999
Business Continuity PlannersBusiness Operations SpecialistsCompliance OfficerEnvironmental Compliance InspectorEqual Opportunity Reps & OfficersFirst-Line SupervisorsManagers of Office & Admin. Support WorkersHuman Resources, Training, & Labor Relations SpecialistsPublic Relations SpecialistsRecycling Coordinators Regulatory Affairs Specialist
$45,000 – $64,999
Agricultural InspectorsLoss Prevention Specialists
$30,000 – $49,999
Environmental Engineering Technicians
$30,000 – $49,999
Biomedical EngineersEnvironmental Restoration Planners
$45,000 – $64,999
Hydroelectric Plant TechniciansMethane/Landfill Gas Generation System TechniciansNuclear Equipment Operation TechniciansPower Distributors & DispatchersPower Plant OperatorsSolar Photovoltaic InstallersSolar Thermal Installers & TechniciansWeatherization Installers & Technicians
$45,000 – $64,999
Compliance ManagerFinancial ExaminerRegulatory Affairs Manager
Biofuels/Biodiesel Technology & Product Development Mgrs.Brownfield Redevelopment Specialists & Site Mgrs.Emergency Management DirectorsEngineering Mgrs.General & Operations Mgrs.Geothermal Production Mgrs.Human Resources Mgrs.Hydroelectric Production Mgrs. LawyersLogistics Mgrs. Management AnalystsMarketing Mgrs. Medical & Health Services Mgrs.Natural Sciences Mgrs. Purchasing Mgrs.Storage & Distribution Mgrs.Supply Chain Mgrs. Treasurers & ControllersWind Energy Operations Mgrs. Wind Energy Project Mgrs.
$65,000 & up
98 | Talent: The Future of Metro St. Louis in the Knowledge Economy
______________
Disrupting College: How Disruptive Innovation Can Deliver Quality and Affordability to Postsecondary Education. February 2011
2. Moody’s Analytics, Feb 2011. Page 92
3. St. Louis RCGA. The Competencies of a High-Performing Workforce: Findings from a Survey of St. Louis Area HR Professionals. 2011
4. James J. Duderstadt. A Master Plan for Higher Education in the Midwest: A Roadmap to the Future of the Nation’s Heartland. Chicago Council on Global Affairs. March 2011. Page 9
a bachelor’s degree and graduate or professional degree.
6. David Autor. The Polarization of Job Opportunities in the U.S. Labor Market: Implications for Employment and Earnings. Center for American Progress and The Hamilton Project. April 2010. Page 5
7. Anthony P. Carnevale, Jeff Strohl, Michelle Melton. What’s It Worth? The Economic Value of College Majors. Georgetown
http://www.bls.gov/cps/data.htm,
http://www.bls.gov/opub/gp/gpsec2.htm
9. National Skills Coalition. America’s Forgotten Middle Skill Jobs. 2007
March 2009
2008, http://www.bls.gov/emp/ep_table_111.htm ; “Metropolitan and Nonmetropolitan Area Occupational Employment and
Research and Information Center (MERIC) http://www.missourieconomy.org/occupations/occ_proj.stm. Note: For the
and Information Center. MERIC assigns ratings to occupations based on anticipated levels of growth, openings, and wages.
12. Ibid
16. Anthony P. Carnevale, Jeff Strohl, Michelle Melton. What’s It Worth? The Economic Value of College Majors. Georgetown
17. “College Navigator,” National Center for Education Statistics, http://nces.ed.gov/ipeds/cool/index.aspx. Note: Degrees Awarded reflect data from the 2008-2009 school year. Data for Columbia College, St. Louis University and Webster University were obtained from these organizations.
18. “College Navigator,” National Center for Education Statistics, http://nces.ed.gov/ipeds/cool/index.aspx.
RCGA | 99
CHAPTER 9
19. College Navigator, National Center for Educational Statistics. Map prepared by the St. Louis RCGA.
21. Ibid.
Returning to Learning: Adults’ Success in College is Key to America’s Future. Lumina Foundation for Degree Completion Beyond Institutional Borders:
Responding to the New Reality of Mobile and Nontraditional Learners. Center for American Progress and the Council for Adult and Experiential Learning. 2010.
23. Comments by Clifford Adelman, Institute for Higher Education Policy, March 2011
Disrupting College: How Disruptive Innovation Can Deliver Quality and Affordability to Postsecondary Education. February 2011
Note: The report provides enrollment weighted average prices.
New York Times. May 14, 2011
27. American Council of Trustees and Alumni. What will they learn? A Report on the General Education Requirements at 100 of the Nation’s Leading Colleges and Universities. 2009. https://www.goacta.org/publications/downloads/
People & Strategy, The Journal of the Human Resource Planning Society. Volume 31, Issue 4. 2008
Resource Management. Are They Really Ready to Work? Employers’ Perspectives on the Basic Knowledge and Applied Skills of New Entrants to the 21st Century U.S
Skills Gap: The Ill-Prepared Workforce, August 2010
31. St. Louis RCGA. The Competencies of a High-Performing Workforce: Findings from a Survey of St. Louis Area HR Professionals.
Time. May 25, 2009
33. Peter Cappelli. Talent on Demand: Managing Talent in an Age of Uncertainty
Pennsylvania. February 20, 2008
Emerging Occupations for that sector. These criteria being satisfied, the list of occupations was further narrowed to encompass
on the original menus.
100 | Talent: The Future of Metro St. Louis in the Knowledge Economy
Leveraging Resources: The Importance of Partnerships
Background
secondary education and skill development in the St. Louis metro area annually. However, no comprehensive catalogue is available and no coordinated strategy exists to allow St. Louis to gauge the effectiveness of these investments in relationship to the broad economic goals identified in Section 3.
This section provides a general summary of current public and private sector funding streams—all of which are fluid and subject to change in this time of resource uncertainty and fiscal restraint. The successful implementation of the recommendations presented in Section 11 of this report will require significant leveraging of public and private sector efforts—including funding—in ways that have not been customary in the past.
Public Funding for Post-Secondary Education and Skill DevelopmentLocal and State FinancingSt. Louis area taxpayers may be most familiar with the public’s investment in higher education through
local property and state taxes. Their fiscal needs and challenges are often described and debated in the press.
Recession, state and local public funding for higher education was compromised. The immediate sting of lost revenue was mitigated somewhat by federal American Recovery and Reinvestment Act (“stimulus”) funds in 2010, but this was a temporary respite. Across the nation, public universities took steps to cap enrollment and raise tuition. According to the Higher Education Strategy Association,
2009/10 and 2010/11 and out of state tuition fees increased by 6 percent in the same period.”1 News items from St. Louis area media report that some public educational institutions also reduced staff levels and eliminated least popular degree programs. The State of Missouri provides assistance directly to students through the Missouri Higher Education Loan Authority (MOHELA), a traditional secondary market lender and servicer that works
which was reduced in 2010 due to a shortfall in state revenues.
10
RCGA | 101
CHAPTER 10
Federal Financial Assistance for Post-Secondary StudentsThe federal government provides financial assistance to qualifying students pursuing education
expects the annual demand for Pell grants to reach 9.6 million in 2012, up from 6 million in 2008.2 Student choice is a priority in federal programs, and individuals with Pell grants or other forms of aid authorized under Title IV of the Higher Education Opportunities Act can attend accredited
explosion in enrollments in recent years, including a considerable number of students receiving federal financial assistance. Some—by no means all—of these proprietary schools appear to have engaged in
data to assure that public funds were used for the intended purpose. The percentage of students who began repayment of loans in 2008 and defaulted within three
and 7.6 percent among those in private institutions.3
accountable for preparing students for “gainful employment.”
Federal Funding and the Workforce Investment ActThe federal government provides funding for job training and development through numerous departments, including Agriculture, Commerce, Defense, Education, Energy, Health and Human
Administration, National Science Foundation, and more.4
administers 62 specific funding and technical assistance programs including formula grants, project
designated programs at the state and local level for the benefit of individual and business customers.

102 | Talent: The Future of Metro St. Louis in the Knowledge Economy
State and Local Partnerships Under the Workforce Investment ActIn 2010, the State of Missouri and the local boards “implemented the most significant change in Missouri’s Career Center System in a generation” with Next Generation Career Centers designed
and streamline service delivery processes.5 These changes enabled the Centers to manage an unprecedented level of demand during the Recession. The Next Gen system also strengthens the State’s commitment to accountability and results. Accountability pertains not only to the system itself, but its customer groups. Community College partners, for example, are putting greater emphasis on ‘stackable credentials’ of value to employers
services.
services such as job search and placement assistance and useful labor market information to all job
them with the information they need to develop the knowledge, skills and abilities sought after in the new economy.” The ability to deliver on this commitment was tested during the Recession, when thousands of individuals of all education and skill levels came into the system for assistance for the first time. The Missouri Career Centers in the St. Louis area established innovative partnerships with the
technology tools and platforms to provide useful information to a broader customer base. Through these partnerships, the Career Centers:
economy
the same field in which they had considerable experience
by addressing deficits in applied skills unique to industry clusters.
These changes had a positive impact: a 2011 survey of 397 professionals in career transition conducted as background for this report found that displaced workers of all educational levels were familiar with the Career Center system and valued the information that was made available to them. The survey respondents identified some areas for continuing improvement—including a need for more timely and individualized service. Nonetheless, the survey results indicate that the Career Centers are making good progress toward serving a more economically diverse population.6
RCGA | 103
CHAPTER 10
State and Local WIA Partners Serving Business
reaffirmed their commitment to serving business needs through a variety of programs, including recruitment assistance to help existing companies and those new to the area meet their labor needs. In the St. Louis metro area, an important new development was the 2011 execution of a Memorandum of
consistent way.
Private Sector Funding for Post-Secondary Education and Skill DevelopmentBusiness-Sponsored Education
may not be widely recognized outside the business community. Research undertaken by the Lumina Foundation for Education concludes that “business and industry drive workforce training, providing
employees in 2004.”7
In 2007, PricewaterhouseCoopers Saratoga conducted a human capital performance study for
people participated in the study. The results quantified the median annual investment in learning and development for each employee as $612—higher than the median of $513 for companies in PwC Saratoga’s national database. This sums to a total 2007 investment of $183.6 million from the 25 St. Louis area companies alone.8 If the pattern in St. Louis area companies is consistent with national practice, much of this money was invested in courses that do not result in credit that can be transferred toward a degree at an
for license examinations, to upgrade job skills, to retrain for new occupations and to provide training classes customized for a particular industry.”9 Some states are implementing learning assessment tools
The absence of more current information makes it impossible to accurately gauge the impact of the Great Recession on company spending for employee development. There are signs that companies are using technology to do more with less, however. A 2010 national survey by the Society for Human Resource Management reports that 29 percent of HR respondents have decreased their training budgets due to technology changes, while 28 percent said that they have increased training “due to
10
Employer Assistance for College Tuition The learning and development expenditures identified in the PwC Saratoga study do not include dollars spent by companies on college assistance and tuition reimbursement. The study found that approximately 3.3 percent of employees in the 25 participating St. Louis area firms were enrolled in employer tuition assistance programs—slightly lower than the national percentage of 4.3 percent.
104 | Talent: The Future of Metro St. Louis in the Knowledge Economy
A survey of companies conducted by the St. Louis RCGA early in 2010 identified 49 companies that are providing some form of tuition assistance for employees enrolled in college. Employees from two of these companies who participated in focus groups convened by the RCGA in preparation for this report indicated that the availability of college help was a positive factor influencing their decision to work at that company.
Private Scholarships
scholarships in the St. Louis metro area. These are sponsored by a range of entities, including
A database with eligibility criteria and other information about all 164 programs is available at www.capstl.org.
Costs Paid by StudentsStudents carry most of the responsibility for paying for education after high school and, with the cost of college rising and levels of outside support declining, financial barriers have become a major impediment for many.11 A 2011 survey by the Pew Research Center reports that 48 percent of adults
12
in 2008. Almost half of respondents said that college debt obligations made it more difficult for them to pay other bills. One quarter said they had changed their career plans because of it.
Lifelong Learning Accounts
education that is being used in several states, including parts of Missouri. Designed and piloted by
13 They are savings accounts in participating commercial banks, with resources dedicated to a specific educational goal. The
amount is matched by the individual’s employer and, possibly, third parties. LILAs have the benefit of shared responsibility for funding higher education, relieving any one party of the total burden.
Going Forward
and sustain the resource infrastructure necessary to meet its talent and economic development goals.
RCGA | 105
CHAPTER 10
______________
Tuition Fees and Student Financial Assistance: 2010 Global Year in Review. Higher Education Strategy Associates. February 2011. www.higheredstrategy.com
Reform and Innovation, Teachers and Leaders, and College Completion.” Press release, February 14, 2011. www.ed.gov
Wall Street Journal. February 4, 2011.
4. See the Catalogue of Federal Domestic Assistance at www.cfda.org for a complete and current listing.
2010 Annual Report. https://worksmart.ded.mo.gov.
6. For a full report of the survey results, see St. Louis RCGA. “Perspectives of St. Louis Area Professionals Changing Careers in a Turbulent Economy. May 2011.
Returning to Learning: Adults’ Success in College is Key to America’s Future. Lumina Foundation for Education, 2007. Page 13.
January 2008.
9. Returning to Learning.
10. Society for Human Resource Management. Workplace Forecast: The Top Workplace Trends According to HR Professionals. February 2011. Page 22.
11. See Section 9 for detailed information about the rising cost of college tuition and fees.
13. See http://www.lifelonglearningaccounts.org/
106 | Talent: The Future of Metro St. Louis in the Knowledge Economy
Recommendations
IntroductionThe preceding pages set the stage for a new approach to talent development in metro St. Louis. The underlying principles have been described and discussed throughout. They stress that an effective talent strategy must be closely aligned with the region’s economic development objectives and that it
partnership with the public sector and engaging hundreds of stakeholders in the future of the region’s workforce. The past 12 months have been a time of much data gathering and analysis, with interim findings shared and discussed with the community at milestones along the way. For that reason, there are no surprises to announce in this final chapter. To implement the talent strategy, we recommend the following initial steps. Broaden Regional Engagement in Talent DevelopmentThe planning partners will circulate this research document and the supplemental reports broadly in the regional community.
work that they do, and take action.
with the recommendation that the analysis contained here is a good starting point for next steps in implementation of the Greater St. Louis Economic Development Plan.
presented, and we welcome opportunities to engage with other stakeholders to expand and enhance the talent strategy.
Implement the New Framework for Regional Talent Development The following recommendations are intended to establish the foundation for the New Framework for Regional Talent Development presented in Section 9. The RCGA Talent Council will continue to work with public and private sector partners to advocate and encourage these activities.
1. Great Talent is Prepared to Work: The Importance of Post-Secondary Credentials
11
RCGA | 107
CHAPTER 11
region that are working to improve college completion rates for the purpose of sharing ideas, information, best practices and leveraging stronger outcomes
focus on those who started college but did not finish
particular attention to occupations in the economic clusters targeted in this plan.
2. Great Talent is Equipped to Perform: Five Competencies Employers Value Most
understanding of the five workforce competencies identified in this report
but who may not have Human Resource capacity
of workforce diversity.
3. Great Talent is Positioned to Advance: Pathways Linking Individual and Business Success
together to:
clusters, including jobs to be created through existing pipeline projects, using the process put forth in this document
development function
demand, skill and credential requirements, and career pathway opportunities relevant to the targeted economic clusters. Advocate a career pathways orientation for all workforce system customers. $

108 | Talent: The Future of Metro St. Louis in the Knowledge Economy
Notes and New Ideas _____________________________________________________________________
________________________________________________________________________________________
________________________________________________________________________________________
________________________________________________________________________________________
________________________________________________________________________________________
________________________________________________________________________________________
________________________________________________________________________________________
________________________________________________________________________________________
________________________________________________________________________________________
________________________________________________________________________________________
________________________________________________________________________________________
________________________________________________________________________________________
________________________________________________________________________________________
________________________________________________________________________________________
________________________________________________________________________________________
________________________________________________________________________________________
________________________________________________________________________________________
________________________________________________________________________________________
________________________________________________________________________________________
________________________________________________________________________________________
________________________________________________________________________________________
________________________________________________________________________________________
________________________________________________________________________________________
________________________________________________________________________________________
________________________________________________________________________________________
________________________________________________________________________________________

RCGA | 109
CHAPTER 11
Design: Peggy Nehmen, n-kcreative.com
Today, talent development is everyone’s business.

www.stlrcga.org314-231-5555