tallinn university school of digital technologies this master thesis focuses on the distributed user...
TRANSCRIPT

Tallinn University
School of Digital Technologies
Assessing the Expressiveness of the Distributed User
Interface Pattern Language
Master Thesis
Amir Zare Pashaei
Author: ”. . . . . . . . . . .” . . . . . . . . . . . . . . . . . . . . . . . . . . . . . . . . . . . . . . . . . . . .Supervisor: ”. . . . . . . . . . .” . . . . . . . . . . . . . . . . . . . . . . . . . . . . . . . . . . . . . . . . . . . .Supervisor: ”. . . . . . . . . . .” . . . . . . . . . . . . . . . . . . . . . . . . . . . . . . . . . . . . . . . . . . . .Head of the School: ”. . . . . . . . . . .” . . . . . . . . . . . . . . . . . . . . . . . . . . . . . . . . . . . . . . . . . . . .
Spring 2017

Abstract
This Master thesis focuses on the distributed user interface (DUI) pattern language - a
collection of patterns that aid HCI researchers and practitioners in the design of interfaces
that span across multiple devices. The purpose of this thesis is to determine whether the
pattern language is useful for analysing existing DUIs. The current pattern language
(which includes DUI patterns with descriptions related to each pattern) needs to be
assessed because the descriptions of patterns are based on the review of literature and the
understanding of the person who compiled the pattern language. This pattern language
has not been tested with external Human-Computer Interaction (HCI) researchers and
practitioners engaged in designing and developing DUIs as part of their everyday work.
For achieving the goal of the thesis, a combination of different methodologies was used.
A rating exercise and a survey were conducted. The rating exercise was conducted to
measure the level of reliability/agreement among the HCI experts. This level of agreement
is measured by using the Intra-class correlation coefficient (ICC). To get additional insights
about the usage of the pattern language for assessing existing DUIs, the following tools
were used: (1) NASA task load index for assessing the amount of perceived workload,
and (2) an open-ended follow-up questionnaire for collecting thorough feedback about
the pattern language from HCI experts. The purpose of the follow-up questionnaire was
to understand what needs to be improved in the pattern language, and what are the
most valuable features in the pattern language for the HCI experts in order to help them
analyse existing DUIs.
The outcomes of the rating exercise, the NASA-TLX values, and answers to the ques-
tionnaire suggest that the DUI pattern language in its current form can indeed be used
to support the analysis of existing DUIs without requiring significant cognitive effort and
causing excessive frustration.
Keywords: Distributed user interfaces, design patterns, pattern language, cross-device
interactions, interaction design
i

Non-exclusive licence to reproduce a thesis and make thesis available to public
I, (name of author) Amir Zare Pashaei (date of birth: 26.04.1990 )
1. grant Tallinn University a permit ( a non-exclusive licence) to reproduce for free and make
public in the repository of Tallinn University Academic Library a piece of work created by
me
Assessing the Expressiveness of the Distributed User Interface Pattern Language,
(title of thesis)
supervised by Ilja Šmorgun, David Jose Ribeiro Lamas.
(name of supervisor)
2. I am aware of the fact that the author also retains the rights mentioned in Clause 1.
3. I certify that granting the non-exclusive licence does not infringe the intellectual property
rights of other persons or the rights arising from the Personal Data Protection Act.
In Tallinn, ______________________________
(digital) signature and date
ii

Acknowledgements
I would first like to thank my thesis supervisors Ilya Shmorgun and David Lamas of the
School of Digital Technologies at Tallinn University. The door to Prof. Lamas’s office was
always open whenever I ran into a trouble spot or had a question about my research. He
consistently allowed this thesis to be my own work, but steered me in the right direction
whenever he thought I needed it.
I would also like to thank the experts who were involved in the assessment procedure and
validation of the questionnaire for this research project. Without their passionate partic-
ipation and input, the assessment procedure could not have been successfully conducted.
Finally, I must express my very profound gratitude to my parents for providing me
with unfailing support and continuous encouragement throughout my years of study and
through the process of researching and writing this thesis. This accomplishment would
not have been possible without them. Thank you.
Amir Zare Pashaei
iii

iv

Declaration
I declare that apart from work whose authors are clearly acknowledged, this thesis is the
result of my own and original work.
This work has not and is not being submitted for any other comparable academic degree.
The thesis was supervised by Ilya Shmorgun (Tallinn University, Estonia) and David
Lamas (Tallinn University, Estonia).
Amir Zare Pashaei
. . . . . . . . . . . . . . . . . . . . (date)
. . . . . . . . . . . . . . . . . . . . (signature)
v

vi

Contents
1 Introduction 1
1.1 Research Problem . . . . . . . . . . . . . . . . . . . . . . . . . . . . . . . . 3
1.2 Research Goal and Questions . . . . . . . . . . . . . . . . . . . . . . . . . 4
1.3 Research Methodology . . . . . . . . . . . . . . . . . . . . . . . . . . . . . 5
1.4 Research Plan . . . . . . . . . . . . . . . . . . . . . . . . . . . . . . . . . . 6
2 Contextualisation 8
2.1 Study Procedure . . . . . . . . . . . . . . . . . . . . . . . . . . . . . . . . 10
2.2 Compiling the DUI Descriptions . . . . . . . . . . . . . . . . . . . . . . . . 12
2.3 Conducting the Rating Exercise . . . . . . . . . . . . . . . . . . . . . . . . 14
2.4 Specifying the Profile of the HCI Experts . . . . . . . . . . . . . . . . . . . 16
2.5 Designing the Questionnaire . . . . . . . . . . . . . . . . . . . . . . . . . . 18
2.5.1 Providing Demographical Information . . . . . . . . . . . . . . . . . 19
2.5.2 Measurement of Workload . . . . . . . . . . . . . . . . . . . . . . . 19
2.5.3 Administering the Follow-Up Questions . . . . . . . . . . . . . . . . 21
2.6 Introducing the Study Procedure to HCI Experts . . . . . . . . . . . . . . 22
vii

2.7 Piloting the Study . . . . . . . . . . . . . . . . . . . . . . . . . . . . . . . 22
2.8 Conducting the Main Study . . . . . . . . . . . . . . . . . . . . . . . . . . 23
3 Analysis 24
3.1 Demographic Information . . . . . . . . . . . . . . . . . . . . . . . . . . . 24
3.2 Rating Exercise . . . . . . . . . . . . . . . . . . . . . . . . . . . . . . . . . 26
3.2.1 Intra-Class Correlation Coefficient (ICC) . . . . . . . . . . . . . . . 27
3.3 Measurement of Workload . . . . . . . . . . . . . . . . . . . . . . . . . . . 30
3.4 Follow-up Questionnaire . . . . . . . . . . . . . . . . . . . . . . . . . . . . 32
4 Discussion 36
4.1 Future Work . . . . . . . . . . . . . . . . . . . . . . . . . . . . . . . . . . . 38
5 Conclusion 40
6 Kokkuvote 42
Appendix A Sources-of-Workload Comparison Cards 45
Appendix B NASA-TLX Rating Scale 46
Appendix C Source-of-Workload Tally Sheet 47
Appendix D Weighted Rating Worksheet 48
Appendix E Code Density Example 49
Bibliography 49
viii

List of Tables
3.1 Age group distribution of the study participants . . . . . . . . . . . . . . . 25
3.2 Different Types of ICC and their names in SPSS . . . . . . . . . . . . . . . 28
3.3 Scale for interpreting Kappa values . . . . . . . . . . . . . . . . . . . . . . 30
3.4 Example of workload calculation for rater two . . . . . . . . . . . . . . . . 32
ix

x

List of Figures
1.1 Phases of the research study . . . . . . . . . . . . . . . . . . . . . . . . . . 7
2.1 List of DUI design patterns in the Semantic MediaWiki . . . . . . . . . . . 8
2.2 The Conduit design pattern . . . . . . . . . . . . . . . . . . . . . . . . . . 11
2.3 Web-based description of the DUI provided to the raters . . . . . . . . . . 15
2.4 Rating exercise sheet . . . . . . . . . . . . . . . . . . . . . . . . . . . . . . 17
2.5 The HCI expert sample profile . . . . . . . . . . . . . . . . . . . . . . . . . 18
2.6 NASA-TLX workload rating sheet . . . . . . . . . . . . . . . . . . . . . . . 20
3.1 Fields of activity of the study participants . . . . . . . . . . . . . . . . . . 26
3.2 Composition of the weighted workload score . . . . . . . . . . . . . . . . . 33
3.3 Questionnaire topics, content analysis codes and example survey texts . . . 35
A.1 Sources-of-Workload Comparison Cards (Human Performance Research Group,
1986) . . . . . . . . . . . . . . . . . . . . . . . . . . . . . . . . . . . . . . . 45
B.1 NASA-TLX Rating Scale (Human Performance Research Group, 1986) . . 46
C.1 Source-of-Workload Tally Sheet (Human Performance Research Group, 1986) 47
xi

D.1 Weighted Rating Worksheet (Human Performance Research Group, 1986) . 48
E.1 Code Density Example . . . . . . . . . . . . . . . . . . . . . . . . . . . . . 49
xii

Chapter 1
Introduction
Distributed User Interfaces (DUIs) are an area of Human-Computer Interaction (HCI)
studying interfaces distributed across different devices, displays, and users engaged in co-
located or remote collaboration (Melchior, 2011). According to Elmqvist (2011) a DUI
is ”a user interface, which components are distributed across one or more dimensions,
including input, output, platform, space and time”. The above five distributed dimensions
are described as follows:
• Input (I) - controlling input on a single or several devices (Johanson, Hutchins,
Winograd, & Stone, 2002), (Myers, Stiel, & Gargiulo, 1998), (Wallace, Mandryk, &
Inkpen, 2008)
• Output (O) - graphical output tied to a single or distributed across several devices
(Czerwinski, Meyers, Tan, & Robertson, 2009), (Biehl et al., 2008), (Wallace et al.,
2008)
• Platform (P) - the interface executes on a single or is distributed across several
platforms.
• Space (S) - the interface is restricted to the same physical space or can be dis-
tributed geographically (Baecker, 1993).
1

2 Chapter 1. Introduction
• Time (T) - interface elements execute simultaneously or are distributed in time.
According to Elmqvist (2011), one of the main challenges of DUI design was that there
were no sufficient generalizable toolkits and frameworks which could support DUI devel-
opment. Shmorgun and Lamas (2015) surveyed existing literature on DUIs in search of
existing methods, approaches, and challenges in the design of DUI. Afterwards, Shmorgun,
Lamas, and Mercer (2016) introduced patterns for designing DUIs as an aid for HCI re-
searchers and practitioners. As the outcome of their research, they established a catalogue
of design patterns, which are gathered in a Semantic MediaWiki (see Figure 2.1) and a
design pattern language created on top of it. However, this pattern language needed to
be assessed, because when HCI experts want to design something they will rarely start
from scratch, and instead will look for what has been done before and try to learn from
existing design knowledge. When they want to learn from existing design knowledge, they
would need to have a way of de-constructing and analysing existing works. The purpose of
the pattern language is thus two-fold: (1) it helps to analyse what has been done before
and learn from it; and (2) it is meant to be applied when designing new interfaces or
applications.
As both of these points are difficult to address in a single study, this thesis focuses only
on the first part. In order to achieve this point, a number of existing applications (case
studies) has been compiled. These cases represent examples of thorough systematic work
on DUI design. An assessment exercise was then conducted to see if the existing DUI
patterns can be used to describe the DUIs from the collected examples, what enabling
technologies have been used, what purposes they serve, what devices they can work on.
Hence, by using this approach and learning from existing design knowledge, the HCI
experts would be able to better understand and learn from the details of existing DUI
designs.

1.1. Research Problem 3
1.1 Research Problem
Design patterns have been introduced as an aid for HCI researchers and practitioners to
support the process of designing DUIs. So far, design patterns have been proved useful
for modelling design experience in domains of software engineering and HCI. The aim of
a design pattern is to show a proven solution to a recurring design problem in a way that
it is easy to understand and can help generate new ideas (Borchers, 2000).
An issue has been identified that HCI researchers and practitioners who were making the
first steps into the area of designing DUIs did not have enough information available to
them about the various possibilities that DUIs offer them and what current technology
supports. To solve this issue, Shmorgun et al. (2016) explored and established a collection
of patterns in order to organise patterns into a hierarchical structure - a pattern language,
following Borcher’s approach (Borchers, 2000). According to Shmorgun et al. (2016), a
DUI design pattern language has been introduced to expose connections between patterns
so that similar or related patterns can be more easily identified and explored. This pattern
language can be described as a set of building blocks for scaffolding the design process in
a way that helps designers better identify the described interactions.
The current version of the pattern language needed to be assessed because the descriptions
of individual patterns belonging to the language were based on review of literature and
the understanding of the person who compiled the pattern language, but not tested with
external HCI experts engaged in designing and developing DUIs as part of their day to
day practice. The pattern descriptions however needed to be understandable for people
who want to design DUIs in a way that they can distinguish and differentiate among
patterns and use them effectively. According to Shmorgun et al. (2016), in order to im-
prove the pattern language, its expressiveness needed to be assessed to see how well the
patterns could be used for analysing existing DUIs and specifying new ones. According
to Shmorgun et al. (2016), such assessment was necessary to provide better ways of navi-
gating through the pattern language, meaning that each user should be able to effectively
find and pick the most relevant patterns.
4 Chapter 1. Introduction
There was a need for an adequate metric, which could represent that the patterns were
different from each other and that HCI experts could differentiate them and use them to
analyse existing DUIs. According to Landis and Koch (1977) and Portney and Watkins
(2015), this metric could be represented by a statistical measurement called Kappa. So
while the pattern descriptions and their relationships have been identified and imple-
mented in the pattern language, the Kappa value would show whether the patterns de-
scriptions were differentiated enough.
1.2 Research Goal and Questions
Based on the identified research problem, the following research goals were set:
• Assess the clarity of design pattern descriptions and their connections by measuring
the level of agreement of HCI experts when selecting patterns to describe existing
DUIs;
• Assess the cognitive load related to using the DUI patterns for assessing existing
DUIs;
• Identify aspects of the DUI pattern language that would need further improvement.
The following research questions were then formulated to help in achieving the goals:
• [RQ1] Can a reasonable level of reliability/agreement be reached when using the
DUI pattern language to assess existing DUIs?
• [RQ2] How cognitively demanding is using the pattern language for assessing existing
DUIs?
• [RQ3] What aspects of the pattern language would need to be improved to better
support the assessment of existing DUIs?

1.3. Research Methodology 5
The expected outcomes of this thesis were stated as follows:
• Measurement of the level of reliability/agreement
Reaching a reasonable level of reliability/agreement would suggest that HCI experts
could easily distinguish and differentiate between the patterns.
• Measurement of the level of perceived workload
By measuring the level of perceived workload, the pattern language could be assessed
to see how cognitively demanding is using the pattern language. HCI experts would
be less likely to use the pattern language if the effort of understanding it would be
too great.
• Description of the aspects of the pattern language needing improvement
By identifying and describing the aspects of the pattern language that could still
be improved would contribute to the improvement and maturing of the language.
Getting insights about the features and properties of the pattern language that are
perceived as more useful and attractive to HCI experts would help expose those
features in a more prominent way.
1.3 Research Methodology
To answer the previously formulated research questions the following methods were se-
lected.
Method 1 (to answer [RQ1])
In order to reach a reasonable level of reliability/agreement, an exploratory study with
HCI experts has been conducted. The reason why an exploratory study has been con-
ducted was to understand if the patterns and their descriptions were clear and different
enough from each other that HCI experts could use them effectively for analysing existing
DUIs. From this a conclusion could be reached whether the pattern language needed any

6 Chapter 1. Introduction
improvements or not. As part of this study, a rating exercise has been conducted in order
to see how HCI experts used the patterns to analyse existing DUIs.
Method 2 (to answer [RQ2])
A questionnaire was implemented to see how cognitively demanding using the pattern
language was. The questionnaire was based on NASA-TLX (which is a widely used,
subjective, multidimensional assessment tool that rates the perceived workload in order
to assess a task effectiveness or other aspect of performance) and used to measure the
perceived workload of HCI experts when using the DUI pattern language.
Method 3 (to answer [RQ3])
A semi-structured questionnaire was implemented to collect insights regarding the aspects
of the pattern language that needed to be improved. The data collected through the
questionnaire was then analysed through qualitative content analysis. The aim of this
analysis was to explore if there were any issues regarding the usage of the DUI pattern
language. If there were any issues, then they could be addressed in the future to further
improve the pattern language.
1.4 Research Plan
The overall research design consisted of three phases (see Figure 1.1). Phase one fo-
cused on gaining initial understanding of how the pattern language was built, what the
relationships between the patterns were, and how the descriptions for each pattern were
provided. In phase two the study procedure was put together, the profile of HCI experts
to participate in the study was compiled, the questionnaires were designed, and the study
was implemented. In the last phase analysis of the collected data was conducted and
conclusions were derived.

1.4. Research Plan 7
Task Description Phase 1: Contextualisation
• Reading through the pattern descriptions • Understanding the relationships between patterns • Understanding the way, the pattern language is built
Phase 2: Assessment
• Describing the study procedure • Compiling the DUI descriptions • Creating the rating exercise • Specifying the profile for the HCI experts • Designing the questionnaire • Conducting the pilot study • Conducting the main study
Phase 3: Analysis
• Analysing the level of reliability/agreement • Measuring the task load index • Evaluating the pattern language
Figure 1.1: Phases of the research study
Chapter 2
Contextualisation
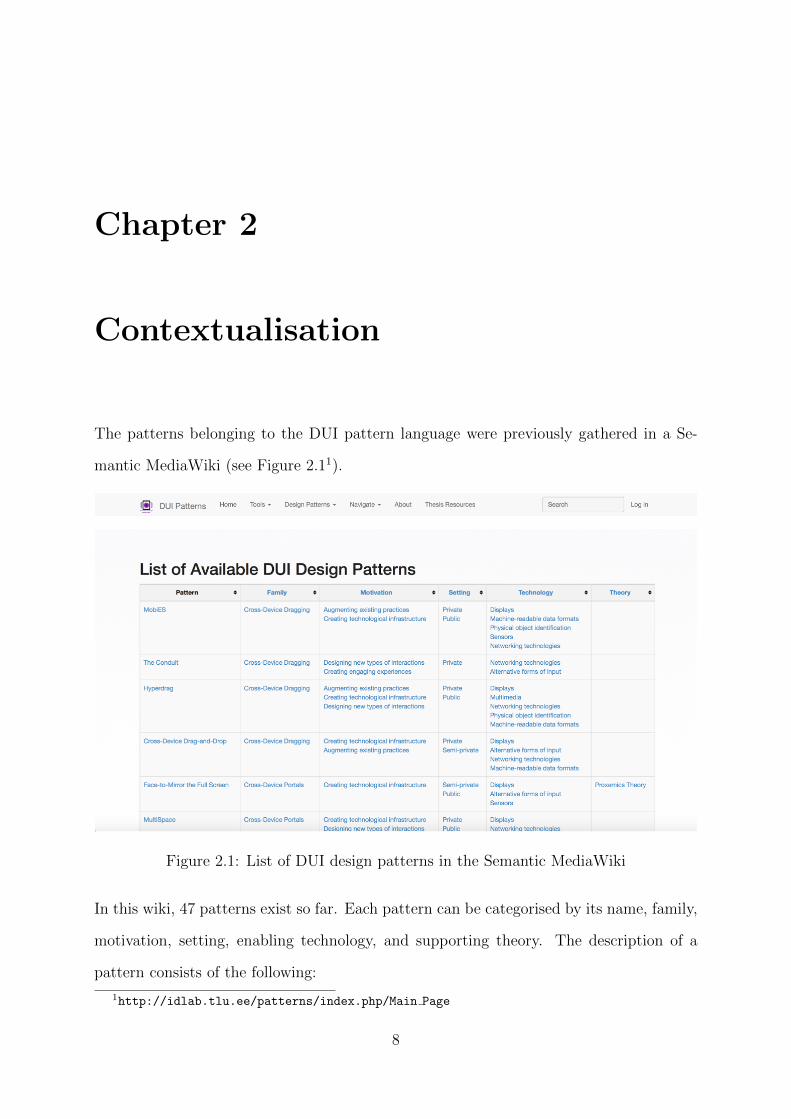
The patterns belonging to the DUI pattern language were previously gathered in a Se-
mantic MediaWiki (see Figure 2.11).
Figure 2.1: List of DUI design patterns in the Semantic MediaWiki
In this wiki, 47 patterns exist so far. Each pattern can be categorised by its name, family,
motivation, setting, enabling technology, and supporting theory. The description of a
pattern consists of the following:
1http://idlab.tlu.ee/patterns/index.php/Main Page
8

9
• Summary: A paragraph describing how the design pattern works;
• Description: A detailed explanation of the pattern as presented in the original
research, describing interactions involved;
• Design motivation: Describes the primary motivations guiding DUI design;
• Design goal: Describes the main goals for designing DUIs;
• Device type: Takes into consideration the context of use: private, semi-private,
public;
• Enabling technology: List of technologies that are used for enabling the design
pattern;
• Reference: Reference to the original article where the interaction technique was
first described.
• Pattern family: Groups this and other related patterns into a pattern family;
• Cites: All articles cited by the one where the pattern is described;
• Cited by: All articles referencing this particular article;
• Related to: Citations of influential material to or from this article, plus any in-
stance of association without citation;
• Examples: A real-life implementation of the pattern;
• Diagram: A schematic representation of the pattern.
The fields Cites, Cited by, and Related to were previously used to identify the con-
nections between the articles describing the design patterns. This analysis contributed
to establishing the relationships between the individual design patterns and helped form
them into a design pattern language.

10 Chapter 2. Contextualisation
As an example, one of the patterns is called The Conduit (N. Chen, Guimbretiere, &
Sellen, 2012), which is a design pattern for facilitating information transfer among e-
readers. In this pattern, the non-dominant hand of the user designates the target device
and the dominant hand select the item to be transferred. In this case, the user’s body acts
an imaginary conduit between the 2 devices, facilitating the file transfer. This pattern
can also be used to navigate to pages corresponding to a thumbnail selected on another
device. In this case, one device is used for displaying thumbnail previews and the other
one for reading the corresponding pages. (Figure 2.2) shows an overview of this design
pattern as represented in the wiki.
2.1 Study Procedure
A review of literature review was conducted to identify possible approaches for assessing
the expressiveness of the pattern language. One of the suitable approaches was proposed
by Lenz, Diefenbach, and Hassenzahl (2014). In their paper, Lenz et al. (2014) describe
research aimed at identifying and categorising attributes of aesthetic interaction design.
For their analysis, Lenz et al. (2014) first identified all attributes mentioned in publica-
tions on designing aesthetic interactions and compiled them in a list. Overall, 19 design
approaches consisting of 151 attributes were collected. Next, the attributes and categories
along with examples and definitions provided by the authors of the approaches were given
to five independent raters. Their task was to assign each attribute to the category fitting
best. After doing so, Lenz et al. (2014) calculated a Fleiss’ Kappa statistic for assessing
the level of reliability/agreement between the raters. ”Clear assignment” was marked
when four or five of five votes were collected. The purpose of the categorization was
two-fold: (1) it helped to validate the suggested categories; (2) it provided an overview
of emerging frequent and shared themes as well as a discussion of the differences between
the initially identified approaches.
The Lenz et al. (2014) study design was used as inspiration for conducting the assessment

2.1. Study Procedure 11
Figure 2.2: The Conduit design pattern

12 Chapter 2. Contextualisation
of the expressiveness of the DUI design pattern language. To do so, a sample of DUI
projects was compiled by selecting publications that describe fully implemented DUIs.
Only publications from 2014 and 2015 were selected to limit the analysis to state of the
art work. The preparation of this study took place in the beginning of 2016 and so newer
publications were not yet available at the time. The collection procedure resulted in a
sample of 29 articles, out of which only 6 have been chosen to be given to the raters, in
order not to overload them with too much information. As it was needed to provide DUI
descriptions to the raters in a systematic way, a template was designed to ensure that the
DUI descriptions would follow the same structure.
2.2 Compiling the DUI Descriptions
The previously selected 6 DUIs included:
1. Object and ARM shadows (Besacier, Tournet, Goyal, Cento, & Scott, 2014):
Object and ARM shadows is a system which proposes to show visual feedback for
drag and drop operations on a tabletop in the form of virtual shadow.
2. Duet (X. A. Chen, Grossman, Wigdor, & Fitzmaurice, 2014): Duet is a system
that tracks motion and touch input and extends visual and tactile output to both
devices which are smart-phone and smart-watch.
3. Surface Link (Goel et al., 2014): Surface Link is a system that allows a set of
mobile devices lying on the same surface to share information thanks to acoustic
and inertial signals.
4. ReflectoSlates (Martinez Plasencia et al., 2014): ReflectoSlates is a hardware/software
system which is aimed to enable users of tabletops in a collaborative setting to see
and interact with personal content on a tabletop while allowing other users to see
public content at the same place.

2.2. Compiling the DUI Descriptions 13
5. SurfacePhone (Winkler, Lochtefeld, Dobbelstein, Kruger, & Rukzio, 2014): Sur-
face Phone is a system that demonstrates the joint system of pico-projector and
mobile phone that creates an interactive projection on a table surface.
6. Mochatop (Wozniak et al., 2014): MochaTop is a software system that is developed
and distributes content over several devices located nearby (for example, lying on
a common surface) and allows for joint interaction with this content across all the
devices.
A template was then created to provide raters with thorough information about each DUI.
This helped ensure that DUI descriptions would follow a similar structure and would be
easier for the raters to comprehend. The full article was provided as supplementary
material in case the raters needed additional information to better understand how a
particular DUI worked. An online (HTML) version2 of the template was provided in order
to make it easier for the raters to navigate through DUIs and access related information
(see Figure 2.3). The web-based version of the DUI descriptions also made it possible to
include short videos that provided brief overviews of how the particular DUI worked.
For each of these 6 DUIs the following information was included:
• Description - a summary of what the DUI is;
• Goal - the aim of implementing the DUI;
• General need - to see what materials are necessary in order to help the DUI work;
• Immediate need - to see on-the-go requirements while using the DUI;
• Problem - the problem that the DUI tries to solve;
• Solution - the solution the DUI is going to provide;
• Interaction involved - types of interaction the DUI uses;
2http://lin2.tlu.ee/~amirzp/dui/1.object-and-arm-shadows.html

14 Chapter 2. Contextualisation
• Usage setting - the usage setting: private, semi-private, public;
• Devices used - the kinds of devices used by the DUI;
• Enabling technologies - technologies needed to implement the DUI;
• Diagram and Video - demonstration of how the DUI works.
2.3 Conducting the Rating Exercise
Input from multiple people is a common way for collecting research data. The question
of consistency or agreement among the individuals providing research data immediately
arises due to the variability among human observers. A well-designed research study must
therefore include procedures that measure agreement among the various participants of
the study. The extent of agreement among the participants is called “interrater reliabil-
ity”. There are two categories of reliability with respect to study participants: reliability
across multiple participants, which is called interrater reliability, and reliability of a single
participant, which is called intrarater reliability. According to Stemler (2010), there are
a number of statistics that can be used to measure interrater and intrarater reliability.
These statistics include Cohen’s Kappa (for two raters), the Fleiss Kappa (adaptation
of Cohen’s Kappa for three or more raters), the contingency coefficient, the Pearson r
and the Spearman Rho, the intra-class correlation coefficient, the concordance correlation
coefficient, and Krippendorff’s Alpha (useful when there are multiple raters and multiple
possible ratings).
There have been loads of different types of methods used in order to measure interrater
reliability. Previously, interrater reliability was measured as a percent agreement. In
order to calculate the percent agreement, the number of agreement scores was divided by
the total number of scores. The concept of “agreement among raters” is very simple, and
for many years interrater reliability was measured as percent agreement among the data
collectors. In order to calculate the measure of percent agreement, first a matrix should

2.3. Conducting the Rating Exercise 15
Figure 2.3: Web-based description of the DUI provided to the raters

16 Chapter 2. Contextualisation
be created in which the columns represent the different raters, and the rows represented
variables for which the raters had collected data. The cells in the matrix should contain
the scores the data collector entered for each variable. At the end the percentage depicts
the level of agreement among the raters (McHugh, 2012).
Portney and Watkins (2015) propose different ways of measurement for describing the
levels of reliability/agreement among raters based on the ranges of Kappa values. Inter-
rater reliability/agreement was calculated based on the ranges of Kappa values to assess
the level of reliability/agreement between the raters. Before calculation it was necessary
to provide a rating sheet to the HCI experts participating in the study in a way that could
be easy for them to use. The rating sheet was designed so that the 6 DUIs were listed on
the top of the sheet and the DUI design patterns were listed on the left side (see Figure
2.4). The task of the raters was to go through the descriptions of the 6 DUIs, either on
paper or by using the web version, and to assign the DUI patterns that in their opinion
best described the interactions depicted by the particular DUI. On the rating sheet the
patterns were sorted alphabetically and the DUIs were sorted in the same sequence used
in the web-based version.
Afterwards, to calculate the level of agreement among raters, the responses of the raters
were collected into separate spreadsheets based on the number of DUIs. In an individual
spreadsheet the columns represented different raters and the rows represented the design
patterns.
2.4 Specifying the Profile of the HCI Experts
In order to conduct the rating exercise it was necessary to identify the HCI experts that
would participate in the study. To do so, a description of the HCI expert profile was
composed to simplify the process of looking for the experts (see Figure 2.5). In the
template, the information regarding each HCI expert was categorised into two major
parts: experience and background.

2.4. Specifying the Profile of the HCI Experts 17
Figure 2.4: Rating exercise sheet
The experience section addressed the responsibilities HCI experts had in different design
and development projects they participated in, the number and types of projects they
worked on, and whether they had any experience in cross-device interaction design.
In the background section, the main focus was on the work history and education of
the expert. It was essential to know if the expert is active in design/IT occupation or
working in academia in the field of HCI or interaction design or any related field. Also,
it was important to know if the expert had any education related to HCI or cross-device
interaction design. Besides, it was important to know if the person was located in Tallinn
or not. In case the expert was not local, it would be necessary to contact him/her via
Skype and conduct the study remotely. Still, the main focus was on the experts located
locally to ease the study procedure.

18 Chapter 2. Contextualisation
Figure 2.5: The HCI expert sample profile
2.5 Designing the Questionnaire
The purpose of conducting the questionnaire was two-fold: first, it was necessary to
measure the level of cognitive workload in order to assess the task’s effectiveness and
performance by using a well-known measurement tool - the NASA Task Load Index
(NASA-TLX). Second, it was necessary to identify the issues related to the usage of the
pattern language, and see what needs to be improved in the pattern language by collecting
additional feedback about the pattern language from the HCI experts, and analyse it by
using qualitative content analysis.
The questionnaire was composed of three major parts:
• Demographical information - including age, gender, and fields of activity of the
HCI expert;
• Measurement of workload - using the NASA-TLX;
• Follow-up questionnaire - including 9 open-ended questions for collecting addi-
tional feedback about the pattern language from the HCI experts.

2.5. Designing the Questionnaire 19
At the end of the questionnaire contact information of the raters was collected for following
up in case there would be a need for clarification.
2.5.1 Providing Demographical Information
Conducting the demographic information of the participants, was very important for this
thesis. As the survey targets specific group of people (HCI experts), the demographic
information depicts that if the target audience is reached or not. On the other side, as it
was aimed for a representative sample of a population, knowing demographic character-
istics of each participants would help in determining how close the sample replicates the
population.
For this section, questions about age, gender and field of activity of the HCI expert were
asked in order to get to know what different age groups HCI experts have; what different
genders they have and what field of activity they are involved in.
2.5.2 Measurement of Workload
Workload is difficult to conceptualise as shown by the following definitions. Workload
can be defined as “the relative capacity to respond” (Lysaght, Hill, Dick, Plamondon, &
Linton, 1989). “Workload is a construct that is used to describe the extent to which an
operator has engaged the cognitive and physical resources required for a task performance”
(Backs, Ryan, & Wilson, 1991). “Workload is a multidimensional and complex construct
that is affected by external task demands, environmental, organizational and psychological
factors, and perceptive and cognitive abilities” (Weinger, Reddy, & Slagle, 2004). These
three definitions show that workload is a difficult concept to define and that workload
consists of several components.
There are different approaches to measuring workload such as using the Cooper-Harper
Scale, the perceived workload scale, the Subjective Workload Assessment Technique

20 Chapter 2. Contextualisation
(SWAT), the Workload Profile (WP), the Rating Scale Mental Effort (RSME), or the
NASA-Task Load Index (NASA-TLX) (Hill et al., 1992) . For this thesis, the NASA-
TLX has been chosen.
NASA TLX was originally developed more than 20 years ago to measure workload in
aviation (G. Hart Sandra, 2006; S. G. Hart & Staveland, 1988). The NASA-TLX is
one of the most widely used instruments for assessing the overall subjective workload.
The NASA-TLX is a multidimensional instrument that consists of 6 sub-scales: Mental
Demand (MD), Physical Demand (PD), Temporal Demand (TD), Frustration (FR), Effort
(EF), and Performance (PE) (see Figure 2.6 3). Twenty-step bipolar scales are used to
obtain ratings on these dimensions, resulting in a score between 0 and 100. The underlying
assumption of the instrument is that the combination of these 6 dimensions is likely to
represent “workload” experienced by operators (G. Hart Sandra, 2006).
Figure 2.6: NASA-TLX workload rating sheet
According to literature, NASA-TLX is a reliable and valid instrument for workload mea-
surement. Furthermore, NASA-TLX is easy to administer, especially when using the raw
3https://en.wikipedia.org/wiki/NASA-TLX
2.5. Designing the Questionnaire 21
scores instead of the weighted scores (Hendy, Hamilton, & Landry, 1993; Nygren, 1991).
Finally, NASA-TLX is one of the few instruments that include a measurement of physical
workload.
For each of the six dimensions of workload measurement in NASA-TLX there is an ac-
companying description that the subject should read before rating. Each dimension is
rated for every task within a 100-point range with 5-point steps. These ratings are then
combined to form the overall task load index. Accompanying descriptions for each mea-
surement can help participants answer more accurately. The descriptions are as follows:
• Mental Demand - How much mental and perceptual activity was required? Was
the task easy or demanding, simple or complex?
• Physical Demand - How much physical activity was required? Was the task easy
or demanding, slack or strenuous?
• Temporal Demand - How much time pressure did you feel due to the pace at
which the tasks or task elements occurred? Was the pace slow or rapid?
• Overall Performance - How successful were you in performing the task? How
satisfied were you with your performance?
• Frustration Level - How irritated, stressed, and annoyed versus content, relaxed,
and complacent did you feel during the task?
• Effort - How hard did you have to work (mentally and physically) to accomplish
your level of performance?
2.5.3 Administering the Follow-Up Questions
The aim of this part of the questionnaire was to get thorough feedback from HCI experts
regarding the usage of the pattern language. The aim was to see what needs to be modified
or added to the pattern language and how it could be improved. This section included

22 Chapter 2. Contextualisation
9 questions and the HCI experts were able to answer any of them. The questions were
mainly focused on the features of the pattern language and were meant to explore whether
there is a need for specific improvements.
2.6 Introducing the Study Procedure to HCI Experts
To ensure a higher success rate of the overall study, the HCI experts had to be carefully
introduced to the procedure in a way that would be clear and easy for them to understand.
A script was designed to ensure that all experts would follow the same procedure. The HCI
experts were introduced to the study procedure as follows. First, the pattern language was
shown to the HCI experts and the navigation in the pattern language was demonstrated.
Second, descriptions of 6 DUIs were provided to the HCI experts and they could see all
the relevant information for each DUI. Third, the HCI experts read through each DUI
description and assigned the DUIs to any corresponding pattern in the pattern language.
After doing the rating exercise, the questionnaire was provided to the experts to gain
thorough feedback about using the pattern language.
2.7 Piloting the Study
For the pilot phase it was decided to do the rating exercise with two HCI experts and then
do it with another four in the main phase. The reason behind it was to see if there is any
necessary modification before the main study. The participants in the pilot phase were
both from industry and they had experience of cross-device interaction design. They were
both working in IT companies in Tallinn. In the pilot phase, the pattern language was
introduced to the raters with full explanation of some sample patterns. The patterns which
were explained to the HCI experts were selected from the patterns with different families,
so that the raters could have an understanding of each of the different pattern families.
In addition, the six DUIs with accompanying descriptions were provided. Afterwards, the

2.8. Conducting the Main Study 23
rating sheet was provided. The results of the pilot study suggested that there was no
specific need to improve the study procedure or the materials provided to the raters.
2.8 Conducting the Main Study
After finishing the pilot phase with the two raters, the main phase has been conducted
to assess how effectively the patterns can be used for analysing existing DUIs. The study
has been carried out in the same way that the pilot phase has been conducted, but this
time with four raters. This time the study participants were from both academia and
industry, both male and female. In order to find the right participants, their social profile
was checked via LinkedIn. The portfolio of each participant was checked assessed to
see if the participants had any experience in designing cross-device interactions. The
time to carry out the study differed for each participant based on individual levels of
understanding. Some of the participants had to read the information about the DUIs
and patterns multiple times. Also, some of the participants used to ask questions during
the study as they encountered misunderstandings. The average duration for doing the
rating exercise for each participant was about two hours. The average time for filling out
the survey was about twenty minutes. After finishing the study, participants were asked
to verbally provide any additional feedback about the pattern language. Most of the
participants were happy about the features of the pattern language and they have stated
that there is sufficient information in it. Also, they stated that the pattern language was
totally new to them and they have not seen anything similar before.

Chapter 3
Analysis
The previous chapter discussed how the study was conducted, how the information was
collected, what methodologies were used. In this chapter as there were different parts to
analyse, the procedure of the analysis of each section has been provided separately.
3.1 Demographic Information
The cluster sampling approach was used in order to select the target audience for this
study. In this approach the total population is divided into groups (or clusters) and a
simple random sample of the groups is selected. Cluster sampling is a sampling technique
used when ”natural” but relatively heterogeneous groupings are evident in a statistical
population. Each cluster should be a small-scale representation of the total population.
The clusters should be mutually exclusive and collectively exhaustive. The technique gives
more accurate results when most of the variation in the population is within the groups,
not between them. A random sampling technique is then used on any relevant clusters to
choose which clusters to include in the study. The clusters that has been selected for the
purpose of this thesis were mainly in academia and industry, but other related clusters
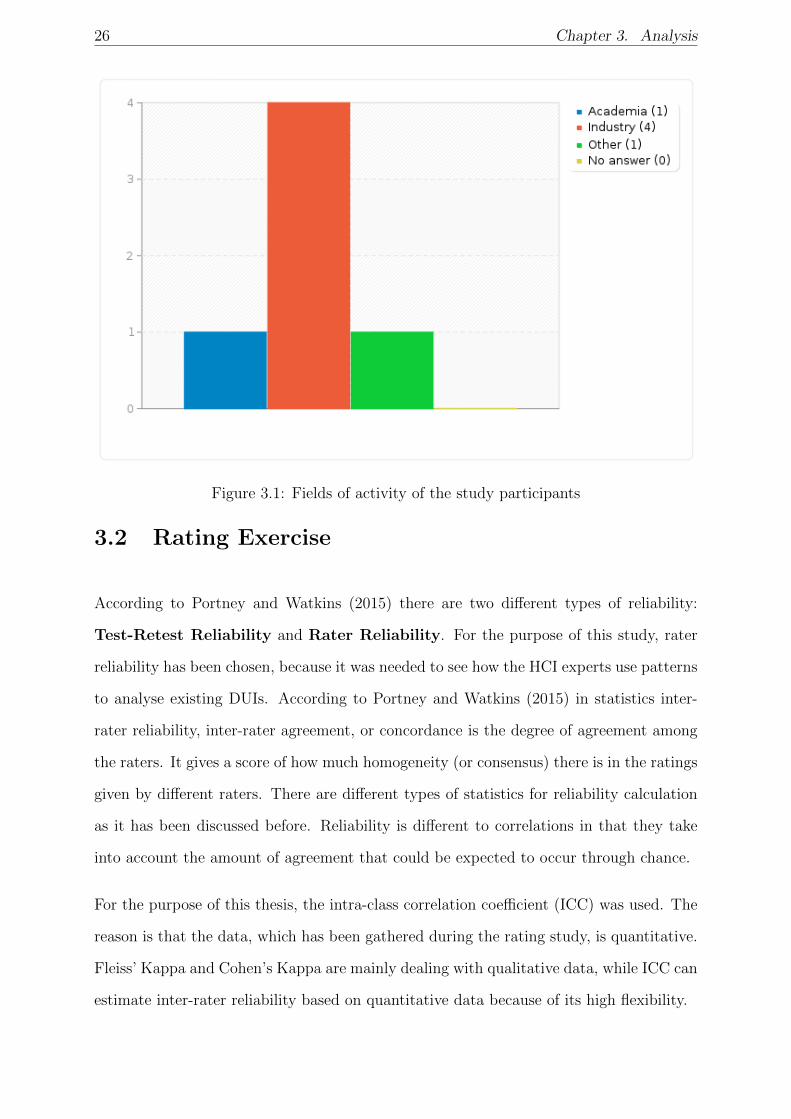
were considered to be included as well (see Figure 3.1).
Age categorisation will often determine knowledge and experience of the person with the
24

3.1. Demographic Information 25
focus they have on the skills and the working tasks that they encounter in their professional
activities. The age group that was involved in the study is between 18 to 44 years of age
(see Table 3.1).
Age group Count Percentage18 - 24 1 17%25 - 34 2 33%35 - 44 years of age or older 3 50%
Table 3.1: Age group distribution of the study participants
Out of six participants of the rating exercise three were female and three were male. For
the purpose of this thesis knowing the gender was very important because depending on
the gender there would be different workload measurement which will be discussed in
the next section. And as the workload has been measured it was needed to identify the
genders in advance.
In order to choose the correct participants it was decided that the participants can be from
two major groups: academia and industry. Within both groups the targeted participants
were people with experience in cross-device interaction design and HCI. There was the
possibility to include people from another group who would have related experiences.
These were mainly people who had the experience of working in the HCI community, but
might have no specific education in this field, and their experience was gained through
doing multiple projects (see Figure 3.1).
Furthermore, having experience related to cross-device interaction design was essential
in choosing the correct participants. It was expected to find people who had done real
projects in this area, therefore they could have provided better and more thorough infor-
mation for the goal of the study. Participants selected for this study all had experience of
designing cross-device solution, except for two who had been involved in similar projects
and were still included in the sample. The similar projects that they had done was still
related to cross-device interaction design but they were not designing a new artefact. they
were working on the existing design and improving it.
26 Chapter 3. Analysis
Figure 3.1: Fields of activity of the study participants
3.2 Rating Exercise
According to Portney and Watkins (2015) there are two different types of reliability:
Test-Retest Reliability and Rater Reliability. For the purpose of this study, rater
reliability has been chosen, because it was needed to see how the HCI experts use patterns
to analyse existing DUIs. According to Portney and Watkins (2015) in statistics inter-
rater reliability, inter-rater agreement, or concordance is the degree of agreement among
the raters. It gives a score of how much homogeneity (or consensus) there is in the ratings
given by different raters. There are different types of statistics for reliability calculation
as it has been discussed before. Reliability is different to correlations in that they take
into account the amount of agreement that could be expected to occur through chance.
For the purpose of this thesis, the intra-class correlation coefficient (ICC) was used. The
reason is that the data, which has been gathered during the rating study, is quantitative.
Fleiss’ Kappa and Cohen’s Kappa are mainly dealing with qualitative data, while ICC can
estimate inter-rater reliability based on quantitative data because of its high flexibility.

3.2. Rating Exercise 27
3.2.1 Intra-Class Correlation Coefficient (ICC)
ICC is a descriptive statistic that can be used when quantitative measurements are made
on units that are organised into groups. It describes how strongly units in the same
group resemble each other. The ICC is used to assess the consistency, or conformity of
measurements made by multiple observers measuring the same quantity. The assumptions
related to ICC are that:
• The raters should be fully independent, meaning that the raters have no influence
on each other;
• The data should be normally distributed among the raters;
• The data should be continuous/quantitative.
In this study, as the data are the numbers of assignment from each rater for each specific
DUI and those numbers have no other value, then it can be concluded that the data
is quantitative, and so the ICC is the appropriate statistic for calculating the level of
agreement/reliability among the raters for this study.
In order to calculate the ICC Kappa value, there were 47 cases (patterns) assigned by
6 raters to 6 variables (DUIs). This dataset had to be assessed in terms of finding out
the agreement/reliability among the raters. As there were a total of 6 variables, then
the main dataset had been divided into 6 datasets (separate dataset for each variable).
So the challenge in this step was that the data from each of the raters was collected
separately and stored in different datasets as it was needed to have a different dataset
for each variable. After creating the dataset for each specific variable, the ICC Kappa
value had been calculated with IBM SPSS. The challenge with calculating the ICC was to
identify the correct type and form of ICC for this study, because depending on the type
of ICC there will be different results. There are three distinct models of ICC where each
model has two types with the descriptions for each model and type provided below:
1. Model 1 - each subject is assessed by a different set of randomly selected raters.
28 Chapter 3. Analysis
• ICC (1,1): Each subject is assessed by a different set of randomly selected
raters and the reliability is calculated from a single measurement.
• ICC (1,k): As above, but reliability is calculated by taking an average of the
k raters’ measurements.
2. Model 2 - each subject is assessed by each rater and raters have been randomly
selected.
• ICC (2,1): Each subject is measured by each rater and raters are considered
representative of a large population of similar raters. Reliability is calculated
from a single measurement.
• ICC (2,k): As above, but reliability is calculated by taking an average of k
raters’ measurements.
3. Model 3 - each subject is assessed by each rater, but the raters are the only raters
of interest (meaning that there is a specific group of raters).
• ICC (3,1): Each subject is assessed by each rater, but the raters are the only
raters of interest. Reliability is calculated from a single measurement.
• ICC (3,k): As above, but reliability is calculated by taking an average of k
raters’ measurements.
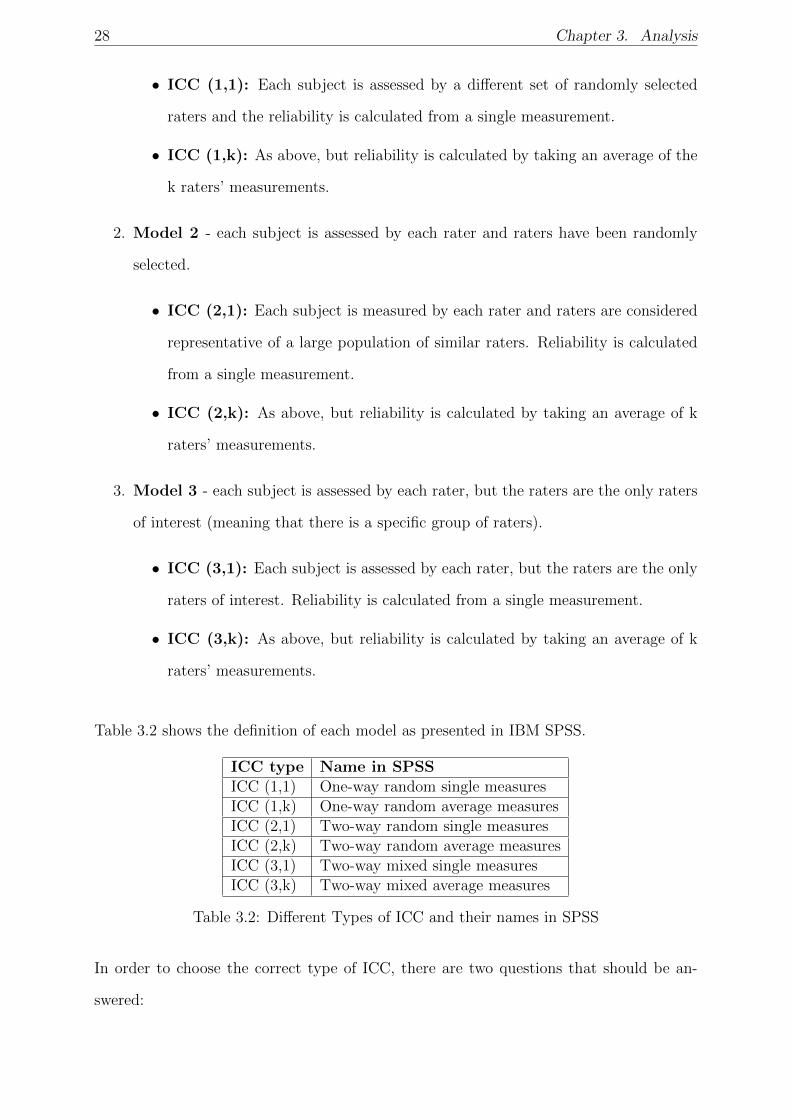
Table 3.2 shows the definition of each model as presented in IBM SPSS.
ICC type Name in SPSSICC (1,1) One-way random single measuresICC (1,k) One-way random average measuresICC (2,1) Two-way random single measuresICC (2,k) Two-way random average measuresICC (3,1) Two-way mixed single measuresICC (3,k) Two-way mixed average measures
Table 3.2: Different Types of ICC and their names in SPSS
In order to choose the correct type of ICC, there are two questions that should be an-
swered:
3.2. Rating Exercise 29
1. Are there consistent raters for all variables? For example, do the exact same 6 raters
make ratings for every variable?
2. Is there a sample or population of raters?
If the answer to Question 1 is ”yes” and the answer to Question 2 is “population”, then
ICC(3) should be chosen (population means that there are a number of existing raters).
In SPSS, this is called “Two-Way Mixed.” This ICC makes the same assumptions as
ICC(2), but instead of treating rater effects as random, it treats them as fixed. This
means that the raters in the task are the only raters of interest for the study. Hence,
for the purpose of this thesis ICC (3) is the correct model. But as it has been discussed
before, there are two different types of ICC measurement for each model. The types
are: Consistency and Absolute agreement. Consistency is the default type which
has been selected by SPSS, but Absolute agreement should be used whether the errors
involved in the measurement are systematic or not. So choosing the type in this case is
not an important issue, but still for this thesis Consistency was chosen because in this
case it is not needed to work with the errors involved in the measurement; and for the
purpose of this thesis it is not important to determine if the errors are systematic or not.
In the procedure all six datasets were analysed and the data was extracted.
According to Table 3.3 which has been introduced by Cicchetti (1994) the level of agree-
ment differs depending on the range of output. The average measure ICC among the
raters has been calculated to see how reliable the measurement is. Also the average mea-
sure ICC is an index for the reliability of different raters averaged together. This ICC
is always higher than the single measure ICC. The value produced by this ICC in this
study is 0.60, which means that there is a Good level of agreement among the raters.
Also, it means that the pattern language and DUIs are reliable enough for the raters (HCI
experts) in a way that it is easy to distinguish and differentiate among the patterns and
it is possible to use these patterns in order to assess existing DUIs.

30 Chapter 3. Analysis
Kappa statistic Strength of agreement<0.40 Poor0.40 - 0.59 Fair0.60 - 0.74 Good0.75 - 1.00 Excellent
Table 3.3: Scale for interpreting Kappa values
3.3 Measurement of Workload
NASA-TLX was used in order to measure the level of cognitive workload participants
experienced when engaging in the rating exercise. It is possible to administer NASA-
TLX in two ways. It can be administered through either an online version or a paper and
pencil version. The paper and pencil version includes rating scale definitions, sources-
of-workload comparison cards, a rating sheet, a sources-of-workload tally sheet, and a
weighted rating worksheet. The version which has been used for the purpose of this thesis
is the paper and pencil version, but the rating sheet was provided to the raters through
on online questionnaire in order to make the raters’ task easier.
The NASA-TLX is a two-part evaluation procedure consisting of calculating weights and
ratings. The first requirement was for each rater to evaluate the contribution of each
factor (its weight) to the workload of a specific task. There are fifteen possible pair-wise
comparisons of the six scales. Each pair is presented on a card (see Appendix A). Raters
circled the member of each pair that contributed more to the workload of the task. The
numbers of times that each selected factor was tallied. The tallies can range from 0 (not
relevant) to 5 (more important than any other factor). The second requirement was to
obtain numerical ratings for each scale that reflect the magnitude of that factor in the
given task (this part was done through the questionnaire). The scales are presented on a
rating sheet (see Appendix B). The ratings exercise was conducted following the entire
task (after finishing the rating exercise for measuring the reliability/agreement among the
raters). By finishing these steps the overall workload score for each rater was calculated
by multiplying each rating by the weight given to that factor by that rater. The sum of
the weighted ratings for each task was divided by fifteen - the sum of the weights (see

3.3. Measurement of Workload 31
Appendix C and D for a sample Tally Sheet and Worksheet).
The procedure for collecting data with the NASA-TLX was as follows:
1. Instructions: Raters read the scale definition and instructions.
2. Familiarisation: Raters practised using the rating scales after performing a few
tasks to ensure that they have developed a standard technique for dealing with the
scales.
3. Ratings: Raters performed the tasks, providing ratings on the six sub-scales fol-
lowing all task conditions of interest.
4. Weights: Raters completed the ”Source-of-Workload Evaluation” for the tasks
included in the study.
The procedure for calculating the weighted workload score was two-fold:
1. Tally sheet: For each rater the ”Source-of-workload Tally Sheet” was used to
calculate the weight for each factor. The raters used the evaluation cards and put a
mark on the appropriate row of the tally column for each response. After doing the
Source-of-Workload evaluation, the tallies for each scale were added and the totals
were written in the ”Weight” column.
2. Worksheet: The weight column for the tally sheet was then transferred to the
”Weighted Rating Worksheet”. Each rater had his or her individual workload pa-
rameter count placed on a separate worksheet for the appropriate task. Ratings were
placed in the ”Raw rating” column of the worksheet. The ”Adjusted Rating” was
formed by multiplying the Raw Rating by the Source-of-Workload Weight.
The adjusted ratings were summed across the different scales. The sum was divided
by fifteen to obtain the overall weighted workload score for the raters in the task
condition.

32 Chapter 3. Analysis
Table 3.4 depicts an example of workload calculation for rater two. The overall weighted
workload is 47. Figure 3.2 depicts the composition of the weighted workload score. This
bar graph shows the area of rating between 0 to 100 and the six sub-scale ratings. Data was
analysed to examine the possible relationship between raters and workload. Results show
no statistically significant differences in workload between the raters with an exception
for frustration level, which increases based on the level of the knowledge and experience of
one of the raters. As the level of the knowledge of the rater decreases in a specific section
of the task, the level of frustration increases accordingly. This is because the rater needs
to put more effort in order to fully understand the specific matter. The results depicted
that the average amount of workload among the HCI experts is less than 50.
Scales Rating Tally WeightMental Demand 60 4 0.26Physical Demand 70 3 0.20Temporal Demand 45 1 0.06Performance 30 3 0.20Effort 25 3 0.20Frustration 45 1 0.06Overall = 47
Table 3.4: Example of workload calculation for rater two
3.4 Follow-up Questionnaire
The open-ended follow-up questions in the questionnaire were analysed by using the con-
ventional content analysis approach. According to Hsieh (2005), qualitative content anal-
ysis is defined as a research method for subjective interpretation of the content of text data
through the systematic classification process of coding and identifying recurring themes.
Also Hsieh (2005) mentions that the goal of content analysis is ”to provide knowledge and
understanding of the phenomenon under study”. Content analysis includes three distinct
approaches: conventional, directed or summative.
According to Emmert and Barker (1989), qualitative content analysis includes seven steps:
1. Formulating the research question to be answered;

3.4. Follow-up Questionnaire 33
Figure 3.2: Composition of the weighted workload score
2. Selecting the sample to be analysed;
3. Defining the categories to be applied;
4. Outlining the coding process and the coder training;
5. Implementing the coding process;
6. Determining trustworthiness;
7. Analysing the results of the coding process.
The process may differ depending on the specific content analysis approach used. The
most important step in any kind of content analysis is the coding part. So if the coding
part is done in a correct way, then it means that the content analysis will be successful.
The approach selected for conducting the analysis of the follow-up questionnaire in this
thesis is summative content analysis. According to Hsieh (2005), summative content
analysis evaluates the data as a whole, the text is often approached as single words or in
relation to particular content. Analysis of the patterns leads to an interpretation of the

34 Chapter 3. Analysis
contextual meaning of specific terms or content. In summative content analysis, analysis
begins with keywords and the keywords are identified before and during data analysis.
Also keywords are derived based on the interest of the researcher. On account of this, it
was decided that this approach is the most appropriate approach for the purpose of this
thesis.
The follow-up questionnaire was coded and the content of answers analysed. Terms such
as ”working features”, ”ease of use”, and others were coded as the main aspect of the
follow-up questionnaire. It was expected to see how people express their thoughts about
the pattern language in terms of: usage of the pattern language, navigation through the
pattern language, finding relevant information in the pattern language, exploring what
features of the pattern language work and what features do not work, finding out what
features were easy to use and what features were difficult to use, discovering the missing
parts of the pattern language, determining if there is a sufficient amount of patterns in the
pattern language and detecting if there should be more or less patterns in it, and finally
providing any additional feedback about the pattern language that the raters thought
could be appropriate in order to improve the pattern language. Figure 3.3 shows the
main topics and sub-topics resulting from the content analysis.
With the help of NVivo (a widely used research tool), data objects were analysed and
codes identified. By using Microsoft Excel, the answers of each HCI expert were gathered
in a different file and added to NVivo for coding and analysis. In order to do the analysis;
The overall data analysis procedure was as follows. First, data was imported into NVivo.
Then data was categorised based on the HCI expert profile, so that it could be easy to find
information related to each study participant. Data was coded based on the texts that
the HCI experts provided. After coding the data for each participant, the code density
for each participant was measured (see Appendix E for an example).

3.4. Follow-up Questionnaire 35
Topics and sub-topics References Example Survey text
Working features: Features that worked well in the pattern library• Navigation Bar• Summary Tab• The search• Visuals
6 “Visual explanations”, “Pictures explained the most”, “The search because I used only this to find the necessary patterns”, “Visuals and examples”, “The navigate menu is helpful in sorting the patterns according to specific needs”, “Summary provides thorough information”.
Not working features: Features which didn’t work properly in the pattern library
• Functionality of search• Long descriptions• Repetition of patterns’ information• Pictures• Same descriptions for some patterns
5 “When the intro of a pattern was repeated to other patterns”, “Descriptions are a bit too long. Would love to have really simpler technical drawings. Darwing looked too similar sometimes”, “The search didn’t show the results by the second or third word in the name (e.g. when I searched for Conduit, it didn’t display the conduit as a result. I had to type The in front of it). Also, some of the capitalization affected the results.”, “Pattern part of same families often had same description and visuals, though better would be to keep them separate (probably)”, “Pictures weren’t clear enough sometimes”.
Easy to use: Features which was easy to use in the pattern library• Navigation• Search
3 “Navigation was fine. Simple.”, “Navigation was easy to use”, “Search was easy to use”.
Difficult to use: Features which was Difficult to use in the pattern library
• Family tree• Images
4 “The images sometimes had more than one example, which makes it hard to understand which one you are looking at”, “I found no problem with navigation”, “Spot the family tree of the pattern”, “All was ok!”.
Relevant information: Possibility to find the relevant information• Filtering
6 “Could find the relevant information”.
Missing parts in the pattern library: Features or datas which were missed in the pattern library
• Alternative examples• Simplified Diagrams • Video
3 “More alternative examples and diagrams perhaps”, “Some of the diagrams and examples were too simplified for me to get a thorough understanding. In some cases, the same description applied to more than one interaction, therefore I wasn’t sure why interactions of the same group (or project) were separated. the description could be divided so that each interaction in the group would have an indivisual, specific description.” “I think videos of patterns were missing in the library”.
Description clarity: Clarity of the descriptions of each pattern in the pattern library
• Possibilities• Shorter version• Text-based understanding
6 “Descriptions were clear enough to understand”, “Nobody really reads, so a shorter version of everything is always better”, “Mostly understandable. I didn’t understand some of the patterns’ possibilities device-wise (e.g. What kind of screens or surfaces they apply to)”, “In most cases it was understandable. Although, for me personally it is difficult (time consuming) to try to comprehend interactions solely based on the text.”,
Sufficient number of patterns: Determing the sufficient number of patterns in the pattern library
• Enough
5 “There are enough patterns in the library”, “There are more than enough patterns in the library”.
Additional feedback: Getting additional feedback about the pattern library
2 “I feel like specialist now”, “Good Job!”.
Figure 3.3: Questionnaire topics, content analysis codes and example survey texts
Chapter 4
Discussion
The aim of this study was to assess how the DUI pattern language can be used to support
analysis of existing DUIs. This assessment was necessary to understand whether outside
HCI experts can successfully use the pattern language in their work without encountering
excessive cognitive load while also being able to differentiate between individual pattern
descriptions.
The aim of the current study was to answer three research questions:
• Can a reasonable level of reliability/agreement be reached when using the DUI
pattern language to assess existing DUIs?
• How cognitively demanding is using the pattern language for assessing existing
DUIs?
• What aspects of the pattern language would need to be improved to better support
the assessment of existing DUIs?
To answer these questions, various methodologies were used. The aim was to achieve
a reasonable level of reliability/agreement among the HCI experts to see how they can
differentiate between the patterns and navigate through the pattern language. According
to Landis and Koch (1977) and Portney and Watkins (2015), the level of agreement can be
36

37
measured by a statistical measurement called Kappa. The result of the analysis suggested
that there is a ”Good” level of agreement among the HCI experts, meaning that the HCI
experts were able to identify individual pattern easily and navigate through the pattern
language without facing any problems.
In addition, the aim was to calculate the level of perceived cognitive workload while using
the pattern language in order to identify how effectively the language can be used for
DUI assessment. According to Hendy et al. (1993) and Nygren (1991), NASA-TLX is
one of the best tools for measuring perceived workload. Results depicted that there is no
statistically significant difference in workload among the HCI experts, except for one case,
were the results of the NASA-TLX were influenced by the expert’s lack of familiarity with
the topic of DUI design. This means that using the pattern language for DUI assessment
is effective and not excessively demanding.
Finally, the aim was to see what features of the pattern language are more useful for
the HCI experts and what aspects can still be improved. According to Hsieh (2005),
qualitative content analysis is the best methodology to achieve this aim. It was identified
that features of the Semantic MediaWiki, such as the navigation bar, visual descriptions
of individual patterns, and search, are the main features that the HCI experts tend to use
while browsing for appropriate design patterns.
The navigation bar is located on the top side of the MediaWiki and helps the user under-
stand the overall structure of the Wiki. This was one of the first features that attracted
the attention of the experts during the study. They could easily choose or select what
they were looking for by different categories, as provided in the navigation bar.
Visual descriptions were mainly those diagrams included in the description of each pattern
in the pattern language. Visuals helped the HCI experts better understand the patterns
and features related to each pattern. Visuals could be only diagrams and pictures or also
videos available for some of the DUIs.
Search was one of the most used features. In some cases, HCI experts wanted to search

38 Chapter 4. Discussion
for a specific pattern in the pattern language and they had to put exactly the same name
as the pattern had, otherwise the search could not show the exact query. As an example,
an HCI expert wanted to look for a pattern called Conduit. She had to put the word
”The” before the name of the pattern, otherwise search could not find the pattern. This
shortcoming can make searching for necessary patterns more difficult and needs to be
improved in the future.
The following limitations were identified while conducting the study and afterwards re-
flecting on the overall process. One of the limitations was that as the preparation of the
study was conducted at the beginning of 2016, only publications from 2014 and 2015 were
chosen as at the time it was not possible to select newer publications. For this reason,
the 6 examples of DUIs that were provided to HCI experts were not state of the art.
Another limitation was the small number of HCI experts located in Tallinn and willing
to participate in the study. While Estonia is a country with a strong focus on ICT,
unfortunately the number of HCI experts residing in Tallinn is still fairly limited. In
addition to this, most of the experts were very busy and scheduling appointments with
them was rather difficult. For this reason, it was not possible to include more participants
in the study and thus benefit from a large sample.
4.1 Future Work
The outcomes of the study suggested that there are several ways in which the current
version of the pattern language could be improved. One possibility is providing videos
along with each pattern description in order to give a more thorough overview of the
pattern to the user. This way the user would understand the patterns better and use
them more effectively. Alternative examples and simplified diagrams can also be provided
in order to lower the level of frustration of the reader. At the moment, some of the
accompanying diagrams are a bit complicated to comprehend for the user as the pattern
descriptions include a lot of technical illustrations. Another area of improvement is the

4.1. Future Work 39
search functionality. By making search more flexible, it will be easier for the user to
navigate through the pattern language and find the desired patterns quicker.
While this study focused on the analysis of existing DUIs, another direction of research is
exploring how HCI experts can use the pattern language in designing new DUIs. While
analysing existing DUIs is one of the first steps for learning from existing design knowledge,
applying design patterns in the design of new DUIs is entirely different. Addressing both
of these aspects will help ensure that the pattern language can be successfully used for
supporting the design of DUIs.

Chapter 5
Conclusion
The aim of this work was to assess whether the pattern language supports the analysis of
existing DUIs. To achieve this, the level of agreement among HCI experts was calculated
to see how reliable the pattern language is. The level of agreement achieved in this study
is Good. According to Cicchetti (1994), this level of agreement means that the pattern
language is reliable enough and outside HCI experts have a good level of agreement on
this matter. This means that it is possible for them to understand the pattern language
in an appropriate manner and use it in their DUI design work.
It was also important to see how cognitively demanding using the pattern language is. By
calculating the workload of using pattern language by using the well-known NASA-TLX
measurement tool, it was calculated that the amount of perceived workload among the
HCI experts is less than 50 (based on NASA-TLX score, which is between 0 and 100).
This means that using the pattern language for assessing DUIs is not demanding and does
not acquire a high level of workload, so that HCI experts can use the pattern language
effectively. This also suggests that the pattern language is easy to use and comprehend
for users.
Finally, it was demonstrated that HCI experts can successfully analyse existing DUIs by
using the pattern language. By implementing a follow-up questionnaire, it was understood
which features of the pattern language work well and which features do not, what is easy to
40

41
use and what offers a bit of frustration for the users, what are the limitations of the pattern
language, how clear the descriptions of the patterns are, how relevant is the information
provided for each pattern and eventually how users could find relevant information related
to the DUIs.
It can be concluded that the pattern language is useful for analysing existing DUIs as it
is easy to navigate its structure, there is a ”Good” level of reliability/agreement among
the HCI experts using the pattern language for DUI analysis, the perceived workload of
using the pattern language is low and using it does not require significant cognitive effort.
There is now also a concrete list of features that need to be improved to make the task
of using the pattern language more effective.

Chapter 6
Kokkuvote
Antud magistritoo keskendub hajutatud kasutajaliideste mustrikeele rakendamisele ha-
jutatud kasutajaliideste analuusimiseks. Tegemist on mustrite kogumiga, mis on abiks
inimese ja arvuti interaktsiooni teadlastele ja praktikutele seadmeuleste kasutajaliideste
disainimisel.
Too eesmargiks oli kindlaks maarata, kas mustrikeel on olemasolevate hajutatud kasuta-
jaliideste analuusimisel kasulik. Praegune mustrikeel vajas hinnangut, kuna disainimus-
trite kirjeldused pohinesid kirjanduse ulevaatel ja vastasid ainult mustrikeele koostaja
arusaamale. Mustrikeel ei olnud testitud valiste inimese ja arvuti interaktsiooni eksper-
tidega, kes igapaevaselt tegelevad seadmeuleste kasutajaliideste kavandamisega ja aren-
damisega.
Too eesmargiks oli leida vastused kolmele uurimiskusimusele:
1. Kas on voimalik saavutada moistlikul tasemel usaldusvaarsus/uksmeelsus kasutades
mustrikeelt olemasolevate hajutatud kasutajaliideste hindamiseks?
2. Kui noudlik on mustrikeele kasutamine?
3. Mis vajab veel taiustamist mustrikeeles?
42

43
Too eesmargi saavutamiseks viidi labi hindamisulesanne ja kusitlus. Hindamisulesanne vi-
idi labi, et moota usaldusvaarsust/uksmeelsust inimese ja arvuti interaktsiooni ekspertide
seas. Uksmeelsuse taset moodeti kasutades Intra-klassi korrelatsioonikordajat (ICC). Et
saada lisaandmeid mustrikeele kasutamisest, kasutati jargmisi vahendeid: (1) NASA-TLX
ulesande koormuse indeks, et hinnata tookoormust, (2) avatud taiendav kusimustik, et
koguda tagasisidet mustrikeelest inimese ja arvuti interaktsiooni ekspertidelt. Taiendava
kusimustiku eesmargiks oli teada saada, mis vajab veel taiendamist mustrikeeles ja mis on
koige vaartuslikumad omadused mustrikeeles inimese ja arvuti interaktsiooni ekspertide
jaoks, selles, mis aitavad neil analuusida olemasolevaid hajutatud kasutajaliideseid.
Hindamisulesande tulemused, NASA-TLX vaartused ja kusimustiku vastused naitavad
seda, et hajutatud kasutajaliideste mustrikeelt on voimalik oma praegusel kujul kasutada,
et toetada olemasolevate hajutatud kasutajaliideste analuuse, ilma, et see vajaks olulist
kognitiivset pingutust ja et see tekitaks liigset frustratsiooni.
Uuringu tulemused naitasid, et on mitmeid viise, kuidas praegust mustrikeelt oleks voimalik
taiendada. Uheks voimaluseks oleks pakkuda videoid koos mustrite kirjeldustega, et anda
kasutajale pohjalikum ulevaade mustritest. Kasutusel voiksid olla ka alternatiivsed naited
ja lihtsustatud skeemid/diagrammid, et vahendada lugeja rahulolematust.
Kuigi antud too keskendus olemasolevate hajutatud kasutajaliideste analuusidele, siis
teine uuringusuund on valja selgitada, kuidas inimese ja arvuti interaktsiooni eksperdid
kasutavad mustrikeelt uute hajutatud kasutajaliideste kavandamisel.

44 Chapter 6. Kokkuvote

Appendix A
Sources-of-Workload Comparison
Cards
EffortOr
Performance
TemporalDemand
OrFrustration
TemporalDemand
OrEffort
PhysicalDemand
OrFrustration
Performance
OrFrustration
PhysicalDemand
OrTemporalDemand
PhysicalDemand
OrPerformance
TemporalDemand
OrMentalDemand
Frustration
OrEffort
Performance
OrMentalDemand
Performance
OrTemporalDemand
MentalDemand
OrEffort
MentalDemand
OrPhysicalDemand
EffortOr
PhysicalDemand
Frustration
OrMentalDemand
Figure A.1: Sources-of-Workload Comparison Cards (Human Performance ResearchGroup, 1986)
45

Appendix B
NASA-TLX Rating Scale
Figure B.1: NASA-TLX Rating Scale (Human Performance Research Group, 1986)
46

Appendix C
Source-of-Workload Tally Sheet
SOURCES-OF-WORKLOADTALLYSHEET
ScaleTitle
Tally
Weight
MENTALDEMAND
PHYSICALDEMAND
TEMPORALDEMAND
PERFORMANCE
EFFORT
FRUSTRATION
Totalcount=
Figure C.1: Source-of-Workload Tally Sheet (Human Performance Research Group, 1986)
47

Appendix D
Weighted Rating Worksheet
WEIGHTEDRATINGWORKSHEET
ScaleTitle
Weight
RawRating
AdjustedRating(WeightXRaw)
MENTALDEMAND
PHYSICALDEMAND
TEMPORALDEMAND
PERFORMANCE
EFFORT
FRUSTRATION
Sumof“AdjustedRating”Column= WEIGHTEDRATING= (SumofAdjustedRating/15)
Figure D.1: Weighted Rating Worksheet (Human Performance Research Group, 1986)
48

Appendix E
Code Density Example
Figure E.1: Code Density Example
49

References
Backs, R. W., Ryan, A. M., & Wilson, G. F. (1991, 9). Cardiorespiratory Measures
of Workload during Continuous Manual Performance. Proceedings of the Human
Factors and Ergonomics Society Annual Meeting , 35 (20), 1495–1499. Retrieved
from http://pro.sagepub.com/lookup/doi/10.1177/154193129103502016 doi:
10.1177/154193129103502016
Baecker, R. M. (1993). Readings in groupware and computer-supported cooperative work:
Assisting human-human collaboration. Elsevier.
Besacier, G., Tournet, J., Goyal, N., Cento, F., & Scott, S. D. (2014). Object and
ARM shadows: visual feedback for cross device transfer. the extended abstracts of
the 32nd annual ACM conference, 463–466. Retrieved from http://dl.acm.org/
citation.cfm?doid=2559206.2574832 doi: 10.1145/2559206.2574832
Biehl, J. T., Baker, W. T., Bailey, B. P., Tan, D. S., Inkpen, K. M., & Czerwinski,
M. (2008). Impromptu: a new interaction framework for supporting collaboration
in multiple display environments and its field evaluation for co-located software
development. In Proceedings of the sigchi conference on human factors in computing
systems (pp. 939–948). ACM.
Borchers, J. O. (2000). CHI meets PLoP: An interaction patterns workshop. ACM
SIGCHI Bulletin, 32 (1), 9–12.
Chen, N., Guimbretiere, F., & Sellen, A. (2012). Designing a multi-slate reading environ-
ment to support active reading activities. ACM Transactions on Computer-Human
Interaction (TOCHI), 19 (3), 18.
Chen, X. A., Grossman, T., Wigdor, D. J., & Fitzmaurice, G. (2014). Duet: Exploring
50

REFERENCES 51
Joint Interactions on a Smart Phone and a Smart Watch. Proceedings of the 32nd an-
nual ACM conference on Human factors in computing systems - CHI ’14 , 159–168.
Retrieved from http://dl.acm.org/citation.cfm?id=2556288.2556955 doi:
10.1145/2556288.2556955
Cicchetti, D. V. (1994). Guidelines, criteria, and rules of thumb for evaluating normed
and standardized assessment instruments in psychology. Psychological assessment ,
6 (4), 284.
Czerwinski, M., Meyers, B., Tan, D. S., & Robertson, G. G. (2009, 2). Managing arbitrary
window regions for more effective use of screen space. Google Patents.
Elmqvist, N. (2011). Distributed User Interfaces: State of the Art. In (pp. 1–12).
Retrieved from http://link.springer.com/10.1007/978-1-4471-2271-5{\ }1
doi: 10.1007/978-1-4471-2271-5{\ }1
Emmert, P., & Barker, L. L. (1989). Measurement of communication behavior. Longman
Publishing Group.
Goel, M., Lee, B., Islam Aumi, M. T., Patel, S., Borriello, G., Hibino, S., & Begole, B.
(2014). SurfaceLink: Using Inertial and Acoustic Sensing to Enable Multi-Device
Interaction on a Surface. Proceedings of the 32nd annual ACM conference on
Human factors in computing systems - CHI ’14 , 1387–1396. Retrieved from
http://dl.acm.org/citation.cfm?id=2557120{\textbackslash}nhttp://dl
.acm.org/citation.cfm?doid=2556288.2557120 doi: 10.1145/2556288.2557120
Hart, G., Sandra. (2006). NASA-task load index (NASA-TLX); 20 years later. Human
Factors and Ergonomics Society Annual Meting , 904–908. doi: 10.1037/e577632012
-009
Hart, S. G., & Staveland, L. E. (1988). Development of NASA-TLX (Task Load Index):
Results of Empirical and Theoretical Research. Advances in Psychology , 52 (C),
139–183. doi: 10.1016/S0166-4115(08)62386-9
Hendy, K. C., Hamilton, K. M., & Landry, L. N. (1993). Measuring subjective workload:
when is one scale better than many? Human Factors: The Journal of the Human
Factors and Ergonomics Society , 35 (4), 579–601.
52 REFERENCES
Hill, S., Iavecchia, H., Byers, J., Bittner, a., Zaklad, a., & Christ, R. (1992).
Comparison of four subjective workload rating scales. Human Factors , 34 (4),
429–439. Retrieved from http://www.ingentaconnect.com/content/hfes/hf/
1992/00000034/00000004/art00005 doi: 10.1177/001872089203400405
Hsieh, H.-F. (2005, 11). Three Approaches to Qualitative Content Analysis. Qualitative
Health Research, 15 (9), 1277–1288. Retrieved from http://qhr.sagepub.com/
cgi/doi/10.1177/1049732305276687 doi: 10.1177/1049732305276687
Human Performance Research Group. (1986). NASA Task Load Index User Man-
ual v. 1.0. Retrieved from https://humansystems.arc.nasa.gov/groups/TLX/
downloads/TLX.pdf doi: 10.293994-13
Johanson, B., Hutchins, G., Winograd, T., & Stone, M. (2002). PointRight: experience
with flexible input redirection in interactive workspaces. In Proceedings of the 15th
annual acm symposium on user interface software and technology (pp. 227–234).
ACM.
Landis, J. R., & Koch, G. G. (1977). The measurement of observer agreement for
categorical data. Biometrics , 33 (1), 159–174. doi: 10.2307/2529310
Lenz, E., Diefenbach, S., & Hassenzahl, M. (2014). Aesthetics of interaction. In Proceed-
ings of the 8th nordic conference on human-computer interaction fun, fast, foun-
dational - nordichi ’14 (pp. 628–637). New York, New York, USA: ACM Press.
Retrieved from http://dl.acm.org/citation.cfm?doid=2639189.2639198 doi:
10.1145/2639189.2639198
Lysaght, R. J., Hill, S. G., Dick, A. O., Plamondon, B. D., & Linton, P. M. (1989). Oper-
ator workload: Comprehensive review and evaluation of operator workload method-
ologies (Tech. Rep.).
Martinez Plasencia, D., Knibbe, J., Haslam, A. D., Latimer, E. J., Dennis, B., Lewis,
G. J., . . . Coyle, D. (2014). ReflectoSlates: personal overlays for tabletops combining
camera-projector systems and retroreflective materials. In Chi’14 extended abstracts
on human factors in computing systems (pp. 2071–2076). ACM.
McHugh, M. L. (2012). Interrater reliability: the kappa statistic. Biochemia medica,

REFERENCES 53
22 (3), 276–282.
Melchior, J. (2011). Distributed user interfaces in space and time. In Proceedings of
the 3rd acm sigchi symposium on engineering interactive computing systems (pp.
311–314). ACM.
Myers, B. A., Stiel, H., & Gargiulo, R. (1998). Collaboration using multiple PDAs
connected to a PC. In Proceedings of the 1998 acm conference on computer supported
cooperative work (pp. 285–294). ACM.
Nygren, T. E. (1991). Psychometric properties of subjective workload measurement tech-
niques: Implications for their use in the assessment of perceived mental workload.
Human Factors: The Journal of the Human Factors and Ergonomics Society , 33 (1),
17–33.
Portney, L. G., & Watkins, M. P. (2015). Foundations of clinical research: applications
to practice. FA Davis.
Shmorgun, I., & Lamas, D. (2015). Exploring the Use of the Human-artifact Model for
Studying Ubiquitous Interactions. In Proceedings of the mulitimedia, interaction,
design and innnovation (p. 6). ACM.
Shmorgun, I., Lamas, D., & Mercer, E. (2016). Towards a Pattern Language for
Distributed User Interfaces. In Proceedings of the 2016 chi conference extended
abstracts on human factors in computing systems - chi ea ’16 (pp. 2712–2718).
New York, New York, USA: ACM Press. Retrieved from http://dl.acm.org/
citation.cfm?doid=2851581.2892304 doi: 10.1145/2851581.2892304
Stemler, S. E. (2010). A comparison of consensus, consistency, and measurement ap-
proaches to estimating interrater reliability. Pract Assess Res Eval [serial online].
2004; 9: e4.
Wallace, J. R., Mandryk, R. L., & Inkpen, K. M. (2008). Comparing content and
input redirection in MDEs. In Proceedings of the 2008 acm conference on computer
supported cooperative work (pp. 157–166). ACM.
Weinger, M. B., Reddy, S. B., & Slagle, J. M. (2004, 5). Multiple measures of anesthesia
workload during teaching and nonteaching cases. Anesthesia and analgesia, 98 (5),

54 REFERENCES
1419–25. Retrieved from http://www.ncbi.nlm.nih.gov/pubmed/15105224
Winkler, C., Lochtefeld, M., Dobbelstein, D., Kruger, A., & Rukzio, E. (2014). Sur-
facePhone. CHI ’14: Proceedings of the 32nd annual ACM conference on Human
factors in computing systems , 3513–3522. Retrieved from http://dl.acm.org/
citation.cfm?id=2556288.2557075 doi: 10.1145/2556288.2557075
Wozniak, P. W., Schmidt, B., Lischke, L., Franjcic, Z., Yantac, A. E., & Fjeld, M.
(2014). MochaTop. Proceedings of the extended abstracts of the 32nd annual ACM
conference on Human factors in computing systems - CHI EA ’14 , 2329–2334.
Retrieved from http://dl.acm.org/citation.cfm?id=2559206.2581232 doi:
10.1145/2559206.2581232