tampere university of technology. publication 883 · the diode laser is increasingly used as an...
TRANSCRIPT

Tampereen teknillinen yliopisto. Julkaisu 883 Tampere University of Technology. Publication 883
Matti Harkoma Confinement in the Diode Laser Ignition of Energetic Materials Thesis for the degree of Doctor of Technology to be presented with due permission for public examination and criticism in Sähkötalo Building, Auditorium S1, at Tampere University of Technology, on the 10th of June 2010, at 12 noon. Tampereen teknillinen yliopisto - Tampere University of Technology Tampere 2010

ISBN 978-952-15-2354-0 (printed) ISBN 978-952-15-2405-9 (PDF) ISSN 1459-2045

iii
Abstract
The diode laser is increasingly used as an ignition device for pyrotechnic mixtures
or propellants and for explosives. The ignition properties of different energetic
materials are important for understanding the ignition mechanism or choosing the
best or suitable material for the current laser ignition application. One of the most
important variables is the ignition energy. Thus it is reasonable to study the
minimum ignition energy of many energetic materials and choose the best
material among them. Other criteria may be, for example, the detonation
properties of the current material as a booster or an igniter and the ageing
properties of the current material.
A strong dependence between the ignition energy and the ambient pressure was
observed in the results. For example, in the case of RDX98/1/1+1% carbon black
the measured energy in an ambient pressure of 10 bar was 180 mJ and in an
ambient pressure of 50 bar it was 32.6 mJ. Mean ignition energy densities were
29,9 J/cm2 and 5,4 J/cm2, respectively. The carbon black content’s effect on the
ignition energy is clear between 1% and 3%, the ignition energy at 2% carbon
black content being 27% lower than at 1% carbon black content, and 31% lower
than at 3% carbon black content. According to the experiments, the mechanical
properties of the RDX pellet are fragile at 3% or higher carbon black content.
Thus the optimum carbon black content may be 1,5 to 2,5%.
According to the diode laser ignition experiments with synthetic air and argon the
ignition energies are essentially the same in the same confinement. These results
suggest that oxygen (in synthetic air) has no remarkable reactions in the laser
illuminated point of the RDX pellet or more generally in the laser illuminated
point of the explosive.
For nitrogen the ignition energies are slightly higher compared with air (and also
with argon) in the same pressure. This is analogous compared with the CO2 laser
ignition results at lower pressures by other authors, but at higher pressures of air

iv
and nitrogen the experimental results of this work and of the reference are in
reverse order.
Evaporated RDX and gaseous decomposition products expand and will displace
synthetic air, nitrogen or argon. Initial decomposition takes place in the vapour
phase of RDX and on the surface of melted RDX. Highly exothermic reactions
begin in the vapour phase and are followed by more rapid decomposition in the
vapour phase and in the liquid phase and ignition of RDX. The rate of the
reactions is deflagration, but it accelerates to the steady state detonation in the
environment of high confinement. The conclusion that can be drawn is that the
ignition process is not only a solid phase reaction but a complex process where
gas, liquid, and/or solid phase reactions are involved.
According to this work, the degree of confinement has a strong role in the
deflagration to detonation transition ignition mechanism. Using a degree of
confinement that is heavy enough, a closed and tight mechanical structure, a high
enough pressure inside the device, and good absorbance, for example using
carbon black in the energetic material, the ignition energy would be low enough
for economically viable applications of compact diode laser igniters.

v
Preface
The present work was carried out in the Explosive Technology Laboratory of the
Finnish Defence Forces Technical Research Centre (PVTT) and in the Department
of Electronics at the Tampere University of Technology. I am very grateful to my
supervisor Prof. Karri Palovuori for his support and valuable advice during this
work. I would specially like to thank my colleagues M.Sc. Maija Hihkiö and M.Sc.
Mari-Ella Sairiala, M.Sc. Tapio Heininen, and Lic.Phil. Timo-Jaakko Toivanen.
Special thanks are due to Techn. Tellervo Vormisto and Bachelor of Laboratory
Services Tiina Runsas for support and for very good teamwork as well as Techn.
Petri Wallgrén for the many quality pictures in this thesis.
In the course of laser ignition research at PVTT, the author spent two months in
1997 at the Energetic Material Laboratory of FOI, in Grindsjön Tumba, Sweden, the
staff of which I would like to thank, and specially Ph.D. Henric Östmark, M.Sc.
Anna Pettersson, M.Sc. Nils Roman, and M.Sc. Janne Pettersson.
All the staff at the Finnish Defence Forces Research Institute of Technology receive
my thanks, in particular Colonel Mika Hyytiäinen, M.Sc. Alpo Kariniemi as well as
the workshop staff and my colleagues. I would like to thank Colonel Ilkka Jäppinen
and Colonel Esa Lappalainen.
I would also like to thank at the Finnish Navy Ing. Commodore Arto Hakala, Ing.
Commander Pekka Loivaranta and Commander Ari Kallio for the financial
resources for laser ignition research at PVTT.
I would also like to thank Prof. Timo Jääskeläinen and Ph.D. Henric Östmark for
their comments and remarks on this thesis.
Finally, I would like to express my deepest gratitude to my wife Sisko and my son
Olli for their best possible support during this work.
Ylöjärvi, December 2009
Matti Harkoma

vi
Contents
Abstract ………………………………………………………………… iii
Preface ………………………………………………………………….. v
Contents ………………………………………………………………… vi
List of Abbreviations and Symbols …………………………………… viii
1. Introduction ………………………………………………………….. 1
2. Theory of burning and detonation …………………………………. 3
2.1 Burning ……………………………………………………………… 3
2.2 Deflagration …………………………………………………………. 6
2.3 Detonation …………………………………………………………… 7
2.3.1 Conservation of Mass ……………………………………………... 15
2.3.2 Conservation of Momentum ………………………………………. 17
2.3.3 Conservation of Energy …………………………………………… 18
2.4 Forest Fire Model ……………………………………………………. 23
2.5 Hot spots ……………………………………………………………... 25
2.6 Lee-Tarver Ignition and Growth Model ……………………………... 29
2.7 DDT type ignition …………………………………………………… 32
2.8 Krause’s exact differential equation of heat explosion ……………… 39
2.9 STD type ignition ……………………………………………………. 42
3. Diode laser ignition of energetic materials ………………………… 45
3.1 Introduction ………………………………………………………….. 45
3.2 Methods and experimental setup ……………………………………. 45
3.3 Diode laser ignition of explosives …………………………………… 49
3.4 Laser ignition of RDX ………………………………………………. 55
3.5 Confinement in the DDT type laser ignition and discussion ………... 62
4. Conclusions …………………………………………………………... 76
vii
Appendix 1 ……………………………………………………………… 78
Up-and-down Method and laser ignition experiments
Appendix 2 ……………………………………………………………… 82
Decomposition of RDX at fast heating rates and its detonation products
Appendix 3 ………………………………………………………………. 84
Decomposition of gaseous RDX in the laser-induced ignition process
Appendix 4 ……………………………………………………………… 87
Patent of Laser Detonator
References ……………………………………………………………….. 99

viii
List of Abbreviations and Symbols
AD Ammonium Perchlorate
BKW Becker-Kistiakowsky-Wilson
CJ Chapman-Jouguet
C-J State Chapman-Jouguet State
DATB Diaminotrinitrobenzene
DDT Deflagration to Detonation Transition
DSC Differential Scanning Calorimeter
FPX Forcit Plastic-Bonded Explosive
HMX Octogen
HNS Hexanitrostilbene
IR Infra Red
JWL Jones-Wilkins-Lee
LI/MS Laser Ignition with Mass Spectroscopy
LIF Laser Induced Fluorescence
NIR Near Infra Red
NM Nitromethane
NTO Nitrotriazolone
NQ Nitroguanidine
P1 Pentolite One
PBX Plastic-Bonded Explosive
PETN Pentolite
PVTT Puolustusvoimien Teknillinen Tutkimuslaitos
RDX Royal Demolition Explosive, Hexogen
STD Shock to Detonation Transition
TG Thermo Gravimetric
TNT Trinitrotoluene
TATB Triaminotrinitrobentzene
UV Ultra Violet
VIS Visible
YAG Yttrium Aluminum Garnet
ZND Zeldovich, Von Neumann, Deering

ix
A Area or Pre-exponential Factor or Constant
B Constant
C Constant or Heat Capacity in the Theory of DDT Type Ignition
vC Heat Capacity at Constant Volume
pC Heat Capacity at Constant Pressure
VC Average Heat Capacity
D Detonation Velocity
E Energy or Energy Fluence in the Theory of SDT Type Ignition
aE Activation Energy
cE Critical Energy Fluence in the Theory of SDT Type Ignition
Eign Ignition Energy
F Force or Fraction of Explosive that has reacted
G Gibbs Free Energy or Growth Rate Function or Constant in the Lee-
Tarver Ignition and Growth Model
aG Gibbs Free Energy of Activation
fusH Heat of Fusion
vH∆ Heat of Evaporation
subH∆ Heat of Sublimation
H∆ Enthalpy
I Constant in the Ignition and Growth Theory or Light Intensity
L Length or Characteristic Length in the Theory of Krause
P Shock Pressure in the Theory of SDT
Po Initial Pressure
crP Critical stress
P1 Final State Pressure
P(T) Radiation Term in the Theory of DDT Type Ignition
R Gas Constant
1R Constant in the Lee-Tarver Ignition and Growth Model
2R Constant in the Lee-Tarver Ignition and Growth Model
S Entropy of the System
T Temperature

x
To Initial Temperature
cT Critical Temperature in the Theory of DDT Type Ignition
'cT Critical Temperature in the Theory of Hot Spots
dT Deflagration Temperature
T1 Final State Temperature
0mT Normal Melting Point
mT Melting Point
UT Ambient Temperature in the Theory of Krause
Q Heat of Reaction or Heat of Decomposition in the Theory of DDT
Type Ignition
U Internal Energy of the System or Shock Velocity in the Theory of
SDT Type Ignition
Vo Specific Volume or Initial Specific Volume of Explosive
V1 Final State Volume or Specific Volume of Shocked, Unreacted
Explosive
W Mass Fraction of Undecomposed Material
Z Geometry Factor of the Burning Material or Collision Number in the
Theory of DDT Type Ignition
a Radius or Half-thickness in the Theory of DDT Type Ignition
a Thermal Diffusivity in the Theory of Krause
c Specific Heat
e Internal Energy in the Conservation Laws or Emissivity in the
Stefan-Boltzmann’s law
h Planck’s Constant
0k Pre-exponential Factor
kB Boltzmann’s Constant
m Mass
n Number of Moles
p Pressure in the Lee-Tarver Ignition and Growth Model
ps Shock Pressure in the Theory of Hot Spots
zp Pressure Dependent Laminar Burn Rate
r Constant in the Lee-Tarver Ignition and Growth Model

xi
t Time
u Particle Velocity in the Theory of SDT
pu Particle Velocity
v Specific Volume
w Volume or Beam Radius in the Theory of DDT
x Constant in the Lee-Tarver Ignition and Growth Model
y Constant in the Lee-Tarver Ignition and Growth Model
z Constant in the Lee-Tarver Ignition and Growth Model
α Pressure Coefficient of Melting Point in the Theory of Hot Spots or
Absorption Coefficient in the Theory of DDT Type Ignition
2∇ Laplacian Operator
δ Shape Factor in the Theory of DDT Type Ignition
21,δδ Dimensionless Parameters in the Theory of Krause
Θ Dimensionless Variable in the Theory of Krause
ϑ Temperature Difference in the Theory of Krause
λ Thermal Conductivity or Thermal Diffusivity in the Theory of DDT
Type Ignition
*λ Degree of Chemical Reaction
ξ Dimensionless Coordinate in the Theory of Krause
ρ Density
oρ Density of Unshocked Material
σ Stefan’s Constant
τ Characteristic Time
ω Grüneisen Coefficient

1
1. Introduction
Energetic materials are materials that have fuel and oxidizer in the same molecule
or in an intimate mechanical mixture of several molecules and include both
explosives and propellants. Useful energetic materials have chemical energy
between 2900 and 6700 J/g.1 A traditional way to initiate detonation in explosive
material has been to use hot wire detonators or igniters. These devices of initiation
are also known as electroexplosive devices. There are associated serious safety
problems with them because of electromagnetic radiation and spurious electrical
signals in many applications for example in space and military technology and
also in blasting technology.
In today’s blasting technology and in some military applications nonelectric
detonators are used, where a hollow plastic shock tube delivers the firing impulse
to the detonator, making it immune to hazards associated with stray electrical
currents. The latest electronic initiation systems with digital detonators are also
considered to be quite immune to the hazards associated with stray electrical
currents.
Laser-initiated devices do not contain electrical circuits and are not directly
attached to electrical equipment. Between the laser source and the individual
explosive component, nonconductive fiber optics is used. This basic construction
leads to better electrical immunity.4 The safety and insensitivity demands for
energetic materials and ignition systems in many applications recommend the use
of laser-initiated devices.
The use of lasers as ignition sources has been extensively applied to studies of the
ignitability of explosives and pyrotechnical materials. The laser was first
introduced as an ignition source for energetic materials by Brish et al2, 3 and
Menichelli and Yang4, 5 in the sixties and early seventies. They did the studies
using a Q-Switched Ruby laser and a YAG-laser. The ignition mechanism is from

2
shock to detonation transition (STD). Laser ignition studies of both deflagration
and detonation using a CO2 laser have also been carried out. The ignition
mechanism with explosives is from deflagration to detonation transition (DDT).
The diode laser is increasingly used as an ignition device for pyrotechnic mixtures
or propellants and for explosives. When using this device, the ignition mechanism
with explosives is also from deflagration to detonation transition.
To understand both ignition mechanisms – from deflagration to detonation and
from shock to detonation – it is useful to know the basic theory of detonation and
know the theoretical descriptions of ignition. Experimental laser ignition studies
have proved to be very important for understanding the ignition mechanisms. One
significant result of the experiments has been the discovery of a strong
dependence between the energy necessary for ignition and the surrounding gas
pressure. The conclusion that can be drawn is that the ignition process is not only
a solid phase reaction but is a complex process where gas, liquid, and/or solid
phase reactions are involved.
The technical evolution has taken place in laser sources - diode lasers and YAG
lasers – making them increasingly economically viable for many applications of
ignition devices and ignition systems. As a proof from this many published
patents for defense and space applications can be mentioned and in conference
presentations laser initiation devices and systems for both applications have been
published.

3
2. Theory of burning and detonation
2.1 Burning
Burning or combustion is known as a complex sequence of exothermic chemical
reactions between a fuel and an oxidant, which mostly consists in oxygen in the
air. Many materials based on carbon and hydrogen compounds, including wood,
burn indirectly so that the combustion takes place as a reaction between oxygen
and the gases released from the material. An exception from this rule is the
glowing combustion of charred wood where oxygen reacts directly with carbon.
Under the influence of heat, wood easily produces substances that react eagerly
with oxygen, leading to the high propensity of wood to ignite and burn.6, 7
Ignition and combustion of wood is mainly based on the pyrolysis, i.e. thermal
decomposition of cellulose and lignin, and the reactions of pyrolysis products
with each other and with gases in the air, mainly oxygen. When temperature
increases and its level is high enough, about 270oC, cellulose starts to pyrolyse.
The decomposition products either remain inside the material or are released as
gases. Gaseous substances react with each other and oxygen, releasing a large
amount of heat that further induces pyrolysis and combustion reactions.
Combustion reactions are accompanied many times by production of light in the
form of either glow or flames.6, 7
Empirically it has been observed that the temperature dependence of the reaction
rate follows the Arrhenius equation:8
RTEaAek −= , (2.1.1)
where A is called the pre-exponential factor and will vary depending on the order
of the reaction. aE is the activation energy, R is the gas constant and T is the

4
temperature in Kelvin. In the Fig. 2.1 two reaction profiles are depicted
schematically for reactants 1 and reactants 2. The horizontal axis is the reaction
coordinate, and the vertical axis is the potential energy. The enthalpy in the
exothermic reaction is H∆ . In the decomposition of an energetic material, the
reaction can be written in the simplified form: ( ) ( ) CBAABCABC ++→↔ # ,
where ( )#ABC describes the activated complex.
Fig. 2.1.1 The diagram of a reaction profile. The horizontal axis is the reaction
coordinate, and the vertical axis is potential energy.
The transition state theory of chemical reactions gives for chemical reactions:9
RTGB aeh
Tkk ∆−= , (2.1.2)
where aG is Gibbs free energy of activation, kB is Boltzmann’s constant, and h is
Planck’s constant. In the transition state theory, an activated molecule is formed

5
during the reaction in the transition state between forming products and reactant
or reactants. It is also known as the activated complex theory or the theory of
absolute reaction rates.8
The Gibbs free energy has the form: G = U + pV – TS, where U is the internal
energy of the system and S is the entropy of the system. The enthalpy of the
system has the form: H = U + pV, which has a negative value in the case of
exothermic reactions, for example, in the case of burning. In the constant pressure
the system’s enthalpy H , is decreased by the amount of 0<∆H . The free energy
of activation includes an entropy term as well as an enthalpy term, both of which
depend on temperature. In the Fig. 2.1.1 HG ∆=∆ is the heat of the
decomposition reaction of an explosive molecule, as an example.
The activation energy has been understood in quantum mechanics to be a
potential energy barrier separating two minima of potential energy, of the
reactants and of the products of reaction. When the temperature rises the molecule
has a higher probability to penetrate the potential energy barrier.8
The precise form of the temperature dependence depends upon the reaction, and
can be calculated using formulas from statistical mechanics involving the partition
functions of the reactants and of the activated complex.9
The Arrhenius burning equation for energetic materials has the form:
nja TREn
jnj
nj etZWWW −+ ∆−=1 , (2.1.3)
where 01 ≥≥ W . W is the mass fraction of undecomposed material. Z is 1 for
slabs, 2 for cylinders and 3 for spheres. aE is the activation energy. R is the gas
constant and T is the temperature in Kelvins.17

6
2.2 Deflagration
Deflagration is a process of subsonic combustion that usually propagates through
thermal conductivity; hot burning material heats the next layer of unburned
material causing decomposition and oxidation. The process is propagating by
releasing energy. In deflagration the linear speed of the reaction front is classified
as being between 0.001 and 1500 ms-1. Sometimes the slowly deflagration is
classified as the reaction speed of 0.001 to 10 ms-1 and correspondingly fast
deflagration is classified as the speed of 10 to 1500 ms-1. In the Table 2.2.1 some
typical qualities of combustion, deflagration and detonation are compared.
Combusting Solid Fuel
Deflagrating Energetic Material
Detonating Energetic Material
Material or element and oxidant
Carbon and hydrogen with oxygen in air
Propellant, molecular structure usually includes the oxidant
High Explosive, molecular structure includes the oxidant
Linear speed of the reaction front [m/s]
10-5 1x10⁻³ – 1.5x10³ 2x10³ - 9x10³
The character of the chemical reaction
Redox mechanism Redox mechanism Redox mechanism
Reaction time [s] 10-1 10-3 10-6 Propagation of the reaction
Heat conduction Heat conduction Shock front and phonon flow
Heat of reaction [kJ/kg]
104 103 103
Power [W/cm3] 10 103 109 Typical mechanism of ignition
Heat Hot particles, hot gases, hot spots
High temperature with confinement, shock wave, hot spots
Typical overpressure following the reaction front [bar]
0 – 7
7 – 7x10³
70 – 7x10⁵
Table 2.2.1 Comparison between some typical properties of combustion,
deflagration and detonation.
Deflagration is a typical way of burning in the case of powders and pyrotechnical
materials. A powder is usually stoichiometric mixture of oxidant and fuel. It may
be a mixture of several materials, for example black powder or it may be a

7
composite propellant consisting of oxygen-donating inorganic salts and a binder
made of plastic or nitrates and perchlorates and plastic binders. Ammonium
Perchlorate (AD) in particular is used as an oxidizer. RDX or other similar
energetic materials are used as nitrates. It may be nitrated hydrocarbons, such as
cellulose nitrate powders.10
Sometimes black powder is classified as a pyrotechnical material. Other typical
pyrotechnical materials are smoke producing mixtures and color light producing
mixtures.
Under certain circumstances and conditions, a burning or deflagration reaction
can grow into a full steady-state detonation. If an explosive is ignited, it starts to
deflagrate, and if it is confined so that the reaction product gases cannot escape,
then the gas pressure in the deflagrating region builds up. Burning reaction rates
are a function of pressure as well as temperature and therefore the reaction rate
increases as pressure increases.14
2.3 Detonation
Detonation is a supersonic form of combustion. It proceeds through the explosive
as a wave, traveling at several times the speed of sound in the material.
Detonation differs from other forms in that all the important energy transfer is by
mass flow in strong compression waves, with negligible contributions from other
processes like heat conduction which are so important in flames. The shock heats
the material by compressing it, thus triggering chemical reaction, and a balance is
attained so that the chemical reaction supports the shock. The material is
consumed 103 to 108 times faster than in a flame, making detonation easily
distinguishable from other combustion processes. Wave velocities in solid and
liquid explosives have a range from 2000 to 9000 m/s. For example, the

8
detonation wave in RDX with an initial density of 1.76 g/cm3 travels 8750 m/s.10,
12
In the detonation theory, the detonation is seen as a shock wave moving through
an explosive. The thermodynamic state of the system is accurately described by
the Chapman-Jouguet model (C-J model).11, 12 This theory does not provide
insight into the molecular level events occurring in the solid behind the shock
front. These are the zones which lie between the unreacted solid and the reaction
products.13 The broader theory is known as ZND-model (Zeldovich, Von
Neumann, Deering, in the early 1940s). The basic assumptions in this theory
are14: 1. The flow is one dimensional. 2. The front of the detonation is a jump
discontinuity. 3. The reaction-product gases leaving the detonation front are in
chemical and thermodynamic equilibrium and the reaction is completed. 4. The
chemical reaction-zone length is zero. 5. The detonation rate or velocity is
constant. 6. The gaseous reaction products, after leaving the detonation front, may
be time dependent and are affected by the surrounding system or boundary
conditions.
The assumption 2 neglects the transport effects: Heat conduction, Radiation,
Diffusion and Viscosity. The assumptions 3, 4, 5 and 6 can be written in other
words: 3b. The reaction rate is zero ahead of the shock and finite behind, and the
reaction is irreversible12. It proceeds in the forward direction only. 4b. All
thermodynamic variables other than the chemical composition are in local
thermodynamic equilibrium everywhere12.
With these constraints, the detonation is seen as a shock wave moving through an
explosive. The shock front compresses and heats the explosive, which initiates a
chemical reaction. The exothermic reaction is completed instantly. The energy
liberated by the reaction feeds the shock front and drives it forward. At the same
time the gaseous products behind this shock wave are expanding and a rarefaction
moves forward into the shock. The shock front, the chemical reaction, and the

9
leading edge of the rarefaction are all in equilibrium. They are all moving at the
same speed, which is the detonation velocity D.14
In the Figure 2.3.1 (a) is depicted as an idealized shock front propagating through
a material. The initial state is characterized by a pressure Po, a temperature To, and
a specific volume Vo. The final state is characterized by P1, T1, and V1. The front
of the shock does not change shape over time, which means that the pressure
remains constant over time. The detonation velocity does not change over time.
Figure 2.3.1 (b) shows the essential physical and chemical elements of the shock
wave in the detonation. The shock front has a finite rise time. Typically the rise of
the front extends over a few nm, corresponding to a rise time of ~1 ps.11, 12
Fig. 2.3.1 The idealized shock front a) and the weak shock front with reaction
zones b). The breadth of the up-pumping zone is lup .15

10
In the phonon rich zone the molecular vibrations, which are not directly pumped
by the shock, have yet to be excited. In the up-pumping zone, the energy in the
phonon modes is transferred to the vibrations by multiphonon up-pumping
process. These two baths equilibrate within ~10-10 s corresponding to 10-7 m. As
the vibrational modes are excited, reactivity is enhanced and bond breaking due to
thermal decomposition occurs in the molecules. This is the ignition zone and
extends to ~10-9 s and 10-6 m behind the shock front. In explosives and other
energetic materials, endothermic bond breaking reactions are the precursors to
detonation, a series of exothermic chain reactions occurring in the reaction zone
10-8 - 10-6 s corresponding to 10-5 -10-3 m behind the front.16 , 17
In the Figure 2.3.2 depicts a P-V plane representation of detonation. P is the
pressure and V is the specific volume. The density isρ , which is the inverse value
of the specific volume, ρ1=V . The point (A) represents the initial state of the
unreacted explosive. At the point (A) the explosive is in the pressure of Po. This
pressure Po may usually be 1 bar. The explosive has a specific volume of 0V . The
initial density is 0ρ . The state at the point (C) indicates the jump condition to the
fully shocked but as yet unreacted explosive. In Figure 2.3.1 that means just the
jump from the pressure Po to P1. On the other Hugoniot, the point (B) represents
the state of reaction products.

11
Fig. 2.3.2 P-V plane representation of detonation with the Hugoniot curves of
unreacted explosive and detonation products.14
The line from the point (A) through the point (B) to the point (C) is called the
Raleigh Line. The state of reaction products is at the point where the Raleigh line
tangent to the products Hugoniot at the point (B). This is called the Chapman-
Jouguet C-J state (Figure 2.3.2).

12
Fig. 2.3.3 Various Raleigh line possibilities.
The conservation conditions require that the final state point in the P-V plane lie
on both the Hugoniot curve of detonation products and the Rayleigh line.
Three of the possible Raleigh lines (Eq. (2.3.2.3)) are depicted in Fig. 2.3.3. Each
of them represents a different value of detonation velocity, say D1 (OVER), Dj and
D2 (UNDER). For a sufficiently small value of detonation velocity D2 the Raleigh
line and the Hugoniot curve of detonation products have no intersection, so there
is no solution that satisfies the assumption (2.3.9). For a large detonation velocity
value, say D1, there will be two solutions which are marked F (strong) and E
(weak) in the figure. The flow at the point F or at the strong point is supersonic
with respect to the detonation front, and a disturbance arising behind the front will
overtake it. At the point E or at the weak point the flow is subsonic with respect to
13
the detonation front, and a disturbance behind the front will fall farther behind. At
the tangent point, the C-J state, the flow is sonic.12,14
In the case of a concave shock front, as in an implosion, the convergence effects
may raise the pressure well above the C-J state, with a corresponding increase in
the detonation velocity D.17
Figure 2.3.4 depicts the pressure variation as a function of distance when a
detonation wave moves through the explosive. The scale is larger than in the
picture (2.3.1) (a) and especially much larger than in the picture (2.3.1) (b). In the
initial step of a popular and much used explanation for the initiation of detonation
the shock wave created by the booster or by some other way hits the surface of the
explosive, which compresses. The temperature rises above the ignition point of
the material, initiating chemical reaction within a small region just behind the
shock wave. This small region is known as the reaction zone. Detonation occurs
when the reaction propagates through the explosive at shock velocity. The rapid
rise in pressure is what brings on the reaction. This is known as the Von Neuman
spike. The C-J state (Chapman-Jouguet state) represents the state of the
detonation products at the end of the reaction zone. The gas expansion is
described using the equation of state developed by Taylor. The gas expansion
wave is called as the Taylor wave (Figure 2.3.4). In the case of unreacted
explosive, the pressure is P = Po and the particle velocity is u = 0. In the C-J state
the pressure is PCJ.

14
Fig 2.3.4 Pressure vs distance diagram of a detonation wave.14
If the explosive has heavy rear and side confinement, the gases cannot expand as
freely as unconfined gases; thus the Taylor wave is higher and longer as is
depicted in Figure 2.3.5. When the explosive is very thick along the detonation
axis, the Taylor wave is higher. When the explosive is very thin and there is little
rear or side confinement, the Taylor wave is lower. The actual shape of the Taylor
wave is governed then by a combination of the isentrope for expansion of the
detonation gases, the charge size, and the degree of confinement.14

15
Fig 2.3.5 The influence of confinement on the Taylor wave in the case of thick
High Explosive and in the case of thin High Explosive.14
In the case of laser ignition heavy rear and side confinement was created using the
mechanical environment of the laser ignition pellet (see Figure 4.1.2) and with the
static high pressure of the gas in the ignition chamber.
Before writing the Hugoniot equation on the P-V plane or the equation of state of
high explosive the conservation laws have to be proved.
2.3.1 Conservation of Mass12, 14, 17
Figure 2.3.6 depicts a cylindrical material volume passing through a shock front.
The parameters in front of the shock-wave (Shock Front) are: Particle velocity
0u , density 0ρ , internal energy 0E , and pressure0P . The parameters behind the
shock-wave suddenly change across the shock front and are: Particle velocity 1u ,

16
density 1ρ , internal energy 1E , and pressure1P . The relative velocity of the
material is D. If the case is the detonation of energetic material, D represents the
detonation velocity. When the material is standing still before it is detonated or
shocked, the particle velocity 0u is equal to zero, 00 =u .
Fig 2.3.6 Material is passing through a shock front. The velocity of the material is
D. The cross-sectional area of the material is A.14
The conservation of mass implies that the mass entering equals the mass leaving.
Mass m is equal to density ρ times volume V : Vm ρ= . When the volume V is
equal to the area A times length L: ALV = .
Length in a system like that in Fig 2.3.6 can be found as the distance a particle
travels relative to the shock front, which is the velocity relative to the front times
the time it took travel that length: )()( uDtrelativevelocitytL −=×= .

17
The mass entering is: 00Vm ρ= and the mass leaving is: 11Vm ρ= . Thus:
00 ALm ρ= and 11ALm ρ= . On the other hand, using the equation of the length L
is: )( 00 uDAtm −= ρ and )( 11 uDAtm −= ρ . The mass in is equal to the mass out
and thus: )()( 1100 uDAtuDAt −=− ρρ or )()( 1100 uDuD −=− ρρ , which is the
mass equation. It can be written as:
1
0
0
1
uD
uD
−−
=ρρ
(2.3.1.1)
In most cases, as mentioned before: 00 =u and thus:
10
1
uD
D
−=
ρρ
or )(10 uDD −= ρρ . (2.3.1.2)
Density can be represented by the reciprocal of specific volume v : ρ1=v and
the mass equation (2.3.1.1) can be written in the form:
1
0
1
0
uD
uD
v
v
−−
= (2.3.1.3)
2.3.2 Conservation of Momentum12, 14, 17
The conservation of momentum implies that the rate of change in momentum, for
the mass (Fig. 2.3.6) to go from the state before the shock to the state after the
shock, must be equal to the force applied to it. The force applied is simply the
pressure difference across the front times the area over which it is applied, the
material cross-sectional area: APPF )( 01 −= . The rate of change in momentum

18
is: tmumurate /)( 01 −= . Deriving the mass-balance equation gives
)( uDAtm −= ρ and thus: [ ] tuDAtuuDAturate /)()( 000111 −−−= ρρ .
Canceling t out of this equation and equating this to the equation of F above
gives: )()()( 00011101 uDAuuDAuAPP −−−=− ρρ and canceling out A leaves:
)()()( 00011101 uDuuDuPP −−−=− ρρ . The mass equation (2.3.1.1) gives:
)()( 0011 uDuD −=− ρρ . Combining these two equations yields:
))(( 001001 uDuuPP −−=− ρ , (2.3.2.1)
which is the momentum equation. The common case, where 00 =u gives:
DuPP 1001 ρ=− . (2.3.2.2)
When 1u is eliminated from the conservation equation of mass and momentum the
result defines the Rayleigh line (Fig. 2.3.3), which is expressed by:
( ) ( ) 00022
0 =−−− vvPPDρ . (2.3.2.3)
2.3.3 Conservation of Energy12, 14, 17
The conservation of energy implies that the rate of energy increase of the mass
(Fig 2.3.6) is equal to the rate of work being done on it. The rate of work done on
the mass would be the change in the pressure-volume product divided by the time
required for the process. The volume divided by time is the same as area times
velocity, thus the rate at which work is done on the mass is:
0011/ AuPAuPtw −= . The rate of energy increase of the mass is the sum of the
rate of change in internal energy plus the rate of change in kinetic energy. The
internal energy, E, is the mass times the specific internal energy, e:

19
ALemeE ρ== , and the rate of change in internal energy is:
teALeALtE /)(/ 000111 ρρ −= . The rate of change in kinetic energy is:
tuALuALtEkin /)½(½/ 2000
2111 ρρ −= . Repeating the above, the rate of work done
is equal to the rate of change in energy, and therefore,
tuALuALteALeALAuPAuP /)½(½/)( 2000
21110001110011 ρρρρ −+−=− .
Substituting in this the expression of L, )( uDtL −= , which is derived in the
chapter on conservation of mass (2.3.1), and canceling the A gives:
)½)(()½)(( 20000
211110011 ueuDueuDuPuP +−−+−=− ρρ . Considering from the
chapter on conservation of mass that )()( 1100 uDuD −=− ρρ gives the energy
equation or the equation of conservation of energy:
)½()(
20
21
00
001101 uu
uD
uPuPee −−
−−
=−ρ
. (2.3.3.1)
In the common case where 00 =u and considering the equation of mass (2.3.1.2)
1
0
10
1
v
v
uD
D =−
=ρρ
and the equation of momentum (2.3.2.2) DuPP 1001 ρ=−
gives:
))(½( 100101 vvPPee −+=− . (2.3.3.2)
Considering the explicit assumptions of the ZND model and applying the laws of
conservation of mass and momentum to the shock front (Fig 2.3.1 (a)) gives the
mass equation, the momentum equation and the energy equation:
0
1
1
0
0
1
uD
uD
V
V
−−
==ρρ
, (2.3.1)
))(( 010001 uuuDPP −−=− ρ , (2.3.2)

20
)(21
)(20
21
00
001101 uu
uD
uPuPee −−
−−=−
ρ, (2.3.3)
where the subscripts 0 and 1 refer to the states just in front of and just behind the
shock front, respectively. D is the shock velocity (= detonation velocity) and u is
the particle velocity. 0e is the specific internal energy of the solid explosive at
(P0, V0). 1e is the specific internal energy of the reaction products at (P1, V1). The
equation (2.3.1) is the mass equation, the equation (2.3.2) is the momentum
equation and the equation (2.3.3) is the energy equation. A derivation of these
conservation equations is presented for example in references 5 and 7. In the
common case where 00 =u , these equations have the formula:
D
uD
V
V 1
1
0
0
1 −==
ρρ
, (2.3.4)
DuρPP 1001 =− , (2.3.5)
))((21
100101 VVPPee −+=− . (2.3.6)
The energy equation (2.3.6) is known as the Hugoniot equation on the P-V plane
(Figure 2.3.2). It has been commonly called the equation of state of high
explosive but, according to some references17 this is misleading.
According to the simple theory of detonation12 the Hugoniot equation is proved
beginning from the equation of state of polytropic gas (ideal gas with constant
heat capacity). The equation of state of an ideal gas is: nRTPV = , where n is the
number of moles of the gas. In the case of a polytropic gas with reaction BA →
having constant enthalpy of complete reaction ( qH =∆− ) the equation of state is:

21
RTpv = (2.3.7)
and the specific internal energy is:
qpvqCe v** )1( λγλ −−=−= , (2.3.8)
where vC is the constant-volume heat capacity and *λ specifies the degree of
chemical reaction, changing from 0 for no reaction to 1 for complete reaction. The
heat capacity for the ideal gas is equal: vp CC /=γ , where pC is heat capacity at
constant pressure. The Hugoniot curve is:
00
242
0
2
0
21vp
q
v
v
p
p µµµµ +−=
+
+ , (2.3.9)
where )1/()1(2 +−= γγµ , p is the specific pressure and v is the specific volume.
There are three equations ((2.3.4), (2.3.5), and (2.3.6)) and five variables. Some
numerical modeling methods for these have been developed. One of them is the
widely used is BKW method based on the equation of state of Becker-
Kistiakowsky-Wilson17. An extensive and thorough fundamental description of
the BKW equation of state and method has been published in reference17. Many
applications of the BKW model and method have been published and described in
reference17.
22
Figure (2.3.7) was plotted using the Fortran BKW computer program at the
PVTT, calculating the Hugoniot curve for RDX, when the densities were 1.50,
1.65 and 1.80 g/cm3. The BKW calculated parameters for RDX are published in
Table (2.3.1). According to those results the CJ pressure and the detonation
velocity increase, and, correspondingly, the CJ temperature and the CJ volume
decrease, when the density of the RDX increases.
Fig 2.3.7 BKW calculated Hugoniot’s for the reaction products of RDX when
density is 1) 1.80 2) 1.65 and 3) 1.50.

23
Table 2.3.1 Some BKW calculated parameters for RDX when density is 1.50,
1.65 and 1.80.
2.4 Forest Fire Model
The basic mechanism of heterogeneous explosive shock initiation is shock
interaction at density discontinuities, which produces local hot spots that
decompose and add their energy to the flow17. Typical heterogeneous explosives
are for example plastic bonded explosives.
According to the experimental studies with heterogeneous explosives a shock
wave interacts with the density discontinuities, producing numerous local hot
spots that explode but do not propagate. The released energy strengthens the
shock, it interacts with additional inhomogeneities, higher temperature hot spots
are formed and more of the explosive is decomposed. The shock wave grows
Density of RDX
[g/cm3]
1.50 1.65 1.80
CJ Pressure
[Mbar]
0.23037 0.28294 0.34666
Detonation Velocity
[km/s]
7643.86 8176.88 8753.99
CJ Temperature
[oK]
3132.5 2880.1 2587.6
CJ Volume
[cm3/g]
0.49143 0.45062 0.41593
Computed γ 2.80437 2.89906 2.97904
Volume of the gas
[cm3/mole]
0.13600 0.12557 0.16223

24
stronger, releasing more and more energy, until it becomes strong enough to
produce propagating detonation.18
A model, called Forest Fire Model after its originator, Charles Forest,19 has been
developed for describing the decomposition rates as a function of the
experimentally measured distance of run of detonation vs. shock pressure and the
reactive and nonreactive Hugoniot. The model can be used to describe the
decomposition from shocks formed either by external drivers or by internal
pressure gradients formed by the propagation of a burning front for the
heterogeneous explosives.17
A model for the burning resulting from the shock initiation of heterogeneous
explosives is included by calculating the rate from the equation:17
( )nXPCPBPAnj
nj teWW +++++ ∆−= ...1 2
1 , (2.4.1)
where
( )( ) nXPCPBPAedtdWW ++++=− ...2
1 (2.4.2)
from Pminimum to PCJ. Here W is the mass fraction of undecomposed explosive and
P is pressure in [Mbar]. A, B and C … are pre-calculated constants from tables of
equation-of-state for some explosive. In equation (2.4.2): (1/W)(dW/dt) = 0 if P <
Pminimum, and 01 =+njW if P > PCJ or n
jW < 0.05.17
The Forest Fire rate model of shock initiation of heterogeneous explosives has
been used to study the sensitivity of explosives to shock. The minimum priming
charge test, the gap test, the shotgun test, sympathetic detonation, and jet initiation
have been modeled numerically using the Forest Fire model.20

25
An extensive and thorough fundamental description of the Forest Fire model has
been published in references17, 19. Some applications of the Forest Fire model are
described in references21, 22, 23, 24.
2.5 Hot spots
A hot spot is a localized region of higher-than-average temperature.25 The relation
between initiation of explosives and hot spots has been investigated by many
researchers.26, 27 The possible generation mechanisms of hot spots are:
1) Adiabatic heating of compressed gas spaces 28, 29,
2) A frictional hot spot on the confining surface or on a grit particle 28, 29,
3) Intercrystalline friction of the explosive itself 28, 29,
4) Viscous heating of explosive at high rates of shear 28,
5) Heating of a sharp point when it is deformed plastically 29,
6) Mutual reinforcement of relatively weak shock waves; probably at
inhomogeneities in the shocked medium 30, 31, 32, 33,
7) Stagnation of particles spalled off a crystallite by incoming shock and then
stopped after flying across an air gap by a neighboring crystallite (the cap can be a
void) 34,
8) Micro-Munro jets formed by shocking bubbles, cavities or voids whose
interface between solid or liquid and the cavity is concave 30.
Modes 1), 2), and 3) from these generation mechanisms operate most probably in
the usual impact and/or friction initiation of pressed solid explosives whereas in
the impact and/or friction initiation of liquid explosives only modes 1) and 2)
operate. Modes 5), 6), 7), and 8) operate in the shock initiation and possibly the
propagation of detonation in solid explosive compacts or explosive liquids
containing inhomogeneities. Mode 4) is operative only at strong shock inputs and
may be the main mode of initiation and propagation in homogeneous explosive
liquids or defect-free explosive single crystals.25

26
In some references cases 1) to 5) are mentioned only as the generation
mechanisms of hot spots.14 The studies by some researchers indicate that these
mechanisms would not produce sufficiently high temperatures. They proposed
that the heart of the matter is the microjetting in bubbles and particle interstices
and/or inelastic compression of solid particles.35, 36 According to some references,
a more believable mechanism is the inelastic flow of the solid explosives under
impact, which produces the required temperatures.37 The local areas are at high
stress or pressure, and the melting point Tm is raised according to the formula 14:
PTT mm α+= 0, (2.5.1)
where 0mT is the normal melting point at 1 atm, α is the melting point pressure
coefficient and P is the pressure. For most CHNO explosives α is approximately
0.02oC/atm.14
Energetic material
0mT Td[
oC] Heat of fusion [kJ/kg] ***)
TNT 80.65-80.85 *) 290 **) 96.6
RDX 202 ***) 230 **) ***) 161
HMX 276-277 *) 270 **) -
PETN 141.3 *) ***) 205 **) ***) 152
Tetryl 128.5-128.8 *) 190 **) 80
Table 2.5.1 The normal melting point 0mT , the deflagration temperature Td and
heat of fusion of some energetic materials *) 38, **) 39, ***) 40.
In the case of from deflagration to detonation (DDT) type laser ignition
measurements of RDX98/1/1 using the pressure of 50 bar, the melting point is
raised by 1oC according to the equation (2.5.1).

27
The basic equation governing hot spot phenomena is 25:
∂∂+
∂∂+−=
∂∂
x
T
x
n
x
TRTEQk
t
Tc a 2
2
0 )/exp( λρ (2.5.2)
where ∞<≤ x0 and 0≥t with conditions: t = 0, when T = To, with the values x
< r and T = T1, with the values x > r, To > T1. When ,0≥t and 0=x , 0=∂∂ xT ,
and when ∞=x , 0=∂∂ xT . In the equation (2.5.2): T is the temperature in
Kelvin, x is the space coordinate, To is the initial hot spot temperature, T1 is the
medium temperature, Q is the heat of reaction, aE is the activation energy, 0k is
the pre-exponential factor, c is the specific heat, λ is the thermal conductivity
coefficient, ρ is the density and n is the hot spot symmetry factor. For the planar
hot spot n = 0, for the cylindrical hot spot n = 1 and for the spherical hot spot n =
2. The exact solution of Equation (2.5.2) is unknown. Only numerical or
approximate analytical solutions are available.
In a similar manner to the critical temperaturecT , the equation (2.5.1), defines the
critical temperature 'cT :41
α)( 'mccr TTP −= . (2.5.3)
The critical temperature 'cT is not been calculated for an infinite time to
explosion, but for a time less than 10-5 s, which is the ignition delay time derived
from observations in impact-machine experiments.14
Thus according to equation (2.5.3), the higher the local pressure, the higher the
melting point, and the lower the critical stress to produce ignition. For most
explosives the critical temperatures,'cT , is found to be between 400 and 600oC;

28
hence the critical stress crP = 1x10⁴ to 2.5x10⁴ atm. The critical diameter of a hot
spot is between 10-4 and 10-2 mm 41.
An empirical hot spot model in the case of shock wave initiation of heterogeneous
explosive is described fundamentally in reference42. The general picture of shock
initiation is shown schematically in Fig 2.5.1.. 'λ specifies the degree of chemical
reaction 10 ' ≤≤ λ , (0 for no reaction and 1 for complete reaction), 1τ , 2τ and 3τ
are characteristic times for the process of hot spot formation, reaction, and
growth, respectively, p is current pressure and ps is shock pressure, ( )sppG , is
the growth rate function.42
Fig 2.5.1 Schematic diagram of the multiple interacting processes in the
phenomenological hot spot model. The steps B, C, D, and E are shown as
independent processes when they, in fact, occur simultaneously.42
29
2.6 Lee-Tarver Ignition and Growth Model
A model of shock initiation in heterogeneous and homogenous explosives was
developed in the late seventies by E. L. Lee and C. M. Tarver. It is called the
“Lee-Tarver Ignition and Growth Model”, “Ignition and Growth Model” or
“Ignition and Growth reactive flow model”.43 The Ignition and Growth reactive
flow model uses two Jones-Wilkins-Lee (JWL) equations of state44, one for the
unreacted explosive and another one for the reaction products. This equation of
state has in the temperature-dependent form:
VTCeBeAp VVRVR ω+⋅+⋅= −− 21 , (2.6.1)
where p is pressure, V is relative volume, T is temperature, ω is the Grüneisen
coefficient, VC is the average heat capacity, and A , B , 1R and 2R are constants.
The chemical energy release rate laws in the ignition and growth models are
based on considerable experimental evidence that the ignition of the explosive
occurs in localized hot spots and that buildup to detonation occurs as the reaction
grows outward from these reaction sites.43 According to Taylor and Ervin the
ignition and buildup sensitivities to shock can be separated.43, 45 The formation of
hot spots can be explained by several plausible mechanisms (void closure,
microjetting in collapsing voids, plastic work at void peripheries, friction between
particles, etc.).43
In the ignition and growth model a small fraction of the explosive is assumed to
be ignited by the passage of the shock front, and the reaction rate is controlled by
the pressure and surface area as in a deflagration process. The explosive material
can be consumed very rapidly since the number of hot spots can be very large.
Micronsized spherically burning regions grow and interact to consume the

30
intervening material within microseconds in most cases.43 The Ignition and
Growth reaction rate is given by the generalized equation:43
( ) ( ) zyxrx pFFGFIt
F −+−=∂∂
11 η , (2.6.2)
where 110 −= VVη and F is the fraction of explosive that has reacted, t is time,
0V is the initial specific volume of explosive, 1V is the specific volume of shocked,
unreacted explosive, p is pressure in megabars, and I , x , r , G , y , and z are
constants. The most physically justifiable models have produced the best
simulations of the experimental results.
The rη term in Eq.(2.6.2) is used to investigate various hot-spot formation
concepts, because η , is relative compression of the unreacted equation of state to
any of the thermodynamic parameters that may be involved in the initiation
process. To a good approximation, p is proportional to 2η and the square of the
particle velocity 2pu is proportional to 3η over the range of compressions and
pressures of interest in shock initiation.43
The second term in Eq. (2.6.2) describes the growth of the reaction. The constant
G corresponds to a surface area to volume ratio and the zp term represents a
pressure dependent laminar burn rate.43
Nowadays the equation (2.6.2) is written in the form:
( ) ( ) ( ) zgeydc
x
b pFFGpFFGaFIdt
dF −+−+
−−−= 1111 21
0ρρ
, (2.6.3)

31
which represents the three stages of reaction generally observed during shock
initiation and detonation of pressed solid explosive.46, 47
First stage of reaction, the first term in Equation (2.6.3) is the formation and
ignition of hot spots caused by the various possible mechanisms discussed for
impact ignition as the shock or compression wave interacts with the unreacted
explosive molecules, max0 igFF << . For shock initiation modeling, the second
term in Equation (2.6.3) then describes the relatively slow process of the inward
and/or outward growth of the isolated hot spots in a deflagration-type process,
max10 GFF << . The third term in Equation (2.6.3) represents the rapid completion
of reaction as the hot spots coalesce at high pressures and temperatures, resulting
in transition from shock-induced reaction to detonation, 1min2<< FFG .47, 48
For detonation modeling, the first term in Equation (2.6.3) again describes the
reaction of quantity of explosive less than or equal to the void volume after the
explosive is compressed to the unreacted von Neumann spike state. The second
term in Equation (2.6.3) models the fast decomposition of solid into stable
reaction product gases (CO2, H2O, N2, CO, etc.). The third term in Equation
(2.6.3) describes the relatively slow diffusion-limited formation of solid carbon
(amorphous, diamond, or graphite) as chemical and thermodynamic equilibrium
at the C-J state is approached.47 These reaction zone stages have been observed
experimentally using embedded gauges and laser interferometry to within several
nanosecond resolution.49, 50
The Ignition and Growth reactive flow model has been applied to great deal of
experimental shock initiation and detonation data using several one-, two-, and
three-dimensional hydrodynamic codes. In shock initiation applications, it has
successfully calculated many embedded gauge, run distance to detonation, short
pulse duration, multiple shock, reflected shock, ramp wave compression, and
divergent flow experiments on several high explosives at various initial

32
temperatures, densities, and degree of damage.48 For detonation wave
applications, the model has successfully calculated embedded gauge, laser
interferometric metal acceleration, failure diameter, corner turning, converging,
diverging, and overdriven experiments.43, 50, 51, 52, 53, 54, 55, 56, 57
2.7 DDT type ignition
In the initiation with the radiation of a diode laser or a CO2 laser the surface of the
explosive warms up inside a short time. If the consequence is the detonation, the
initiation mechanism is from deflagration to detonation transition DDT.
According to many authors, the Lambert-Beer absorption xeII α−=0 might be
one of the main interaction processes between the high explosive and the laser
beam.58, 59, 69, 80, 88 Here α is the absorption coefficient of the explosive material,
x is the path length, 0I is the incident light intensity and I is the transmitted light
intensity. The absorption coefficient of the material α may have wavelength
dependence.
According to the experiments, confinement has a strong role in the transition from
warming up through deflagration to detonation. The initiation mechanism is at
first stage thermal initiation. Thus the theoretical study of thermal initiation is
valid in this case too.
The Frank-Kamenetskii equation for a single zero-order rate process is written in
the form60:
RTEaQZetTCz
T
y
T
x
T −=∂∂+
∂∂+
∂∂+
∂∂− ρρλ )(
2
2
2
2
2
2
or (2.7.1)
RTEaQZetTCT −=∂∂+∇− ρρλ )(2 ,
33
where T is temperature in K, λ is thermal conductivity, ρ is density, C is heat
capacity, Q is heat of decomposition, Z is collision number, aE is activation
energy and R is the gas constant. Here it will be assumed that the above constants
are independent of temperature. The Laplacian operator 2∇ reduces in the cases of
sphere, infinitely long cylinder, or infinite slab in one dimension to the form:
)()( 22 xxmx ∂∂+∂∂ , where m = 0 for slab, 1 for cylinder and 2 for sphere. In
some references the thermal conductivityλ is replaced in the Frank-Kamenetskii
equation by the thermal diffusivity a.
When there are no chemical reactions, the reaction heating term RTEaQZe−ρ is
zero and the equation (2.7.1) reduces to the heating equation:
)(2 tTCT ∂∂=∇ ρλ . (2.7.2)
In the one-dimensional case this equation has the form: )(22 tTCxT ∂∂=∂∂ λρ .
For example in the case of infinite slap.
When the energetic material is illuminated by laser, in the case of laser ignition,
the material absorbs the radiationlsE , which is the total laser radiation lstotE
reduced by the reflected radiationlsreflE : lsrefllstotls EEE −= . The laser power
absorption term lsE is expressed in two dimensional calculation by the equation61:
( ) zls erIzrE ⋅−⋅= αα),( , (2.7.3)
where α is the absorption coefficient of the material, taking into account the
Gaussian energy distribution of the laser beam 22
0)( wreIrI −= (Eq. (3.2.1)),
where 0I is the ordinary intensity of the laser, r is the radial distance andw is the

34
beam radius62. The volumetric heating caused by the laser is thus equal to the
material absorbed radiationlsE , which can be described by the two dimensional
equation:
( ) zwrls eetzrIE ⋅−−≅ α
λα 22
,,0 , (2.7.4)
where λ is the thermal conductivity. The laser intensity may have time
dependence t. The equation (2.7.2) is writeable now in the form:
lsEtTCT =∂∂+∇− )(2 ρλ . (2.7.5)
If the energetic material has a melting point mT before the ignition, for example,
in the case of RDX (Table 2.5.1), the heat of fusion fusH∆ uses the energy of
absorbed laser radiation, melting the material amount m∂ in the differential time
unit t∂ . The heat of fusion is writeable in the form ( )mTfus tmH ∂∂∆ . Equation
(2.7.5) now has the form:
( ) lsTfus EtmHtTCTm
=∂∂∆+∂∂+∇− )(2 ρλ . (2.7.6)
The term of net heat radiation loss rate takes the form ( ) ( )44sTTAeTP −= σ , which
is provable from the Stefan-Boltzmann’s law for the ideal blackbody radiator.
Here e is the emissivity of the object ( 1≤e and 1=e for the ideal radiator), σ is
Stefan’s constant ( 428106703.5 KmW−×=σ ), A is the radiating area, T is the
temperature of radiator and sT is the temperature of surroundings. When the
temperature is at the melting point mT , ( ) ( )44sm TTAeTP −= σ . Equation (2.7.6)
reduces in the form:

35
( ) ( ) lsTfus ETPtmHtTCTm
=+∂∂∆+∂∂+∇− )(2 ρλ (2.7.7)
Energy comes into the system as the radiation of laser. Energy losses are the
thermal conductivity (the term: T2∇− λ ), the heat of fusion (the term:
)( tmH fus ∂∂∆ ) and the heat radiation (the term: )(TP ).
If the system absorbs more energy of laser radiation than the energy losses are
together, the temperature rises. The energetic material evaporates and there is
another energy loss more, the heat of evaporation vH∆ , which uses the energy of
absorbing laser radiation evaporating the material amount m∂ in the differential
time unit t∂ . The heat of evaporation has pressure dependence and it is writeable
in the form ( )pv tmH ∂∂∆ . In some cases and with some explosives, the
sublimation may be possible especially when the ambient pressure is low enough.
The heat of sublimation subH∆ is thus an energy loss.63
The ignition energy (Eign) is defined as the minimum amount of energy required
to cause ignition, and corresponds to the ignition time.
The energy of the laser radiation excites the molecular vibrations in the energetic
material. The energy in the phonon modes is transferred to the vibrations by
multiphonon up-pumping processes.13 As the vibration modes are excited,
reactivity is enhanced and bond breaking due to thermal decomposition occurs in
the molecule.16
The amount of energy, which is enough to excite the molecule just over the front
of spontaneous reaction is the activation energyaE . The breaking of the molecular
bonds and the formulation of new molecules, the reaction products, is a highly
exothermic process. Now the reaction heating term RTEaQZe−ρ is written on the
right hand side of formula (2.7.5):

36
( ) ( ) ( ) RTElspvTfus
a
mQZeETPtmHtmHtTCT −+=+∂∂∆+∂∂∆+∂∂+∇− ρρλ )(2
. (2.7.8)
The energy term lsE is zero after the ignition pulse of laser. Energy losses are still
the thermal conductivity, the heat of fusion fusH∆ , the heat of evaporation
vH∆ and the heat radiation )(TP , but they are small compared with the reaction
heating term.
( ) ( ) ( ) RTEpvTfus
a
mQZeTPtmHtmHtTCT −=+∂∂∆+∂∂∆+∂∂+∇− ρρλ )(2 .
(2.7.9)
The rate of the reactions is deflagration, but it accelerates to the steady state
detonation in the environment of high confinement. This acceleration of reaction
rate is called Deflagration to Detonation Transition. In the laser heating period of
RDX the liquid phase and vapor phase occur and in the deflagration period the
liquid phase occurs and thus the heat of fusion fusH∆ and the heat of evaporation
should be taken into account.63 It seems probable that the heat of fusion fusH∆
has no significant role in the case of steady state detonation. The radiation term
P(T) is not insignificant when considering the energy balance. If it has been
omitted, the result is just the equation (2.7.1) RTEaQZetTCT −=∂∂+∇− ρρλ )(2 .
The Frank-Kamenetskii equation (2.7.1) has not been solved analytically.
Numerical solutions can be obtained in some references.17 The solution of the
Frank-Kamenetskii equation under steady-state condition 0)( =∂∂ tT leads to the
equation:
RTEaQZez
T
y
T
x
T −=
∂∂+
∂∂+
∂∂− ρλ
2
2
2
2
2
2
(2.7.10)

37
and to the expression for the critical temperature cT in terms of related physical
parameters.
)ln(303.2 22 δλρ ca
ac RTQZEaR
ET = , (2.7.11)
with the shape factor δ = 0.88 for slab, 2.00 for cylinder, and 3.32 for sphere. For
a given size and shape of a given explosive material there is some maximum
initial temperature which, if exceeded, will lead to a runaway reaction or
explosion 14. The iterative solution of the equation (2.7.11) gives values for cT in
certain conditions.
Experimental and calculated numerical values of critical temperatures Tc and
some parameters in Frank-Kamenetskii equation of some high explosives are
expressed in Table 2.7.1. Comp. B is a castable mixture of RDX and TNT in the
proportion of 60:40. DATB is diaminotrinitrobenzene or 1,3-diamino-2,4,6-
trinitrobenzene and TATB is triaminotrinirobenzene or 1,3,5-triamino-2,4,6-
trinirobenzene. HNS is hexanitrostilbene. NQ is nitroguanidin. PETN is
pentaerythitol tetranitrate and is known as Pentolite. RDX is
trimethylentrinitramin or cyclo-1,3,5-trimethylene-2,4,6-trinitramine and is
known as Cyclonite or Hexogen and also as T 4. TNT is 2,4,6-trinitrotoluene or
trinitrotoluene and is known as Trotyl or also as Tolite.

38
Table 2.7.1 Experimental and calculated numerical values of critical temperatures
Tc and some parameters in Frank-Kamenetskii equation for high explosives.14 *)17
The surface-to-volume rations of slab, cylinder, and sphere are 1/a, 2/a and 3/a,
respectively, where a represents radius or half-thickness. According to the
experiments and calculations a given value of the slab should have the lowest
critical temperature. At relatively low temperatures explosion times relate to
surface-to-volume ratios in the opposite manner. The sphere, having the smallest
volume to be heated per unit surface, will explode fastest.17
HE
Sample
Thickness
d [mm]
Tc[oC]
Exp.
Tc[oC]
Calc.
a
[cm]
ρ
[g/cm3]
Q
[cal/g]
Z
[s-1]
aE
[cal/mol]
λ
[cal/cmsK]
Comp B 0.80 216 215 0.040 1.58 758 4.62x10¹⁶ 43.1 0.00047
DATB 0.70 320-323 323 0.035 1.74 300 1.17x10¹⁵ 46.3 0.0006
HMX 0.80 258
253-255*)
253 0.033 1.81 500 5x10¹⁹ 52.7 0.0007
HNS 0.74 320-321 316 0.037 1.65 500 1.53x10⁹ 30.3 0.0005
NQ 0.78 200-204 204 0.039 1.63 500 2.84x10⁷ 20.9 0.0005
PETN 0.80 197
200-203*)
196 0.034 1.74 300 6.3x10¹⁹ 47.0 0.0006
RDX 0.80 214-217
215-217*)
217 0.035 1.72 500 2.02x10¹⁸ 47.1 0.00025
TATB 0.70 353
331-332*)
334 0.033 1.84 600 3.18x10¹⁹ 59.9 0.0010
TNT 0.80 286
287-289*)
291 0.038 1.57 300 2.51x10¹¹ 34.4 0.0005

39
2.8 Krause’s exact differential equation of heat explosion
In the stationary temperature field, just before the runaway under steady-state
condition, the Frank-Kamenetskii equation has the form (2.7.10), when the
instationary term 0)( =∂∂ tT , and is so neglected. This implies a critical
temperature distribution in the interior that is stable and stationary.64
The Frank-Kamenetskii equation (2.7.1) is based on the
approximation ( ) xx −≈+ 111 . It results in the so called Frank-Kamenetskii
transformation:
−
−≈
−2
exp1
exp1
expU
a
U
aa
TR
E
TR
E
TR
E ϑ, (2.8.1)
where UT is the ambient temperature and UTT −=ϑ is the temperature
difference. The term ( ) ( )2/ Ua TRE ϑ=Θ is a dimensionless variable.
According to Krause, the exact equation of heat explosion will be derived without
any approximation. The stationary equation (2.7.10) is written with the Laplace’s
operator in the form of Fourier’s heat equation:
RTEaea
QT −−=∇ 10
2 , (2.8.2)
where CQZQ ρ=0 and thermal conductivity λ is replaced by thermal
diffusivity a . The temperature difference UTT −=ϑ and the dimensionless
coordinate Lx=ξ permit the derivation from equation (2.8.2) of the one
dimensional relationship:64

40
RTEaea
Q −−=∂∂ 1
02
2
ξϑ
. (2.8.3)
The definition of a dimensionless temperature ( ) UTTT =+=Θ ϑ1 transforms
the equation (2.8.2) into the expression:
Θ−−=
∂Θ∂ 1
exp11 2
02
2
U
a
U RT
E
TL
aQ
ξ, (2.8.4)
which is the exact, stationary differential equation of heat explosion.64 Two new
dimensionless parameters are defined according to:
UTL
aQ
11 201 =δ (2.8.5)
and
U
a
TR
E 12 =δ . (2.8.6)
The heat explosion equation (2.8.4) appears now in the final dimensionless form:
Θ−−=
∂Θ∂ 2
12
2
expδδ
ξ, (2.8.7)
which posses two parameters 1δ and 2δ whereas the equation of Frank-
Kamenetskii contains one parameter only.64 The ambient temperature UT has
been eliminated from equations (2.8.5) and (2.8.6) by forming the quotient:
2012
2
1 LE
RQ
aλδ
δδ
== . (2.8.8)

41
The fundamental relation (2.8.7) contains all the necessary information about the
substance, such as thermal diffusivitya (or thermal conductivityλ ), Arrhenius
prefactor 0Q , apparent activation energy REa and characteristic length L .
Table 2.8.1 compares the parameters in Frank-Kamenetskii equation and Krause’s
equation (2.8.7).
Frank-Kamenetskii Krause
( )Θ−=∂
Θ∂exp
2
2
FKδξ
Θ−−=
∂Θ∂ 2
12
2
expδδ
ξ
U
U
U
a
T
TT
RT
E −=Θ
UT
T=Θ
22
exp1
LRT
E
TR
E
a
Q
U
a
U
aFK ⋅
−=δ
UTL
aQ
11 201 =δ
U
a
TR
E 12 =δ
20
12 LE
RQ
aλδ =
Table 2.8.1 The comparison between the parameters of Frank-Kamenetskii’s
equation and Krause’s equation.65
It is not possible to solve equation (2.8.7) using analytical methods.64 A numerical
solution with the aid of finite difference formulae is performed.65

42
2.9 SDT type ignition
According to the experimental studies of shock initiation of homogenous
explosives the detonation of the heated, compressed explosive begins at the
interface, where the explosive has been hot the longest, after an induction time,
which is a decreasing function of the shock strength.15 The initiation mechanism
is known as from shock to detonation transition (SDT). The detonation proceeds
through the compressed explosive at a velocity greater than the steady state
velocity in uncompressed explosive, overtaking the initial shock and overdriving
the detonation in the unshocked explosive.17
The shock-initiated molecular reactions require transfer of substantial amount of
mechanical energy from the shock front to the internal vibrational states of the
molecules. This process is known as the multiphonon up-pumping.13
An explosive is shocked with a square-wave pulse shock wave, which has an
amplitude P, the shock pressure, and a duration t, the shock width in the time
scale. The particle velocity behind the shock front is u. The rate at which work is
done per unit area on the energetic material being compressed by the shock is:
rate of work/unit area = Pu. The amount of energy per unit area or the energy
fluence, E, deposited in the energetic material is:
PutE = . (2.9.1)
Taking into account the conservation equations of mass and momentum for shock
derives:
uUP oρ= , (2.9.2)
where oρ is the density of unshocked material and U is the shock velocity. For
the particle velocity u is writeable as: )( UPu oρ= . Equation (2.9.1) gives now:

43
)(2 UtPE oρ= . (2.9.3)
The quantity Uoρ is called the shock impedance of a material. It increases very
slowly with increasing pressure, but over the pressure ranges of general interest in
shock initiation it can be considered to be nearly constant. Because of this, tP2 is
frequently used instead as the critical value for initiation.14
The square-wave shock pulses are simulated experimentally by the impact of flyer
plates. The pulse duration is varied by changing the thickness of the flyer plates,
and the shock pressure is varied by changing the impact velocity of the flyer
plates. According to the experiments each explosive is found to have a unique
range of energy fluence, above which prompt detonation is always obtained, and
below which it is not.14 The average of this range is called the critical energy
fluence, cE .
Table 2.9.2 lists critical energy fluence for shock initiation for number of various
energetic materials. HNS-I is a kind of hexanitrostilbene (HNS), which has a less
pure raw product with lower bulk density compared with HNS-II.66 NM is
nitromethane. PBX-9404 is a plastic-bonded explosive, which contains 94% of
HMX. Tetryl is tetranitromethylanilin or trinitro-2,4,6-phenylmethylnitramine and
is also known as Pyronite.

44
Explosive Density ρ [g/cm3] cE [cal/cm2] cE [J/cm2]
Comp. B 1.73 44 184
DATB 1.676 39 163
HNS-I 1.555 <34 <142
Lead azide 4.93 0.03 0.13
NM 1.13 405a 1694a
PBX-9404 1.84 15 63
PETN 1.0 2.7 11
PETN 1.6 4 17
RDX 1.55 16b 67b
TATB 1.762 72-88 301-368
Tetryl 1.655 10 42
TNT, cast 1.6 100a 419a
TNT, pressed 1.645 34 142
Table 2.9.2 Critical energies for shock initiation of some energetic materials.67
(aValues are estimated from data other than critical energy determinations and
should be considered tentative. bConstant energy threshold not confirmed.67)

45
3. Diode laser ignition of energetic materials
3.1 Introduction
The use of laser as an ignition source has been extensively applied to studies of
the ignitability of explosives and pyrotechnical materials. Laser was first
introduced as an ignition source for energetic materials by Brish et al68, 69 and
Menichelli and Yang70, 71 in the sixties and early seventies. They carried out the
studies using a Q-Switched Ruby laser and a Nd:YAG-laser, which has also been
the laser pulse source in the subsequently published studies72, 73, 74, 75. The ignition
mechanism was from shock to detonation transition (STD). Laser ignition studies
on both deflagration and detonation with a CO2 laser have been carried out by
many authors76, 77, 78, 79, 80, 81, 82. The ignition mechanism with explosives was from
deflagration to detonation transition (DDT). One significant result of the
experiments is the strong dependence between the energy necessary for ignition
and the surrounding gas pressure. A conclusion has been drawn that the ignition
process is not only a solid phase reaction but is a complex process where gas,
liquid and/or solid phase reactions are involved. The diode laser has been used as
an ignition device for pyrotechnic mixtures or propellants and for explosives by
an increasing number of authors83, 84, 85, 86, 87. Theoretical descriptions and numeric
modeling of laser ignition have been published in many papers84, 88, 89, 90, 91, 92, 93.
3.2 Methods and experimental setup
The diode laser ignition studies of explosives by means of optical fiber were
carried out as a function of ambient overpressure. Apparatus was developed
specially for diode laser ignition research, consisting of a laser ignition test device
and a pressure chamber (Fig. 3.2.1). The Up-and-down method94 (Appendix 1)

46
was applied using the ambient pressure of 10, 20, 30, 40 and 50 bar, when the
parameter was the diode laser current. The pulse duration of 100 ms was used.
Fig. 3.2.1 The complete pressure chamber (top) and the laser ignition test
device disassembled (middle). The test device components depicted on a
larger scale (bottom).
In the Fig. 3.2.2 depicts the experimental setup of laser ignition studies
schematically. The core diameter of the optical fiber was 0.8 mm. Between
the explosive pellet and the end of the optical fiber there was a 1 mm thick
quartz class window. The monitoring of the initiation was carried out using
optical fiber and a photo detector (Oriel 70124) with a transient recorder
(IMC Cronos with the FAMOS computer program). The diode laser used

47
was 2.6 W, 808 nm, (Coherent-Tutcore, F-8 10-10-260-20SMM) with a
microcomputer controlled power supply and temperature control
customized for diode laser ignition measurements (Coherent-Tutcore). The
laser energy was measured with LaserMate-P Energy Meter combined with
a crystalline pyroelectric detector (Coherent). The profile of the laser beam
on the surface of the energetic material was measured with a CCD camera
based laser beam imager (WinCamD). The mean specific gravity of the
pressed RDX pellets was 1.65.
RECORDER
SYNTHETIC AIR / NITROGEN / ARGON
PRESSED
PRESSURE MEASUREMENT
VALVE
VALVE
DECOMPRESSION
SUPPLYPOWER
DIODELASER
COMPUTERIGNITIONOF THEMONITORING
GAS OUT
PRESSURE GAUGE
MEASUREMENT
DIGITALPRESSURE
VALVE
DETECTORPHOTO
LASERDIODE
SIGNALIGNITION
GAS
ANALOGICAL
VALVE
MICRO
TRANSIENT
Fig. 3.2.2 The schematic picture of the experimental setup. The monitoring
of the initiation was carried out using optical fiber and a photo detector.
A typical profile of the laser beam is depicted in Fig. 3.2.3. The profile was
measured at a distance of 1 mm from the fiber using the CCD camera based laser
beam imager. The cross section of the profile is the Gaussian shape having a
sharp intensity maximum on the plane of illuminated explosive surface. The

48
spatial intensity distribution )(rI as a function of radial distance r can be written
as the equation:
22
0)( wreIrI −= , (3.2.1)
where 0I is the center intensity and w is the beam radius62. The mean root
diameter of the typical profile is 0.9 mm and the diameter of the half maximum is
0.3 mm, respectively. The area of the beam on the explosive surface is
approximately 0.65 mm2.
Fig. 3.2.3 A typical profile of the laser beam on the virtual surface of RDX pellet
measured using the CCD camera based laser beam imager. The distance between
the end of the fiber and the CCD detector was 1 mm.
49
3.3 Diode laser ignition of explosives
The diode laser ignition properties of different energetic materials are important
when the ignition mechanisms are investigated or the best or most suitable
material for a current laser ignition application are chosen. One of the most
important variables is the ignition energy. Thus it is reasonable to study the
minimum ignition energy of many energetic materials and choose the best
material among them. Other criteria may be, for example, the detonation
properties of the current material as a booster or an igniter and the ageing
properties of the current material.
Figure 3.3.1 compares the diode laser ignition energies of 12 different explosives.
The numerical values of the ignition energies and comparable ignition currents
are presented in Table 3.3.1. The pressure in the confinement was 50 bar synthetic
air. The length of the laser pulse was 100 ms. The ignition mechanism was from
deflagration to detonation transition. FPX7a is a RDX based plastic bonded
explosive. P1a is a plastic bonded pentolite (PETN) booster explosive.
a TM of OY FORCIT AB

50
Fig. 3.3.1 Diode laser ignition energy of some explosives, when the synthetic air
pressure is 50 bar.
Explosive I[A] Elaser[mJ] Eignition[mJ] alfa-HMX 1.9 155.8 70 FPX7 1.7 139.4 54 FPX7+2%C 1.7 139.4 54 FPX7+alfa-HMX 2.2 180.4 77 FPX7 S 2 164 56 PETN+2%C 16 1312 300 P1 3 246 110 P1+2%graphite 2 164 56 P1+14%Al 2.2 180.4 83 P1+carbon black 2.6 213.2 94 RDX98/1/1+0,2%C 1.4 114.8 35 TNT+2%C 31 2542 770
Table 3.3.1 Numerical values of diode laser ignition current and comparable
ignition energy for some high explosives, when the synthetic air pressure is 50
bar.
0
500
1000
1500
2000
2500
3000
alfa-
HMXFPX7
FPX7+2%
C
FPX7+alf
a-HM
X
FPX7 S
PETN+2%
C P1
P1+2%
grap
hite
P1+14
%Al
P1+ca
rbon
blac
k
RDX98/1/
1+0,
2%C
TNT+2%
C
Dio
de
lase
r en
erg
y [m
J]

51
Table 3.3.1 depicts the absorption of the laser radiation on the explosive surface
and in the explosive, when the wavelength of the diode laser is 808 nm. The
reflecting angle is 45o.
Fig. 3.3.2 Reflectivity to the 45o angle and absorption of diode laser radiation on
the surface of explosive as percentage, when the wavelength is 808 nm.
0
10
20
30
40
50
60
70
80
90
100
RDX98/1/1 RDX PETN HMX NTO TNT
Explosive
Per
cen
tag
e [%
]
Reflectivity
Absorption
52
Explosive Reflectivity Absorption
RDX98/1/1 7.3 92.7
RDX (pure) 30.6 69.4
PETN 29.9 70.1
HMX 31.8 68.2
NTO 32.0 68.0
TNT 28.4 71.6
Table 3.3.2 Numerical values of reflectivity to the 45o angle and absorption of
diode laser radiation on the surface of explosive as percentage, when the
wavelength is 808 nm.
The ignition current carbon black content dependence of RDX was measured
from 1% to 3%. According to the experiments the mechanical properties of the
RDX pellet are fragile at higher carbon black contents. Results are depicted in
Fig. 3.3.3.
Fig. 3.3.3 Ignition energy of RDX as a function of carbon black content, when the
pressure is 50 bar. The wax content was 1%.
0
10
20
30
40
50
60
70
80
0 0.5 1 1.5 2 2.5 3 3.5
Carbon black content [%]
Ign
itio
n e
ner
gy
[mJ]

53
Fig. 3.3.4 Reflectivity of RDX as a function of carbon black content. The wax
content was 1%.
Carbon black content [%]
Reflectivity [%]
Variation [+/-%]
0 30.6 1.8 0.5 21.1 1.4 1 7.1 0.5
1.5 6.8 0.4 2 6.8 0.4
Table 3.3.3 Reflectivity of RDX as a function of carbon black content. The wax
content was 1%.
According to the reflectivity measurements, RDX98/1/1 absorbs about 93% of the
diode laser radiation at the wavelength of 808 nm. According to the results
depicted in Fig. 3.3.4 and Table 3.3.3, the 1% carbon black content increases the
0
5
10
15
20
25
30
35
0 0.25 0.5 0.75 1 1.25 1.5 1.75 2 2.25
Carbon black content [%]
Ref
lect
ivit
y [%
]

54
absorption of the 808 nm diode laser radiation on the surface of RDX98/1/1 by
about 23% when compared with pure RDX.
The spectroscopic methods give 17% reflectance for RDX98/1/1 and 96%
reflectance for pure RDX, when the wavelength is 808 nm (12376 cm-1). Fig.
3.3.5 depicts the emission spectra of pure RDX and RDX98/1/1 in the visible
wavelength range and in the near infrared range. In the near infrared spectra of
pure RDX the typical characteristics of vibration and rotation lines of RDX
molecule are identifiable. The Spectra were measured using a dispersive Perkin
Elmer Lamda 900 UV VIS NIR spectrophotometer.
0
10
20
30
40
50
60
70
80
90
100
300 500 700 900 1100 1300 1500 1700 1900 2100 2300 2500
Wavelength [nm]
Ref
lect
ance
[%
]
Pure RDXRDX 98/1/1
Fig. 3.3.5 Emission spectra of pure RDX and RDX98/1/1 from the wavelength of
300 nm to the wavelength of 2500 nm.

55
Fig. 3.3.6 IR absorbance spectrum of pure RDX from the wavelength of 3 µm to
the wavelength of 25 µm (1 µm = 1000 nm). Hatched lines enclose the
wavelength domain accessible by the CO2 laser82.
3.4 Laser ignition of RDX
The diode laser current at 5%, 50% and 95% ignition probability for RDX/1/1.2
(1% wax and 1.2% carbon black) as a function of pressure is depicted in Fig
3.4.1. The diode laser current at 95% ignition probability is 5 A, when the
pressure is 10 bar, and decreases to 1.4 A, when the pressure is 50 bar. The
ignition energy is 180 mJ and 32.6 mJ (Fig. 3.4.4), corresponding to the mean
energy density of 29.9 J/cm2 and 5.4 J/cm2 (Fig. 3.4.5), respectively, which are in
good agreement with the corresponding energy density values published in the
reference72.

56
0
1
2
3
4
5
6
0 10 20 30 40 50 60
Pressure [bar]
Dio
de
lase
r cu
rren
t [A
]
5 %
50 %
95 %
Fig. 3.4.1 Diode laser ignition current for RDX/1/1.2 as a function of pressure at
5%, 50% and 95% ignition probability.
Fig. 3.4.2 Diode laser ignition current for RDX/1/1.2 as a function of pressure.
0
1
2
3
4
5
6
0 10 20 30 40 50 60
Pressure [bar]
Do
iod
e la
ser
curr
ent
[A]

57
Fig. 3.4.3 Diode laser ignition power for RDX/1/1.2 as a function of pressure.
Fig. 3.4.4 Diode laser ignition energy for RDX/1/1.2 as a function of pressure.
0
2
4
6
8
10
12
0 10 20 30 40 50 60
Pressure [bar]
Dio
de
lase
r p
ow
er [
W]
0
20
40
60
80
100
120
140
160
180
200
0 10 20 30 40 50 60
Pressure [bar]
Dio
de
lase
r en
erg
y [m
J]

58
Fig. 3.4.5 Mean ignition energy density of laser light on the surface of RDX pellet
as a function of pressure.
020406080
100120140160180200
0 1 2 3 4 5 6
Diode laser current [A]
Las
er p
uls
e en
erg
y [m
J]
Fig. 3.4.6 Energy of laser pulse as a function of diode laser current.
0
5
10
15
20
25
30
35
0 10 20 30 40 50 60
Pressure [bar]
En
erg
y d
ensi
ty [
J/cm
2 ]

59
0
5
10
15
20
25
30
35
0 1 2 3 4 5 6
Ignition current [A]
En
egy
den
sity
[J/
cm2 ]
Fig. 3.4.7 Mean energy density on the surface of RDX pellet as a function of
diode laser current.
Table 3.4.1 Equivalence between the pressure, diode laser power and mean
ignition energy density on the surface of RDX pellet.
Pressure
[bar]
Laser Power
[W]
Ignition
energy density [J/cm2]
10 10.1 29.9
20 6.7 19.0
30 3.3 7.4
40 2.9 5.7
50 2.8 5.4

60
A) B)
C)
Fig. 3.4.8 Typical cases in the laser ignition experiments with RDX. The duration
of the laser pulse was 100 ms.
Fig. 3.4.8 depicts the typical cases in the laser ignition experiments with RDX. In
picture A) the initiation begins as a deflagration 36 ms after the beginning of the
laser pulse and the state changes immediately into a detonation. In picture B) the
initiation begins as a deflagration 39 ms after the beginning of the laser pulse. The

61
RDX-pellet deflagrates and after 110 ms the reaction changes into a detonation. In
picture C) the initiation begins 46 ms after the beginning of the laser pulse. The
duration of the deflagration is 210 ms and probably no transition to detonation
happened.
The mean time from the start of the ignition pulse to the initiation was 43 ms ± 7
ms, when energetic material was RDX98/1/1 and the pressure in the sample
chamber was 50 bar.
Fig. 3.4.9 The illuminated point of the laser beam on the surface of the RDX
pellet just below the minimum ignition energy in the case of high confinement,
when the pressure is 50 bar and the energy of the laser beam is 17 mJ. The
diameter of the pellet is 6 mm. The diameter of the molten point on the surface of
the pellet is about 0.3 mm.

62
Fig. 3.4.10 The illuminated point of the laser beam on the surface of the RDX
pellet in the case of low confinement, when the pressure is 1 bar and the energy of
the laser beam is 65 mJ.
3.5 Confinement in the DDT type laser ignition and discussion
Confinement is understood as a local physical state of things on the surface of
energetic material or in the bulk of energetic material, where the pressure will go
quickly high enough to increase the detonation velocity or bring it closer to the
ideal performance.14 It can cause the start of a spontaneous detonation reaction
from the initial state, such as combustion or deflagration, as is the situation in the
DDT type laser ignition.

63
Fig 3.5.1 depicts the laser ignition results for RDX98/1/1 (+1% extra carbon
black) as a variable diode laser current of the Up-and-Down method, when the
ambient pressure of the RDX pellet was 50 bar with synthetic air, nitrogen and
argon. The laser pulse width was 100 ms. The numerical values are presented in
the Table 2.5.1. The ignition currents are in practice the same for synthetic air and
argon, but nitrogen gives slightly higher ignition current.
Fig. 3.5.1 Percentage ignition probability of RDX as a function of diode laser
current, when the pressure of synthetic air, nitrogen and argon is 50 bar.
0
200
400
600
800
1000
1200
1400
1600
Air Nitrogen Argon
Dio
de
lase
r cu
rren
t [m
A]
5 %
50 %
95 %

64
Ignition probability
Air Nitrogen Argon
5% 1091.8 1054.9 1088.5 50% 1193.4 1212.1 1193.7 95% 1304.5 1392.7 1309.2
Table 3.5.1 Numerical values of diode laser current for the percentage ignition
probability - 5%, 50% and 95% - of RDX, when the pressure of synthetic air,
nitrogen and argon is 50 bar.
These results suggest that the oxygen (in synthetic air) may have no reactions or
the reactions are not remarkable in the laser illuminated point of RDX pellet in
this experimental setup. Östmark et al.79 achieved analogous results - air versus
nitrogen - for PETN, when the pressure was lower than 45 bar and for RDX,
when the pressure has been lower than 20 bar. For the higher pressures the results
are in reverse order. In the experimental setup of Östmark, the laser illuminated
point on the surface of explosive is open to the half of full solid angle. In this
experimental setup, the quartz glass confines the laser illuminated point on the
surface of explosive pellet.
Figure 3.5.2 depicts typical condensation of RDX on the surface of quartz glass a)
(I) and b), when the laser energy is just below the minimum ignition energy in the
case of high confinement. The pressure of argon was 50 bar.

65
a)
b)
Fig. 3.5.2 Typical condensation of RDX on the surface of quartz glass a) (I) and
b), when the laser energy is just below the minimum ignition energy in the case of
high confinement. The pressure of argon was 50 bar.

66
According to the IR-spectroscopic measurements the material of condensation (I)
is RDX.95 It is the same case with the ringlike crystalline rest material (II), which
has a radius of 1.5 mm from the centre of quartz glass. The rapid temperature
increase of the gas between the RDX pellet and quartz glass causes rapid local
increase of pressure. If the temperature increases from 293 K to 473 K (from 20 oC to 204 oC), the pressure increases in constant volume from 50 bar to 81 bar.
Figure 3.5.3 depicts a typical laser profile meter image of RDX98/1/1 + 1% C
surface in the case of high confinement, when the pressure of argon is 50 bar. The
ignition energy of the laser beam is just below the energy of ignition. According
to the laser profile meter measurements, the mean volume of the laser evaporated
hole in the RDX is typically about 0.1 mm3. The RDX melted by laser radiation is
evaporated and probably the decomposition begins in the vapour phase but is not
sufficient to cause an ignition.96
The laser evaporated RDX and the gaseous decomposition products rise the local
pressure still higher. They will expand because of the pressure difference between
the illuminated point of the laser beam and its surrounding and will displace the
argon and/or other gases. The level of confinement rises too, as the pressure rises.

67
Fig. 3.5.3 A typical surface reflectivity image from a laser profile meter for the
RDX98/1/1 + 1% C surface, when the ignition energy of laser beam is just below
the energy of ignition in the case of high confinement. The laser evaporated hole
is 27 µm in depth and its volume is 0.1 mm3. The pressure of argon was 50 bar.
Figure 3.5.4 depicts the thermal decomposition rate of solid RDX at temperatures
150 to 190 oC and in Figure 3.5.5 the thermal decomposition rate of RDX in a
solution of m-nitrobenzene at temperatures 160 to 200 oC, respectively. As is
typical of many energetic materials, the decomposition accelerates when the
temperature rises. According to many references, the decomposition of RDX
begins between 160 and 170 oC.96, 97

68
Fig. 3.5.4 Thermal decomposition of solid RDX.98
Fig. 3.5.5 Thermal decomposition of RDX in solution of m-nitrobenzene.98
Figure 3.5.6 depicts Thermo Gravimetric (TG) and Differential Scanning
Calorimetric (DSC) results of RDX as a function of temperature in the range 20 to
340 oC. According to those results the melting of RDX began in the temperature
of 201.6 oC. All of RDX has melted, by the time 5% of RDX has decomposed.

69
Fig. 3.5.6 Thermo Gravimetric (TG) and Differential Scanning Calorimetric
(DSC) results of RDX as a function of temperature in the range 20 to 340 oC.99
The temperature rate 5 K/min was used.
Figure 3.5.7 depicts experimental data and its linear fit for the vapour pressure of
solid RDX at temperatures from 320 to 375 K (47 to 102 oC). The function of the
fitted line has the form: ][)( PaTBATP ∗+= , where 29296.06146.22 ±−=A
and 442613.805558.0 −±= EB .100 The extrapolation for the temperature of
201.6 oC gives the vapour pressure of RDX as 3.76 Pa and for the temperature of
204 oC as 3.90 Pa.

70
Fig. 3.5.7 Experimental RDX vapour pressure and linear fit.100
Authors studying the decomposition of RDX have come to the conclusion that the
initial decomposition takes place in the vapour phase and is followed by a more
rapid decomposition in the liquid phase.96, 97, 101 In this mechanism, the result may
be deflagration and initiation of detonation by the action of laser radiation. The
decomposition of RDX at a fast heating rate is presented in Appendix 2.
Some studies have been carried out on the ignition characteristics of gaseous
RDX, by applying the mass and energy conservation equations to a homogeneous
mixture in an adiabatic, constant-pressure environment to identify the heat-release
mechanisms for achieving ignition and to examine the dependence of ignition
delay on the initial temperature and species concentrations.63, 102 The chemical
kinetics scheme involves 49 species and 250 elementary reactions.103 The
formation of CN species gives rise to a luminous flame often serving as an
ignition criterion for both experimental and theoretical studies.63 In all the cases
studied in reference63, ignition occurs only if the initial temperature exceeds 600
K (327 oC).
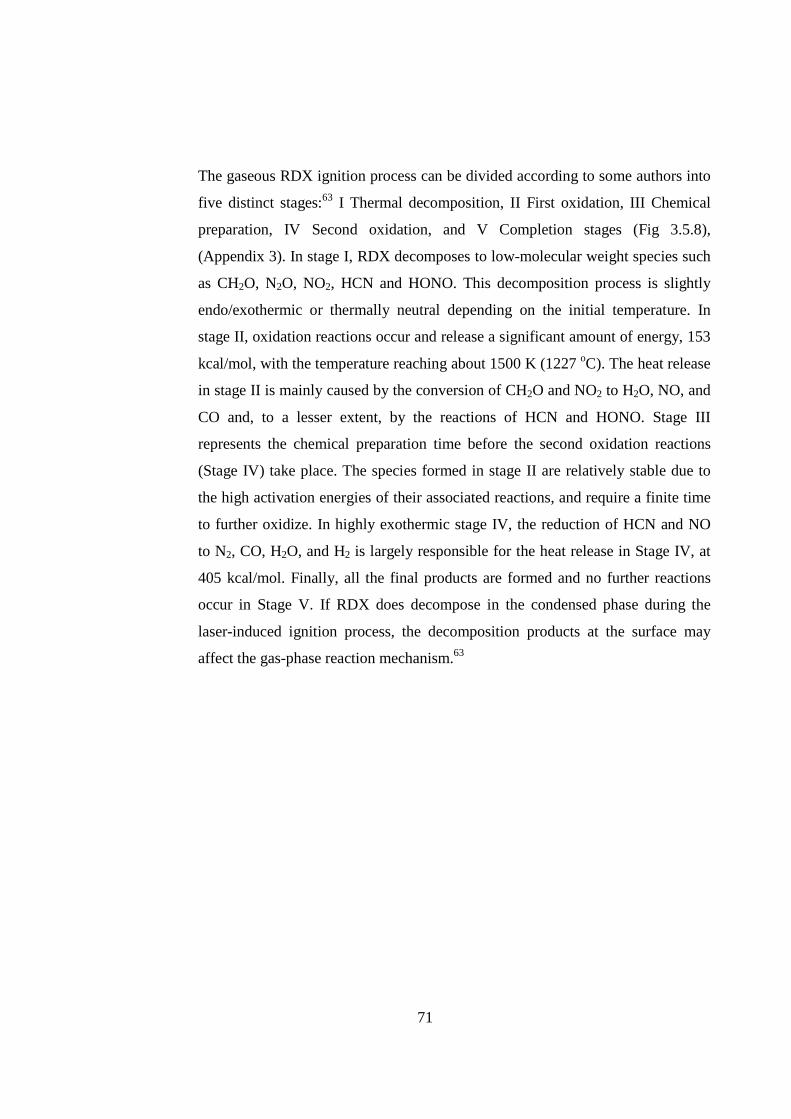
71
The gaseous RDX ignition process can be divided according to some authors into
five distinct stages:63 I Thermal decomposition, II First oxidation, III Chemical
preparation, IV Second oxidation, and V Completion stages (Fig 3.5.8),
(Appendix 3). In stage I, RDX decomposes to low-molecular weight species such
as CH2O, N2O, NO2, HCN and HONO. This decomposition process is slightly
endo/exothermic or thermally neutral depending on the initial temperature. In
stage II, oxidation reactions occur and release a significant amount of energy, 153
kcal/mol, with the temperature reaching about 1500 K (1227 oC). The heat release
in stage II is mainly caused by the conversion of CH2O and NO2 to H2O, NO, and
CO and, to a lesser extent, by the reactions of HCN and HONO. Stage III
represents the chemical preparation time before the second oxidation reactions
(Stage IV) take place. The species formed in stage II are relatively stable due to
the high activation energies of their associated reactions, and require a finite time
to further oxidize. In highly exothermic stage IV, the reduction of HCN and NO
to N2, CO, H2O, and H2 is largely responsible for the heat release in Stage IV, at
405 kcal/mol. Finally, all the final products are formed and no further reactions
occur in Stage V. If RDX does decompose in the condensed phase during the
laser-induced ignition process, the decomposition products at the surface may
affect the gas-phase reaction mechanism.63
72
Fig. 3.5.8 Temperature evolution during RDX ignition in well-stirred reactor at P
= 1 atm, Tini = 700 K, 100% RDX.63
The detailed physiochemical processes involved in the ignition of RDX are
schematically illustrated according to Liau et al. in Fig. 3.5.9. The description is
in good agreement with the theoretical formulation in the chapter 2.7.
The ignition processes are divided into six distinct stages. The initial temperature
of the RDX and the ambient gas is uniformly distributed at room temperature. In
the first stage (a) volumetric absorption of laser energy in the solid phase takes
place. When the solid reaches its melting temperature, the absorbed radiant
energy cannot further raise the temperature without first undergoing a melting
process. Since the radiant energy absorbed is insufficient for instantaneous
melting of all of the solid within such a short period of time, partial melting of the
solid occurs and leads to the formation of a “mushy zone” which consists of both
the solid and liquid (b). When a pure liquid layer is formed, the solid-liquid
interface starts to move due to the conductive and radiative heat transfer (c). In
the liquid, thermal decomposition and subsequent reactions, as well as phase

73
transition, take place, generating gas bubbles and forming a two phase region. The
RDX then undergoes a sequence of rapid evaporation at the surface (d). Ignition
occurs if the heat flux is sufficiently large to initiate the subsequent self-
accelerated exothermic reactions which result in substantial heat release in the gas
phase and emission of light. A luminous flame is produced in the gas phase (e),
regressing toward the surface producing hot spots, and finally combusting the
RDX (f).63
In Fig. 3.5.9 the term tid means the ignition delay time. The term q” flux means the
flux of laser light on the surface of RDX. T’ means the temperature of ambient gas
and Tini means the initial temperature of RDX. Tmelt is the melting temperature of
RDX. The term “Mushy Zone” used means the zone where the solid and the
melted RDX form a mixture. The term “Foam Zone” means the zone where the
gaseous RDX and the gaseous decomposition products of RDX mix with the
melted RDX.

74
Fig. 3.5.9 Physiochemical processes involved in laser-induced ignition of RDX
according Liau et al.63
75
According to the work of Liau et al, the process accelerates to steady-state
deflagration in the ambient pressure of 1 atm if the incoming energy is high
enough to produce the temperature of 600 K in the zone of pyrolyzed
decomposition products and evaporated RDX. According to this work and the
works of other authors, Östmark et al., Roman et al. and others, the energy
required for ignition is conciderably lower and deflagration accelerates to steady-
state detonation, if the ambient pressure is higher and confinement is high enough.

76
4. Conclusions
A strong dependence between ignition energy and ambient pressure was observed
in the diode laser ignition research with RDX and other explosives. For example,
in the case of RDX98/1/1+1% carbon black, the measured energy for 95%
ignition probability in an ambient pressure of 10 bar was 180 mJ and in an
ambient pressure of 50 bar it was 32.6 mJ. Mean ignition energy densities were
29.9 J/cm2 and 5.4 J/cm2, respectively. The values have good agreement with the
results from other studies on diode lasers and optical fibers104, but the pressure
dependence is stronger in the results of this study, probably because of the higher
level of confinement. The pressure dependence at a low pressure is explained by
the fact that the reaction rate for a bimolecular reaction in the gas phase is
proportional to the pressure squared79.
Some authors have discovered stronger pressure dependence and lower energy
density using the CO2 laser.79 An energy density of 1.2 J/cm2 at 50 bar (5 MPa)
was measured using the CO2 laser in a nitrogen atmosphere and 1.6 J/cm2 in air.79
The wavelength used was 10.6 µm (10600 nm), which has higher absorption in
the solid RDX when compared with the diode laser wavelength of 808 nm.63
Some authors have measured energy density values of 5 to 8 J/cm2 at 50 bar using
the Nd:YAG laser with 532 nm wavelength and 8 ns pulse length72. In those
experiments, the ignition mechanism was from shock to detonation (SDT). The
values are in good agreement with the corresponding energy density values from
this study.
The carbon black content dependence of ignition energy is clear between 1% and
3% being 27% lower at 2% carbon black content when compared with the
ignition energy of 1% carbon black content, and 31% lower at 3% carbon black
content. According to the experiments, the mechanical properties of the RDX

77
pellet are fragile, using 1% wax content, for 3% or higher carbon black content.
Thus the optimum carbon black content may be 1.5 to 2.5%.
According to the diode laser ignition experiments with synthetic air and argon the
ignition energies are essentially the same in the same confinement. These results
suggest that oxygen (in synthetic air) has no remarkable reactions in the laser
illuminated point of the RDX pellet or more generally in the laser illuminated
point of any explosive.
For nitrogen, the ignition energies are slightly higher, compared with air (and also
with argon) in the same pressure. This is analogous to the CO2 laser ignition
results at lower pressures in the research by Östmark et al., but at higher pressures
of air and nitrogen the experimental results of this work are in the reverse order to
those of reference79.
The evaporated RDX and the gaseous decomposition products (for example
CH2O, N2O, NO2, HCN and HONO)63 expand and will displace synthetic air,
nitrogen or argon. Initial decomposition takes place in the vapour phase of RDX
and on the surface of melted RDX. Highly exothermic reactions begin in the
vapour phase and are followed by a more rapid decomposition in the vapour
phase and in the liquid phase and the ignition of RDX.63 The rate of the reactions
is deflagration, but it accelerates to the steady state detonation in the environment
of high confinement.
According to this study and to those of other authors, the degree of confinement
has a strong role in the deflagration to detonation transition ignition mechanism.
Using a sufficiently heavy degree of confinement, a closed and tight mechanical
structure and sufficiently pressure inside the device, and good absorbance, for
example using carbon black in the energetic material, the ignition energy is low
enough for economically viable applications of compact diode laser igniters105, 106
and Appendix 4.

78
Appendix 1
The Up-and-down method and laser ignition experiments
In true sensitivity experiments it is possible to make only one observation on
given specimen. For example, in testing the sensitivity of explosives to shock, a
common procedure is to drop a weight on specimens of the same explosive
mixture from various heights. There are heights at which some specimens will
explode and others will not, and it is assumed that those which do not explode
would have exploded were the weight been dropped from a sufficiently great
height. It is supposed, therefore, that there is a critical height associated with each
specimen and that the specimen will explode when the weight is dropped from a
greater height and will not explode when the weight is dropped from a lesser
height. The population of specimens is thus characterized by a continuous
variable – the critical height, which cannot be measured. All one can do is select
some height arbitrarily and determine whether the critical height for a given
specimen is less than or greater than the selected height.94
For the experiments described above or similar experiments the Up-and-down
method and its statistical analysis have been developed, these are described in
reference94. One important condition is that the variable is normally distributed.
The method is effective for estimating the mean. Using the simple statistical
analysis, it is possible to estimate the 95 per cent, 50 per cent and 5 per cent
points, i.e. the 95 per cent, the mean 50 per cent and the 5 per cent probability of
ignition.

79
Date 02.-03.05.2001
Wavelength λλλλ[nm] 808
Pressure P[bar] 30 (synthetic air)
Explosive RDX 98/1/1 + 2% C
Pulse length [ms] 100
Temperature [oC] 20
RH [%] 40
Num.
E
[mJ]
+/-5
i 0 1 2 3 4
log(h) 3,25 3,27 3,29 3,31 3,33 3,35 3,37 3,39
h[mA] 1778 1862 1950 2042 2138 2239 2344 2455
1 82 +
2 81 +
3 80 +
4 79 +
5 78 -
6 79 -
7 80 -
8 81 +
9 80 +
10 79 -
11 80 +
12 79 -
13 80 -
14 81 +
15 80 +
16 79 -
17 80 +
18 79 -
19 80 +
20 79 +
21 78 -
22 79 +
23 78 -
24 79 -
25 80 +
26 79 -
27 80 -
Σni[+]= 14 ni[+] 0 3 7 3 1
Σni[-]= 13 ni[-] 3 7 3 0 0
Table of Appendix 1. Laser ignition experiment for RDX98/1/1 with 2% extra
carbon black.
80
In the laser ignition sensitivity experiments on explosives or on other energetic
materials, the diode laser current corresponds to the height in the sensitivity
experiments described above. The laser light energy on the surface of a pressed
explosive pellet has linear correspondence to the diode laser current (Fig. 3.4.6.).
As an example of the use of the up-and-down method for laser ignition research,
there are experiments on RDX/1/1 + 2% carbon black in the 30 bar pressure of
synthetic air (Table of Appendix 1). The wavelength of the diode laser was 808
nm and the diameter of the optical fibre was 0.8 mm.
Simple statistical analysis94, 107
The rule to choose N: ∑ −][in = 13 is less than ∑ +][in = 14, and so N = 13.
1332710
=⋅+⋅==∑=
k
iiinA and 193271 2
0
2 =⋅+⋅==∑=
k
iiniB
The mean value has the expression:
34.35.013
1302,031.35.0 =
++=
±+=N
AdyX ,
which corresponds to the diode laser current of 2291.5 mA (+0.5 because of N
being chosen as the quantity of minus signs). The variable d is the expected value
of standard deviation (or standard error) and has an advanced estimation with the
value of 0.02. The mean value X is the 50% confidence interval and so 50%
ignition probability too. The standard deviation s is written in the form:
( ) 0159.0029.0462.002.0620.1029.0620.12
2
=+⋅=
+−=
N
ANBds . The
formula of s is an approximation which is quite accurate when ( ) 22 / NANB− is
larger than 0.3 but breaks down rapidly when ( ) 22 / NANB− becomes less than
0.3. In this example ( ) 3.0462.0/ 22 >=− NANB .
The expression of the 5% confidence interval (5% ignition probability) is written
in the form: 31.30159.0645.134.305 =⋅−=⋅−= szXP a , where 645.1=az is
81
chosen from the table of normal deviation. The value 3.31 of 05P corresponds to
the diode laser current of 2060 mA.
The 95% confidence interval (95% ignition probability) is estimated by
366.30159.0645.134.395 =⋅+=⋅+= szXP a corresponding to the diode laser
current of 2324 mA.
The example above (Table of Appendix 1) is shortened by the number of tests but
describes a typical case of an up-and-down sensitivity experiment well, where the
primary advantage is that it automatically concentrates on testing near the mean.
According to reference94 the statistical analysis may be unreliable, when the
number of tests is less than 40.
In the laser ignition example, the testing interval of 0.02 is chosen to correspond
to the diode laser current of about 100 mA. According to the testing interval
analysis94 the interval should be within the range of about 0.5σ to 2σ , where σ
is the standard deviation of the experiment. It is unknown but the value of s is a
good approximation. So in the case of this example, the interval should be 0.008
to 0.032 and it is 0.02. In the laser ignition experiments described in Chapter 3 the
interval used was 0.01, which corresponds to the diode laser current interval of
about 50 mA. The number of experiments was usually from 30 to 50, which is in
good agreement with the studies of other authors.79, 107
82
Appendix 2
Decomposition of RDX at fast heating rates and its detonation products
The decomposition mechanism of energetic materials, such as nitramines and
RDX, are highly dependent upon the chemical environment and the heating rates
of the energetic material and may be more complicated than simply unimolecular
decomposition.108, 109 The pathway for unimolecular decomposition of RDX in the
case of rapid heating rate is presented in Fig. 1 of Appendix 2. The total energy of
chain bond breaking is 262 kcal/mol (4939 kJ/kg). The heat of explosion as
computed by the ICT-Thermodynamic code for RDX is 5297 kJ/kg and the heat
of detonation is 6322 kJ/kg.40 The term heat of explosion is used for propellants
and heat of detonation for explosives.14 The decomposition mechanisms of
energetic materials and thermochemical modelling applied to decomposition of
energetic materials is thoroughly presented in many references.14, 108, 109
Figure 1 of Appendix 2. Decomposition mechanism for RDX under rapid heating
rates. The number indicates the order in which the bonds are broken. The bond
breaking energies are given in parentheses in [kcal/mol].108

83
Figure 2 of Appendix 2 depicts the decomposition paths for RDX in the collision-
free IR multiphoton decomposition experiment.110
Figure 2 of Appendix 2. Decomposition paths for RDX in the collision-free IR
multiphoton decomposition experiment.110
The elemental formula of RDX is C3H6N6O6. In the detonation reaction the
products of RDX are: 3N2, 3H2O, and 3CO. In the afterburning reactions CO
reacts with oxygen in the air producing CO2.14 Heat of combustion of CO is 283.0
kJ/mol (67.59 kcal/mol).111

84
Appendix 3
Decomposition of gaseous RDX in the laser-induced ignition process
In the chemical kinetics studies with gaseous RDX 49 species and 250 elementary
reactions have been identified.112 The formation of CN species as mentioned
earlier gives rise to a luminous flame often serving as an ignition criterion for
both experimental and theoretical studies.63 For all the cases studied in
reference63, ignition occurs only if the initial temperature exceeds 600 K (327 oC).
The gaseous RDX ignition process can be divided into five distinct stages: I
Thermal decomposition, II First oxidation, III Chemical preparation, IV Second
oxidation, and V Completion stages (Fig 3.6.8). In Stage I, RDX decomposes to
low-molecular weight species such as CH2O, N2O, NO2, HCN, and HONO. This
decomposition process is slightly endo/exothermic or thermally neutral depending
on the initial temperature. In Stage II, oxidation reactions occur and release a
significant amount of energy with the temperature reaching about 1500 K (1227 oC). The dominant net reactions in Stage II can be given as follows:63
[ ]molkcalH∆
CH2O + NO2 → H2O + NO + CO -44
HNO + HONO → H2O + 2NO -23
2HCN + NO2 → C2N2 + NO + H2O -33
CO + NO2 → CO2 + NO -53
2HONO → NO + NO2 + H2O + 8
2NO2 → 2NO + O2 +29
The net heat release is 153 kcal/mol. The heat release in Stage II is mainly caused
by the conversion of CH2O and NO2 to H2O, NO, and CO, and to a lesser extent
by the reactions of HCN and HONO.63

85
Stage III represents the chemical preparation time before the second oxidation
reactions (Stage IV) take place. The species formed in Stage II are relatively
stable due to the high activation energies of their associated reactions, and require
a finite time to further oxidize. The highly exothermic reactions occurring in
Stage IV are according to reference63 the net reactions:
[ ]molkcalH∆
2HCN + NO → 2CO + 2N2 + H2 -158
N2O + H2 → N2 + H2O -78
C2N2 + 2NO → CO + 2N2 -169
Thus the net heat release is 405 kcal/mol. The reduction of HCN and NO to N2,
CO, H2O, and H2 is largely responsible for the heat release in Stage IV. Finally,
when all the final products are formed, no further reactions occur in Stage V (Fig
3.6.8).63 If RDX does decompose in the condensed phase during the laser-induced
ignition process, the decomposition products on the surface may affect the gas-
phase reaction mechanism.63
Laser ignition with mass spectroscopy (LI/MS) has been used to study the pre-
ignition/ignition zone of some explosives including RDX.113 A CO2 laser has
been used to produce the ignition pulse. The main decomposition products have
been identified as N2O, NO, CO2, N2, NO2, HCN, H2CO and H2O (for H2CO the
form CH2O is used in reference63). The conclusions mention for example, that
HCN and H2CO play important part in the ignition process of RDX and the
ignition of RDX is a multi-phase reaction (involving a gas phase and a condensed
phase).
The combination of laser ignition with LIF (Laser Induced Fluorescence)
spectroscopy has been used to study the gas phase reactions and decomposition
products of RDX.114 A CO2 laser has been used to produce the ignition pulse and
a Nd:YAG pumped dye laser has been used to monitor the reaction and reaction

86
products. The technique has been used to measure the relative NO and CN
concentrations in the subignition zone of RDX. The calculation of the vibrational
temperature in the gas phase reaction zone in the front of sample at subignition
has given the temperature of 3100 K, according to authors. The conclusions
mention that the Lambert-Beer absorption is the main energy interaction
mechanism between a laser beam and a high explosive, but occasionally other
unknown absorption process may occur simultaneously.

87
Appendix 4
Patent of Laser Detonator

99
References
1 W. C. Davis, Detonation Physics, Volume1, 1994, Computational Mechanics
Associates, Baltimore, MD.
2 Brish A. A., Galeeva I. A., Zaitsev B. N., Sbitnev E. A. and Tararinstev L. V.,
Fizika Goreniya i Vzryva, 2, 3, 132, (1966).
3 Brish A. A., Galeeva I. A., Zaitsev B. N., Sbitnev E. A. and Tararinstev L. V.,
Fizika Goreniya i Vzryva, 5, 4, 475, (1969).
4 Yang L. C., Menichelli C. F., Sensitivity of Explosives to Laser Energy,
California Institute of Technology, Technical Report, 32-1474, (1970).
5 Yang L. C., Menichelli C. F., Detonation of Insensitive High Explosives by a Q-
Switched Ruby Laser, 19, 473, (1971).
6 Mikkola E., Wichman I. S., On the Thermal Ignition Of Combustible Materials,
Fire and Materials, 14, 87, (1989)
7 Mikkola E., Charring of Wood, Technical Research Centre of Finland, Research
Reports 689, Espoo, (1990).
8 Atkins P. W., Physical Chemistry, Fourth Edition, Oxford University Press,
(1990).
9 Laidler K. J., The World of Physical Chemistry, Oxford University Press,
(1993).
10 Meyer R., Koehler J., Homburg A., Explosives, 5th Edition, Wiley-VCH,
(2002).

100
11 Chapman D. L., Phil. Mag., 47, 90, 1899. M. Jouguet, Sur la propagation des
reactions chimiques dans les gaz, Journal de mathematiques pure et appliquees,
60, 347, (1905).
12 Fickett W., Davis W. C., Detonation Theory and Experiment, Dover
Publications, Inc., New York, (2000).
13 Tokmakoff A., Fayer M. D., Dlott D. D., Chemical Reaction Initiation and Hot-
Spot Formation in Shocket Energetic Molecular Materials, J. Phys. Chem., 97,
1901, (1993).
14 Cooper P. W., Explosives Engineering, Wiley-VCH, Inc., (1996).
15 Campbell A. W., Davis W. C., Travis J. R., Shock Initiation of Detonation in
Liquid Explosives, Physics of Fluids 4, 498, (1961).
16 Tarver C. M., Combustion and Flame, 46, 157, (1982).
17 Mader C. L., Numerical Modelling of Detonations, University of California
Press, Berkeley, CA, (1979).
18 Campbell A. W., Davis W. C., Ramsay J. B. and Travis J. R., Shock Initiation
of Solid Explosives, Physics of Fluids 4, 511, (1961).
19 Mader C. L., Forest C. A., Two-Dimensional Homogeneous and Heterogeneous
Detonation Wave Propagation, Los Alamos Scientific Laboratory report LA-6259
(1976).
20 Starkenberg J., An Assessment of the Performance of the Original and
Modified Versions of the Forest Fire Explosive Initiation Model, Proceedings
Tenth (International) Detonation Symposium, Boston, Massachusetts, July 12 –
16, (1993).

101
21 Forest C. A., Burning and Detonation, Proceedings Seventh Symposium
(International) on Detonation, Annapolis, Maryland, June 16 – 19, (1981).
22 Bowman A. L., Forest C. A., Kershner J. D., Mader C. L., Pimbley G. H.,
Numerical Modeling of Shock Sensitivity Experiments, Proceedings Seventh
Symposium (International) on Detonation, Annapolis, Maryland, June 16 – 19,
(1981).
23 Zhao Feng, Sun Chengwei, Chen Peiqi and Ouyang Denghuan, Reaction Rates
of PBH-9D Explosive, Proceedings Ninth Symposium (International) on
Detonation, Portland, Oregon, August 28 – September 1, (1989).
24 Liang D., Flis W. J., and Chou P. C., The Calculation of the Constants for the
Forest Fire Model, Proceedings Tenth (International) Detonation Symposium,
Boston, Massachusetts, July 12 – 16, (1993).
25 Fedoroff B. T., Sheffield O. E., Encyclopedia of Explosives and Related Items,
Picatinny Arsenal Dover, New Jersey, USA, 7, (1975).
26 Bowden F. P., Yoffe A. D., Initiation of Growth of Explosions in Liquids and
Solids, Cambridge University Press, Cambridge, (1952).
27 Kelzenberg S., Weiser V., Roth E., Eisenreich N., Berger B. and Haas B., Hot
Spot Modeling of Thermite Type Reactions Regarding Particle Size and
Composition, 34th International Pyrotechnics Seminar Proceedings, Volume 1, 81-
92, Beaune, France, from october 8 to 11, (2007).
28 Bowden F. P., Yoffe A. D., Chapters II, III and IV, (1952).
29 Bowden F. P., Yoffe A. D., Chapters IV, V and VII, (1958).

102
30 Bowden F. P., Proceedings of 9th International Symposium on Combustion, p
499-515, Academic Press, (1963).
31 Mader C. L., Phys Fluids 6 (3) 375 (1963) and CA 58, 8844, (1963).
32 Mader C. L., Phys Fluids 8 (10) 1811 (1965) and CA 63, 16120, (1965).
33 Mader C. L., Proceedings of 5th Symposium on Detonation, p 177, (1970).
34 Blackburn J.H. and Seely L. B., Trans Farad Soc 61, 537, (1965) and CA 62,
8924, (1965).
35 Kholevo, Proceedings International Conference on Sensitivity and Hazards of
Explosives, p 5 – 26, London, (1963).
36 Andreev, Proceedings International Conference on Sensitivity and Hazards of
Explosives, p 47 – 151, London, (1963).
37 Afanas’ev, Bobosev, Initiation of Solid Explosives by Impact, Acad. Sc. USSR,
(1968), (Translation 19).
38 Urbanski T., Chemistry and Technology of Explosives, Vol 1, Pergamon Press,
Oxford, (1983).
39 Finnish Defence Forces Technical Research Centre, Results in the Research of
Explosive Technology Laboratory.
40 Mayer R., Köhler J., Homburg A., Explosives, Wiley-VCH Verlag GmbH,
Weinheim, (2002).
41 Afanas’ev, Bobolev, Initiation of Solid Explosives by Impact, Acad. Sc. USSR,
(1968).

103
42 Johnson J. N., Tang P. K., Forest C. A., Shock-wave initiation of heterogeneous
reactive solids, J. Appl. Phys., 57, 9, 4232, (1985).
43 Lee E. L., Tarver C. M., Phenomenological Model of Shock Initiation in
Heterogeneous Explosives, Phys. Fluids, 23, 12, 2362, (1980).
44 Lee E. L., Hornig H. C., Kury J. W., Lawrence Livermore Laboratory Report
UCRL-50422, (1968).
45 Taylor B. C., Ervin L. H., Separation of ignition and buildup to detonation in
pressed TNT, Proceedings Sixth Symposium (International) on Detonation, ARC-
221, Office of Naval Research-Department of the NAVY, p. 3, Coronado,
California, (1976).
46 Tarver C.M., Breithaupt R. D., Kury J. W., Current Experimental and
Theoretical Understanding of Detonation Waves in Heterogeneous Solid
Explosives, International Synposium on Pyrotechnics and Explosives, 692,
Beijing, China, 12 – 15 October (1987).
47 Tarver C. M., Ignition and Growth Modelling of LX-17 Hockey Puck
Experiments, Propellants, Explosives, Pyrotechnics, 30, 2, 109, (2005).
48 Tarver C. M., Hallquist J. O., Erickson L. M., Modeling Short Pulse Duration
Shock Initiation of Solid Explosives, Proceedings 8th Symposium (International)
on Detonation, Naval Surface Weapons Center NSWC MP 86-194, p. 951,
Albuquerque, NM, 15 – 19 July (1985).
49 Green L. G., Tarver C. M., Erskine D. J., Reaction Zone Structure in
Supracompressed Detonating Explosives, Proceedings 9th Symposium

104
(International) on Detonation, Office of the Chief of Naval Research OCNR
113291-7, p. 670, Portland, OR, August 28 – September 1 (1989).
50 Tarver C. M., Kury J. W., Breithaupt R. D., Detonation Waves in
Triaminotrinitrobentzene, J. Appl. Phys., 82, 3771, (1997).
51 Tarver C. M., Parker N. L., Palmer H. G., Hayes B., Erickson L. M., Reactive
Flow Modeling of Recent Embedded Gauge and Metal Acceleration Experiments
on Detonating PBX 9404 and LX-17, J. Energ. Mater., 1, 213, (1983).
52 Sheffield S. A., Bloomquist D. D., Tarver C. M., Subnanosecond
Measurements of Detonation Fronts in Solid High Explosives, J. Chem. Phys., 80,
3831, (1984).
53 Tarver C. M., Maiden D. E., Experimental Measurements and Numerical
Simulations of Metal Spallation by Detonating Solid Explosives, Shock Waves in
Condensed Matter-1987, Elsevier Science Publishers B. V., New York, p. 363,
(1988).
54 Tarver C. M., Modeling Shock Initiation and Detonation Divergence Tests on
TATB-Based Explosives, Propellants, Explosives, Pyrotechnics, 15, 132, (1990).
55 Tarver C. M., Tao W. C., Lee C. G., Sideways Plate Push Test for Detonating
Solid Explosives, Propellants, Explosives, Pyrotechnics, 21, 238, (1996).
56 Tarver C. M., Breithaupt R. D., Kury J. W., Detonation Waves in
Pentaerythritol Tetranitrate, J. Appl. Phys., 81, 7193, (1997).
57 Kury J. W., Breithaupt R. D., Tarver C. M., Detonation Waves in
Trinitrotoluene, Shock Waves, 9, 227, (1999).
58 Kovalskii A. A., Khlevnoi S. S., Mikheev V. F., Fizika Goreniya I Vzryva, 3,
527, (1967).

105
59 Srakovskii L. G., Frolov E. I., Fizika Goreniya I Vzryva, 16, 140, (1980).
60 Frank-Kamenetskii D. A., Calculation of Thermal Explosion Limits, Acta
Physicochimica U.R.S.S., 10, 365, (1939).
61 von Allmen M., Blatter A., Laser Beam Interactions with Materials: Physical
Principals and Applications, Springer, New York, (1995).
62 Silfvast W. T., Laser Fundamentals, 316, Cambridge University Press, (1999).
63 Liau Y. -C., Kim E. S. and Yang V., A comprehensive analysis of laser-induced
ignition of RDX monopropellant, CPIA Pupl. 2000, 701 (JANNAF 37th
combustion subcommittee meeting, 2000, Vol 1).
64 Krause G., Stationary Theory of Heat Explosion, Proceedings 38th
International Annual Conference of ICT, June 26 – 29, Karlsruhe, Federal
Republic of Germany, 18-1 – 18-12, (2007).
65 Krause G., Theory of Heat Explosion, 2. Symposium in Theory of Heat
Explosion, Chem. Kinetics and Calorimetry, Potsdam, (2007).
66 Bellamy, Anthony, A method for production of HNS II, European Patent,
EPO0277386, Assignee: Bofors Explosives AB (Karlsskoga, S-691 86, SE),
Application number: EP19870202613, 14.06.1995.
67 Dobratz B. M., LLNL Handbook of Explosives, UCRL-52997, Lawrence
Livermore National Laboratory, (1981).
68 Brish A. A., Galeeva I. A., Zaitsev B. N., Sbitnev E. A. and Tararinstev L. V.,
Fizika Goreniya i Vzryva, 2, 3, 132, (1966).
106
69 Brish A. A., Galeeva I. A., Zaitsev B. N., Sbitnev E. A. and Tararinstev L. V.,
Fizika Goreniya i Vzryva, 5, 4, 475, (1969).
70 Yang L. C., Menichelli C. F., Sensitivity of Explosives to Laser Energy,
California Institute of Technology, Technical Report, 32-1474, (1970).
71 Yang L. C., Menichelli C. F., Detonation of Insensitive High Explosives by a
Q-Switched Ruby Laser, 19, 473, (1971).
72 Botcher T. R., Ladouceur H. D. and Russell T. P., Pressure Dependent Laser
Induced Decomposition of RDX, Shock Compression of Condenced Matter -
1997, The American Institute of Physics, 989-992, (1998)
73 Renlund A. M., Stanton P. L. and Trott W. M., Laser initiation of secondary
explosives, Proceedings Ninth Symposium (International) on Detonation,
Portland, Oregon, August 27 – September 1, 1118-1127, (1989).
74 Marchand A. and Bigot C., Solid-state Laser Initiation System for Defense
Application, 34th International Pyrotechnics Seminar Proceedings, Volume 2,
679-689, Beaune, France, from october 8 to 11, (2007).
75 Moulard H., Ritter A. and Mory J., Studies on Working Time Reproducibility
of a Laser Ignited Detonator, 34th International Pyrotechnics Seminar
Proceedings, Volume 2, 667-677, Beaune, France, from october 8 to 11, (2007).
76 Sofue T., Iwama A., Ignition of Composite Propellant at Subatmospheric
Pressures by means of Carbon Dioxide Laser, Propellants and Explosives, 4, 98-
106, (1979).

107
77 Harayama M., Saito T., Iwama A., Ignition of Composite Propellant at
Subatmospheric Pressures, Combustion and Flames, 52, 81-89 (1983).
78 Östmark H., Laser as Tool in Sensitivity Testing of Explosives, Proceedings 8th
Symposium on Detonation, 473-484, NSWC 86-194, Albuquerque, New Mexico,
July 15-19, (1985).
79 Östmark H. and Gräns R., Laser Ignition of Explosives: Effects of Gas Pressure
on the Threshold Ignition Energy, Journal of Energetic Materials, 8, 4, 308-322,
(1990).
80 Östmark H., Roman N., Laser Ignition of Explosives: Pyrotechnic Ignition
Mechanisms, Journal of Applied Physics, 73, 4, 1993-2003, (1993).
81 Kuo K. K., Kim J. U., Fetherolf B. L., Torikai T., Preignition Dynamics of
RDX-Based Energetic Materials Under CO2 Laser Heating, Combustion and
Flame, 95, 351 – 361, (1993).
82 Östmark H., Carlson M. and Ekvall K., Laser Ignition of Explosives: Effects of
Laser Wavelength on the Threshold Ignition Energy, Journal of Energetic
Materials, 12, 63-83, (1994).
83 Kunz S. C., Salas F. J., Diode Laser Ignition of High Explosives and
Pyrotechnics, Sandia National Laboratories, SAND—87-3032C, DE88 008771,
(1988).
84 Ewick D. W., Beckman T. M., Holy J. A. and Thorpe R., Ignition of HMX
Using Low Energy Laser Diodes, EG&G Mound Applied Technologies, MLM--
3628-OP DE90 007637 (1990).

108
85 Glass M. W., Merson J. A., Salas F. J., Modeling low Energy Laser Ignition of
Explosive and Pyrotechnic Powders, Sandia National Laboratories, SAND—92-
0249C, DE88 015000, (1992)
86 Petterson A., Petterson J. and Roman N., Diode Laser Ignition of Unconfined
Secondary Explosive: A Parametric Study, Proceedings 11th (International)
Detonation Symposium, Snowmass, Colorado, August 30 – September 4, (1998).
87 Dilhan D., Moulard H., Ritter A. and Castarede M., Overview of Recent
Developments of Laser Initiated Detonator for Space Applications, 34th
International Pyrotechnics Seminar Proceedings, Volume 2, 657-666, Beaune,
France, from october 8 to 11, (2007)
88 Harrach R. J., Journal of Applied Physics, 47, 2473, (1976)
89 Chernai A. V., Fizika Goreniya I Vzryva, 18, 48, (1982)
90 Atwood A. I., Price C. F., Boggs T. L. and Richter H. P., Transient Combustion
Analysis of Energetic Materials, Proceedings 19th International Annual
Conference of ICT, June 29 – July 1, Karlsruhe, Federal Republic of Germany, I-
1, (1988).
91 Price C. F., Atwood A. I. and Boggs T. L., An Improved Model of the
Deflagration-to Detonation Transition in Porous Beds, Proceedings Ninth
Symposium (International) on Detonation, August 28 – September 1, Portland,
Oregon, I , 363 – 376, (1989).
92 Gillard Ph, and Roux M., Ignition of Pyrotechnic Mixture by means of Laser
Diode, Part I: Numerical Modeling, Propellants, Explosives, Pyrotechnics, 22,
256-262, (1997)

109
93 Rubenchik A., M., On the Initiation of High Explosives by Laser Radiation,
Propellants, Explosives, Pyrotechnics, 32, 4, 296-300, (2007)
94 Dixon W. J., Massey, Jr. F. J., Introduction to Statistical Analysis, Second
Edition, McGraw-Hill Book Company, Inc., New York, (1957)
95 Toivanen T.-J., Analyse report 08/129/D/I of Defence Forces Technical
Research Centre, 14.2.2008.
96 Urbanski T., Chemistry and Technology of Explosives, Vol 4, 374, Pergamon
Press, Oxford, (1983)
97 Debenham D. F. and Owen A. J., Proceedings of Fourth Symposium on
Stability of Explosives, 201, Mölle, 1976.
98 Maksimov Yu. Ya., in, Theory of Explosives (Ed. Andreev K. K.), 73,
Collective vol., Vysshaya Shkola, Moscow, 1967.
99 Hihkiö M., Vormisto T., TG and DSC measurements of pure RDX, Finnish
Defence Forces Technical Research Centre, PVTT, Explosives Technology, 2003.
100 Rosen J. M., Dickinson C., Vapour Pressures and Heats of Sublimation of
Some High Melting Organic Explosives, J. Chem. Eng. Data 14, 120 - 124, 1969
101 Cosgrave J. D. and Owen A. J., Comb. & Flame 22, 13, 19 (1974)
102 Strakouskiy L., Cohen A., Fifer R., Beyer R. and Forch B., Laser Ignition of
Propellants and Explosive, ARL-TR-1699, Army Research Laboratory, Aberdeen
Proving Ground, MD, (1998).

110
103 Kim E. S., Ph.D. Thesis, The Pennsylvania State University, Department of
Mechanical and Nuclear Engineering, (2000).
104 Roman N., Pettersson A., Pettersson J. and Bergman H., Diode laser ignition
of RDX 98/1/1, Proceedings 33th International Annual Conference of ICT, June
25 – 28, Karlsruhe, Federal Republic of Germany, 26-1 – 26-16, (2002).
105 Harkoma M., Hihkiö M. and Vormisto T., Laser Detonator, European Patent
Office, EP 1 443 297 B1, DE, FR, GB, SE, Proprietor PVTT, Application
number: 04397005.2, Bulletin 2008/43, 22.10.2008.
106 Harkoma M., Hihkiö M. and Vormisto T., DDT-tyypin lasersytytin,
Laserdetonator av DDT-typ, Patentti ja rekisterihallitus, FI 112702 B, Haltija
PVTT, F42C 19/00, 31.12.2003.
107 Discussions with Roman N., Pettersson J. and Pettersson A. in FOI
Department of Energetic Materials, Grindsjön in Autumn1997.
108 Melius C. F., Thermocemical Modeling: I. Application to Decomposition of
Energetic Materials. An article in the book: Bulusu S. N., Chemistry and Physics
of Energetic Materials, Kluwer Academic Publishers, 1990, and references
therein.
109 Östmark H., Bergman H., Ekvall K., Langlet A., A study of the sensitivity and
decomposition of 1,3,5-trinitro-2-oxo-1,3,5-triazacyclo-hexane, Thermochimica
Acta, 260, 201-216, (1995).
110 Zhao X., Hintsa E. J., Lee Y. T., J. Chem Phys., 88, 801, (1988).

111
111 Lide D. R., CRC Handbook of Chemistry and Physics, 73rd Edition, CRC
Press, Boca Raton, Florida (1992 - 1993).
112 Kim E. S., Ph.D. Thesis, The Pennsylvania State University, Department of
Mechanical and Nuclear Engineering, (2000).
113 Östmark H., Bergman H., Ekvall K., Laser pyrolysis of explosives combined
with mass spectral studies of the ignition zone, Journal of Analytical and Applied
Pyrolysis, 24, 163, (1992).
114 Östmark H., Carlson M., Ekvall K., Concentration and Temperature
Measurements in the Laser-Induced High Explosive Ignition Zone. Part I: LIF
Spectroscopy Measurements, Combustion and Flames, 105, 381, (1996).