tanzania - country strategy paper - african development bank
TRANSCRIPT

AFRICAN DEVELOPMENT BANK
AFRICAN DEVELOPMENT FUND
UNITED REPUBLIC OF TANZANIA
COUNTRY STRATEGY PAPER
2011-2015
REGIONAL DEPARTMENT EAST 1
OREA
JUNE 2011
Task Team: P. Bhakta (TZFO), P. Kariuki (UGFO), B. Hija (TZFO), G. Kaijage (TZFO), L. Kiggundu (TZFO), B.
Kishebuka (TZFO), S. Marandu (TZFO), Rweyamamu (TZFO), D. O. Leo (TZFO), S. Turay (OREA)I. Amadou
(OSAN), C. Ambert (OPSM), S. Chinien (OSGE), P. Dzimiri (OWAS), B. Issahaku (OSHD), F. Mkandawire (ORPF),
E. Muguti (ONEC), M. Muwele (ESTA), E. Negash (ONEC), T. Ngororano (OSGE), B. Purohit (OPSM), T. Temesgen
(OSGE),
Peer Reviewers: Ali. A. (OITC), J. Anywanu (EDRE); A. Coulibaly (OSGE), P. Dougna (OSHD), C. Mollinedo
(OSGE), K. Tench (OSGE), R. Walker (KEFO)
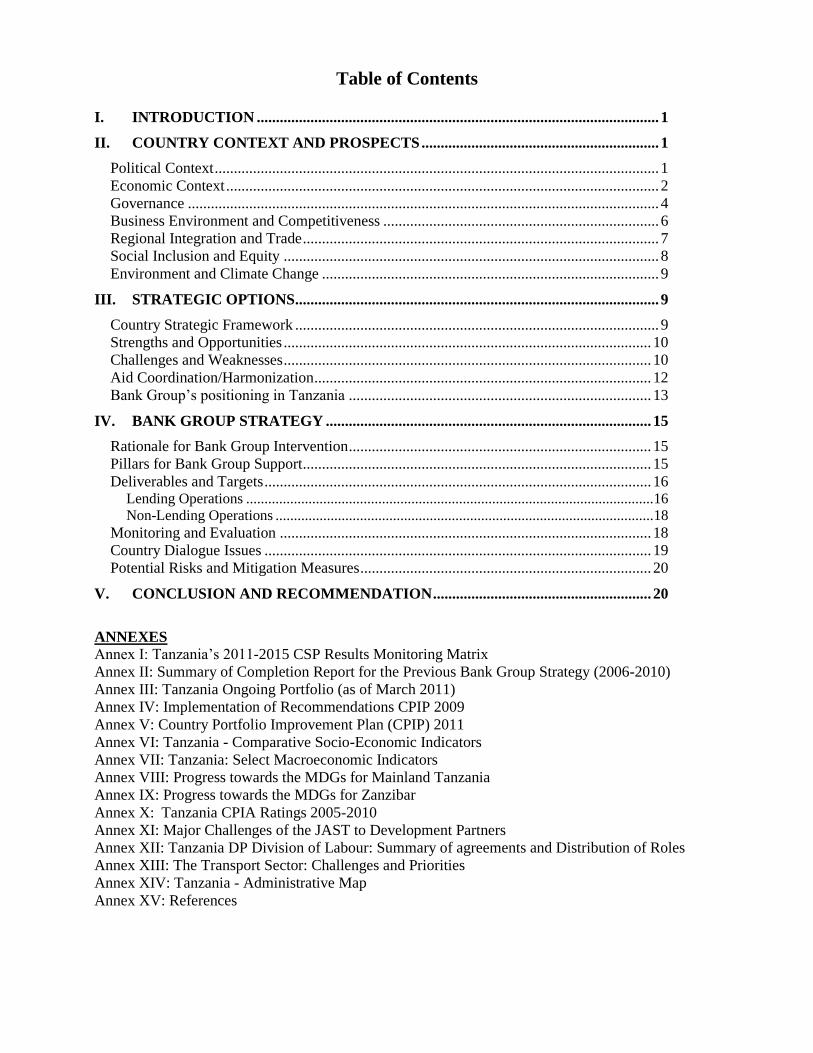
Table of Contents
I. INTRODUCTION ......................................................................................................... 1
II. COUNTRY CONTEXT AND PROSPECTS .............................................................. 1
Political Context .................................................................................................................... 1
Economic Context ................................................................................................................. 2
Governance ........................................................................................................................... 4
Business Environment and Competitiveness ........................................................................ 6
Regional Integration and Trade ............................................................................................. 7
Social Inclusion and Equity .................................................................................................. 8
Environment and Climate Change ........................................................................................ 9
III. STRATEGIC OPTIONS ............................................................................................... 9
Country Strategic Framework ............................................................................................... 9
Strengths and Opportunities ................................................................................................ 10
Challenges and Weaknesses ................................................................................................ 10
Aid Coordination/Harmonization ........................................................................................ 12
Bank Group‘s positioning in Tanzania ............................................................................... 13
IV. BANK GROUP STRATEGY ..................................................................................... 15
Rationale for Bank Group Intervention ............................................................................... 15
Pillars for Bank Group Support ........................................................................................... 15
Deliverables and Targets ..................................................................................................... 16
Lending Operations ............................................................................................................... 16
Non-Lending Operations ....................................................................................................... 18
Monitoring and Evaluation ................................................................................................. 18
Country Dialogue Issues ..................................................................................................... 19
Potential Risks and Mitigation Measures ............................................................................ 20
V. CONCLUSION AND RECOMMENDATION ......................................................... 20
ANNEXES
Annex I: Tanzania‘s 2011-2015 CSP Results Monitoring Matrix
Annex II: Summary of Completion Report for the Previous Bank Group Strategy (2006-2010) Annex III: Tanzania Ongoing Portfolio (as of March 2011)
Annex IV: Implementation of Recommendations CPIP 2009 Annex V: Country Portfolio Improvement Plan (CPIP) 2011
Annex VI: Tanzania - Comparative Socio-Economic Indicators
Annex VII: Tanzania: Select Macroeconomic Indicators
Annex VIII: Progress towards the MDGs for Mainland Tanzania
Annex IX: Progress towards the MDGs for Zanzibar
Annex X: Tanzania CPIA Ratings 2005-2010
Annex XI: Major Challenges of the JAST to Development Partners
Annex XII: Tanzania DP Division of Labour: Summary of agreements and Distribution of Roles
Annex XIII: The Transport Sector: Challenges and Priorities
Annex XIV: Tanzania - Administrative Map
Annex XV: References
LIST CHARTS, TABLES AND DESCRIPTIVE BOXES
Charts
Chart 1: Political Context 2009[Score -4.0 (Worst) to 2.5 (Best)]
Chart 2: Real GDP Growth (%)
Chart 3: Consumer Price Index Inflation Average (%)
Chart 4: Fiscal Balance (% of GDP) Chart 5: Rankings - GCI Global Competitiveness Index 2010-2011 (EAC)
Chart 6: Infrastructure Indicators 2009 Chart 7: Composition and Commitment by Sector since 1971 (as at 22 June 2011) Chart 8: Pillars for Bank Support
Tables
Table 1: Ease of Doing Business (Global Rank) 2010-2011 Table 2: Trade Flow – Regional Shares of Exports and Imports Table 3: Indicative Lending Program (National) Table 4: Indicative Lending Program (Multinational) Table 5: Indicative Non- Lending Program
Descriptive Boxes
Box 1: Combatting Corruption in Tanzania Box 2: Major Regional Integration and Trade Affiliations
Box 3: Bank Group Consultations on the CSP
CURRENCY EQUIVALENTS
February 2011
UA 1 = US$ 1.453
UA 1 = EUR 1.13117
UA 1 = TZS 2,098.99 (Tanzania Shilling)
US$ 1 = TZS 1,508 (Tanzania Shilling)
GOVERNMENT FISCAL YEAR
July 1st to 30th June
WEIGHTS AND MEASURES
Metric System
ii
ACRONYMS AND ABBREVIATIONS
ADB African Development Bank
ADF African Development Fund
AIDS Acquired Immuno-Deficiency Syndrome
ALC Alternative Learning Center
ALSD Alternative Learning and Skills Development Project
ASDP Agriculture Sector Development Program
BOT Bank of Tanzania
CAR Commitment at Risk
CCM Chama Cha Mapinduzi
COMESA Common Market for Eastern and Southern Africa
CPI Consumer Price Index
CPIA Country Policy and Institutional Assessment
CPIP Country Portfolio Improvement Plan
CPPR Country Portfolio Performance Review
CSP Country Strategy Paper
CStP Country Statistical profile
CUF Civic United Front
DP(s) Development Partner(s)
DPG Development Partners‘ Group
DRM Domestic Resource Mobilization
EA Executing Agency
EAC East African Community
EITI Extractive Industries Transparency Initiative
ESW Economic and Sector Work
FAO Food and Agriculture Organization
FDI Foreign Direct Investment
FY Fiscal Year
GBS General Budget Support
GDP Gross Domestic Product
GIZ Gesellschaft für Internationale Zusammenarbeit
GNU Government of National Unity
GoT Government of Tanzania
GSTP Global System of Trade Preferences among Developing Countries
HDI Human Development Index
HIV/AIDS Human Immuno-deficiency Virus/Acquired Immuno-Deficiency Syndrome
IA Implementation Agency
ICP International Comparison Program
IFAD International Fund for Agriculture Development
IFAD International Fund for Agricultural Development
IFMIS Integrated Financial Management Information System
IFLS Integrated Labor Force Survey
ILO International Labor Organization
IMF International Monetary Fund
IOM International Organization for Migration
ISP Institutional Support Project
JAST Joint Assistance Strategy for Tanzania
iii
JICA Japan International Cooperation Agency
JPD Joint Program Document
JSAN (IMF-World Bank) Joint Staff Advisory Note
KOICA Korea International Cooperation Agency
M&E Monitoring and Evaluation
MCC Millennium Challenge Corporation
MDGs Millennium Development Goals
MIVARFP Marketing Infrastructure, Value Addition & Rural Finance Program
MKUKUTA Mkakati wa Kukuza Uchumi na Kupunguza Umasikini Tanzania
MKUZA Mkakati wa Kukuza Uchumi na Kupunguza Umasikini Zanzibar
MTEF Medium Term Expenditure Framework
MIVARF Market Infrastructure, Value Addition and Rural Financing
NSGRP National Strategy for Growth and Reduction of Poverty
PAF Performance Assessment Framework
PCB Prevention of Corruption Bureau
PCCB Prevention and Combating of Corruption Bureau
PCR Project Completion Report
PEDP Primary Education Development Program
PEFAR Public Expenditure Financial Accountability Review
PFM Public Financial Management
PFMRP Public Financial Management Reform Program
PIU Project Implementing Unit
PPP Purchasing Power Parity
PPPs Public Private Partnerships
PRBS Poverty Reduction Budget Support
PRSL Poverty Reduction Support Loan
RIFF Regional Integration Facilitation Forum
RISP Regional Integration Strategy Paper
SADC Southern African Development Community
SAI Supreme Audit Institution
SBS Sector Budget Support
SNA System of National Accounts
SWOT Strengths, Weaknesses, Opportunities and Threats
SEDP Secondary Education Development Program
TANESCO Tanzania Electricity Supply Company
TDHS Tanzania Demographic and Health Survey
TDMS Teacher Development and Management Strategy
THMIS Tanzania HIV and Malaria Indicator Survey
TSMP Tanzania Statistical Master Plan
TZS Tanzanian Shilling
UA Unit of Account
UN United Nations
UNAIDS United Nations Program on HIV/AIDS
UNCDF United Nations Capital Development Fund
UNDP United Nations Development Program
UNEP United Nations Environment Program
UNESCO United Nations Educational, Scientific and Cultural Organization
UNFPA United Nations Population Fund

iv
UN-HABITAT United Nations Human Settlements Program
UNHCR United Nations High Commission for Refugees
UNICEF United Nations Children's Fund
UNIFEM United Nations Entity for Gender Equality and the Empowerment of Women
UNIDO United Nations Industrial Development Organization
USAID United States Agency for International Development
US$ United States of America Dollar
VAT Value Added Tax
WFP World Food Program
WHO World Health Organization
ZSGRP Zanzibar Strategy for Growth and Reduction of Poverty

1
Chart 1: Political Context 2009
[Score -4.0 (Worst) to 2.5 (Best)]
Source: AfDB Statistics Department using data from the WEF,
2011
I. INTRODUCTION
1. The Tanzania1 Country Strategy Paper for 2011-2015 assesses the country‘s development
challenges and prospects, and guides Bank Group‘s support to the priorities expressed in the new
national development strategy 2
. The Country Strategy lays emphasis on selectivity and rests on a
single overarching theme: supporting Tanzania become a more competitive economy and achieve
inclusive growth aimed at reducing poverty. This theme is anchored on two complementary pillars:
(i) infrastructure development; and (ii) building an enabling institutional and business environment.
2. The preceding Bank Group Strategy (2006-2010) was drawn from the Joint Assistance Strategy
for Tanzania (JAST), the Joint Program Document (JPD) and presented in an accompanying Cover
Note.3 The three documents were approved by the Board of Directors in 2007. The Joint Assistance
Strategy expired in 2010. Nonetheless, development partners have principally agreed to continue
working in the spirit of the JAST while deciding on how best to proceed with future collaborations.
Accordingly, the Bank and several other partners are progressing with preparation of their respective
assistance strategies; consistent with the new national development plan.4
3. Preparation of this Strategy benefited from elaborate consultations with Government,
development partners, private sector and civic institutions—including research and academic
concerns. It incorporates lessons from the 2006-2010 JAST and is underpinned by analytic and
diagnostic knowledge products. In addition to optimally utilizing Tanzania‘s performance based
concessionary resources allocation, the Strategy positions the Bank to assume a more catalytic role in
leveraging additional private and non-Bank resources.
II. COUNTRY CONTEXT AND PROSPECTS
Political Context
4. Tanzania continues to be politically stable and
peaceful; free of ethnic cleavages and labor unrest.
These factors partly explain the country‘s continued
attraction as an investment destination despite the
relatively high cost of doing business and other
structural hurdles.
5. The country scores better than other East
African countries in terms of civil liberties and
political rights, although there is room for
improvement (see Chart 1). Strength elements
include liberties such as: freedoms of press, speech
and religion; freedom of assembly and association,
and constitutionally guaranteed Women‘s rights.
Areas needing improvement include: weak transparency and accountability institutions; business
climate bottlenecks; and deteriorating educational quality.
6. In the October 2010 Presidential and Parliamentary elections, the incumbent President and the
ruling Chama Cha Mapinduzi (CCM) party secured re-election; wining 61.2 percent of the votes.
The nearest opposition candidate garnered 26.3 percent. The comfortable victory margin
notwithstanding, these results, compared to the 2005 election results, marked a slump in the CCM‘s
1 Tanzania derives from the names of the two states-- Tanganyika and Zanzibar-- that united in 1964 to form the United Republic of Tanzania. 2 The country‘s new development framework consists of the strategy for the mainland; the National Strategy for Growth and Reduction of Poverty II (or NSGRP II) and the Zanzibar Strategy for Growth and Reduction of Poverty (ZSGRP II). The NSGRP II and ZSGRP II are also popularly referred to
by their Swahili acronyms as MKUKUTA II (Mkakati wa Kukuza Uchumi na Kupunguza Umasikini) and MKUZA II (Mkakati wa Kukuza Uchumi na
Kupunguza Umasikini Zanzibar), respectively. 3 The respective Board documents were ADB/BD/WP/2007/55, and ADF/BD/WP/2007/41. The JAST MOU was signed on 05 December 2006 by the
Government and 19 Development Partners, namely-- African Development Bank, Belgium, Canada, Denmark, European Commission, Finland,
France, Ireland, Japan, Germany, Netherlands, Norway, Spain, Sweden, Switzerland, United Kingdom, World Bank, United Nations Organizations and United States of America. 4 These include: DFID, the UN-system, The World Bank, Denmark and Sweden.

2
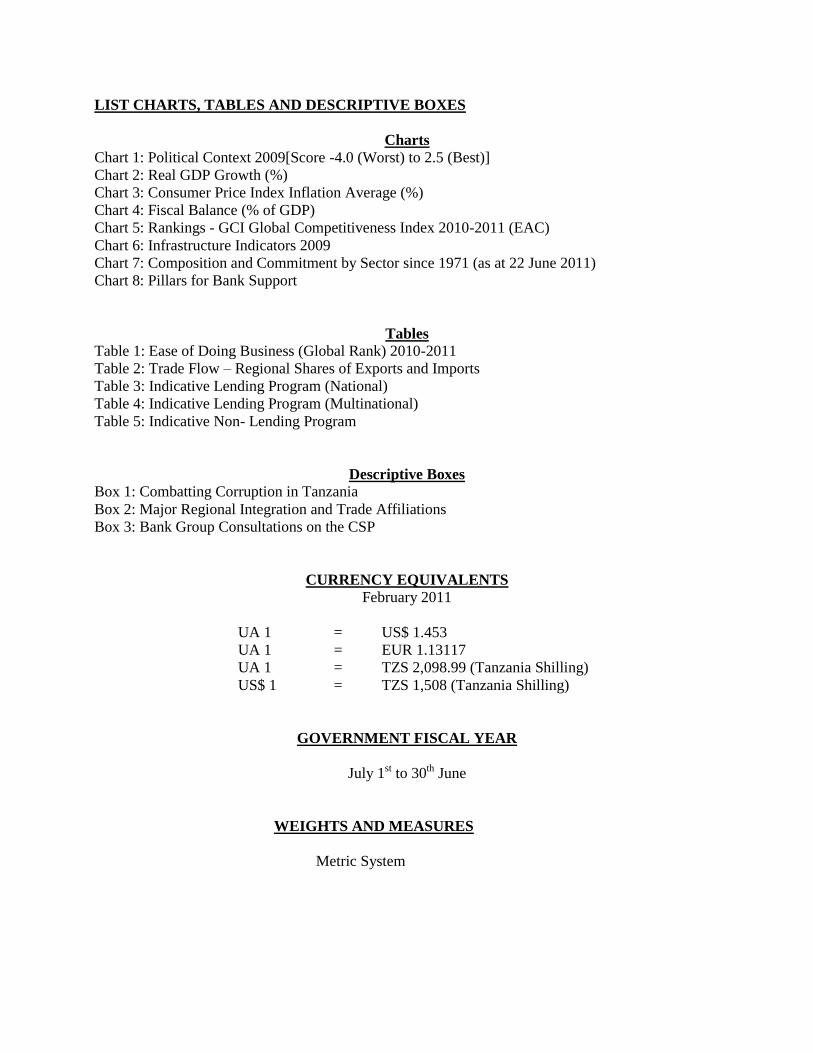
Chart 2: Real GDP Growth (%)
Source: AfDB Statistics Department, African Economic Outlook,
May 2010
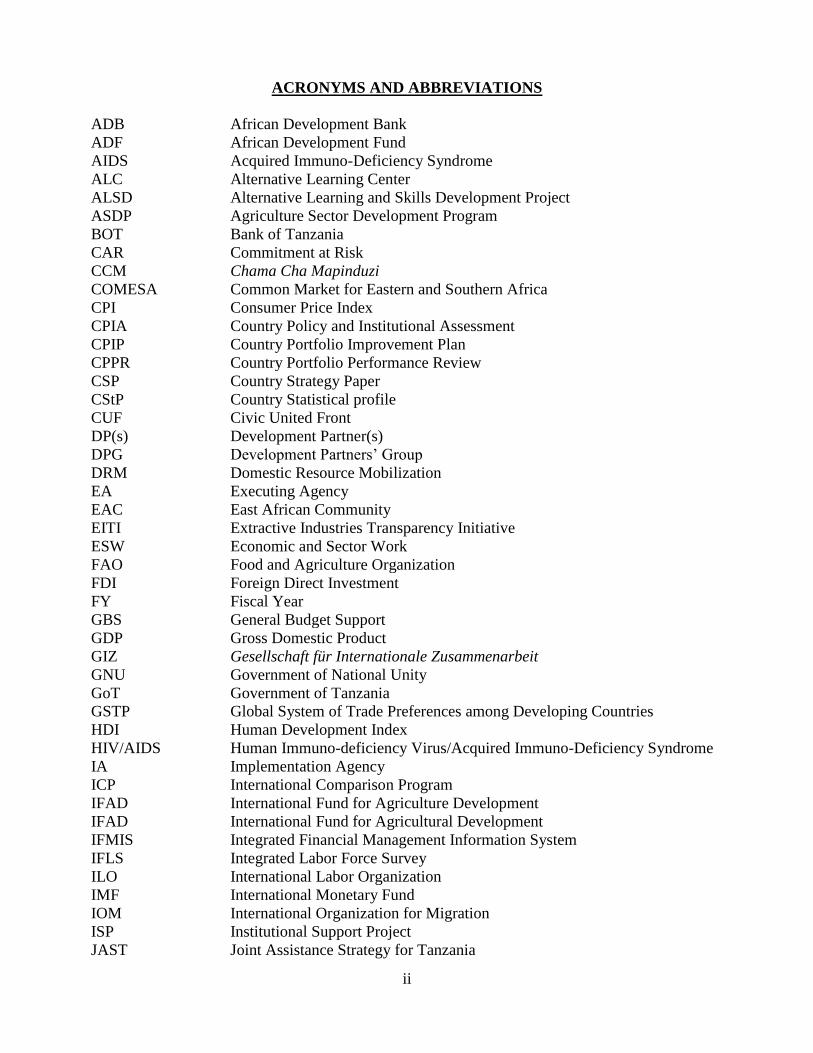
Chart 3: Consumer Price Index Inflation Average (%)
Source: AfDB Statistics Department
popularity for the first time. The latest result also points to a more spirited and competitive political
environment than before.
7. In a July 2010 referendum that preceded general elections, 66.4 percent of Zanzibari voters
agreed to the formation of a Government of National Unity (GNU). The GNU was, in effect, a
political compromise between the two key political parties; CCM and Civic United Front (CUF). In
the near-term, the key domestic political development to watch is the ongoing national debate about
the Constitution reform process.
Economic Context
8. Economic Structure: The economy is still highly dependent on agriculture, contributing an
estimated 30 percent to GDP and employing nearly 80 percent of the working population. The
service sector—which has been growing rapidly in recent years—accounts for approximately 47
percent (for opportunities and challenges see paragraphs 48-58). The two sectors are expected to
continue their dominance of the economy in the foreseeable future. The industrial sector, dominated
by the construction sub-sector, accounts for 23 percent. Industrial production plummeted in 2008-09
in the aftermath of the global economic slowdown. However, the sector has since rebounded, despite
severe and persistent power outages as well as rising fuel prices, both of which do not bode well in
the short and medium term. Since 2000, the mining sub-sector has attracted the bulk of foreign direct
investment (FDI), contributing to its rapid growth. Nevertheless, its share of GDP remains small (2.3
percent), partly because it is import dependent and not linked to the other sectors of the economy.
The sub-sector still accounts for a quarter of total exports.
9. Economic Growth: The country has achieved
impressive economic growth since the mid-1990s,
with reasonably low inflation. This reflects the
GoT‘s reform agenda, launched in the late 1980s,
ushering in a change in orientation from a state-led
strategy to market liberalization. Real annual GDP
growth increased from 3.3 percent in the early 1990s
to an average of 7 percent in the late 1990s. In 2009,
because of the global financial crisis, GDP growth
stood close to 6 percent, and recovered to 7 percent
in 2010 (Chart 2).
10. Growth Drivers: GDP growth was driven by
private consumption (growing population), exports
(due to favorable gold prices) and gross fixed capital
(mainly public investment). Private investment is
expected to lead growth in the short and medium
term. In terms of dynamic sectors, tourism and
mining continue to experience high growth rate even
if agriculture remains the largest sector.
11. Macroeconomic Management: Since early
2007, macroeconomic managment has been guided
by the IMF‘s Policy Support Instrument (PSI). The
current PSI, approved in June 2010, aims to maintain
macroeconomic stability and support accelerated
growth in line with the national development
strategy. According to the March 2011 IMF review,
the program has been implemented satisfactorily and
remains on track despite short-term challenges. (See para 12 - 14).
3
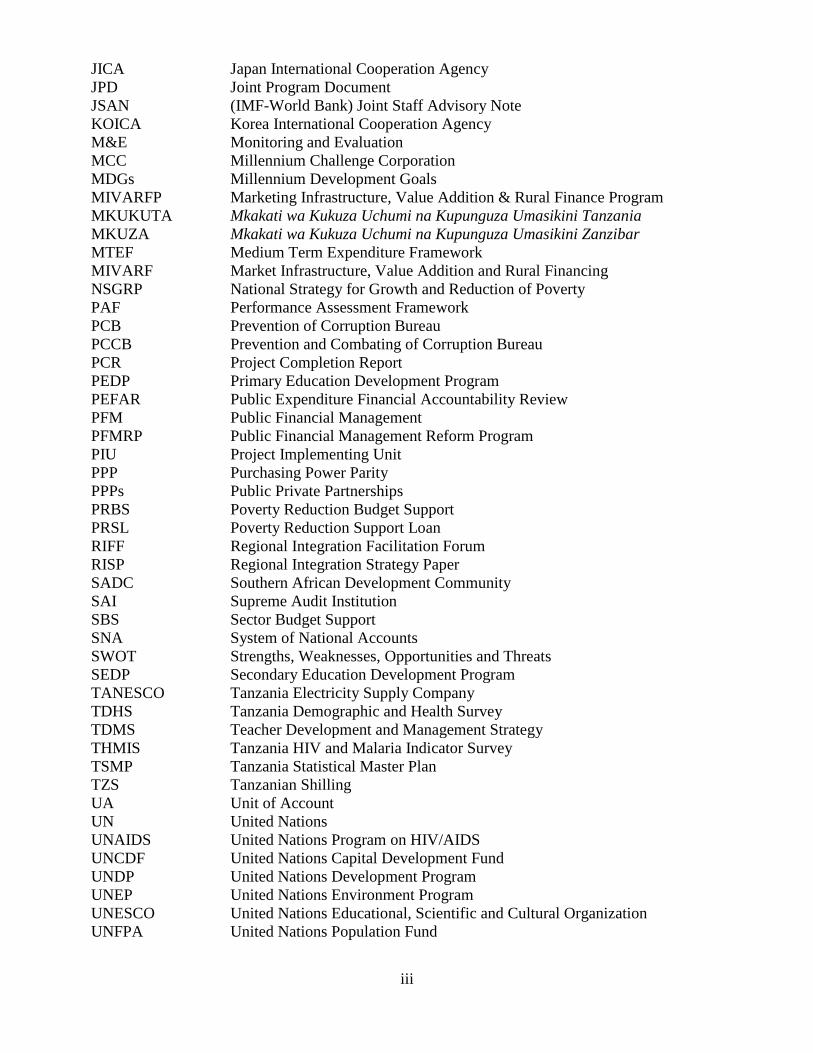
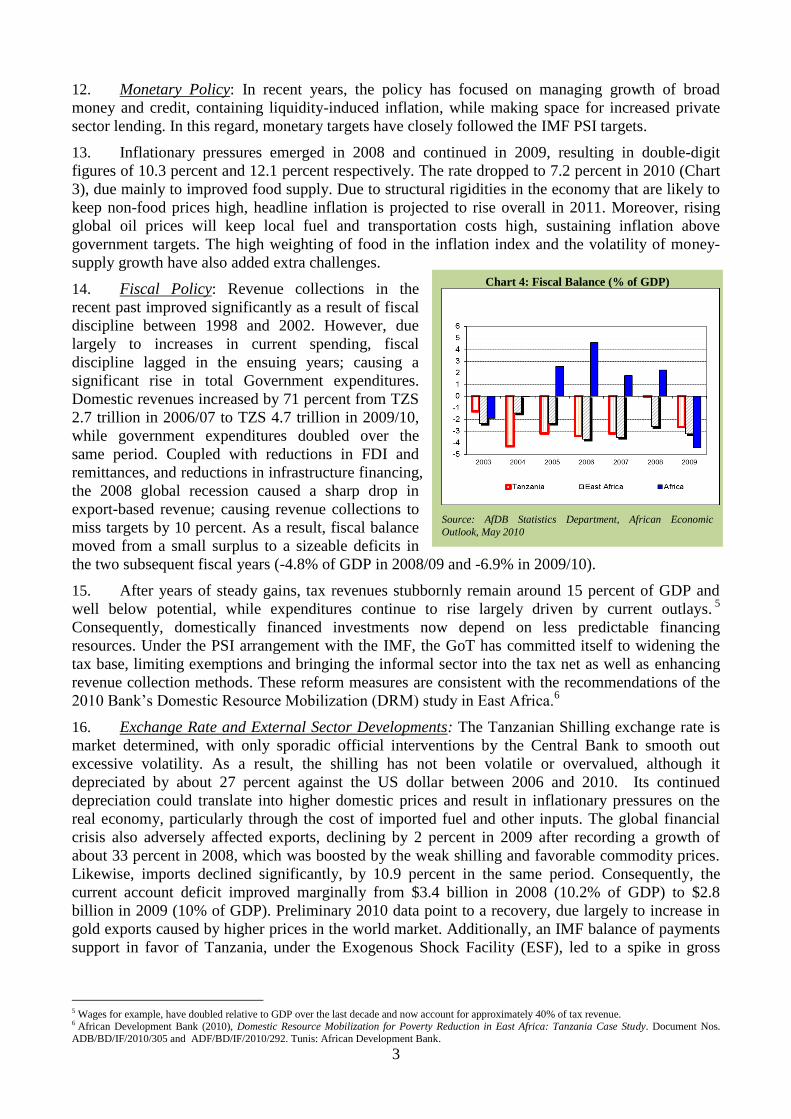
Chart 4: Fiscal Balance (% of GDP)
Source: AfDB Statistics Department, African Economic
Outlook, May 2010
12. Monetary Policy: In recent years, the policy has focused on managing growth of broad
money and credit, containing liquidity-induced inflation, while making space for increased private
sector lending. In this regard, monetary targets have closely followed the IMF PSI targets.
13. Inflationary pressures emerged in 2008 and continued in 2009, resulting in double-digit
figures of 10.3 percent and 12.1 percent respectively. The rate dropped to 7.2 percent in 2010 (Chart
3), due mainly to improved food supply. Due to structural rigidities in the economy that are likely to
keep non-food prices high, headline inflation is projected to rise overall in 2011. Moreover, rising
global oil prices will keep local fuel and transportation costs high, sustaining inflation above
government targets. The high weighting of food in the inflation index and the volatility of money-
supply growth have also added extra challenges.
14. Fiscal Policy: Revenue collections in the
recent past improved significantly as a result of fiscal
discipline between 1998 and 2002. However, due
largely to increases in current spending, fiscal
discipline lagged in the ensuing years; causing a
significant rise in total Government expenditures.
Domestic revenues increased by 71 percent from TZS
2.7 trillion in 2006/07 to TZS 4.7 trillion in 2009/10,
while government expenditures doubled over the
same period. Coupled with reductions in FDI and
remittances, and reductions in infrastructure financing,
the 2008 global recession caused a sharp drop in
export-based revenue; causing revenue collections to
miss targets by 10 percent. As a result, fiscal balance
moved from a small surplus to a sizeable deficits in
the two subsequent fiscal years (-4.8% of GDP in 2008/09 and -6.9% in 2009/10).
15. After years of steady gains, tax revenues stubbornly remain around 15 percent of GDP and
well below potential, while expenditures continue to rise largely driven by current outlays.5
Consequently, domestically financed investments now depend on less predictable financing
resources. Under the PSI arrangement with the IMF, the GoT has committed itself to widening the
tax base, limiting exemptions and bringing the informal sector into the tax net as well as enhancing
revenue collection methods. These reform measures are consistent with the recommendations of the
2010 Bank‘s Domestic Resource Mobilization (DRM) study in East Africa.6
16. Exchange Rate and External Sector Developments: The Tanzanian Shilling exchange rate is
market determined, with only sporadic official interventions by the Central Bank to smooth out
excessive volatility. As a result, the shilling has not been volatile or overvalued, although it
depreciated by about 27 percent against the US dollar between 2006 and 2010. Its continued
depreciation could translate into higher domestic prices and result in inflationary pressures on the
real economy, particularly through the cost of imported fuel and other inputs. The global financial
crisis also adversely affected exports, declining by 2 percent in 2009 after recording a growth of
about 33 percent in 2008, which was boosted by the weak shilling and favorable commodity prices.
Likewise, imports declined significantly, by 10.9 percent in the same period. Consequently, the
current account deficit improved marginally from $3.4 billion in 2008 (10.2% of GDP) to $2.8
billion in 2009 (10% of GDP). Preliminary 2010 data point to a recovery, due largely to increase in
gold exports caused by higher prices in the world market. Additionally, an IMF balance of payments
support in favor of Tanzania, under the Exogenous Shock Facility (ESF), led to a spike in gross
5 Wages for example, have doubled relative to GDP over the last decade and now account for approximately 40% of tax revenue. 6 African Development Bank (2010), Domestic Resource Mobilization for Poverty Reduction in East Africa: Tanzania Case Study. Document Nos.
ADB/BD/IF/2010/305 and ADF/BD/IF/2010/292. Tunis: African Development Bank.

4
reserves to about $3.9 billion by January 2011; sufficient to cover six-month import of goods and
services.
17. Medium-term Prospects: The expected continued global recovery and an ambitious green
revolution to revamp agriculture, popularly known as Kilimo Kwanza (agriculture first) initiative,
bode well for Tanzania‘s economy. According to Bank projections, growth is envisaged to revert to
its pre-crisis trajectory, having reached 7 percent in 2010, but expected to slow down slightly to 6.8
percent in 2011; bouncing back to 7.5 percent in 2012 and 7.8 percent by 2013.
18. There are two main challenges to the projected robust growth figures: First, the growing
fiscal deficit (see paragraph 14) resulting from GoT‘s optimistic revenue projections (& expenditure
patterns) implies a potential need to raise bridging funds. In turn, this could lead to an even greater
reliance on foreign grants and investment, or resorting to non-concessional borrowing.7 Public debt
in present value terms stood at 35.8 percent of GDP in 2010, and the ratio of debt service-to-revenue
increased from 7.5 percent in 2008 to 10.9 percent in 2010. However, the May 2010 joint IMF-
World Bank Debt Sustainability Analysis (DSA) concluded that the envisaged additional foreign
financing over the medium term would not necessarily jeopardize long-term debt sustainability, even
though it would increase the Present Value (PV) of debt-to-GDP and other indicators.
19. The second challenge over the medium-term is that growth remains highly heterogeneous;
differentiated geographically and across various segments of society.
20. Tanzania‘s economic challenges are more structural in nature (see paragraphs 53-61). Most
pressing challenges include: acute infrastructural bottlenecks—particularly in transport and energy, a
deficient fiduciary environment impeding private sector development and an under-performing
agricultural sector hindering poverty reduction efforts. A weak human resource base and significant
skills mismatch resulting from a deteriorating higher education system is also part of the structural
constraint. The Bank Group‘s proposed areas of intervention during this Strategy period derive from
these challenges (see paragraphs 76-81).
Governance
21. Tanzania has mixed achieved governance results. The World Bank‘s Governance Indicators
ranks the country between the 25 to 50 percentile amongst the 212 countries surveyed in 2009;
attaining its best score for political stability and lowest for regulatory quality. Furthermore, the Mo
Ibrahim Index of African Governance shows that, between 2008 and 2009, Tanzania maintained its
overall score of 55.0 (out of the highest possible score of 100) and its ranking remained unchanged at
12th place out of the 48 Sub-Saharan African countries. 8
Similarly, Tanzania‘s ranking in the Bank
Group‘s overall Policy and Institutional Assessment (CPIA) rating has remained at 4 for the past five
years, while its governance rating has remained at 3.8.
22. Control of Corruption Various indicators continue to rank Tanzania low in its efforts to
control corruption. For example, although the country‘s score on Transparency International‘s
Corruption Perception Index (CPI) improved between 1998 and 2007, both in absolute and relative
terms9, by 2009 the score was back to its low 2002 levels. In the 2010 CPI Tanzania scored 2.7,
ranking it 116th out of 178 countries. The CPI by definition assesses perceived rather than actual
cases of corruption. It, nonetheless, confirms respondents‘ opinion about rising corruption levels.
23. As highlighted in Box 1, anti-corruption efforts and initiatives go back several decades. Still,
both petty and grand corruption persists in the country. In general, there is inadequate access to
public information on corruption, as well as a lack of systematic surveying/monitoring and reporting.
Recently, the President ordered immediate publication of a long-anticipated National Governance
7 The Government is currently negotiating a non-concessional credit line with of the Commercial Banks. The IMF and other DPs are aware of this
development and are following very closely. 8 The Mo Ibrahim Index assesses the delivery of public goods and services to citizens by government and non-state actors. It uses indicators across four
main categories as proxies for the quality of the processes and outcomes of governance. They are: (i) safety and rule of law; (ii) participation and
human rights; (iii) sustainable economic opportunity; and (iv) human development. 9 Tanzania improved its ranking from 1.9 to 3.2

5
Box 1: Combatting Corruption in Tanzania
Efforts by the GoT to combat corruption go as far back as 1966 with the formation of the Permanent Commission of Inquiry
(Ombudsman) to check on the abuse of powers by government officials and agencies. This was followed by the 1971 Prevention
of Corruption Act, and subsequently, the creation of the Anti-Corruption Squad in 1975, which in 1991 was replaced by Prevention of Corruption Bureau (PCB), and later in 2001 evolved to Prevention and Combating of Corruption Bureau (PCCB).
In 1996, the then president set up the Warioba Commission of Inquiry to undertake a comprehensive study on corruption which
produced a detailed report with various anti-corruption recommendations. Between 2005 and January 2011, PCCB received more
than 35,000 allegations, and completed 7,339 investigations. During the same period, 928 new corruption related cases were taken
to courts, 798 of which were filed since the new Prevention and Combating of Corruption Act (2007) became operational. In total,
between 2005 and January 2011 the courts prosecuted 2,698 corruption related cases, resulting into 208 convictions against
corrupt offenders, and recovery of about US$ 19.5 million. The most recent high profile corruption cases have involved two ex-
Ministers and ex-Permanent Secretary (case still on-going); ex-employees of the Central Bank (one has been convicted – related
to loss of US$ 74 million; one case on-going – related to loss of US$ 70 million); and former Ambassador. Also, between 1995
and 2010, administrative actions were taken against 934 corrupt public servants.
and Corruption Survey report, conducted in 2009. Incidents of grand corruption scandals, weak
sanctions, deficient accounting standards and ineffective internal/external audit; all underscore the
need for greater oversight and accountability in government, strengthening legal and judicial reforms
and revamping the country‘s fiduciary environment.10
24. Public Financial Management: Results in PFM performance have been varied. Government
has enacted various legislations defining roles and responsibilities, accountability of spending
agencies, transparency requirements, and sanctions arrangements. 11
25. The PFM reform agenda is presented in the GoT‘s Public Financial Management Reform
Program (PFMRP III), which expires in June 2011.12
In September 2010, a joint GoT/Partners
mission assessed implementation progress of the action plan and found the overall progress to be
‗moderately satisfactory.‘13
Similarly, the most recent Public Expenditure and Financial
Accountability Assessment Review (PEFAR) results concluded that there are still challenges with
Government ownership of specific reforms. 14
26. The next phase of PFMRP aims to consolidate gains achieved thus far, and address remaining
challenges in the system. Seven key areas have been identified to meet this objective: (i) revenue
collections; (ii) planning and budget management; (iii) public financial accountability and
transparency; (iv) legal regulatory framework; (v) public investments and management; (vi) public
debt management; (vii) change management, program governance and management arrangements;
and (viii) building capacities of the Supreme Audit Institution (SAI), the Accountant General,
internal audit and parliamentary scrutiny.15
27. Along with progress in some areas, reinforcing fiscal discipline on budget formulation and
execution still requires urgent Government action. Improvements are especially needed in cash and
budget management, Integrated Financial Management Information Systems (IFMIS), flow of funds
to Local Government Authorities (LGAs)16
and building local PFM capacity. Annual budget cycles
also need to be carefully integrated into a transparent and realistic medium-term expenditure and
borrowing plans, accompanied by greater oversight. Regular monitoring of the Public Financial
Management Reform Program (PFMRP) is key to improved compliance with procurement
regulations and to achieve better value for money.
10 There are currently several pending legislations designed to address these challenges, including: Right to Information Act; Public Leadership Code of Ethics Act, and; Whistleblowers Act, all of which would help enhance transparency and demonstrate political will to further strengthen Tanzania‘s legal
framework. 11 These include the Constitution (1977); Tanzania Revenue Authority Act (1994); Public Finance Act (2001, revised in 2004); Public Procurement
Act (2004) ; Local Government Finance Act (1982 amended in 2001); Loans, Grants and Guarantees Act, a new Audit Act (2008) and a new Public-
Private Partnership Act (2010). The New PPA being drafted and expected to be presented to parliament by April 2011. 12The Bank‘s intervention in this area is through the Institution Support for Good Governance Project II (ISP II). 13 Out of 24 short-term actions, 15 were assessed as green, 1orange, 5 red, 2 as split and 1 as not applicable – the mission used a ‗traffic light system‘
when assessing implementation (Green indicating successful implementation, orange partially satisfactory and red not implemented). 14 The most recent PEFA was carried out between June 2008 and March 2009, with a further review in May 2010. 15 PFMRP IV and ISP II also address capacity issues at the supreme audit institution; the accountant-general‘s office; internal audit and parliamentary oversight. These interventions, among others, will help the Bank to accelerate Use of Country FM systems in its aid delivery to Tanzania. 16 A KPMG report for the system audit of Epicor IFMS revealed weaknesses both at the Central and Local government.

6
Table 1:
Ease of Doing Business (Global Rank) 2010-
2011
Topic Rankings DB 2011
Rank
DB
2010
Rank
Change
in
Rank
Starting a Business 122 122
No
change
Dealing with
Construction Permits
179 179 No
change
Registering Property 151 148 -3
Getting Credit 89 87 -2
Protecting Investors 93 92 -1
Paying Taxes 120 116 -4
Trading Across
Borders
109 111 2
Enforcing Contracts 32 32
No
change
Closing a Business 113 112 -1
Source: Doing Business, World Bank 2011
Chart 5:
Rankings - GCI Global Competitiveness
Index 2010-2011 (EAC)
Source: The Global Competitiveness Report 2010-
2011, WEF, 2010-11
28. Since 2007, the Bank, through its General Budget Support and Institutional Support
operations,17
and in close coordination with other partners through the General Budget Support
Working Group, has consistently supported Government efforts to implement a robust PFM reform
agenda. These interventions have helped Government to deter and detect corrupt practices by
strengthening accountability and transparency up-stream in the anti-corruption process.
Business Environment and Competitiveness
29. Business Environment: Whereas GoT is
committed to developing the country‘s nascent private
sector, this resolve has yet to be sufficiently translated
into adequate actions. Hence, the slow pace of reforms
continues to dampen overall investor confidence.
30. In recent years, Tanzania has slipped in the
World Bank‘s Doing Business Report 2011. Out of
183 countries, its ranking dropped from 125th to 128th
for 2010 and 2011 respectively. The drop is attributed
to the worsening ranking in five areas (see Table 1).
31. Improving the business environment is
accorded high priority by both the GoT and partners. It
was a key issue in the 2009 and 2010 GBS Annual
Reviews. In response to the deteriorating rankings in
the Ease of Doing Business, the GoT adopted a
Roadmap in 2010 focused on short, medium and long-
term reforms. Its implementation, however, has been
slow, suggesting continued unfavorable legal and
regulatory frameworks plus limited reform capacity in the public sector.
32. Other initiatives under implementation to improve the business environment include the
Business Environment Strengthening for Tanzania
Program (BEST), the Tax Modernization Program,
and an on-going Second Generation Financial Sector
Reform Program. Efforts to simplify business entry,
operation and exit are also underway. A one-stop non-
pre-approved business registration system is scheduled
to come on line in 2011.
33. Competitiveness: Tanzania ranked 113th
in the
2010-11Global Competitiveness Report, having slid by
nine positions from the previous year. Most notably,
the country has dropped from 97th (out of 122
countries) in 2006 to 113th (out of 134) in 2008. Key
challenges underlying this decline include: the
country‘s undeveloped infrastructure, particularly in
energy and transport, low human capital development,
an unsatisfactory regulatory and legal environment,
and poor quality human resource base. The financial sector also remains underdeveloped, resulting in
limited access to financial services. Less than 17 percent of formal businesses reported borrowing from
financial institutions and the stock of private sector credit is only 16-17 percent of GDP.
34. Other challenges contributing to Tanzania‘s poor showing include: failure to implement
pension fund reforms necessary to inject long-term liquidity into the economy, stalled land reform,
17 PRSL I (May-December 2005); PRSL II (June 2006 – December 2007) and PRSL III (November 2008 – August 2009).

7
Box 2: Major Regional Integration and Trade Affiliations
Tanzania is a member of the EAC, SADC, the Regional Integration Facilitation Forum (RIFF), and is granted non-reciprocal trade
preferences by the EC under the Cotonou Agreement and the Everything-but-Arms (EBA) initiative, the United States‘ AGOA, and
the GSP schemes of mainly Australia, Canada, EC, Japan, New Zealand and the United States. It has also participated in the
Agreement on the Global System of Trade Preferences among Developing Countries (GSTP) since 19 April 1989. Under the GSTP,
India and Turkey grant preferential access to Tanzania.
Tanzania is a former member of the Common Market for Eastern and Southern Africa (COMESA), from which it withdrew in 2000.
However, Kenya and Uganda remain members of both the COMESA and EAC, complicating the latter‘s drive towards a unified
market within COMESA. Starting in 2008, there are plans to merge 26 countries in eastern and southern Africa into a single trading
bloc under the COMESA-EAC-SADC tripartite arrangement, which will have a combined gross domestic product (GDP) of $625
billion.
lack of a national identity system18
, and inconsistencies in the application of laws and regulations.
Through selective interventions in infrastructure, governance and human development, the Bank is
well positioned to tackle some of these challenges.
Regional Integration and Trade
35. Tanzania is party to various regional integration and trade affiliations as summarized in Box
2 below. For close to two decades, it has implemented both external and domestic trade liberalization
programs. Measures taken under global trade liberalization include a lowering of applied and bound
tariffs rates, simplification of trade procedures and abolition of licensing as well as administrative
controls. Liberalizations on the domestic front include elimination of state controls, phasing-out
monopoly commodity marketing boards and state companies. Additional measures in this regard
include liberalization of foreign exchange market and attempts to open rural areas to markets through
infrastructure development. A national trade policy was also adopted in 2005, responding to and
building upon the various reforms above.19
36. Since 2006, Tanzania‘s exports of goods and services
have averaged 22 percent of GDP while imports have averaged
35 percent. Exports increased from $1.9 billion in 2006 to $3
billion in 2009, while imports rose from $3.9 billion in 2006 to
$5.9 billion for the same period.
37. The trade flows data in table2 depicts low volume
intra-regional trade within the EAC. These trade flows are
expected to increase following full operationalization of the
EAC Customs Union since January 2010. The Customs Union
has seen the removal of tariffs among member states,
application of a common external tariff and a move to an EAC
Common Market since July 2010. The move to a Common
Market implies freer trade, and freer movement of goods,
services, capital and people within the region. There is also a
substantial amount of informal trade with neighboring EAC
countries, mainly in food items, which is not fully captured by
official statistics
38. Going forward, Tanzania still faces challenges to integration and trade, particularly in the
areas of hard infrastructure (road transport, ports, energy, including the absence of power pools and
interconnections) as well as soft (financial markets, investment and business regulation and
procedures, customs/boarder post arrangements, policy harmonization). 20
All these areas are ripe for
the Bank‘s intervention in regional infrastructure development (transport, energy, ICT and shared
18
Measures are already underway to address this issue, and in April 2011, the Government formally contracted a Malaysian firm to implement the
National Identification Project. Production of national identity cards is expected to start this year. 19 Tanzania (2003), Trade Policy for a Competitive Economy and Export-led Growth. Dar es Salaam: Ministry of Industry and Trade. 20 See African Development Bank (2010), African Development Report: Logistics and Trade in Africa. Tunis: African Development Bank.
Table 2:
Trade Flow - Regional Shares of Exports
and Imports
2007 2008 2009
Regional Shares of Exports
Europe 36% 33% 30%
SADC 14% 15% 12%
EAC 8% 10% 9%
Africa 22% 29% 22%
America 2% 2% 2%
Asia 17% 20% 28%
Regional Shares of Imports
Europe 29% 27% 23%
SADC 14% 15% 13%
EAC 2% 3% 5%
Africa 17% 19% 19%
America 7% 6% 5%
Asia 40% 44% 43% Source: United Republic of Tanzania, 2010:
Economic Survey
8
water resources) and capacity building; as highlighted in the recent Regional Integration Strategy for
East Africa.
Social Inclusion and Equity
39. Poverty: Tanzania‘s ranking in UNDP‘s Human Development Index improved marginally
from 0.370 in 2005 to 0.398 in 2010. Still, poverty remains high; suggesting that despite impressive
macroeconomic achievements and sustained economic growth over the past decade, there has been
very little impact on the incomes and well-being of the poor. Available evidences point to the weak
redistributive aspect of growth, especially the weak linkages with rural areas where the majority of
the population lives. According to the 2007 Household Budget Survey (HBS), the basic needs
poverty ratio was 33.4 percent, representing only a modest decline from 35.6 percent in the 2000/01
HBS. Income inequality appears to have remained unchanged as reflected in the Gini Coefficients.21
Poverty remains predominantly rural (as high as 37.4% due largely to low agricultural growth caused
by drought, low rainfall and lack of and/or poor agriculture equipment and productivity). There are
also substantial numbers of poor people in urban/peri-urban areas. These developments suggest that
the MDG target of halving abject poverty by 2015 may not be achieved (Annex VIII & Annex IX).
40. Health: Inadequate facilities and acute shortage of skilled personnel pose challenges in the
health sector. Estimates from the 2009 Joint Health Sector Review suggest that only 35 percent of
the required skilled workforce is active in the rural areas. Nonetheless, the sector has recorded some
gains in recent years. The recent Tanzania Demographic and Health Survey (TDHS 2009/2010)
shows infant mortality rate declined from 58 deaths per 1,000 live births in 2007/08 to 51 in 2009/10.
Under-five mortality rate also declined from 91 deaths per 1,000 live births between 2007/8 and
2009/10 to 81 in 2009/10.22
Likewise, between 2007/8 and 2009/10, maternal mortality declined
significantly from 578 to 454 deaths per 100,000 live births. Based on the 2007/08 HIV and Malaria
Indicator Survey, HIV prevalence among the 15-49 age group declined from about 10 percent to 5.7
percent in late 1990s, with a higher incidence among women. Malaria prevalence in Zanzibar has
remained significantly low at 1 percent since 2007, down from over 40 percent before 2005.
41. Education: A quarter of adult Tanzanians have no education and 32.5 percent of women and
16.9 percent of men are illiterate.23
Following implementation of major sector reforms, there have
been significant improvements in the provision of basic education. Net primary school enrollment
increased from 59 percent in 2000 to 95.4 percent in 2010; secondary school net enrolment rate
reached 27.8 percent in 2009, up from 23.5 percent in 2007. However, the quality of education,
particularly in secondary schools, has declined markedly. The pass rate at the Form-IV level dropped
from 26.7 percent in 2008 to 11.5 percent in 2010—a development that points to, among other things,
decreasing performance and the urgency of addressing quality education delivery.24
Key constraints
specific to the sector include: teacher shortages, lack of teaching and learning materials, inadequate
facilities including science and language laboratories.
42. Labor Force and Employment: According to the 2006 Integrated Labor Force Survey (ILFS),
the size of the labor force is estimated to be in excess of 19 million; with an overall participation rate
of 89.6 percent. Unemployment is currently estimated at 4.3 percent and youth unemployment
(people aged 15-24) stood at 14.9 percent in 2006. The rate is estimated to be as high as 24 percent
amongst urban youth. Underemployment, although thought to be high, is not fully captured by
official statistics. Over 76 percent of the labor force is engaged in small-scale, mostly rain-fed,
subsistence agriculture. The lack of requisite skills is a constraint to private sector development. This
was confirmed during several Bank consultations with a cross-section of private sector employers.
21 The Gini coefficient of 0.35 in the 2007 HBS was virtually unchanged from the 2000/01 HBS, and in fact, was essentially the same as the 0.34 figure
in the 1991/92 HBS. 22 Tanzania HIV & Malaria Indicator Survey. 23 2005 Multi-Sector Country Gender Profile for Tanzania. 24 Currently, the main focus in education is to implement the major components of the Education Sector Development Program (ESDP), which are:
Primary Education Development Program Phase II (PEDP II 2007-2011); Secondary Education Development Program (SEDP-2004-2009); Teacher Development and Management Strategy (TDMS)-2007; Technical and Higher Education Sub Master Plan 2003-2018; and Preparation of the second
phase of SEDP.
9
Box 3: Bank Group Consultations on the Country Strategy Paper
In developing this Strategy, the Bank held wide-ranging consultations with the Government, various development partners, as
well as other non-state stakeholders from the private sector, academia and civil society. The discussions focused on the:
(i) country context and prospects; (ii) indicative project pipeline and its consistency with the proposed pillars as well as with
Government priorities; (iii) what other Partners plan to undertake in the period covered by the Strategy; and (iv) formulation of a
Results Framework for the Strategy, focusing on outcome and output indicators.
.
Rising levels of youth unemployment could have adverse implications for national development,
including a loss of their potential contribution to nation building, increased poverty and vulnerability,
and pose a potential threat to the social fabric and national security.
43. Gender: Unemployment is 5.8 percent amongst women compared to 2.8 percent amongst
men (ILFS, 2006); and the former constitute about 89 percent of the labor force. The HBS (2007)
estimates that average earnings for men is 1.7 times higher than women. Though gender parity in
primary school has been consistently good and parity has been attained at the national level, girls in
some regions face difficulties in completing the primary cycle. At the secondary level, proportion of
girls in government schools is still below 45 percent in Form One and below 35 percent in Form Six.
In 2010 Global Gender Gap Report, Tanzania had a Gender Development Index of 0.68 and was
ranked 66 out of 134 countries. This suggests a moderately high male/female gender disparity. To
address this disparity, Tanzania is a signatory to several international treaties including the
Convention on the Elimination of all forms of Discrimination against Women. A dedicated ministry
has also been established to provide leadership on gender equality and formulates gender sensitive
policies/Action Plans to advance women empowerment.
Environment and Climate Change
44. Tanzania faces various environmental challenges, many of which have significant bearing on
government policy choices. Human impacts on deforestation, soil erosion, overgrazing, and abuse of
water resources and loss of biodiversity have all contributed to significant land degradation. Poor
agricultural practices such as shifting cultivation, lack of crop rotation, inadequate agricultural
technology and land husbandry techniques further exacerbate the problem. Pollution is also a major
problem in urban areas, particularly with improper treatment and disposal of solid and liquid waste.
Most recently, there have been challenges in the management of mineral resources, particularly with
prospecting and mining practices and their environmental and social impacts.
45. With regard to climate change and its impact, a 2009 assessment revealed the following
environmental challenges: (a) steady increase in temperature for the past 30 years; (b) severe and
recurrent droughts in the past few years, with over 60 percent of land facing serious desertification;
(c) dramatic drop of water levels in all lakes (e.g., Lake Victoria dropped by 2.57 meters between
1965 and 2006); and (d) loss of about 80 percent of the glacier on Mount Kilimanjaro since 1912,
with projections of total glacier loss by 2025. The GoT, with the support of the Norwegian
government, is developing a national climate change adaptation and mitigation plan. A pilot program
was launched as part of that plan to reduce deforestation, develop methodologies for carbon
accounting, promote research and capacity building, as well as to promote Public Private
Partnerships to enhance investments in sustainable management of forest resources. The GoT also
launched a task force to help develop a National Strategy for Reducing Emissions from Deforestation
and Forest Degradation (REDD) and for enhancement of voluntary carbon market in Tanzania,
which presents an opportunity for Bank intervention in this agenda.
III. STRATEGIC OPTIONS
Country Strategic Framework
46. Tanzania‘s overall development framework and long-term social and economic development
goals are laid out in the National Vision 2025 and Zanzibar Vision 2020. The medium-term
objectives for Mainland Tanzania and Zanzibar are guided by the NSGRP II and ZSGRP II, both of
which make up the national development strategy approved at the end of 2010, and to be
implemented over the period 2010/2011 – 2014/2015.

10
47. The Mainland development strategy focuses on three broad clusters: (i) growth and reduction
of income poverty; (ii) improvement of quality of life and social well-being; and (iii) governance and
accountability. Similarly, Zanzibar‘s development strategy focuses on three clusters: (i) growth and
reduction of income poverty; (ii) improvement of social services and well-being; and (iii) good
governance and national unity. The strategies are fully linked with the MDGs, and encompass key
sectors and cross-cutting issues, including private sector development.
48. According to a Joint Staff Advisory Note (JSAN) published by the IMF and the World Bank
in January 2011, the ambitious projections underlying the new national development strategy (8.5%
growth annually) will require policy interventions on multiple fronts. Furthermore, whereas the
JSAN lauds the strategy‘s focus on agriculture and social sectors, particularly education quality, it
also points out that priority should be accorded to infrastructure projects, especially those most
pivotal for private sector-led growth. The JSAN also points to the need to accelerate implementation
of PFM and anti-corruption reforms.
Strengths and Opportunities
49. Geographic Location: Tanzania is the largest country in the EAC and a major import/export
gateway for two members: Burundi and Rwanda. It also has the potential to provide transport and
logistics services for its landlocked neighbors: Eastern Congo, Malawi, Uganda and Zambia. With
800 kilometers of coastline along the Indian Ocean and long historic linkages with the Middle East
and Asia, this vantage location could be better exploited to offer more efficient port services and
related transport logistics crucial for the movement of goods and deepening regional integration.
50. Natural Resources: Tanzania is endowed with rich natural resources, including: land, water
bodies, forest reserves, wildlife, exploitable hydrocarbons and minerals.25
Transforming these
resources through sustainable productive activities into higher value and exportable products could
enable the country to attain the national development strategy‘s vision of a stronger, more balanced,
broad-based and private sector-driven economy. For example, Tanzania controls 55 percent of Lake
Victoria, the largest fresh-water lake in Africa. The yearly fish quota for the Lake is 730,000 tons.
Yet, Tanzania lags behind Kenya in processed fish and fish exports.
51. Tourism: This sector offers various employment opportunities both directly (supporting over
200,000 jobs) and indirectly. In 2009, there were about 700,000 tourist arrivals, and total receipts
from tourism amounted to $1.3 billion in 2009. While tourism is significant in certain parts of the
country, overall there is still more room for growth. Earnings from the sector could be significantly
enhanced by strengthening regulatory and support policy framework, marketing of the sector‘s key
attractions, ensuring sustainable utilization of wildlife and other natural resources, and incentivizing
private investors to undertake infrastructure improvements.
52. Foreign Investment Destination: Tanzania has emerged as an attractive FDI destination partly
due to its political stability, its location with a vast hinterland, and its favorable investment laws—
though saddled with cumbersome implementation challenges. Recent years have seen sharp increases
in FDI, reaching US$ 744 million in 2008 and US$ 650 million in 2009; with most investments
going to the mining sector. FDI is expected to increase if the country enacts more comprehensive
regulatory reforms and addresses infrastructure bottlenecks. Likewise, harmonization of mainland
Tanzania and Zanzibar‘s foreign investment regimes would further boost the prospect.
Challenges and Weaknesses
53. High Level of Poverty and low human development: As discussed earlier (paragraph 39),
despite recent sound macroeconomic achievements, Tanzania remains poor, with growth occurring
in sectors with limited impact on the income levels of most citizens. The 2010 per capita income of
approximately $45326
is low and a large proportion of its 44 million people have limited access to
25 A 2011 Extractive Industries Transparency Initiative report has pointed out that while the country is endowed with rich mineral resources, there are substantial discrepancies between the Government‘s reported revenue from the sector and that reported by mining firms. 26
In U.S. dollars, at 2000 prices, using 2000 exchange rates

11
Chart 6:
Infrastructure Indicators 2009,
(Rank in World Countries)
Source: AfDB Statistics Dept. using data from the WEF,
2010
education, health and other basic services. Translating economic growth into increased poverty
reduction remains the foremost challenge.
54. Substantial Dependence on Aid: Approximately 30 percent of government spending depends
on foreign aid; making Tanzania one of the largest recipients of foreign aid in Sub-Saharan Africa.
This renders the country vulnerable to global economic shocks. Tanzania needs to rectify the
situation by, among other things, strengthening domestic resource mobilization instruments, reining-
in government expenditures and expanding economic activities in the private sector.
55. Infrastructure: The state of transport, energy, water and port facilities is still very poor and in
urgent need of Government action. The power sector is
characterized by exceptionally high demand in the face of
limited supply; even by the standards of other low income
African countries (Chart 6).27
Despite major investments in
the water sector from the 1970s to the 1990s, water supply
and sanitation services remain inadequate. The 2007 HBS
showed that from 2000 to 2007, access to safe water
declined by 10 percent in urban and 6 percent in rural
areas.28
Similarly, the Dar es Salaam port has serious
capacity constraints caused by high traffic growth and poor
backward linkages with inland transport networks, making
the port inefficient and causing a major bottleneck for the
national and regional economies. The poor condition of the
rail sub-sector has caused a shift of freight to road transport
which, in turn, has resulted in the deterioration of the
already crumbling bitumen network due to movement of
heavy goods vehicles. (See Annex XIII)
56. Governance: The public sector is characterized by weak financial controls and accountability,
which translate into significant resource leakages (see paragraphs 21-27). There is an urgent need for
improving internal controls within IFMIS, including better cash management in the control of funds
and rolling out of IFMIS to Local Government Authorities (LGAs). Likewise, budget management
needs to be better integrated in transparent and realistic medium-term expenditure and borrowing
plans and underpinned by vigorous oversight systems and structures. Particular challenges remain
with the public procurement system, especially with regard to the number and quality of procurement
practitioners at LGA level. Lastly, knowledge of the Public Procurement Act and its regulations
requires significant enhancement. This is particularly so, given Tanzania‘s decentralization trends
and Partner‘s growing commitment to use national procurement systems.
57. Agriculture: The agricultural sector presents particular challenges with direct linkages to
growth, poverty, and competitiveness (see paragraphs 8 and 39). In general, yields are low, while
productions costs are high and income remains meager. Various price and export controls in the
sector risk undermining market conditions and jeopardizing long-term sustainability. The new
National Development Strategy emphasizes improvement in technological inputs, rural infrastructure
and small holder financing (including through creation of an Agricultural Bank). There is, however,
a need to fully integrate such interventions into a commercial value chain, which is indispensible for
attracting large investments in the sector and realizing scale economies. This investment is crucial,
especially in transportation, processing and marketing of agricultural produce, a significant
proportion of which is currently wasted through post-harvest losses.
27 These challenges are mostly the result of a lack of investment over time, failure of privatization strategies, lack of diversification in energy sources,
governance issues, difficulties in access financing, and failure in timely implementation of projects. 28 The HBS was based on data from selected samples of the population and a full census will be carried out in 2012. It should be noted that in order to
address sector challenges, the GoT replaced its previous policy of free water provision and adopted instead a new National Water Policy in 2002, which
focused on cost recovery, sustainability, and integrated water resources management. The GoT has also developed a sector strategy and a regulatory framework for sustained delivery of water services. A Water Sector Development Program, which started in 2007 is now in its fourth year of
implementation, involving 280 Implementing Agencies and a funding envelope of $1,200 million over a five-year period.

12
58. Human Capital: At present, much of Tanzania‘s post-primary education system exhibits
severe quality deficiencies, with system expansion in recent years being an aggravating factor. Rapid
and chaotic expansion has left many public sector institutions severely under-funded. Meanwhile,
private for-profit education institutions are focused on short-term, market-driven demands that has
resulted in, among other things, a general lack of skills and marked skills mismatch.29
59. Private Sector Environment: Tanzania‘s private sector is constrained by several factors
including infrastructure bottlenecks, an underdeveloped financial sector and weak human and
institutional (particularly, regulatory) capacity. Further deregulation of the economy and reduction in
the cumbersome bureaucracy will significantly improve the enabling environment. This can be
achieved by creating catalytic and demonstration effects for entrepreneurs as highlighted in the
national development strategy.
60. Other Challenges: High population growth rate of 3 percent will adversely impact on the
country‘s development, especially in the areas of social outcomes, provision of services and sizeable
youth unemployment and underemployment. This rapidly expanding population, majority of which
is still in the informal sector, along with a high prevalence of HIV/AIDS will also negatively impact
the attainment of key MDGs. Unfettered urbanization due to the lack of an appropriate policy and
proliferation of informal settlements and poor housing construction further aggravates the situation.30
61. The Island of Zanzibar also has several unique issues. It has a very small economy ($589
million GDP); high poverty levels (about 40% living below basic needs poverty line) and weak
linkages between tourism (which is the lead sector) and other sectors of its economy. Logistical
difficulties due to distance between its main Islands – Unguja and Pemba and power problems
resulting from its continued dependence on the unreliable supply from the Mainland also pose unique
challenges. These constraints offer possibilities for effective Bank intervention.
Aid Coordination/Harmonization
62. Recent Developments: The Bank has made notable strides towards effectively harmonizing
its operations with the Paris Declaration and the Accra Agenda for Action. The Development
Partners Group (DPG) has been the main conduit through which the Bank and other Partners have
engaged with Government and other stakeholders to strengthen development cooperation.
63. Starting in 2006, aid management has been guided by the Joint Assistance Strategy (JAST),
which sought to operationalize international principles of aid effectiveness. The Bank‘s Cover Note
to the Board described its specific approach and programs, which were aligned to the pillars in the
national development strategy. The new aid strategy, which had its challenges (Annex XI), reflected
a re-orientation from traditional project financing towards basket funding and increased contributions
through GBS. It also required strong contribution by each partner to the policy dialogue on sector-
specific issues.
64. In the years since, there has been a shift towards GBS and more Partners alignment to sector-
funding baskets. A recently finalized new Partnership Framework Memorandum sets out the
partnership terms between GoT and Development Partners in respect to budget support. The
Memorandum outlines the underlying principles for a harmonized approach to aid coordination,
particularly at a time when several Partners, both in Tanzania and elsewhere, are re-evaluating
budget support as the preferred aid instrument.
65. The Bank is a member of the Development Partners Group and chaired the Poverty
Reduction and Budget Support donor group from April 2009 to April 2010. Under this framework,
there is a well-established structure for dialogue which consists of four clusters, 26 thematic working
29 In 2006, the Government introduced a ‗Vocational Education & Training Levy‘ payable at the end of every month, from every employer who has four or more employees. The uses as well as impact of the Levy remain unclear. 30 The urbanization challenge also has potential upsides as it signals an upward trend in urban land prices, construction activity, and greater
concentration of the labor force in urban areas (particularly among the middle class with increasing discretionary income). This could be good for the country‘s construction industry (both material manufacturers and builders, which would include SMEs). From a Bank operations perspective, it would
also open up opportunities in terms of housing and mortgage lending-sector financing.
13
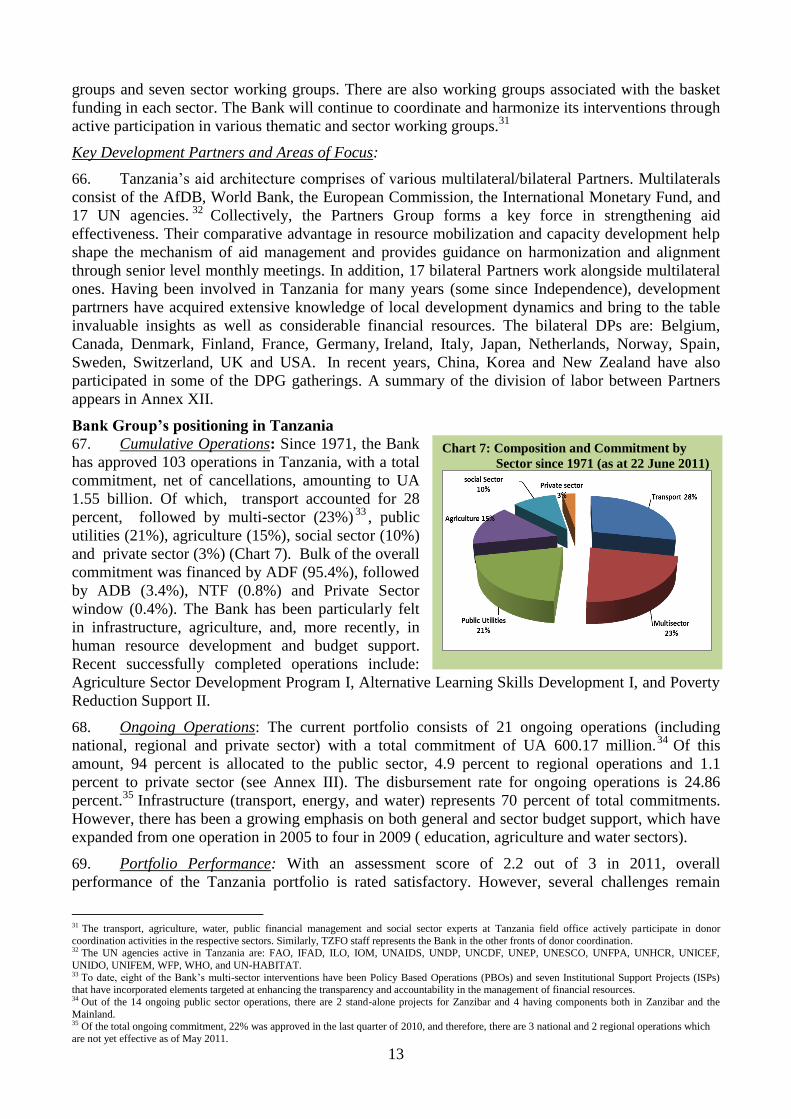
Chart 7: Composition and Commitment by
Sector since 1971 (as at 22 June 2011)
groups and seven sector working groups. There are also working groups associated with the basket
funding in each sector. The Bank will continue to coordinate and harmonize its interventions through
active participation in various thematic and sector working groups.31
Key Development Partners and Areas of Focus:
66. Tanzania‘s aid architecture comprises of various multilateral/bilateral Partners. Multilaterals
consist of the AfDB, World Bank, the European Commission, the International Monetary Fund, and
17 UN agencies.32
Collectively, the Partners Group forms a key force in strengthening aid
effectiveness. Their comparative advantage in resource mobilization and capacity development help
shape the mechanism of aid management and provides guidance on harmonization and alignment
through senior level monthly meetings. In addition, 17 bilateral Partners work alongside multilateral
ones. Having been involved in Tanzania for many years (some since Independence), development
partrners have acquired extensive knowledge of local development dynamics and bring to the table
invaluable insights as well as considerable financial resources. The bilateral DPs are: Belgium,
Canada, Denmark, Finland, France, Germany, Ireland, Italy, Japan, Netherlands, Norway, Spain,
Sweden, Switzerland, UK and USA. In recent years, China, Korea and New Zealand have also
participated in some of the DPG gatherings. A summary of the division of labor between Partners
appears in Annex XII.
Bank Group’s positioning in Tanzania
67. Cumulative Operations: Since 1971, the Bank
has approved 103 operations in Tanzania, with a total
commitment, net of cancellations, amounting to UA
1.55 billion. Of which, transport accounted for 28
percent, followed by multi-sector (23%)33
, public
utilities (21%), agriculture (15%), social sector (10%)
and private sector (3%) (Chart 7). Bulk of the overall
commitment was financed by ADF (95.4%), followed
by ADB (3.4%), NTF (0.8%) and Private Sector
window (0.4%). The Bank has been particularly felt
in infrastructure, agriculture, and, more recently, in
human resource development and budget support.
Recent successfully completed operations include:
Agriculture Sector Development Program I, Alternative Learning Skills Development I, and Poverty
Reduction Support II.
68. Ongoing Operations: The current portfolio consists of 21 ongoing operations (including
national, regional and private sector) with a total commitment of UA 600.17 million.34
Of this
amount, 94 percent is allocated to the public sector, 4.9 percent to regional operations and 1.1
percent to private sector (see Annex III). The disbursement rate for ongoing operations is 24.86
percent.35
Infrastructure (transport, energy, and water) represents 70 percent of total commitments.
However, there has been a growing emphasis on both general and sector budget support, which have
expanded from one operation in 2005 to four in 2009 ( education, agriculture and water sectors).
69. Portfolio Performance: With an assessment score of 2.2 out of 3 in 2011, overall
performance of the Tanzania portfolio is rated satisfactory. However, several challenges remain
31 The transport, agriculture, water, public financial management and social sector experts at Tanzania field office actively participate in donor
coordination activities in the respective sectors. Similarly, TZFO staff represents the Bank in the other fronts of donor coordination. 32 The UN agencies active in Tanzania are: FAO, IFAD, ILO, IOM, UNAIDS, UNDP, UNCDF, UNEP, UNESCO, UNFPA, UNHCR, UNICEF,
UNIDO, UNIFEM, WFP, WHO, and UN-HABITAT. 33 To date, eight of the Bank‘s multi-sector interventions have been Policy Based Operations (PBOs) and seven Institutional Support Projects (ISPs) that have incorporated elements targeted at enhancing the transparency and accountability in the management of financial resources. 34 Out of the 14 ongoing public sector operations, there are 2 stand-alone projects for Zanzibar and 4 having components both in Zanzibar and the
Mainland. 35 Of the total ongoing commitment, 22% was approved in the last quarter of 2010, and therefore, there are 3 national and 2 regional operations which
are not yet effective as of May 2011.
14
including: (i) limited understanding of Bank rules and procedures; (ii) low financial management
capacity at local government levels; (iii) low and inadequate staffing of implementing agencies; (iv)
delays in fulfillment of loan and grant conditions and project start-up activities; and (v) persistent
procurement problems. Typically, projects experience protracted delays during the bid evaluation
and contract award stages.36
More accurate and elaborate planning of procurement activities, timely
approval of documents by the Ministerial Tender Board and the Bank, and capacity building of
procurement specialists in the implementing agencies should substantially improve procurement
performance.37
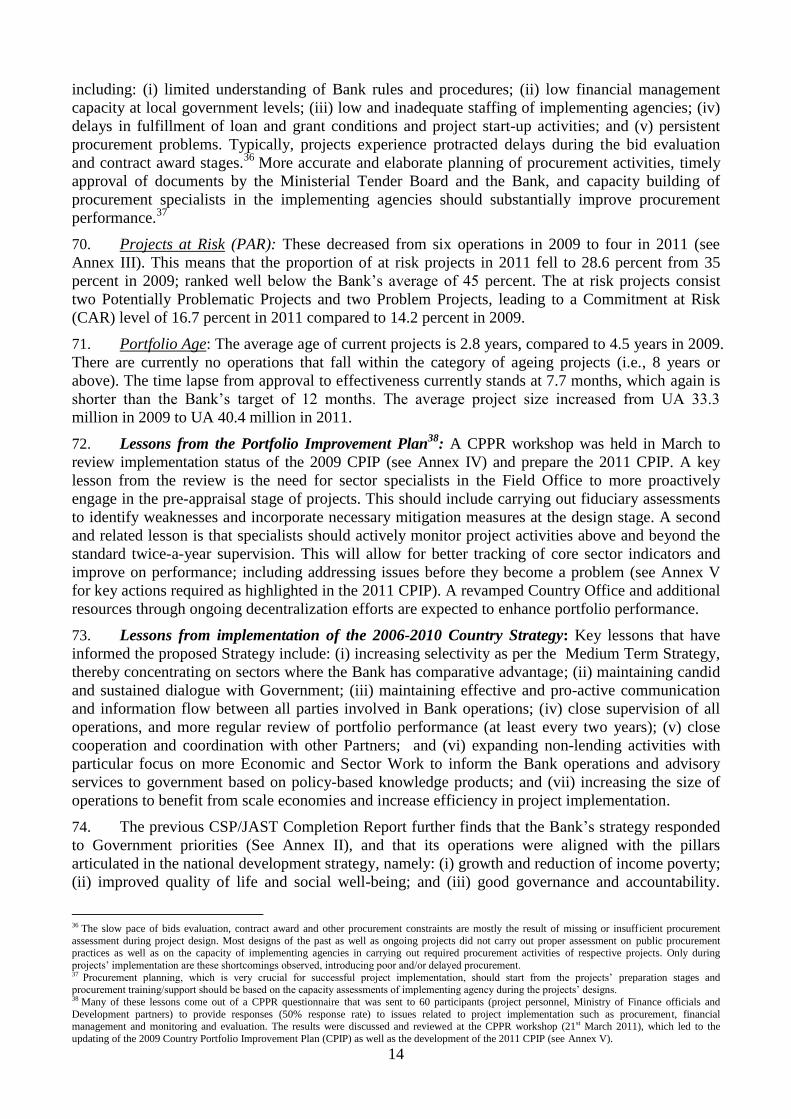
70. Projects at Risk (PAR): These decreased from six operations in 2009 to four in 2011 (see
Annex III). This means that the proportion of at risk projects in 2011 fell to 28.6 percent from 35
percent in 2009; ranked well below the Bank‘s average of 45 percent. The at risk projects consist
two Potentially Problematic Projects and two Problem Projects, leading to a Commitment at Risk
(CAR) level of 16.7 percent in 2011 compared to 14.2 percent in 2009.
71. Portfolio Age: The average age of current projects is 2.8 years, compared to 4.5 years in 2009.
There are currently no operations that fall within the category of ageing projects (i.e., 8 years or
above). The time lapse from approval to effectiveness currently stands at 7.7 months, which again is
shorter than the Bank‘s target of 12 months. The average project size increased from UA 33.3
million in 2009 to UA 40.4 million in 2011.
72. Lessons from the Portfolio Improvement Plan38
: A CPPR workshop was held in March to
review implementation status of the 2009 CPIP (see Annex IV) and prepare the 2011 CPIP. A key
lesson from the review is the need for sector specialists in the Field Office to more proactively
engage in the pre-appraisal stage of projects. This should include carrying out fiduciary assessments
to identify weaknesses and incorporate necessary mitigation measures at the design stage. A second
and related lesson is that specialists should actively monitor project activities above and beyond the
standard twice-a-year supervision. This will allow for better tracking of core sector indicators and
improve on performance; including addressing issues before they become a problem (see Annex V
for key actions required as highlighted in the 2011 CPIP). A revamped Country Office and additional
resources through ongoing decentralization efforts are expected to enhance portfolio performance.
73. Lessons from implementation of the 2006-2010 Country Strategy: Key lessons that have
informed the proposed Strategy include: (i) increasing selectivity as per the Medium Term Strategy,
thereby concentrating on sectors where the Bank has comparative advantage; (ii) maintaining candid
and sustained dialogue with Government; (iii) maintaining effective and pro-active communication
and information flow between all parties involved in Bank operations; (iv) close supervision of all
operations, and more regular review of portfolio performance (at least every two years); (v) close
cooperation and coordination with other Partners; and (vi) expanding non-lending activities with
particular focus on more Economic and Sector Work to inform the Bank operations and advisory
services to government based on policy-based knowledge products; and (vii) increasing the size of
operations to benefit from scale economies and increase efficiency in project implementation.
74. The previous CSP/JAST Completion Report further finds that the Bank‘s strategy responded
to Government priorities (See Annex II), and that its operations were aligned with the pillars
articulated in the national development strategy, namely: (i) growth and reduction of income poverty;
(ii) improved quality of life and social well-being; and (iii) good governance and accountability.
36 The slow pace of bids evaluation, contract award and other procurement constraints are mostly the result of missing or insufficient procurement
assessment during project design. Most designs of the past as well as ongoing projects did not carry out proper assessment on public procurement practices as well as on the capacity of implementing agencies in carrying out required procurement activities of respective projects. Only during
projects‘ implementation are these shortcomings observed, introducing poor and/or delayed procurement. 37 Procurement planning, which is very crucial for successful project implementation, should start from the projects‘ preparation stages and procurement training/support should be based on the capacity assessments of implementing agency during the projects‘ designs. 38 Many of these lessons come out of a CPPR questionnaire that was sent to 60 participants (project personnel, Ministry of Finance officials and
Development partners) to provide responses (50% response rate) to issues related to project implementation such as procurement, financial management and monitoring and evaluation. The results were discussed and reviewed at the CPPR workshop (21st March 2011), which led to the
updating of the 2009 Country Portfolio Improvement Plan (CPIP) as well as the development of the 2011 CPIP (see Annex V).

15
Chart 8: Pillars for Bank Support
Bank Group support focused mainly on the first two pillars, but recognizing the importance of
governance and accountability, it remained active in the third pillar through the Institutional Support
for Good Governance project. The Bank‘s multi-sector operations contributed to macroeconomic
stability, while in the agriculture and microfinance sectors, the contribution was mainly through the
development of marketing systems and access to finance, respectively. Tanzania‘s notable progress
in the social sector also benefited from Bank interventions, mainly targeted at improving service
provision through infrastructure development (construction of class rooms and health facilities).
75. Concerning aid modalities, the Bank made significant progress on harmonization as
demonstrated by the increase in GBS and SBS operations. Additional areas of Bank improvement in
donor harmonization include doing away with separate Project Completion Reports (PCRs) from
implementing agencies and the use of parallel monitoring indicators.
IV. BANK GROUP STRATEGY
Rationale for Bank Group Intervention
76. Tanzania has recorded robust macroeconomic performance over the last two decades. To be
translated into tangible and lasting benefits for the majority of Tanzanians, growth must be
sustainable and more inclusive. The Bank Strategy is consistent with and aligned to the national
development strategies (NSGRP and ZSGRP) and their renewed emphasis on pro-poor growth and
targeting communities that have failed to achieve its benefit. Improved quality of life, good
governance and accountability and private sector development—all key areas of Bank intervention,
are also emphasized in the strategies. Based on its comparative advantage and informed by lessons
drawn from past experiences, the Bank‘s planned interventions will be underpinned by analytic and
diagnostic knowledge products. Interventions will aim to build on successes achieved and support
Government address the challenges identified (see paragraph 53-61).
Pillars for Bank Group Support
77. The Bank Group‘s support under this Strategy is anchored in the selectivity principle and
rests on a single overarching theme of supporting Tanzania towards greater competitiveness and
more inclusive growth. The Strategy also aims to support the country benefit more from regional
integration and trade.
78. The choice of the Strategy‘s two pillars —
infrastructure development and building an enabling
institutional and business environment — derives from
the guiding principles discussed above (see Chart 8).
The pillars highlight the Bank‘s comparative advantage,
particularly in infrastructure and governance, and draw
from the: (i) thrust of the national development
strategy; (ii) SWOT analysis of the country situation;
(iii) operational focus of the Bank Group‘s Medium Term Strategy 2008-2012; 39 (iv) lessons learned
from the Bank‘s previous engagement in Tanzania; (v) need to complement assistance from other
Partners; (vi) various Economic and Sector work (ESW)40; and (vii) Bank Group‘s efforts to enhance
integration in the region as articulated in the East Africa RISP. A brief elaboration on planned Bank
support under the two pillars follows:
Pillar 1: Infrastructure Development
79. The national development strategy observes that extensive and efficient infrastructure (power,
ports, roads, rail, air transport, water supply and sanitation, irrigation, ICT) is critical to ensure the
effective functioning of Tanzania‘s economy. It is in this context that the Bank aims to strongly
39 It is recognized that the CSP covers a longer term than the Medium Term Strategy but the sectoral areas of focus that are identified are expected to
continue being relevant in coming years. 40 These include a Regional Integration Strategy Paper (RISP) as well as a study on domestic resource mobilization by OREA, various country chapters of the issues of the African Economic Outlook led by EDRE, a Country Statistical Profile for Tanzania by ESTA, as well as several sectoral strategy
papers by various Bank Sector Operations departments.

16
focus on infrastructure as an enabling sector of the economy. Hence, a sizeable share of the Bank‘s
new commitments will be directed to infrastructure investments; aimed primarily at reducing travel
time between regions, integrating the national market and connecting it to other markets in the EAC.
This, in turn, will positively impact on national competitiveness, growth and regional integration.
Pillar 2: Building an Enabling Institutional and Business Environment
80. Fiduciary Environment Development. Efficient public operations underpinned by accepted
norms and practices are crucial for growth and competitiveness. Undue bureaucracy and
overregulation, fraudulent procurement practices and waste in the management of public resources
all impose significant economic costs on private economic actors; resulting in slow growth and
development. Moreover, proper management of public finances is critical to ensuring trust in the
national business environment. The Bank will direct a portion of its new commitments to reform-
focused GBS programs. Specifically, Bank support will focus on working with other Partners to
address upstream governance and accountability challenges. Building on the gains to date from
earlier and ongoing reforms, new interventions will focus on strengthening PFM systems designed to
prevent and detect corruption and waste before they occur.41
Additionally, interventions will focus
on supporting financial sector reforms and effective operationalization of key reforms, including the
Public Procurement Act.
81. Human Resource Development. Supporting Tanzania become more competitive requires,
inter alia, producing high quality human resources to meet current and future labor market needs and
promoting self-employment through creation of enterprises. It also calls for creating a cadre of young
people skilled enough to take advantage of labor mobility and job opportunities in the sub-region.
The Bank investment in human capital development with a view to improving the business
environment and enhancing competitiveness. Working in conjunction with other Partners, the Bank
will direct a portion of new commitments to support vocational training aimed at upgrading youth
technical skills, promoting entrepreneurship and improving the quality of education; especially at
vocational level. Among other things, such interventions will help mitigate social discontent and
other risks associated with large numbers of unemployed and underemployed youth, including fall-
outs from income inequality.
Deliverables and Targets
82. In line with the two strategic pillars, an indicative work program is described below. The
program takes into account the full ADF XII cycle (2011-2013) and the first two years of the ADF
XIII cycle (2014-2015). The allocation for ADF XII is UA 396.7 million; slightly down from the UA
407 allocation under ADF XI.42
However, it is expected that additional resources could be mobilized
from other sources, including the private sector and regional operations and non-Bank sources.
83. The work program below combines both lending and non-lending activities and would be
reviewed periodically (mid-term review and annual updates, as necessary) to assess changing
conditions and GoT priorities. The planned Bank deliverables take note of the country‘s special
status of one country with two systems: Government of the United Republic of Tanzania and
Government of Zanzibar.
Lending Operations
84. The Bank will deliver its assistance through various modes including stand-alone investment
projects, general and sector budget support, regional operations, and where appropriate, non-
sovereign private sector interventions or sovereign transactions with a private sector development
41 Based on PCRs from previous operations, the two most recent CPPRs, the recently-completed independent evaluation of the Bank‘s interventions
during 2006-2010, and several independent evaluations of GBS by various DPs, a lot has been learned about the size, the timing, and the design of the Bank‘s past GBS interventions. These lessons will inform the Bank‘s GBS support under this Strategy. 42 It should be noted that the allocation decrease was unrelated to the Country Policy and Institutional Assessment (CPIA). In fact, Tanzania‘s CPIA
ratings have been improving in recent years (See Annex X). Overall CPIA rating improved from 3.93 in 2005 to 4.07 in 2007. The particular segments of CPIA which registered improvements were: macroeconomic management (from 4.5 in 2005 to 5.0 in 2007); and quality of public administration
(from 3.5 in 2005 to 4.0 in 2007).
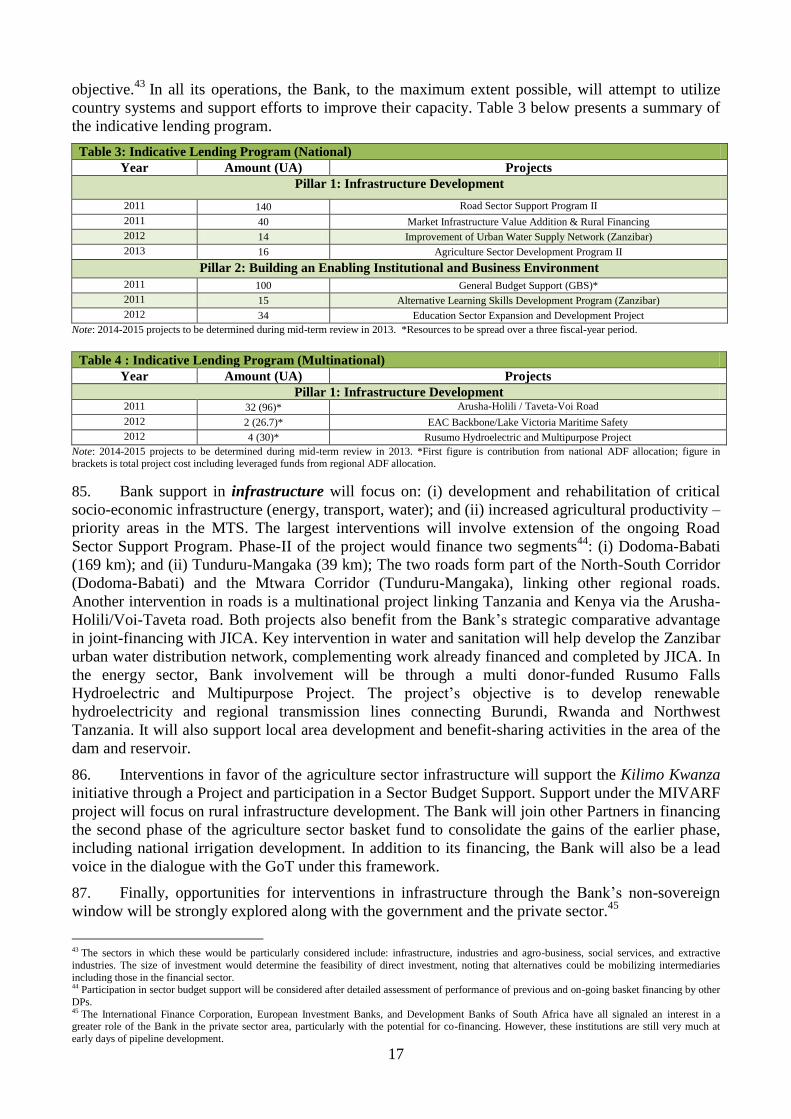
17
objective.43
In all its operations, the Bank, to the maximum extent possible, will attempt to utilize
country systems and support efforts to improve their capacity. Table 3 below presents a summary of
the indicative lending program.
Table 3: Indicative Lending Program (National)
Year Amount (UA) Projects
Pillar 1: Infrastructure Development
2011 140 Road Sector Support Program II
2011 40 Market Infrastructure Value Addition & Rural Financing
2012 14 Improvement of Urban Water Supply Network (Zanzibar)
2013 16 Agriculture Sector Development Program II
Pillar 2: Building an Enabling Institutional and Business Environment
2011 100 General Budget Support (GBS)*
2011 15 Alternative Learning Skills Development Program (Zanzibar)
2012 34 Education Sector Expansion and Development Project
Note: 2014-2015 projects to be determined during mid-term review in 2013. *Resources to be spread over a three fiscal-year period.
Table 4 : Indicative Lending Program (Multinational)
Year Amount (UA) Projects
Pillar 1: Infrastructure Development 2011 32 (96)* Arusha-Holili / Taveta-Voi Road
2012 2 (26.7)* EAC Backbone/Lake Victoria Maritime Safety
2012 4 (30)* Rusumo Hydroelectric and Multipurpose Project
Note: 2014-2015 projects to be determined during mid-term review in 2013. *First figure is contribution from national ADF allocation; figure in brackets is total project cost including leveraged funds from regional ADF allocation.
85. Bank support in infrastructure will focus on: (i) development and rehabilitation of critical
socio-economic infrastructure (energy, transport, water); and (ii) increased agricultural productivity –
priority areas in the MTS. The largest interventions will involve extension of the ongoing Road
Sector Support Program. Phase-II of the project would finance two segments44
: (i) Dodoma-Babati
(169 km); and (ii) Tunduru-Mangaka (39 km); The two roads form part of the North-South Corridor
(Dodoma-Babati) and the Mtwara Corridor (Tunduru-Mangaka), linking other regional roads.
Another intervention in roads is a multinational project linking Tanzania and Kenya via the Arusha-
Holili/Voi-Taveta road. Both projects also benefit from the Bank‘s strategic comparative advantage
in joint-financing with JICA. Key intervention in water and sanitation will help develop the Zanzibar
urban water distribution network, complementing work already financed and completed by JICA. In
the energy sector, Bank involvement will be through a multi donor-funded Rusumo Falls
Hydroelectric and Multipurpose Project. The project‘s objective is to develop renewable
hydroelectricity and regional transmission lines connecting Burundi, Rwanda and Northwest
Tanzania. It will also support local area development and benefit-sharing activities in the area of the
dam and reservoir.
86. Interventions in favor of the agriculture sector infrastructure will support the Kilimo Kwanza
initiative through a Project and participation in a Sector Budget Support. Support under the MIVARF
project will focus on rural infrastructure development. The Bank will join other Partners in financing
the second phase of the agriculture sector basket fund to consolidate the gains of the earlier phase,
including national irrigation development. In addition to its financing, the Bank will also be a lead
voice in the dialogue with the GoT under this framework.
87. Finally, opportunities for interventions in infrastructure through the Bank‘s non-sovereign
window will be strongly explored along with the government and the private sector.45
43 The sectors in which these would be particularly considered include: infrastructure, industries and agro-business, social services, and extractive
industries. The size of investment would determine the feasibility of direct investment, noting that alternatives could be mobilizing intermediaries
including those in the financial sector. 44 Participation in sector budget support will be considered after detailed assessment of performance of previous and on-going basket financing by other
DPs. 45 The International Finance Corporation, European Investment Banks, and Development Banks of South Africa have all signaled an interest in a greater role of the Bank in the private sector area, particularly with the potential for co-financing. However, these institutions are still very much at
early days of pipeline development.

18
88. Bank support to the enabling environment will reflect the two components of this pillar. In
supporting development of a robust fiduciary environment, Bank intervention will be channeled
through a budget support operation, focusing on strategic policy reforms on both the enabling
environment and economic and financial governance. The intervention will also focus on reducing
economic costs on private economic actors due to excessive bureaucracy, overregulation, inefficient
public procurement practices, as well as corruption and waste in the management of public
finances. The operation will be aligned with the national development strategy and draw lessons
from earlier budget support operations.46
This approach will enable the Bank to contribute to the
overall resource envelope for implementing Tanzania‘s national development strategy, and also
create space to leverage policy dialogue in key reform areas.
89. Lastly, in the area of human resource development, Bank‘s focus will be on skills
development and entrepreneurship promotion; areas deemed essential for a thriving private sector
and overall competitiveness. In this respect, Bank‘s interventions will support second phase of the
Alternative Learning and Skills Development Project implemented in Zanzibar, building on the
success of the pilot phase, completed in 2010. Bank support will also be provided to a potentially
transformative Education Sector Expansion and Development Project, focusing on delivering need-
based skills. One aspect of the project will be a second phase of the Bank‘s support towards
expanding and improving vocational education and technical training. Other aspects will include: (i)
construction, rehabilitation and equipping of science and language laboratories, complementing work
financed by the World Bank; and (ii) strengthening ICT in teaching and learning as part of the
Government‘s ‗Tanzania Beyond Tomorrow‘ program. The support in human resource development
will take into consideration previous and ongoing interventions through the education sector basket
as well as free-standing projects for the period 2011 – 2015.
Non-Lending Operations
90. In addition to its lending activities, the Bank will assist Tanzania during this Strategy period
through focused investments in non-lending activities, such as Economic and Sector Work (ESW).
Such interventions will marshal contributions from various departments and units within the Bank
and implementation will be in full collaboration with other Partners. These undertakings which will
provide the analytical underpinning for the next lending cycle, facilitate high-level policy dialogue
and advisory services and inform future operations listed below.47
Note: 2014-2015 projects, including, non-sovereign operation, to be determined during mid-term review in 2013. *Yet to be finalized; # Carried out every five years, last survey conducted in 2006.
Monitoring and Evaluation
91. One of the lessons derived from the previous Bank strategy is the need to strengthen the
Bank‘s M&E framework in order to generate requisite data and information. The results-based
framework to be used jointly by the GoT and the Bank in monitoring the outcomes of this CSP is
46
See, in this regard, PM, Oxford Policy Management, Mokoro and Center for the Study of the Economies of Africa (2011), ―Evaluation of Policy
Based Operations in the African Development Bank, 1999-2009. Country Case Study: Tanzania‖. Tunis: Operations Evaluation Department, AfDB. 47 Although not indicated in Table 3, there is also the potential for interventions on the institutional development and regulatory reform for PPPs
following ongoing discussions with the Government. This may involve some diagnostic activities upfront, but should also lead to substantial non-lending work to be driven through collaboration between OSGE, sector departments and OPSM. Likewise, discussions are still underway on non-
lending support on the transition towards Basel II and III at both national and regional (EAC)) levels.
Table 5: Indicative Non- Lending Program*
2011 - Country Fiduciary Risk Assessment [led by DFID in partnership with other DPs including the AfDB].
- Tanzania Transport Sector Review
- Tanzania chapter in the Africa Governance Outlook
- Tanzania chapter in the African Economic Outlook (each year)
2012 - Tanzania Energy Sector Review
- Study on Tanzania‘s ports, logistics and trade
- Participating in the Integrated Labor Force Survey. [led by ILO in partnership with other DPs including the AfDB]#
2013 - Study on deepening and broadening Tanzania‘s financial sector
-- Report on the Observance of Standards and Codes, Accounting &Auditing [in partnership with others]
2014-2015 Note: To Be Determined during Mid Term Review in 2013
19
shown in Annex I. Using the national development strategy as a departure point, it focuses on the
outcomes that can be influenced by Bank-financed interventions during the Strategy period. The
Bank‘s main objectives and priority areas are covered under each component of its unified pillar of
support. As indicated, the existing stock of projects in the current portfolio will account for a
significant share of outcomes during this Strategy period.
92. Additionally, the Bank‘s results matrix builds on the joint Poverty Reduction Budget Support
Performance Assessment Framework (PAF). The latter instrument, a subset of the wider monitoring
framework, is jointly revised annually by the GoT and Partners. The PAF helps in the monitoring
and reporting on specific results directly linked to poverty reduction, in areas such as water and
sanitation, agriculture, health, education and progress on PFM reforms. The log frame therein will be
used in tracking progress and results achieved in implementing activities covered under the pillars.
93. Lastly, the Bank will conduct country portfolio reviews (preferably with other Partners) every
year to track progress towards attainment of the development objectives herein. A mid-term review
will also be undertaken during the fourth quarter of 2013 to assess progress towards the Strategy‘s
outcomes. A completion report will be prepared in early 2016.
Country Dialogue Issues
94. Portfolio Performance: It is critical to ensure that ongoing project resources are effectively
utilized to ensure that benefits are delivered on a timely basis. The Bank will undertake regular
monitoring of its operations through periodic supervisions and reviews of its portfolio. It would
accelerate dialogue aimed at encouraging GoT authorities to put in place mechanisms to ensure
quality at entry and managing for results of the Bank-financed projects.
95. Fiduciary Environment: High-level dialogue will continue around the key issues of policy
reforms in favor of good financial governance and reduced resource leakages. Encouraging
Government to sustain ongoing reforms to improve systems of financial control, procurement,
transparency and accountability. Complementarity through this program is expected with the Bank‘s
ongoing support to the Extractive Industries Transparency Initiative (EITI) that encourages more
accountability in revenue management within the extractive sector, particularly through deeper
involvement of civil society and the media.
96. Private Sector Development: Dialogue with the Government and other stakeholders on
private sector development, including its contribution and impact on Tanzania‘s growth will be
strengthened. The dialogue will also focus on leveraging non-sovereign investments as well as the
regulatory issues that underpin such investments. Such dialogue will enable the Bank to be catalytic
and allow it to leverage its position to achieve system-wide changes and crowd-in private sector
investment beyond the immediate project or Bank financed institutions. 48
97. Regional Integration: Prerequisites for successful integration will be a key focus of dialogue,
including balancing national and regional commitments and priorities; harmonization of policies,
regulations and standards (including timely implementation of legislation to comply with EAC
Common Market); and monitoring and evaluation mechanisms of regional operations. Dialogue will
also address the need to reassure various stakeholders about perceived downsides of regional
integration (especially, stiffer competition in the short and medium term).
48 There is substantial scope for ONEC, OITC, OWAS, in collaboration with OPSM and OSGE to lead on high level policy dialogue for more effective sector performance (beyond individual projects). Such dialogue would need to be underpinned by substantial diagnostic work, but also potentially
presents opportunities to consider including performance triggers in the planned general budget support operations.
20
98. Other Issues: Bank dialogue with the GoT and other stakeholders will also focus on other
emerging issues including: (i) social inclusion and inequality; and (ii) statistical capacity.49
Potential Risks and Mitigation Measures
99. Increasing Fiscal Challenges: Continued difficulties in meeting revenue collection targets,
declining GBS as well as external shocks arising from rising commodity prices pose significant fiscal
uncertainties. Whereas the GoT is exerting considerable efforts to improve revenue collection,
Partners tend to reduce their supports—a trend likely to persist in the medium term. This could
substantially affect project implementation, particularly where government co-financing is required.
As a mitigation measure, the Bank will work with Government to address such challenges up-stream
in the process. Moreover, the Bank will continue efforts to further coordinate its strategy with other
Partners. Consideration will also be given to developing enhanced interventions targeted in key
reform areas (i.e. institutional and governance reforms).
100. Lagging Reforms: Given its record of stalled and at times, failed reforms, further delays in
Government reforms may register insufficient progress, including in core institutional and
governance reforms. Substantial risk could arise in the continued erosion of the country‘s credibility
and reputation as a preferred investment destination. Mitigation measures would primarily revolve
around enhanced high-level policy dialogue with the Government, particularly through the GBS
Partners groups. Steps could also be taken to boost public awareness and popular support, including
strengthening the demand-side for reform.
101. It is recognized that risk management is a dynamic process and new risks may emerge or the
risks identified may evolve, becoming more or less acute, over the Strategy period. Towards this end,
the Bank will liaise closely with Government and other Partners to monitor major risks in the horizon
and work together to identify pragmatic mitigation strategies.
V. CONCLUSION AND RECOMMENDATION
102. In the last decade, much has been achieved in restructuring, stabilizing and growing the
Tanzanian economy. However, despite its encouraging growth trajectory, many challenges remain
before attaining the middle-income status aspiration contained in the Tanzania Vision 2025 and
Zanzibar 2020.
103. The Bank‘s 2011-2015 Strategy to assist Tanzania comes at an opportune time with: (i) the
launch of a new five-year national development strategy; (ii) integration of lessons learned from the
previous strategy; (iii) improved prospects from continued robust growth projected in the medium
term; and (iv) finalization by several Partners of their country business plans and strategies.
104. The Country Strategy has two pillars based on the overarching aim of supporting Tanzania in
its quest for a more competitive economy and achieve inclusive growth. These are key priorities for
both the GoT and Partners including the Bank. It also provides a suitable framework for
transformative interventions. The Government is in full agreement with the Bank‘s overall
assessment and the proposed strategic focus, both of which will be anchored into knowledge and
capacity building processes.
105. The Boards of Directors are invited to consider and approve the proposed Tanzania Country
Strategy Paper for 2011–2015.
49 Dialogue will complement the recently completed, Country Statistical Profile (CStP) for Tanzania by ESTA, which responded to Bank Group Deputies‘ directives that results measurement should be at the core of ADF Agenda. The Bank‘s senior management now requires the allocation of at
least 2% of the value of each project/program (subject to a ceiling) for a component on M&E and statistical capacity development. Dialogue will focus
on potential areas of Bank assistance in coordination with other DPs and stakeholders. Under the Bank‘s Multinational Statistical Capacity Building (SCB) program, 2009-2011, $580 000 has been allocated to Tanzania to contribute to strengthening the country‘s capacity in economic and social
statistics. These include consolidating the progress under International Comparison Program (ICP)-Africa including transition from System of National
Accounts (SNA) 1993 to SNA 2008; price statistics focusing on harmonization of the ICP and Consumer Price Index (CPI) survey methodology, estimating the 2006 and 2009 Purchasing Power Parities (PPPs) and development of an ICP-Africa database; monitoring MDGs; and, the preparation of
Tanzania‘s Statistical Master Plan (TSMP).

Annex I: Tanzania’s 2011-2015 CSP Results Monitoring Matrix
Country’s Sector
Development Goals
Constraints hindering
achievement of desired
outcomes
Final Outcomes
(by 2015)
Final Outputs
(by 2015)
Mid-Term
Outcomes
(by 2013)
Mid-Term
Outputs
(by 2013)
Bank Group Interventions
during CSP period (ongoing &
proposed) PILLAR I: INFRASTRUCTURE DEVELOPMENT
TRANSPORT
Improved transport
system that links centers
of economic activity,
enhance socio-economic
development, poverty
reduction and regional
integration
Inadequate level of
periodic and routine
maintenance.
Poor condition of feeder
road network
Level of road user
charging below the needs
of the road network.
Reduction of travel time
from 5hrs to 2hrs between
Dodoma and Babati, and
from 4hrs to 1.5hrs between
Tunduru and Mangaka
490km of gravel roads
upgraded to bitumen
surface standard.
Increase in paved road
density from 6.86km
/1,000km2 in 2011 to
7.25km/ 1,000km2 in
2015.
Increase in paved national
trunk roads from 18.8% in
2011 to 21% in 2015.
Completed transport
sector review study
265km of gravel
roads upgraded to
bitumen surface
standard.
Increase in paved
road density from
6.51km /1,000km2
in 2011 to 70km/
1,000km2 in 2013.
Increase in paved
national roads from
18.8% in 2011 to
19.9% in 2015.
Proposed:
- Road Sector Support Project II :
(i) Dodoma-Babati; and (ii)
Tunduru-Mangaka
- Multinational: Arusha-
Holili/Taveta-Voi Road
- Transport sector review study
Ongoing:
- Zanzibar Roads Upgrading
Project
- Singida-Babati-Minjingu Road
Project
Road Sector Support Project I
- Multinational: Arusha-Namanga-
Athi River Development Project
AGRICULTURAL
To enhance rural incomes
and food security on a
sustainable basis
Limited access to
agricultural services
(research, extension,
inputs, credits, etc.)
Inadequate marketing
infrastructure including
markets, warehouses,
storage facilities
(including cold storage)
Poor feeder road network
Lack of postharvest
management skills by
farmers
Productivity increase of
20% for major crops
An increase in farm gate
prices of 20% for major
crops
Reduction in post-harvest
losses from 22– 14%
for maize and 13– 9% for
rice
Provision of agricultural
services increased by 50%
from current levels
70 (36 markets-25 with
cold-storage; 2 ice plants;
32 warehouses)
market/storage facilities
constructed/ rehabilitated
1550 km of feeder roads
upgraded
16 post-harvest training
centers rehabilitated /
resourced
Productivity increase
of 10% for major
crops
An increase of 10% of
farm gate prices for
major crops
Reduction in post-
harvest losses from
22– 18%
for maize and 13–
11% for rice
Provision of
agricultural services
increased by 20%
from current levels
30 (market/storage)
facilities constructed/
rehabilitated
600 km of feeder
roads upgraded
8 post-harvest
training centers
rehabilitated /
resourced
Proposed:
Market Infrastructure, Value
Addition and Rural Finance
Program (MIVARFP)
Agriculture Sector Development
Program II (ASDP II)
Ongoing:
- District Agricultural Sector
Investment Project (DASIP)
- Agriculture Sector
Development Program I (ASDP
I)
WATER SUPPLY AND SANITATION
Improve access to
reliable water and
sanitation facilities in
both rural and urban
areas
Limited resources to meet
development targets
Implementation capacity
constraints, particularly at
sub-national level.
Increase in the proportion of
households with access to
reliable water supply:
(a) Mainland:
- In rural areas to 65%
600 RWSS village water
projects implemented.
70 km of water
distribution network in
Unguja urban (Zanzibar)
Increase in proportion
of households with
access to reliable water
supply:
(a) Mainland:
- In rural areas to
300 RWSS village
water projects
implemented.
35 km of the water
distribution network
Proposed:
- Rehabilitation and extension of
Unguja urban (Zanzibar) water
distribution network
Ongoing and approved:

Country’s Sector
Development Goals
Constraints hindering
achievement of desired
outcomes
Final Outcomes
(by 2015)
Final Outputs
(by 2015)
Mid-Term
Outcomes
(by 2013)
Mid-Term
Outputs
(by 2013)
Bank Group Interventions
during CSP period (ongoing &
proposed)
Underinvestment and
weaknesses in water
resources management,
including vulnerability to
climate change.
Inadequate sustainability
of completed facilities,
including operation and
maintenance weakness;
and poor billing and
revenue collection for
urban systems.
(b) Zanzibar: (to 95% in
urban areas)
- In rural areas to 75%
Improved sanitation:
(a) Mainland:
- Increase in proportion of
rural population with
improved toilets to 35%
(b) In Zanzibar:
- Increase in proportion of
population with access to
basic sanitation to 90%
rehabilitated and extended
2.0 million rural household
latrines upgraded.
61.5%
(b) Zanzibar:
- In urban areas to
87%
Improved sanitation:
(a) Mainland:
- Increase in
proportion of the rural
population with
improved toilets to
29%
in Unguja urban
(Zanzibar)
rehabilitated and
extended.
1.0 million rural
household latrines
upgraded
- Rural Water Supply and
Sanitation Program Phase 2 (part
of the Water Sector Development
Program).
- Zanzibar Water Supply and
Sanitation Project
- Lake Victoria Water Supply and
Sanitation Program.
ENERGY
Enhance generation
capacity to increase
customer connection
Inadequate generation,
transmission and
distribution infrastructure.
500,000 additional
customers connected
(100,000 new customers per
year)
Increase in power
generation capacity by
1200 MW ( from 865 MW
in 2010 to 2065 .MW in
2015) in 8 plants50
300,000 additional
customers connected
(100,000 new
customers per year)
Completed energy
sector review study
Increase in power
generation capacity
by 980 MW (from
865 MW in 2010 to
1583 MW in 2013)
in 6 plants51
Proposed:
- Regional Rusomo Falls
Hydroelectric and Multipurpose
project
- Energy sector review
Ongoing:
1. Dodoma Singida 217 Km, 400
KV line (one section of the Iringa-
Shinyanga transmission Project)
2. Electricity V project
PILLAR II:BUILDING AN ENABLING INSTITUTIONAL AND BUSINESS ENVIRONMENT
HUMAN RESOURCE DEVELOPMENT
Improvement of social
well-being and reduction
in income poverty
High attrition rate &
shortage of qualified
teachers
Inadequate infrastructure
especially for vocational
training and science
education.
Ordinary level examination
pass rate increased from
11.5% in 2010 to 20% by
2015
Gender parity achieved in
primary, secondary and
vocational education.
Enrolment in Skills
Development Institutions
increased from current
116,613 per annum to
260,000 students per
annum (50% female)
4 Alternative Learning
Centers and 5 Skills
Development Centers
constructed in Zanzibar by
Ordinary level pass rate
increased to 20% from
by 2013 from 11.5% in
2010
Improved access to
secondary vocational
education with an
emphasis on relevant
and transferable skills
Enrollment in
skills
Development
Institutions
increased from
116,613 per
annum to 180,000
per annum by
2013
Proposed:
- Education Sector Expansion and
Development Project
- Alternative learning and Skills
Development Project – ALSD II
Ongoing:
- Small Entrepreneurs Loan
Facility –SELF II
- Technical and Vocational
Training (TVET)
50 Mwanza diesel plant 60 MW; Ubongo IPP GasTurbine 100 MW; Singida Wind Farm 50 MW; Kimwara Thermal Pant 200 MW; Kiniyerez Gas Turbine 240MW; Rusomo Hydropower21 MW;and
Mitwara CC 300 MW; and Somanga-Fungu (230 MW). 51 Mwanza diesel plant 60 MW; Ubongo IPP GasTurbine 100 MW; Singida Wind Farm 50 MW; Kiniyerez Gas Turbine 240MW and Somanga-Fungu (230 MW).

Country’s Sector
Development Goals
Constraints hindering
achievement of desired
outcomes
Final Outcomes
(by 2015)
Final Outputs
(by 2015)
Mid-Term
Outcomes
(by 2013)
Mid-Term
Outputs
(by 2013)
Bank Group Interventions
during CSP period (ongoing &
proposed)
Lack of employable skills
among young people and
mismatch between skills
training and labour market
needs.
Limited access to finance
for small enterprise
development particularly
by women and the youth
Unemployment amongst
young people aged 15-24
reduced from 14.9% in
2006 to 10% by 2015.
Reduction in financial
exclusion from 56% in 2009
to 54% by 2015.
2015.
Selected TVET institutions
and Science Laboratories
rehabilitated by 2015.
600,000 people accessing
micro finance by 2015
Reduction in financial
exclusion from 56% in
2009 to 55% by 2013.
Curricula for skills
development
institutions revised
to reflect labour
market needs.
300,000 people
accessing micro
finance by 2013.
ECONOMIC AND FINANCIAL GOVERNMANCE
Strengthen economic and
financial governance,
reduce incidence of
corruption and improve
business enabling
environment
Lack of continued political
commitment from
Government towards
economic and financial
reforms.
Limited predictability of
flow of funds
Delays in implementation
of administrative processes
and procedures
Weak regulatory
framework as a constraint
to the enabling
environment
Increased predictability and
control of budget execution
Increased domestic resource
mobilization
Reduced incidence of grand
and petty corruption
Increase in Tanzania‘s
competitiveness
More conducive
environment for PPP‘s
Implementation of all
recommendations from
2011 Country Fiduciary
Risk Assessment
Ratio of total tax revenue
to GDP increased
Improved value of
Corruption Perception
Index (CPI)
Increase in exports
Increased investment in
infrastructure sector
through PPPs
Aggregate expenditure
deviation from
budgeted expenditure
not more than 5%
Increased tracking of
revenues in the mining
sector by TRA
Outcome indicators
related to corruption
in cluster 3 of the PAF
are all met
Minimum of 2
National
Competitiveness
reports published
PPPs legal framework
finalized, and PPP unit
operational
Country Fiduciary
Risk Assessment
Completed
16.5% total tax
revenue to GDP in
2013
CPI improved from
2.7 in 2010 to 3.0 in
2013
Increase value of
exports by 10%
Increase in receipt
of PPP proposals by
30%
Proposed:
- Budget Support Operation
- Country Fiduciary Risk
Assessment
- Report on the Observance of
Standards and Codes, Accounting
&Auditing
Ongoing:
- Institutional Support for Good
Governance II
Annex II: Summary of Completion Report for the Previous Bank Group Strategy (2006-2010)
Introduction: This annex provides an assessment of the Bank Group‘s Strategy for Tanzania during the
2006-2010 period. Its interventions were guided by: Joint Assistance Strategy for Tanzania (JAST),
Joint Program Document (JPD), and the Cover Note describing the Bank‘s specific approach and
programs over the period. It focused on two mutually reinforcing clusters of the country‘s national
development strategy:, (i) growth and poverty reduction: and, (ii) improvement of the quality of life and
social well-being. Within these two clusters, sectors of interventions included infrastructure, public
utilities and multi-sector budget support. In recognition of the importance of cross-cutting issues of
governance and accountability, the Bank also remained active in the third pillar through the Institutional
Support for Good Governance (ISP) project.
Developments in country context: Tanzania remains politically stable and peaceful. There have been
two major political developments during the period 2006- 2010: (i) general elections of 2010, which saw
the re-election of President Kikwete, albeit with a significant increase in the number of opposition
parliamentarians; and (ii) a referendum in Zanzibar, which culminated in the formation of a Government
of National Unity (GNU) following violence-free elections on the Island for the first time since 1995.
Economically, Tanzania experienced strong growth, averaging 7 percent annually. However, poverty
rates remained stubbornly high, with 36 percent of the population living below basic needs poverty line,
indicating that growth has not translated into poverty reduction. Improved revenue collections,
supplemented by aid inflows boosted government spending from 22.8 percent of GDP in 2007 to 26.1
percent in 2009. As a result of increased public spending, there were substantial achievements on non-
income poverty, mainly in education and health, which placed Tanzania on track for meeting both
national and MDG targets in child survival, infant mortality and primary school enrolment. Nonetheless,
MDG objectives on income poverty remained unattainable.
Implementation of the Bank Group Strategy and the Results: The 2006-2010 period spanned two
ADF cycles, covering the last two years of ADF X (2006-2007) and the entire three years of ADF XI
(2008-2010). Tanzania remained one of the largest ADF recipient countries, with an allocation of UA 407
million under ADF XI. The Bank approved 14 operations (12 public and 2 private). It made significant
progress on harmonization of its policy-based operations by increasing General Budget Support (GBS)
and Sector Budget Support (SBS). The Bank‘s strategy responded to the Government priorities as
articulated in the national development strategy. Its multi-sector operations contributed to macroeconomic
stabilization, while in the agriculture sector and microfinance, the main contribution was towards
development of marketing systems and access to finance, respectively. The Bank‘s interventions in the
social sector aimed at improving service provision through infrastructure development (mostly
construction of classrooms and health facilities). The most challenging operations were in the water sector,
which only saw limited progress on planned outcomes, largely because of weak program design and
implementation.
Key Lessons Learned: The Bank could improve the impact of its interventions by: (i) increasing
selectivity as per its Medium Term Strategy, concentrating on sectors where the Bank has comparative
advantage; (ii) increasing the size of operations in order to reduce transaction costs and enhance
efficiency in project implementation; (iii) continuing a candid dialogue with Government; (iv)
maintaining effective and pro-active communication and information flow between all parties involved in
Bank operations; (v) close supervision of all its operations, and regularly reviewing portfolio
performance (at least every two years); (vi) closer cooperation and coordination with other Development
Partners; and (vii) expanding non-lending operations with particular focus on more Economic and Sector
Work (ESW) to inform the Bank operations and support the government with relevant knowledge
products.

Annex III: Tanzania Ongoing Portfolio (as of March 2011)
Sectors TOTAL Disbursement
(UA million)
Disbursement
Rate (%)
Overall
Assessment#
PAR/
CAR
Age
(Years)
AGRICULTURE 87.99 67.43 80.12 2.29 2 PPP 5.4
1. District Agric. Sector Inv. Program
ADF Loan 36.00 22.89 63.58 2.17 36.00 6.3
ADF Grant 7.00 6.73 96.07 7.00
2. Agriculture Sector Dev. Program (ASDP)* 40.00 40.00 100.00 2.41 3.5
3. Support to Lake Tanganyika Integrated Dev. 4.99 0.88 17.65 4.69 6.3
TRANSPORT 228.47 37.09 16.23 1.93 1 PP 3.8
4. Zanzibar Roads Upgrading* 6.8
ADF Loan 16.22 11.20 69.05 1.41 16.22
ADF Grant 0.25 0.25 100.0 0.25
5. Singida – Babati- Mijingu Road Upgrading 60.00 25.64 42.73 2.44 3.5
6. Road Sector Project I 152.00 - 1.2
ENERGY 75.36 0.65 0.86 1 PP 1.8
7. Electricity V Project*** -
ADF Loan 28.68 0 - 28.68 3.2
ADF Grant 1.32 0.65 49.24 - 1.32
8. Iringa-Shinyanga Transmission Line*** 45.36 0 - - 0.3
WATER 92.76 0.25 0.27 2.17 1.3
9. Zanzibar Water Supply & Sanitation Program -
ADF Loan 25.00 0.25 1.00 2.17 2.3
RWSII Grant 2.76 - -
10. Rural Water Supply and Sanitation II***
ADF Loan 59.0 - - - - 0.3
RWSII Grant 6.00 - - - -
SOCIAL SECTOR 75.82 36.99 48.79 2.29 4.3
11. Support to SAP for VETA Project*
ADF Loan 14.22 13.04 91.72 2.08 7.7
ADF Grant 1.60 0.96 60.00
12. Support to Maternal Mortality Reduction 40.00 13.44 33.60 2.39 4.4
13. Small Entrepreneurs Loan Facility II 20.00 9.55 47.77 2.41 0.8
MULTI SECTOR 5.2 - - - 0.4
14. ISP for Good Governance II*** 5.2 - - - 0.4
PRIVATE SECTOR 6.04 0.68 11.26 2.50 3.5
15. Equity Investment to Access Bank 0.55 0.55 100.0 2.50 4.0
16. CRDB Partial Guarantee Scheme - Loan 4.9 0.0 0.0 2.6
FAPA Grant 0.59 22.5 2.50 4.0
REGIONAL OPERATIONS 28.47 1.78 15.85 2.52 4.3
17. Arusha –Namanga-Athi River Road 4.03 0.39 9.67 2.58 4.3
18. East Africa Transport & Trade Fac.(EAC) 6.20 1.41 22.74 2.74 4.3
19. East Africa Transport & Trade Fac.(TTFA) 1.00 0.37 37.37 2.26 4.3
20. Lake Victoria Water Supply & Sanitation 17.24
21. Isaka-Kigali-Musongati Railway Line (Study) 1.06 0.0 0.0 - 1.2
(a) Public Sector Only 565.60 145.48 32.3 2.18
4 (28.6%
PAR; 16.7%
CAR)
2.8
(b) Public + Private Sectors 571.64 146.16 32.4 2.9
(c) Public + Private + ROs 600.11 147.94 32.1 2.24 3.1
Note: * - Substantially completed and PCR planned 2nd Q 2011. ** - Effective but no disbursement for over 6 months. *** - signed but not yet effective. # - Overall assessment is rated on a scale from 0 to 3 with 3 = highly satisfactory, 2 = satisfactory, 1 =
unsatisfactory, and 0 = highly unsatisfactory.

Annex IV: Implementation of Recommendations CPIP 2009
Action required Who? Time frame Status Notes and Explanations
FIDUCIARY
Greater delegation of ore authority; increased capacity to review,
decide and issue ‗no objections‘. Consider making Tanzania Field
Office a regional hub on fiduciary issues.
ADB Jan ‗10 Pending
Delegation of authority being considered in the decentralization road map; Kenya designated as
regional hub on fiduciary matters.
Harmonization of procurement guidelines using country systems
to extent possible
GoT/ADB Oct ‗09,
continuous Ongoing 2009 ORPF assessment of NCB recommended Bank procurement rules to still be used until
modifications are made for Mainland (i.e., amendments to procurement bill) and Zanzibar.
Adoption of scheme of services for procurement cadre. GoT Nov ‗09 Done National Procurement Regulatory Board established to examine all procurement cadre services.
Further training of procurement staff on changes in procurement regulations.
ADB Dec ‗09 Ongoing Procurement and other staff at TZFO trained on new procurement rules and regulations; also participate in relevant ORPF trainings; TZFO procurement staff provided training via PPRA-
organized seminars on the new Bank procurement rules (action to be covered at national project
implementation workshop scheduled for September 2011).
FM & DISBURSEMENT
Performance improvements in existing FM staff through further
training and work environment; recruitment of adequately
qualified FM specialists where needed
GoT /
ADB
Oct ‗09-April
‗10 Ongoing Limited funds available under some projects for training of staff on FM issues; action to be
covered at the national project implementation workshop scheduled in September 2011.
Provision of on-the-job training/guidance to projects through regular supervision or ad hoc support as needed. Requests to be
made in line with relevant contract conditions
GoT/ADB Oct ‗09-April ‗10
Ongoing TZFO staff are providing on-the-job training as the need arises.
Communication improvements between Bank and projects to expedite processing.
GoT/ADB Continuous Ongoing Ongoing Regular communication and dialogue currently between TZFO sector specialists and all project staff
Enhancement of MoF oversight in portfolio management. GoT Oct/ Dec.
‗09;
continuous
Ongoing Regular participation in supervision missions or signing of AMs; increase in staff at ADB desk
in MOF; More proactive communication between MoF and IAs still needed.
Reviewing of causes delays and addressing individual project
problems
MDAs /
ADB
October -
Dec. ‗09 Pending Still being raised only during project supervision missions.
Payment facilitation using special accounts method (esp. for infrastructure projects - up to UA 3 million threshold) and by
direct payment method for amounts ≥ UA 3 million
GoT/ADB April ‗10 Pending Payments under road projects still being paid through direct method; May need to be factored in during project appraisal subject to FFCO guidance and approval.
Conducting 1- or 2-day clinics in Dar es Salaam with HQ- and
TZFO-based staff on Bank disbursement procedures.
ADB October ‗09 –
April ‗10 Pending Formal clinics yet to be organized, although staff from TZFO providing hands-on training
through site visits on frequent basis or as needs arise.
AUDIT
Sensitization of PIU on importance of preparing and submitting
financial statements for audit.
GoT/ADB April ‗10 Ongoing Being followed up on a continuous basis by TZFO FM specialist.
Training auditors on ADB procedures and providing them with manuals, terms of reference, etc reflecting Bank‘s procedures and
reporting requirements.
GoT/ADB April ‗10 Ongoing TZFO FM specialist meets with CAG Mainland on a regular basis to share information. This needs to be strengthened for Zanzibar.
ENVIRONMENT & SOCIAL SAFEGUARDS
Sensitizing project managers and coordinators on safeguards. Capacity building for IAs to enforce safeguards
GoT/ADB April ‗10 Pending Not done extensively due to lack of expertise at TZFO; Need to strengthen capacity at TZFO. Some IAs participated at ORQR regional workshop in Uganda in Nov ‗10.
GOVT CONTRIBUTION/CP FUNDS
Follow up of Cash Management Unit at MoF and implementing
MDAs to incorporate projects in MTEF to ensure timely release of funds.
GoT October 2009
– May ‗10, continuous
Ongoing Improvement need to be made on timely release of funds.
Coordination between Planning Department and Budget MoF
required to: (i) estimate counterpart funding for new loans; and (ii)
ensure inclusion in annual budgets/MTEF.
GoT/PIU Nov ‗09 Pending Government CP funding has been a challenge in project execution due to the mismatch between
the availability of counterpart funds and the time when those funds are needed. The
Government would like to recommend the negotiation with the Bank for full funding.

Action required Who? Time frame Status Notes and Explanations
PROJECT MANAGEMENT
Minimizing TM changes and assigning alternates with adequate decision power; communicating names of alternate TMs to
MoFEA, PIUs and MDAs; ensuring proper handing over by TMs
ADB July ‗09, then continuous
Ongoing Not being done formally but there is need to improve; No problems associated with proper handing over given that most of the TZFO sector specialists are on the ground
in case of absence of TMs, contact field offices for support EAs, PIUs Continuous Continuous All correspondences and issues are being addressed to TZFO.
Strengthening communication, coordination and information flow between concerned stakeholders through dialogue and ICT
MOF, ADB
PIUs,
MDAs
Continuous Continuous Currently being enhanced through visits by IA staff to TZFO, especially when they are located in Dar or via phone.
Reinstate quarterly portfolio management review meetings with project personnel in the field to remove potential bottlenecks and
expedite project implementation
ADB/ GoT
Oct. ‗09 & Continuous
Ongoing This has been changed to bi-annual meetings.
Strengthen Desk Offices in MoF MoF Oct. ‗09 Done Desk offices on both Mainland and Zanzibar each have three personnel. Further assistance to be provided through ongoing project – ISP 2.
Strengthening communication and coordination between MoF and
respective EAs and PIUs
GoT
June ‗09 –
April ‗10 Continuous IAs need to be more proactive to encourage MoF desk officers to participate in visiting project
sites, participate in supervision missions etc.
Speeding up project implementation by thematic working groups in line-ministries
GoT October ‗09 Done Currently being done on regular basis in all SWAPs.
Adopting readiness filter for future operations: key staff
designated and implementation plan ready by Board approval,
baseline data in place, monitoring and evaluation schemes/staff and a comprehensive results-framework are set up before project
implementation
ADB,
MOF,
MDA‘s, PIU‘s
Continuous Ongoing All new projects under ADF XII will adopt readiness filter.
Improving communication and joint Bank-PIU planning of supervision missions; ensuring adequate skills mix
ADB/MDAs/PIUs
Continuous Done Currently being done for all joint funded projects and SWAPs; Need for improvement for stand-alone projects,
Timely preparation of joint project completion reports and pro-
actively cancelling loan balances; ensuring that lessons learned are
incorporated in new operations
ADB/GoT For each
project
completion
Done All PCRs have been led by TZFO staff and IAs. Lessons learned have been incorporated into
all future new operations.
HARMONISATION
Reviewing of current procedures including recommendations for
harmonization.
ADB Jan – April
‗10 Done There is harmonization of procurement procedures between DPs on jointly funded projects.
MONITORING & EVALUATION
Identifying gaps in the national sectoral M&E systems and
strengthening them so that they are utilized for donor financed
projects and also an integral part of GoT systems.
GoT/ADB Jan – April
‗10 Ongoing This is being done in SWAPs but needs to be strengthened at project level.
IMPLEMENTATION & OUTCOMES
Ensuring projects identified based on GoT‘s priorities with
stakeholders involvement throughout project cycle.
GoT,
ADB
Continuous Done Projects are aligned to GoT priorities; Need improvement to ensure that other stakeholders such
as other line Ministries, CSOs, academia and private sector are involved.
Enhancing GoT commitment by more realistic screening of donor-
driven initiatives
GoT Continuous Ongoing Dialogue in progress with the DPs on screening of donor driven initiatives without jeopardizing
diplomatic and economic ties between the parties.
Teams to focus on reporting on outcomes using the indicators in
the results frameworks as evidence of progress.
ADB/PIU
s/EAs
Continuous Continuous. Bank should develop the reporting format for new projects so as to include this in the Qtly
progress reports.

Annex V: Country Portfolio Improvement Plan (CPIP) 2011
Issues Actions Required Responsible Time frame
IMPLEMENTATION PREPAREDNESS & EFFECTIVENESS
Inadequate stakeholders (IA, EA,
Government) participation in preparation
stage for development of new project proposals
During the preparation phase (project identification and appraisal) arrange
consultations/workshop with all key stakeholders (CSOs, local communities,
LGAs, etc.)
HQ sector
department, TZFO
Immediate;
continuous
Unrealistic loan conditions/legal
covenants leading to delayed effectiveness and start up
Carefully scrutinize loan conditions/legal covenants during appraisal and fulfill
them at loan/grant negotiations prior to Board (incl. allocation of resources for compensation to project affected persons)
MoF; Implementing
Agency (IA); AfDB sector department
Immediate;
continuous
PROCUREMENT
Inadequate design/setup of procurement
arrangements in project
Organize separate procurement assessment mission prior to project appraisal mission. The participation of ORPF 1 to start from the preparatory stages of
projects.
TZFO procurement staff
Immediate; continuous
Delays in procurement processes at
project management unit level
Arrange training workshop for all PIU procurement staff – held at least once per
year or as needs arise. Undertake proper risk assessment and prepare mitigation measures during projects‘ preparation and appraisal stages
TZFO procurement
staff
Sept 2011; and
annually thereafter
Attach the updated procurement plan to the BTOR of all supervision missions.
Procurement staff should be part of all supervision missions.
TZFO procurement
staff and IA procurement staff
Immediate;
continuous
Delays in providing ‗no- objection‘
response by AfDB
Enforce KPIs in processing of procurements documents ORPF Sector
Manager
Immediate;
continuous
Implement an automated procurement process ORPF, CIMM July 2012
Delegate more authority to FO procurement and sector specialists. ORPF December 2011
FINANCIAL MANAGEMENT, DISBURSEMENT and AUDIT
Inadequate design/setup of FM arrangements and/or flow of funds
FM assessments mainstreamed into the project cycle phases including organizing separate FM assessment prior to project appraisal mission and .
TZFO FM specialist Immediate; continuous
Project staff not familiar with AfDB disbursement rules and procedures
Arrange a formal training workshop for all PIU FM staff on FM and
disbursement issues – held at least once a year or as need arises.
TZFO disbursement
specialist
Sept 2011; and
annually
thereafter
Untimely response to Government/project disbursement requests by the AfDB
Enforce KPIs in processing of disbursement documents TZFO disbursement specialist
Immediate; continuous
Zanzibar CAG not familiar with AfDB‘s
Terms of Reference for auditing
Provide ToR for auditing at project launching/follow up missions and PIUs to
share with firms carrying out auditing functions for Bank-funded projects
TZFO FM staff; IAs;
CAG-Zanzibar
Immediate;
continuous
Inadequate or weak internal audit functions at IA/EA level
EAs should include audit program for Bank-financed projects in work program CAG; TZFO FM
staff, TM
Immediate;
continuous
Auditors at EAs should produce separate audit report for all Bank-financed
projects and should be discussed by the audit Committee.
― ―
Delays in preparing and submitting financial statements for auditors
Submit financial statement for auditing within 2 months after closure of
financial year.
EAs/IAs Oct 2011 and
continuous
Send regular reminders for PIU to comply with audit procedures TZFO FM staff, TM ―
Late GoT/PIU responses to audit queries raised by Auditor General‘s Office
Respond within 21 days as per requirement EAs/IAs Immediate; continuous
Develop a tracking system at TZFO for follow up with EAs on audit queries TZFO FM specialist ―
MONITORING, EVALUATION & REPORTING
Lack of baseline data during project design/start up
Include a subcomponent for data collection in the project design and for
implementation in the early stages of the project
Sector Dept
Country Team
Immediate; for
all projects
under ADF XII
Project data on the key performance
indicators not up to date
Status on key performance indicators included in all progress reports and
supervision mission reports.
IA; TM Immediate; for
all projects
under ADF XII
Lack of understanding of M&E by the
project team and government officials
Assess M&E capacity at EA level and allocate sufficient resources for building or strengthening M&E systems
EA; TM Immediate; for all projects
under ADF XII
INSTITUTIONAL CAPACITY ASSESSMENT
Formal communication from the Bank on changes in project management/personnel
at AfDB
Ensure that joint mission with both the ex and new TM is undertaken before the PIU/EA is officially informed of the change in TM.
TM Immediate
AFDB SUPERVISION & STAFFING
Lack of sufficient powers to make
decisions by sector specialists at Tanzania
Field office.
Delegate more authority to FO as part of Bank decentralization process ORVP; FFCO Jan 2012

Annex VI: Tanzania - Comparative Socio-Economic Indicators
Year Tanzani
a Africa
Developing
Countries
Developed
Countries
Basic Indicators
Total Population (millions) 2010 45.0 1,031.
5 5,629 1,069
Urban Population (% of Total) 2010 26.4 40.0 44.8 77.7
Population Density (per Km²) 2010 47.7 3.4 66.6 23.1
GNI per Capita (US $) 2009 500 1 550 2 780 39 688
Labor Force Participation - Total (%) 2010 49.6 39.5 45.6 54.6
Labor Force Participation - Female (%) 2010 49.7 41.4 39.8 43.3
Human Develop. Index (Rank among 169
countries) 2010 148 n.a n.a n.a.
Popul. Living Below $ 1 a Day (% of
Population) 2005 … 42.3 25.0 …
Demographic Indicators
Population Growth Rate - Total (%) 2010 2.9 2.3 1.3 0.7
Population Growth Rate - Urban (%) 2010 4.7 3.3 2.4 1.0
Population < 15 years (%) 2010 44.7 40.3 29.2 17.7
Population >= 65 years (%) 2010 3.5 3.8 6.0 15.3
Dependency Ratio (%) 2010 91.8 77.6 52.8 49,O
Sex Ratio (per 100 female) 2010 99.5 99.5 93.5 94.8
Female Population 15-49 years (% of total
population) 2010 22.8 24.4 53.3 47.2
Life Expectancy at Birth - Total (years) 2010 54 56.0 66.9 79.8
Crude Birth Rate (per 1,000) 2010 40.9 34.2 21.5 12.0
Crude Death Rate (per 1,000) 2010 10.7 12.6 8.2 8.3
Infant Mortality Rate (per 1,000) 2010 51 78.6 49.9 5.8
Child Mortality Rate (per 1,000) 2010 81 127.2 51.4 6.3
Total Fertility Rate (per woman) 2010 5.5 4.4 2.7 1.8
Maternal Mortality Rate (per 100,000) 2008 790.0 530.2 440.0 10.0
Health & Nutrition Indicators
Physicians (per 100,000 people) 2007 4.8 42.9 78.0 287.0
Nurses (per 100,000 people)* 2007 102.4 116.6 98.0 782.0
Births attended by Trained Health Personnel (%) 2005 46 52.7 63.4 99.3
Access to Safe Water (% of Population) 2008 54.0 64.9 84.0 99.6
Access to Sanitation (% of Population) 2008 24.0 41.0 54.6 99.8
Percent. of Adults (aged 15-49) Living with
HIV/AIDS 2007 6.2 4.6 1.3 0.3
Incidence of Tuberculosis (per 100,000) 2007 297.0 315.2 161.9 14.1
Child Immunization Against Tuberculosis (%) 2009 93.0 81.8 89.0 99.0
Child Immunization Against Measles (%) 2009 91.0 81.0 81.7 92.6
Underweight Children (% of children under 5
years) 2005 22.0 30.9 27.0 0.1
Daily Calorie Supply per Capita 2007 2 032 2 462 2 675 3 285
Public Expenditure on Health (as % of GDP) 2006 3.7 2.4 4.0 6.9
Education Indicators
Gross Enrolment Ratio (%)
Primary School - Total 2009 104.9 102.8 106.8 101.5
Primary School - Female 2009 104.9 99.0 104.6 101.2
Secondary School - Total 2005 … 35.0 62.3 100.3
Secondary School - Female 2005 … 30.6 60.7 100.0
Primary School Female Teaching Staff (% of
Total) 2009 49.1 38.1 … …
Adult literacy Rate - Total (%) 2008 72.6 64.8 81.0 …
Adult literacy Rate - Male (%) 2008 79.0 74.0 86.6 …
Adult literacy Rate - Female (%) 2008 66.3 55.9 75.6 …
Percentage of GDP Spent on Education 2008 6.8 4.6 … 5.4 Sources : ADB Statistics Department Databases; World Bank: World Development Indicators;
UNAIDS; UNSD; WHO, UNICEF, WRI, UNDP; Country Reports: National Bureau of Statistics, Tanzania:
Note : n.a. : Not Applicable ; … : Data Not Available. last update : January 2011

Annex VII: Tanzania: Select Macroeconomic Indicators
Indicators 2001 2005 2006 2007 2008 2009
National Accounts
GNI at Current Prices (Million US $) 9,447 13,382 14,518 15,934 18,350 …
GNI per Capita (US$) 270 350 370 400 440 …
GDP at Current Prices (Million US $ ) 10,383.6 14,142.0 14,331.2 16,825.5 20,715.1 20 532.8
GDP at 2000 Constant prices (Million US $ ) 10,796.7 14,287.5 15,273.3 16,311.9 17,535.3 18 507.9
Real GDP Growth Rate (% ) 6.0 7.4 6.9 6.8 7.4 6
Real per Capita GDP Growth Rate ( %) 3.3 4.5 4.0 3.8 4.5 2.6
Gross Domestic Investment ( % GDP) 17.4 25.1 27.6 29.6 29.8 28.2
Public Investment (% GDP ) 5.6 8.4 7.9 7.8 7.6 7.5
Private Investment ( % GDP) 11.8 16.7 19.7 21.8 22.2 20.7
Gross National Savings (% GDP ) 12.5 20.5 19.5 20.2 19.7 17.9
Prices and Money
Inflation (CPI) - ( %) 5.1 5.0 7.3 7.0 10.3 12.1
Exchange Rate (Annual Average) -( US$) 876.4 1,128.9 1,251.9 1,245.0 1,196.3 1,326.4
Monetary Growth (M2) ( %) 34.2 34.8 21.5 20.5 19.8 12.0
Money and Quasi Money as % of GDP 20.6 26.6 28.8 29.7 30.1 30.7
Government Finance
Total Revenue and Grants as % GDP 14.2 18.5 17.9 19.0 22.8 21.6
Total Expenditure and Net Lending as % GDP 15.1 21.7 21.3 22.2 22.8 24.2
Overall Deficit (-) / Surplus (+) as % GDP -1.0 -3.2 -3.4 -3.2 0.0 -2.7
External Sector
Exports Volume Growth (Goods) 25.6 17.7 2.5 -6.6 6.2 4.3
Imports Volume Growth (Goods) -5.5 9.0 3.7 19.2 13.3 -0.2
Terms of Trade Growth -15.4 -13.1 -10.4 17.8 9.0 0.6
Current Account Balance -199.9 -862.8 -1,143.2 -1,783.1 -2,571.2 -2,084.5
Current Account Balance -1.9 -6.1 -8.0 -10.6 -12.4 -10.2
External Reserves (Months of Imports) 5.2 4.5 3.9 3.9 3.1 3.5
Debt and Financial Flows
Debt Service 24.4 7.1 4.4 132.2 1.6 2.2
External Debt 67.1 45.0 45.5 39.7 33.0 34.1
Net Total Financial Flows 1,304.1 1,675.3 1,993.5 2,375.4 2,516.8 …
Net Official Development Assistance 1,275.3 1,497.5 1,837.6 2,818.5 2,330.7 …
Net Foreign Direct Investment 388.8 77.0 77.3 49.2 67.8 …
Source : ADB Statistics Department
Notes: … Data Not Available
Last Update: May ‗10Source: Last Update: May ‗10

Annex VIII: Progress towards the MDGs for Mainland Tanzania
MDG 1990 2000 2008
2015 Glance Actual Expected
Proportion of population below basic needs
poverty line 39 36 33.64 25.0 19.5
Under-five Underweight (%) 28.8 29.5 22 18.4 14.4
Under-five Stunted (%) 46.6 44.4 (1999) 38 29.8 23.3
Primary school net enrollment rate 54.2 58.7 97.2 87.2 100
Under-five mortality rate (per 1,000 live births) 191 153 112 99.6 64
Infant mortality rate (per 1,000 live births) 115 99 68 59.6 38
Maternal Mortality Rate (per 100,000 live
births) 529 - 578 244 133
Births attended by skilled health personnel (%) 43.9 35.8 63 77.1 90
HIV prevalence, 15-24 years 6 - 2.5 <6 <6
Access to potable water :% of rural population 51 42 (2002) 57.1 67.6 74
Access to potable water :% of urban population 68 85 (2002) 83 79.5 84
Annex IX: Progress towards the MDGs for Zanzibar
MDG 1990 2000 2008
2015 Glance Actual Actual
Proportion of population below basic needs
poverty line 60 - 51 38.4 30
Under-five Underweight (%) 39.9 25.8 7.3 14.3 20.0
Under-five Stunted (%) 47.9 35.8 (1999) 23.1 30.6 23.9
Primary school net enrollment rate 50.9 67.0 83.4 86.3 100
Under-five mortality rate (per 1,000 live births) 202 14.1 101 105 67
Infant mortality rate (per 1,000 live births) 120 89 61 62.4 40
Maternal Mortality Rate (per 100,000 live
births) 377 323 473 173 94
Births attended by skilled health personnel (%) 37 - 47 75.2 90
HIV prevalence, 15-24 years 0.7 - 0.6 <0.7 <0.7
Access to potable water :% of rural population 46 46 59 65.4 73
Access to potable water :% of urban population 68 90 83 79.5 84
Achievable Likely to achieve Unlikely to achieve
Achievable Likely to achieve Unlikely to achieve

Annex X: Tanzania CPIA Ratings 2005-’10
A. ECONOMIC
MANAGEMENT
B. STRUCTURAL
POLICIES
C. POLICIES FOR SOCIAL
INCLUSION / EQUITY
OV
ER
AL
L C
PIA
RA
TIN
G
GOVERNANCE RATING : PUBLIC
SECTOR MANAGEMENT AND
INSTITUTIONS
1 2 3
Av
era
ge
4 5 6
Av
era
ge
7 8 9 10 11
Av
era
ge
1 2 3 4 5
Av
era
ge
Mac
ro-E
con
om
ic M
anag
emen
t
Fis
cal
Po
licy
Deb
t P
oli
cy
Reg
ional
Inte
gra
tion
an
d t
rad
e
Fin
anci
al S
ecto
r
Bu
sines
s R
egu
lato
ry E
nv
iron
men
t
Gen
der
E
qu
alit
y
Equ
ity o
f P
ub
lic
Res
ou
rce
Use
Buil
din
g H
um
an R
eso
urc
es
So
cial
Pro
tect
ion
and
Lab
or
Env
iro
nm
enta
l P
oli
cy &
Reg
ula
tion
s
Pro
per
ty R
igh
ts &
Rule
Bas
ed
Go
ver
nan
ce
Qu
alit
y o
f B
udg
etar
y &
Fin
anci
al
Man
agm
t.
Eff
icie
ncy
of
Rev
enue
Mobil
izat
ion
Qu
alit
y o
f P
ubli
c A
dm
inis
trat
ion
Tra
nsp
aren
cy, A
ccou
nta
bil
ity &
Co
rrupti
on
in P
ub
. S
ecto
r
2010 5 4 4.5 4.5 4 4 3.5 3.8 3.5 4 4 3.5 4 3.8 4.0 3.
5
4 4 4 3.5 3.8
2009 5.0 4.0 4.5 4.5 4.0 4.0 3.5 3.8 3.5 4.0 3.5 3.5 4.0 3.7 4.0 3.5
4.0
4.0 4.0 3.5 3.8
2008 5.0 4.0 4.5 4.5 4.0 4.0 3.5 3.8 3.5 4.0 3.5 3.5 4.0 3.7 4.0 3.
5
4.
0
4.0 4.0 3.5 3.8
2007 5.0 4.0 4.5 4.5 4.0 4.0 4.0 4.0 3.5 4.0 3.5 3.5 4.0 3.7 4.2 3.
5
4.
0
4.0 4.0 3.5 3.8
2006 4.5 4.0 4.5 4.3 4.0 4.0 4.0 4.0 3.5 4.0 3.5 3.5 4.0 3.7 4.0 3.
5
4.
0
4.0 4.0 3.5 3.8
2005 4.5 4.0 4.5 4.3 4.0 4.0 4.0 4.0 3.5 4.0 3.5 3.5 4.0 3.7 4.0 3.5
4.0
4.0 3.5 3.5 3.7
Annex XI: Major Challenges of the JAST to Development Partners52
Aid delivery under JAST created substantial changes in the structures of most donors, especially multilateral financial
institutions. With regard to the Bank Group, changes included the following:
JAST increased the demand for monitoring and evaluating Government performance, as well as dialoguing with the
authorities to ensure that the intended results are achieved. The Bank was required to work in coordination with other
DPs through active participation in joint dialogue sessions than was the case before. A good example of how this new
approach to aid delivery and how it reoriented operations of DPs is noted from those DPs supporting the government
budget under the Poverty Reduction Budget Support (PRBS) framework (i.e., GBS), as well as on those supporting
specific basket funds (i.e., SBS), particularly in health, education, agriculture, and on specific programs.
JAST also increased joint supervision missions in some instances, as many Bank interventions were co-financed and
implemented along the GoT systems, procedures and regulations. Joint missions largely concentrated on review of
progress based on established performance indicators linked to an agreed list of actions for implementation over a
specified period of time.
In cases where the support was in the form of direct project financing, some of the Bank interventions were mainstreamed
within GoT structures and procedures in an effort to avoid duplication of systems and build institutional capacities for
sustainable development.
The Bank Group also needed agreement with other DPs on how to divide responsibilities among themselves, depending
on comparative advantage in terms of expertise in particular sectors/areas. It was done to devise policy actions that could
enhance performance on the government part. .
In the wake of full implementation of JAST, there was increased demand for active involvement of each DP in the follow-up
of implementation of GoT programs in order to ensure transparency and accountability on the use of public funds, as well as
in respect to its impact on poverty reduction and growth. This often proved difficult since most DPs lacked direct control on
the use of funds, except via established monitoring mechanisms, agreed performance indicators/reporting systems.
52 Adopted from African Development Bank (2005), Tanzania – Joint Assistance Strategy and Joint Program Document ADB/BD/WP/2007/55,
ADF/BD/WP/2007/41. Tunis: African Development Bank and with reference to Maliti, E. (2011), Independent Evaluation of AfDB Operations in Tanzania within the JAST Framework (2006-2010). Dar es Salaam: African Development Bank.
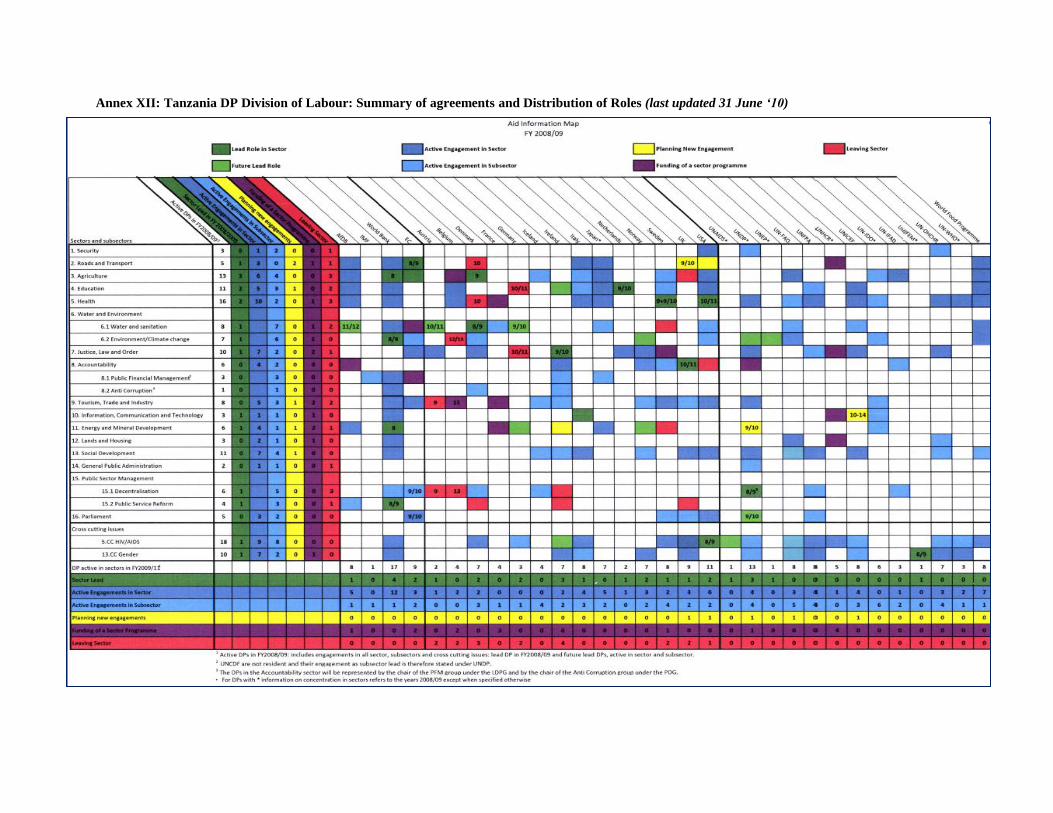
Annex XII: Tanzania DP Division of Labour: Summary of agreements and Distribution of Roles (last updated 31 June ‘10)

Annex XIII: The Transport Sector: Challenges and Priorities
Tanzania’s transport system consists of: (i) a road network of about 95,000 km; (ii) two railway
systems – the Tanzania Zambia Railway (TAZARA), which links Dar Es Salaam with Zambia and
Tanzania Railways Corporation (TRC), which serves the central and northern regions and provides
transit access to DRC, Rwanda, Burundi and Uganda; (iii) one dominant and three subsidiary ports;
Dar Es Salaam, Zanzibar, Tanga and Mtwara; and (iv) a civil aviation sub-sector consisting of
several small airlines, three international airports and a number of domestic airports and air strips.
The physical condition of the transport system is poor, which constraints economic activity and
growth. The poor condition, particularly for roads and rail, is due mainly to inadequate
maintenance.
Roads
Major challenges include: (i) significant volume of backlog maintenance; (ii) inadequate level of road
user charging; (iii) inefficient road user charges collection system, resulting in evasion; (v) human
resource capacity problems; (vi) poor domestic contracting capacity; and (vii) poor rural accessibility.
Priorities include: (i) bituminization of the trunk road system and links on regional corridors; (ii)
bringing network to maintainable levels; (iii) revamping the road user collection system; and (iv)
building contracting and professional capacity.
Rail
Major challenges include: (i) poor track condition rolling stock and signaling systems; (ii) absence of
private sector investment; (iii) poor financial and operational management; and (iv) human resource
capacity problems.
Priorities include: (i) attraction of private sector investment; (ii) rehabilitation of track and revamping
of rolling stock; (iii) improve operational and financial management; and (iv) building professional
capacity.
Aviation
Major challenges include: (i) terminal and airside capacity problems and poor safety at Dar-es-Salaam
Airport; (ii) flight safety; (iii) human resource capacity problems.
Priorities include: (i) attraction of private sector investment; (ii) expansion of the Dar-es-Salaam
terminal and airside facilities; and (iii) building professional capacity.
Ports
Major challenges include: (i) Dar-es-Salaam port capacity problems; (ii) low level of investment; (iii)
efficiency problems; (iv) slow implementation of recommendations for improvement; and (v) human
resource capacity problems.
Priorities include: (i) attraction of investment to improve handling capacity; and (ii) building
professional capacity.
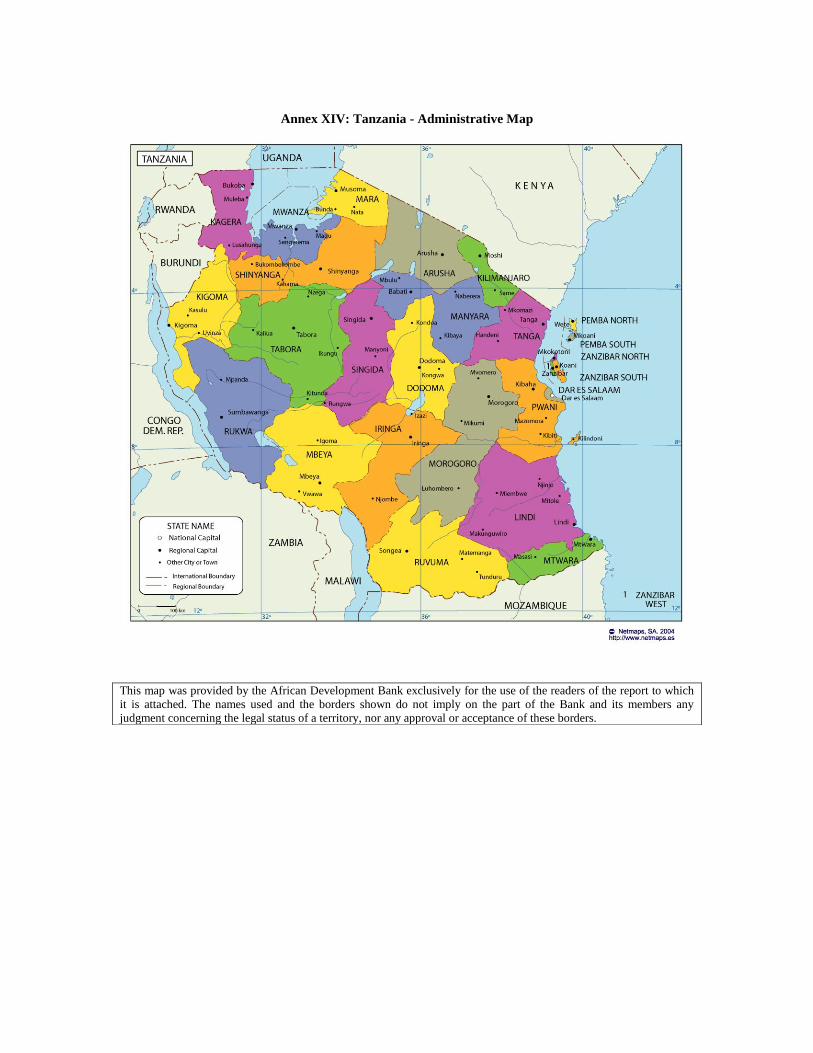
Annex XIV: Tanzania - Administrative Map
This map was provided by the African Development Bank exclusively for the use of the readers of the report to which
it is attached. The names used and the borders shown do not imply on the part of the Bank and its members any
judgment concerning the legal status of a territory, nor any approval or acceptance of these borders.
Annex XV: References
African Development Bank (‗10), African Development Report: Logistics and Trade in
Africa. Tunis: African Development Bank.
African Development Bank (‗10), African Economic Outlook ‘10: Domestic Resource
Mobilization and Aid. Tunis: African Development Bank.
African Development Bank (‗10), Domestic Resource Mobilization for Poverty Reduction in
East Africa: Tanzania Case Study. Document Nos. ADB/BD/IF/‘10/305 and
ADF/BD/IF/‘10/292. Tunis: African Development Bank.
African Development Bank (‗10), Eastern Africa- Regional Integration Strategy Paper
(RISP) 2011-2015: Document Nos. ADB/BD/WP/‘10/217 and ADF/BD/WP/‘10/168.
Tunis: African Development Bank.
African Development Bank (2005), Tanzania - Country Portfolio Performance Review:
Document ADB/BD/WP/2009/175 and ADF/BD/WP/2009/125. Tunis: African
Development Bank.
African Development Bank (2005), Tanzania – Joint Assistance Strategy and Joint Program
Document ADB/BD/WP/2007/55, ADF/BD/WP/2007/41. Tunis: African Development
Bank.
African Development Bank (2005), Tanzania HIV and Malaria Indicator Survey, 2007/2008
United Republic of Tanzania Multi-Sector Country Gender Profile. Tunis: African
Development Bank.
Afro-Barometer (2006), ―Combatting Corruption in Tanzania: Perception and Experience‖,
Afro-Barometer Briefing Paper (April 2006)
Bank of Tanzania, Monthly Economic Review: Various issues
Bank of Tanzania, Quarterly Economic Bulletin: Various issues
International Monetary Fund and the United Republic of Tanzania (‗10), Seventh Review
Under the Policy Support Instrument, Second Review Under the Exogenous Shocks
Facility, and Request for a New Three-Year Policy Support Instrument. Washington, DC:
IMF.
International Monetary Fund: United Republic of Tanzania (‗10), First Review Under the
Policy Support Instrument and Request for Modification of Assessment Criteria—Staff
Report; Press Release on the Executive Board Discussion: IMF Country Report No.
10/351. Washington DC: IMF.
Maliti, E. (2011), Independent Evaluation of AfDB Operations in Tanzania within the JAST
Framework (2006-’10). Dar es Salaam: African Development Bank.
Mugisa, E., et. al. (2009), An Evaluation of the Implementation and Impact of the East
African Community Customs Union. Arusha: East African Community.
Ndulu, B.J., et. al. (2007), Challenges of African Growth: Opportunities, Constraints, and
Strategic Directions. Washington, DC: World Bank.

PM, Oxford Policy Management, Mokoro and Center for the Study of the Economies of
Africa (2011), ―Evaluation of Policy Based Operations in the African Development Bank,
1999-2009. Country Case Study: Tanzania‖. Tunis: Operations Evaluation Department,
AfDB.
Policy Forum (2009), ―An Analysis of Tanzania‘s Budget Revenue Projections: How Much
Revenue are we Losing? Tanzania Budget 2009/‘10.‖ Policy Brief No. 3.09. Dar es
Salaam: Policy Forum.
Revolutionary Government of Zanzibar (‗10), The Zanzibar Strategy for Growth and
Reduction of Poverty – ZSGRP II. Zanzibar: United Republic of Tanzania.
United Nations Development Program (2009), Millennium Development Goals: Millennium
Development Goals Report, Mid-Way Evaluation, 2000 – 2008. Dar es Salaam: United
Nations Development Program.
United Republic of Tanzania (‗10), National Panel Survey, 2008 – 2009. Dar es Salaam:
National Bureau of Statistics.
United Republic of Tanzania (‗10), National Strategy for Growth and Reduction of Poverty
NSGRP II. Dar es Salaam: Ministry of Finance and Economic Affairs.
United Republic of Tanzania (‗10), Tanzania Demographic and Health Survey 2009/10. Dar
es Salaam: National Bureau of Statistics.
United Republic of Tanzania (2005), Tanzania Demographic and Health Survey 2004/05.
Dar es Salaam: National Bureau of Statistics.
United Republic of Tanzania (2003), Trade Policy for a Competitive Economy and Export-
led Growth. Dar es Salaam: Ministry of Industry and Trade.
United Republic of Tanzania (2006), Integrated Labor Force Survey. Dar es Salaam:
National Bureau of Statistics.
United Republic of Tanzania (2007), Household Budget Survey: Dar es Salaam: National
Bureau of Statistics.
United Republic of Tanzania, Economic Survey: Various issues.
World Bank (‗10), Doing Business ‘10: Reforming through Difficult Times,
www.doingbusiness.org
World Bank (‗10), Tanzania’s Infrastructure: A Continental Perspective (Africa
Infrastructure Country Diagnostic Series). Washington DC: World Bank.
World Bank (‗10), Worldwide Governance Indicators: Country Data Report for Tanzania,
1966 - 2009
World Bank (2007), Tanzania: Sustaining and Sharing Economic Growth. (Country
Economic Memorandum and Poverty Assessment). Report No. 39021-TZ. Washington
DC: World Bank.
World Bank (2009), Governance Matters VIII: Governance Indicators for 1996-2008,
www.worldbank.org/wbi/governance