tape diagrams
DESCRIPTION
Tape Diagrams . Sean VanHatten [email protected] Tracey Simchick [email protected]. Increasing student understanding through visual representation . Morning Session : Progression of Tape Diagrams Addition, Subtraction, Multiplication, Division & Fractions - PowerPoint PPT PresentationTRANSCRIPT

Tape Diagrams Increasing student understanding through visual representation
Sean VanHatten
svanhatten@e2ccb.
org
Tracey Simchick
g

Morning Session: Progression of Tape Diagrams• Addition, Subtraction, Multiplication, Division &
Fractions
LUNCH: 11:30 AM – 12:30 PM
Afternoon Session: Exploring Tape Diagrams within the Modules
** Norms of Effective Collaboration **

Learning Targets0 I understand how mathematical modeling
(tape diagrams) builds coherence, perseverance, and reasoning abilities in students
0 I understand how using tape diagrams shift students to be more independent learners
0 I can model problems that demonstrates the progression of mathematical modeling throughout the K-5 modules

Opening Exercise …Directions: Solve the problem below using a tape diagram.88 children attended swim camp. An equal number of boys and girls attended swim camp. One-third of the boys and three-sevenths of girls wore goggles. If 34 students wore goggles, how many girls wore goggles?
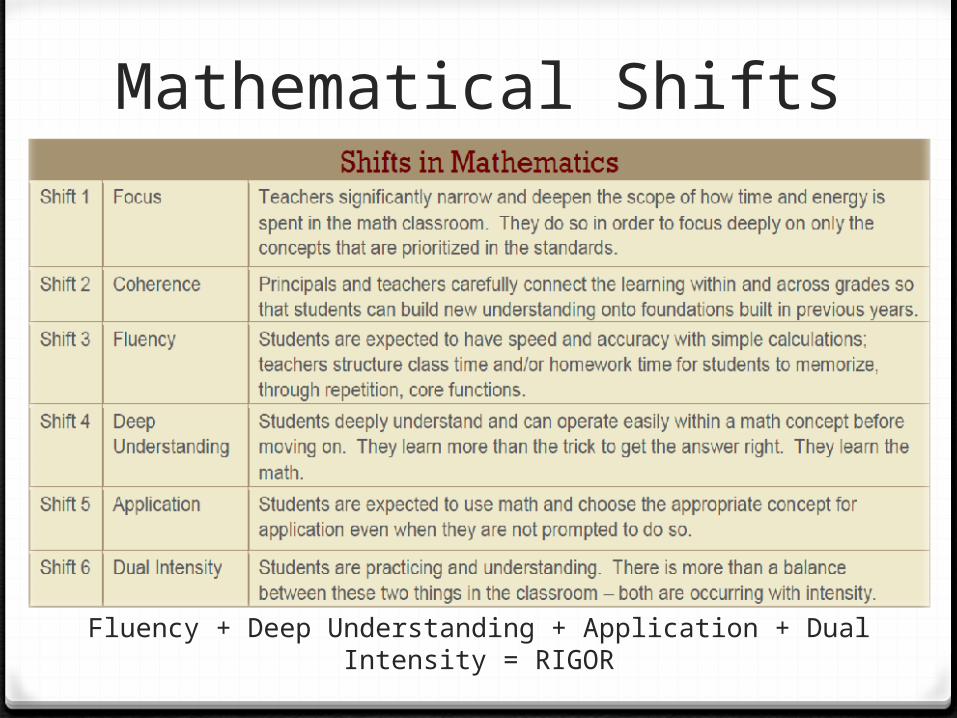
Mathematical Shifts
Fluency + Deep Understanding + Application + Dual Intensity = RIGOR

What are tape diagrams?0A “thinking tool” that allows students to
visually represent a mathematical problem and transform the words into an appropriate numerical operation
0A tool that spans different grade levels

0 A picture (or diagram) is worth a thousand words
0 Children find equations and abstract calculations difficult to understand. Tape diagrams help to convert the numbers in a problem into pictorial images
0 Allows students to comprehend and convert problem situations into relevant mathematical expressions (number sentences) and solve them
0 Bridges the learning from primary to secondary (arithmetic method to algebraic method)
Why use tape diagrams? Modeling vs. Conventional Methods

Making the connection …
Concrete
Pictorial
Abstract
9 + 6 = 15

ApplicationProblem solving requires studentsto apply the 8 Mathematical Practices
http://commoncoretools.me/2011/03/10/structuring-the-mathematical-practices/

Background Information0 Diagnostic tests on basic mathematics skills were
administered to a sample of more than 17,000 Primary 1 – 4 students
0 These tests revealed:0 that more than 50% of Primary 3 and 4 students performed
poorly on items that tested division0 87% of the Primary 2 – 4 students could solve problems
when key words (“altogether” or “left”) were given, but only 46% could solve problems without key words
0 Singapore made revisions in the 1980’s and 1990’s to combat this problem – The Mathematics Framework and the Model Method
The Singapore Model Method, Ministry of Education, Singapore, 2009

Singapore Math Framework (2000)

Progression of Tape Diagrams
0Students begin by drawing pictorial models0Evolves into using bars to represent quantities
0 Enables students to become more comfortable using letter symbols to represent quantities later at the secondary level (Algebra)
15
7 ?


Foundation for tape diagrams:The Comparison Model – Arrays (K/Grade 1)
0Students are asked to match the dogs and cats one to one and compare their numbers.
Example: There are 6 dogs. There are as many dogs as cats. Show how many cats there would be.

The Comparison Model – Grade 10There are 2 more dogs than cats. If there are 6 dogs,
how many cats are there?
There are 6 dogs. There are 2 more dogs than cats. The difference between the two numbers is 2. There are 4 cats.

First Basic Problem Type0Part – Part – Whole
8 = 3 + 58 = 5 + 33 + 5 = 85 + 3 = 8
8 – 3 = 58 – 5 = 35 = 8 – 3
3 = 8 – 5
Part + Part = Whole
Whole - Part = Part
Number Bond

The Comparison Model – Grade 2
0Students may draw a pictorial model to represent the problem situation.
Example:

Part-Whole Model – Grade 2
Ben has 6 toy cars. Stacey has 8 toy cars. How many toy cars do they have altogether?
6 + 8 = 14 They have 14 toy cars altogether.

Forms of a Tape Diagram0Part-Whole Model
- Also known as the ‘part-part-whole’ model, shows the various parts which make up a whole
0Comparison Model- Shows the relationship between two quantities
when they are compared

Part-Whole Model Addition & Subtraction
Part + Part = Whole
Whole – Part = Part
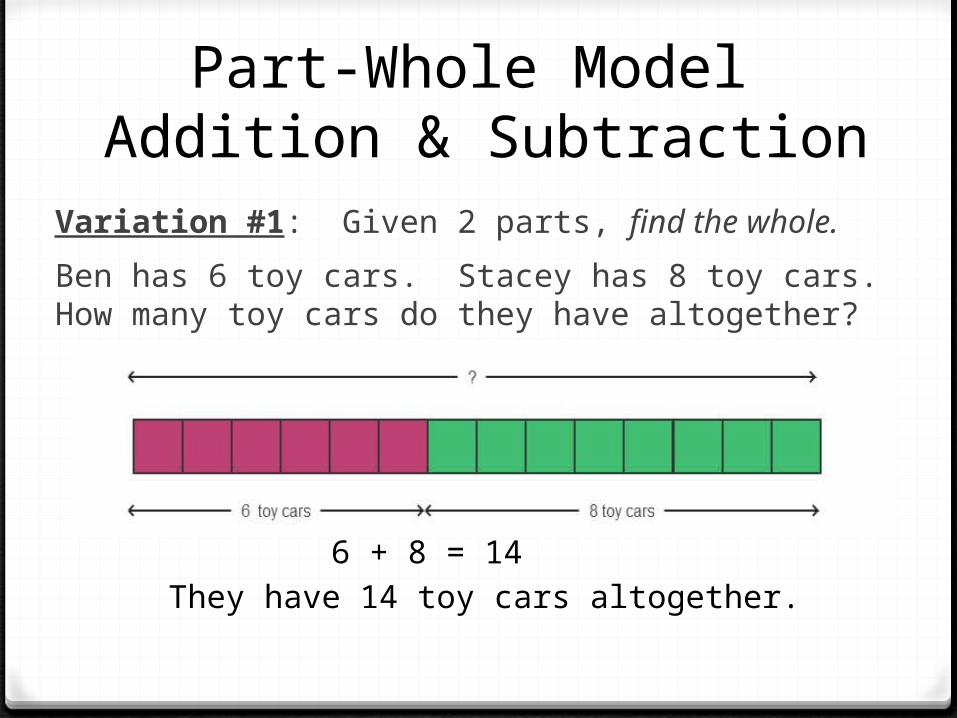
Part-Whole Model Addition & Subtraction
Variation #1: Given 2 parts, find the whole.Ben has 6 toy cars. Stacey has 8 toy cars. How many toy cars do they have altogether?
6 + 8 = 14 They have 14 toy cars altogether.
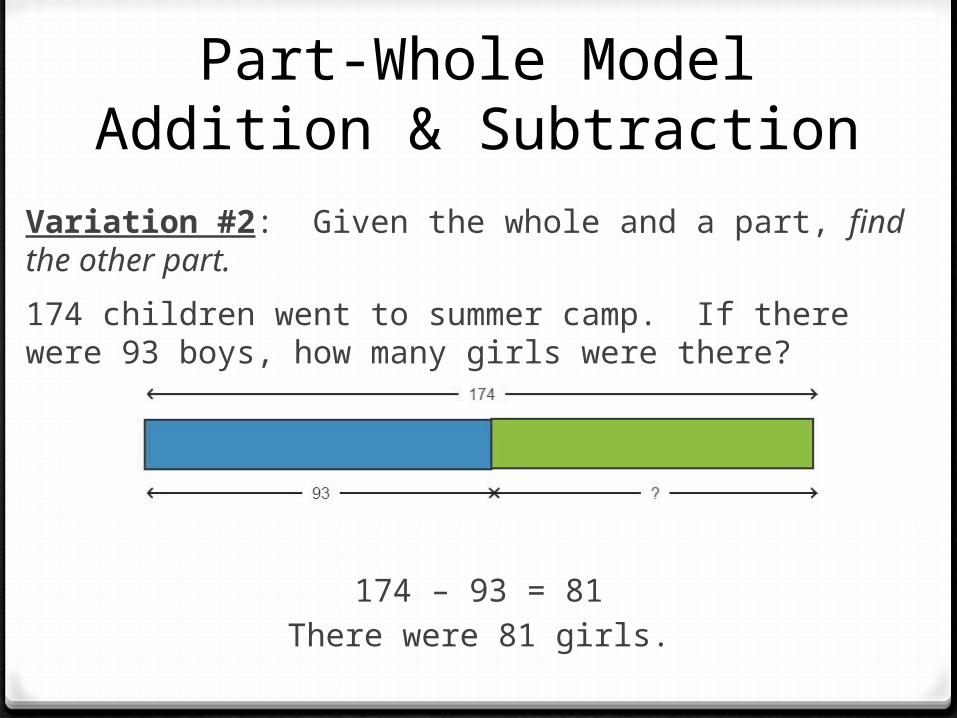
Part-Whole ModelAddition & Subtraction
Variation #2: Given the whole and a part, find the other part.174 children went to summer camp. If there were 93 boys, how many girls were there?
174 – 93 = 81There were 81 girls.

Example #1Shannon has 5 candy bars. Her friend, Meghan, brings her 4 more candy bars. How many candy bars does Shannon have now?

Example #2Chris has 16 matchbox cars. Mark brings him 4 more matchbox cars. How many matchbox cars does Chris have now?

Example #3Caleb brought 4 pieces of watermelon to a picnic. After Justin brings him some more pieces of watermelon, he has 9 pieces. How many pieces of watermelon did Justin bring Caleb?

The Comparison Model
There are 6 dogs. There are 2 more dogs than cats. The difference between the two numbers is 2. There are 4 cats.

The Comparison Model Addition & Subtraction
larger quantity – smaller quantity = difference
smaller quantity + difference = larger quantity

Example #4Tracy had 328 Jolly Ranchers. She gave 132 Jolly Ranchers to her friend. How many Jolly Ranchers does Tracy have now?

Example #5Anthony has 5 baseball cards. Jeff has 2 more cards than Anthony. How many baseball cards do Anthony and Jeff have altogether?

Part-Whole Model Multiplication & Division
one part x number of parts = whole
whole ÷ number of parts = one part
whole ÷ one part = number of parts

Part-Whole Model Multiplication & Division
Variation #1: Given the number of parts and one part, find the whole.5 children shared a bag of candy bars equally. Each child got 6 candy bars. How many candy bars were inside the bag?
5 x 6 = 30The bag contained 30 candy bars.

Part-Whole Model Multiplication & Division
Variation #2: Given the whole and the number of parts, find the missing part.5 children shared a bag of 30 candy bars equally. How many candy bars did each child receive?
30 ÷ 5 = 6Each child received 6 candy bars.

Part-Whole Model Multiplication & Division
Variation #3: Given the whole and one part, find the missing number of parts.A group of children shared a bag of 30 candy bars equally. They received 6 candy bars each. How many children were in the group?
30 ÷ 6 = 5There were 5 children in the group.

The Comparison Model Multiplication & Division
larger quantity ÷ smaller quantity = multiplesmaller quantity x multiple = larger quantitylarger quantity ÷ multiple = smaller quantity

The Comparison Model Multiplication & Division
Variation #1: Given the smaller quantity and the multiple, find the larger quantity.A farmer has 7 cows. He has 5 times as many horses as cows. How many horses does the farmer have?
5 x 7 = 35The farmer has 35 horses.

The Comparison Model Multiplication & Division
Variation #2: Given the larger quantity and the multiple, find the smaller quantity.A farmer has 35 horses. He has 5 times as many horses as cows. How many cows does he have?
35 ÷ 5 = 7The farmer has 7 cows.

The Comparison Model Multiplication & Division
Variation #3: Given two quantities, find the multiple.A farmer has 7 cows and 35 horses. How many times as many horses as cows does he have?
35 ÷ 7 = 5The farmer has 5 times as many horses as cows.

Example #6Scott has 4 ties. Frank has twice as many ties as Scott. How many ties does Frank have?

Example #7Jack has 4 pieces of bubble gum. Michelle has twice as many pieces of bubble gum than Jack. How many pieces of bubble gum do they have altogether?

Example #8Sean’s weight is 40 kg. He is 4 times as heavy as his younger cousin Louis. What is Louis’ weight in kilograms?

Example #9Tiffany has 8 more pencils than Edward. They have 20 pencils altogether. How many pencils does Edward have?

Example #10The total weight of a soccer ball and 10 golf balls is 1 kg. If the weight of each golf ball is 60 grams, find the weight of the soccer ball.

Example #11Two bananas and a mango cost $2.00. Two bananas and three mangoes cost $4.50. Find the cost of a mango.

Part-Whole Model Fractions
To show a part as a fraction of a whole:
Here, the part is of the whole.

Part-Whole ModelFractions
means + + , or 3 x

Part-Whole ModelFractions
4 units = 12
1 unit = = 3 3 units = 3 x 3 = 9
There are 9 objects in of the whole.

Part-Whole ModelFractions
3 units = 9
1 unit = = 3 4 units = 4 x 3 = 12
There are 12 objects in the whole set.

Part-Whole ModelFractions
Variation #1: Given the whole and the fraction, find the missing part of the fraction.Ricky bought 24 cupcakes. of them were white. How many white cupcakes were there?
3 units = 241 unit = 24 ÷ 3 = 8 2 units = 2 x 8 = 16
There were 16 white cupcakes.

Part-Whole ModelFractions
Now, find the other part …Ricky bought 24 cupcakes. of them were white. How many cupcakes were not white?
3 units = 24 1 unit = 24 ÷ 3 = 8
There were 8 cupcakes that weren’t white.
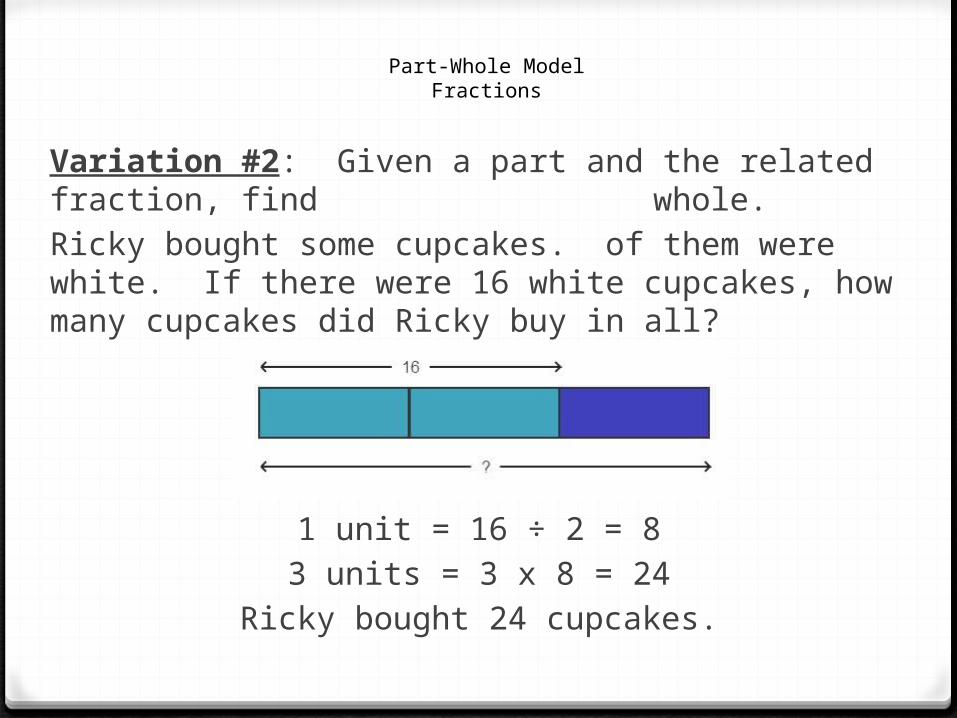
Part-Whole ModelFractions
Variation #2: Given a part and the related fraction, find whole.Ricky bought some cupcakes. of them were white. If there were 16 white cupcakes, how many cupcakes did Ricky buy in all?
2 units = 161 unit = 16 ÷ 2 = 83 units = 3 x 8 = 24
Ricky bought 24 cupcakes.
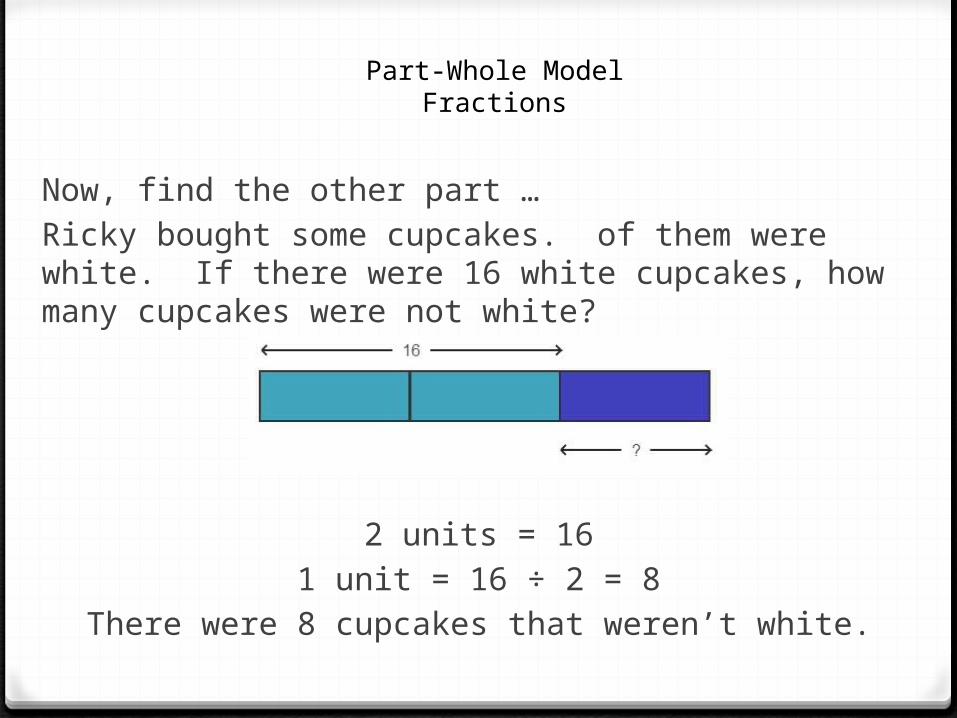
Part-Whole ModelFractions
Now, find the other part …Ricky bought some cupcakes. of them were white. If there were 16 white cupcakes, how many cupcakes were not white?
2 units = 161 unit = 16 ÷ 2 = 8
There were 8 cupcakes that weren’t white.

The Comparison Model Fractions
A is 5 times as much as B. Thus, A is 5 times B. (A = 5 x B)
B is as much as A. Thus, B is of A.We can also express this relationship as:
B is times A. (B = x A)

The Comparison Model Fractions
There are as many boys as girls. If there are 75 girls, how many boys are there?
5 units = 751 unit = 75 ÷ 5 = 153 units = 3 x 15 = 45
There are 45 boys.

The Comparison Model Fractions
Variation #1: Find the sum.There are as many boys as girls. If there are 75 girls, how many children are there altogether?
5 units = 751 unit = 75 ÷ 5 = 15
8 units = 8 x 15 = 120There are 120 children altogether.

The Comparison Model Fractions
Variation #2: Find the difference.There are as many boys as girls. If there are 75 girls, how many more girls than boys are there?
5 units = 751 unit = 75 ÷ 5 = 152 units = 2 x 15 = 30
There are 30 more girls than boys.

The Comparison Model Fractions
Variation #3: Given the sum and the fraction, find a missing quantityThere are as many boys as girls. If there are 120 children altogether, how many girls are there?
8 units = 1201 unit = 120 ÷ 8 = 155 units = 5 x 15 = 75
There are 75 girls.

Example #12Markel spent of his money on a remote control car. The remote control car cost $20. How much did he have at first?

Example #13Dana bought some chairs. One third of them were red and one fourth of them were blue. The remaining chairs were yellow. What fraction of the chairs were yellow?

Example #14Jason had 360 toy action figures. He sold of them on Monday and of the remainder on Tuesday. How many action figures did Jason sell on Tuesday?

Example #15Tina spent of her money in a one shop and of the remainder in another shop. What fraction of her money was left? If he had $90 left, how much did he have at first?

Example #16Jacob bought 280 blue and red paper cups. He used of the blue ones and of the red ones at a party. If he had an equal number of blue cups and red cups left over, how many cups did he use altogether?

Opening Question Revisited …
34
20
Boys Girls
Wore goggles
Children at swim camp
Did not wear goggles
54
34
Wore goggles 14
94
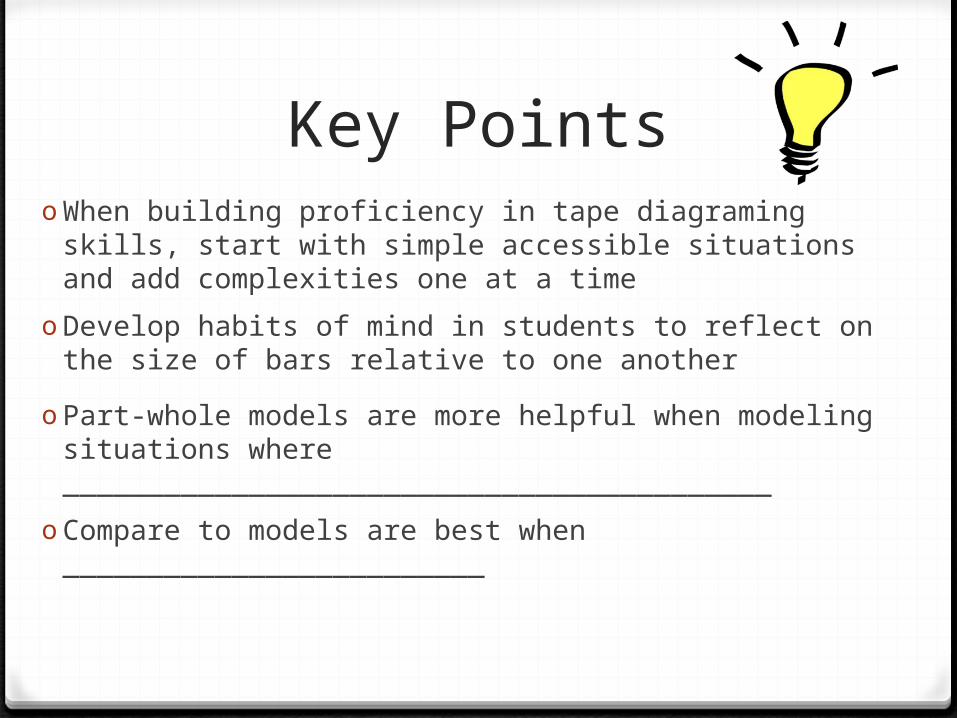
Key PointsoWhen building proficiency in tape diagraming skills, start
with simple accessible situations and add complexities one at a time
oDevelop habits of mind in students to reflect on the size of bars relative to one another
o Part-whole models are more helpful when modeling situations where __________________________________________
oCompare to models are best when _________________________

Exploring Module 1 Activities

Next Steps … oWhat’s your next critical move?
oHow do you build capacity within your district to ensure the successful implementation of tape diagram?
Drawing your own Tape Diagram: http://ultimath.com/whiteboard.php

Name: _______________________________Date: Thursday, August 8th
Using Tape Diagrams: K - 5
Example Booklet
Sean VanHatten – IES, Staff Development Specialist (Mathematics) [email protected]
Tracey Simchick – IES, Staff Development Specialist (Mathematics & Science)[email protected]