tapping environmental accounting potentials of beer brewing: information needs for successful...
TRANSCRIPT
at SciVerse ScienceDirect
Journal of Cleaner Production 29-30 (2012) 1e10
Contents lists available
Journal of Cleaner Production
journal homepage: www.elsevier .com/locate/ jc lepro
Tapping environmental accounting potentials of beer brewingInformation needs for successful cleaner production
Stefan Schaltegger*, Tobias Viere 1, Dimitar Zvezdov 1
Centre for Sustainability Management, Leuphana University Lüneburg, D-21335 Lüneburg, Germany
a r t i c l e i n f o
Article history:Received 8 September 2011Received in revised form1 February 2012Accepted 10 February 2012Available online 20 February 2012
Keywords:Environmental management accountingMaterial flowCleaner ProductionEco-efficiencyCase study
* Corresponding author. Tel.: þ49 4131 677 2180; fE-mail address: [email protected] (S. S
1 Tel.: þ49 4131 677 2180; fax: þ49 4131 677 2186
0959-6526/$ e see front matter � 2012 Elsevier Ltd.doi:10.1016/j.jclepro.2012.02.011
a b s t r a c t
Improving established production processes towards Cleaner Production can be a demanding challengeas the actors involved in these processes e both management and technical staff e often need a freshperspective on how business and the business environment are developing. Whether existing potentialsare effectively and efficiently uncovered largely depends on the availability of information as well as onknowing how to make use of it. An often observed problem is the lack of tools to obtain useful CleanerProduction information efficiently. Against the background of a case study of a major Vietnamese beerproducer, this paper highlights the importance of decision-making information and demonstrates howconsiderable performance improvement potentials can be uncovered using environmental managementaccounting (EMA) techniques and tools. Particular attention is paid to the information needs of thevarious users of such information and how these needs can be fulfilled. The analysis of the resultssuggests a pattern of action that increases the efficacy and efficiency of information management and usein corporate practice.
� 2012 Elsevier Ltd. All rights reserved.
1. The role of information in improving economic andenvironmental performance
An inherent objective of conventional management activities isto (continuously) improve the economic efficiency of the company.Environmental management in turn aims at improving environ-mental performance which ideally should result in economicimprovements at the same time. Empirical research indicates thatsignificant efficiency improvement potentials exist with regard toboth, environmental and economic performance, particularly in theproducing industry (e.g. Jasch, 2009; Schaltegger et al., 2008;Hallstedt et al., 2010).
In this context, Cleaner Production (CP) has shown to bea valuable approach to improving economic performance byconsidering the impacts of the business on the environment andvice versa (e.g. Hobbs, 2000). Although various approaches exist forCP (Jasch, 2006), their applicability depends on available andretrievable information in the company where CP is applied.However, managers pursuing CP often seem to be hindered by thelack of tools which provide information and support decision
ax: þ49 4131 677 2186.chaltegger)..
All rights reserved.
making. A major challenge is thus the acquisition and interpreta-tion of available CP information (see e.g. Jasch, 2006).
Although the information availability problem is generic andapplies to corporate practice as a whole (e.g. Scavone, 2006), in-depth research on information needs of decision makers hasdeveloped only recently (e.g. da Silva and Amaral, 2009). To betterunderstand the environmental and economic information needsof decision makers and how these needs can be met by internalinformation providers an environmental management accounting(EMA) framework has been proposed by Burritt et al. (2002). Thisframework distinguishes 16 different types of decision situations,based on core attributes of the information used such as time frameand routineness of generation. However, this framework, like themultitude of proposed environmental accounting tools, does notexplain the processes how corporate decision makers design theirenvironmental information management and use processes.
Against the background of a case study conducted in the Viet-namese beer brewing facility of Sai Gon Beer, this paper focuses onthe challenge of identifying what information can serve the needsof managers in the course of applying CP and how relevant infor-mation can be provided at a minimum cost. For a discussion of thecase study approach in general see Yin (2009), in managementaccounting research see e.g. Kaplan (1986), Parker (1994) or Ryanet al. (2002), and in EMA see e.g. Burritt et al. (2009) or Gale(2006). In particular, this case study looks into the decision
S. Schaltegger et al. / Journal of Cleaner Production 29-30 (2012) 1e102
situations that arise when applying material and energy flowaccounting for corporate decision making and identifies suitabletools for providing the required decision-making information aswell as for reducing the cost of doing this. The example of a Viet-namese company is particularly interesting as various authors haveoutlined the higher potential of CP for economic and environmentalimprovement of activities in developing countries (e.g. Burritt et al.,2009). The higher potentials have been explained with external(e.g. economic and political conditions) and internal factors such aslack of know-how and resources (e.g. Lee et al., 1999). This paperfocuses on internal factors.
Section 2 provides an overview of different EMA decision situa-tions, discusses the settings of doing research in developing coun-tries, and explains the relevance of analysing improvementpotentials of beer production. Section 3 presents the methods andthe research approach adopted. The core of this paper is Section 4,which demonstrates how EMA was used to support the process ofdesigningand implementingCPat the case studycompanyandwhatcan be learned from the case. Section 5 concludes with the mainimplications and observations in applying EMA tools to support CP.
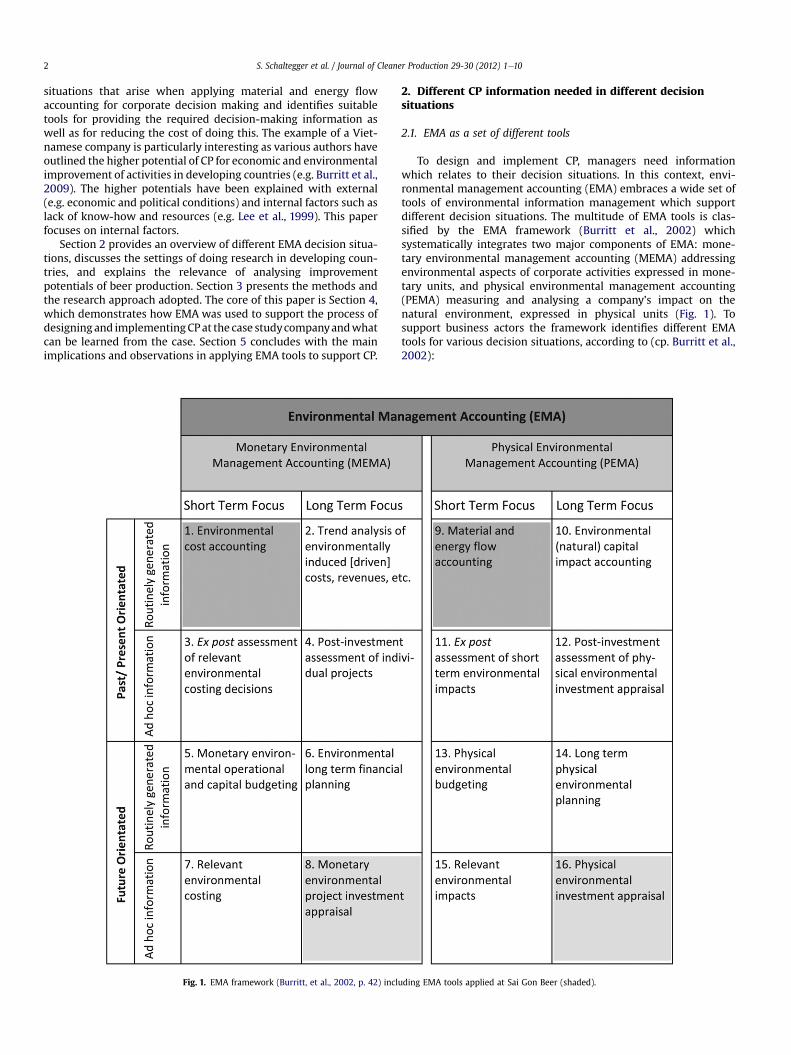
Fig. 1. EMA framework (Burritt, et al., 2002, p. 42) incl
2. Different CP information needed in different decisionsituations
2.1. EMA as a set of different tools
To design and implement CP, managers need informationwhich relates to their decision situations. In this context, envi-ronmental management accounting (EMA) embraces a wide set oftools of environmental information management which supportdifferent decision situations. The multitude of EMA tools is clas-sified by the EMA framework (Burritt et al., 2002) whichsystematically integrates two major components of EMA: mone-tary environmental management accounting (MEMA) addressingenvironmental aspects of corporate activities expressed in mone-tary units, and physical environmental management accounting(PEMA) measuring and analysing a company’s impact on thenatural environment, expressed in physical units (Fig. 1). Tosupport business actors the framework identifies different EMAtools for various decision situations, according to (cp. Burritt et al.,2002):
uding EMA tools applied at Sai Gon Beer (shaded).
S. Schaltegger et al. / Journal of Cleaner Production 29-30 (2012) 1e10 3
� the type of information e monetary or non-monetary (phys-ical) information;
� the time framee past or future: looking at whether the focus ofthe decision is oriented towards measuring past performanceor making decisions for the future;
� the length of time frame e short or long term: whether thedecision setting involves strategic information concerningseveral years or whether it is more operational, thus coveringa shorter period such as months, weeks or days, and
� the routineness of information provision e regular or ad hoc:whether the required information is gathered regularly fora recurring purpose or only when required, e.g. to supporta specific and non-recurring need.
The framework serves for conceptual classification purposes butalso provides a pragmatic structure for the identification of theappropriate EMA tool for any given corporate decision setting. Itcan therefore serve as a basis for managers and staff to reflectwhether an EMA tool already in use is the most appropriate one forthe intended decision-making purposes.
From an organisational and methodological point of view,environmental aspects have often been dealt with in parallelorganisational structures and departments separate from conven-tional business management (Schaltegger and Burritt, 2005). Thisdetachment of environmental responsibilities can result in inade-quate attention of complementarities and conflicts with other partsof the organisation (e.g. Herzig et al., 2006). Furthermore, it canlead to a total or at least partial failure to address environmentalissues (ibid.).
With its concepts and tools, EMA may provide a good startingpoint for a successful integration in the organisation. EMA toolsoffer the opportunity to analyse the environmental impacts of thecompany on the natural environment, and address the environ-mentally driven monetary impacts on the company. By linkingenvironmental issues with conventional management tools, EMAavoids the establishment of environmental management systemsand tools which are rarely connected with day-to-day business andwhich run parallel to already existing corporate managementsystems. Furthermore, whereas it may seem to be a luxury privilegeof developed countries to discuss the optimal choice of EMA tools tosupport CP, the same issues can be a question of economic andenvironmental survival in developing countries.
2.2. CP research in developing countries
Developing countries face greater difficulties in implementingCP than developed countries (e.g. Gale, 2006) because they usuallydo not have the institutional capacity in place to promote envi-ronmental protection, or to encourage the inclusion of environ-mental costs in decision making (Davy, 1997, p. 179; Burritt et al.,2009). A growing part of global industrial production takes placein Southeast Asia. This is particularly true for, amongst others,globally traded goods such as textiles, electronic goods and plastics(cp. CIA, 2011 for statistics on Southeast Asian countries).
With the accompanying production growth of food, paper, andmobility for domestic consumption, the Southeast Asian region ischaracterised both by rapid economic growth and increasingenvironmental problems. Countries in the region have shownsubstantial annual economic growth rates in recent years, boostingpurchasing power and consumption along with significantlyincreasing energy consumption, traffic volume, waste disposal, andenvironmental impacts (ibid.). Decoupling environmental impactsfrom economic growth, a prerequisite for sustainable development(Weizsäcker et al., 1997), seems to be a distant prospect as “incre-mental improvements in environmental regulatory policy typically
have been over-ridden by the scale effects of increased production,consumption and resource use” (Angel and Rock, 2003, p. 4).
A typical example of this development is the Vietnamese beerindustry with its rapid growth of production and consumption. Theannual beer output grew from 8.7 million hl in 2002 to 17million hlin 2006, an annual growth rate of 18%. The Ministry of Industryannounced plans to double this output by the end of 2010 up to 35million hl, and predicted a beer consumption of 28 l per capita,expecting it to double compared to the 2006 consumption of 15 l(cp. Mekong Securities, 2007; Datamonitor, 2008; Timberlake,2010). This fast growth of the beer industry has been fostered bythe Vietnamese government by privatising the biggest breweriesprior to encouraging international brewing companies such asCarlsberg and Anheuser Busch to establish joint ventures as theVietnamese laws do not allow for 100% foreign investment(Mekong Securities, 2007).
2.3. Beer: untapped economic and environmental potential inproduction
Beer was one of the first good whose production was mecha-nised during the industrial revolution. In comparison to pharma-ceutical, petrochemical or other industrial products, brewing beeris usually not considered to be particularly harmful to the envi-ronment since it uses only natural ingredients e typically malt,barley, hops andwater. However, a closer look at the environmentallife cycle of beer reveals its environmental importance (Cordellaet al., 2008; Narayanaswamy et al., 2005; Talve, 2001). By far thelargest ecological impacts are caused by agricultural processes toproduce the basic ingredients of beer. According to Talve (2001, p.297, Table 3), the agricultural production contributes almost 80%to the total environmental impact of the beer life cycle, followed bytransportation (w8%), production of auxiliaries (w6%), and beerproduction (w5%). From a life-cycle perspective, brewers are notthe focal point for environmental improvement: “[.] beerproduction did not seem to be a problematic activity, consistentwith the widely held opinion that breweries have to be consideredas small energy consuming and less polluting companies in theindustrial sector” (Cordella et al., 2008, p. 137).
Numerous life-cycle assessment (LCA) studies on beer produc-tion, however, conclude that certain aspects of beer productionhave a significant environmental impact, in particular in terms ofenergy consumption and the related environmental contribution toglobal warming. A weighted assessment of all environmentalimpacts by Talve (2001, p. 297, Table 3) shows that the globalwarming contribution (GWC) is the most important environmentalimpact of brewing, contributing to roughly one third of the overalllife cycle’s GWC. Given that other life-cycle steps are more impor-tant in general and energy use is the crucial issue for brewers,Cordella et al. (2008, p. 139) arrive at the following recommenda-tions for environmental management measures of breweries:
� “monitoring, registering and analysing the input and theoutput streams of the brewery system;
� choosing carefully the suppliers, especially those of barley andglass bottle;
� improving energy saving policies;� optimizing solutions for the product delivery;� setting up marketing strategies in favour of reusable packagingrather than non-returnable ones”.
This paper thus investigates the use of EMA for applying a CPmethodology in optimising beer production. From a globalperspective, beer consumption and production is decreasing indeveloped countries but increasing strongly in many developing
S. Schaltegger et al. / Journal of Cleaner Production 29-30 (2012) 1e104
countries (Timberlake, 2010; Talve, 2001). This is why CP and themeasurement of environmental impacts and related economiceffects are of major relevance for the beer production in developingcountries with a high growth in beer production, and often withshortages of electric power, water, and raw materials.
3. Research approach
The analysis conducted in Section 4 is based on the results ofa four-year case study research project on environmentalmanagement accounting in Southeast Asian small and medium-sized companies. Beside their wide-spread application for teachingpurposes, case studies have become quite common in managementaccounting research in general (Ryan et al., 2002) and in EMAresearch in particular (e.g. Burritt, 2004).
This case study based project investigated the applicability ofEMA tools for management decision making and accountability bydifferent groups of management, and in different organisations.Based on the EMA framework (Burritt et al., 2002) the projectanalysed the process of establishing environmental informationmanagement with EMA tools. In total 16 in-depth company casestudies were conducted in Indonesia, the Philippines, Thailand andVietnam. These case studies were designed to contribute toa comparative research (Yin, 2009) analysing decision-makingsituations and potentials for EMA implementation in businesses indeveloping countries. In addition, factors influencing the applica-tion of EMA tools were analysed. Thus this case study of the Viet-namese beer brewer Sai Gon Beer dealt with here, is embedded ina broader context of exploring different decision situations. Giventhe higher proportion of energy and material costs (due to lowerlabour costs compared to industrialised countries) to the overallcosts in Vietnamese settings, it was expected that applying CP islikely to result in relatively high economic and environmentalperformance improvement.
The case study research designwas chosen to better understandcomplex decision-making processes and contexts and to examineand explain their outcomes. This case-orientated approach analysesthe specific types of environmental datawhichmanagers of variousbusiness functions may need when making decisions in differentdecision situations.
Based on the EMA framework the specific decision-makingcontext of the company was analysed to identify the most suitableEMAtool(s). Thiswas donebyasking companymanagers about theirdecision situations and information needs. The managers were notaware of the EMA framework until the case study was finalised.Rather than elaborating on the usefulness of specific EMA methodsfor variousbusinesses, the researchapproaches EMAby focussingonthe needs and the specific decision situations company managersface. This approach helps explore current practice, increase thebenefitof EMAformanagement andmeet the realityofmanagementaccounting, where internal decisions about varied and ratherdifferent issues have to be prepared, assessed, and made indepen-dent of predefined systems or standardised tools.
To capture a wide range of phenomena and for the purpose ofdata triangulation, the study drew from multiple data sourcesincluding:
� a large spectrum of contact persons (environmental, produc-tion, and financial managers, accountants, representativesfrom environmental and industry associations such as, forinstance, chambers of commerce);
� a variety of research methods (direct observation, documen-tation, archival records, interviews, and questionnaires);
� different groupings of researchers (interviewing and observingin pairs) and
� various cases within and between sectors (e.g. electroplating,food, paper and pulp, etc.).
The case studies were conductedwith the help of so-called ‘localresource persons’ who were involved in conducting the casestudies to promote EMA in Southeast Asia. These were mainlyenvironmental management and engineering consultants as wellas trainersmultiplying EMA knowledge and experience they gainedfrom the case studies. The following case study of Sai Gon Beerillustrates the EMA approach to identify CP potentials in beerbrewing, its strengths and weaknesses.
4. Applying EMA for CP
4.1. The case of Sai Gon Beer
Sai Gon Beer was established as an equity joint venture of one ofthe largest and former state-owned brewing companies anda newly privatised Vietnamese importeexport company, witha total capital investment of roughly V 5 million. The joint venturecompany started its production of bottled and barrelled beer in1999. Employing some 200 people, the brewery has increased beeroutput year by year up to almost 200,000 hl/a, with plans to growfurther. This required the construction of an additional brewingfacility which was in planning when the case study was conducted.
Themanagement considers Sai Gon Beer to be an “environmentalflagship company” of central Vietnam. The company uses state-of-the-art brewing equipment andhas implemented an environmentalmanagement system which led to proper waste separation, recy-cling of broken bottles and other materials, wastewater treatment,etc. Consequently, Sai Gon Beerwas certified in accordance with ISO9001 and ISO 14001 and does not face any legal penalties relating toenvironmental issues. It haswon several Vietnamese quality awardsfor its products. Furthermore, as stated in its environmentalmanagement report, the company is motivated to reduce its envi-ronmental impacts such as the use of water, energy consumption,noise, dust, and pollutants in effluent wastewater.
The production facilities of Sai Gon Beer were constructed in1998. Almost the entire brewing equipment was imported fromGerman suppliers and installed by a German engineering company.Beer is filled in bottles and kegs and delivered to retailers witha small portion going to large customers such as restaurants in theTuy Hoa province. The company operates a return system for bottlesand kegs, i.e. empty bottles and kegs are collected, sorted andwashed.
The main production steps include grinding (of malt and rice),brewing, fermentation, filtration and storage, and keg and bottlefilling. All steps include various detail processes and activities.Unlike most European and North American breweries, Sai Gon Beeruses rice instead of barley as one of the main beer ingredients.Important supply or utility processes from an environmental pointof view include chilling, air compressing, heat supply (boiler), andwastewater treatment. These activities require facilities and devicessuch as the office building, the air conditioning system of thefactory building, etc.
4.2. In-plant assessment
As a first impression of its economic performance, Sai Gon Beerprovided the budgeted and the actual figures for sales and net profit(Table 1). While the company met its sales targets, it failed to meetthe net profit target. The accounting department identified themain culprit: higher than expected operational expenses on rawmaterials and energy.
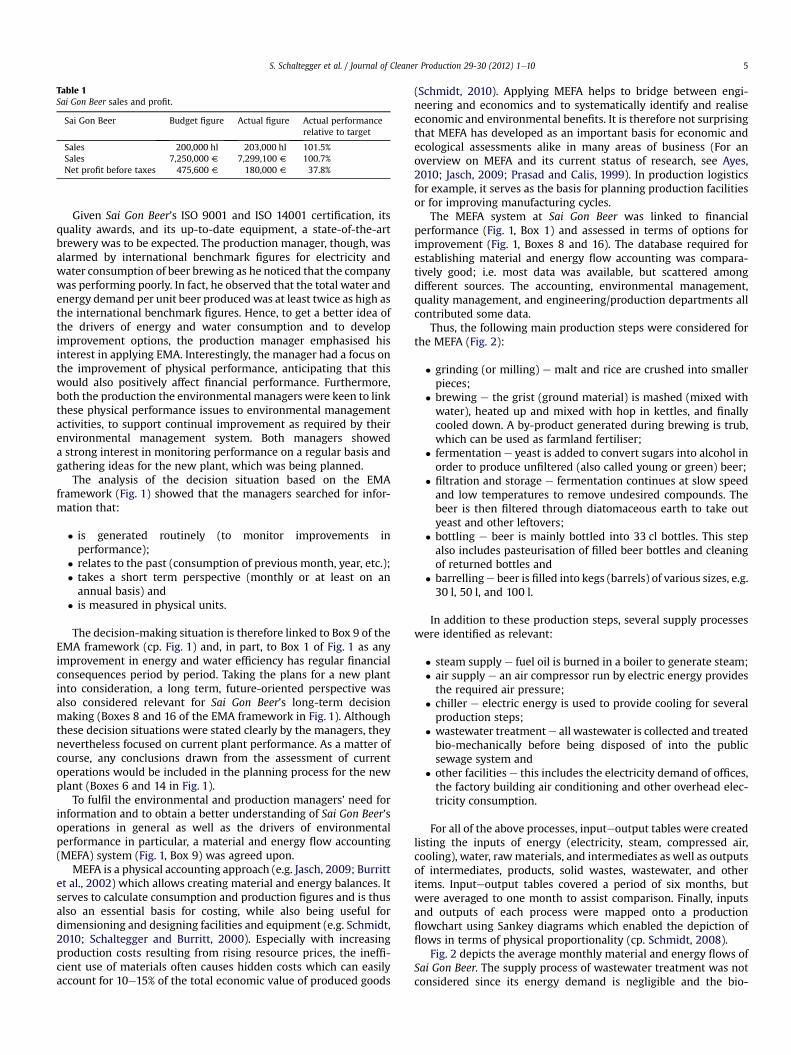
Table 1Sai Gon Beer sales and profit.
Sai Gon Beer Budget figure Actual figure Actual performancerelative to target
Sales 200,000 hl 203,000 hl 101.5%Sales 7,250,000 V 7,299,100 V 100.7%Net profit before taxes 475,600 V 180,000 V 37.8%
S. Schaltegger et al. / Journal of Cleaner Production 29-30 (2012) 1e10 5
Given Sai Gon Beer’s ISO 9001 and ISO 14001 certification, itsquality awards, and its up-to-date equipment, a state-of-the-artbrewery was to be expected. The production manager, though, wasalarmed by international benchmark figures for electricity andwater consumption of beer brewing as he noticed that the companywas performing poorly. In fact, he observed that the total water andenergy demand per unit beer produced was at least twice as high asthe international benchmark figures. Hence, to get a better idea ofthe drivers of energy and water consumption and to developimprovement options, the production manager emphasised hisinterest in applying EMA. Interestingly, the manager had a focus onthe improvement of physical performance, anticipating that thiswould also positively affect financial performance. Furthermore,both the production the environmental managers were keen to linkthese physical performance issues to environmental managementactivities, to support continual improvement as required by theirenvironmental management system. Both managers showeda strong interest in monitoring performance on a regular basis andgathering ideas for the new plant, which was being planned.
The analysis of the decision situation based on the EMAframework (Fig. 1) showed that the managers searched for infor-mation that:
� is generated routinely (to monitor improvements inperformance);
� relates to the past (consumption of previous month, year, etc.);� takes a short term perspective (monthly or at least on anannual basis) and
� is measured in physical units.
The decision-making situation is therefore linked to Box 9 of theEMA framework (cp. Fig. 1) and, in part, to Box 1 of Fig. 1 as anyimprovement in energy and water efficiency has regular financialconsequences period by period. Taking the plans for a new plantinto consideration, a long term, future-oriented perspective wasalso considered relevant for Sai Gon Beer’s long-term decisionmaking (Boxes 8 and 16 of the EMA framework in Fig. 1). Althoughthese decision situations were stated clearly by the managers, theynevertheless focused on current plant performance. As a matter ofcourse, any conclusions drawn from the assessment of currentoperations would be included in the planning process for the newplant (Boxes 6 and 14 in Fig. 1).
To fulfil the environmental and production managers’ need forinformation and to obtain a better understanding of Sai Gon Beer’soperations in general as well as the drivers of environmentalperformance in particular, a material and energy flow accounting(MEFA) system (Fig. 1, Box 9) was agreed upon.
MEFA is a physical accounting approach (e.g. Jasch, 2009; Burrittet al., 2002) which allows creating material and energy balances. Itserves to calculate consumption and production figures and is thusalso an essential basis for costing, while also being useful fordimensioning and designing facilities and equipment (e.g. Schmidt,2010; Schaltegger and Burritt, 2000). Especially with increasingproduction costs resulting from rising resource prices, the ineffi-cient use of materials often causes hidden costs which can easilyaccount for 10e15% of the total economic value of produced goods
(Schmidt, 2010). Applying MEFA helps to bridge between engi-neering and economics and to systematically identify and realiseeconomic and environmental benefits. It is therefore not surprisingthat MEFA has developed as an important basis for economic andecological assessments alike in many areas of business (For anoverview on MEFA and its current status of research, see Ayes,2010; Jasch, 2009; Prasad and Calis, 1999). In production logisticsfor example, it serves as the basis for planning production facilitiesor for improving manufacturing cycles.
The MEFA system at Sai Gon Beer was linked to financialperformance (Fig. 1, Box 1) and assessed in terms of options forimprovement (Fig. 1, Boxes 8 and 16). The database required forestablishing material and energy flow accounting was compara-tively good; i.e. most data was available, but scattered amongdifferent sources. The accounting, environmental management,quality management, and engineering/production departments allcontributed some data.
Thus, the following main production steps were considered forthe MEFA (Fig. 2):
� grinding (or milling) e malt and rice are crushed into smallerpieces;
� brewing e the grist (ground material) is mashed (mixed withwater), heated up and mixed with hop in kettles, and finallycooled down. A by-product generated during brewing is trub,which can be used as farmland fertiliser;
� fermentation e yeast is added to convert sugars into alcohol inorder to produce unfiltered (also called young or green) beer;
� filtration and storage e fermentation continues at slow speedand low temperatures to remove undesired compounds. Thebeer is then filtered through diatomaceous earth to take outyeast and other leftovers;
� bottling e beer is mainly bottled into 33 cl bottles. This stepalso includes pasteurisation of filled beer bottles and cleaningof returned bottles and
� barrellinge beer is filled into kegs (barrels) of various sizes, e.g.30 l, 50 l, and 100 l.
In addition to these production steps, several supply processeswere identified as relevant:
� steam supply e fuel oil is burned in a boiler to generate steam;� air supply e an air compressor run by electric energy providesthe required air pressure;
� chiller e electric energy is used to provide cooling for severalproduction steps;
� wastewater treatmente all wastewater is collected and treatedbio-mechanically before being disposed of into the publicsewage system and
� other facilities e this includes the electricity demand of offices,the factory building air conditioning and other overhead elec-tricity consumption.
For all of the above processes, inputeoutput tables were createdlisting the inputs of energy (electricity, steam, compressed air,cooling), water, rawmaterials, and intermediates as well as outputsof intermediates, products, solid wastes, wastewater, and otheritems. Inputeoutput tables covered a period of six months, butwere averaged to one month to assist comparison. Finally, inputsand outputs of each process were mapped onto a productionflowchart using Sankey diagrams which enabled the depiction offlows in terms of physical proportionality (cp. Schmidt, 2008).
Fig. 2 depicts the average monthly material and energy flows ofSai Gon Beer. The supply process of wastewater treatment was notconsidered since its energy demand is negligible and the bio-
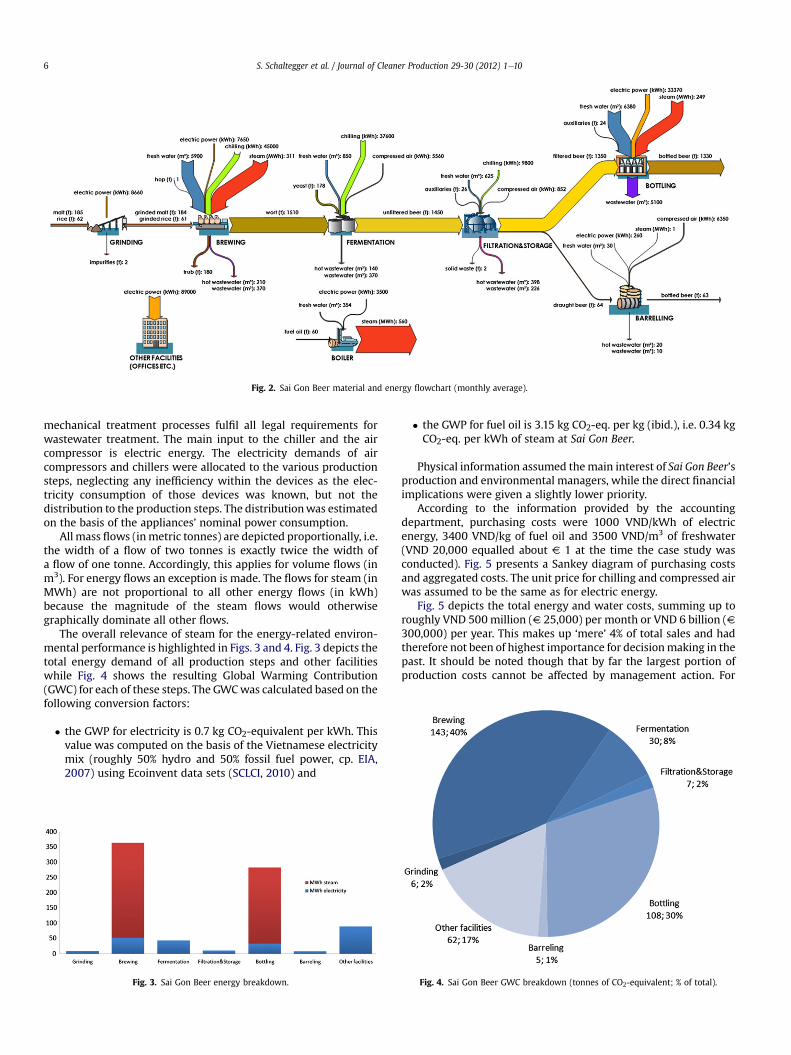
Fig. 2. Sai Gon Beer material and energy flowchart (monthly average).
S. Schaltegger et al. / Journal of Cleaner Production 29-30 (2012) 1e106
mechanical treatment processes fulfil all legal requirements forwastewater treatment. The main input to the chiller and the aircompressor is electric energy. The electricity demands of aircompressors and chillers were allocated to the various productionsteps, neglecting any inefficiency within the devices as the elec-tricity consumption of those devices was known, but not thedistribution to the production steps. The distributionwas estimatedon the basis of the appliances’ nominal power consumption.
All mass flows (inmetric tonnes) are depicted proportionally, i.e.the width of a flow of two tonnes is exactly twice the width ofa flow of one tonne. Accordingly, this applies for volume flows (inm3). For energy flows an exception is made. The flows for steam (inMWh) are not proportional to all other energy flows (in kWh)because the magnitude of the steam flows would otherwisegraphically dominate all other flows.
The overall relevance of steam for the energy-related environ-mental performance is highlighted in Figs. 3 and 4. Fig. 3 depicts thetotal energy demand of all production steps and other facilitieswhile Fig. 4 shows the resulting Global Warming Contribution(GWC) for each of these steps. The GWCwas calculated based on thefollowing conversion factors:
� the GWP for electricity is 0.7 kg CO2-equivalent per kWh. Thisvalue was computed on the basis of the Vietnamese electricitymix (roughly 50% hydro and 50% fossil fuel power, cp. EIA,2007) using Ecoinvent data sets (SCLCI, 2010) and
Fig. 3. Sai Gon Beer energy breakdown.
� the GWP for fuel oil is 3.15 kg CO2-eq. per kg (ibid.), i.e. 0.34 kgCO2-eq. per kWh of steam at Sai Gon Beer.
Physical information assumed themain interest of Sai Gon Beer’sproduction and environmental managers, while the direct financialimplications were given a slightly lower priority.
According to the information provided by the accountingdepartment, purchasing costs were 1000 VND/kWh of electricenergy, 3400 VND/kg of fuel oil and 3500 VND/m3 of freshwater(VND 20,000 equalled about V 1 at the time the case study wasconducted). Fig. 5 presents a Sankey diagram of purchasing costsand aggregated costs. The unit price for chilling and compressed airwas assumed to be the same as for electric energy.
Fig. 5 depicts the total energy and water costs, summing up toroughly VND 500 million (V 25,000) per month or VND 6 billion (V300,000) per year. This makes up ‘mere’ 4% of total sales and hadtherefore not been of highest importance for decisionmaking in thepast. It should be noted though that by far the largest portion ofproduction costs cannot be affected by management action. For
Fig. 4. Sai Gon Beer GWC breakdown (tonnes of CO2-equivalent; % of total).
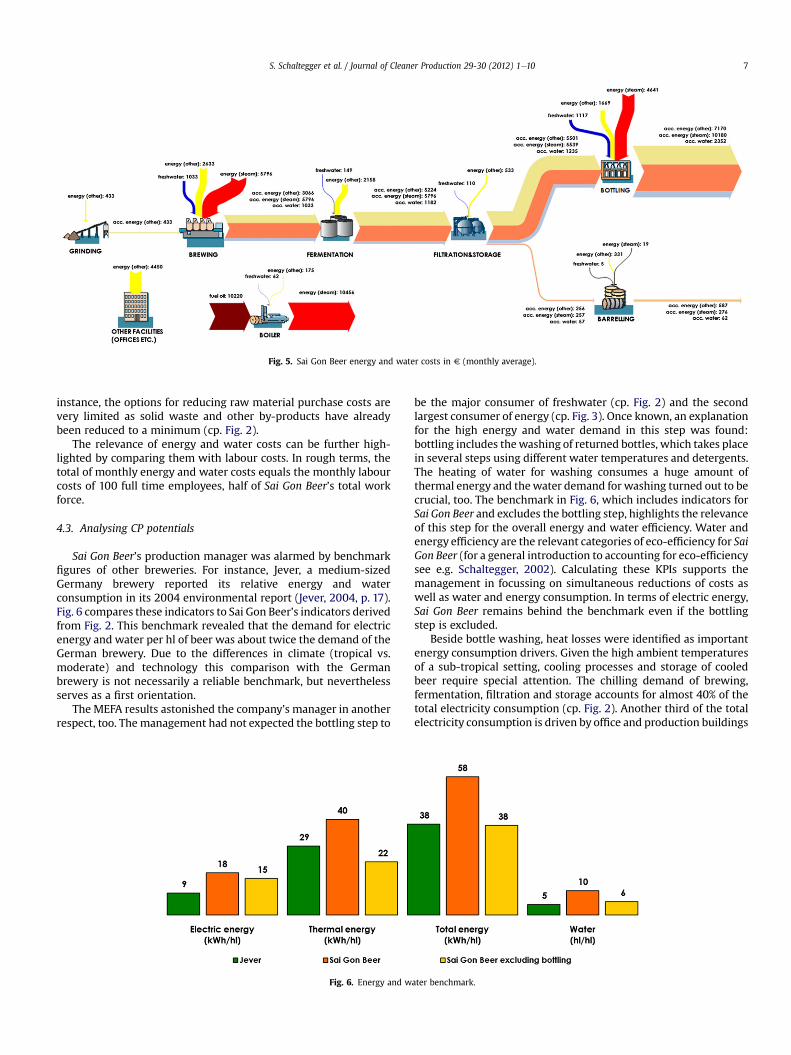
Fig. 5. Sai Gon Beer energy and water costs in V (monthly average).
S. Schaltegger et al. / Journal of Cleaner Production 29-30 (2012) 1e10 7
instance, the options for reducing raw material purchase costs arevery limited as solid waste and other by-products have alreadybeen reduced to a minimum (cp. Fig. 2).
The relevance of energy and water costs can be further high-lighted by comparing them with labour costs. In rough terms, thetotal of monthly energy and water costs equals the monthly labourcosts of 100 full time employees, half of Sai Gon Beer’s total workforce.
4.3. Analysing CP potentials
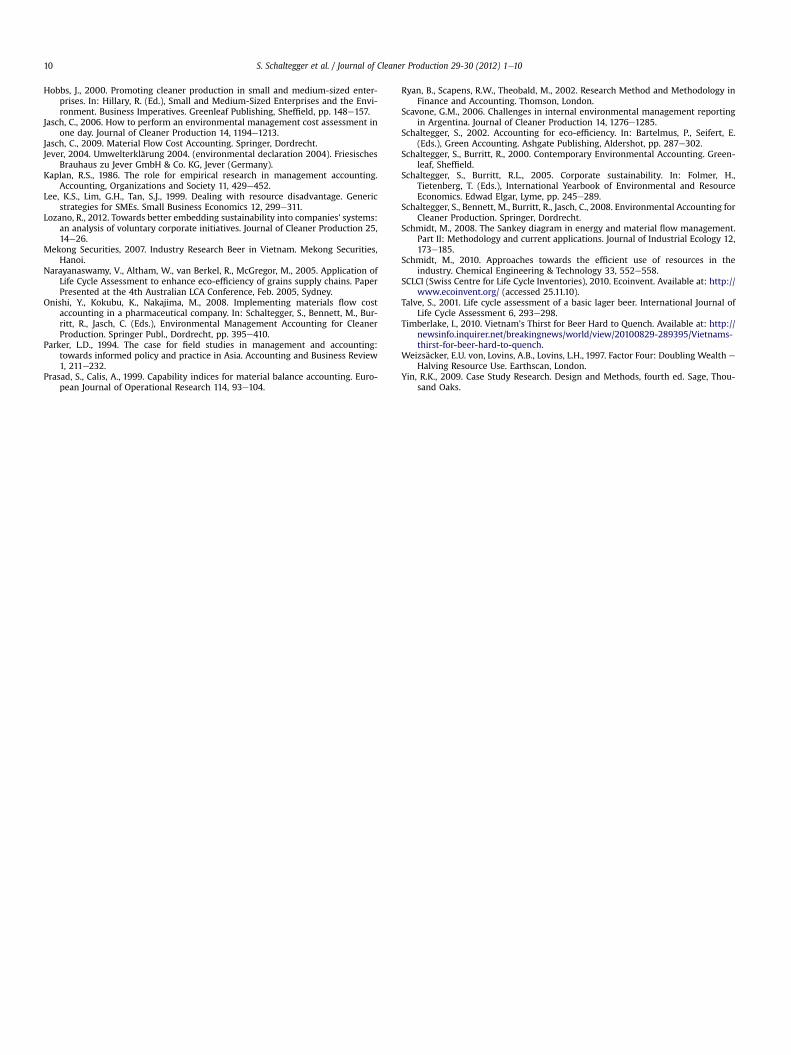
Sai Gon Beer’s production manager was alarmed by benchmarkfigures of other breweries. For instance, Jever, a medium-sizedGermany brewery reported its relative energy and waterconsumption in its 2004 environmental report (Jever, 2004, p. 17).Fig. 6 compares these indicators to Sai Gon Beer’s indicators derivedfrom Fig. 2. This benchmark revealed that the demand for electricenergy and water per hl of beer was about twice the demand of theGerman brewery. Due to the differences in climate (tropical vs.moderate) and technology this comparison with the Germanbrewery is not necessarily a reliable benchmark, but neverthelessserves as a first orientation.
The MEFA results astonished the company’s manager in anotherrespect, too. The management had not expected the bottling step to
Fig. 6. Energy and w
be the major consumer of freshwater (cp. Fig. 2) and the secondlargest consumer of energy (cp. Fig. 3). Once known, an explanationfor the high energy and water demand in this step was found:bottling includes thewashing of returned bottles, which takes placein several steps using different water temperatures and detergents.The heating of water for washing consumes a huge amount ofthermal energy and thewater demand for washing turned out to becrucial, too. The benchmark in Fig. 6, which includes indicators forSai Gon Beer and excludes the bottling step, highlights the relevanceof this step for the overall energy and water efficiency. Water andenergy efficiency are the relevant categories of eco-efficiency for SaiGon Beer (for a general introduction to accounting for eco-efficiencysee e.g. Schaltegger, 2002). Calculating these KPIs supports themanagement in focussing on simultaneous reductions of costs aswell as water and energy consumption. In terms of electric energy,Sai Gon Beer remains behind the benchmark even if the bottlingstep is excluded.
Beside bottle washing, heat losses were identified as importantenergy consumption drivers. Given the high ambient temperaturesof a sub-tropical setting, cooling processes and storage of cooledbeer require special attention. The chilling demand of brewing,fermentation, filtration and storage accounts for almost 40% of thetotal electricity consumption (cp. Fig. 2). Another third of the totalelectricity consumption is driven by office and production buildings
ater benchmark.

S. Schaltegger et al. / Journal of Cleaner Production 29-30 (2012) 1e108
as well as other overhead electricity demand (Fig. 5), most of itresulting from air conditioning. Thus, as a substantial difference tothe German beer brewery Jever, two-thirds of the total electricityconsumption resulted from the provision of cooling energy.
Including energy and water costs into the EMA assessmentsupports the findings of the previously applied MEFA. Brewing andbottling are the most intensive production steps in terms of energyand water costs. Yet, reducing overall costs requires that the effi-ciency of these production steps and the steam supply is improved.Thus, as a next step, the air compressors and chilling units of SaiGon Beer were analysed in detail to identify further CP improve-ment potentials.
The material and energy flow analysis including energy andwater costs allows for comparing bottled and draught beer. Table 2is derived from Figs. 2, 4, and 5 and highlights the environmentaladvantage of draught beer in comparison with bottled beer. Thedifferent energy sources explain the fact that energy and watercosts of draught beer are nevertheless not much lower than thoseof bottled beer. Bottled beer requires comparably more thermalenergy (steam) per hl while draught beer consumes greaterquantities of electric energy, which is more expensive. In any case,comparison supports the conclusion of an Italian LCA study on lagerbeer: “From the previous analysis it turned out that the mosteffective actions to reduce the environmental burdens of the beerlife cycles have to be promoted in the consumption phase, prefer-ring draught beer to bottled one [.]” (Cordella et al., 2008, p. 138).
4.4. Identifying CP improvement options
Based on the information obtained with thematerial and energyflow assessment, several CP improvement options were discussedand presented to Sai Gon Beer’s top management:
� The assessment revealed that a cascade water recycling systemcould be installed to reduce the water and energy consumptionin bottling. For each of the four separate washing steps,freshwater had to be drawn from the tap, heated up with steamor electric energy, and discharged to the wastewater plant. Acascade system would only use freshwater for the finalwashing step and reuse the lightly polluted wastewater of thisstep as water input to the second last washing step. Thewastewater from that second last washing step would serve asinput for the third last step and so on. Such a cascade systemwould reduce freshwater, wastewater and steam demandsubstantially.
� A large energy saving potential was identified in the properinsulation of pipes and tanks, in particular where largetemperature differences exist. For instance, several large beertanks were situated outside in the tropical atmosphere andexposed to direct sunlight, while the beer inside these tankshad to be kept at a temperature below 2 �C. Installing a sunshades over these tanks and improving the tank insulationwere calculated to be profitable and energy saving.
� The bulk of the energy consumption was caused by auxiliaryprocesses, in particular the oil-fired boiler, air compressors, and
Table 2Comparison of the relative resource consumption of bottled and draught beer at SaiGon Beer.
Product CO2-eq.(kg/hl)
Water(hl/hl)
Costs(VND/hl)
Total energy(kWh/hl)
Bottled beer 8.16 4.80 29,600 21.23Draught beer 7.89 0.48 29,400 12.08Ratio bottled
to draught3.4% 907.4% 0.9% 75.8%
the chilling devices. As a consequence, the efficiency of theseprocesses was examined closely, including one-off measure-ments. The boiler, for instance, could use exhaust heat for pre-heating of water instead of using electric energy. Furthermore,the water needed for the steam generation could be preheatedby solar power, e.g. by simply using a black hose on the roof ofthe production facility.
� The aggregated EMA information showed that office buildingsconsumed a considerable amount of energy. Thus, the use ofheat exchangers was evaluated for several processes in thebrewing step and could also be used to reduce the loss ofthermal energy of air conditioners by using the cool exhaust airleaving the office and production buildings to pre-cool theincoming air.
� The results of the EMA based analysis of CP potentials showedthat the environmental management system could be improvedby including more ambitious and specific indicator based targetson energy and water consumption. Targets such as the annual0.5% reduction of energy consumption per unit of product werereplaced by more ambitious ones.
As the topmanagement was pleasedwith the recommendationsit got interested in establishing EMA on a more regular basis toimprove measurements. It furthermore considered including EMAas an assessment tool in the planning process of its new productionplant. Based on these results, Sai Gon Beer commissioned a Japanesecompany to conduct a feasibility study for energy efficiencymeasures at its new plant. The commissioned company recom-mended the establishment of a so-called ‘total energy managementsystem’ in combination with Cleaner Development Mechanismmeasures.
5. Towards more informed decisions for cleaner production
The take-home message of this case study on Sai Gon Beer isthree-fold. Firstly, the case study provides an example thatincreasingly recognized voluntary corporate initiatives such as CP(Lozano, 2012) can be achieved more efficiently on the basis ofrelevant and robust information. EMA and the EMA framework canhelp to identify and create this kind of information. Secondly, thecase study illustrates that EMA is understood, applicable and suit-able to support CP also in a typical setting of a developing country.Thirdly and most importantly, very few case studies on EMA for CPexist for developing countries, compared to a relatively largenumber of case studies in industrialized countries. This imbalancemight trick managers to believe that CP and EMA would be bene-ficial for industrialized countries only. However, as the case studyillustrates, actually the opposite is true. The proportion of materialand energy costs compared to labour cost as part of the totalproduction costs is relatively much higher in developing countriesthan in industrialised countries (Hasanbeigi et al., 2012). Theapplication of EMA for CP thus reveals much higher relative costsaving potentials in developing economies.
As the above case study shows, by using the EMA framework,managers were able to identify their information needs and choosethe most powerful environmental information management toolsin a systematic manner. More importantly, these tools not onlyserve to use information for various decision-making situations butalso support the systematic identification and retrieval of suchinformation.
This case study approach can be seen as a guiding example forintroducing environmental data collection by firstly consideringthe decision situation on basis of the EMA framework. Once themost adequate EMA tools have been identified, applied and valu-able information has been created, management may be motivated

S. Schaltegger et al. / Journal of Cleaner Production 29-30 (2012) 1e10 9
to establish EMA on a more regular basis and to broaden theapplication of different EMA tools. For example Sai Gon Beerestablished a regular collection of environmental data (boxes 3 and1 in Fig. 1) and applied an environmental investment appraisal andplanning (boxes 14 and 16 in Fig. 1) for planning its new productionplant.
The case study may be particularly revealing as for the promo-tion of CP in a company the most relevant research questions are‘how’ and ‘why’ rather than requiring broad statistical analysis (cp.Eisenhardt, 1989; Yin, 2009). This is why this case study illuminatesthe application and implementation process of EMA as a tool for CP.The first units of analysis are the company specific managementdecision situations, which can vary substantially, depending on thecompany’s physical context (e.g. tropical vs. moderate climate), thetype of management activity (investment, operational productionactivity, ex post assessment of a project, etc.), themanagement level(top management, middle management, etc.), the department incharge (accounting, finance, production, environment, etc.), thetime frame, and the risk attitude.
This case study is based on Sai Gon Beer’s written records,personal onsite-inspection, and oral information provided by theenvironmental, production and accounting departments. Dataobtained was compared with figures available in several publi-cations on brewing referenced throughout this study. Based onthese publications the order of magnitude and the generaldirection of the results derived from the data available can beconsidered as reliable. However, the overall completeness anddata quality of the EMA application can only be classified asmedium. In particular, the breakdown of material and energyflows to production and supply processes is based on qualifiedestimates and computations by production managers and engi-neers. Actual measurements, as planned by management afterthey realised the CP potential, could be carried out to improve thereliability of information.
Applying EMA at Sai Gon Beer has helped the production,environmental and accounting departments to identify drivers ofenvironmental performance and related costs. The managementwas surprised to find out that certain steps in the productionprocess such as bottle filling and bottle washing were amongstthe major drivers of water and energy consumption and thusenvironmentally induced costs. As the existing environmentalmanagement system did not break down the physical inputs andoutputs to single production steps and supply processes, this facthad been overlooked prior to conducting the EMA analysis. Acascade water recycling system and several others environmentalimprovements were identified which would easily exceed theenvironmental goals of Sai Gon Beer stated in its environmentalreports. Thus, the case study shows that the introduction of EMAcan create benefits for environmental management systems byproviding a detailed information basis for target setting, planningof improvement measures, and performance monitoring.
The application of EMA at Sai Gon Beer comprised basic MEFAand the breakdown of related energy and water costs. Albeitelementary, the analysis led to the identification of severalimprovement options and made the top management rethink itsenvironmental targets and establish EMA on a more regular basis.This case study thus confirms the experiences of Jasch (2006, 2009)and Onishi et al. (2008) in introducing MEFA and highlights therelevance of EMA also for beer brewing in developing countries.EMA shows particular importance of the MEFA approach, whichenables managers and engineers to break down relevant physicalinformation to separate production steps and supply processes.EMA can help to meet the accounting criteria of materiality, i.e. ithelps to focus on ‘hot-spots’ e those steps and processes with thehighest potential for improvement and the greatest impact on
overall (environmental) performance. This can be done in fourmajor steps. The initial step (i) consists of inspecting material andenergy flows and is followed by (ii) identifying the decision situa-tion when investigating material and energy flows. Based on therelevant decision situation identified, (iii) a corresponding infor-mation management tool from the EMA framework can be chosenand applied to obtain the relevant information to (iv) supportinformed decisions when applying CP. This structured informationacquisition process supports the implementation of CP ina systematic manner.
The case study highlights the importance of considering both,production processes and auxiliary processes. Most of the energyrequired at Sai Gon Beer is related to steam production, a centralboiler, chilling and refrigerating units, as well as compressors.
Overall, the application of EMA at Sai Gon Beer supports thefindings of earlier studies dealing with beer production in devel-oped countries and the beer life cycle: “At the process level,improving the energy and material use efficiency of energy inten-sive equipment could enhance efficiency of production and pro-cessing. There is a clear need to expand the focus of the past andexisting cleaner production efforts, which were mainly focussingon solid waste and dust control towards enhancing energy andresource use efficiency” (Narayanaswamy et al., 2005, pp. 15e16).Given the strong growth rates of the food industry and beerproduction in developing countries the more wide-spread appli-cation of EMA could foster CP where it is needed most.
References
Angel, D.P., Rock, M.T., 2003. Industrial transformation in East Asia. Assessing policyapproaches to improving the environmental performance of industry withinrapidly industrialising economies. IHDP Newsletter of the International HumanDimensions Programme on Global Environmental Change 1, 4e6.
Ayes, D., 2010. Environmental and material flow cost accounting: principles andprocedures. Journal of Cleaner Production 18, 1347e1348.
Burritt, R.L., Hahn, T., Schaltegger, S., 2002. Towards a comprehensive framework forenvironmental management accounting. Links between business actors andenvironmental management accounting tools. Australian Accounting Review12, 39e50.
Burritt, R.L., 2004. Environmental management accounting: roadblocks on the wayto the green and pleasant land. Business Strategy and the Environment 13,13e32.
Burritt, R.L., Herzig, C., Tadeo, B.D., 2009. Environmental management accountingfor cleaner production: the case of a Philippine rice mill. Journal of CleanerProduction 17, 431e439.
CIA e Central Intelligence Agency, 2011. The CIA World Factbook 2011. CIA, Wash-ington DC. Available at: http://www.cia.gov/library/publications/the-world-factbook/.
Cordella, M., Tugnoli, A., Spadoni, G., Santarelli, F., Zangrando, T., 2008. LCA of anItalian lager beer. International Journal of Life Cycle Assessment 13, 133e139.
da Silva, P.R.S., Amaral, F.G., 2009. An integrated methodology for environmentalimpacts and costs evaluation in industrial processes. Journal of CleanerProduction 17, 1339e1350.
Datamonitor, 2008. Beer, Cider and FABs in Vietnam to 2011. Datamonitor, London.Davy, A., 1997. Environmental management systems. ISO 14001 issues for devel-
oping countries. In: Sheldon, C. (Ed.), ISO 14001 and Beyond. EnvironmentalManagement Systems in the Real World. Greenleaf Publishing, Sheffield,pp. 169e182.
EIA (Energy Information Administration) (Ed.), 2007. Vietnam Energy Data, Statis-tics and Analysis. Oil, Gas, Electricity, Coal. EIA, Washington DC.
Eisenhardt, K.M., 1989. Building theories from case study research. Academy ofManagement Review 14, 532e550.
Gale, R., 2006. Environmental costs at a Canadian paper mill: a case study ofenvironmental management accounting (EMA). Journal of Cleaner Production14, 1237e1251.
Hallstedt, S., Ny, H., Robèrt, K.-H., Broman, G., 2010. An approach to assessingsustainability integration in strategic decision systems for product develop-ment. Journal of Cleaner Production 18, 703e712.
Hasanbeigi, A., Hasanabadi, A., Abdorrazaghi, M., 2012. Comparison analysis ofenergy intensity for five major sub-sectors of the Textile Industry in Iran.Journal of Cleaner Production 23, 186e194.
Herzig, C., Viere, T., Burritt, R.L., Schaltegger, S., 2006. Understanding and supportingmanagement decision-making. South East Asian case studies on environmentalmanagement accounting. In: Schaltegger, S., Bennett, M., Burritt, R.L. (Eds.),Sustainability Accounting and Reporting. Springer, Dordrecht, pp. 491e508.
S. Schaltegger et al. / Journal of Cleaner Production 29-30 (2012) 1e1010
Hobbs, J., 2000. Promoting cleaner production in small and medium-sized enter-prises. In: Hillary, R. (Ed.), Small and Medium-Sized Enterprises and the Envi-ronment. Business Imperatives. Greenleaf Publishing, Sheffield, pp. 148e157.
Jasch, C., 2006. How to perform an environmental management cost assessment inone day. Journal of Cleaner Production 14, 1194e1213.
Jasch, C., 2009. Material Flow Cost Accounting. Springer, Dordrecht.Jever, 2004. Umwelterklärung 2004. (environmental declaration 2004). Friesisches
Brauhaus zu Jever GmbH & Co. KG, Jever (Germany).Kaplan, R.S., 1986. The role for empirical research in management accounting.
Accounting, Organizations and Society 11, 429e452.Lee, K.S., Lim, G.H., Tan, S.J., 1999. Dealing with resource disadvantage. Generic
strategies for SMEs. Small Business Economics 12, 299e311.Lozano, R., 2012. Towards better embedding sustainability into companies’ systems:
an analysis of voluntary corporate initiatives. Journal of Cleaner Production 25,14e26.
Mekong Securities, 2007. Industry Research Beer in Vietnam. Mekong Securities,Hanoi.
Narayanaswamy, V., Altham, W., van Berkel, R., McGregor, M., 2005. Application ofLife Cycle Assessment to enhance eco-efficiency of grains supply chains. PaperPresented at the 4th Australian LCA Conference, Feb. 2005, Sydney.
Onishi, Y., Kokubu, K., Nakajima, M., 2008. Implementing materials flow costaccounting in a pharmaceutical company. In: Schaltegger, S., Bennett, M., Bur-ritt, R., Jasch, C. (Eds.), Environmental Management Accounting for CleanerProduction. Springer Publ., Dordrecht, pp. 395e410.
Parker, L.D., 1994. The case for field studies in management and accounting:towards informed policy and practice in Asia. Accounting and Business Review1, 211e232.
Prasad, S., Calis, A., 1999. Capability indices for material balance accounting. Euro-pean Journal of Operational Research 114, 93e104.
Ryan, B., Scapens, R.W., Theobald, M., 2002. Research Method and Methodology inFinance and Accounting. Thomson, London.
Scavone, G.M., 2006. Challenges in internal environmental management reportingin Argentina. Journal of Cleaner Production 14, 1276e1285.
Schaltegger, S., 2002. Accounting for eco-efficiency. In: Bartelmus, P., Seifert, E.(Eds.), Green Accounting. Ashgate Publishing, Aldershot, pp. 287e302.
Schaltegger, S., Burritt, R., 2000. Contemporary Environmental Accounting. Green-leaf, Sheffield.
Schaltegger, S., Burritt, R.L., 2005. Corporate sustainability. In: Folmer, H.,Tietenberg, T. (Eds.), International Yearbook of Environmental and ResourceEconomics. Edwad Elgar, Lyme, pp. 245e289.
Schaltegger, S., Bennett, M., Burritt, R., Jasch, C., 2008. Environmental Accounting forCleaner Production. Springer, Dordrecht.
Schmidt, M., 2008. The Sankey diagram in energy and material flow management.Part II: Methodology and current applications. Journal of Industrial Ecology 12,173e185.
Schmidt, M., 2010. Approaches towards the efficient use of resources in theindustry. Chemical Engineering & Technology 33, 552e558.
SCLCI (Swiss Centre for Life Cycle Inventories), 2010. Ecoinvent. Available at: http://www.ecoinvent.org/ (accessed 25.11.10).
Talve, S., 2001. Life cycle assessment of a basic lager beer. International Journal ofLife Cycle Assessment 6, 293e298.
Timberlake, I., 2010. Vietnam’s Thirst for Beer Hard to Quench. Available at: http://newsinfo.inquirer.net/breakingnews/world/view/20100829-289395/Vietnams-thirst-for-beer-hard-to-quench.
Weizsäcker, E.U. von, Lovins, A.B., Lovins, L.H., 1997. Factor Four: Doubling Wealth eHalving Resource Use. Earthscan, London.
Yin, R.K., 2009. Case Study Research. Design and Methods, fourth ed. Sage, Thou-sand Oaks.