target retirement funds - valicthe funds invest in a diversified portfolio of t. rowe price mutual...
TRANSCRIPT
Proof #4
T. Rowe PRice
Target Retirement FundsThe funds invest in a diversified portfolio of T. Rowe Price mutual funds, offering a professionally managed, age-appropriate mix of stocks and bonds for investors willing to accept lower potential long-term growth in exchange for potentially lower short-term volatility up to and in retirement.
SEMIANNuAlREPORT
November 30, 2014
Proof #4
REPORTS ON THE WEB
Sign up for our E-mail Program, and you can begin to receive updated fund reports and prospectuses online rather than through the mail. Log in to your account at troweprice.com for more information.
HIGHLIGHTS
• GlobalstockandbondmarketsturnedinmixedresultsoverthesixmonthsendedNovember30,2014.
• TheTargetRetirementFundsgeneratedmoderategainsinthereportingperiod.Performanceversusthefunds’Lipperpeergroupaverageswasmixed,whileallofthefundstrailedtheircombinedindexportfolios.
• Securityselectionandtacticaldecisionstooverweightandunderweightassetclassesbenefitedthefunds’performance,buttheinclusionofdiversifyingassetclassesnotreflectedinthefunds’combinedindexportfoliosweighedonresults.
• Weexpectmodestglobaleconomicgrowthoverthenextseveralquartersmarkedbydivergentgrowthtrends.TheU.S.economyshouldcontinuetostrengthen,withweaknessinnon-U.S.developedeconomies.Lowerenergyandcommoditypricesshouldhelpemergingeconomiesthatimportcommoditiesbutarelikelytopunishcommodityexporters.
T. Rowe Price Target Retirement Funds
TheviewsandopinionsinthisreportwerecurrentasofNovember30,2014.They are not guarantees of performance or investment results andshouldnotbe takenas investmentadvice. Investmentdecisionsreflectavarietyof factors,and themanagers reserve the right tochange theirviews about individual stocks, sectors, and the markets at any time.As a result, the views expressed should not be relied upon as a fore-castof the fund’s future investment intent.Thereport iscertifiedunderthe Sarbanes-Oxley Act, which requiresmutual funds and other publiccompanies to affirm that, to the best of their knowledge, the informa-tionintheirfinancialreportsisfairlyandaccuratelystatedinallmaterialrespects.
Proof #4
T. Rowe Price Target Retirement Funds
Manager’s Letter
1
Fellow Shareholders
Global markets turned in mixed results over the past six months, with U.S. equities
generating solid gains amid steady labor market gains, favorable corporate earnings,
and supportive monetary policies from global central banks. Emerging markets stocks
lagged domestic shares as U.S. economic improvement and the expectation of higher
U.S. interest rates reduced the appeal of higher-risk assets, while developed non-U.S.
markets posted steeper losses. U.S. investment-grade bonds produced good returns
as long-term interest rates fell and bond prices rose, but high yield bonds declined
due largely to the steep drop in oil prices. Debt in non-U.S. developed and emerging
markets also fell for the period. Many non-U.S. securities gained in local currency
terms, but a stronger U.S. dollar versus most other currencies significantly eroded
returns for U.S.-based investors.
RETIREMENT FUND NEWS
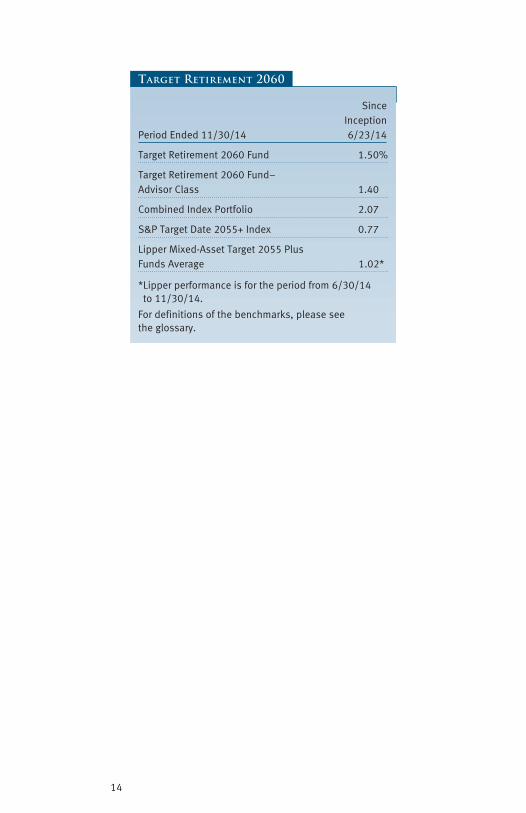
We are pleased to announce that T. Rowe Price launched the Target Retirement 2060 Fund on June 23, 2014. The fund is the newest investment option in our suite of Target Retirement Funds and is intended for investors born in 1993. Like our other Target Retirement Funds, the 2060 fund will gradually shift its investment allocation up to and through its stated retirement date. (For more information on the funds’ investment approach, see “Target Retirement Funds at Work” on the following page.)
Proof #4
2
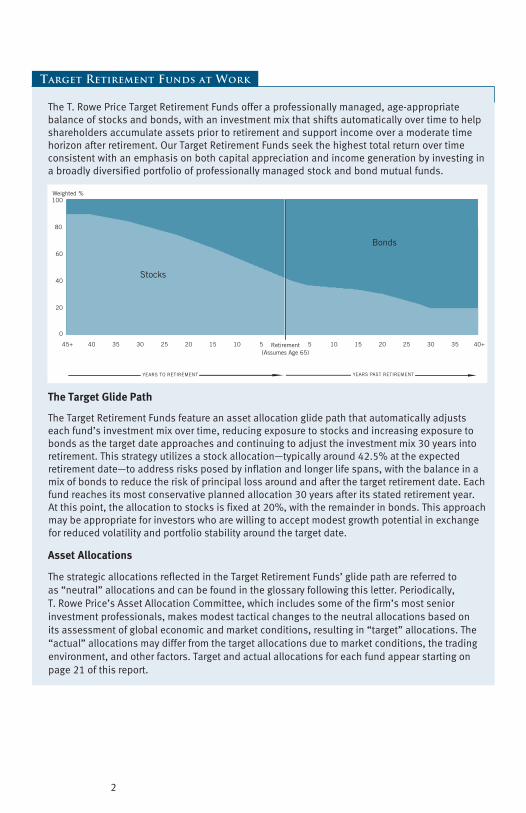
TheT.RowePriceTargetRetirementFundsofferaprofessionallymanaged,age-appropriatebalanceofstocksandbonds,withaninvestmentmixthatshiftsautomaticallyovertimetohelpshareholdersaccumulateassetspriortoretirementandsupportincomeoveramoderatetimehorizonafterretirement.OurTargetRetirementFundsseekthehighesttotalreturnovertimeconsistentwithanemphasisonbothcapitalappreciationandincomegenerationbyinvestinginabroadlydiversifiedportfolioofprofessionallymanagedstockandbondmutualfunds.
0
20
40
60
80
100
IFB
Bonds
Stocks
40+3530252015105Retirement(Assumes Age 65)
51015202530354045+
Weighted %
Stocks
Bonds
YEARS TO RETIREMENT YEARS PAST RETIREMENT
Targ
et 2
045
Targ
et 2
040
Targ
et 2
035
Targ
et 2
030
Targ
et 2
025
Targ
et 2
020
Targ
et 2
015
Targ
et 2
010
Targ
et 2
005
Targ
et 2
050
Targ
et 2
055
The Target Glide Path
TheTargetRetirementFundsfeatureanassetallocationglidepaththatautomaticallyadjustseachfund’sinvestmentmixovertime,reducingexposuretostocksandincreasingexposuretobondsasthetargetdateapproachesandcontinuingtoadjusttheinvestmentmix30yearsintoretirement.Thisstrategyutilizesastockallocation—typicallyaround42.5%attheexpectedretirementdate—toaddressrisksposedbyinflationandlongerlifespans,withthebalanceinamixofbondstoreducetheriskofprincipallossaroundandafterthetargetretirementdate.Eachfundreachesitsmostconservativeplannedallocation30yearsafteritsstatedretirementyear.Atthispoint,theallocationtostocksisfixedat20%,withtheremainderinbonds.Thisapproachmaybeappropriateforinvestorswhoarewillingtoacceptmodestgrowthpotentialinexchangeforreducedvolatilityandportfoliostabilityaroundthetargetdate.
Asset Allocations
ThestrategicallocationsreflectedintheTargetRetirementFunds’glidepatharereferredtoas“neutral”allocationsandcanbefoundintheglossaryfollowingthisletter.Periodically,T.RowePrice’sAssetAllocationCommittee,whichincludessomeofthefirm’smostseniorinvestmentprofessionals,makesmodesttacticalchangestotheneutralallocationsbasedonitsassessmentofglobaleconomicandmarketconditions,resultingin“target”allocations.The“actual”allocationsmaydifferfromthetargetallocationsduetomarketconditions,thetradingenvironment,andotherfactors.Targetandactualallocationsforeachfundappearstartingonpage21ofthisreport.
Target Retirement Funds at Work
Proof #4
3
MARKET ENVIRONMENT
The U.S. economy continued to recover over the past six months, showing strong resilience in the face of slowing growth across much of Europe and Asia. U.S. gross domestic product (GDP) grew at an annualized rate of 4.6% in the second quarter and 3.9% in the third quarter, with the combined periods marking the strongest consecutive quarters of economic growth since 2003. A firming labor market reflected the improving economy. Employers added 321,000 jobs in November, the best monthly gain in nearly three years, and the unemployment rate declined to 5.8% in November from 6.1% at the start of our fiscal year in June. Meanwhile, inflation expectations have stayed tame, aided by the recent plunge in oil prices and signs of slowing economic growth in Europe, Japan, and China. The Federal Reserve ended its monthly purchases of Treasuries and agency mortgage-backed securities in October. With the end of the
Fed’s quantitative easing program, investors have shifted their attention to the timing and pace of the Fed’s prospective interest rate hikes, now expected to begin in mid-2015.
U.S. equities produced good returns in the six months ended November 30, 2014, supported by an improved labor market, solid corporate earnings growth, and expanded monetary and other
economic stimulus measures in key overseas markets. As measured by various Russell indexes, growth stocks outperformed value stocks across all market capitalizations. Stocks in non-U.S. developed markets declined overall in U.S. dollar terms, but performance varied between regions. Asian markets held up best thanks to healthy gains in Hong Kong and modestly positive results in Japan, with the latter benefiting from the postponement of a proposed tax increase and a further round of monetary stimulus announced by the Bank of Japan at the end of October. Most European markets declined as eurozone economies
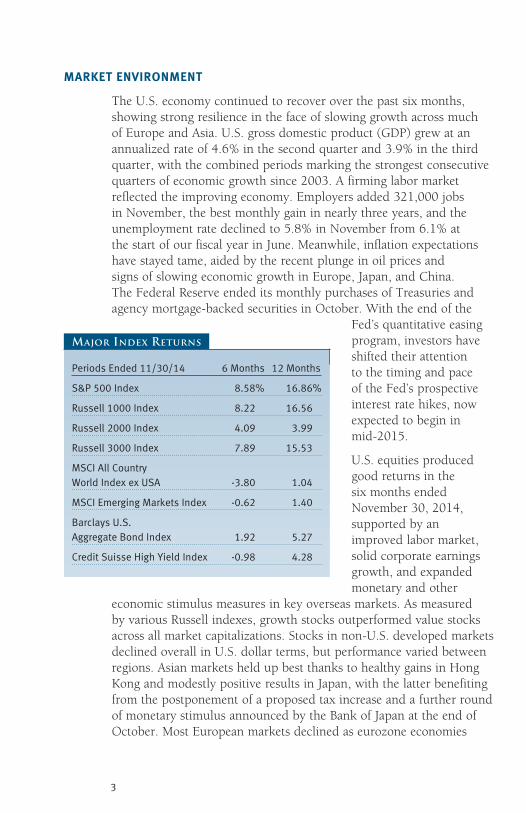
PeriodsEnded11/30/14 6Months 12Months
S&P500Index 8.58% 16.86%
Russell1000Index 8.22 16.56
Russell2000Index 4.09 3.99
Russell3000Index 7.89 15.53
MSCIAllCountryWorldIndexexUSA -3.80 1.04
MSCIEmergingMarketsIndex -0.62 1.40
BarclaysU.S.AggregateBondIndex 1.92 5.27
CreditSuisseHighYieldIndex -0.98 4.28
Major Index Returns
Proof #4
4
struggled amid low inflation and high unemployment, and currency weakness significantly reduced returns to U.S. investors in dollar terms. Emerging markets stocks edged slightly lower in aggregate over the last six months but managed to outperform non-U.S. developed
markets. Developing markets in Asia generated good gains, but emerging Europe and Latin America declined.
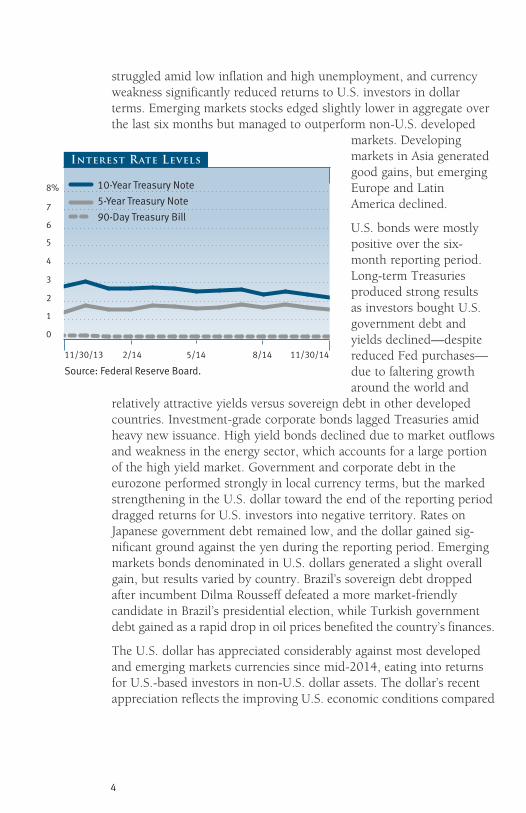
U.S. bonds were mostly positive over the six-month reporting period. Long-term Treasuries produced strong results as investors bought U.S. government debt and yields declined—despite reduced Fed purchases—due to faltering growth around the world and
relatively attractive yields versus sovereign debt in other developed countries. Investment-grade corporate bonds lagged Treasuries amid heavy new issuance. High yield bonds declined due to market outflows and weakness in the energy sector, which accounts for a large portion of the high yield market. Government and corporate debt in the eurozone performed strongly in local currency terms, but the marked strengthening in the U.S. dollar toward the end of the reporting period dragged returns for U.S. investors into negative territory. Rates on Japanese government debt remained low, and the dollar gained sig-nificant ground against the yen during the reporting period. Emerging markets bonds denominated in U.S. dollars generated a slight overall gain, but results varied by country. Brazil’s sovereign debt dropped after incumbent Dilma Rousseff defeated a more market-friendly candidate in Brazil’s presidential election, while Turkish government debt gained as a rapid drop in oil prices benefited the country’s finances.
The U.S. dollar has appreciated considerably against most developed and emerging markets currencies since mid-2014, eating into returns for U.S.-based investors in non-U.S. dollar assets. The dollar’s recent appreciation reflects the improving U.S. economic conditions compared
11/30/13 11/30/142/14 5/14 8/14
Interest Rate Levels
7
6
4
2
1
0
3
5
8% 10-Year Treasury Note
5-Year Treasury Note
90-Day Treasury Bill
Source: Federal Reserve Board.
Proof #4
5
with other major markets, including Europe and Japan, and expec-tations for rising U.S. interest rates. The dollar is also historically perceived as a “safe haven” currency amid geopolitical turmoil. When the U.S. dollar appreciates, imported goods can be purchased with fewer dollars, and U.S. exports become more expensive for foreign buyers. All other things being equal, a strengthening dollar hurts the performance of nondollar investments for U.S. investors, while a falling dollar is additive to performance. Investors should keep in mind that currency trends are unpredictable and should not be a primary factor when making long-term investment decisions.
PORTFOLIO REVIEW AND POSITIONING
The Target Retirement Funds generated moderate gains in the six months ended November 30, 2014. The 2005, 2010, 2015, 2020, and 2025 funds performed roughly in line with their respective Lipper peer group averages, while the 2030, 2035, 2040, 2045, 2050, 2055, and 2060 funds outperformed. All of the funds trailed their combined index portfolios. Diversifying allocations to sectors and asset classes not included in the funds’ combined index portfolio benchmarks weighed on results and were the largest factors in the funds’ relative underperformance. Non-benchmark exposure to non-U.S. developed markets debt and high yield bonds hurt results versus the combined index portfolio, but our exposure to real assets equities was the most notable detractor.
In order to provide an effective relative performance comparison, we have created a combined index portfolio for each Target Retirement Fund (shown in the Performance Comparison tables later in this letter) composed of multiple indexes representing the underlying asset classes in which the funds invest. The weights of the underlying indexes in the combined index portfolios are intended to match the combined weights of the underlying funds assigned to each asset class at a given point along the glide path. We believe that our combined index portfolios provide the most appropriate evaluation of the active management of our underlying components and tactical asset allocation decisions. The composi-tion of each fund’s combined index portfolio as of the end of the reporting period can be found in the glossary following this letter.
Proof #4
6
Security selection in the funds’ underlying portfolios generally benefited results versus their combined index portfolios. Our emerging markets stocks and growth stocks in non-U.S. developed markets outpaced their respective underlying benchmarks, as did our portfolio of U.S. large-cap growth stocks. Our U.S. value stocks in the large-, mid-, and
small-cap arenas lagged their underlying benchmarks and weighed on results. Security selection in the funds’ fixed income portfolios tended to be neutral or slightly negative for relative performance.
Tactical decisions to overweight or underweight asset classes helped results modestly. We reduced our exposure to stocks relative to bonds, moving from an overweight to a neutral position. Stocks are broadly priced at levels at or above historical averages across multiple measures, and at current valuations, the risk/return profile for equities now appears more evenly balanced. We expect modest returns from bonds as the current low-yield environment remains a headwind
as interest rates normalize. Despite the end of quantitative easing and expectations for rate hikes in the U.S., global monetary policies remain broadly accommodative, which should mitigate downside risk for bonds. Underweight allocations to real assets and small-cap equities helped results, while an overweight to non-U.S. stocks detracted from the funds’ relative performance.
Stock PerformanceThe funds’ broader equity portfolio generated decent absolute gains for the reporting period. Not surprisingly, our domestic equities posted the largest gains in a period where the U.S. market significantly outpaced overseas developed and emerging markets in U.S. dollar terms. Growth stocks led the way among U.S. shares across all market capitalization ranges. The funds’ allocation to non-U.S. stocks weighed on performance. Our emerging markets stock portfolio managed a modest gain in U.S. dollars, but this was more than offset by declines in our international developed markets stock portfolios, where value stocks posted the largest declines. Our portfolio of real assets stocks declined sharply for the period as commodity and energy prices plummeted.
Stock PositioningIn the U.S., we favor growth stocks over value stocks. A slow-growth economy often benefits growth stocks more than value stocks as growth companies tend to rely less on a strong economy to increase
WEREdUCEdOUR
ExPOSURETO
STOCkSRELATIvE
TOBONdS,
MOvINGFROMAN
OvERWEIGHTTOA
NEUTRALPOSITION.
Proof #4
7
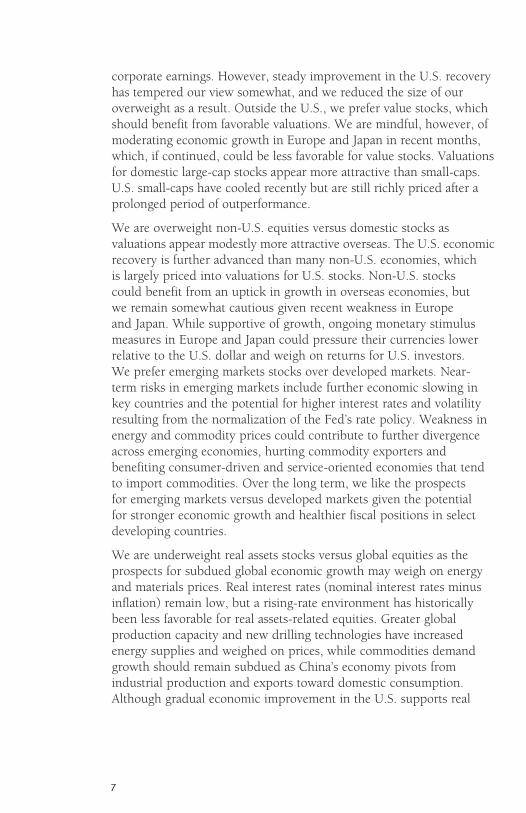
corporate earnings. However, steady improvement in the U.S. recovery has tempered our view somewhat, and we reduced the size of our overweight as a result. Outside the U.S., we prefer value stocks, which should benefit from favorable valuations. We are mindful, however, of moderating economic growth in Europe and Japan in recent months, which, if continued, could be less favorable for value stocks. Valuations for domestic large-cap stocks appear more attractive than small-caps. U.S. small-caps have cooled recently but are still richly priced after a prolonged period of outperformance.
We are overweight non-U.S. equities versus domestic stocks as valuations appear modestly more attractive overseas. The U.S. economic recovery is further advanced than many non-U.S. economies, which is largely priced into valuations for U.S. stocks. Non-U.S. stocks could benefit from an uptick in growth in overseas economies, but we remain somewhat cautious given recent weakness in Europe and Japan. While supportive of growth, ongoing monetary stimulus measures in Europe and Japan could pressure their currencies lower relative to the U.S. dollar and weigh on returns for U.S. investors. We prefer emerging markets stocks over developed markets. Near-term risks in emerging markets include further economic slowing in key countries and the potential for higher interest rates and volatility resulting from the normalization of the Fed’s rate policy. Weakness in energy and commodity prices could contribute to further divergence across emerging economies, hurting commodity exporters and benefiting consumer-driven and service-oriented economies that tend to import commodities. Over the long term, we like the prospects for emerging markets versus developed markets given the potential for stronger economic growth and healthier fiscal positions in select developing countries.
We are underweight real assets stocks versus global equities as the prospects for subdued global economic growth may weigh on energy and materials prices. Real interest rates (nominal interest rates minus inflation) remain low, but a rising-rate environment has historically been less favorable for real assets-related equities. Greater global production capacity and new drilling technologies have increased energy supplies and weighed on prices, while commodities demand growth should remain subdued as China’s economy pivots from industrial production and exports toward domestic consumption. Although gradual economic improvement in the U.S. supports real
Proof #4
8
estate fundamentals, current valuations appear rich, and the sector is susceptible to shifting interest rates. Over the long term, we believe that exposure to real assets equities should enhance the funds’ diversification and position them to perform well under a variety of market conditions, particularly in periods of rising inflation.
Bond PerformanceOverall, our fixed income portfolio was slightly positive for the period, led by modest gains in our U.S. investment-grade debt. Other fixed income sectors weighed on the funds’ absolute returns. Our allocations to high yield debt, inflation focused bonds and short-term bonds, and emerging markets debt posted moderate losses, while our non-U.S. developed markets debt posted a steeper decline due largely to the strength of the U.S. dollar versus other currencies.
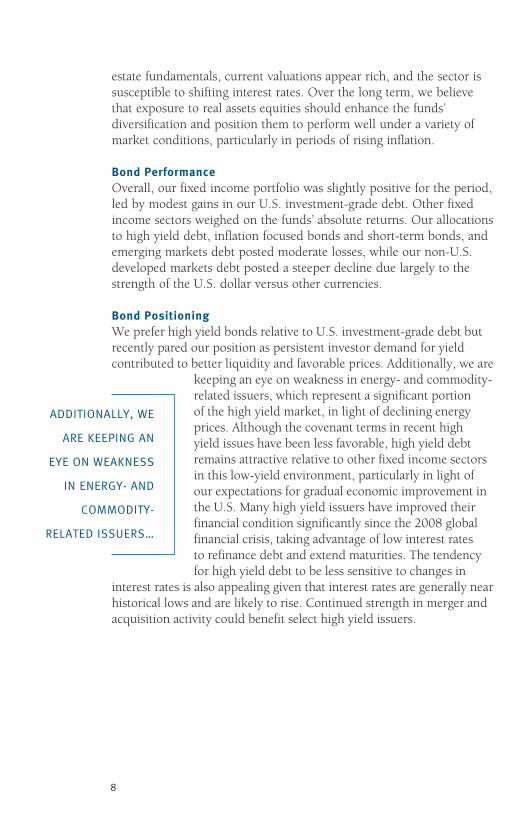
Bond PositioningWe prefer high yield bonds relative to U.S. investment-grade debt but recently pared our position as persistent investor demand for yield contributed to better liquidity and favorable prices. Additionally, we are
keeping an eye on weakness in energy- and commodity-related issuers, which represent a significant portion of the high yield market, in light of declining energy prices. Although the covenant terms in recent high yield issues have been less favorable, high yield debt remains attractive relative to other fixed income sectors in this low-yield environment, particularly in light of our expectations for gradual economic improvement in the U.S. Many high yield issuers have improved their financial condition significantly since the 2008 global financial crisis, taking advantage of low interest rates to refinance debt and extend maturities. The tendency for high yield debt to be less sensitive to changes in
interest rates is also appealing given that interest rates are generally near historical lows and are likely to rise. Continued strength in merger and acquisition activity could benefit select high yield issuers.
AddITIONALLY,WE
AREkEEPINGAN
EYEONWEAkNESS
INENERGY-ANd
COMMOdITY-
RELATEdISSUERS…
Proof #4
9
We reduced our exposure in emerging markets relative to U.S. investment-grade debt and moved to a neutral position. Low U.S. interest rates and market-friendly results in many key elections have benefited emerging markets bonds, but muted economic growth and the impending start of the Fed’s interest rate policy normalization pose near-term risks. In addition, we are selective in the emerging markets credits that we own due in part to the considerable disparity in the strength of various emerging economies. Those countries with significant current account deficits are most vulnerable, and lower commodity prices could pressure the fiscal accounts of commodity-exporting countries even further. We favor U.S. investment-grade debt over non-U.S. dollar-denominated debt. The U.S. dollar should continue to benefit from improving economic growth and the potential for higher interest rates as the Fed contemplates the timing and pace of interest rate hikes, now expected to begin in mid-2015. Further efforts by the European Central Bank and the Bank of Japan to stimulate growth and inflation could weaken their currencies even more relative to the U.S. dollar.
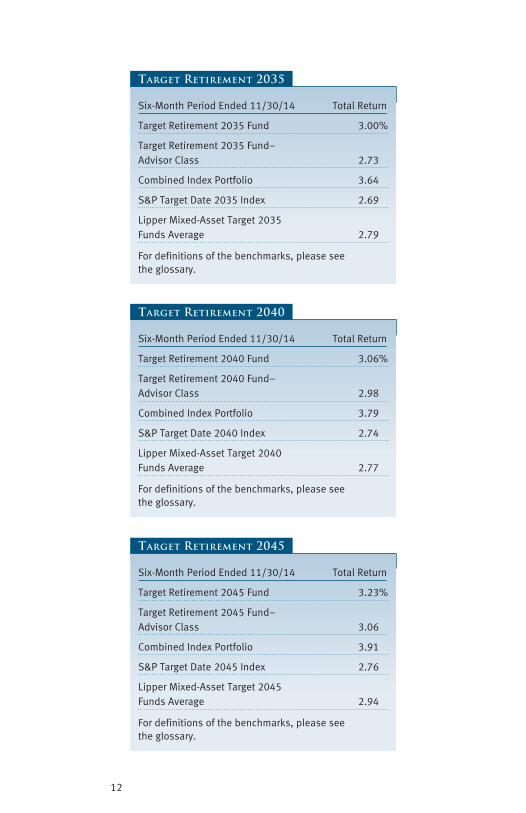
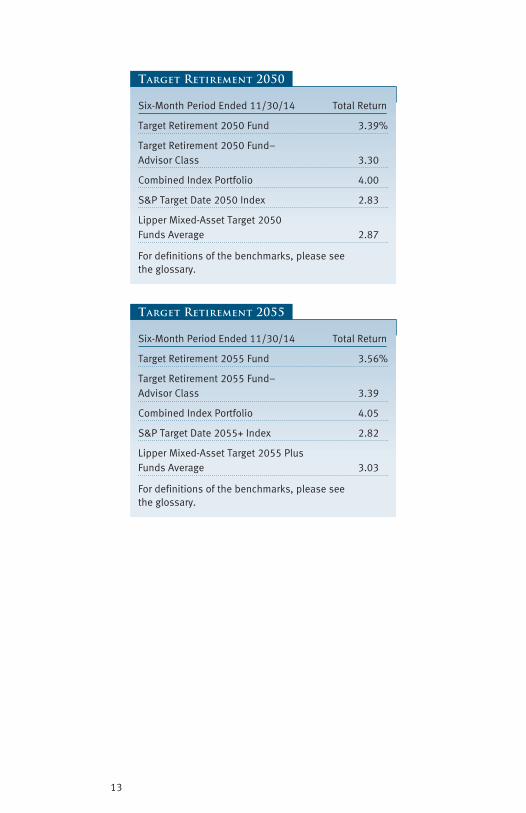
PERFORMANCE COMPARISON
The Performance Comparison tables show the returns for each fund versus its combined index portfolio, which is composed of several indexes representing the underlying asset classes in which the funds invest. The tables also show the average returns for each fund’s respective Lipper target date category and, where available, each fund’s S&P target date index, providing a tool to measure the performance of our funds against those with similar objectives.
Please note that returns for each fund’s Advisor Class may differ slightly due to their different fee structures.
Proof #4
10
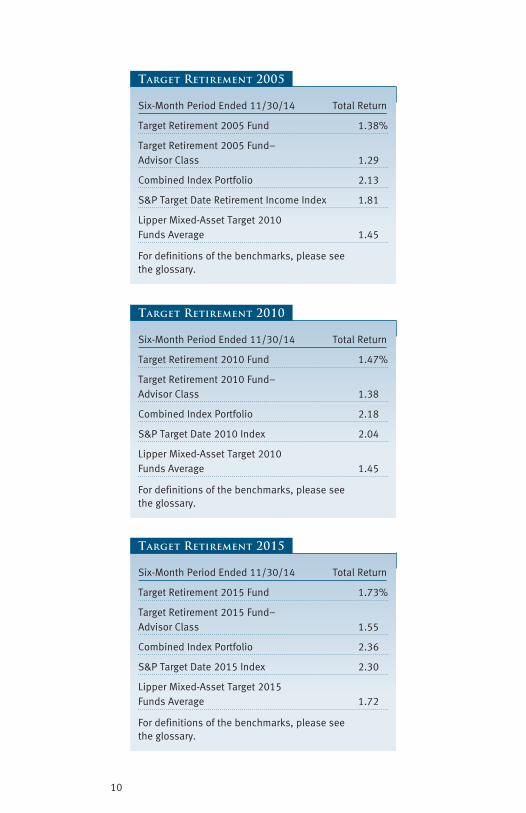
Six-MonthPeriodEnded11/30/14 TotalReturn
TargetRetirement2005Fund 1.38%
TargetRetirement2005Fund–AdvisorClass 1.29
CombinedIndexPortfolio 2.13
S&PTargetdateRetirementIncomeIndex 1.81
LipperMixed-AssetTarget2010FundsAverage 1.45
Fordefinitionsofthebenchmarks,pleaseseetheglossary.
Target Retirement 2005
Six-MonthPeriodEnded11/30/14 TotalReturn
TargetRetirement2010Fund 1.47%
TargetRetirement2010Fund–AdvisorClass 1.38
CombinedIndexPortfolio 2.18
S&PTargetdate2010Index 2.04
LipperMixed-AssetTarget2010FundsAverage 1.45
Fordefinitionsofthebenchmarks,pleaseseetheglossary.
Target Retirement 2010
Six-MonthPeriodEnded11/30/14 TotalReturn
TargetRetirement2015Fund 1.73%
TargetRetirement2015Fund–AdvisorClass 1.55
CombinedIndexPortfolio 2.36
S&PTargetdate2015Index 2.30
LipperMixed-AssetTarget2015FundsAverage 1.72
Fordefinitionsofthebenchmarks,pleaseseetheglossary.
Target Retirement 2015

Proof #4
11
Six-MonthPeriodEnded11/30/14 TotalReturn
TargetRetirement2020Fund 1.99%
TargetRetirement2020Fund–AdvisorClass 1.90
CombinedIndexPortfolio 2.62
S&PTargetdate2020Index 2.49
LipperMixed-AssetTarget2020FundsAverage 1.98
Fordefinitionsofthebenchmarks,pleaseseetheglossary.
Target Retirement 2020
Six-MonthPeriodEnded11/30/14 TotalReturn
TargetRetirement2025Fund 2.33%
TargetRetirement2025Fund–AdvisorClass 2.15
CombinedIndexPortfolio 2.97
S&PTargetdate2025Index 2.48
LipperMixed-AssetTarget2025FundsAverage 2.36
Fordefinitionsofthebenchmarks,pleaseseetheglossary.
Target Retirement 2025
Six-MonthPeriodEnded11/30/14 TotalReturn
TargetRetirement2030Fund 2.66%
TargetRetirement2030Fund–AdvisorClass 2.49
CombinedIndexPortfolio 3.33
S&PTargetdate2030Index 2.58
LipperMixed-AssetTarget2030FundsAverage 2.47
Fordefinitionsofthebenchmarks,pleaseseetheglossary.
Target Retirement 2030
Proof #4
12
Six-MonthPeriodEnded11/30/14 TotalReturn
TargetRetirement2035Fund 3.00%
TargetRetirement2035Fund–AdvisorClass 2.73
CombinedIndexPortfolio 3.64
S&PTargetdate2035Index 2.69
LipperMixed-AssetTarget2035FundsAverage 2.79
Fordefinitionsofthebenchmarks,pleaseseetheglossary.
Target Retirement 2035
Six-MonthPeriodEnded11/30/14 TotalReturn
TargetRetirement2040Fund 3.06%
TargetRetirement2040Fund–AdvisorClass 2.98
CombinedIndexPortfolio 3.79
S&PTargetdate2040Index 2.74
LipperMixed-AssetTarget2040FundsAverage 2.77
Fordefinitionsofthebenchmarks,pleaseseetheglossary.
Target Retirement 2040
Six-MonthPeriodEnded11/30/14 TotalReturn
TargetRetirement2045Fund 3.23%
TargetRetirement2045Fund–AdvisorClass 3.06
CombinedIndexPortfolio 3.91
S&PTargetdate2045Index 2.76
LipperMixed-AssetTarget2045FundsAverage 2.94
Fordefinitionsofthebenchmarks,pleaseseetheglossary.
Target Retirement 2045
Proof #4
13
Six-MonthPeriodEnded11/30/14 TotalReturn
TargetRetirement2050Fund 3.39%
TargetRetirement2050Fund–AdvisorClass 3.30
CombinedIndexPortfolio 4.00
S&PTargetdate2050Index 2.83
LipperMixed-AssetTarget2050FundsAverage 2.87
Fordefinitionsofthebenchmarks,pleaseseetheglossary.
Target Retirement 2050
Six-MonthPeriodEnded11/30/14 TotalReturn
TargetRetirement2055Fund 3.56%
TargetRetirement2055Fund–AdvisorClass 3.39
CombinedIndexPortfolio 4.05
S&PTargetdate2055+Index 2.82
LipperMixed-AssetTarget2055PlusFundsAverage 3.03
Fordefinitionsofthebenchmarks,pleaseseetheglossary.
Target Retirement 2055
Proof #4
14
Since InceptionPeriodEnded11/30/14 6/23/14
TargetRetirement2060Fund 1.50%
TargetRetirement2060Fund–AdvisorClass 1.40
CombinedIndexPortfolio 2.07
S&PTargetdate2055+Index 0.77
LipperMixed-AssetTarget2055PlusFundsAverage 1.02*
*Lipperperformanceisfortheperiodfrom6/30/14to11/30/14.
Fordefinitionsofthebenchmarks,pleaseseetheglossary.
Target Retirement 2060
Proof #4
15
OUTLOOK
We expect modest global economic growth over the next several quarters. Diminishing fiscal headwinds, increased state and local government spending, improving private sector demand, and moderate
job growth should support gradual improvements in U.S. economic activity. U.S. Federal Reserve policy remains accommodative despite the end of its quanti-tative easing program in October, with balance sheet assets in excess of $4 trillion and interest rate hikes not expected until mid-2015. Inflation remains below the Fed’s 2% target, helped by lower energy costs. Healthy corporate balance sheets and cash flows offer flexibility to increase hiring and capital expenditures, enhance merger and acquisition activity, and return capital to shareholders through dividends and share buybacks. Revenue growth in the low- to mid-single digits is consistent with modest economic growth, and earnings growth expectations have trended lower toward the
mid-single digits over recent months. A stronger U.S. dollar and lower energy prices are beneficial for U.S. consumers but represent a headwind to corporate earnings in manufacturing and export-oriented sectors.
In contrast, European and Japanese growth momentum has faded. Europe’s economy softened over recent months as concerns over deflation and the effects of Russian sanctions on growth were added to longstanding issues with burdensome debt loads and high unemployment. The European Central Bank is employing more aggressive stimulus measures, with expectations that it could initiate full-scale quantitative easing that involves purchase of eurozone sovereign debt. Japan’s economy slipped back into recession in the third quarter following the impact of a sales tax increase in the spring of 2014. The Bank of Japan has dramatically increased its bond purchase targets, and the government called for (and subsequently won) new elections to garner support for ongoing stimulus and structural reforms.
Among emerging markets, slowing growth in China, Brazil, and other economies is weighing on global trade. But there is a broad divergence of fiscal conditions between countries, with some economies showing modest improvements as currencies have weakened and current accounts have improved. China’s leadership is working hard to keep annualized GDP growth near its 7.5% target, with the People’s Bank
HEALTHYCORPORATE
BALANCESHEETS
ANdCASHFLOWS
OFFERFLExIBILITY
TOINCREASE
HIRINGANdCAPITAL
ExPENdITURES…
Proof #4
16
of China cutting interest rates for the first time in two years to help stabilize declining growth and a weak housing market. Overall, however, emerging markets economic growth rates still outpace those of developed markets and have greater long-term potential.
Key risks to global markets include the effectiveness of global monetary policy actions to support growth and rising geopolitical tensions in some regions of the world. However, we believe that highly diversified portfolios and a careful focus on fundamental research can enhance our ability to identify investment opportunities on behalf of our shareholders.
Respectfully submitted,
Jerome A. ClarkCo-portfolio manager and cochairman of the funds’ Investment Advisory Committee
Wyatt A. LeeCo-portfolio manager and cochairman of the funds’ Investment Advisory Committee
December 18, 2014
Proof #4
17
T. Rowe Price Target Retirement Funds
Risks of Investing
TheTargetRetirementFunds’investmentinmanyunderlyingfundsmeansthattheywillbeexposedtotherisksofdifferentareasofthemarket.Aswithallstockandbondmutualfunds,eachfund’ssharepricecanfallbecauseofweaknessinthestockorbondmarkets,aparticularindustry,orspecificholdings.Stockmarketscandeclineformanyreasons,includingadversepoliticaloreconomicdevelopments,changesininvestorpsychology,orheavyinstitutionalselling.Theprospectsforanindustryorcompanymaydeterioratebecauseofavarietyoffactors,includingdisappointingearningsorchangesinthecompetitiveenvironment.Inaddition,theinvestmentmanager’sassessmentofcompaniesheldinafundmayproveincorrect,resultinginlossesorpoorperformanceeveninrisingmarkets.Investorsshouldnotethatthehigherafund’sallocationtostocks,thegreatertherisk.
Bondsaresubjecttointerestraterisk,thedeclineinbondpricesthatusuallyaccompaniesariseininterestrates,andcreditrisk,thechancethatanyfundholdingcouldhaveitscreditratingdowngradedorthatabondissuerwilldefault(failtomaketimelypaymentsofinterestorprincipal),potentiallyreducingthefund’sincomelevelandshareprice.Highyieldcorporatebondscouldhavegreaterpricedeclinesthanfundsthatinvestprimarilyinhigh-qualitybonds.Companiesissuinghighyieldbondsarenotasstrongfinanciallyasthosewithhighercreditratings,sothebondsareusuallyconsideredspeculativeinvestments.
FundsthatinvestoverseasmaycarrymoreriskthanfundsthatinveststrictlyinU.S.assets.Riskscanresultfromvaryingstagesofeconomicandpoliticaldevelopment;differingregulatoryenvironments,tradingdays,andaccountingstandards;andhighertransactioncostsofnon-U.S.markets.Non-U.S.investmentsarealsosubjecttocurrencyrisk,oradeclineinthevalueofaforeigncurrencyversustheU.S.dollar,whichreducesthedollarvalueofsecuritiesdenominatedinthatcurrency.
Glossary
Barclays U.S. Aggregate Bond Index: Anunmanagedindexthattracksdomesticinvestment-gradebonds,includingcorporate,government,andmortgage-backedsecurities.
Barclays U.S. 1–5 Year Treasury Inflation Protected Securities (TIPS) Index: AnunmanagedindexcomposedofU.S.Treasuryinflationprotectedsecuritieswithmaturitiesbetweenoneyearandfiveyears.
Proof #4
18
T. Rowe Price Target Retirement Funds
Glossary (continued)
Combined index portfolios: UnmanagedblendedindexportfolioscreatedascustombenchmarksforeachoftheTargetRetirementFunds.AsofNovember30,2014,thecombinedindexportfolioswerecomposedofthefollowingindexes:
• Target Retirement 2005 Fund: 24.85%Russell3000Index,44.50%BarclaysU.S.AggregateBondIndex,20.00%BarclaysU.S.1–5YearTreasuryInflationProtectedSecurities(TIPS)Index,and10.65%MSCIAllCountryWorldIndexexUSA.
• Target Retirement 2010 Fund: 26.25%Russell3000Index,42.50%BarclaysU.S.AggregateBondIndex,20.00%BarclaysU.S.1–5YearTreasuryInflationProtectedSecurities(TIPS)Index,and11.25%MSCIAllCountryWorldIndexexUSA.
•Target Retirement 2015 Fund: 30.80%Russell3000Index,36.50%BarclaysU.S.AggregateBondIndex,19.50%BarclaysU.S.1–5YearTreasuryInflationProtectedSecurities(TIPS)Index,and13.20%MSCIAllCountryWorldIndexexUSA.
•Target Retirement 2020 Fund: 36.05%Russell3000Index,31.50%BarclaysU.S.AggregateBondIndex,17.00%BarclaysU.S.1–5YearTreasuryInflationProtectedSecurities(TIPS)Index,and15.45%MSCIAllCountryWorldIndexexUSA.
•Target Retirement 2025 Fund: 41.31%Russell3000Index,29.50%BarclaysU.S.AggregateBondIndex,11.50%BarclaysU.S.1–5YearTreasuryInflationProtectedSecurities(TIPS)Index,and17.69%MSCIAllCountryWorldIndexexUSA.
•Target Retirement 2030 Fund: 46.20%Russell3000Index,28.50%BarclaysU.S.AggregateBondIndex,5.50%BarclaysU.S.1–5YearTreasuryInflationProtectedSecurities(TIPS)Index,and19.80%MSCIAllCountryWorldIndexexUSA.
•Target Retirement 2035 Fund: 50.75%Russell3000Index,27.00%BarclaysU.S.AggregateBondIndex,0.50%BarclaysU.S.1–5YearTreasuryInflationProtectedSecurities(TIPS)Index,and21.75%MSCIAllCountryWorldIndexexUSA.
• Target Retirement 2040 Fund: 54.60%Russell3000Index,22.00%BarclaysU.S.AggregateBondIndex,and23.40%MSCIAllCountryWorldIndexexUSA.
•Target Retirement 2045 Fund: 58.11%Russell3000Index,17.00%BarclaysU.S.AggregateBondIndex,and24.89%MSCIAllCountryWorldIndexexUSA.
• Target Retirement 2050 Fund: 60.91%Russell3000Index,13.00%BarclaysU.S.AggregateBondIndex,and26.09%MSCIAllCountryWorldIndexexUSA.
•Target Retirement 2055 and 2060 Funds: 63.00%Russell3000Index,10.00%BarclaysU.S.AggregateBondIndex,and27.00%MSCIAllCountryWorldIndexexUSA.
Proof #4
19
T. Rowe Price Target Retirement Funds
Glossary (continued)
Credit Suisse High Yield Index: AnunmanagedindexdesignedtotracktheU.S.dollar-denominatedhighyieldbondmarket.
Gross domestic product (GDP): Thetotalmarketvalueofallgoodsandservicesproducedinacountryinagivenyear.
Lipper averages: TheaveragesofavailablemutualfundperformancereturnsforspecifiedtimeperiodsincategoriesdefinedbyLipperInc.
MSCI All Country World Index ex USA: Anunmanagedindexthatmeasuresequitymarketperformanceofdevelopedandemergingcountries,excludingtheUnitedStates.
MSCI Emerging Markets Index: Acapitalization-weightedindexofstocksfrom26emergingmarketscountriesthatonlyincludessecuritiesthatmaybetradedbyforeigninvestors.
Neutral allocations: TheassetallocationsreflectedintheTargetRetirementFunds’glidepathsarereferredtoas“neutral”allocations.AsofNovember30,2014,theneutralallocationsforeachfundwereasfollows:
•Target Retirement 2005 Fund: 35.5%stocksand64.5%bonds.
•Target Retirement 2010 Fund: 37.5%stocksand62.5%bonds.
•Target Retirement 2015 Fund: 44.0%stocksand56.0%bonds.
• Target Retirement 2020 Fund: 51.5%stocksand48.5%bonds.
•Target Retirement 2025 Fund: 59.0%stocksand41.0%bonds.
•Target Retirement 2030 Fund: 66.0%stocksand34.0%bonds.
•Target Retirement 2035 Fund: 72.5%stocksand27.5%bonds.
•Target Retirement 2040 Fund: 78.0%stocksand22.0%bonds.
•Target Retirement 2045 Fund: 83.0%stocksand17.0%bonds.
•Target Retirement 2050 Fund: 87.0%stocksand13.0%bonds.
•Target Retirement 2055 and 2060 Funds: 90.0%stocksand10.0%bonds.
Russell 1000 Index: Anindexthattrackstheperformanceofthe1,000largestcompaniesintheRussell3000Index.
Russell 2000 Index: Anunmanagedindexthattracksthestocksof2,000smallU.S.companies.
Russell 3000 Index: Anindexthattrackstheperformanceofthe3,000largestU.S.companies,representingapproximately98%oftheinvestableU.S.equitymarket.
Proof #4
20
T. Rowe Price Target Retirement Funds
Glossary (continued)
S&P target date indexes: Aseriesofunmanagedindexescomposedofdifferentallocationstostocks,bonds,andshort-terminvestmentsthatreflectreductionsinpotentialriskovertime.
S&P 500 Index: Anunmanagedindexthattracksthestocksof500primarilylarge-capU.S.companies.
Note:RussellInvestmentgroupisthesourceandownerofthetrademarks,servicemarks,andcopyrightsrelatedtotheRussellIndexes.Russell®isatrademarkofRussellInvestmentgroup.
Note:MSCImakesnoexpressorimpliedwarrantiesorrepresentationsandshallhavenoliabilitywhatsoeverwithrespecttoanyMSCIdatacontainedherein.TheMSCIdatamaynotbefurtherredistributedorusedasabasisforotherindicesoranysecuritiesorfinancialproducts.Thisreportisnotapproved,reviewed,orproducedbyMSCI.
Proof #4
21
T. Rowe Price Target Retirement Funds
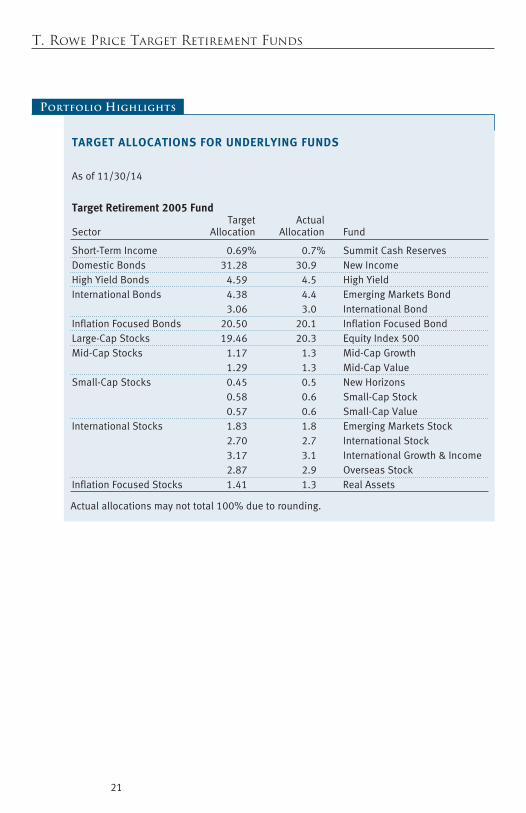
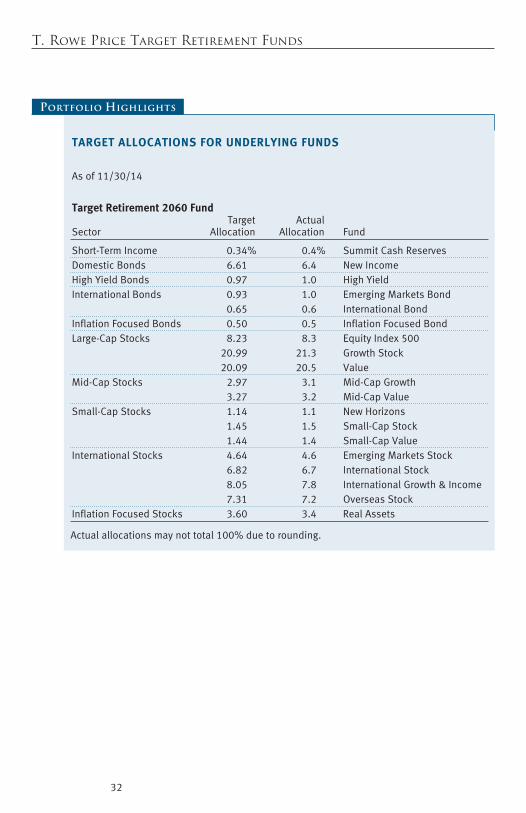
TARGET ALLOCATIONS FOR UNDERLYING FUNDS
Asof11/30/14
Target Retirement 2005 Fund Target ActualSector Allocation Allocation Fund
Short-TermIncome 0.69% 0.7% SummitCashReservesdomesticBonds 31.28 30.9 NewIncomeHighYieldBonds 4.59 4.5 HighYieldInternationalBonds 4.38 4.4 EmergingMarketsBond 3.06 3.0 InternationalBondInflationFocusedBonds 20.50 20.1 InflationFocusedBondLarge-CapStocks 19.46 20.3 EquityIndex500Mid-CapStocks 1.17 1.3 Mid-CapGrowth 1.29 1.3 Mid-CapvalueSmall-CapStocks 0.45 0.5 NewHorizons 0.58 0.6 Small-CapStock 0.57 0.6 Small-CapvalueInternationalStocks 1.83 1.8 EmergingMarketsStock 2.70 2.7 InternationalStock 3.17 3.1 InternationalGrowth&Income 2.87 2.9 OverseasStockInflationFocusedStocks 1.41 1.3 RealAssets
Actualallocationsmaynottotal100%duetorounding.
Portfolio Highlights
Proof #4
22
T. Rowe Price Target Retirement Funds
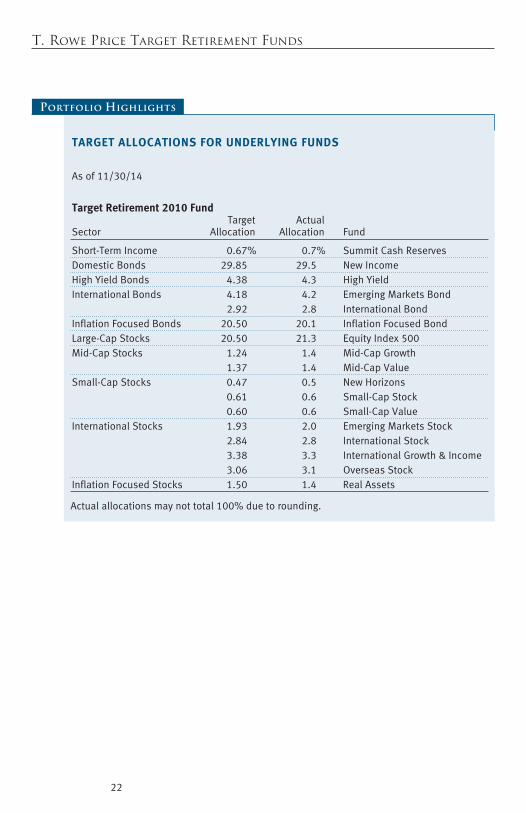
TARGET ALLOCATIONS FOR UNDERLYING FUNDS
Asof11/30/14
Target Retirement 2010 Fund Target ActualSector Allocation Allocation Fund
Short-TermIncome 0.67% 0.7% SummitCashReservesdomesticBonds 29.85 29.5 NewIncomeHighYieldBonds 4.38 4.3 HighYieldInternationalBonds 4.18 4.2 EmergingMarketsBond 2.92 2.8 InternationalBondInflationFocusedBonds 20.50 20.1 InflationFocusedBondLarge-CapStocks 20.50 21.3 EquityIndex500Mid-CapStocks 1.24 1.4 Mid-CapGrowth 1.37 1.4 Mid-CapvalueSmall-CapStocks 0.47 0.5 NewHorizons 0.61 0.6 Small-CapStock 0.60 0.6 Small-CapvalueInternationalStocks 1.93 2.0 EmergingMarketsStock 2.84 2.8 InternationalStock 3.38 3.3 InternationalGrowth&Income 3.06 3.1 OverseasStockInflationFocusedStocks 1.50 1.4 RealAssets
Actualallocationsmaynottotal100%duetorounding.
Portfolio Highlights
Proof #4
23
T. Rowe Price Target Retirement Funds
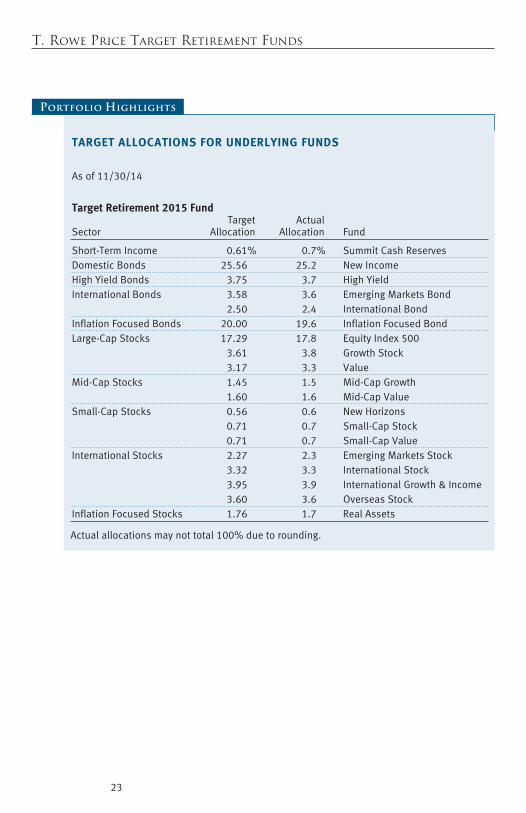
TARGET ALLOCATIONS FOR UNDERLYING FUNDS
Asof11/30/14
Target Retirement 2015 Fund Target ActualSector Allocation Allocation Fund
Short-TermIncome 0.61% 0.7% SummitCashReservesdomesticBonds 25.56 25.2 NewIncomeHighYieldBonds 3.75 3.7 HighYieldInternationalBonds 3.58 3.6 EmergingMarketsBond 2.50 2.4 InternationalBondInflationFocusedBonds 20.00 19.6 InflationFocusedBondLarge-CapStocks 17.29 17.8 EquityIndex500 3.61 3.8 GrowthStock 3.17 3.3 valueMid-CapStocks 1.45 1.5 Mid-CapGrowth 1.60 1.6 Mid-CapvalueSmall-CapStocks 0.56 0.6 NewHorizons 0.71 0.7 Small-CapStock 0.71 0.7 Small-CapvalueInternationalStocks 2.27 2.3 EmergingMarketsStock 3.32 3.3 InternationalStock 3.95 3.9 InternationalGrowth&Income 3.60 3.6 OverseasStockInflationFocusedStocks 1.76 1.7 RealAssets
Actualallocationsmaynottotal100%duetorounding.
Portfolio Highlights

Proof #4
24
T. Rowe Price Target Retirement Funds
TARGET ALLOCATIONS FOR UNDERLYING FUNDS
Asof11/30/14
Target Retirement 2020 Fund Target ActualSector Allocation Allocation Fund
Short-TermIncome 0.56% 0.6% SummitCashReservesdomesticBonds 21.98 21.6 NewIncomeHighYieldBonds 3.23 3.2 HighYieldInternationalBonds 3.08 3.0 EmergingMarketsBond 2.15 2.1 InternationalBondInflationFocusedBonds 17.50 17.1 InflationFocusedBondLarge-CapStocks 14.27 14.6 EquityIndex500 7.21 7.5 GrowthStock 6.70 7.0 valueMid-CapStocks 1.71 1.8 Mid-CapGrowth 1.88 1.9 Mid-CapvalueSmall-CapStocks 0.66 0.6 NewHorizons 0.83 0.8 Small-CapStock 0.83 0.8 Small-CapvalueInternationalStocks 2.65 2.7 EmergingMarketsStock 3.90 3.9 InternationalStock 4.62 4.6 InternationalGrowth&Income 4.19 4.2 OverseasStockInflationFocusedStocks 2.05 2.0 RealAssets
Actualallocationsmaynottotal100%duetorounding.
Portfolio Highlights

Proof #4
25
T. Rowe Price Target Retirement Funds
TARGET ALLOCATIONS FOR UNDERLYING FUNDS
Asof11/30/14
Target Retirement 2025 Fund Target ActualSector Allocation Allocation Fund
Short-TermIncome 0.54% 0.5% SummitCashReservesdomesticBonds 20.55 20.1 NewIncomeHighYieldBonds 3.02 3.0 HighYieldInternationalBonds 2.88 2.9 EmergingMarketsBond 2.01 2.0 InternationalBondInflationFocusedBonds 12.00 11.6 InflationFocusedBondLarge-CapStocks 11.90 12.2 EquityIndex500 10.50 10.8 GrowthStock 9.91 10.3 valueMid-CapStocks 1.94 2.0 Mid-CapGrowth 2.14 2.1 Mid-CapvalueSmall-CapStocks 0.75 0.8 NewHorizons 0.96 0.9 Small-CapStock 0.95 0.9 Small-CapvalueInternationalStocks 3.04 3.1 EmergingMarketsStock 4.46 4.5 InternationalStock 5.28 5.2 InternationalGrowth&Income 4.81 4.8 OverseasStockInflationFocusedStocks 2.36 2.3 RealAssets
Actualallocationsmaynottotal100%duetorounding.
Portfolio Highlights

Proof #4
26
T. Rowe Price Target Retirement Funds
TARGET ALLOCATIONS FOR UNDERLYING FUNDS
Asof11/30/14
Target Retirement 2030 Fund Target ActualSector Allocation Allocation Fund
Short-TermIncome 0.53% 0.6% SummitCashReservesdomesticBonds 19.84 19.3 NewIncomeHighYieldBonds 2.91 2.9 HighYieldInternationalBonds 2.78 2.7 EmergingMarketsBond 1.94 1.9 InternationalBondInflationFocusedBonds 6.00 5.8 InflationFocusedBondLarge-CapStocks 10.08 10.3 EquityIndex500 13.36 13.7 GrowthStock 12.70 13.1 valueMid-CapStocks 2.18 2.3 Mid-CapGrowth 2.40 2.4 Mid-CapvalueSmall-CapStocks 0.84 0.8 NewHorizons 1.07 1.1 Small-CapStock 1.06 1.0 Small-CapvalueInternationalStocks 3.39 3.4 EmergingMarketsStock 5.00 5.0 InternationalStock 5.92 5.8 InternationalGrowth&Income 5.37 5.4 OverseasStockInflationFocusedStocks 2.63 2.5 RealAssets
Actualallocationsmaynottotal100%duetorounding.
Portfolio Highlights

Proof #4
27
T. Rowe Price Target Retirement Funds
TARGET ALLOCATIONS FOR UNDERLYING FUNDS
Asof11/30/14
Target Retirement 2035 Fund Target ActualSector Allocation Allocation Fund
Short-TermIncome 0.51% 0.5% SummitCashReservesdomesticBonds 18.76 18.2 NewIncomeHighYieldBonds 2.76 2.7 HighYieldInternationalBonds 2.63 2.6 EmergingMarketsBond 1.84 1.8 InternationalBondInflationFocusedBonds 1.00 1.0 InflationFocusedBondLarge-CapStocks 7.85 8.0 EquityIndex500 16.29 16.7 GrowthStock 15.57 16.0 valueMid-CapStocks 2.39 2.5 Mid-CapGrowth 2.63 2.6 Mid-CapvalueSmall-CapStocks 0.93 0.9 NewHorizons 1.17 1.2 Small-CapStock 1.17 1.1 Small-CapvalueInternationalStocks 3.73 3.7 EmergingMarketsStock 5.48 5.5 InternationalStock 6.49 6.4 InternationalGrowth&Income 5.90 5.9 OverseasStockInflationFocusedStocks 2.90 2.7 RealAssets
Actualallocationsmaynottotal100%duetorounding.
Portfolio Highlights

Proof #4
28
T. Rowe Price Target Retirement Funds
TARGET ALLOCATIONS FOR UNDERLYING FUNDS
Asof11/30/14
Target Retirement 2040 Fund Target ActualSector Allocation Allocation Fund
Short-TermIncome 0.46% 0.5% SummitCashReservesdomesticBonds 15.19 14.7 NewIncomeHighYieldBonds 2.23 2.2 HighYieldInternationalBonds 2.13 2.1 EmergingMarketsBond 1.49 1.4 InternationalBondInflationFocusedBonds 0.50 0.5 InflationFocusedBondLarge-CapStocks 7.12 7.2 EquityIndex500 18.19 18.5 GrowthStock 17.41 17.8 valueMid-CapStocks 2.57 2.7 Mid-CapGrowth 2.83 2.8 Mid-CapvalueSmall-CapStocks 1.00 1.0 NewHorizons 1.25 1.3 Small-CapStock 1.26 1.2 Small-CapvalueInternationalStocks 4.01 4.0 EmergingMarketsStock 5.90 5.9 InternationalStock 7.00 6.9 InternationalGrowth&Income 6.34 6.3 OverseasStockInflationFocusedStocks 3.12 3.0 RealAssets
Actualallocationsmaynottotal100%duetorounding.
Portfolio Highlights

Proof #4
29
T. Rowe Price Target Retirement Funds
TARGET ALLOCATIONS FOR UNDERLYING FUNDS
Asof11/30/14
Target Retirement 2045 Fund Target ActualSector Allocation Allocation Fund
Short-TermIncome 0.41% 0.4% SummitCashReservesdomesticBonds 11.61 11.2 NewIncomeHighYieldBonds 1.71 1.7 HighYieldInternationalBonds 1.63 1.7 EmergingMarketsBond 1.14 1.1 InternationalBondInflationFocusedBonds 0.50 0.5 InflationFocusedBondLarge-CapStocks 7.58 7.7 EquityIndex500 19.35 19.7 GrowthStock 18.51 18.9 valueMid-CapStocks 2.74 2.9 Mid-CapGrowth 3.02 3.0 Mid-CapvalueSmall-CapStocks 1.06 1.1 NewHorizons 1.33 1.3 Small-CapStock 1.34 1.3 Small-CapvalueInternationalStocks 4.27 4.2 EmergingMarketsStock 6.27 6.2 InternationalStock 7.45 7.3 InternationalGrowth&Income 6.77 6.7 OverseasStockInflationFocusedStocks 3.31 3.1 RealAssets
Actualallocationsmaynottotal100%duetorounding.
Portfolio Highlights

Proof #4
30
T. Rowe Price Target Retirement Funds
TARGET ALLOCATIONS FOR UNDERLYING FUNDS
Asof11/30/14
Target Retirement 2050 Fund Target ActualSector Allocation Allocation Fund
Short-TermIncome 0.37% 0.4% SummitCashReservesdomesticBonds 8.75 8.4 NewIncomeHighYieldBonds 1.29 1.3 HighYieldInternationalBonds 1.23 1.3 EmergingMarketsBond 0.86 0.8 InternationalBondInflationFocusedBonds 0.50 0.5 InflationFocusedBondLarge-CapStocks 7.94 8.0 EquityIndex500 20.29 20.6 GrowthStock 19.42 19.8 valueMid-CapStocks 2.87 3.0 Mid-CapGrowth 3.16 3.2 Mid-CapvalueSmall-CapStocks 1.11 1.1 NewHorizons 1.40 1.4 Small-CapStock 1.40 1.3 Small-CapvalueInternationalStocks 4.47 4.4 EmergingMarketsStock 6.60 6.6 InternationalStock 7.80 7.6 InternationalGrowth&Income 7.07 7.0 OverseasStockInflationFocusedStocks 3.47 3.3 RealAssets
Actualallocationsmaynottotal100%duetorounding.
Portfolio Highlights

Proof #4
31
T. Rowe Price Target Retirement Funds
TARGET ALLOCATIONS FOR UNDERLYING FUNDS
Asof11/30/14
Target Retirement 2055 Fund Target ActualSector Allocation Allocation Fund
Short-TermIncome 0.34% 0.3% SummitCashReservesdomesticBonds 6.61 6.4 NewIncomeHighYieldBonds 0.97 1.0 HighYieldInternationalBonds 0.93 1.0 EmergingMarketsBond 0.65 0.6 InternationalBondInflationFocusedBonds 0.50 0.5 InflationFocusedBondLarge-CapStocks 8.23 8.3 EquityIndex500 20.99 21.3 GrowthStock 20.09 20.5 valueMid-CapStocks 2.97 3.1 Mid-CapGrowth 3.27 3.2 Mid-CapvalueSmall-CapStocks 1.14 1.2 NewHorizons 1.45 1.5 Small-CapStock 1.44 1.4 Small-CapvalueInternationalStocks 4.64 4.6 EmergingMarketsStock 6.82 6.7 InternationalStock 8.05 7.8 InternationalGrowth&Income 7.31 7.2 OverseasStockInflationFocusedStocks 3.60 3.4 RealAssets
Actualallocationsmaynottotal100%duetorounding.
Portfolio Highlights
Proof #4
32
T. Rowe Price Target Retirement Funds
TARGET ALLOCATIONS FOR UNDERLYING FUNDS
Asof11/30/14
Target Retirement 2060 Fund Target ActualSector Allocation Allocation Fund
Short-TermIncome 0.34% 0.4% SummitCashReservesdomesticBonds 6.61 6.4 NewIncomeHighYieldBonds 0.97 1.0 HighYieldInternationalBonds 0.93 1.0 EmergingMarketsBond 0.65 0.6 InternationalBondInflationFocusedBonds 0.50 0.5 InflationFocusedBondLarge-CapStocks 8.23 8.3 EquityIndex500 20.99 21.3 GrowthStock 20.09 20.5 valueMid-CapStocks 2.97 3.1 Mid-CapGrowth 3.27 3.2 Mid-CapvalueSmall-CapStocks 1.14 1.1 NewHorizons 1.45 1.5 Small-CapStock 1.44 1.4 Small-CapvalueInternationalStocks 4.64 4.6 EmergingMarketsStock 6.82 6.7 InternationalStock 8.05 7.8 InternationalGrowth&Income 7.31 7.2 OverseasStockInflationFocusedStocks 3.60 3.4 RealAssets
Actualallocationsmaynottotal100%duetorounding.
Portfolio Highlights
Proof #4
33
T. Rowe Price Target Retirement Funds
Performance and Expenses
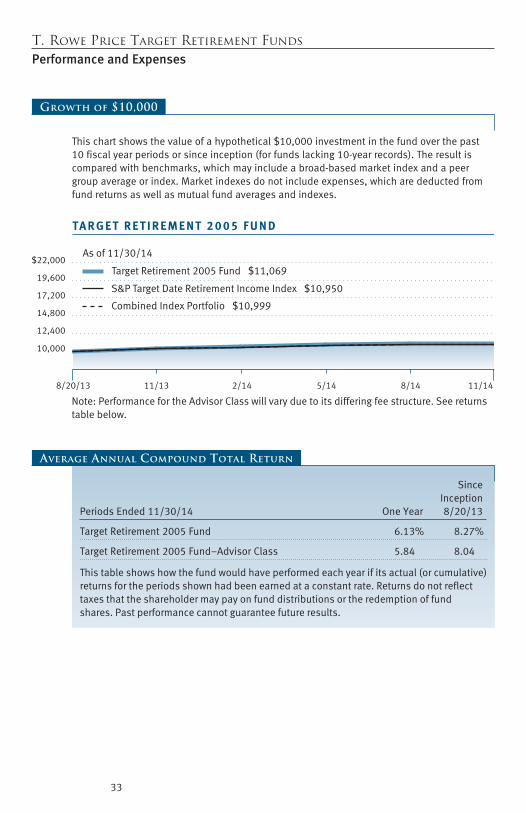
S&P Target Date Retirement Income Index $10,950
Target Retirement 2005 Fund $11,069
As of 11/30/14
8/20/13 11/13 2/14 5/14 8/14 11/14
TA R G E T R E T I R E M E N T 2 0 0 5 F U N D
$22,000
19,600
17,200
14,800
12,400
10,000
Combined Index Portfolio $10,999
Note: Performance for the Advisor Class will vary due to its differing fee structure. See returnstable below.
Growth of $10,000
Thischartshowsthevalueofahypothetical$10,000investmentinthefundoverthepast10fiscalyearperiodsorsinceinception(forfundslacking10-yearrecords).Theresultiscomparedwithbenchmarks,whichmayincludeabroad-basedmarketindexandapeergroupaverageorindex.Marketindexesdonotincludeexpenses,whicharedeductedfromfundreturnsaswellasmutualfundaveragesandindexes.
Since InceptionPeriodsEnded11/30/14 OneYear 8/20/13
TargetRetirement2005Fund 6.13% 8.27%
TargetRetirement2005Fund–AdvisorClass 5.84 8.04
Thistableshowshowthefundwouldhaveperformedeachyearifitsactual(orcumulative)returnsfortheperiodsshownhadbeenearnedataconstantrate.Returnsdonotreflecttaxesthattheshareholdermaypayonfunddistributionsortheredemptionoffundshares.Pastperformancecannotguaranteefutureresults.
Average Annual Compound Total Return

Proof #4
34
T. Rowe Price Target Retirement Funds
As of 11/30/14
8/20/13 11/13 2/14 5/14 8/14 11/14
TA R G E T R E T I R E M E N T 2 0 1 0 F U N D
$22,000
19,600
17,200
14,800
12,400
10,000
Target Retirement 2010 Fund $11,130
Combined Index Portfolio $11,034
S&P Target Date 2010 Index $11,105
Note: Performance for the Advisor Class will vary due to its differing fee structure. See returnstable below.
Growth of $10,000
Thischartshowsthevalueofahypothetical$10,000investmentinthefundoverthepast10fiscalyearperiodsorsinceinception(forfundslacking10-yearrecords).Theresultiscomparedwithbenchmarks,whichmayincludeabroad-basedmarketindexandapeergroupaverageorindex.Marketindexesdonotincludeexpenses,whicharedeductedfromfundreturnsaswellasmutualfundaveragesandindexes.
Since InceptionPeriodsEnded11/30/14 OneYear 8/20/13
TargetRetirement2010Fund 6.30% 8.73%
TargetRetirement2010Fund–AdvisorClass 6.01 8.42
Thistableshowshowthefundwouldhaveperformedeachyearifitsactual(orcumulative)returnsfortheperiodsshownhadbeenearnedataconstantrate.Returnsdonotreflecttaxesthattheshareholdermaypayonfunddistributionsortheredemptionoffundshares.Pastperformancecannotguaranteefutureresults.
Average Annual Compound Total Return

Proof #4
35
T. Rowe Price Target Retirement Funds
S&P Target Date 2015 Index $11,264
Target Retirement 2015 Fund $11,224
As of 11/30/14
8/20/13 11/13 2/14 5/14 8/14 11/14
TA R G E T R E T I R E M E N T 2 0 1 5 F U N D
$22,000
19,600
17,200
14,800
12,400
10,000
Combined Index Portfolio $11,136
Note: Performance for the Advisor Class will vary due to its differing fee structure. See returnstable below.
Growth of $10,000
Thischartshowsthevalueofahypothetical$10,000investmentinthefundoverthepast10fiscalyearperiodsorsinceinception(forfundslacking10-yearrecords).Theresultiscomparedwithbenchmarks,whichmayincludeabroad-basedmarketindexandapeergroupaverageorindex.Marketindexesdonotincludeexpenses,whicharedeductedfromfundreturnsaswellasmutualfundaveragesandindexes.
Since InceptionPeriodsEnded11/30/14 OneYear 8/20/13
TargetRetirement2015Fund 6.60% 9.45%
TargetRetirement2015Fund–AdvisorClass 6.40 9.22
Thistableshowshowthefundwouldhaveperformedeachyearifitsactual(orcumulative)returnsfortheperiodsshownhadbeenearnedataconstantrate.Returnsdonotreflecttaxesthattheshareholdermaypayonfunddistributionsortheredemptionoffundshares.Pastperformancecannotguaranteefutureresults.
Average Annual Compound Total Return

Proof #4
36
T. Rowe Price Target Retirement Funds
S&P Target Date 2020 Index $11,393
Target Retirement 2020 Fund $11,361
As of 11/30/14
8/20/13 11/13 2/14 5/14 8/14 11/14
TA R G E T R E T I R E M E N T 2 0 2 0 F U N D
$22,000
19,600
17,200
14,800
12,400
10,000
Combined Index Portfolio $11,260
Note: Performance for the Advisor Class will vary due to its differing fee structure. See returnstable below.
Growth of $10,000
Thischartshowsthevalueofahypothetical$10,000investmentinthefundoverthepast10fiscalyearperiodsorsinceinception(forfundslacking10-yearrecords).Theresultiscomparedwithbenchmarks,whichmayincludeabroad-basedmarketindexandapeergroupaverageorindex.Marketindexesdonotincludeexpenses,whicharedeductedfromfundreturnsaswellasmutualfundaveragesandindexes.
Since InceptionPeriodsEnded11/30/14 OneYear 8/20/13
TargetRetirement2020Fund 7.08% 10.49%
TargetRetirement2020Fund–AdvisorClass 6.89 10.26
Thistableshowshowthefundwouldhaveperformedeachyearifitsactual(orcumulative)returnsfortheperiodsshownhadbeenearnedataconstantrate.Returnsdonotreflecttaxesthattheshareholdermaypayonfunddistributionsortheredemptionoffundshares.Pastperformancecannotguaranteefutureresults.
Average Annual Compound Total Return

Proof #4
37
T. Rowe Price Target Retirement Funds
S&P Target Date 2025 Index $11,475
Target Retirement 2025 Fund $11,517
As of 11/30/14
8/20/13 11/13 2/14 5/14 8/14 11/14
TA R G E T R E T I R E M E N T 2 0 2 5 F U N D
$22,000
19,600
17,200
14,800
12,400
10,000
Combined Index Portfolio $11,406
Note: Performance for the Advisor Class will vary due to its differing fee structure. See returnstable below.
Growth of $10,000
Thischartshowsthevalueofahypothetical$10,000investmentinthefundoverthepast10fiscalyearperiodsorsinceinception(forfundslacking10-yearrecords).Theresultiscomparedwithbenchmarks,whichmayincludeabroad-basedmarketindexandapeergroupaverageorindex.Marketindexesdonotincludeexpenses,whicharedeductedfromfundreturnsaswellasmutualfundaveragesandindexes.
Since InceptionPeriodsEnded11/30/14 OneYear 8/20/13
TargetRetirement2025Fund 7.73% 11.68%
TargetRetirement2025Fund–AdvisorClass 7.54 11.44
Thistableshowshowthefundwouldhaveperformedeachyearifitsactual(orcumulative)returnsfortheperiodsshownhadbeenearnedataconstantrate.Returnsdonotreflecttaxesthattheshareholdermaypayonfunddistributionsortheredemptionoffundshares.Pastperformancecannotguaranteefutureresults.
Average Annual Compound Total Return
Proof #4
38
T. Rowe Price Target Retirement Funds
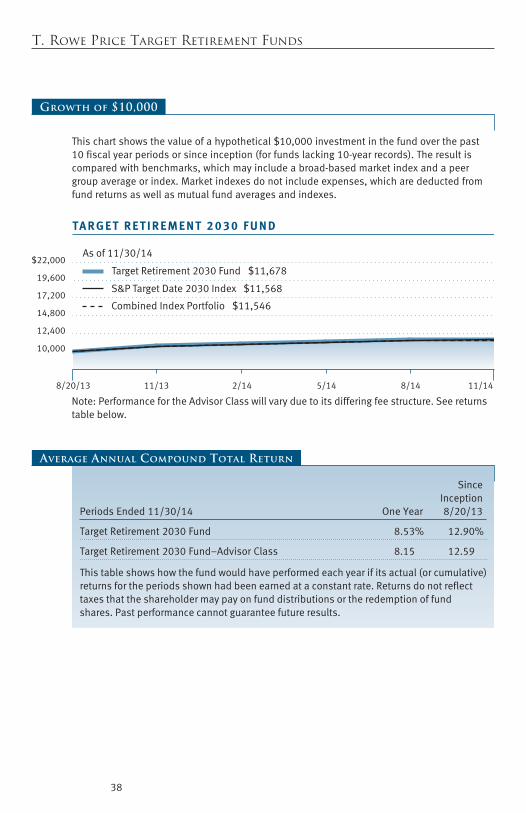
S&P Target Date 2030 Index $11,568
Target Retirement 2030 Fund $11,678
As of 11/30/14
8/20/13 11/13 2/14 5/14 8/14 11/14
TA R G E T R E T I R E M E N T 2 0 3 0 F U N D
$22,000
19,600
17,200
14,800
12,400
10,000
Combined Index Portfolio $11,546
Note: Performance for the Advisor Class will vary due to its differing fee structure. See returnstable below.
Growth of $10,000
Thischartshowsthevalueofahypothetical$10,000investmentinthefundoverthepast10fiscalyearperiodsorsinceinception(forfundslacking10-yearrecords).Theresultiscomparedwithbenchmarks,whichmayincludeabroad-basedmarketindexandapeergroupaverageorindex.Marketindexesdonotincludeexpenses,whicharedeductedfromfundreturnsaswellasmutualfundaveragesandindexes.
Since InceptionPeriodsEnded11/30/14 OneYear 8/20/13
TargetRetirement2030Fund 8.53% 12.90%
TargetRetirement2030Fund–AdvisorClass 8.15 12.59
Thistableshowshowthefundwouldhaveperformedeachyearifitsactual(orcumulative)returnsfortheperiodsshownhadbeenearnedataconstantrate.Returnsdonotreflecttaxesthattheshareholdermaypayonfunddistributionsortheredemptionoffundshares.Pastperformancecannotguaranteefutureresults.
Average Annual Compound Total Return

Proof #4
39
T. Rowe Price Target Retirement Funds
S&P Target Date 2035 Index $11,651
Target Retirement 2035 Fund $11,815
As of 11/30/14
8/20/13 11/13 2/14 5/14 8/14 11/14
TA R G E T R E T I R E M E N T 2 0 3 5 F U N D
$22,000
19,600
17,200
14,800
12,400
10,000
Combined Index Portfolio $11,674
Note: Performance for the Advisor Class will vary due to its differing fee structure. See returnstable below.
Growth of $10,000
Thischartshowsthevalueofahypothetical$10,000investmentinthefundoverthepast10fiscalyearperiodsorsinceinception(forfundslacking10-yearrecords).Theresultiscomparedwithbenchmarks,whichmayincludeabroad-basedmarketindexandapeergroupaverageorindex.Marketindexesdonotincludeexpenses,whicharedeductedfromfundreturnsaswellasmutualfundaveragesandindexes.
Since InceptionPeriodsEnded11/30/14 OneYear 8/20/13
TargetRetirement2035Fund 9.19% 13.93%
TargetRetirement2035Fund–AdvisorClass 8.80 13.70
Thistableshowshowthefundwouldhaveperformedeachyearifitsactual(orcumulative)returnsfortheperiodsshownhadbeenearnedataconstantrate.Returnsdonotreflecttaxesthattheshareholdermaypayonfunddistributionsortheredemptionoffundshares.Pastperformancecannotguaranteefutureresults.
Average Annual Compound Total Return

Proof #4
40
T. Rowe Price Target Retirement Funds
S&P Target Date 2040 Index $11,707
Target Retirement 2040 Fund $11,895
As of 11/30/14
8/20/13 11/13 2/14 5/14 8/14 11/14
TA R G E T R E T I R E M E N T 2 0 4 0 F U N D
$22,000
19,600
17,200
14,800
12,400
10,000
Combined Index Portfolio $11,751
Note: Performance for the Advisor Class will vary due to its differing fee structure. See returnstable below.
Growth of $10,000
Thischartshowsthevalueofahypothetical$10,000investmentinthefundoverthepast10fiscalyearperiodsorsinceinception(forfundslacking10-yearrecords).Theresultiscomparedwithbenchmarks,whichmayincludeabroad-basedmarketindexandapeergroupaverageorindex.Marketindexesdonotincludeexpenses,whicharedeductedfromfundreturnsaswellasmutualfundaveragesandindexes.
Since InceptionPeriodsEnded11/30/14 OneYear 8/20/13
TargetRetirement2040Fund 9.33% 14.54%
TargetRetirement2040Fund–AdvisorClass 9.04 14.30
Thistableshowshowthefundwouldhaveperformedeachyearifitsactual(orcumulative)returnsfortheperiodsshownhadbeenearnedataconstantrate.Returnsdonotreflecttaxesthattheshareholdermaypayonfunddistributionsortheredemptionoffundshares.Pastperformancecannotguaranteefutureresults.
Average Annual Compound Total Return

Proof #4
41
T. Rowe Price Target Retirement Funds
S&P Target Date 2045 Index $11,749
Target Retirement 2045 Fund $11,971
As of 11/30/14
8/20/13 11/13 2/14 5/14 8/14 11/14
TA R G E T R E T I R E M E N T 2 0 4 5 F U N D
$22,000
19,600
17,200
14,800
12,400
10,000
Combined Index Portfolio $11,824
Note: Performance for the Advisor Class will vary due to its differing fee structure. See returnstable below.
Growth of $10,000
Thischartshowsthevalueofahypothetical$10,000investmentinthefundoverthepast10fiscalyearperiodsorsinceinception(forfundslacking10-yearrecords).Theresultiscomparedwithbenchmarks,whichmayincludeabroad-basedmarketindexandapeergroupaverageorindex.Marketindexesdonotincludeexpenses,whicharedeductedfromfundreturnsaswellasmutualfundaveragesandindexes.
Since InceptionPeriodsEnded11/30/14 OneYear 8/20/13
TargetRetirement2045Fund 9.53% 15.11%
TargetRetirement2045Fund–AdvisorClass 9.25 14.80
Thistableshowshowthefundwouldhaveperformedeachyearifitsactual(orcumulative)returnsfortheperiodsshownhadbeenearnedataconstantrate.Returnsdonotreflecttaxesthattheshareholdermaypayonfunddistributionsortheredemptionoffundshares.Pastperformancecannotguaranteefutureresults.
Average Annual Compound Total Return
Proof #4
42
T. Rowe Price Target Retirement Funds
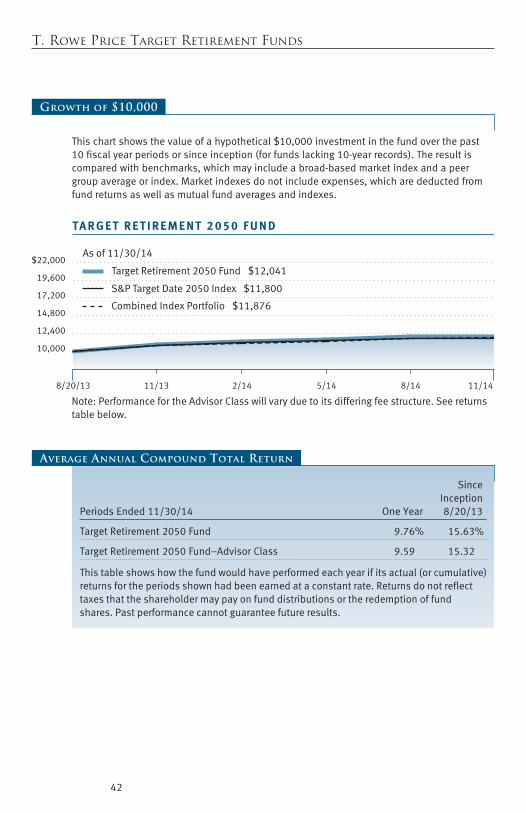
S&P Target Date 2050 Index $11,800
Target Retirement 2050 Fund $12,041
As of 11/30/14
8/20/13 11/13 2/14 5/14 8/14 11/14
TA R G E T R E T I R E M E N T 2 0 5 0 F U N D
$22,000
19,600
17,200
14,800
12,400
10,000
Combined Index Portfolio $11,876
Note: Performance for the Advisor Class will vary due to its differing fee structure. See returnstable below.
Growth of $10,000
Thischartshowsthevalueofahypothetical$10,000investmentinthefundoverthepast10fiscalyearperiodsorsinceinception(forfundslacking10-yearrecords).Theresultiscomparedwithbenchmarks,whichmayincludeabroad-basedmarketindexandapeergroupaverageorindex.Marketindexesdonotincludeexpenses,whicharedeductedfromfundreturnsaswellasmutualfundaveragesandindexes.
Since InceptionPeriodsEnded11/30/14 OneYear 8/20/13
TargetRetirement2050Fund 9.76% 15.63%
TargetRetirement2050Fund–AdvisorClass 9.59 15.32
Thistableshowshowthefundwouldhaveperformedeachyearifitsactual(orcumulative)returnsfortheperiodsshownhadbeenearnedataconstantrate.Returnsdonotreflecttaxesthattheshareholdermaypayonfunddistributionsortheredemptionoffundshares.Pastperformancecannotguaranteefutureresults.
Average Annual Compound Total Return

Proof #4
43
T. Rowe Price Target Retirement Funds
S&P Target Date 2055+ Index $11,834
Target Retirement 2055 Fund $12,071
As of 11/30/14
8/20/13 11/13 2/14 5/14 8/14 11/14
TA R G E T R E T I R E M E N T 2 0 5 5 F U N D
$22,000
19,600
17,200
14,800
12,400
10,000
Combined Index Portfolio $11,912
Note: Performance for the Advisor Class will vary due to its differing fee structure. See returnstable below.
Growth of $10,000
Thischartshowsthevalueofahypothetical$10,000investmentinthefundoverthepast10fiscalyearperiodsorsinceinception(forfundslacking10-yearrecords).Theresultiscomparedwithbenchmarks,whichmayincludeabroad-basedmarketindexandapeergroupaverageorindex.Marketindexesdonotincludeexpenses,whicharedeductedfromfundreturnsaswellasmutualfundaveragesandindexes.
Since InceptionPeriodsEnded11/30/14 OneYear 8/20/13
TargetRetirement2055Fund 10.04% 15.86%
TargetRetirement2055Fund–AdvisorClass 9.66 15.55
Thistableshowshowthefundwouldhaveperformedeachyearifitsactual(orcumulative)returnsfortheperiodsshownhadbeenearnedataconstantrate.Returnsdonotreflecttaxesthattheshareholdermaypayonfunddistributionsortheredemptionoffundshares.Pastperformancecannotguaranteefutureresults.
Average Annual Compound Total Return
Proof #4
44
T. Rowe Price Target Retirement Funds
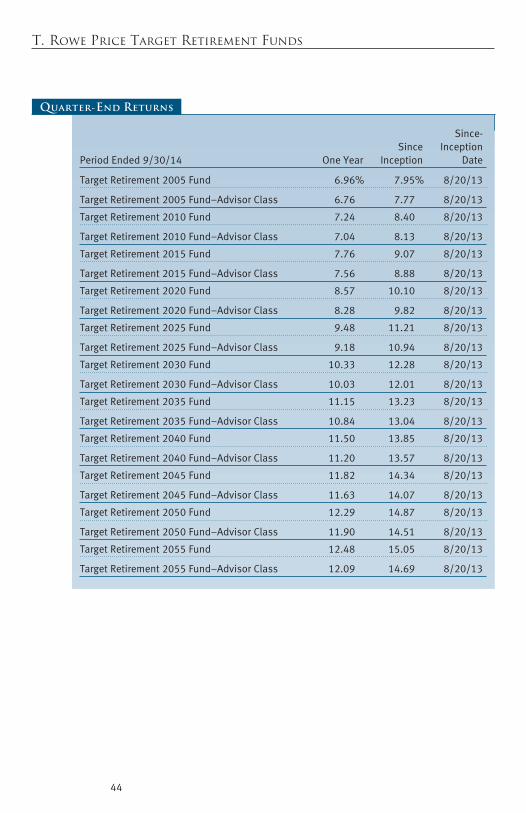
Since- Since InceptionPeriodEnded9/30/14 OneYear Inception date
TargetRetirement2005Fund 6.96% 7.95% 8/20/13
TargetRetirement2005Fund–AdvisorClass 6.76 7.77 8/20/13
TargetRetirement2010Fund 7.24 8.40 8/20/13
TargetRetirement2010Fund–AdvisorClass 7.04 8.13 8/20/13
TargetRetirement2015Fund 7.76 9.07 8/20/13
TargetRetirement2015Fund–AdvisorClass 7.56 8.88 8/20/13
TargetRetirement2020Fund 8.57 10.10 8/20/13
TargetRetirement2020Fund–AdvisorClass 8.28 9.82 8/20/13
TargetRetirement2025Fund 9.48 11.21 8/20/13
TargetRetirement2025Fund–AdvisorClass 9.18 10.94 8/20/13
TargetRetirement2030Fund 10.33 12.28 8/20/13
TargetRetirement2030Fund–AdvisorClass 10.03 12.01 8/20/13
TargetRetirement2035Fund 11.15 13.23 8/20/13
TargetRetirement2035Fund–AdvisorClass 10.84 13.04 8/20/13
TargetRetirement2040Fund 11.50 13.85 8/20/13
TargetRetirement2040Fund–AdvisorClass 11.20 13.57 8/20/13
TargetRetirement2045Fund 11.82 14.34 8/20/13
TargetRetirement2045Fund–AdvisorClass 11.63 14.07 8/20/13
TargetRetirement2050Fund 12.29 14.87 8/20/13
TargetRetirement2050Fund–AdvisorClass 11.90 14.51 8/20/13
TargetRetirement2055Fund 12.48 15.05 8/20/13
TargetRetirement2055Fund–AdvisorClass 12.09 14.69 8/20/13
Quarter-End Returns
Proof #4
45
T. Rowe Price Target Retirement Funds
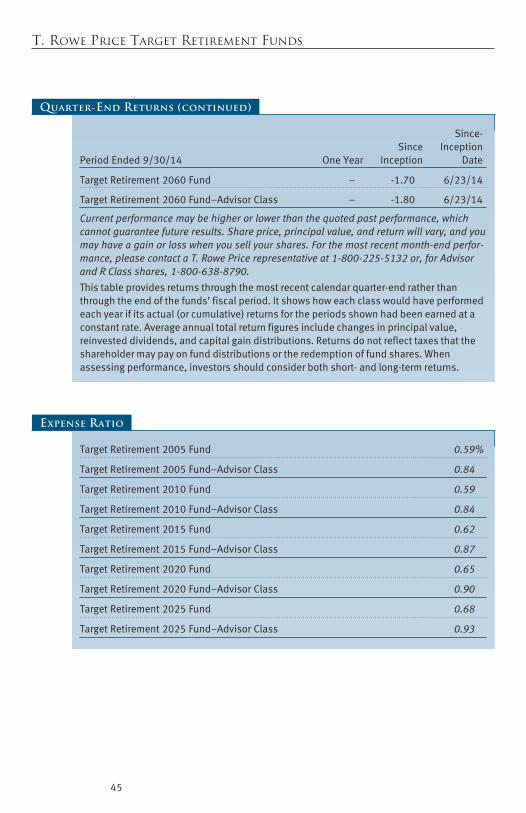
TargetRetirement2005Fund 0.59%
TargetRetirement2005Fund–AdvisorClass 0.84
TargetRetirement2010Fund 0.59
TargetRetirement2010Fund–AdvisorClass 0.84
TargetRetirement2015Fund 0.62
TargetRetirement2015Fund–AdvisorClass 0.87
TargetRetirement2020Fund 0.65
TargetRetirement2020Fund–AdvisorClass 0.90
TargetRetirement2025Fund 0.68
TargetRetirement2025Fund–AdvisorClass 0.93
Expense Ratio
Since- Since InceptionPeriodEnded9/30/14 OneYear Inception date
TargetRetirement2060Fund – -1.70 6/23/14
TargetRetirement2060Fund–AdvisorClass – -1.80 6/23/14
Current performance may be higher or lower than the quoted past performance, which cannot guarantee future results. Share price, principal value, and return will vary, and you may have a gain or loss when you sell your shares. For the most recent month-end perfor-mance, please contact a T. Rowe Price representative at 1-800-225-5132 or, for Advisor and R Class shares, 1-800-638-8790.
Thistableprovidesreturnsthroughthemostrecentcalendarquarter-endratherthanthroughtheendofthefunds’fiscalperiod.Itshowshoweachclasswouldhaveperformedeachyearifitsactual(orcumulative)returnsfortheperiodsshownhadbeenearnedataconstantrate.Averageannualtotalreturnfiguresincludechangesinprincipalvalue,reinvesteddividends,andcapitalgaindistributions.Returnsdonotreflecttaxesthattheshareholdermaypayonfunddistributionsortheredemptionoffundshares.Whenassessingperformance,investorsshouldconsiderbothshort-andlong-termreturns.
Quarter-End Returns (continued)
Proof #4
46
T. Rowe Price Target Retirement Funds
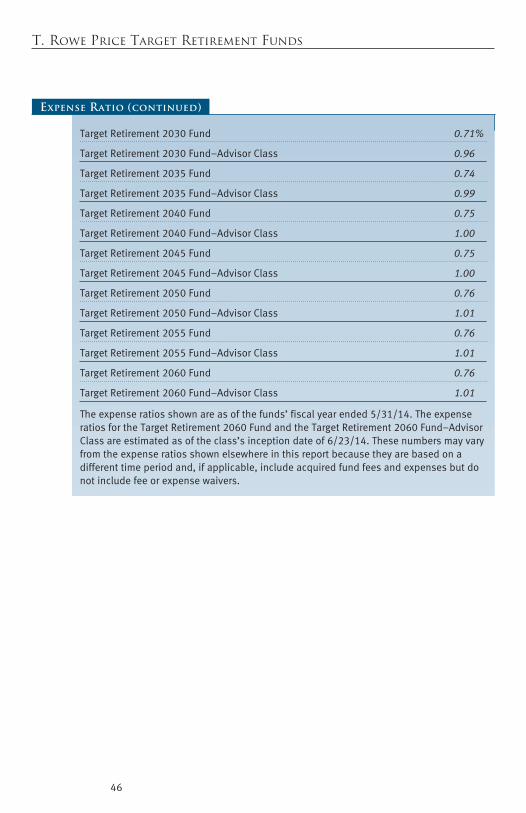
TargetRetirement2030Fund 0.71%
TargetRetirement2030Fund–AdvisorClass 0.96
TargetRetirement2035Fund 0.74
TargetRetirement2035Fund–AdvisorClass 0.99
TargetRetirement2040Fund 0.75
TargetRetirement2040Fund–AdvisorClass 1.00
TargetRetirement2045Fund 0.75
TargetRetirement2045Fund–AdvisorClass 1.00
TargetRetirement2050Fund 0.76
TargetRetirement2050Fund–AdvisorClass 1.01
TargetRetirement2055Fund 0.76
TargetRetirement2055Fund–AdvisorClass 1.01
TargetRetirement2060Fund 0.76
TargetRetirement2060Fund–AdvisorClass 1.01
Theexpenseratiosshownareasofthefunds’fiscalyearended5/31/14.TheexpenseratiosfortheTargetRetirement2060FundandtheTargetRetirement2060Fund–AdvisorClassareestimatedasoftheclass’sinceptiondateof6/23/14.Thesenumbersmayvaryfromtheexpenseratiosshownelsewhereinthisreportbecausetheyarebasedonadifferenttimeperiodand,ifapplicable,includeacquiredfundfeesandexpensesbutdonotincludefeeorexpensewaivers.
Expense Ratio (continued)
Proof #4
47
T. Rowe Price Target Retirement Funds
Fund Expense Example
Asamutualfundshareholder,youmayincurtwotypesofcosts:(1)transactioncosts,suchasredemptionfeesorsalesloads,and(2)ongoingcosts,includingmanagementfees,distribu-tionandservice(12b-1)fees,andotherfundexpenses.Thefollowingexampleisintendedtohelpyouunderstandyourongoingcosts(indollars)ofinvestinginthefundandtocomparethesecostswiththeongoingcostsofinvestinginothermutualfunds.Theexampleisbasedonaninvestmentof$1,000investedatthebeginningofthemostrecentsix-monthperiodandheldfortheentireperiod.
Pleasenotethatthefundhasthreeshareclasses:Theoriginalshareclass(InvestorClass)chargesnodistributionandservice(12b-1)fee;AdvisorClasssharesareofferedonlythroughunaffiliatedbrokersandotherfinancialintermediariesandchargea0.25%12b-1fee;andRClasssharesareavailabletoretirementplansservicedbyintermediariesandchargea0.50%12b-1fee.Eachshareclassispresentedseparatelyinthetable.
Actual ExpensesThefirstlineofthefollowingtable(Actual)providesinformationaboutactualaccountvaluesandexpensesbasedonthefund’sactualreturns.Youmayusetheinformationonthisline,togetherwithyouraccountbalance,toestimatetheexpensesthatyoupaidovertheperiod.Simplydivideyouraccountvalueby$1,000(forexample,an$8,600accountvaluedividedby$1,000=8.6),thenmultiplytheresultbythenumberonthefirstlineundertheheading“ExpensesPaidduringPeriod”toestimatetheexpensesyoupaidonyouraccountduringthisperiod.
Hypothetical Example for Comparison PurposesTheinformationonthesecondlineofthetable(Hypothetical)isbasedonhypotheticalaccountvaluesandexpensesderivedfromthefund’sactualexpenseratioandanassumed5%peryearrateofreturnbeforeexpenses(notthefund’sactualreturn).Youmaycomparetheongoingcostsofinvestinginthefundwithotherfundsbycontrastingthis5%hypotheticalexampleandthe5%hypotheticalexamplesthatappearintheshareholderreportsoftheotherfunds.Thehypotheticalaccountvaluesandexpensesmaynotbeusedtoestimatetheactualendingaccountbalanceorexpensesyoupaidfortheperiod.
Note: T.RowePricechargesanannualaccountservicefeeof$20,generallyforaccountswithlessthan$10,000.ThefeeiswaivedforanyinvestorwhoseT.RowePricemutualfundaccountstotal$50,000ormore;accountselectingtoreceiveelectronicdeliveryofaccountstatements,transactionconfirmations,prospectuses,andshareholderreports;oraccountsofaninvestorwhoisaT.RowePricePreferredServices,PersonalServices,orEnhancedPersonalServicesclient(enrollmentintheseprogramsgenerallyrequiresT.RowePriceassetsofatleast$100,000).Thisfeeisnotincludedintheaccompanyingtable.Ifyouaresubjecttothefee,keepitinmindwhenyouareestimatingtheongoingexpensesofinvestinginthefundandwhencomparingtheexpensesofthisfundwithotherfunds.
Youshouldalsobeawarethattheexpensesshowninthetablehighlightonlyyourongoingcostsanddonotreflectanytransactioncosts,suchasredemptionfeesorsalesloads.Therefore,thesecondlineofthetableisusefulincomparingongoingcostsonlyandwillnothelpyoudeterminetherelativetotalcostsofowningdifferentfunds.Totheextentafundchargestransactioncosts,however,thetotalcostofowningthatfundishigher.
Proof #4
48
T. Rowe Price Target Retirement Funds
Fund Expense Example (continued)
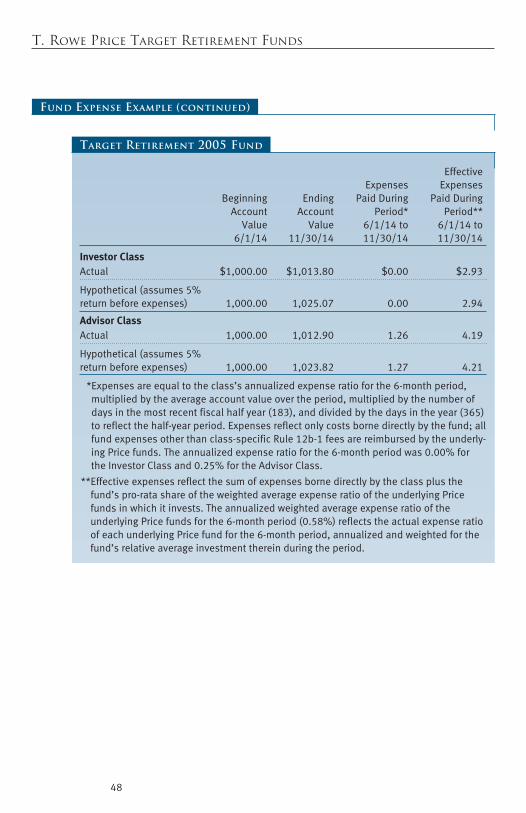
Effective Expenses Expenses Beginning Ending Paidduring Paidduring Account Account Period* Period** value value 6/1/14to 6/1/14to 6/1/14 11/30/14 11/30/14 11/30/14
Investor ClassActual $1,000.00 $1,013.80 $0.00 $2.93
Hypothetical(assumes5%returnbeforeexpenses) 1,000.00 1,025.07 0.00 2.94
Advisor ClassActual 1,000.00 1,012.90 1.26 4.19
Hypothetical(assumes5%returnbeforeexpenses) 1,000.00 1,023.82 1.27 4.21
*Expensesareequaltotheclass’sannualizedexpenseratioforthe6-monthperiod,multipliedbytheaverageaccountvalueovertheperiod,multipliedbythenumberofdaysinthemostrecentfiscalhalfyear(183),anddividedbythedaysintheyear(365)toreflectthehalf-yearperiod.Expensesreflectonlycostsbornedirectlybythefund;allfundexpensesotherthanclass-specificRule12b-1feesarereimbursedbytheunderly-ingPricefunds.Theannualizedexpenseratioforthe6-monthperiodwas0.00%fortheInvestorClassand0.25%fortheAdvisorClass.
**Effectiveexpensesreflectthesumofexpensesbornedirectlybytheclassplusthefund’spro-ratashareoftheweightedaverageexpenseratiooftheunderlyingPricefundsinwhichitinvests.TheannualizedweightedaverageexpenseratiooftheunderlyingPricefundsforthe6-monthperiod(0.58%)reflectstheactualexpenseratioofeachunderlyingPricefundforthe6-monthperiod,annualizedandweightedforthefund’srelativeaverageinvestmentthereinduringtheperiod.
Target Retirement 2005 Fund

Proof #4
49
T. Rowe Price Target Retirement Funds
Effective Expenses Expenses Beginning Ending Paidduring Paidduring Account Account Period* Period** value value 6/1/14to 6/1/14to 6/1/14 11/30/14 11/30/14 11/30/14
Investor ClassActual $1,000.00 $1,014.70 $0.00 $2.93
Hypothetical(assumes5%returnbeforeexpenses) 1,000.00 1,025.07 0.00 2.94
Advisor ClassActual 1,000.00 1,013.80 1.26 4.19
Hypothetical(assumes5%returnbeforeexpenses) 1,000.00 1,023.82 1.27 4.21
*Expensesareequaltotheclass’sannualizedexpenseratioforthe6-monthperiod,multipliedbytheaverageaccountvalueovertheperiod,multipliedbythenumberofdaysinthemostrecentfiscalhalfyear(183),anddividedbythedaysintheyear(365)toreflectthehalf-yearperiod.Expensesreflectonlycostsbornedirectlybythefund;allfundexpensesotherthanclass-specificRule12b-1feesarereimbursedbytheunderlyingPricefunds.Theannualizedexpenseratioforthe6-monthperiodwas0.00%fortheInvestorClassand0.25%fortheAdvisorClass.
**Effectiveexpensesreflectthesumofexpensesbornedirectlybytheclassplusthefund’spro-ratashareoftheweightedaverageexpenseratiooftheunderlyingPricefundsinwhichitinvests.TheannualizedweightedaverageexpenseratiooftheunderlyingPricefundsforthe6-monthperiod(0.58%)reflectstheactualexpenseratioofeachunderlyingPricefundforthe6-monthperiod,annualizedandweightedforthefund’srelativeaverageinvestmentthereinduringtheperiod.
Target Retirement 2010 Fund

Proof #4
50
T. Rowe Price Target Retirement Funds
Effective Expenses Expenses Beginning Ending Paidduring Paidduring Account Account Period* Period** value value 6/1/14to 6/1/14to 6/1/14 11/30/14 11/30/14 11/30/14
Investor ClassActual $1,000.00 $1,017.30 $0.00 $3.08
Hypothetical(assumes5%returnbeforeexpenses) 1,000.00 1,025.07 0.00 3.10
Advisor ClassActual 1,000.00 1,015.50 1.26 4.35
Hypothetical(assumes5%returnbeforeexpenses) 1,000.00 1,023.82 1.27 4.36
*Expensesareequaltotheclass’sannualizedexpenseratioforthe6-monthperiod,multipliedbytheaverageaccountvalueovertheperiod,multipliedbythenumberofdaysinthemostrecentfiscalhalfyear(183),anddividedbythedaysintheyear(365)toreflectthehalf-yearperiod.Expensesreflectonlycostsbornedirectlybythefund;allfundexpensesotherthanclass-specificRule12b-1feesarereimbursedbytheunderlyingPricefunds.Theannualizedexpenseratioforthe6-monthperiodwas0.00%fortheInvestorClassand0.25%fortheAdvisorClass.
**Effectiveexpensesreflectthesumofexpensesbornedirectlybytheclassplusthefund’spro-ratashareoftheweightedaverageexpenseratiooftheunderlyingPricefundsinwhichitinvests.TheannualizedweightedaverageexpenseratiooftheunderlyingPricefundsforthe6-monthperiod(0.61%)reflectstheactualexpenseratioofeachunderlyingPricefundforthe6-monthperiod,annualizedandweightedforthefund’srelativeaverageinvestmentthereinduringtheperiod.
Target Retirement 2015 Fund

Proof #4
51
T. Rowe Price Target Retirement Funds
Effective Expenses Expenses Beginning Ending Paidduring Paidduring Account Account Period* Period** value value 6/1/14to 6/1/14to 6/1/14 11/30/14 11/30/14 11/30/14
Investor ClassActual $1,000.00 $1,019.90 $0.00 $3.24
Hypothetical(assumes5%returnbeforeexpenses) 1,000.00 1,025.07 0.00 3.25
Advisor ClassActual 1,000.00 1,019.00 1.27 4.50
Hypothetical(assumes5%returnbeforeexpenses) 1,000.00 1,023.82 1.27 4.52
*Expensesareequaltotheclass’sannualizedexpenseratioforthe6-monthperiod,multipliedbytheaverageaccountvalueovertheperiod,multipliedbythenumberofdaysinthemostrecentfiscalhalfyear(183),anddividedbythedaysintheyear(365)toreflectthehalf-yearperiod.Expensesreflectonlycostsbornedirectlybythefund;allfundexpensesotherthanclass-specificRule12b-1feesarereimbursedbytheunderlyingPricefunds.Theannualizedexpenseratioforthe6-monthperiodwas0.00%fortheInvestorClassand0.25%fortheAdvisorClass.
**Effectiveexpensesreflectthesumofexpensesbornedirectlybytheclassplusthefund’spro-ratashareoftheweightedaverageexpenseratiooftheunderlyingPricefundsinwhichitinvests.TheannualizedweightedaverageexpenseratiooftheunderlyingPricefundsforthe6-monthperiod(0.64%)reflectstheactualexpenseratioofeachunderlyingPricefundforthe6-monthperiod,annualizedandweightedforthefund’srelativeaverageinvestmentthereinduringtheperiod.
Target Retirement 2020 Fund

Proof #4
52
T. Rowe Price Target Retirement Funds
Effective Expenses Expenses Beginning Ending Paidduring Paidduring Account Account Period* Period** value value 6/1/14to 6/1/14to 6/1/14 11/30/14 11/30/14 11/30/14
Investor ClassActual $1,000.00 $1,023.30 $0.00 $3.40
Hypothetical(assumes5%returnbeforeexpenses) 1,000.00 1,025.07 0.00 3.40
Advisor ClassActual 1,000.00 1,021.50 1.27 4.66
Hypothetical(assumes5%returnbeforeexpenses) 1,000.00 1,023.82 1.27 4.67
*Expensesareequaltotheclass’sannualizedexpenseratioforthe6-monthperiod,multipliedbytheaverageaccountvalueovertheperiod,multipliedbythenumberofdaysinthemostrecentfiscalhalfyear(183),anddividedbythedaysintheyear(365)toreflectthehalf-yearperiod.Expensesreflectonlycostsbornedirectlybythefund;allfundexpensesotherthanclass-specificRule12b-1feesarereimbursedbytheunderlyingPricefunds.Theannualizedexpenseratioforthe6-monthperiodwas0.00%fortheInvestorClassand0.25%fortheAdvisorClass.
**Effectiveexpensesreflectthesumofexpensesbornedirectlybytheclassplusthefund’spro-ratashareoftheweightedaverageexpenseratiooftheunderlyingPricefundsinwhichitinvests.TheannualizedweightedaverageexpenseratiooftheunderlyingPricefundsforthe6-monthperiod(0.67%)reflectstheactualexpenseratioofeachunderlyingPricefundforthe6-monthperiod,annualizedandweightedforthefund’srelativeaverageinvestmentthereinduringtheperiod.
Target Retirement 2025 Fund

Proof #4
53
T. Rowe Price Target Retirement Funds
Effective Expenses Expenses Beginning Ending Paidduring Paidduring Account Account Period* Period** value value 6/1/14to 6/1/14to 6/1/14 11/30/14 11/30/14 11/30/14
Investor ClassActual $1,000.00 $1,026.60 $0.00 $3.56
Hypothetical(assumes5%returnbeforeexpenses) 1,000.00 1,025.07 0.00 3.55
Advisor ClassActual 1,000.00 1,024.90 1.27 4.82
Hypothetical(assumes5%returnbeforeexpenses) 1,000.00 1,023.82 1.27 4.82
*Expensesareequaltotheclass’sannualizedexpenseratioforthe6-monthperiod,multipliedbytheaverageaccountvalueovertheperiod,multipliedbythenumberofdaysinthemostrecentfiscalhalfyear(183),anddividedbythedaysintheyear(365)toreflectthehalf-yearperiod.Expensesreflectonlycostsbornedirectlybythefund;allfundexpensesotherthanclass-specificRule12b-1feesarereimbursedbytheunderlyingPricefunds.Theannualizedexpenseratioforthe6-monthperiodwas0.00%fortheInvestorClassand0.25%fortheAdvisorClass.
**Effectiveexpensesreflectthesumofexpensesbornedirectlybytheclassplusthefund’spro-ratashareoftheweightedaverageexpenseratiooftheunderlyingPricefundsinwhichitinvests.TheannualizedweightedaverageexpenseratiooftheunderlyingPricefundsforthe6-monthperiod(0.70%)reflectstheactualexpenseratioofeachunderlyingPricefundforthe6-monthperiod,annualizedandweightedforthefund’srelativeaverageinvestmentthereinduringtheperiod.
Target Retirement 2030 Fund
Proof #4
54
T. Rowe Price Target Retirement Funds
Effective Expenses Expenses Beginning Ending Paidduring Paidduring Account Account Period* Period** value value 6/1/14to 6/1/14to 6/1/14 11/30/14 11/30/14 11/30/14
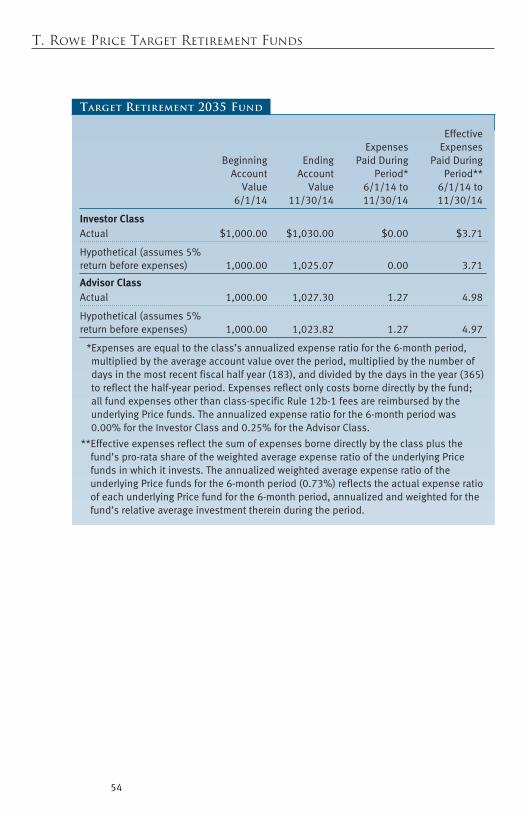
Investor ClassActual $1,000.00 $1,030.00 $0.00 $3.71
Hypothetical(assumes5%returnbeforeexpenses) 1,000.00 1,025.07 0.00 3.71
Advisor ClassActual 1,000.00 1,027.30 1.27 4.98
Hypothetical(assumes5%returnbeforeexpenses) 1,000.00 1,023.82 1.27 4.97
*Expensesareequaltotheclass’sannualizedexpenseratioforthe6-monthperiod,multipliedbytheaverageaccountvalueovertheperiod,multipliedbythenumberofdaysinthemostrecentfiscalhalfyear(183),anddividedbythedaysintheyear(365)toreflectthehalf-yearperiod.Expensesreflectonlycostsbornedirectlybythefund;allfundexpensesotherthanclass-specificRule12b-1feesarereimbursedbytheunderlyingPricefunds.Theannualizedexpenseratioforthe6-monthperiodwas0.00%fortheInvestorClassand0.25%fortheAdvisorClass.
**Effectiveexpensesreflectthesumofexpensesbornedirectlybytheclassplusthefund’spro-ratashareoftheweightedaverageexpenseratiooftheunderlyingPricefundsinwhichitinvests.TheannualizedweightedaverageexpenseratiooftheunderlyingPricefundsforthe6-monthperiod(0.73%)reflectstheactualexpenseratioofeachunderlyingPricefundforthe6-monthperiod,annualizedandweightedforthefund’srelativeaverageinvestmentthereinduringtheperiod.
Target Retirement 2035 Fund

Proof #4
55
T. Rowe Price Target Retirement Funds
Effective Expenses Expenses Beginning Ending Paidduring Paidduring Account Account Period* Period** value value 6/1/14to 6/1/14to 6/1/14 11/30/14 11/30/14 11/30/14
Investor ClassActual $1,000.00 $1,030.60 $0.00 $3.77
Hypothetical(assumes5%returnbeforeexpenses) 1,000.00 1,025.07 0.00 3.76
Advisor ClassActual 1,000.00 1,029.80 1.27 5.04
Hypothetical(assumes5%returnbeforeexpenses) 1,000.00 1,023.82 1.27 5.02
*Expensesareequaltotheclass’sannualizedexpenseratioforthe6-monthperiod,multipliedbytheaverageaccountvalueovertheperiod,multipliedbythenumberofdaysinthemostrecentfiscalhalfyear(183),anddividedbythedaysintheyear(365)toreflectthehalf-yearperiod.Expensesreflectonlycostsbornedirectlybythefund;allfundexpensesotherthanclass-specificRule12b-1feesarereimbursedbytheunderlyingPricefunds.Theannualizedexpenseratioforthe6-monthperiodwas0.00%fortheInvestorClassand0.25%fortheAdvisorClass.
**Effectiveexpensesreflectthesumofexpensesbornedirectlybytheclassplusthefund’spro-ratashareoftheweightedaverageexpenseratiooftheunderlyingPricefundsinwhichitinvests.TheannualizedweightedaverageexpenseratiooftheunderlyingPricefundsforthe6-monthperiod(0.74%)reflectstheactualexpenseratioofeachunderlyingPricefundforthe6-monthperiod,annualizedandweightedforthefund’srelativeaverageinvestmentthereinduringtheperiod.
Target Retirement 2040 Fund

Proof #4
56
T. Rowe Price Target Retirement Funds
Effective Expenses Expenses Beginning Ending Paidduring Paidduring Account Account Period* Period** value value 6/1/14to 6/1/14to 6/1/14 11/30/14 11/30/14 11/30/14
Investor ClassActual $1,000.00 $1,032.30 $0.00 $3.82
Hypothetical(assumes5%returnbeforeexpenses) 1,000.00 1,025.07 0.00 3.81
Advisor ClassActual 1,000.00 1,030.60 1.27 5.09
Hypothetical(assumes5%returnbeforeexpenses) 1,000.00 1,023.82 1.27 5.07
*Expensesareequaltotheclass’sannualizedexpenseratioforthe6-monthperiod,multipliedbytheaverageaccountvalueovertheperiod,multipliedbythenumberofdaysinthemostrecentfiscalhalfyear(183),anddividedbythedaysintheyear(365)toreflectthehalf-yearperiod.Expensesreflectonlycostsbornedirectlybythefund;allfundexpensesotherthanclass-specificRule12b-1feesarereimbursedbytheunderlyingPricefunds.Theannualizedexpenseratioforthe6-monthperiodwas0.00%fortheInvestorClassand0.25%fortheAdvisorClass.
**Effectiveexpensesreflectthesumofexpensesbornedirectlybytheclassplusthefund’spro-ratashareoftheweightedaverageexpenseratiooftheunderlyingPricefundsinwhichitinvests.TheannualizedweightedaverageexpenseratiooftheunderlyingPricefundsforthe6-monthperiod(0.75%)reflectstheactualexpenseratioofeachunderlyingPricefundforthe6-monthperiod,annualizedandweightedforthefund’srelativeaverageinvestmentthereinduringtheperiod.
Target Retirement 2045 Fund

Proof #4
57
T. Rowe Price Target Retirement Funds
Effective Expenses Expenses Beginning Ending Paidduring Paidduring Account Account Period* Period** value value 6/1/14to 6/1/14to 6/1/14 11/30/14 11/30/14 11/30/14
Investor ClassActual $1,000.00 $1,033.90 $0.00 $3.82
Hypothetical(assumes5%returnbeforeexpenses) 1,000.00 1,025.07 0.00 3.81
Advisor ClassActual 1,000.00 1,033.00 1.27 5.10
Hypothetical(assumes5%returnbeforeexpenses) 1,000.00 1,023.82 1.27 5.07
*Expensesareequaltotheclass’sannualizedexpenseratioforthe6-monthperiod,multipliedbytheaverageaccountvalueovertheperiod,multipliedbythenumberofdaysinthemostrecentfiscalhalfyear(183),anddividedbythedaysintheyear(365)toreflectthehalf-yearperiod.Expensesreflectonlycostsbornedirectlybythefund;allfundexpensesotherthanclass-specificRule12b-1feesarereimbursedbytheunderlyingPricefunds.Theannualizedexpenseratioforthe6-monthperiodwas0.00%fortheInvestorClassand0.25%fortheAdvisorClass.
**Effectiveexpensesreflectthesumofexpensesbornedirectlybytheclassplusthefund’spro-ratashareoftheweightedaverageexpenseratiooftheunderlyingPricefundsinwhichitinvests.TheannualizedweightedaverageexpenseratiooftheunderlyingPricefundsforthe6-monthperiod(0.75%)reflectstheactualexpenseratioofeachunderlyingPricefundforthe6-monthperiod,annualizedandweightedforthefund’srelativeaverageinvestmentthereinduringtheperiod.
Target Retirement 2050 Fund

Proof #4
58
T. Rowe Price Target Retirement Funds
Effective Expenses Expenses Beginning Ending Paidduring Paidduring Account Account Period* Period** value value 6/1/14to 6/1/14to 6/1/14 11/30/14 11/30/14 11/30/14
Investor ClassActual $1,000.00 $1,035.60 $0.00 $3.83
Hypothetical(assumes5%returnbeforeexpenses) 1,000.00 1,025.07 0.00 3.81
Advisor ClassActual 1,000.00 1,033.90 1.27 5.10
Hypothetical(assumes5%returnbeforeexpenses) 1,000.00 1,023.82 1.27 5.07
*Expensesareequaltotheclass’sannualizedexpenseratioforthe6-monthperiod,multipliedbytheaverageaccountvalueovertheperiod,multipliedbythenumberofdaysinthemostrecentfiscalhalfyear(183),anddividedbythedaysintheyear(365)toreflectthehalf-yearperiod.Expensesreflectonlycostsbornedirectlybythefund;allfundexpensesotherthanclass-specificRule12b-1feesarereimbursedbytheunderlyingPricefunds.Theannualizedexpenseratioforthe6-monthperiodwas0.00%fortheInvestorClassand0.25%fortheAdvisorClass.
**Effectiveexpensesreflectthesumofexpensesbornedirectlybytheclassplusthefund’spro-ratashareoftheweightedaverageexpenseratiooftheunderlyingPricefundsinwhichitinvests.TheannualizedweightedaverageexpenseratiooftheunderlyingPricefundsforthe6-monthperiod(0.75%)reflectstheactualexpenseratioofeachunderlyingPricefundforthe6-monthperiod,annualizedandweightedforthefund’srelativeaverageinvestmentthereinduringtheperiod.
Target Retirement 2055 Fund
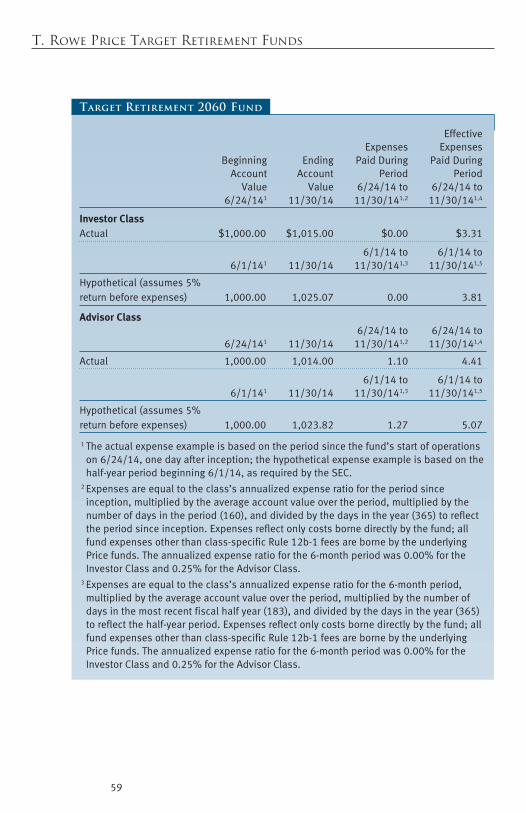
Proof #4
59
T. Rowe Price Target Retirement Funds
Effective Expenses Expenses Beginning Ending Paidduring Paidduring Account Account Period Period value value 6/24/14to 6/24/14to 6/24/141 11/30/14 11/30/141,2 11/30/141,4
Investor ClassActual $1,000.00 $1,015.00 $0.00 $3.31
6/1/14to 6/1/14to 6/1/141 11/30/14 11/30/141,3 11/30/141,5
Hypothetical(assumes5%returnbeforeexpenses) 1,000.00 1,025.07 0.00 3.81
Advisor Class 6/24/14to 6/24/14to 6/24/141 11/30/14 11/30/141,2 11/30/141,4
Actual 1,000.00 1,014.00 1.10 4.41
6/1/14to 6/1/14to 6/1/141 11/30/14 11/30/141,3 11/30/141,5
Hypothetical(assumes5%returnbeforeexpenses) 1,000.00 1,023.82 1.27 5.07
1Theactualexpenseexampleisbasedontheperiodsincethefund’sstartofoperationson6/24/14,onedayafterinception;thehypotheticalexpenseexampleisbasedonthehalf-yearperiodbeginning6/1/14,asrequiredbytheSEC.
2Expensesareequaltotheclass’sannualizedexpenseratiofortheperiodsinceinception,multipliedbytheaverageaccountvalueovertheperiod,multipliedbythenumberofdaysintheperiod(160),anddividedbythedaysintheyear(365)toreflecttheperiodsinceinception.Expensesreflectonlycostsbornedirectlybythefund;allfundexpensesotherthanclass-specificRule12b-1feesarebornebytheunderlyingPricefunds.Theannualizedexpenseratioforthe6-monthperiodwas0.00%fortheInvestorClassand0.25%fortheAdvisorClass.
3Expensesareequaltotheclass’sannualizedexpenseratioforthe6-monthperiod,multipliedbytheaverageaccountvalueovertheperiod,multipliedbythenumberofdaysinthemostrecentfiscalhalfyear(183),anddividedbythedaysintheyear(365)toreflectthehalf-yearperiod.Expensesreflectonlycostsbornedirectlybythefund;allfundexpensesotherthanclass-specificRule12b-1feesarebornebytheunderlyingPricefunds.Theannualizedexpenseratioforthe6-monthperiodwas0.00%fortheInvestorClassand0.25%fortheAdvisorClass.
Target Retirement 2060 Fund
Proof #4
60
T. Rowe Price Target Retirement Funds
4Effectiveexpensesreflectthesumofexpensesbornedirectlybytheclassplusthefund’spro-ratashareoftheweightedaverageexpenseratiooftheunderlyingPricefundsinwhichitinvests.Expensesareequaltotheclass’sannualizedweightedaverageexpenseratiooftheunderlyingPricefundsfortheperiodsinceinception(0.75%),multipliedbytheaverageaccountvalueovertheperiod,multipliedbythenumberofdaysintheperiod(160),anddividedbythedaysintheyear(365)toreflecttheperiodsinceinception.TheannualizedweightedaverageexpenseratiooftheunderlyingPricefundsfortheperiodsinceinceptionreflectstheactualexpenseratioofeachunderlyingPricefundfortheperiodsinceinception,annualizedandweightedforthefund’srelativeaverageinvestmentthereinduringtheperiod.
5Effectiveexpensesreflectthesumofexpensesbornedirectlybytheclassplusthefund’spro-ratashareoftheweightedaverageexpenseratiooftheunderlyingPricefundsinwhichitinvests.Expensesareequaltotheclass’sannualizedweightedaverageexpenseratiooftheunderlyingPricefundsforthe6-monthperiod(0.75%),multipliedbytheaverageaccountvalueovertheperiod,multipliedbythenumberofdaysinthemostrecentfiscalhalfyear(183),anddividedbythedaysintheyear(365)toreflectthehalf-yearperiod.TheannualizedweightedaverageexpenseratiooftheunderlyingPricefundsforthe6-monthperiodreflectstheactualexpenseratioofeachunderlyingPricefundforthe6-monthperiod,annualizedandweightedforthefund’srelativeaverageinvestmentthereinduringtheperiod.
Target Retirement 2060 Fund (continued)
Proof #4
61
T. Rowe Price Investment Services and Information
Investment Services and InformationKNOWLEDGEABLE CUSTOMER SERVICE
On the Web at troweprice.com.
By Phone at 1-800-225-5132. Available Monday through Friday from 8 a.m. until 10 p.m. ET and Saturday from 8:30 a.m. until 5 p.m. ET.
In Person at a T. Rowe Price Investor Center. Please visit the website at troweprice.com/investorcenter or call 1-800-225-5132 to locate a center near you.
ACCOUNT SERVICES
Account Access. Through the T. Rowe Price website at troweprice.com and via phone through Tele*Access®.
Automatic Investing. From your bank account or paycheck.
Automatic Withdrawal. Scheduled, periodic redemptions.
IRA Rebalancing. Automatically rebalance to ensure that your accounts reflect your desired asset allocations.
BROKERAGE SERVICES‡
Trade stocks, mutual funds, ETFs, bonds, options, CDs, precious metals, and more at competitive commissions.
INVESTMENT INFORMATION
Consolidated Statement. Overview of all of your T. Rowe Price mutual fund and Brokerage accounts.
Shareholder Reports. Manager reviews of their strategies and results.
T. Rowe Price Report. Quarterly investment newsletter.
T. Rowe Price Investor. Quarterly publication of insightful financial articles.
Investment Guides. International Investing Guide and Guide to Bond Funds.
FINANCIAL INTERMEDIARIES AND ADVISORS
By Phone at 1-877-804-2315. Contact us Monday through Friday from 8:30 a.m. until 6 p.m. ET.
By Mail: T. Rowe Price, Financial Institution Services, P.O. Box 89000, Baltimore, MD 21289-4232.
CUSTOMERS WHO TRADE THROUGH A FINANCIAL INTERMEDIARY
Please contact your intermediary or financial professional for assistance.
‡Optionstradinginvolvesadditionalriskandisnotsuitableforallinvestors.BrokerageservicesofferedbyT.RowePriceInvestmentServices,Inc.,memberFINRA/SIPC.
Thispagecontainssupplementaryinformationthatisnotpartoftheshareholderreport.
Proof #4
2014-US-6647 C17-051 1/15
Call 1-800-225-5132 to request a prospectus or summary prospectus; each includes investment objectives, risks, fees, expenses, and other information that you should read and consider carefully before investing. Investments in the money market funds are not insured or guaranteed by the FDIC or any other government agency. Although the funds seek to preserve the value of your investment at $1.00 per share, it is possible to lose money by investing in the funds. ‡ClosedtonewinvestorsexceptforadirectrolloverfromaretirementplanintoaT.RowePriceIRAinvestedinthisfund.
ˆTheTargetdateFundsareinclusiveoftheRetirementFunds,theTargetRetirementFunds,andtheRetirementIncomeFund.Effectivedecember29,2014,theT.RowePriceRetirementIncomeFundwillchangeitsnametotheT.RowePriceRetirementBalancedFund.
STOCK FUNDSDomestic Blue Chip GrowthCapital Appreciation‡
Capital OpportunityDiversified Mid-Cap GrowthDiversified Small-Cap GrowthDividend GrowthEquity IncomeEquity Index 500Extended Equity Market IndexFinancial ServicesGrowth & IncomeGrowth StockHealth SciencesMedia & TelecommunicationsMid-Cap Growth‡
Mid-Cap Value‡
New America GrowthNew EraNew Horizons‡
Real EstateScience & TechnologySmall-Cap Stock‡
Small-Cap ValueTax-Efficient Equity Total Equity Market IndexU.S. Large-Cap CoreValue
ASSET ALLOCATION FUNDS
Balanced Global AllocationPersonal Strategy BalancedPersonal Strategy GrowthPersonal Strategy IncomeReal AssetsSpectrum GrowthSpectrum IncomeSpectrum InternationalTarget Date Fundsˆ
BOND FUNDSDomestic TaxableCorporate IncomeCredit OpportunitiesFloating RateGNMA High Yield‡
Inflation Protected BondNew IncomeShort-Term BondStrategic IncomeUltra Short-Term BondU.S. Bond Enhanced IndexU.S. Treasury IntermediateU.S. Treasury Long-Term
Domestic Tax-FreeCalifornia Tax-Free BondGeorgia Tax-Free BondIntermediate Tax-Free High YieldMaryland Short-Term
Tax-Free BondMaryland Tax-Free BondNew Jersey Tax-Free BondNew York Tax-Free BondSummit Municipal IncomeSummit Municipal IntermediateTax-Free High YieldTax-Free IncomeTax-Free Short-IntermediateVirginia Tax-Free Bond
MONEY MARKET FUNDSTaxablePrime ReserveSummit Cash ReservesU.S. Treasury Money
MONEY MARKET FUNDS (cont.)
Tax-FreeCalifornia Tax-Free MoneyMaryland Tax-Free MoneyNew York Tax-Free MoneySummit Municipal Money MarketTax-Exempt Money
INTERNATIONAL/GLOBAL FUNDSStockAfrica & Middle EastAsia OpportunitiesEmerging EuropeEmerging Markets StockEuropean Stock Global Growth StockGlobal IndustrialsGlobal Real EstateGlobal StockGlobal TechnologyInternational Concentrated EquityInternational DiscoveryInternational Equity IndexInternational Growth & IncomeInternational StockJapanLatin AmericaNew AsiaOverseas Stock
BondEmerging Markets BondEmerging Markets Corporate BondEmerging Markets Local
Currency BondInternational Bond
T.RowePriceInvestmentServices,Inc.100EastPrattStreetBaltimore,Md21202
Thispagecontainssupplementaryinformationthatisnotpartoftheshareholderreport.
T. Rowe Price Mutual Funds
Proof #4
Target Retirement 2005 Fund
Target Retirement 2005 Fund–Advisor Class
T. Rowe PRiCe
SEMIANNuAlREPORTFinancial Statements
November 30, 2014
TRARX
PANRX
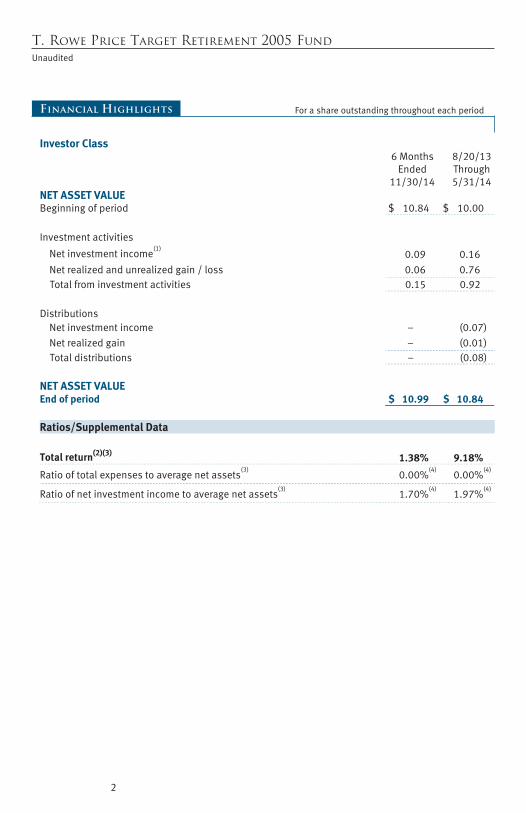
Proof #4
2
T. Rowe Price Target Retirement 2005 FundUnaudited
Financial Highlights For a share outstanding throughout each period
Investor Class6 Months
Ended 11/30/14
8/20/13 Through 5/31/14
NET ASSET VALUE
Beginning of period
$ 10.84
$ 10.00
Investment activities
Net investment income(1)
0.09
0.16
Net realized and unrealized gain / loss 0.06
0.76
Total from investment activities 0.15
0.92
Distributions
Net investment income
– (0.07)
Net realized gain
– (0.01)
Total distributions
– (0.08)
NET ASSET VALUE
End of period $ 10.99 $ 10.84
Ratios/Supplemental Data Total return(2)(3) 1.38% 9.18%
Ratio of total expenses to average net assets(3)
0.00%(4)
0.00%(4)
Ratio of net investment income to average net assets(3)
1.70%(4)
1.97%(4)
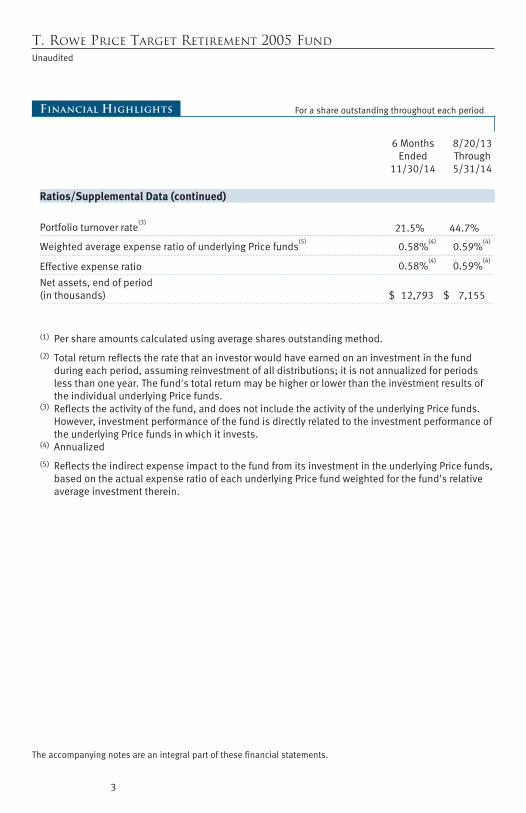
Proof #4
3
T. Rowe Price Target Retirement 2005 FundUnaudited
Financial Highlights For a share outstanding throughout each period
The accompanying notes are an integral part of these financial statements.
6 Months Ended
11/30/14
8/20/13 Through 5/31/14
Ratios/Supplemental Data (continued) Portfolio turnover rate
(3) 21.5%
44.7%
Weighted average expense ratio of underlying Price funds(5)
0.58%(4)
0.59%(4)
Effective expense ratio
0.58%(4)
0.59%(4)
Net assets, end of period (in thousands) $ 12,793 $ 7,155
(1) Per share amounts calculated using average shares outstanding method.
(2) Total return reflects the rate that an investor would have earned on an investment in the fund during each period, assuming reinvestment of all distributions; it is not annualized for periods less than one year. The fund's total return may be higher or lower than the investment results of the individual underlying Price funds.
(3) Reflects the activity of the fund, and does not include the activity of the underlying Price funds. However, investment performance of the fund is directly related to the investment performance of the underlying Price funds in which it invests.
(4) Annualized
(5) Reflects the indirect expense impact to the fund from its investment in the underlying Price funds, based on the actual expense ratio of each underlying Price fund weighted for the fund's relative average investment therein.
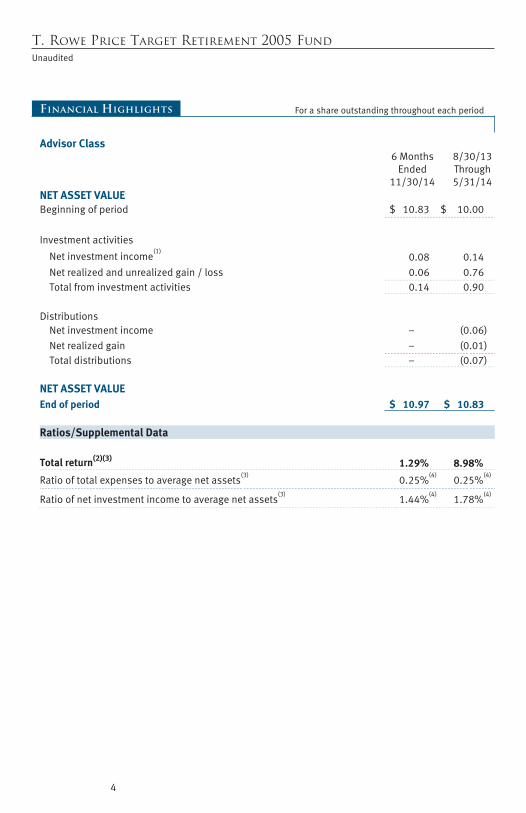
Proof #4
4
T. Rowe Price Target Retirement 2005 FundUnaudited
Financial Highlights For a share outstanding throughout each period
Advisor Class
6 Months Ended
11/30/14
8/30/13 Through 5/31/14
NET ASSET VALUE
Beginning of period
$ 10.83
$ 10.00
Investment activities
Net investment income(1)
0.08
0.14
Net realized and unrealized gain / loss 0.06
0.76
Total from investment activities 0.14
0.90
Distributions
Net investment income
– (0.06)
Net realized gain
– (0.01)
Total distributions
– (0.07)
NET ASSET VALUE
End of period $ 10.97 $ 10.83
Ratios/Supplemental Data Total return(2)(3) 1.29% 8.98%
Ratio of total expenses to average net assets(3)
0.25%(4)
0.25%(4)
Ratio of net investment income to average net assets(3)
1.44%(4)
1.78%(4)

Proof #4
5
T. Rowe Price Target Retirement 2005 FundUnaudited
Financial Highlights For a share outstanding throughout each period
The accompanying notes are an integral part of these financial statements.
6 Months Ended
11/30/14
8/20/13 Through 5/31/14
Ratios/Supplemental Data (continued) Portfolio turnover rate
(3) 21.5%
44.7%
Weighted average expense ratio of underlying Price funds(5)
0.58%(4)
0.59%(4)
Effective expense ratio
0.83%(4)
0.84%(4)
Net assets, end of period
(in thousands)
$ 292
$ 273
(1) Per share amounts calculated using average shares outstanding method.
(2) Total return reflects the rate that an investor would have earned on an investment in the fund during each period, assuming reinvestment of all distributions; it is not annualized for periods less than one year. The fund's total return may be higher or lower than the investment results of the individual underlying Price funds.
(3) Reflects the activity of the fund, and does not include the activity of the underlying Price funds. However, investment performance of the fund is directly related to the investment performance of the underlying Price funds in which it invests.
(4) Annualized
(5) Reflects the indirect expense impact to the fund from its investment in the underlying Price funds, based on the actual expense ratio of each underlying Price fund weighted for the fund's relative average investment therein.
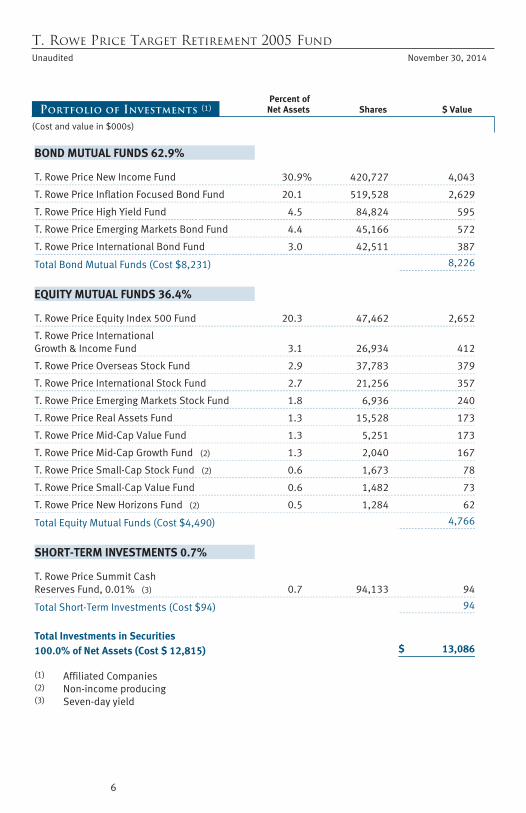
Proof #4
6
T. Rowe Price Target Retirement 2005 FundUnaudited November 30, 2014
(Cost and value in $000s)
Percent of Net Assets Shares $ ValuePortfolio of Investments (1)
BOND MUTUAL FUNDS 62.9%
T. Rowe Price New Income Fund 30.9% 420,727 4,043
T. Rowe Price Inflation Focused Bond Fund 20.1 519,528 2,629
T. Rowe Price High Yield Fund 4.5 84,824 595
T. Rowe Price Emerging Markets Bond Fund 4.4 45,166 572
T. Rowe Price International Bond Fund 3.0 42,511 387
Total Bond Mutual Funds (Cost $8,231) 8,226
EQUITY MUTUAL FUNDS 36.4%
T. Rowe Price Equity Index 500 Fund 20.3 47,462 2,652
T. Rowe Price International Growth & Income Fund 3.1 26,934 412
T. Rowe Price Overseas Stock Fund 2.9 37,783 379
T. Rowe Price International Stock Fund 2.7 21,256 357
T. Rowe Price Emerging Markets Stock Fund 1.8 6,936 240
T. Rowe Price Real Assets Fund 1.3 15,528 173
T. Rowe Price Mid-Cap Value Fund 1.3 5,251 173
T. Rowe Price Mid-Cap Growth Fund (2) 1.3 2,040 167
T. Rowe Price Small-Cap Stock Fund (2) 0.6 1,673 78
T. Rowe Price Small-Cap Value Fund 0.6 1,482 73
T. Rowe Price New Horizons Fund (2) 0.5 1,284 62
Total Equity Mutual Funds (Cost $4,490) 4,766
SHORT-TERM INVESTMENTS 0.7%
T. Rowe Price Summit Cash Reserves Fund, 0.01% (3) 0.7 94,133 94
Total Short-Term Investments (Cost $94) 94
Total Investments in Securities 100.0% of Net Assets (Cost $ 12,815) $ 13,086
(1) Affiliated Companies (2) Non-income producing (3) Seven-day yield
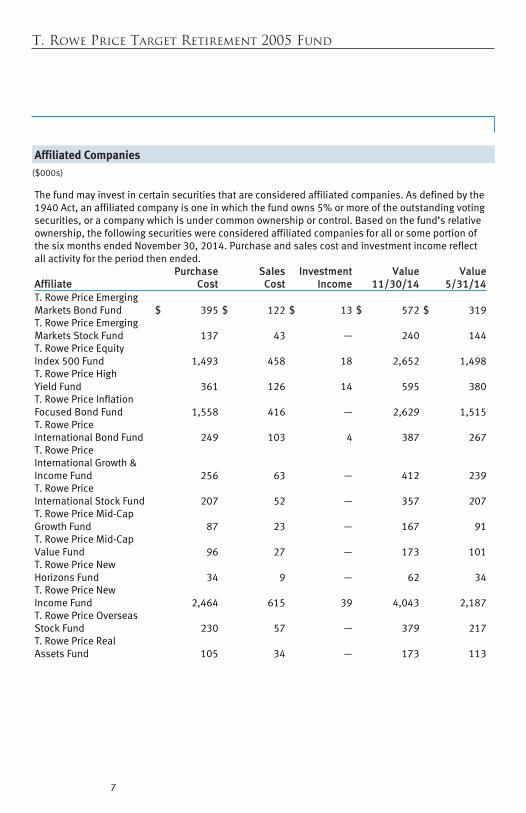
Proof #4
T. Rowe Price Target Retirement 2005 Fund
7
Affiliated Companies
($000s)
The fund may invest in certain securities that are considered affiliated companies. As defined by the 1940 Act, an affiliated company is one in which the fund owns 5% or more of the outstanding voting securities, or a company which is under common ownership or control. Based on the fund’s relative ownership, the following securities were considered affiliated companies for all or some portion of the six months ended November 30, 2014. Purchase and sales cost and investment income reflect all activity for the period then ended. Affiliate
PurchaseCost
SalesCost
InvestmentIncome
Value11/30/14
Value5/31/14
T. Rowe Price Emerging Markets Bond Fund $ 395 $ 122 $ 13 $ 572 $ 319T. Rowe Price Emerging Markets Stock Fund 137 43 — 240 144T. Rowe Price Equity Index 500 Fund 1,493 458 18 2,652 1,498T. Rowe Price High Yield Fund 361 126 14 595 380T. Rowe Price Inflation Focused Bond Fund 1,558 416 — 2,629 1,515T. Rowe Price International Bond Fund 249 103 4 387 267T. Rowe Price International Growth & Income Fund 256 63 — 412 239T. Rowe Price International Stock Fund 207 52 — 357 207T. Rowe Price Mid-Cap Growth Fund 87 23 — 167 91T. Rowe Price Mid-Cap Value Fund 96 27 — 173 101T. Rowe Price New Horizons Fund 34 9 — 62 34T. Rowe Price New Income Fund 2,464 615 39 4,043 2,187T. Rowe Price Overseas Stock Fund 230 57 — 379 217T. Rowe Price Real Assets Fund 105 34 — 173 113
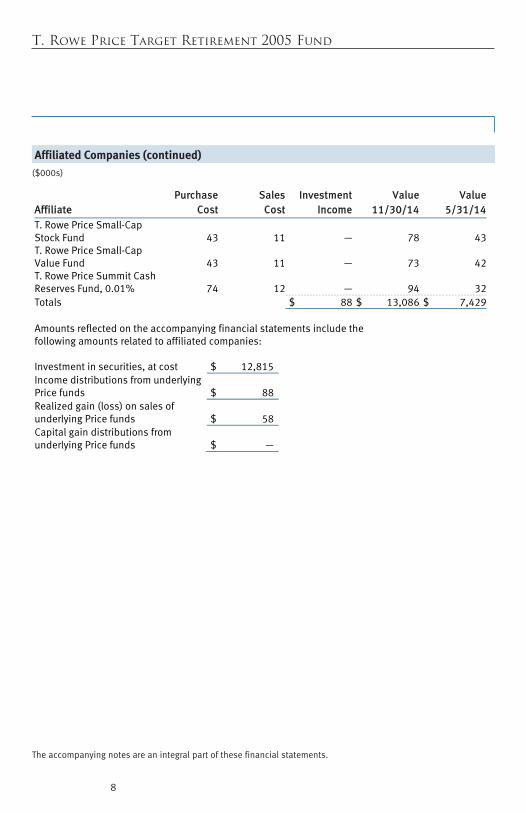
Proof #4
T. Rowe Price Target Retirement 2005 Fund
8
The accompanying notes are an integral part of these financial statements.
Affiliated Companies
($000s)
Affiliated Companies (continued)
Affiliate Purchase
CostSales
CostInvestment
IncomeValue
11/30/14Value
5/31/14T. Rowe Price Small-Cap Stock Fund 43 11 — 78 43T. Rowe Price Small-Cap Value Fund 43 11 — 73 42T. Rowe Price Summit Cash Reserves Fund, 0.01% 74 12 — 94 32Totals $ 88 $ 13,086 $ 7,429 Amounts reflected on the accompanying financial statements include the following amounts related to affiliated companies: Investment in securities, at cost $ 12,815 Income distributions from underlying Price funds $ 88 Realized gain (loss) on sales of underlying Price funds $ 58 Capital gain distributions from underlying Price funds $ —
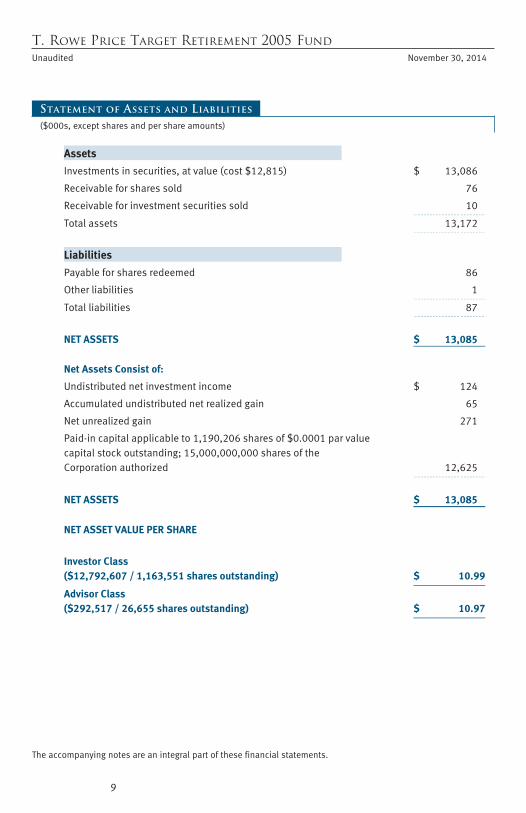
Proof #4
9
T. Rowe Price Target Retirement 2005 FundUnaudited November 30, 2014
The accompanying notes are an integral part of these financial statements.
($000s, except shares and per share amounts)
Statement of Assets and Liabilities
Assets
Investments in securities, at value (cost $12,815) $ 13,086
Receivable for shares sold 76
Receivable for investment securities sold 10
Total assets 13,172
Liabilities
Payable for shares redeemed 86
Other liabilities 1
Total liabilities 87
NET ASSETS $ 13,085 Net Assets Consist of:
Undistributed net investment income $ 124
Accumulated undistributed net realized gain 65
Net unrealized gain 271
Paid-in capital applicable to 1,190,206 shares of $0.0001 par value capital stock outstanding; 15,000,000,000 shares of the Corporation authorized 12,625
NET ASSETS $ 13,085 NET ASSET VALUE PER SHARE
Investor Class ($12,792,607 / 1,163,551 shares outstanding) $ 10.99
Advisor Class ($292,517 / 26,655 shares outstanding) $ 10.97
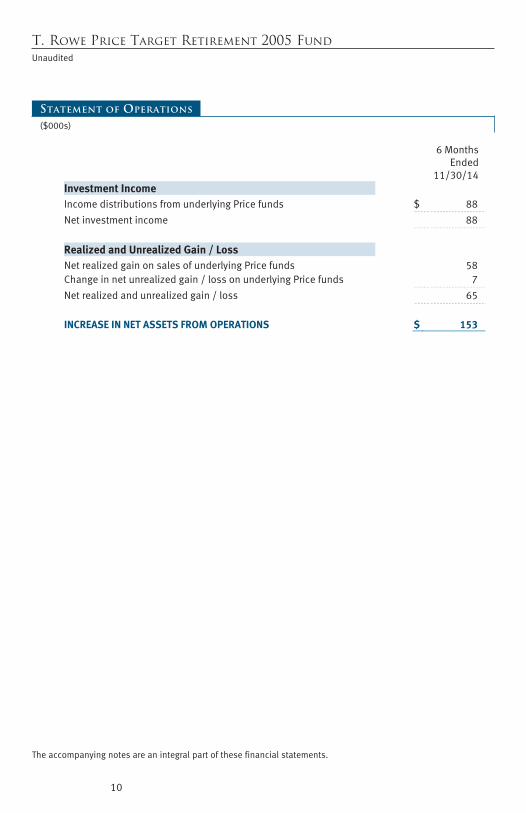
Proof #4
T. Rowe Price Target Retirement 2005 FundUnaudited
($000s)
Statement of Operations
10
The accompanying notes are an integral part of these financial statements.
6 Months Ended
11/30/14Investment Income Income distributions from underlying Price funds $ 88
Net investment income 88
Realized and Unrealized Gain / Loss Net realized gain on sales of underlying Price funds 58 Change in net unrealized gain / loss on underlying Price funds 7
Net realized and unrealized gain / loss 65
INCREASE IN NET ASSETS FROM OPERATIONS $ 153
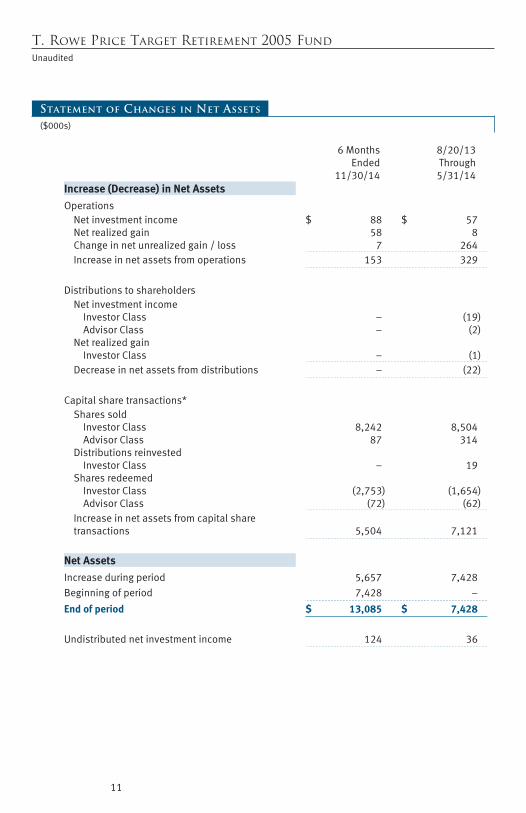
Proof #4
T. Rowe Price Target Retirement 2005 FundUnaudited
($000s)
11
Statement of Changes in Net Assets
6 Months Ended
11/30/14
8/20/13 Through5/31/14
Increase (Decrease) in Net Assets
Operations Net investment income $ 88 $ 57 Net realized gain 58 8 Change in net unrealized gain / loss 7 264 Increase in net assets from operations 153 329
Distributions to shareholders
Net investment income Investor Class – (19) Advisor Class – (2)
Net realized gain Investor Class – (1)
Decrease in net assets from distributions – (22)
Capital share transactions*
Shares sold Investor Class 8,242 8,504 Advisor Class 87 314
Distributions reinvested Investor Class – 19
Shares redeemed Investor Class (2,753) (1,654) Advisor Class (72) (62)
Increase in net assets from capital share transactions 5,504 7,121
Net Assets
Increase during period 5,657 7,428 Beginning of period 7,428 –
End of period $ 13,085 $ 7,428
Undistributed net investment income 124 36
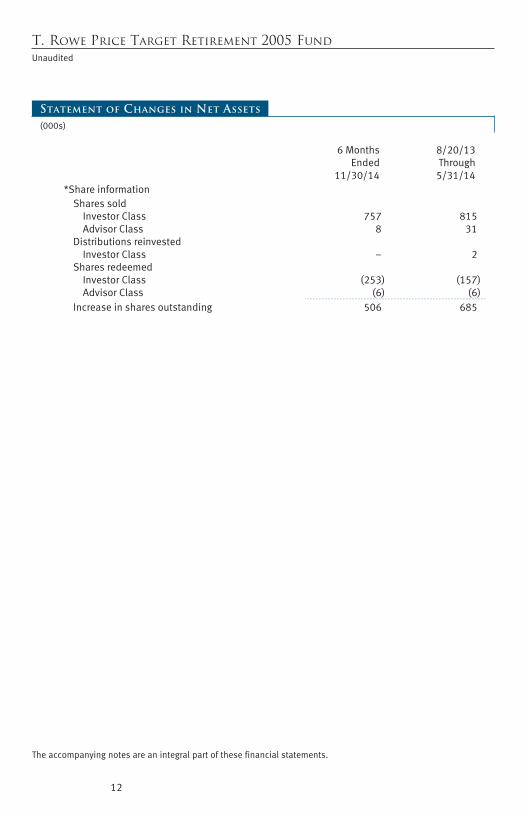
Proof #4
T. Rowe Price Target Retirement 2005 FundUnaudited
12
The accompanying notes are an integral part of these financial statements.
Statement of Changes in Net Assets
(000s)
6 Months Ended
11/30/14
8/20/13 Through 5/31/14
*Share information Shares sold
Investor Class 757 815 Advisor Class 8 31
Distributions reinvested Investor Class – 2
Shares redeemed Investor Class (253) (157) Advisor Class (6) (6)
Increase in shares outstanding 506 685
Proof #4
13
T. Rowe Price Target Retirement 2005 FundUnaudited November 30, 2014
Notes to Financial Statements
T. Rowe Price Retirement Funds, Inc. (the corporation), is registered under the Investment Company Act of 1940 (the 1940 Act). T. Rowe Price Target Retirement 2005 Fund (the fund) is an open-end management investment company and is one of the portfolios established by the corporation. It commenced operations on August 20, 2013. The fund invests in a portfolio of other T. Rowe Price stock and bond funds (underlying Price funds) that represent various asset classes and sectors. The fund’s allocation among under-lying Price funds will change and its asset mix will become more conservative over time. The fund is nondiversified for purposes of the 1940 Act, due to its limited number of investments; however, its investments in underlying Price funds are selected to provide exposure to a diversified portfolio of securities. The fund seeks the highest total return over time consistent with an emphasis on both capital growth and income.
The fund has two classes of shares: the Target Retirement 2005 Fund original share class, referred to in this report as the Investor Class, offered since August 20, 2013; and the Target Retirement 2005 Fund (Advisor Class), also offered since August 20, 2013. Advisor Class shares are sold only through unaffiliated brokers and other financial intermediaries that are compensated by the class for distribution, shareholder servicing and/or certain administra-tive services under a Board-approved Rule 12b-1 plan. Each class has exclusive voting rights on matters related solely to that class; separate voting rights on matters that relate to all classes; and, in all other respects, the same rights and obligations as the other classes.
Note 1 - SigNifiCANt ACCouNtiNg PoliCieS
Basis of Preparation The fund is an investment company and follows accounting and reporting guidance in the Financial Accounting Standards Board Accounting Standards Codification Topic 946 (ASC 946). The accompanying financial statements were prepared in accordance with accounting principles generally accepted in the United States of America (GAAP), including but not limited to ASC 946. GAAP requires the use of estimates made by management. Management believes that estimates and valuations of the underlying Price funds are appropriate; however, actual results may differ from those estimates, and the valuations reflected in the accompanying financial statements may differ from the values ultimately realized upon sale of the underlying Price funds.
Proof #4
14
T. Rowe Price Target Retirement 2005 Fund
investment transactions, investment income, and Distributions Income and expenses are recorded on the accrual basis. Income and capital gain distributions from the underlying Price funds are recorded on the ex-dividend date. Purchases and sales of the underlying Price funds are accounted for on the trade date. Gains and losses realized on sales of the underlying Price funds are reported on the identified cost basis. Income tax-related interest and penalties, if incurred, would be recorded as income tax expense. Distributions to shareholders are recorded on the ex-dividend date. Income distributions are declared and paid by each class annually. Capital gain distributions, if any, generally are declared and paid by the fund annually.
Class Accounting The Advisor Class pays distribution, shareholder servicing and/or certain administrative expenses in the form of Rule 12b-1 fees in an amount not exceeding 0.25% of the class’s average daily net assets; during the six months ended November 30, 2014, the Advisor incurred less than $1,000 in these fees. Income distributions from the underlying Price funds and realized and unrealized gains and losses are allocated to the classes based upon the relative daily net assets of each class.
Note 2 - VAluAtioN
The fund’s financial instruments are valued, and each class’s net asset value (NAV) per share is computed at the close of the New York Stock Exchange (NYSE), normally 4 p.m. ET, each day the NYSE is open for business. The fund’s financial instruments are reported at fair value, which GAAP defines as the price that would be received to sell an asset or paid to transfer a liability in an orderly transaction between market participants at the measurement date. Investments in the underlying Price funds are valued at their closing NAV per share on the day of valuation. Assets and liabilities other than financial instruments, including short-term receivables and payables, are carried at cost, or estimated realizable value, if less, which approximates fair value.
The T. Rowe Price Valuation Committee (the Valuation Committee) has been established by the fund’s Board of Directors (the Board) to ensure that financial instruments are appropriately priced at fair value in accordance with GAAP and the 1940 Act. Subject to oversight by the Board, the Valuation Committee develops and oversees pricing-related policies and procedures and approves all fair value determinations. Specifically, the Valuation Committee establishes
Proof #4
15
T. Rowe Price Target Retirement 2005 Fund
procedures to value securities; determines pricing techniques, sources, and persons eligible to effect fair value pricing actions; oversees the selection, services, and performance of pricing vendors; oversees valuation-related business continuity practices; and provides guidance on internal controls and valuation-related matters. The Valuation Committee reports to the Board; is chaired by the fund’s treasurer; and has representation from legal, portfolio management and trading, operations, and risk management.
Various valuation techniques and inputs are used to determine the fair value of financial instruments. GAAP establishes the following fair value hierarchy that categorizes the inputs used to measure fair value:
Level 1 – quoted prices (unadjusted) in active markets for identical financial instruments that the fund can access at the reporting date
Level 2 – inputs other than Level 1 quoted prices that are observable, either directly or indirectly (including, but not limited to, quoted prices for similar financial instruments in active markets, quoted prices for identical or similar financial instruments in inactive markets, interest rates and yield curves, implied volatilities, and credit spreads)
Level 3 – unobservable inputs
Observable inputs are developed using market data, such as publicly available information about actual events or transactions, and reflect the assumptions that market participants would use to price the financial instrument. Unobservable inputs are those for which market data are not available and are developed using the best information available about the assumptions that market participants would use to price the financial instrument. GAAP requires valuation tech-niques to maximize the use of relevant observable inputs and minimize the use of unobservable inputs. When multiple inputs are used to derive fair value, the financial instrument is assigned to the level within the fair value hierarchy based on the lowest-level input that is significant to the fair value of the financial instrument. Input levels are not necessarily an indication of the risk or liquidity associated with financial instruments at that level but rather the degree of judgment used in determining those values. On November 30, 2014, all of the investments in underlying Price funds were classified as Level 1, based on the inputs used to determine their fair values.

Proof #4
16
T. Rowe Price Target Retirement 2005 Fund
Note 3 - iNVeStMeNtS iN uNDeRlYiNg PRiCe fuNDS
Purchases and sales of the underlying Price funds during the six months ended November 30, 2014, aggregated $7,832,000 and $2,240,000, respectively.
Note 4 - feDeRAl iNCoMe tAxeS
No provision for federal income taxes is required since the fund intends to continue to qualify as a regulated investment company under Subchapter M of the Internal Revenue Code and distribute to shareholders all of its taxable income and gains. Distributions determined in accordance with federal income tax regulations may differ in amount or character from net investment income and realized gains for financial reporting purposes. Financial reporting records are adjusted for permanent book/tax differences to reflect tax character but are not adjusted for temporary differences. The amount and character of tax-basis distributions and composition of net assets are finalized at fiscal year-end; accordingly, tax-basis balances have not been determined as of the date of this report.
At November 30, 2014, the cost of investments for federal income tax purposes was $12,830,000. Net unrealized gain aggregated $256,000 at period-end, of which $332,000 related to appreciated investments and $76,000 related to depreciated investments.
Note 5 - RelAteD PARtY tRANSACtioNS
The fund is managed by T. Rowe Price Associates, Inc. (Price Associates), a wholly owned subsidiary of T. Rowe Price Group, Inc. (Price Group). Price Associates, directly or through sub-advisory agreements with its wholly owned subsidiaries, also provides investment management services to all the underlying Price funds. Pursuant to various service agreements, Price Associates and its wholly owned subsidiaries provide shareholder servicing and administrative, transfer and dividend disbursing, accounting, marketing, and certain other services to the fund. Certain officers and directors of the fund are also officers and directors of Price Associates and its subsidiaries and the underlying Price funds.
Proof #4
17
T. Rowe Price Target Retirement 2005 Fund
The fund pays no management fees; however, Price Associates receives manage-ment fees from the underlying Price funds. The fund operates in accordance with the investment management and special servicing agreements between and among the corporation; the underlying Price funds; Price Associates; and T. Rowe Price Services, Inc., a wholly owned subsidiary of Price Associates. Pursuant to these agreements, expenses associated with the operation of the fund, other than class-specific Rule 12b-1 fees, are borne by each underlying Price fund to the extent of estimated savings to it and in proportion to the average daily value of its shares owned by the fund. Therefore, the expense ratio of each class reflects only its Rule 12b-1 fees. However, the fund indirectly bears its proportionate share of the management fees and operating costs of the underlying Price funds in which it invests.
The fund does not invest in the underlying Price funds for the purpose of exercising management or control; however, investments by the fund may represent a significant portion of an underlying Price fund’s net assets. At November 30, 2014, the fund held less than 25% of the outstanding shares of any underlying Price fund.
As of November 30, 2014, T. Rowe Price Group, Inc., or its wholly owned subsidiaries owned 25,000 shares of the Investor Class, and 25,000 shares of the Advisor Class, aggregating 4% of the fund’s net assets.
Proof #4
18
T. Rowe Price Target Retirement 2005 Fund
Information on Proxy Voting Policies, Procedures, and Records
A description of the policies and procedures used by T. Rowe Price funds and portfolios to determine how to vote proxies relating to portfolio securities is available in each fund’s Statement of Additional Information. You may request this document by calling 1-800-225-5132 or by accessing the SEC’s website, sec.gov.
The description of our proxy voting policies and procedures is also available on our website, troweprice.com. To access it, click on the words “Social Responsibility” at the top of our corporate homepage. Next, click on the words “Conducting Business Responsibly” on the left side of the page that appears. Finally, click on the words “Proxy Voting Policies” on the left side of the page that appears.
Each fund’s most recent annual proxy voting record is available on our website and through the SEC’s website. To access it through our website, follow the above directions to reach the “Conducting Business Responsibly” page. Click on the words “Proxy Voting Records” on the left side of that page, and then click on the “View Proxy Voting Records” link at the bottom of the page that appears.
The fund files a complete schedule of portfolio holdings with the Securities and Exchange Commission for the first and third quarters of each fiscal year on Form N-Q. The fund’s Form N-Q is available electronically on the SEC’s website (sec.gov); hard copies may be reviewed and copied at the SEC’s Public Reference Room, 100 F St. N.E., Washington, DC 20549. For more information on the Public Reference Room, call 1-800-SEC-0330.
How to Obtain Quarterly Portfolio Holdings

Proof #4
19
T. Rowe Price Investment Services and Information
Investment Services and InformationKNoWleDgeABle CuStoMeR SeRViCe
On the Web at troweprice.com.
By Phone at 1-800-225-5132. Available Monday through Friday from 8 a.m. until 10 p.m. ET and Saturday from 8:30 a.m. until 5 p.m. ET.
In Person at a T. Rowe Price Investor Center. Please visit the website at troweprice.com/investorcenter or call 1-800-225-5132 to locate a center near you.
ACCouNt SeRViCeS
Account Access. Through the T. Rowe Price website at troweprice.com and via phone through Tele*Access®.
Automatic Investing. From your bank account or paycheck.
Automatic Withdrawal. Scheduled, periodic redemptions.
IRA Rebalancing. Automatically rebalance to ensure that your accounts reflect your desired asset allocations.
BRoKeRAge SeRViCeS‡
Trade stocks, mutual funds, ETFs, bonds, options, CDs, precious metals, and more at competitive commissions.
iNVeStMeNt iNfoRMAtioN
Consolidated Statement. Overview of all of your T. Rowe Price mutual fund and Brokerage accounts.
Shareholder Reports. Manager reviews of their strategies and results.
T. Rowe Price Report. Quarterly investment newsletter.
T. Rowe Price Investor. Quarterly publication of insightful financial articles.
Investment Guides. International Investing Guide and Guide to Bond Funds.
fiNANCiAl iNteRMeDiARieS AND ADViSoRS
By Phone at 1-877-804-2315. Contact us Monday through Friday from 8:30 a.m. until 6 p.m. ET.
By Mail: T. Rowe Price, Financial Institution Services, P.O. Box 89000, Baltimore, MD 21289-4232.
CuStoMeRS WHo tRADe tHRougH A fiNANCiAl iNteRMeDiARY
Please contact your intermediary or financial professional for assistance.
‡ Options trading involves additional risk and is not suitable for all investors. Brokerage services offered by T. Rowe Price Investment Services, Inc., member FINRA/SIPC.
This page contains supplementary information that is not part of the shareholder report.
Proof #4
20
T. Rowe Price Web Services
troweprice.com
log iN AND MANAge YouR iNVeStMeNtS oNliNe troweprice.com/access
Manage your account by checking balances with up-to-date statements, tracking and analyzing your portfolio, and/or granting View Access to others as you see fit.
Perform transactions at your convenience. Buy, sell, or exchange shares quickly and securely. You can also set up automatic investing and add a bank account to move money easily.
Update your preferences by confirming your contact information and verifying your beneficiaries so that your assets can be distributed as you wish.
oNliNe SeRViCiNg troweprice.com/paperless
Enroll to receive your transaction confirmations, investor statements, prospec-tuses, and shareholder reports online instead of by U.S. mail. 1 You will receive an e-mail with a link to our website informing you that your document is available to view online, print, or download.
Join our E-mail Program to receive market and fund information by e-mail. Receive timely market reports, performance of T. Rowe Price mutual funds, invest-ment and market insights from T. Rowe Price managers, and more.
iNVeStMeNt guiDANCe AND toolS troweprice.com/planningtools
FuturePath® helps you define your path to retirement, connecting where you are today to where you want to be tomorrow.
Personal Rate of Return aids in tracking the historical performance of your mutual funds over time.
Portfolio Growth Tracker allows you to track the historical growth of your mutual fund investments over time. The analysis consists of three components: Activity Summary, Asset Allocation, and Net Investment versus Market Value.
Retirement Income Calculator can help you see if your retirement goals are on track.
Social Security Benefits Evaluator can help you decide how and when to claim Social Security benefits.
fiNANCiAl iNteRMeDiARieS AND ADViSoRS troweprice.com/financialintermediaries
This secure site is designed for professional financial intermediaries and advisors. Financial professionals may access daily prices and historical performance of mutual funds; view market research, manager commentary, and sales ideas; and access literature and forms. For U.S. technical assistance, call 1-888-358-8490 or e-mail us at [email protected]. For non-U.S. technical assistance, call +1 (410) 345 4400 or contact us via e-mail.
This page contains supplementary information that is not part of the shareholder report.
1 By signing up for paperless services, you may qualify for the account service fee waiver. Visit us at troweprice.com/feesandminimums to find out more.
Proof #4
21
* Services offered by T. Rowe Price Advisory Services, Inc., a federally registered investment adviser. There may be costs associated with these services.
T. Rowe Price Planning Tools and Services
T. Rowe Price Retirement Services
T. Rowe Price offers unique retirement services that can help you meet a broad variety of planning challenges. Our retirement tools are suitable for individuals, the self-employed, small businesses, cor porations, and nonprofit organizations. For more information, call 1-800-IRA-5000 or visit our website at troweprice.com/retirement.
iNVeStMeNt ACCouNtS
Rollover IRAs. If you’ve changed jobs, experienced a job loss, or retired and are considering moving your assets into an IRA, call toll-free 1-800-IRA-5000. Our rollover specialists can explain your options, answer your questions, and help deter-mine which option is right for you.
Roth IRAs. A Roth IRA offers tax-free withdrawals and a flexible distribution schedule. Open your account at troweprice.com/ira or call 1-800-IRA-5000.
Traditional IRAs. Traditional IRA contributions may be tax-deductible, with no taxes due until withdrawal. Open your account at troweprice.com/ira or call 1-800-IRA-5000.
Small Business Retirement Plans. If you’re self-employed or run a small business or professional practice, T. Rowe Price can help you establish a cost-effective retire-ment plan that’s easy to set up and maintain. Call 1-800-638-3804, and our small business specialists can answer your questions, set up a plan, or open an account.
iNVeStMeNt ADViCe
T. Rowe Price Advisory Planning Services offers a wide range of services that provide expert advice based on your individual needs and financial goals, including consultations with an advisory counselor. Please contact one of our specialists at 1-888-744-0270 to determine the most appropriate service to fit your needs.*
This page contains supplementary information that is not part of the shareholder report.
Proof #4
22
T. Rowe Price College PlanningThis page contains supplementary information that is not part of the shareholder report.
College Planning
One of the most important things to do when it comes to saving for college is to just get started. Every dollar saved today is one less dollar you may have to borrow later. Our college planning information and college savings products can help you meet your educational investment goals. For more information, visit our website at troweprice.com/college, where you will find the College Savings Planner, an interactive tool that can help you determine how much you should save, estimate future tuition costs, and review college savings options. In a few easy steps, the calculator provides you with information and a plan of action. To speak with a college planning specialist, please call 1-800-638-5660.
College Savings Plans (529 Plans). To help families prepare for college education costs, T. Rowe Price manages three 529 plans that are open to all U.S. residents. Any earnings on contributions are tax-deferred, and distributions are exempt from federal income taxes when used for qualified educational expenses. Also, these plans offer high contribution limits and affordable systematic investing.
T. Rowe Price manages the T. Rowe Price College Savings Plan, a national 529 plan offered by the Education Trust of Alaska; the Maryland College Investment Plan; and the University of Alaska College Savings Plan. The Maryland College Investment Plan offers certain potential benefits for Maryland residents, and the University of Alaska College Savings Plan offers potential benefits for Alaska residents.
Earnings on a distribution not used for qualified expenses may be subject to income taxes and a 10% federal penalty. Please note that the availability of tax or other benefits may be conditioned on meeting certain requirements, such as residency, purpose for or timing of distributions, or other factors, as applicable.
Please visit our website or call 1-800-638-5660 to obtain the applicable plan disclosure document, which includes investment objectives, risks, fees, expenses, and other information that you should read and consider carefully before investing. Please consider, before invest-ing, whether your or your beneficiary’s home state offers any state tax or other benefits that are only available for investments in that state’s plan. T. Rowe Price Investment Services, Inc., Distributor/Underwriter.
Proof #4
23
The T. Rowe Price Program for Charitable Giving is an independent, nonprofit corporation founded by T. Rowe Price to assist individuals with planning and managing their charitable giving. The Program has contracted with various T. Rowe Price companies to provide operational, recordkeeping, and investment management services to the Program.
T. Rowe Price Charitable Giving
The T. Rowe Price Program for Charitable Givingsm
Simplify your giving.The Program for Charitable Giving is a donor-advised fund (a public charity) that provides a simple way to support your favorite charities while achieving attractive tax savings.
The Program lets you do all your charitable giving through one convenient account. Our donor relations specialists take care of the administrative details, so you spend less time writing checks and keeping records.
Lock in your charitable deduction now.You can establish a Program account with a minimum contribution of $10,000 or more. Your contributions are fully deductible (up to allowable IRS limits) in the tax year when they are made. Donation amounts above IRS limits can be carried over and deducted in future years.
The Program makes it easy to contribute long-term appreciated securities. You sim-ply transfer the securities in kind to your Program account. You can deduct the full market value and do not have to pay capital gains taxes.
Recommend grants to support your favorite charities.Once your account is established, you have the flexibility to recommend grants to your favorite charities whenever you like—this year or in the future. The Program confirms that your charity qualifies for a grant and is in good standing with the IRS.
Benefit from the investment expertise of T. Rowe Price.You advise how your account’s balance is invested among six professionally managed investment pools. This means your donations have the potential to grow over time and produce additional funds for your charities. Investment returns are net of the expenses of the underlying mutual funds. All investment pools are subject to market risk, including possible loss of principal.
Save with low fees. The Program’s administrative fees are among the lowest in the industry, and there is no minimum annual fee. Since you also save with low investment management fees, there is the potential for more money to be available for your charities.
It’s easy to start giving more efficiently with the Program. You can call a donor relations specialist at 1-800-690-0438 to learn more about the Program, receive printed information, or get help to open your Program account. You also will find everything you need to open an account online at ProgramForGiving.org.
This page contains supplementary information that is not part of the shareholder report.
Proof #4
F182-051 1/15
Call 1-800-225-5132 to request a prospectus or summary prospectus; each includes investment objectives, risks, fees, expenses, and other information that you should read and consider carefully before investing. Investments in the money market funds are not insured or guaranteed by the FDIC or any other government agency. Although the funds seek to preserve the value of your investment at $1.00 per share, it is possible to lose money by investing in the funds. ‡ Closed to new investors except for a direct rollover from a retirement plan into a T. Rowe Price IRA
invested in this fund.ˆ The Target Date Funds are inclusive of the Retirement Funds, the Target Retirement Funds, and the Retirement Income Fund. Effective December 29, 2014, the T. Rowe Price Retirement Income Fund will change its name to the T. Rowe Price Retirement Balanced Fund.
StoCK fuNDSDomestic Blue Chip GrowthCapital Appreciation‡
Capital OpportunityDiversified Mid-Cap GrowthDiversified Small-Cap GrowthDividend GrowthEquity IncomeEquity Index 500Extended Equity Market IndexFinancial ServicesGrowth & IncomeGrowth StockHealth SciencesMedia & TelecommunicationsMid-Cap Growth‡
Mid-Cap Value‡
New America GrowthNew EraNew Horizons‡
Real EstateScience & TechnologySmall-Cap Stock‡
Small-Cap ValueTax-Efficient Equity Total Equity Market IndexU.S. Large-Cap CoreValue
ASSet AlloCAtioN fuNDS
Balanced Global AllocationPersonal Strategy BalancedPersonal Strategy GrowthPersonal Strategy IncomeReal AssetsSpectrum GrowthSpectrum IncomeSpectrum InternationalTarget Date Fundsˆ
BoND fuNDSDomestic taxableCorporate IncomeCredit OpportunitiesFloating RateGNMA High Yield‡
Inflation Protected BondNew IncomeShort-Term BondStrategic IncomeUltra Short-Term BondU.S. Bond Enhanced IndexU.S. Treasury IntermediateU.S. Treasury Long-Term
Domestic tax-freeCalifornia Tax-Free BondGeorgia Tax-Free BondIntermediate Tax-Free High YieldMaryland Short-Term
Tax-Free BondMaryland Tax-Free BondNew Jersey Tax-Free BondNew York Tax-Free BondSummit Municipal IncomeSummit Municipal IntermediateTax-Free High YieldTax-Free IncomeTax-Free Short-IntermediateVirginia Tax-Free Bond
MoNeY MARKet fuNDStaxablePrime ReserveSummit Cash ReservesU.S. Treasury Money
MoNeY MARKet fuNDS (cont.)
tax-freeCalifornia Tax-Free MoneyMaryland Tax-Free MoneyNew York Tax-Free MoneySummit Municipal Money MarketTax-Exempt Money
iNteRNAtioNAl/gloBAl fuNDSStockAfrica & Middle EastAsia OpportunitiesEmerging EuropeEmerging Markets StockEuropean Stock Global Growth StockGlobal IndustrialsGlobal Real EstateGlobal StockGlobal TechnologyInternational Concentrated EquityInternational DiscoveryInternational Equity IndexInternational Growth & IncomeInternational StockJapanLatin AmericaNew AsiaOverseas Stock
BondEmerging Markets BondEmerging Markets Corporate BondEmerging Markets Local
Currency BondInternational Bond
T. Rowe Price Investment Services, Inc. 100 East Pratt Street Baltimore, MD 21202
This page contains supplementary information that is not part of the shareholder report.
T. Rowe Price Mutual Funds