targeted approach • proven business model • sound execution · • targeted approach • proven...
TRANSCRIPT

• Targeted Approach
• Proven Business Model
• Sound Execution
2009 Annual Report

Company Profile
Signature Bank, member FDIC, is a full-service commercial bank with 23 private client offices located throughout the New York metropolitan area. The Bank primarily serves privately owned businesses, their owners and senior managers. Signature Bank offers a broad range of business and personal banking products and services as well as investment, brokerage, asset management and insurance products and services through its subsidiary, Signature Securities Group Corporation, a licensed broker-dealer, investment adviser and member FINRA/SIPC.
Signature Bank’S 23 new York-area Private Client Banking offiCeS
Manhattan
261 Madison Avenue 300 Park Avenue 71 Broadway 565 Fifth Avenue 950 Third Avenue200 Park Avenue South 1020 Madison Avenue 50 West 57th Street
BrooklYn
26 Court Street84 Broadway 6321 New Utrecht Avenue
QueenS
36-36 33rd Street, Long Island City 78-27 37th Avenue, Jackson Heights
Bronx
421 Hunts Point Avenue
Staten iSland
2066 Hylan Boulevard
weStCheSter
1C Quaker Ridge Road, New Rochelle 360 Hamilton Avenue, White Plains
long iSland
1225 Franklin Avenue, Garden City279 Sunrise Highway, Rockville Centre68 South Service Road, Melville923 Broadway, Woodmere40 Cuttermill Road, Great Neck 100 Jericho Quadrangle, Jericho
Borough Park
Downtown BrooklynWilliamsburg
Jackson Heights Rockville Centre
Woodmere
Garden City
Jericho
Great Neck
New Rochelle
Hunts Point
White Plains
Long Island City
Melville
N
MANHATTAN
QUEENS
BROOKLYN
LONG ISLAND
BRONX
WESTCHESTER
STATENISLAND

2 0 0 9 a n n u a l r e p o r t | 1
Financial Highlights (in thousands)
2005 2006 2007 2008 2009
Total assets $ 4,384,938 5,399,425 5,845,172 7,192,199 9,146,112
Total loans 1,005,153 1,577,618 2,025,578 3,470,542 4,376,098
Total deposits 3,487,733 4,211,159 4,511,890 5,387,886 7,222,546
Shareholders’ equity 350,982 392,598 425,756 698,134 803,659
Net interest income after provision for loan losses 95,832 117,903 134,474 168,383 219,680
Non-interest income 18,678 21,328 8,746 27,645 34,632
Non-interest expense 81,757* 81,242 99,062 123,820 149,885
Income before income taxes 32,753 57,989 44,158 72,208 104,427
Net income available to common shareholders $ 15,869 33,360 27,279 42,969 50,523
* Includes $12 million special bonus paid by former parent company, Bank Hapoalim
Since our 2001 inception, Signature Bank has remained dedicated
to the targeted approach on which it was founded. This
includes serving the needs of privately owned businesses, their owners and senior
managers by providing clients with a single-point-of-contact approach.
Over the years, we have developed a proven business model, incorporating seasoned banking teams that deliver solid
results and an unwavering dedication to depositor safety.
This sound execution has enabled Signature Bank to
emerge as one of the New York area’s leading mid-sized commercial banks with
among the highest capital ratios in the industry.

2 | S i g n a t u r e B a n k
Signature Bank was founded in 2001 to fill a
void we saw unfolding in the marketplace. At
that time, we determined there would be signifi-
cantly fewer choices available as many relation-
ship-based institutions were being acquired by
mega-banks. These mega-banks began institu-
tionalizing their client base, quickly losing sight
of the importance of delivering highly personal-
ized financial care. Some people characterized
the mega-banks as “too big to fail.” We believe
they are “too big to succeed” in providing the
high level of service that clients deserve.
It was the vision of Signature Bank’s manage-
ment to create an institution that primarily
caters to privately owned businesses – a
niche clearly underserved and ignored
by these larger financial institutions.
Our model directly addresses the over-
arching need we recognized for a stable, well-capitalized relationship-based bank that could consis-
tently deliver tailored financial care and service to clients using a single-point-of-contact approach.
As the consolidations unfolded, many of the New York metropolitan area’s most experienced relation-
ship managers became disenchanted with their “too big” employers, and sought to find an institution
where they could personally care for their clients as they had in the past. Fortunately, we found each
other. Today, Signature Bank has 68 private client banking teams in place, which are lead by 88 Group
Directors, who operate from 23 offices, strategically situated throughout the New York metropolitan area.
To our Sh ar eholder s
(Left to right) Scott A. Shay, Chairman of the Board and Joseph J. DePaolo, President and Chief Executive Officer. In the background appears New York’s most famous landmark, The Empire State Building, with whose ownership Signature Bank has proudly forged a banking relationship.
06 07Year
Num
ber
05 08 09
Teams
0
10
30
20
40
50
70
60

A Targeted Approach
2 0 0 9 a n n u a l r e p o r t | 3
Validation of Our Business Model
During the past nine years, we have
consistently and diligently executed our
fundamental business model. We have
carefully structured, managed and maintained our strong balance sheet with a keen and cautious eye.
Our original model and fundamental principles lie in our ability to build upon the Bank’s market
leadership position and sustain our solid performance, amid some of the nation’s most unprecedented
financial times.
Through consistent execution of our proven business model, in 2009, Signature Bank:
• Achieved record net income available to common shareholders, which grew 17.6 percent to
$50.5 million, or $1.30 diluted earnings per share.
• Grew deposits by a record $1.83 billion, or 34.1 percent. Core deposits increased a record $1.82
billion, or 36.2 percent, while average deposits increased $1.54 billion, or 32.4 percent.
• Increased loans $905.6 million, or 26.1 percent, ending the year with the portfolio totaling
$4.38 billion.
• Maintained some of the industry’s strongest capital ratios. Total risk-based, tier one risk-
based and tier one leverage capital ratios were 14.47 percent, 13.57 percent and 9.39 percent,
respectively.
• Expanded net interest margin on a tax-equivalent basis to 3.41 percent.
• Added 13 private client banking teams, the most that joined in a given year since inception.
Capital R atios (As of 12/31/2009)
InstitutionTotal
Capital (to risk-weighted assets)
Tier 1 Capital
(to risk-weighted assets)
Tier 1 Leverage Capital
(to average assets)
Signature Bank 14.47% 13.57% 9.39%
Peer Group 1* (Average) 14.03% 12.15% 8.69%
* Peer Group 1 includes commercial banks with greater than $3 billion in assets as defined by the Federal Financial Institutions Examination Council.

4 | S i g n a t u r e B a n k
Delivering Exceptional Performance
2009 marked another outstanding year in terms of the Bank’s financial performance with our depositor-
oriented model, reaping positive results for the institution.
Net income available to common shareholders in 2009 reached a record $50.5 million, or $1.30 diluted earn-
ings per share, representing an increase of 17.6 percent, when compared with $43.0 million, or $1.35 diluted
earnings per share, reported in 2008. The record results are primarily attributable to increases in net interest
income, which was fueled by record core deposit growth and continued expansion in our loan portfolio. This
was partially offset by an increase in the provision for loan losses, a decrease in commissions and an increase
in non-interest expenses.
Net interest margin on a tax-equivalent basis for
2009 reached 3.41 percent, up 16 basis points
versus last year’s 3.25 percent. The Bank’s net
interest margin has steadily improved year-over-
year during the past nine years, marking record
highs each year. The growth in net interest margin
is attributable to the continued increase in core
deposits and loans.
A Matter of Timing
The Bank’s loan portfolio in 2009 grew $905.6
million, or 26.1 percent, to $4.38 billion for
2009. Our consistent attention to sensible lending
practices and timing contributed to this expan-
sion. We recognize the importance of appropriate
(Left to right) John McDonough and Richard Podolec, both Group Directors and Senior Vice Presidents at Signature Bank in
Williamsburg, Brooklyn, leave their offices to head to a client meeting.

A Proven Business Model
2 0 0 9 a n n u a l r e p o r t | 5
timing, especially in today’s uncertain waters.
We remain focused on extending loans to high-
quality borrowers with whom we have forged
strong relationships.
At the forefront of our depositor-focused model
is safety, and as such, we entered the commercial
real estate market after careful consideration and
prudent timing. We anticipated the financial
distress that surfaced in 2008 and 2009 when we
made a decision to extend certain commercial real
estate loans to our clients.
As with every move we make here at Signature
Bank, we only execute with the right people in
place and at what we believe to be the right time. After one of the New York area’s most
qualified commercial real estate banking teams joined in late 2007, Signature Bank entered
the market with eyes wide open.
As a result, 85 percent of the Bank’s commercial real estate portfolio was originated in the past
two years, during a tumultuous time for some, but fortunately for us, when the excess of capital
from the CMBS conduits and overly aggressive lenders departed the market. In the present
environment, with realistic real estate valuations, an acceptance by borrowers of conservative
underwriting standards and sober competition, we are able to make prudent loans consistent
with our depositor-oriented focus.
Group Director and Senior Vice President Alan Roth spends time meeting with team member Katherine Mulvey, Group Director and Vice President (left) and Linda Willinger, Financial Center Manager (right) at the Bank’s offices at 261 Madison Avenue, in the heart of midtown Manhattan.
06 0705
Real Estate Other
08 09
Loans(in millions)
$ 0
$ 2,000
$ 1,000
$ 3,000
$ 5,000
$ 4,000
Year
Amou
nt

6 | S i g n a t u r e B a n k
Leadership Through Strength and Safety
Once again, in 2009, our depositor-focused model enabled the Bank to prosper, despite economic
downturn. The relationships we have forged within our target market, along with the single-
point-of-contact approach we offer and the strength of our capital position, all helped propel our
market position.
Deposits in 2009 rose a record $1.83 billion, or 34.1 percent from 2008, reaching $7.22 billion at year-
end. Core deposits (excluding short-term escrow and brokered deposits) increased a record $1.82 billion,
or 36.2 percent. We believe it would be necessary for other institutions to acquire a bank or banks to
achieve this type of remarkable core growth. Average deposits in 2009 were $6.29 billion, up $1.54
billion, or 32.4 percent, when compared with $4.75 billion reported in 2008.
This core deposit growth is a result of the dedi-
cation our private client banking network brings
to depositors. Our significant deposit growth is
nothing short of exceptional – particularly in
the midst of a market like the one in which we
currently operate. With our teams serving as a
single point of contact to clients, they are able to
bring a sense of safety to these relationships while
generating deposits and appropriately growing the
loan portfolio.
Our capital position also remained strong during
2009, and Signature Bank’s levels continue to
be among the strongest industrywide. As of
December 31, 2009, the Bank’s total risk-based,
tier one risk-based and tier one leverage capi-
tal ratios were 14.47 percent, 13.57 percent and
Bank Operations Manager Margie Sowell-Jenkins and Michael Sharkey, Senior Vice President and Chief Technology Officer, discuss some
of the Bank’s new systems at the Company’s New York City headquarters.
06 0705 08 09
deposits(in millions)
$ 0
$ 1,600
$ 3,200
$ 4,800
$ 8,000
$ 6,400
Year
Amou
nt

Sound Execution
2 0 0 9 a n n u a l r e p o r t | 7
9.39 percent, respectively. These are once again
well above the regulatory requirements deemed
necessary to be considered a well-capitalized
institution. The risk-based ratios ref lect the
relatively low risk profile of Signature Bank’s
carefully managed balance sheet.
Early in 2009, Signature Bank made history
when we returned all the capital we received
from the U.S. Department of Treasury on the
first possible day allowable. We were one of only
five banks nationwide to do so. Initially, in late
2008, the Bank agreed to participate in the
Capital Purchase Program, which, at the time,
was promoted as geared toward the most financially
sound institutions in the nation. Later, subsequent
legislation placed considerable restrictions on
banks that accepted the funds without
distinguishing between healthy entities
like Signature Bank and weaker, less
capitalized institutions. This led to
the Bank’s 2009 return of $120.0
million received (in late 2008) from
the sale of senior preferred shares. We
believe our pristine capitalization led
the government to agree to accept the
funds so quickly.
Laura Palacios, Investment Group Director and Vice President for Signature Securities Group in Garden City, meets with Walter Malek, Group Director and Senior Vice President, in his office at Signature Bank’s private client banking location in Melville, Long Island.
signature bank’s single-point-of-contact approach
Business Banking
personal Banking
personal retirement
account
Cash Management
Services
Business line of Credit
CommercialMortgage
private Client Banking team

8 | S i g n a t u r e B a n k
Staying on Target
As we look back on the U.S. banking crisis of
2008 and 2009, we are aware that there are many
chapters left to unfold. We believe we have built a
business model that is robust and durable enough
to actually thrive in this turbulent environment.
Don’t look for us to follow the latest lending fads
or to create any splashy ad campaigns. Rather look
to us, as our clients do each and every day, to make
decisions based upon the safety of our depositors
first. This value serves as our foundation and is the
guiding light of all colleagues at Signature Bank.
We would like to thank our clients for their continued confidence in Signature Bank as well as the private
client banking teams that serve as their point of contact; all our other colleagues for their dedication; and our
fellow Board members for their guidance and counsel. We also want to thank our investors for their support.
All of these contributions have added to the market leadership position Signature Bank holds today and the
financial performance we have enjoyed to date.
If you are a prospective client and not getting the attention you deserve from your current institution, we
believe you will benefit from a Signature Bank relationship, and look forward to welcoming you.
As we look ahead to 2010, we remain not “too big” to succeed and not “too small” to provide a wide gamut of
products and the latest technology to our clients.
Respectfully,
James Raggi, Group Director and Senior Vice President at the Bank’s 71 Broadway location and Maryanne Kearney, Vice President - Real Estate
Lending, visit to address a client’s lending needs.
Joseph J. DePaolo President and Chief Executive Officer
Scott A. Shay Chairman of the Board

UNITED STATES FEDERAL DEPOSIT INSURANCE CORPORATION
WASHINGTON, D.C. 20429
FORM 10-K ANNUAL REPORT PURSUANT TO SECTION 13 OR 15(d) OF THE SECURITIES EXCHANGE ACT OF 1934
For the fiscal year ended December 31, 2009
Or
TRANSITION REPORT PURSUANT TO SECTION 13 OR 15(d) OF THE SECURITIES EXCHANGE ACT OF 1934
For the transition period from to
FDIC Certificate Number 57053
SIGNATURE BANK (Exact name of registrant as specified in its charter)
1249414-31 KROY WEN(State or other jurisdiction (I.R.S. Employer
of incorporation or organization) Identification No.)
71001 kroY weN ,kroY weN ,eunevA htfiF 565 )edoC piZ( )seciffo evitucexe lapicnirp fo sserddA(
Registrant’s telephone number, including area code: (646) 822-1500
Securities registered pursuant to Section 12(b) of the Act:
Title of each class Name of each exchange on which registered
Common Stock, $0.01 par value NASDAQ Global Select Market
Securities registered pursuant to Section 12(g) of the Act: NONE
Indicate by check mark if the registrant is a well-known seasoned issuer, as defined in Rule 405 of the Securities Act. Yes No
Indicate by check mark if the registrant is not required to file reports pursuant to Section 13 or Section 15(d) of the Act. Yes No
Indicate by check mark whether the registrant (1) has filed all reports required to be filed by Section 13 or 15(d) of the Securities Exchange Act of 1934 during the preceding 12 months (or for such shorter period that the registrant was required to file such reports), and (2) has been subject to such filing requirements for the past 90 days. Yes No
Indicate by check mark whether the registrant has submitted electronically and posted on its corporate Web site, if any, every Interactive Data File required to be submitted and posted pursuant to Rule 405 of Regulation S-T (§232.405 of this chapter) during the preceding 12 months (or for such shorter period that the registrant was required to submit and post such files). Yes No
Indicate by check mark if disclosure of delinquent filers pursuant to Item 405 of Regulation S-K (§229.405 of this chapter) is not contained herein, and will not be contained, to the best of registrant’s knowledge, in definitive proxy or information statements incorporated by reference in Part III of this Form 10-K or any amendment to this Form 10-K.
Indicate by check mark whether the registrant is a large accelerated filer, an accelerated filer, a non-accelerated filer, or a smaller reporting company. See definition of “large accelerated filer,” “accelerated filer” and “smaller reporting company” in Rule 12b-2 of the Exchange Act.(Check one):
Large accelerated filer Accelerated filer Non-accelerated filer Smaller reporting company
Indicate by check mark whether the registrant is a shell company (as defined in Rule 12b-2 of the Exchange Act). Yes No
The aggregate market value of the voting stock held by non-affiliates of the registrant, based on the closing sales price of theregistrant’s Common Stock as quoted on the NASDAQ Global Select Market on June 30, 2009 was $1.07 billion.
As of February 25, 2010, the Registrant had outstanding 40,619,557 shares of Common Stock.
DOCUMENTS INCORPORATED BY REFERENCE
Portions of the registrant’s definitive Proxy Statement for the 2009 Annual Meeting of Stockholders. (Part III)

2
SIGNATURE BANK
ANNUAL REPORT ON FORM 10-K
FOR THE FISCAL YEAR ENDED DECEMBER 31, 2009
INDEX
Page
PART I
Item 1. Business . . . . . . . . . . . . . . . . . . . . . . . . . . . . . . . . . . . . . . . . . . . . . . . . . . . . . . . . . . . . . . . . . . . 4Item 1A. Risk Factors. . . . . . . . . . . . . . . . . . . . . . . . . . . . . . . . . . . . . . . . . . . . . . . . . . . . . . . . . . . . . . . . . 20Item 1B. Unresolved Staff Comments. . . . . . . . . . . . . . . . . . . . . . . . . . . . . . . . . . . . . . . . . . . . . . . . . . . . 32Item 2. Properties . . . . . . . . . . . . . . . . . . . . . . . . . . . . . . . . . . . . . . . . . . . . . . . . . . . . . . . . . . . . . . . . . . 33Item 3. Legal Proceedings . . . . . . . . . . . . . . . . . . . . . . . . . . . . . . . . . . . . . . . . . . . . . . . . . . . . . . . . . . . 34Item 4. Submission of Matters to a Vote of Security Holders . . . . . . . . . . . . . . . . . . . . . . . . . . . . . . . . 34
PART II
Item 5. Market for Registrant’s Common Equity, Related Stockholder Matters and Issuer Purchases of Equity Securities . . . . . . . . . . . . . . . . . . . . . . . . . . . . . . . . . . . . . . . . . . . . . . . 35
Item 6. Selected Financial Data . . . . . . . . . . . . . . . . . . . . . . . . . . . . . . . . . . . . . . . . . . . . . . . . . . . . . . . 37Item 7. Management’s Discussion and Analysis of Financial Condition and Results of Operations . 39Item 7A. Quantitative and Qualitative Disclosures About Market Risk . . . . . . . . . . . . . . . . . . . . . . . . . . 72Item 8. Financial Statements and Supplementary Data . . . . . . . . . . . . . . . . . . . . . . . . . . . . . . . . . . . . 73Item 9. Changes in and Disagreements with Accountants on Accounting and Financial Disclosure. 73Item 9A. Controls and Procedures . . . . . . . . . . . . . . . . . . . . . . . . . . . . . . . . . . . . . . . . . . . . . . . . . . . . . . 73Item 9B. Other Information . . . . . . . . . . . . . . . . . . . . . . . . . . . . . . . . . . . . . . . . . . . . . . . . . . . . . . . . . . . . 76
PART III
Item 10. Directors, Executive Officers and Corporate Governance . . . . . . . . . . . . . . . . . . . . . . . . . . . . 76Item 11. Executive Compensation . . . . . . . . . . . . . . . . . . . . . . . . . . . . . . . . . . . . . . . . . . . . . . . . . . . . . . 76Item 12. Security Ownership of Certain Beneficial Owners and Management and Related
Stockholder Matters . . . . . . . . . . . . . . . . . . . . . . . . . . . . . . . . . . . . . . . . . . . . . . . . . . . . . . . . 76Item 13. Certain Relationships and Related Transactions, and Director Independence. . . . . . . . . . . . 76
Item 14. Principal Accounting Fees and Services . . . . . . . . . . . . . . . . . . . . . . . . . . . . . . . . . . . . . . . . . . 76
PART IV
Item 15. Exhibits, Financial Statement Schedules. . . . . . . . . . . . . . . . . . . . . . . . . . . . . . . . . . . . . . . . . . 77
SIGNATURES . . . . . . . . . . . . . . . . . . . . . . . . . . . . . . . . . . . . . . . . . . . . . . . . . . . . . . . . . . . . . . . . . . . . . . . . . . 79
Index to Financial Statements . . . . . . . . . . . . . . . . . . . . . . . . . . . . . . . . . . . . . . . . . . . . . . . . . . . . . . . . . . . . . F-1
3
PRIVATE SECURITIES LITIGATION REFORM ACT SAFE HARBOR STATEMENT
This Annual Report on Form 10-K and oral statements made from time-to-time by our representatives contain “forward-looking statements” within the meaning of the Private Securities Litigation Reform Act of 1995 that are subject to risks and uncertainties. You should not place undue reliance on those statements because they are subject to numerous uncertainties and factors relating to our operations and business environment, all of which are difficult to predict and many are beyond our control. Forward-looking statements include information concerning our possible or assumed future results of operations, including descriptions of our business strategy, expectations, beliefs, projections, anticipated events or trends, growth prospects, financial performance, and similar expressions concerning matters that are not historical facts. These statements often include words such as “may,” “believe,” “expect,” “anticipate,” “intend,” “plan,” “estimate,” “could,” “project,” “seek,” “should,” “will,” or “would,” or the negative of these words and phrases or similar words and phrases.
All forward-looking statements may be impacted by a number of risks and uncertainties. These statements are based on assumptions that we have made in light of our experience in the industry as well as our perception of historical trends, current conditions, expected future developments and other factors we believe are appropriate under the circumstances including those related to:
• earnings growth; • revenue growth; • deposit growth; • short-term escrow deposit growth; • off-balance sheet deposit growth; • future acquisitions; • performance, credit quality and liquidity of investments made by us, including our investments in certain mortgage-
backed and similar securities; • loan origination volume; • the interest rate environment; • non-interest income levels, including fees from product sales; • credit performance on loans made by us; • our ability to maintain, generate and/or raise capital; • changes in the regulatory environment and government intervention in the banking industry; • Federal Deposit Insurance Corporation insurance assessments; • margins on sales or securitizations of loans; • market share; • expense levels; • hiring of new private client banking teams; • results from new business initiatives; • other business operations and strategies; and • impact of new accounting pronouncements.
As you read and consider forward-looking statements, you should understand that these statements are not guarantees of performance or results. They involve risks, uncertainties and assumptions and can change as a result of many possible events or factors, not all of which are known to us or in our control. Although we believe that these forward-looking statements are based on reasonable assumptions, beliefs and expectations, if a change occurs or our beliefs, assumptions or expectations were incorrect, our business, financial condition, liquidity or results of operations may vary materially from those expressed in our forward-looking statements. You should be aware that many factors could affect our actual financial results or results of operations and could cause actual results to differ materially from those in the forward-looking statements. See “Part I, Item 1A. – Risk Factors” for additional information.
You should keep in mind that any forward-looking statement made by us speaks only as of the date on which we make it. New risks and uncertainties come up from time to time, and it is impossible for us to predict these events or how they may affect us. We have no duty to, and do not intend to, update or revise the forward-looking statements after the date on which they are made. In light of these risks and uncertainties, you should keep in mind that any forward-looking statement made in this document or elsewhere might not reflect actual results.

4
PART I
ITEM 1. BUSINESS
In this annual report filed on Form 10-K, except where the context otherwise requires, the “Bank,” the “Company,” “Signature,” “we,” “us,” and “our” refer to Signature Bank and its subsidiaries, including Signature Securities Group Corporation (“Signature Securities”).
Introduction
We are a New York-based full-service commercial bank with 23 private client offices located in the New York metropolitan area serving the needs of privately-owned business clients and their owners and senior managers. We offer a wide variety of business and personal banking products and services through the Bank as well as investment, brokerage, asset management and insurance products and services through our wholly-owned subsidiary, Signature Securities, a licensed broker-dealer and investment adviser. Through Signature Securities, we also purchase, securitize and sell the guaranteed portions of U.S. Small Business Administration (“SBA”) loans. For financial information by segment, see note 22 to the “Notes to Consolidated Financial Statements,” included elsewhere in this annual report on Form 10-K.
Signature Bank’s Annual Report on Form 10-K, Quarterly Reports on Form 10-Q, Current Reports on Form 8-K and all amendments to those reports, Proxy Statement for its Annual Meeting of Stockholders and Annual Report to Stockholders are made available, free of charge, on our website at www.signatureny.com as soon as reasonably practicable after such reports have been filed with or furnished to the Federal Deposit Insurance Corporation (“FDIC”). You may also obtain any materials that we file with the FDIC at the Federal Deposit Insurance Corporation’s offices located at 550 17th Street N.W., Washington, DC 20429. We do not file reports with the Securities and Exchange Commission.
Since commencing operations in May 2001, we have grown to $9.15 billion in assets, $7.22 billion in deposits, $4.32 billion in loans, $803.7 million in equity capital and $1.91 billion in other assets under management as of December 31, 2009.
We intend to continue our growth and maintain our position as a premier relationship-based financial services organization in the New York metropolitan area. This growth will be guided by our Chairman and senior management team who have extensive experience developing, managing and growing financial service organizations. Our Chairman, Scott Shay, has been a Managing Director of Ranieri & Co. Inc. since its formation in 1988. Most of our senior management, including our President and Chief Executive Officer, Joseph DePaolo, and our Vice-Chairman, John Tamberlane, were formerly senior officers of Republic National Bank of New York (Republic National Bank), an institution that successfully employed a deposit gathering strategy and private client focus similar to ours.
Recent Highlights
U.S. Treasury Programs
In response to the global financial crisis we have experienced over the last two years, several Federal programs were implemented that were designed to purchase assets from, provide equity capital to, and guarantee the liquidity of the industry. On October 3, 2008, the Emergency Economic Stabilization Act of 2008 (“EESA”) was signed into law, authorizing the United States Department of the Treasury (the “U.S. Treasury”) to, among other things, purchase up to $700 billion of mortgages, mortgage-backed securities, and certain other financial instruments from financial institutions for the purpose of stabilizing and providing liquidity to the U.S. financial markets. We have not as of yet participated, and do not expect to participate, in the sale of any of our assets into this program. EESA also immediately increased the FDIC deposit insurance limit on deposit accounts from $100,000 to $250,000 through December 31, 2009 and removed the insurance limits on transaction accounts, including demand deposit accounts and low-interest NOW accounts. Subsequently, in May 2009, the $250,000 deposit insurance limit was extended through December 31, 2013, and in August 2009, the unlimited coverage of transaction accounts was extended through June 30, 2010.

5
During the fourth quarter of 2009, the FDIC adopted a rule that required FDIC-insured depository institutions to prepay their quarterly risk-based assessments for the fourth quarter of 2009, and for all of 2010, 2011, and 2012, on December 30, 2009. Our prepaid assessment amount for the fourth quarter of 2009 and all of 2010 was based on our total base assessment rate in effect on September 30, 2009. For purposes of calculating the prepayment amount, that rate was increased by three basis points for all of 2011 and 2012, and our third quarter 2009 assessment base was increased quarterly by an estimated five percent annual growth rate through the end of 2012. Our total prepaid assessment was $31.4 million, which we recorded as a prepaid expense (asset) as of December 31, 2009. As of December 31, 2009, we recorded an expense for our regular quarterly assessment for the fourth quarter of 2009 and an offsetting credit to the prepaid expense, which we will continue for each quarter going forward until the prepaid asset is exhausted.
During October 2008, the U.S. Treasury announced that it would purchase equity stakes in a wide variety of banks and thrifts. Under this program, known as the Troubled Asset Relief Program Capital Purchase Program (the “TARP Capital Purchase Program”), the U.S. Treasury announced it would make capital available to U.S. financial institutions by purchasing preferred stock from the institutions. In conjunction with these purchases of preferred stock, the U.S. Treasury would receive warrants to purchase common stock with an aggregate market price equal to 15% of the preferred stock investment. Participating financial institutions are required to adopt the U.S. Treasury’s standards for executive compensation and corporate governance for the period during which the Treasury holds the preferred stock issued under the TARP Capital Purchase Program. On October 28, 2008, we submitted an application for voluntary participation in the TARP Capital Purchase Program, which was approved for an amount equal to approximately 3.0% of our risk-weighted assets.
On December 12, 2008, we completed the issuance of 120,000 shares of senior preferred stock (with an aggregate liquidation preference of $120.0 million) and a warrant to purchase 595,829 common shares to the U.S. Treasury through the TARP Capital Purchase Program (the “TARP Offering”). We began to use the proceeds from the TARP Offering to fund our continued loan growth, and we believe our active lending to credit-worthy borrowers during our participation in the program supported the U.S. Treasury’s stated goal of increasing the flow of credit to both consumers and businesses.
On February 17, 2009, the American Recovery and Reinvestment Act of 2009 (the “Recovery Act”) was enacted. The Recovery Act included limitations and other provisions that may have affected the manner in which participants in the TARP Capital Purchase Program conduct their business. In light of the restrictions of the Recovery Act, on March 31, 2009, we repurchased the 120,000 shares of preferred stock we issued to the U.S. Treasury for $120.0 million (the aggregate liquidation preference of such preferred stock) plus accrued and unpaid dividends of $767,000. We believe exiting the program was in our best interest and the best interest of our shareholders and clients, and we remain “well capitalized” as defined for regulatory purposes. The ten-year warrant to purchase up to 595,829 shares of our common stock that was also issued to the U.S. Treasury on December 12, 2008 in connection with the TARP Capital Purchase Program remains outstanding at December 31, 2009. On February 18, 2010, the U.S. Treasury expressed its intent to auction our warrant, and we are assessing whether we will participate in the auction of the warrant.
Common Stock Offerings
On September 12, 2008, we completed a public offering of 5,400,000 shares of our common stock, and on June 8, 2009, we completed a public offering of 5,175,000 shares of our common stock. Our net proceeds from these offerings amounted to approximately $148.1 million and $127.3 million, respectively, and such amounts were added to our capital. The net proceeds from these offerings have supported a significant level of growth and have permitted us to originate and retain loans of a size and type that allows us to accommodate the needs of our targeted clients, which are privately owned businesses, their owners and their senior managers.
Core Deposit Growth
From December 31, 2008 through December 31, 2009, our deposits grew $1.83 billion, or 34.1%, to $7.22 billion. This amount includes $10.1 million of brokered deposits and approximately $379.4 million of short-term escrow deposits, which due to their nature and as expected, have been or will be released during the first quarter of 2010. At year end 2008, deposits included $143.2 million of brokered deposits and $228.9 million of short-term escrow deposits. Excluding brokered deposits and short-term escrow deposits, core deposits increased $1.82 billion, or 36.2%, for the year. This growth in our core deposits, which is at a cost of funds below industry averages, can be attributed to the addition of new private client groups, who assist us in growing our client base, and additional deposits by our current clients. We primarily focus our deposit gathering efforts in the greater New York

6
metropolitan area market with money center banks, regional banks and community banks as our primary competitors. We distinguish ourselves from competitors by focusing on our target market: privately-owned businesses and their owners and senior managers. This niche approach, coupled with our relationship-banking model, provides our clients with a personalized service, which we believe gives us a competitive advantage. Our deposit mix has remained favorable, with non-interest-bearing and NOW deposits accounting for 36.8% of our total deposits and time deposits accounting for only 10.6% of our total deposits as of December 31, 2009. Our average cost for total deposits was 1.36% for the year ended December 31, 2009 and 1.21% for the three months ended December 31, 2009.
Additionally, our core deposit growth reflects our participation in the FDIC’s Transaction Account Guarantee Program, which temporarily provides a full guarantee above the existing $250,000 deposit insurance limit for funds held at participating FDIC-insured depository institutions in non-interest-bearing transaction accounts and NOW accounts that pay up to 50 basis points. Coverage became effective on October 14, 2008 and continues through June 30, 2010.
Escrow Deposits
At December 31, 2009 and 2008, approximately $379.4 million and $228.9 million, respectively, of short-term escrow deposits were included in the Bank’s deposits. We have developed a core competency in catering to the needs of law firms, claims administrators, accounting firms, and title companies, which allows us to obtain from our clients short-term escrow deposits that banks of our size typically do not attract.
Strategic Hires
During 2009, we added 13 new private client groups and 19 new group directors to increase our network of seasoned banking professionals. Our full-time equivalent number of employees grew from 553 to 614 during 2009.
Private Client Groups and Offices
As of December 31, 2009, we had 68 private banking client groups and 88 banking group directors throughout the New York metropolitan area. With the on-going consolidation of financial institutions in our marketplace and market segmentation by our competitors, we continue to actively recruit experienced private client groups with established client relationships that fit our niche market of privately-owned businesses, their owners and their senior managers. Our typical group director joins us with 20 years of experience in financial services, a seasoned book of business and an established team of two to four additional professionals to assist with business development and client services. Each additional private client group brings client relationships that allow us to grow our core deposits as well as expand our lending opportunities. We are actively recruiting several additional private client groups that we believe will fit our strategy and enhance our franchise.
To facilitate our growth, we opened one additional private client office during 2009 located in Midtown Manhattan. We currently operate 23 private client offices located in the New York metropolitan area. While our strategy does not call for us to have an expansive office presence, we will continue to add offices to meet the needs of the private client groups that we recruit.
Our Business Strategy
We intend to increase our presence as a premier relationship-based financial services organization serving the needs of privately-owned business clients, their owners and senior managers in the New York metropolitan area by continuing to:
Focus on our niche market of privately-owned businesses, their owners and their senior managers
We generally target closely held commercial clients with revenues of less than $50 million and fewer than 1,000 employees. Our business clients are representative of the New York metropolitan area economy and include real estate owners/operators, real estate management companies, law firms, accounting firms, entertainment business managers, medical professionals, retail establishments, money management firms and not-for-profit philanthropic organizations. We also target the owners and senior management of these businesses who typically have a net worth of between $500,000 and $20 million.

7
Provide our clients a wide array of high quality banking, brokerage and insurance products and services
through our private client group structure and a seamless financial services solution
We offer a broad array of financial products and services with a seamless financial services solution through our private client group structure.
Most of our competitors that sell banking products as well as investment and insurance products do so based on a “silo” approach. In this approach, different sales people from different profit centers within the bank, brokerage firm or insurance company separately offer their particular products to the client. This approach creates client confusion as to who is servicing the relationship. Because no single relationship manager considers all of the needs of a client in the “silo” approach, some products and services may not be presented at all to the client. We market our banking, investment and insurance services seamlessly, thus avoiding the “silo” based approach of many of our competitors in the New York metropolitan area. Our cash management, investment and insurance products and services are presented to clients by the private client group professional but provided or underwritten by others.
Our business is built around banking and investment private client groups. We believe that our ability to hire and retain top-performing relationship group directors is our major competitive advantage. Our group directors have primary responsibility for attracting client relationships and, on an on-going basis, through them and their groups, servicing those relationships. Our group directors are experienced financial service professionals who come from the following disciplines: private banking, middle market banking, high-end retail banking, investment and insurance and institutional brokerage. Our group directors each have their own private client team (typically two to four professionals) who assists the group director in business development and client service.
Recruit experienced, talented and motivated private client group directors who are top producers and who
believe in our banking model
A key to our success in developing a relationship-based bank is our ability to recruit and retain experienced and motivated financial services professionals. We recruit group directors and private client groups who we believe are top performers. While recruitment channels differ and our recruitment efforts are largely opportunistic in nature, the continuing merger and acquisition activity in the New York financial services marketplace provides an opportunity to selectively target and recruit qualified groups. We believe the current market to be a favorable environment for locating and recruiting qualified private client groups. Our experience has been that such displacement and change leads select private client groups to smaller, less bureaucratic organizations.
Offer progressive incentive-based compensation that rewards private client groups for developing their
business and retaining their clients
Our private client group variable compensation model adds to the foundation for our relationship based banking discipline. A key part of our strategy for growing our business is the progressive incentive-based compensation that we employ to help us retain our group directors while ensuring that they continue to develop their business and retain their clients. Under our private client group variable compensation model, annual bonuses are paid to members of the client relationship team based upon the profit generated from their business. In order to mitigate the inherent risk in our incentive-based compensation model, we have in place an internal control structure that includes segregation of duties. For example, the underwriting and ultimate approval of any loan is performed by loan officers who are separate from the private client groups and report to our Chief Credit Officer.
Maintain a flat organization structure that allows our clients and group directors to interface with, and our
group directors to report directly to, senior management
Another key element of our strategy is our organizational structure. We operate with a flat organizational and reporting structure, which allows our group directors to interface with, and report directly to, senior management. More importantly, it gives our clients direct access to senior management.
Develop and maintain operations support that is client-centric and service oriented
We have made a significant investment in our infrastructure, including our support staff. We have centralized many of our critical operations, such as finance, information technology, client services, cash management services, loan administration and human resources. Although we have centralized many of our operations, we have located some functions within the private client offices so they are closer to the group directors and our clients. For example, most of our private client offices have a senior lender on location, who is part of our credit

8
group, to assist the private client groups with the lending process. In addition, most of our private client offices have an investment group director or group that provides brokerage and/or insurance services, as necessary. We believe that our existing infrastructure (physical and systems infrastructure, as well as people) can accommodate additional growth without substantial additional support area personnel or significant spending on technology and operations in the medium term.
Be committed to a sound risk management process while focusing on profitability
Risk management is an important element of our business. We evaluate the inherent risks that affect our business, including interest rate risk, credit risk, operational risk, regulatory risk, and reputation risk. Members of our senior management group have significant experience in risk management. In addition, they have extensive backgrounds in credit, operations, finance and auditing. We have put internal controls in place that help to mitigate the risks that affect our business. In addition, we have policies and procedures that further help mitigate risk and regulatory requirements that mandate that we evaluate, test and opine on the effectiveness of internal controls. No system of internal control or policies and procedures will ever totally eliminate risk, however, we believe that our risk management processes will help keep our risks to a manageable level.
Maintain an appropriate balance between cost control, incentive compensation and business expansion
initiatives
We have established an internal approval process for capital and operating expenses. We maintain cost control practices and policies to increase efficiency of operations. A key expense for financial service companies is compensation. Controlling this expense is an important element in keeping overall expenses down. A member of senior management and our President and Chief Executive Officer must approve all new hires. Our group directors and their groups receive base salaries and benefits; however, a significant portion of their compensation is variable and based upon the profit generated from the business they create. This variable compensation model helps us control expenses as employees do not receive variable compensation unless revenue is generated. Virtually all expenditures (both current and capital) in excess of certain thresholds must be approved by a member of senior management, and are reviewed and approved by our Purchasing and Capital Expenditures Committee, which includes our Chief Operating Officer and our Chief Financial Officer.
We make extensive use of outsourcing to provide cost-effective operational support with service levels consistent with large-bank operations. We focus on our financial services business and have outsourced many of our key banking and brokerage systems to third-party providers. This has several advantages for an institution like ours, including the ability to cost-effectively utilize the latest technology to better serve, and stay focused on, the needs of our clients. Some of our key outsourcing partners include Fidelity Information Services and National Financial Services (the brokerage and investments systems division of Fidelity Investments). We maintain management oversight of these providers. Each of these providers was the subject of a due diligence investigation prior to their selection and continues to be reviewed on an on-going basis.
Historical Development
We were incorporated as a New York State-chartered bank in September 2000, received approval to commence operations from the New York State Banking Department on April 5, 2001, our date of inception, and commenced operations on May 1, 2001. Since commencing operations, the following subsequent historical developments have occurred in relation to our ownership and capital structure:
� We completed our initial public offering in March 2004 and a follow-on offering in September 2004. Our common stock trades on the Nasdaq National Market under the symbol “SBNY.”
� In March 2005, Bank Hapoalim B.M. sold its controlling stake in us in a secondary offering. After the offering, Bank Hapoalim beneficially owned 5.7% of our common stock on a fully diluted basis. Bank Hapoalim no longer owns any shares of our stock.
� In September 2008, we completed a public offering of 5.4 million shares of our common stock generating net proceeds of $148.1 million.
� In December 2008, we issued 120,000 shares of senior preferred stock and a warrant to purchase 595,829 common shares to the U.S. Treasury in the TARP Capital Purchase Program, for an aggregate purchase price of $120.0 million.

9
� In light of the restrictions of the Recovery Act, on March 31, 2009, we repurchased the 120,000 shares of preferred stock we issued to the U.S. Treasury for $120.0 million plus accrued and unpaid dividends of $767,000.
� In June 2009, we completed a public offering of 5.2 million shares of our common stock generating net proceeds of $127.3 million.
Signature Securities
Signature Securities is a registered broker-dealer in securities under the Securities Exchange Act of 1934 (the “Exchange Act”) and a member of the National Association of Securities Dealers, Inc. (“NASD”). It formally opened for full business operations on May 1, 2001.
Signature Securities provides our clients with comprehensive investment, brokerage, wealth management, and other non-banking financial products and services. Signature Securities delivers these products and services to its clients through experienced investment group directors, located in our private client offices, who work directly with our banking group directors to bring these services to clients.
Products and Services
We offer a wide variety of deposit, escrow deposit, credit, cash management, investment and insurance products and services to our clients. At December 31, 2009, we maintained approximately 61,500 deposit accounts, 8,200 investment accounts, 8,200 loan accounts and 12,400 client relationships.
Business Clients
We offer a full range of products and services oriented to the needs of our business clients, including:
� Deposit products such as non-interest-bearing checking accounts, money market accounts and time deposits;
� Escrow deposit services; � Cash management services; � Commercial loans and lines of credit for working capital and to finance internal growth, acquisitions and
leveraged buyouts; � Permanent real estate loans; � Letters of credit; � Investment products to help better manage idle cash balances, including money market mutual funds and
short-term money market instruments; � Business retirement accounts such as 401(k) plans; and � Business insurance products, including group health and group life products.
Personal Clients
We offer a full range of products and services oriented to the needs of our high net worth personal clients, including:
� Interest-bearing and non-interest-bearing checking accounts, with optional features such as debit/ATM cards and overdraft protection and, for our top clients, rebates of certain charges, including ATM fees;
� Money market accounts and money market mutual funds; � Time deposits; � Personal loans, both secured and unsecured; � Mortgages, home equity loans and credit card accounts; � Investment and asset management services; and � Personal insurance products, including health, life and disability.
Deposit Products
The market for deposits continues to be very competitive. We primarily focus our deposit gathering efforts in the greater New York metropolitan area with money center banks, regional banks and community banks as our

10
primary competitors. We distinguish ourselves from competitors by focusing on our target market: privately-owned businesses and their owners and senior managers. This niche approach, coupled with our relationship-banking model, provides our clients with a personalized service, which we believe gives us a competitive advantage.
We offer a variety of deposit products to our clients at interest rates that are competitive with other banks. Our business deposit products include commercial checking accounts, money market accounts, escrow deposit accounts, lockbox accounts, cash concentration accounts and other cash management products. Our personal deposit products include checking accounts, money market accounts and certificates of deposit. We also allow our personal and business deposit clients to access their accounts, transfer funds, pay bills and perform other account functions over the internet and through ATM machines. At December 31, 2009, we maintained approximately 61,500 deposit accounts representing $7.21 billion in client deposits, excluding brokered deposits.
The following table presents the mix of our deposits and deposit products as of December 31, 2009 and 2008.
(dollars in thousands) Amount Percentage Amount Percentage
Personal demand deposit accounts (1) 203,204$ 2.81% 210,293 3.90%Business demand deposit accounts (1) 1,766,530 24.46% 1,353,114 25.12%Rent security 37,707 0.52% 22,338 0.41%Personal NOW 115,476 1.60% 72,674 1.35%Business NOW 571,920 7.92% 383,226 7.11%Personal money market accounts 1,085,782 15.03% 565,950 10.50%Business money market accounts 2,675,934 37.05% 2,086,642 38.73%Personal time deposits 481,555 6.67% 159,521 2.96%Business time deposits 274,374 3.80% 390,931 7.26%Brokered time deposits 10,064 0.14% 143,197 2.66%
Total 7,222,546$ 100.00% 5,387,886 100.00%Demand deposit accounts (1) 1,969,734$ 27.27% 1,563,407 29.02%NOW 687,396 9.52% 455,900 8.46%
Money market accounts 3,799,423 52.60% 2,674,930 49.64%Time deposits 755,929 10.47% 550,452 10.22%
Brokered time deposits 10,064 0.14% 143,197 2.66%Total 7,222,546$ 100.00% 5,387,886 100.00%
Personal 1,886,017$ 26.11% 1,008,438 18.71%Business 5,326,465 73.75% 4,236,251 78.63%Brokered time deposits 10,064 0.14% 143,197 2.66%
Total 7,222,546$ 100.00% 5,387,886 100.00%
(1) Non-interest bearing.
December 31,2009 2008
Lending Activities
Our traditional commercial and industrial lending is generally limited to existing clients with whom we have or expect to have deposit and/or brokerage relationships in order to assist in monitoring and controlling credit risk. We target our lending to privately-owned businesses, their owners and senior managers, generally high net worth individuals who meet our credit standards. The credit standards are set by the Credit Committee of our Board of Directors (the “Credit Committee”) with the assistance of our Chief Credit Officer, who is charged with ensuring that credit standards are met by loans in our portfolio. In addition, we have a credit authorization policy under which no single individual is authorized to approve a loan regardless of dollar amount. Smaller loans may be approved by concurring authorized officers. Larger loans require the approval of the Credit Committee. Our largest loan category requires the approval of our Board of Directors. Our credit standards for commercial borrowers reference numerous criteria with respect to the borrower, including historical and projected financial

11
information, the strength of management, acceptable collateral and associated advance rates, and market conditions and trends in the borrower’s industry. In addition, prospective loans are analyzed based on current industry concentrations in our loan portfolio to prevent an unacceptable concentration of loans in any particular industry. We believe our credit standards are similar to the standards generally employed by large nationwide banks in the markets we serve. We seek to differentiate ourselves from our competitors by focusing on and aggressively marketing to our core clients and accommodating, to the extent permitted by our credit standards, their individual needs. We generally limit unsecured lending for consumer loans to private banking clients who we believe demonstrate ample net worth, liquidity and repayment capacity.
We make loans that are appropriately collateralized under our credit standards. Approximately 95% of our funded loans are secured by collateral. Unsecured loans are typically made to individuals with substantial net worth.
Commercial and Industrial Loans
Our commercial and industrial (“C&I”) loan portfolio is comprised of lines of credit for working capital and term loans to finance equipment, company owned real estate and other business assets, along with commercial overdrafts. Our lines of credit for working capital are generally renewed on an annual basis and our term loans generally have terms of two to five years. Our lines of credit and term loans typically have floating interest rates, and as of December 31, 2009, approximately 61% of our outstanding C&I loans were variable rate loans. C&I loans can be subject to risk factors unique to the business of each client. In order to mitigate these risks and better serve our clients, we seek to gain an understanding of the business of each client and the reliability of their cash flow, so that we can place appropriate value on collateral taken and structure the loan to maintain collateral values at appropriate levels. In analyzing credit risk, we generally focus on the business experience of our borrowers’ management. We prefer to lend to borrowers with an established track record of loan repayment and predictable growth and cash flow. We also rely on the experience of our bankers and their relationships with our clients to aid our understanding of the client and its business. Our lines of credit typically are limited to a percentage of the value of the assets securing the line. Lines of credit are generally reviewed annually and are typically supported by accounts receivable, inventory and equipment. Depending on the risk profile of the borrower, we may require periodic aging of receivables, as well as borrowing base certificates representing current levels of inventory, equipment, and accounts receivable. Our term loans are typically also secured by the assets of our clients’ businesses. Commercial borrowers are required to provide updated personal and corporate financial statements at least annually. At December 31, 2009, funded C&I loans totaled approximately 23% of our total funded loans. Loans extended to borrowers within the services industries include loans to finance working capital and equipment, as well as loans to finance investment and owner-occupied real estate.
12
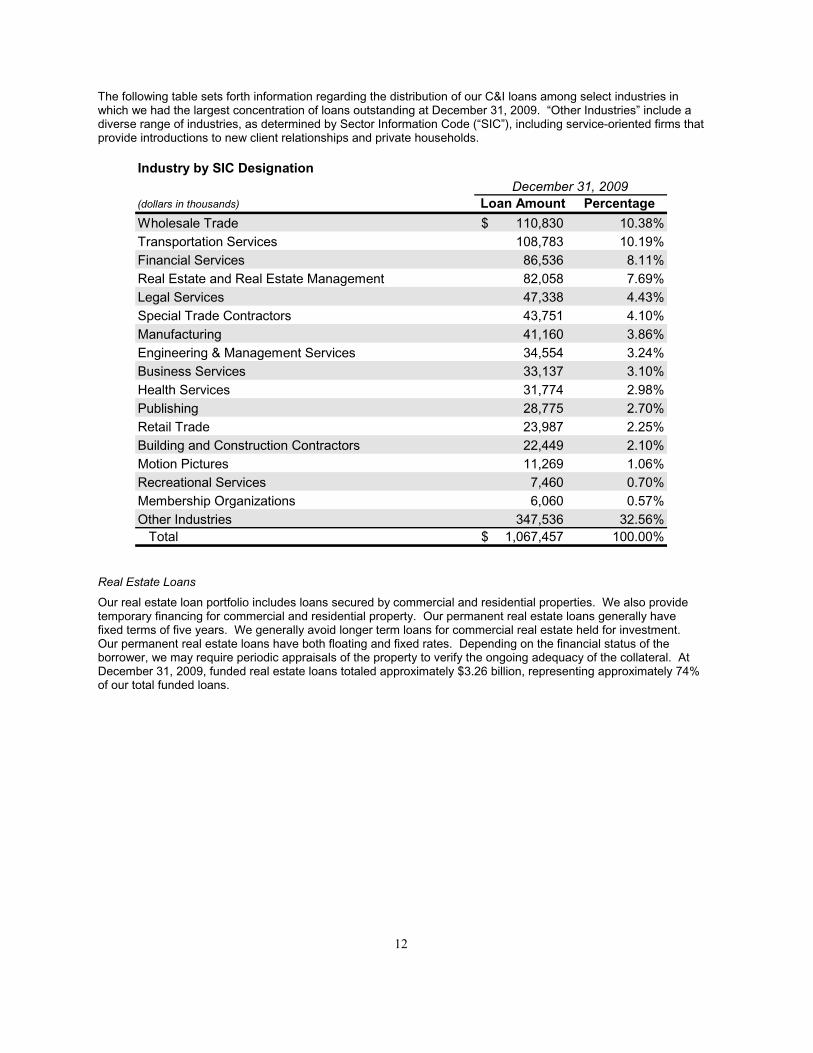
The following table sets forth information regarding the distribution of our C&I loans among select industries in which we had the largest concentration of loans outstanding at December 31, 2009. “Other Industries” include a diverse range of industries, as determined by Sector Information Code (“SIC”), including service-oriented firms that provide introductions to new client relationships and private households.
Industry by SIC Designation
(dollars in thousands) Loan Amount Percentage
Wholesale Trade 110,830$ 10.38%Transportation Services 108,783 10.19%Financial Services 86,536 8.11%Real Estate and Real Estate Management 82,058 7.69%Legal Services 47,338 4.43%Special Trade Contractors 43,751 4.10%Manufacturing 41,160 3.86%Engineering & Management Services 34,554 3.24%Business Services 33,137 3.10%Health Services 31,774 2.98%Publishing 28,775 2.70%Retail Trade 23,987 2.25%Building and Construction Contractors 22,449 2.10%Motion Pictures 11,269 1.06%Recreational Services 7,460 0.70%Membership Organizations 6,060 0.57%Other Industries 347,536 32.56%
Total 1,067,457$ 100.00%
December 31, 2009
Real Estate Loans
Our real estate loan portfolio includes loans secured by commercial and residential properties. We also provide temporary financing for commercial and residential property. Our permanent real estate loans generally have fixed terms of five years. We generally avoid longer term loans for commercial real estate held for investment.Our permanent real estate loans have both floating and fixed rates. Depending on the financial status of the borrower, we may require periodic appraisals of the property to verify the ongoing adequacy of the collateral. At December 31, 2009, funded real estate loans totaled approximately $3.26 billion, representing approximately 74% of our total funded loans.

13
The following table shows the distribution of our real estate loans as of December 31, 2009 by collateral type:
Loans Secured by Real Estate
(dollars in thousands) Loan Amount Percentage
Commercial property 1,492,877$ 45.83%Multi-family residential property 1,153,610 35.42%1-4 family residential property 260,986 8.01%Construction and land 178,740 5.49%Home equity lines of credit 170,891 5.25%
Total 3,257,104$ 100.00%
December 31, 2009
We occasionally make personal residential real estate loans. These loans consist of first and second mortgage loans for residential properties. These loans are typically made to high net worth individuals as part of our private client services. We generally do not retain long-term, fixed rate residential real estate loans in our portfolio due to interest rate and collateral risks and low levels of profitability. We do not consider personal residential real estate loans a core part of our business. Our rates are usually higher than the rates offered by other providers of these loans.
Substantially all of the collateral for our real estate loans is located within the New York metropolitan area. As a result, our financial condition and results of operations may be affected by changes in the economy and the real estate market of the New York metropolitan area. A prolonged period of economic recession or other adverse economic conditions in the New York metropolitan area, such as the one we are facing now, has and may continue to cause an increase in nonpayment of loans and a decrease in collateral value.
Letters of Credit
We issue standby or performance letters of credit, and can service the international needs of our clients through correspondent banks. At December 31, 2009, our commitments under letters of credit totaled approximately $209.2 million.
Consumer Loans
Our personal loan portfolio consists of personal lines of credit and loans to acquire personal assets. Our personal lines of credit generally have terms of one year and our term loans usually have terms of three to five years. Our lines of credit typically have floating interest rates. If the financial situation of the client is sufficient, we will grant unsecured lines of credit. We also examine the personal liquidity of our individual borrowers, in some cases requiring agreements to maintain a minimum level of liquidity, to insure that the borrower has sufficient liquidity to repay the loan. Due to low levels of profitability, interest rate risks and collateral risks, we do not consider secured personal loans, such as automobile loans, a core part of our business. At December 31, 2009, our consumer loans totaled $54.6 million.
Investment and Asset Management Products and Services
Investment and asset management products and services are provided through our subsidiary, Signature Securities. Signature Securities is a licensed broker-dealer and is a member of the NASD and the SIPC. Signature Securities is an introducing firm and, as such, clears its trades through National Financial Services, Inc., a wholly-owned subsidiary of Fidelity Investments. Signature Securities is also registered as an investment adviser in New York, New Jersey, Pennsylvania and Florida. Our investment group directors work with our clients to define objectives, goals and strategies for their investment portfolios, whether our clients are looking for a relationship based provider or are looking for assistance with a particular transaction.
We offer a wide array of asset management and investment products, including the ability to purchase and sell all types of individual securities such as equities, options, fixed income securities, mutual funds and annuities. We offer transactional, “cash management” type brokerage accounts with check writing and daily sweep capabilities. We offer our clients an asset management program whereby we work with our clients to tailor their asset allocation according to their risk profile and then invest the client’s assets either directly with a select group of high quality

14
money managers, no load mutual funds or a combination of both. We contract with a third party to perform investment manager due diligence for us on these money managers and mutual funds. We have entered into an agreement and strategic alliance with American Stock Transfer & Trust Company and utilize this firm to provide our corporate and personal clients with trust, custody and estate planning products and services. We offer no proprietary products or services. We do not perform and we do not provide our clients with our own branded investment research. Instead, we have contracted with a number of third-party research providers and are able to provide our clients with traditional Wall Street research from a number of sources.
We also offer retirement products such as individual retirement accounts (“IRAs”) and administrative services for retirement vehicles such as pension, profit sharing, and 401(k) plans to our clients. These products are not proprietary products.
Signature Securities offers wealth management services to our high net worth personal clients. Together with our client and their other professional advisors, including attorneys and certified public accountants, we develop a sophisticated financial plan that can include estate planning, business succession planning, asset protection, investment management, family office advisory services, bill payment, art and collectible advisory services and concentrated stock services.
SBA Loans and Pools
We are an active participant in the SBA loan and SBA pool secondary market by purchasing, securitizing, and selling the guaranteed portions of SBA Section 7(a) loans. Most SBA Section 7(a) loans have adjustable rates and float at a spread to the prime rate and reset monthly or quarterly. SBA loans consist of a guaranteed portion of the loan and an un-guaranteed balance, which typically represents 10% of the original balance that is retained by the originating lender. The guaranteed portions of SBA loans are backed by the full faith and credit of the U.S. government and, therefore, have no credit risk and carry a 0% risk weight for capital purposes. At December 31, 2009, we had $293.2 million in SBA loans held for sale compared to $217.7 million at December 31, 2008. The increase in SBA loans held for sale was due to the continued dislocation in the credit markets, where we were able to use our strong capital position to acquire SBA loans at advantageous prices. The increased inventory has been used to fill the demand for this product on the investor side that has been fueled by the Federal Reserve’s Term Asset-Backed Securities Loan Facility initiative.
Signature Securities acts as an agent and as a consultant to the Bank on the purchase, sale and assembly of SBA loans and pools. Signature Securities is one of the largest SBA pool assemblers in the United States. The primary business of the group is to be an active market maker in the SBA loan and pool secondary market by purchasing, securitizing and selling the government guaranteed portions of the SBA loans. Signature Bank is approved by the SBA as a pool assembler and is approved by the FDIC to engage in government securities dealer activities.
We purchase the guaranteed portion of SBA loans from various SBA lender clients. Once purchased, we typically warehouse the guaranteed loan for approximately 30 to 180 days. From this warehouse, we aggregate like SBA loans by similar characteristics into pools for securitization to the secondary market. In order to meet the SBA’s rate requirement, we may strip excess servicing from loans with different coupons to create a pool at a common rate. This has resulted in the creation of two assets: a par pool and excess servicing strips. Excess servicing represents the portion of the coupon stripped from a loan. At December 31, 2009, the carrying amount of our SBA SBA excess servicing strip assets was $93.0 million.
Colson Services Corp. is the government appointed fiscal and transfer agent for the SBA’s Secondary Market Program. As the designated servicer, it provides transaction processing, record keeping and loan servicing functions, including document review and custody, payment collection and disbursement, and data collection and exchange for us.
Insurance Services
We offer our business and private clients a wide array of individual and group insurance products, including health, life, disability and long-term care insurance products through our subsidiary, Signature Securities. We do not underwrite insurance policies. We only act as an agent in offering insurance products and services underwritten by insurers that we believe are the best for our clients in each category.

15
Competition
There is significant competition among commercial banking institutions in the New York metropolitan area. We compete with other bank holding companies, national and state-chartered commercial banks, savings and loan associations, consumer finance companies, credit unions, securities brokerage firms, insurance companies, mortgage banking companies, money market mutual funds, asset-based non-bank lenders, and other financial institutions. Many of these competitors have substantially greater financial resources, lending limits and larger office networks than we do and are able to offer a broader range of products and services than we can. Because we compete against larger institutions, our failure to compete effectively for deposit, loan, and other clients in our markets could cause us to lose market share, slow our growth rate and may have an adverse effect on our financial condition and results of operations.
The market for banking and brokerage services is extremely competitive and allows consumers to access financial products and compare interest rates and services from numerous financial institutions located across the United States. As a result, clients of all financial institutions, including those within our target market, are sensitive to competitive interest rate levels and services. Our future success in attracting and retaining client deposits depends, in part, on our ability to offer competitive rates and services. Our clients are particularly attracted to the level of personalized service we can provide. Our business could be impaired if our clients believe other banks provide better service or if they come to believe that higher rates are more important to them than better service.
Finally, there has been significant government intervention in the banking industry recently, including equity investments, liquidity facilities and guarantees. These actions have changed and have the potential to change the competitive landscape significantly. For example, clients may view some of our competitors as “too big to fail” and thereby benefiting from an implicit U.S. government guarantee beyond those provided to all banks and their clients. In addition, some of these government programs have, or may have, the ability to give rise to new competitors. For instance, the FDIC has introduced a bidding process for institutions that have been or will be placed into receivership by federal or state regulators. This process is open to existing financial institutions, as well as groups without pre-existing operations. The impact of this government intervention is difficult to predict and could adversely affect our competitive standing and profitability.
The New York Market
Substantially all of our business is located in the New York metropolitan area. We believe the New York metropolitan area economy presents an attractive opportunity to build an independent financial services company oriented to the needs of the New York metropolitan area economic marketplace. The New York Metropolitan Statistical Area (or MSA) is, by far, the largest market in the United States for bank deposits. The MSA of New York, Long Island and Northern New Jersey is - with approximately $893.4 billion in total deposits, as of June 30, 2009 – more than two and a half times larger than the second largest MSA in the U.S. (Los Angeles, Long Beach and Santa Ana, California). The New York MSA is also home to the largest number of businesses with fewer than 500 employees in the nation. The economy of the New York metropolitan area has diversified substantially over the past several decades and includes a greater variety of industries such as services, technology and real estate. The New York metropolitan area financial services marketplace is served by many large, diverse financial services companies, including large, multi-national financial services companies, regional banks and brokerage firms, mid-size commercial banks and brokerage firms and mutual and stock savings banks.
As of December 31, 2009, we operated 23 private client offices located in the New York metropolitan area. These 23 offices housed a total of 68 private client groups. As part of the continuing development of our business strategy, we expect to open additional offices in 2010. We believe these private client offices will allow us to expand our current operations in the New York metropolitan area.
Information Technology and System Security
We rely on industry leading technology companies to deliver software, support and disaster recovery services. Our core banking application software (DDA, Savings, Compliance, General Ledger, Teller, and Internet Banking) is provided by Fidelity Information Services. All of our brokerage systems are provided by and run at our clearing firm, National Financial Services, a subsidiary of Fidelity Financial Services Corp. Our personnel connect to the

16
system via both dedicated and Internet based connections to Fidelity Financial Services in Boston, Massachusetts.
Our information technology environment uses Fidelity Information Services’ technology center in Little Rock, Arkansas. This technology center includes dedicated “lights out” computer raised-floor space, as well as designated office space for information technology support personnel. A combination of backup power generation, uninterruptible power systems and 24 hour a day monitoring of the facility perimeters, hardware, operating system software, network connectivity, and building environmental systems minimizes the risk of any serious outage or security breach.
Employees
As of December 31, 2009, we had 614 full-time employee equivalents, 380 of whom were officers. None of our employees is represented by a collective bargaining agreement. We consider our relations with our employees to be good.
Regulation and Supervision
As a state-chartered bank, the deposits of which are insured by the FDIC, we and our subsidiaries are subject to a comprehensive system of bank supervision administered by federal and state banking agencies. Because we are chartered under the laws of the State of New York, the New York State Banking Department is our primary regulator. The FDIC is our primary federal banking regulator because we are not a member of the Federal Reserve System. These regulators oversee our compliance with applicable federal and New York laws and regulations governing our activities, operations, and business.
The primary purpose of the U.S. system of bank supervision is to ensure the safety and soundness of banks in order to protect depositors, the FDIC insurance fund, and the financial system generally. It is not primarily intended to protect the interest of shareholders. Thus, if we were to violate banking law and regulations, including engaging in unsafe or unsound practices, we could be subject to enforcement actions and other sanctions that could be detrimental to shareholders.
As noted above under “Recent Highlights,” the federal government has recently implemented and announced programs designed to bolster the capital of U.S. banks. Some of these programs have, and any future programs may, impose additional rules and regulations on us, some of which may affect the way we conduct our business and/or limit our ability to compete effectively. See “Risk Factors – We are subject to significant government regulation.”
Safety and Soundness Regulation
New York law governs our authority to engage in deposit-taking, lending, investing, and other activities. New York law also imposes restrictions intended to ensure our safety and soundness, including limitations on the amount of money we can lend to a single borrower (generally, 15% of capital; 25% if the loan is secured by certain types of collateral), prohibitions on engaging in activities such as investing in equity securities or non-financial commodities, and prohibitions on making loans secured by our own capital stock.
We are subject to comprehensive capital adequacy requirements intended to protect against losses that we may incur. FDIC regulations require that we maintain a minimum ratio of qualifying total capital to total risk-weighted assets (including off-balance sheet items) of 8.0%, at least one-half of which must be in the form of Tier 1 capital, and a ratio of Tier 1 capital to total risk-weighted assets of 4.0%. Tier 1 capital is generally defined as the sum of core capital elements less goodwill and certain other deductions. Core capital includes common shareholders’ equity, non-cumulative perpetual preferred stock, and minority interests in equity accounts of consolidated subsidiaries. Supplementary capital, which qualifies as Tier 2 capital and counts towards total capital subject to certain limits, includes allowances for loan losses, perpetual preferred stock, subordinated debt, and certain hybrid instruments. At December 31, 2009, our total risk-based capital ratio was 14.47%, and our Tier 1 risk-based capital ratio was 13.57%.
We are also required to maintain a minimum leverage capital ratio - the ratio of Tier 1 capital (net of intangibles) to adjusted total assets. Banks that have received the highest rating of five categories used by regulators to rate

17
banks and are not anticipating or experiencing any significant growth must maintain a leverage capital ratio of at least 3.0%. All other institutions must maintain a leverage capital ratio of 4.0%. At December 31, 2009, our leverage capital ratio was 9.39%.
In addition, payments of dividends on our common stock may be subject to the prior approval of the New York State Banking Department, and the FDIC. Under New York law, we are prohibited from declaring a dividend so long as there is any impairment of our capital stock. In addition, we would be required to obtain the approval of the New York State Banking Department if the total of all our dividends declared in any calendar year would exceed the total of our net profits for that year combined with retained net profits of the preceding two years, less any required transfer to surplus or a fund for the retirement of any preferred stock. We would also be required to obtain the approval of the FDIC prior to declaring a dividend if after paying the dividend we would be undercapitalized, significantly undercapitalized, or critically undercapitalized.
The federal banking regulators are currently working on significant revisions to the capital adequacy regulations to implement the new capital accord being drafted by the Basel Committee on Bank Supervision. We cannot at this time predict whether the new requirements will apply to us or the effect that they may have on our business. However, if the new capital adequacy regulations were to lower the capital requirements for large money center banks but not for smaller banks like Signature Bank, we could be put at a competitive disadvantage.
The federal banking agencies have also adopted guidelines establishing safety and soundness standards for all insured depository institutions. The safety and soundness guidelines relate to our internal controls, information systems, internal audit systems, loan underwriting and documentation, compensation, and interest rate exposure. The standards assist the federal banking agencies with early identification and resolution of problems at insured depository institutions. If we were to fail to meet these standards, the FDIC could require us to submit a compliance plan and take enforcement action if an acceptable compliance plan were not submitted.
Prompt Corrective Action and Enforcement Powers
We are also subject to FDIC regulations which apply to every FDIC-insured commercial bank and thrift institution a system of mandatory and discretionary supervisory actions, and which generally become more severe as the capital levels of an individual institution decline. The regulations establish five capital categories for purposes of determining our treatment under these prompt corrective action provisions.
We would be categorized as “well capitalized” under the regulations if (i) we have a total risk-based capital ratio of at least 10.0%; (ii) we have a Tier 1 risk-based capital ratio of at least 6.0%; (iii) we have a leverage capital ratio of at least 5.0%; and (iv) we are not subject to any written agreement, order, capital directive, or prompt corrective action directive issued by the FDIC to meet and maintain a specific capital level.
We would be categorized as “adequately capitalized” if (i) we have a total risk-based capital ratio of at least 8.0%; (ii) we have a Tier 1 risk-based capital ratio of at least 4.0%; and (iii) we have a leverage capital ratio of at least 4.0% (3.0% if we are rated in the highest supervisory category).
We would be categorized as “undercapitalized” if (i) we have a total risk-based capital ratio that is less than 8.0%; (ii) we have a Tier 1 risk-based capital ratio that is less than 4.0%; and (iii) we have a leverage capital ratio that is less than 4.0% (3.0% if we are rated in the highest supervisory category).
We would be categorized as “significantly undercapitalized” if (i) we have a total risk-based capital ratio that is less than 6.0%; (ii) we have a Tier 1 risk-based capital ratio that is less than 3.0%; and (iii) we have a leverage capital ratio that is less than 3.0%.
We would be categorized as “critically undercapitalized” and subject to provisions mandating appointment of a conservator or receiver if we have a ratio of “tangible equity” to total assets that is 2.0% or less. “Tangible equity” generally includes core capital plus cumulative perpetual preferred stock.
At December 31, 2009, our total risk-based capital ratio was 14.47%; our Tier 1 risk-based capital ratio was 13.57%; and our leverage capital ratio was 9.39%. Each of these ratios exceeds the minimum ratio established for a “well capitalized” institution.
In addition to measures taken under the prompt corrective action provisions, insured banks may be subject to potential actions by the federal regulators for unsafe or unsound practices in conducting their businesses or for
18
violations of any law, rule, regulation or any condition imposed in writing by the agency or any written agreement with the agency. Enforcement actions may include the issuance of cease and desist orders, the imposition of civil money penalties, the issuance of directives to increase capital, formal and informal agreements, or removal and prohibition orders against “institution-affiliated” parties, and termination of insurance of deposits. The New York State Banking Department also has broad powers to enforce compliance with New York laws and regulations. The New York State Banking Department and/or the FDIC examine us periodically for safety and soundness and for compliance with applicable laws.
Other Regulatory Requirements
We are subject to certain requirements and reporting obligations under the Community Reinvestment Act (“CRA”). The CRA generally requires federal banking agencies to evaluate the record of a financial institution in meeting the credit needs of its local communities, including low- and moderate-income neighborhoods. The CRA further requires the agencies to take into account our record of meeting community credit needs when evaluating applications for, among other things, new branches or mergers. The performance standards and examination frequency of CRA evaluations differ depending on whether a bank falls into the small or large bank categories. During 2006, we were evaluated under the large bank standards for the first time. In measuring our compliance with these CRA obligations, the regulators rely on a performance-based evaluation system that bases our CRA rating on our actual lending service and investment performance. In connection with its assessment of CRA performance, the FDIC assigns a rating of “outstanding,” “satisfactory,” “needs to improve,” or “substantial noncompliance.” We were last examined for CRA compliance by the FDIC as of August 24, 2009 and by the New York State Banking Department as of December 31, 2005. We received a “satisfactory” CRA Assessment Rating from both agencies.
Federal and state banking laws also require us to take steps to protect consumers. Bank regulatory agencies are increasingly focusing attention on compliance with consumer protection laws and regulations. These laws include disclosures regarding truth in lending, truth in savings, funds availability, privacy protection under the Gramm-Leach-Bliley Act of 1999, and prohibitions on discrimination in the provision of banking services. We have incurred and may in the future incur additional costs in complying with these requirements.
We must also comply with the anti-money laundering provisions of the Bank Secrecy Act, as amended by the USA PATRIOT Act, and implementing regulations issued by the FDIC and the U.S. Department of the Treasury. As a result, we must obtain and maintain certain records when opening accounts, monitor account activity for suspicious transactions, impose a heightened level of review on private banking accounts opened by non-U.S. persons and, when necessary, make certain reports to law enforcement or regulatory officials that are designed to assist in the detection and prevention of money laundering and terrorist financing activities. To this end, we are also required to implement an anti-money laundering compliance program that includes policies, procedures, and internal controls; the appointment of an anti-money laundering compliance officer; an internal training program; and internal audits.
Under FDIC regulations, we are required to pay premiums to the Bank Insurance Fund for insurance of our deposit accounts. The FDIC utilizes a risk-based premium system in which an institution pays premiums for deposit insurance on its Bank Insurance Fund-insured deposits based on supervisory evaluations and on the institution’s capital category under the FDIC’s prompt corrective action regulations.
We must maintain reserves on transaction accounts. The maintenance of reserves increases our cost of funds because reserves must generally be maintained in cash or non-interest-bearing balances maintained directly or indirectly with a Federal Reserve Bank.
The Riegle-Neal Interstate Banking and Branching Efficiency Act of 1994 regulates interstate banking activities by establishing a framework for nationwide interstate banking and branching. This interstate banking and branching authority generally permits a bank in one state to merge with a bank in another unless the state prohibits all out-of-state banks from doing so and permits a bank in one state to establish de novo branches in another state in which it does not maintain a branch, if that state expressly permits all out-of-state banks to establish branches.
The Gramm-Leach-Bliley Act of 1999 eliminated most of the barriers to affiliations among banks, securities firms, insurance companies, and other financial companies previously imposed under federal banking laws if certain criteria are satisfied. Certain subsidiaries of well-capitalized and well-managed banks may be treated as “financial subsidiaries,” which are generally permitted to engage in activities that are financial in nature, including securities

19
underwriting, dealing, and market making; sponsoring mutual funds and investment companies; and activities that the Federal Reserve has determined to be closely related to banking.
Signature Securities is registered as a broker-dealer with and subject to supervision by the SEC. The SEC is the federal agency primarily responsible for the regulation of broker-dealers. Signature Securities is also subject to regulation by one of the brokerage industry’s self-regulatory organizations, the Financial Industry Regulatory Authority (“FINRA”). As a registered broker-dealer, Signature Securities is subject to the SEC’s uniform net capital rule. The purpose of the net capital rule is to require broker-dealers to have at all times enough liquid assets to satisfy promptly the claims of clients if the broker-dealer goes out of business. If Signature Securities fails to maintain the required net capital, the SEC and NASD may impose regulatory sanctions including suspension or revocation of its broker-dealer license. A change in the net capital rules, the imposition of new rules, or any unusually large charge against Signature Securities’ net capital could limit its operations. As a subsidiary of Signature Bank, Signature Securities is also subject to regulation and supervision by the New York State Banking Department. Signature Securities currently is permitted to act as a broker and as a dealer in certain bank eligible securities.
Signature Securities is also subject to state insurance regulation. In July 2004, Signature Securities received approval from the New York State Banking Department and the New York State Department of Insurance to act as an agent in the sale of insurance products. Signature Securities’ insurance activities are subject to extensive regulation under the laws of the various states where its clients are located. The applicable laws and regulations vary from state to state, and, in every state of the United States, an insurance broker or agent is required to have a license from that state. These licenses may be denied or revoked by the appropriate governmental agency for various reasons, including the violation of state regulations and conviction for crimes.
Change in Control
The approval of the New York State Banking Board is required before any person may acquire “control” of a banking institution, which includes Signature Bank and any company controlling Signature Bank. “Control” is defined as the possession, directly or indirectly, of the power to direct or cause the direction of management and policies of a banking institution through ownership of stock or otherwise and is presumed to exist if, among other things, any company owns, controls, or holds the power to vote 10% or more of the voting stock of a banking institution. As a result, any person or company that seeks to acquire 10% or more of our outstanding common stock must obtain prior regulatory approval.
In addition to the New York requirements, the Bank Holding Company Act prohibits a company from, directly or indirectly, acquiring 25% or more (5% if the acquirer is a bank holding company) of any class of our voting stock or obtaining the ability to control in any manner the election of a majority of our directors or otherwise directing the management or policies of our company without prior application to and the approval of the Federal Reserve. Moreover, under the Change in Bank Control Act, any individual who intends to acquire 10% or more of any class of our voting stock or otherwise obtain control over us could be required to provide prior notice to and obtain the non-objection of the FDIC.

20
ITEM 1A. RISK FACTORS
If any of the following risks actually occur, our business, financial condition or operating results could be materially adversely affected. Additional risks and uncertainties not presently known to us or that we currently deem immaterial may also impair our business operations. As a result, we cannot predict every risk factor, nor can we assess the impact of all of the risk factors on our businesses or to the extent to which any factor, or combination of factors, may impact our financial condition and results of operation.
Risks Relating to Our Business
Current disruption and volatility in global financial markets might continue and the federal government
has and may continue to take measures to intervene.
Since late 2007, global financial markets have experienced extraordinary disruption and volatility following adverse changes in the global economy and, in particular, the credit markets. The federal government has taken significant measures in response to these events, such as enactment of the Emergency Economic Stabilization Act of 2008 and other regulatory actions applicable to financial institutions. We can not predict the federal government’s responses to any further dislocation and instability and potential future government responses and changes in law or regulation, may affect our business, results of operations and financial conditions.
Difficult market conditions have adversely affected our industry.
Dramatic declines in the housing market over the past two years, together with falling home prices, increasing foreclosures, unemployment and under-employment, have negatively impacted the credit performance of mortgage loans and resulted in significant write-downs of asset values by financial institutions. The market for commercial loans (including commercial and industrial loans and loans secured by commercial real estate) and multi-family mortgage loans has also been adversely affected. A worsening of these conditions could exacerbate the adverse effects of these difficult market conditions on us. In particular, we may face the following risks in connection with these events:
� Commercial loans (including commercial and industrial loans and loans secured by commercial real estate) and multi-family mortgage loans constitute a substantial portion of our loan activity and loan portfolio. If the difficult market conditions that we are currently facing continue over a prolonged period of time, losses on such loans could increase significantly, which could adversely affect our financial condition and results of operation.
� Market developments may affect confidence levels and may cause declines in credit usage and adverse changes in payment patterns, causing increases in delinquencies and default rates, which we expect would impact our provision for loan losses.
� The process we use to estimate losses inherent in our credit exposure requires difficult, subjective, and complex judgments, including forecasts of economic conditions and how these economic predictions might impair the ability of our borrowers to repay their loans, which may no longer be capable of accurate estimation which may, in turn, impact the reliability of the process.
We may be unable to successfully implement our business strategy.
We intend to continue to pursue our strategy for growth. In order to execute this strategy successfully, we must, among other things:
� identify and expand into suitable markets;
� assess market conditions for growth;
� build our client base;
� maintain credit quality;
� attract and retain qualified bank management in each of our targeted markets;
� properly manage risks, including operational risks, credit risks and interest rate risks;
� attract sufficient core deposits to fund our anticipated loan growth;

21
� identify and pursue suitable opportunities for opening new banking locations; and
� maintain sufficient capital to satisfy regulatory requirements.
Failure to manage our growth effectively could have a material adverse effect on our business, future prospects, financial condition or results of operations and could adversely affect our ability to successfully implement our growth strategy.
Our operations are significantly affected by interest rate levels and we are especially vulnerable to
changes in interest rates.
We incur interest rate risk. Our income and cash flows and the value of our assets depend to a great extent on the difference between the interest rates we earn on interest-earning assets, such as loans and investment securities, and the interest rates we pay on interest-bearing liabilities such as deposits and borrowings. These rates are highly sensitive to many factors which are beyond our control, including general economic conditions and policies of various governmental and regulatory agencies, in particular, the Federal Reserve. Changes in monetary policy, including changes in interest rates, significantly influence the interest we earn on our loans and investment securities and the amount of interest we pay on deposits. In addition, such changes can significantly affect our ability to originate loans and obtain deposits and our costs in doing so.
If the rate of interest we pay on our deposits and other borrowings increases more than the rate of interest we earn on our loans and other investments, our net interest income and, therefore, our earnings could be materially adversely affected. Our earnings could also be materially adversely affected if the interest rates on our loans and other investments fall more quickly than those on our deposits and other borrowings. Furthermore, an increase in interest rates may negatively affect the market value of securities in our investment portfolio. Our fixed-rate securities, generally, are more negatively affected by these increases. A reduction in the market value of our portfolio will increase the unrealized loss position of our available-for-sale investments. Any of these events could materially adversely affect our results of operations or financial condition.
We compete with many larger financial institutions which have substantially greater financial and other
resources than we have.
There is significant competition among commercial banking institutions in the New York metropolitan area. We compete with other bank holding companies, national and state-chartered commercial banks, savings and loan associations, consumer finance companies, credit unions, securities brokerage firms, insurance companies, mortgage banking companies, money market mutual funds, asset-based non-bank lenders, and other financial institutions. Many of these competitors have substantially greater financial resources, lending limits and larger office networks than we do, and are able to offer a broader range of products and services than we can. Because we compete against larger institutions, our failure to compete effectively for deposit, loan and other clients in our markets could cause us to lose market share, slow our growth rate and have a material adverse effect on our financial condition and results of operations.
The market for banking and brokerage services is extremely competitive and allows consumers to access financial products and compare interest rates and services from numerous financial institutions located across the United States. As a result, clients of all financial institutions, including those within our target market, are sensitive to competitive interest rate levels and services. Our future success in attracting and retaining client deposits depends, in part, on our ability to offer competitive rates and services. Our clients are particularly attracted to the level of personalized service we can provide. Our business could be impaired if our clients believe other banks provide better service or if they come to believe that higher rates are more important to them than better service.
In addition, the financial services industry is undergoing rapid technological changes, with frequent introductions of new technology-driven products and services. In addition to improving the ability to serve clients, the effective use of technology increases efficiency and enables financial institutions to reduce costs. In addition, these technological advancements have made it possible for non-financial institutions to offer products and services that have traditionally been offered by financial institutions. Our future success will depend, in part, upon our ability to address the needs of our clients by using technology, including the use of the Internet, to provide products and services that will satisfy client demands for convenience, as well as to create additional efficiencies in our operations. Because many of our competitors have substantially greater resources to invest in technological improvements than we do, these institutions could pose a significant competitive threat to us.

22
Government intervention in the banking industry has the potential to change the competitive landscape.
There has been significant government intervention in the banking industry recently, including equity investments, liquidity facilities and guarantees. These actions have changed and have the potential to change the competitive landscape significantly. For example, clients may view some of our competitors as “too big to fail” and thereby benefiting from an implicit U.S. government guarantee beyond those provided to all banks and their clients. The impact of this government intervention is difficult to predict and could adversely affect our competitive standing and profitability.
The FDIC’s Transaction Account Guarantee Program, which temporarily provides a full guarantee above the existing $250,000 deposit insurance limit for funds held at participating FDIC-insured depository institutions in non-interest-bearing transaction accounts and NOW accounts that pay up to 50 basis points, is scheduled to end on June 30, 2010. We could potentially lose deposits to our competitors viewed by clients as “too big to fail.”
In addition, certain government programs introduced during the economic crisis may give rise to new competitors. For instance, the FDIC has introduced a bidding process for institutions that have been or will be placed into receivership by federal or state regulators. This process is open to existing financial institutions, as well as groups without pre-existing operations. This program and others like it that exist now or that may be developed in the future could give rise to a significant number of new competitors, which could have a material adverse effect on our business and results of operations.
We are vulnerable to downgrades in credit ratings for securities within our investment portfolio.
Although over 95% of our portfolio of investment securities was rated investment grade as of December 31, 2009, we remain exposed to potential investment rating downgrades by credit rating agencies of the issuers and guarantors of securities in our investment portfolio. A significant volume of downgrades would negatively impact the fair value of our securities portfolio, resulting in a potential increase in the unrealized loss in our investment portfolio, which could negatively affect our earnings. Rating downgrades of securities below investment grade level and other events may result in impairment of such securities, requiring recognition of the credit component of the other-than-temporary impairment as a charge to current earnings.
We are vulnerable to illiquid market conditions, resulting in potential significant declines in the fair value
of our investment portfolio.
In cases of illiquid or dislocated marketplaces, there may not be an available market for certain securities in our portfolio. For example, mortgage-related assets have experienced, and are expected to continue to experience, periods of illiquidity, caused by, among other things, an absence of a willing buyer or an established market for these assets, or legal or contractual restrictions on sale. In addition, current market conditions have created dislocations in the market for bank-collateralized pooled trust preferred securities and other securities in which we invest. Continued adverse market conditions, including continued bank failures, could result in a significant decline in the value of these securities. We have in the past, and depending on the probability of a near-term market recovery, we may be required to recognize the credit component of the additional other-than-temporary impairments as a charge to current earnings resulting from the decline in the value of these securities.
We primarily invest in mortgage-backed obligations and such obligations have been, and are likely to
continue to be, impacted by market dislocations, declining home values and prepayment risk, which may
lead to volatility in cash flow and market risk and declines in the value of our investment portfolio.
Our investment portfolio largely consists of mortgage-backed obligations primarily secured by pools of mortgages on single-family residences.
The value of mortgage-backed obligations in our investment portfolio has declined and may decline further for several reasons, including (i) rising delinquencies and defaults on the mortgages underlying such obligations, due in part to high unemployment rates, (ii) increases in interest rates resulting from expiration of the fixed rate portion of adjustable rate mortgages (“ARMs”), (iii) falling home prices, (iv) lack of a liquid market for such obligations, (v) uncertainties in respect of government-sponsored enterprises such as the Federal National Mortgage Association (“Fannie Mae”) or the Federal Home Loan Mortgage Corporation (“Freddie Mac”), which guarantee such obligations, and (vi) the expiration of government stimulus initiatives. Home values have declined significantly over the last two years. If the value of homes were to further materially decline, the value of the mortgage-backed obligations in which we invest would also decline. Any such decline in the value of mortgage-backed obligations, or perceived market uncertainty about their value, could adversely affect our interest income, financial position and results of operations. In addition, market uncertainty about residential mortgage loans in general could continue to

23
depress the market for mortgage-backed obligations, which means that it may be more difficult for us to sell our mortgage-backed obligations on favorable terms or at all. If market conditions result in a decline in available purchasers of mortgage-backed obligations in our investment portfolio, our financial position and results of operations also could be adversely affected.
In addition, when we acquire a mortgage-backed security, we anticipate that the underlying mortgages will prepay at a projected rate, thereby generating an expected yield. Prepayment rates generally increase as interest rates fall and decrease when rates rise, but changes in prepayment rates are difficult to predict. In light of historically low interest rates, many of our mortgage-backed securities have a higher interest rate than prevailing market rates, resulting in a premium purchase price. In accordance with accounting rules, we amortize the premium over the expected life of the mortgage-backed security. If the mortgage loans securing the mortgage-backed security prepay more rapidly than anticipated, we would have to amortize the premium on an accelerated basis, which would thereby adversely affect our profitability.
Continued adverse developments in the residential mortgage market may adversely affect the value of our
investment portfolio.
Over the last two years, the residential mortgage market in the United States has experienced a variety of difficulties resulting from changed economic conditions, including increased unemployment rates, heightened defaults, credit losses and liquidity concerns. These disruptions have adversely affected the performance and market value of many of the types of financial instruments in which we invest and may continue to do so. Many residential mortgage-backed securities have been downgraded by rating agencies over the past two years, and rating agencies may further downgrade these securities in the future if conditions do not improve. As a result of these difficulties and changed economic conditions, many companies operating in the mortgage sector have failed and others are facing serious operating and financial challenges. While the Federal Reserve has taken certain actions in an effort to ameliorate the current market conditions, its efforts may be ineffective. As a result of these factors, among others, the market for these securities may be adversely affected for a significant period of time.
Adverse conditions in the residential mortgage market have also negatively impacted other sectors in which the issuers of securities in which we invest operate, which has adversely affected, and may continue to adversely affect, the value of such securities, including bank-collateralized pooled trust preferred securities, in our investment portfolio.
If the U.S. agencies or U.S. government-sponsored enterprises were unable to pay or to guarantee
payments on their securities in which we invest, our results of operations would be adversely affected.
A large portion of our investment portfolio consists of mortgage-backed securities and collateralized mortgage obligations issued or guaranteed by Federal National Mortgage Association (“Fannie Mae”) or Federal Home Loan Mortgage Corporation (“Freddie Mac”) and debentures issued by the Federal Home Loan Banks, Fannie Mae, and Freddie Mac. Fannie Mae, Freddie Mac, and the Federal Home Loan Banks are U.S. government-sponsored enterprises but their guarantees and debt obligations are not backed by the full faith and credit of the United States.
The economic crisis, especially as it relates to the residential mortgage market has adversely affected the financial results and stock values of Fannie Mae and Freddie Mac and have resulted in the value of the debt securities issued or guaranteed by Fannie Mae and Freddie Mac becoming unstable and relatively illiquid compared to prior periods. Fannie Mae and Freddie Mac reported substantial losses in 2007 and 2008 and continue to experience significant difficulties stemming from current market disruptions, including significant increases in credit-related expenses and credit losses. If Fannie Mae and Freddie Mac continue to suffer significant losses and their stock values continue to decline, investors may perceive these entities as financially unstable, which may decrease the liquidity of debt securities issued or guaranteed by them, further exacerbate declines in the value of such securities, threaten such entities’ financial stability, and adversely affect their ability to honor their respective guarantees and debt obligations. Further, any actual or perceived financial challenges at either Fannie Mae or Freddie Mac could cause rating agencies to downgrade the corporate credit ratings of Fannie Mae or Freddie Mac. Moody’s Investor Services (“Moody’s”) Bank Financial Strength Rating (“BFSR”), measures the likelihood that a financial institution will require financial assistance. In 2008, Fannie Mae’s and Freddie Mac’s BFSRs were downgraded substantially. While both the Federal Reserve and the federal regulator of Fannie Mae and Freddie Mac have taken actions to back the safety and soundness of these entities and to improve liquidity in the financial markets, there is still much concern in the marketplace about these entities. In July 2008, the U.S. Congress enacted a law granting the U.S. Treasury Department the authority to extend additional credit to Fannie Mae and Freddie Mac in order to prevent their failure and creating the Federal Housing Finance Agency to regulate the

24
government-sponsored enterprises. On September 7, 2008, the U.S. Treasury Department announced that the U.S. government would place Fannie Mae and Freddie Mac into conservatorship, purchase senior preferred equity shares in each entity, establish a new secured lending credit facility available to both entities and purchase mortgage-backed securities of Fannie Mae and Freddie Mac. Although these actions seem to have stabilized the entities in the short term, none of these actions guarantees the future financial success of Fannie Mae or Freddie Mac as stand-alone, independent entities.
Should the U.S. government contain, reduce or eliminate support for the financial stability of Fannie Mae, Freddie Mac and the Federal Home Loan Banks, the ability for those entities to operate as independent entities is questionable. Any failure by Fannie Mae, Freddie Mac, or the Federal Home Loan Banks to honor their guarantees of mortgage-backed securities, debt or other obligations will have severe ramifications for the capital markets and financial industry. Any failure by Fannie Mae, Freddie Mac, or the Federal Home Loan Banks to pay principal or interest on their mortgage guarantee and debentures when due could also materially adversely affect our results of operations and financial condition.
There are material risks involved in commercial lending that could adversely affect our business.
Commercial lending (including commercial and industrial loans and loans secured by commercial real estate) represented approximately 55% of our total lending activities as of December 31, 2009 and primarily consists of loans to our privately-owned business clients. Commercial loans generally involve a higher degree of credit risk than residential mortgage loans due, in part, to their larger average size and less readily-marketable collateral. In addition, unlike residential mortgage loans, commercial loans generally depend on the cash flow of the borrower’s business to service the debt. A significant portion of our loans depends primarily on the liquidation of assets securing the loan for repayment, such as inventory and accounts receivable. These loans carry incrementally higher risk, because their repayment is often dependent solely on the financial performance of the borrower’s business. Adverse economic conditions or other factors adversely affecting our target market segment may have a greater adverse effect on us than on other financial institutions that have a more diversified client base. Our business plan calls for continued efforts to increase our assets invested in commercial loans. For all of these reasons, increases in non-performing commercial loans could result in operating losses, impaired liquidity and the erosion of our capital, and could have a material adverse effect on our financial condition and results of operations. Credit market tightening could adversely affect our commercial borrowers through declines in their business activities and adversely impact their overall liquidity through the diminished availability of other borrowing sources or otherwise.
Our business and a large portion of our real estate collateral is concentrated in the New York metropolitan
area and a downturn in the economy of the New York metropolitan area may adversely affect our
business.
Substantially all of our business is located in the New York metropolitan area. In addition, as of December 31, 2009, substantially all of the real estate collateral for the loans in our portfolio was located within the New York metropolitan area. As a result, our financial condition and results of operations are affected by changes in the economy and the real estate market of the New York metropolitan area. A prolonged period of economic recession or other adverse economic conditions in the New York metropolitan area, such as the one we are facing now, may result in an increase in nonpayment of loans and a decrease in collateral value.
In addition, our geographic concentration in the New York metropolitan area heightens our exposure to future terrorist attacks, which may adversely affect our business and that of our clients and result in a material decrease in our revenues. Future terrorist attacks cannot be predicted, and their occurrence can be expected to further negatively affect the U.S. economy generally and specifically the regional market in which we operate.
If the value of real estate were to decline materially, a significant portion of our loan portfolio could
become under-collateralized, which would have a material adverse effect on us.
As of December 31, 2009, approximately 70% of the collateral for the loans in our portfolio consisted of real estate. The market value of real estate, particularly real estate held for investment, can fluctuate significantly in a short period of time as a result of market conditions in the geographic area in which the real estate is located. If the value of the real estate serving as collateral for our loan portfolio were to decline materially, a portion of our loan portfolio could become under-collateralized. If the loans that are collateralized by real estate become troubled during a time when market conditions are declining or have declined, we may not be able to realize the value of the collateral that we anticipated at the time of originating the loan, which could have a material adverse effect on our provision for loan losses and our financial condition and results of operations.

25
As the size of our loan portfolio grows, the risks associated with our loan portfolio may be exacerbated.
As we grow our business and hire additional banking teams, the size of our loan portfolio grows, which can exacerbate the risks associated with that portfolio. Although we attempt to minimize our credit risk through certain procedures, including monitoring the concentration of our loans within specific industries, we cannot assure you that these procedures will remain as effective when the size of our loan portfolio increases. This may result in an increase in charge-offs or underperforming loans, which could adversely affect our business.
Our failure to effectively manage our credit risk could have a material adverse effect on our financial
condition and results of operations.
There are risks inherent in making any loan, including repayment risks associated with, among other things, the period of time over which the loan may be repaid, changes in economic and industry conditions, dealings with individual borrowers and uncertainties as to the future value of collateral. Although we attempt to minimize our credit risk by monitoring the concentration of our loans within specific industries and through what we believe to be prudent loan application approval procedures, we cannot assure you that such monitoring and approval procedures will reduce these lending risks.
In addition, we are subject to credit risk in our investment portfolio. Our investments include debentures, mortgage-backed securities and collateralized mortgage obligations issued or guaranteed by U.S. government-sponsored enterprises, such as Fannie Mae, Freddie Mac and the Federal Home Loan Banks, as well as collateralized mortgage obligations, bank-collateralized pooled trust preferred securities and other debt securities issued by private issuers. The issuers of our trust preferred securities include several depositary institutions that have suffered significant losses since the onset of the economic crisis. We are exposed to credit risks associated with the issuers of the debt securities in which we invest. Further, with respect to the mortgage-backed securities in which we invest, we also are affected by the credit risk associated with the borrowers of the loans underlying these securities.
Lack of seasoning of our loan portfolio and mortgage loans underlying our investment portfolio may
increase the risk of credit defaults in the future.
In general, loans do not begin to show signs of credit deterioration or default until they have been outstanding for some period of time, a process referred to as “seasoning.” As a result, a portfolio of older loans will usually behave more predictably than a newer portfolio. Because our loan portfolio is relatively new compared to the portfolio of many of our competitors, the current level of delinquencies and defaults may not be representative of the level that will prevail when the portfolio becomes more seasoned, which is likely to be somewhat higher than current levels.
Because over 75% of the loans in our loan portfolio were originated over the last two years, our loan portfolio does not provide an extensive history of loan losses for our management to consider in establishing our allowance for loan losses. We therefore rely to a greater extent upon other financial institutions’ histories of loan losses and their allowance for loan losses, as well as our management’s estimates based on their experience in the banking industry, when determining our allowance for loan losses. There is no assurance that the history of loan losses and the reserving policies of other financial institutions and our management’s judgment will result in reserving policies that will be adequate for our business and operations or applicable to our loan portfolio.
In addition, the mortgage loans underlying certain mortgage-backed obligations in which we invest also may not begin to show signs of credit deterioration until they have been outstanding for some period of time. Because the mortgage loans underlying certain of the mortgage-backed obligations in our investment portfolio are relatively new, the level of delinquencies and defaults on such loans may increase in the future, thus adversely affecting the mortgage-backed obligations we hold.
Our allowance for loan losses may not be sufficient to absorb actual losses.
Experience in the banking industry indicates that a portion of our loans will become delinquent, and that some of these loans may be only partially repaid or may never be repaid at all. Despite our underwriting criteria, we experience losses for reasons beyond our control, including general economic conditions. A prolonged period of economic recession or other adverse economic conditions in the New York metropolitan area, such as the one we are facing now, may result in an increase in nonpayment of loans, a decrease in collateral value, and an increase in our allowance for loan losses. Although we believe that our allowance for loan losses is maintained at a level adequate to absorb any inherent losses in our loan portfolio, these estimates of loan losses are necessarily subjective and their accuracy depends on the outcome of future events, some of which are beyond our control.

26
We may need to make significant and unanticipated increases in our loss allowances in the future, which would materially adversely affect our results of operations.
In addition, bank regulators, as an integral part of their supervisory functions, periodically review our allowance for loan losses. These regulatory agencies may require us to increase our provision for loan losses or to recognize further loan charge-offs based upon their judgments, which may be different from ours. Any increase in the allowance for loan losses required by these regulatory agencies could materially adversely affect our financial condition and results of operations.
We rely on the Federal Home Loan Bank of New York for secondary and contingent liquidity sources.
We utilize the Federal Home Loan Bank (or “FHLB”) of New York for secondary and contingent sources of liquidity. Also, from time to time, we utilize this borrowing source to capitalize on market opportunities to fund investment and loan initiatives. Our FHLB borrowings were approximately $305.0 million at December 31, 2009. Because we rely on the FHLB for liquidity, if we were unable to borrow from the FHLB, we would need to find alternative sources of liquidity, which may be available only at a higher cost and on terms that do not match the structure of our liabilities as well as FHLB borrowings do.
As a member of the FHLB, we are required to purchase capital stock of the FHLB as partial collateral and to pledge marketable securities or loans for this borrowing. At December 31, 2009, we held $23.9 million of FHLB stock.
We are dependent upon key personnel.
Our success depends to a significant extent upon the performance of certain key executive officers and employees, the loss of any of whom could have a material adverse effect on our business. Our key executive officers and employees include our Chairman, Scott Shay, our President and Chief Executive Officer, Joseph DePaolo, and our Vice-Chairman, John Tamberlane. Although we have entered into agreements with Messrs. Shay and DePaolo, we generally do not have employment agreements with our key personnel. We adopted an equity incentive plan and a change of control plan for key personnel in connection with the consummation of our initial public offering. Even though we are party to these agreements and sponsor these plans, we cannot assure you that we will be successful in retaining any of our key executive officers and employees.
Our business is built around group directors, who are principally responsible for our client relationships. A principal component of our strategy is to increase market penetration by recruiting and retaining experienced group directors, their groups, loan officers and other management professionals. Competition for experienced personnel within the commercial banking, brokerage and insurance industries is strong and we may not be successful in attracting and retaining the personnel we require. We cannot assure you that our recruiting efforts will be successful or that they will enhance our business, results of operations or financial condition.
In addition, our group directors may leave us at any time for any reason. They are not under contractual restrictions to remain with us and would not be bound by non-competition agreements or non-solicitation agreements if they were to leave us. If even a small number of our key group directors were to leave, our business could be materially adversely affected. We cannot assure you that such losses of group directors or other professionals will not occur.
Our SBA division is also dependent upon relationships our SBA professionals have developed with clients from whom we purchase loans and upon relationships with investors in pooled securities. The loss of a key member of our SBA division team may lead to the loss of existing clients. We cannot assure you that we will be able to recruit qualified replacements with a comparable level of expertise and relationship base.
We may not be able to acquire suitable client relationship groups or manage our growth.
A principal component of our growth strategy is to increase market penetration and product diversification by recruiting group directors and their groups. However, we believe that there are a limited number of potential group directors and groups that will meet our development strategy and other recruiting criteria. As a result, we cannot assure you that we will identify potential group directors and groups that will contribute to our growth. Even if suitable candidates are identified, we cannot assure you that we will be successful in attracting them, as they may opt instead to join our competitors.
Even if we are successful in attracting these group directors and groups, we cannot assure you that they will be successful in bringing additional clients and business to us. Furthermore, the addition of new groups involves

27
several risks including risks relating to the quality of the book of business that may be contributed, adverse personnel relations and loss of clients because of a change of institutional identity. In addition, the process of integrating new groups could divert management time and resources from attention to existing clients. We cannot assure you that we will be able to successfully integrate any new group that we may acquire or that any new group that we acquire will enhance our business, results of operations, cash flows or financial condition.
Provisions in our charter documents may delay or prevent our acquisition by a third party.
Our restated Certificate of Organization (as amended) and By-laws contain provisions that may make it more difficult for a third party to acquire control of us without the approval of our Board of Directors. For example, our Organization Certificate authorizes our Board of Directors to determine the rights, preferences, privileges and restrictions of unissued series of common stock and preferred stock, without any vote or action by our stockholders. As a result, our Board of Directors can authorize and issue shares of preferred stock with voting or conversion rights that could adversely affect the voting or other rights of holders of our common stock. Additionally, our By-laws contain provisions that separate our Board of Directors into three separate classes with staggered terms of office and provisions that restrict the ability of shareholders to take action without a meeting. These provisions could delay, prevent or deter a merger, acquisition, tender offer, proxy contest or other transaction that might otherwise result in our stockholders receiving a premium over the market price for their common stock.
There are substantial regulatory limitations on changes of control.
Federal law prohibits a company or a group of persons deemed to be “acting in concert” from, directly or indirectly, acquiring 25% or more (5% if the acquirer is a bank holding company) of any class of our voting stock or obtaining the ability to control in any manner the election of a majority of our directors or otherwise to direct the management or policies of our company without prior application to and the approval of the Board of Governors of the Federal Reserve System, which we refer to as the Federal Reserve. Moreover, any individual who acquires 10% or more of our voting stock or otherwise obtains control over Signature Bank would be required to notify, and could be required to obtain the non-objection of, the FDIC. Finally, any person acquiring 10% or more of our voting stock would be required to obtain approval of the New York State Banking Department. Accordingly, prospective investors need to be aware of and comply with these requirements, if applicable, in connection with any purchase of shares of our common stock. This may effectively reduce the number of investors who might be interested in investing in our stock and also limits the ability of investors to purchase us or cause a change in control.
Curtailment of government guaranteed loan programs could affect our SBA business.
Our SBA business relies on the purchasing, pooling and selling of government guaranteed loans, in particular those guaranteed by the SBA. From time to time, the government agencies that guarantee these loans reach their internal limits and cease to guarantee loans for a period of time. In addition, these agencies may change their rules for loans or Congress may adopt legislation that would have the effect of discontinuing or changing the programs. If changes occur, the volumes of loans that qualify for government guarantees could decline. Lower volumes of origination of government guaranteed loans may reduce the profitability of our SBA business.
We rely extensively on outsourcing to provide cost-effective operational support.
We make extensive use of outsourcing to provide cost-effective operational support with service levels consistent with large bank operations, including key banking, brokerage and insurance systems. For example, under the clearing agreement Signature Securities has entered into with National Financial Services (a Fidelity Investments company), National Financial Services processes all securities transactions for the account of Signature Securities and the accounts of its clients. Services of the clearing firm include billing and credit extension and control, receipt, custody and delivery of securities. Signature Securities is dependent on the ability of its clearing firm to process securities transactions in an orderly fashion. In addition, Fidelity Information Services provides us with all our core banking applications. Our outsourcing agreements can generally be terminated by either party upon notice. The termination of some of our outsourcing agreements, including the agreements with National Financial Services and Fidelity Information Services, could result in a disruption of service that could have a material adverse effect on our financial condition.

28
System failures or breaches of our network security could subject us to increased operating costs as well
as litigation and other liabilities.
The computer systems and network infrastructure we use could be vulnerable to unforeseen problems. Our operations are dependent upon our ability to protect our computer equipment against damage from fire, power loss, telecommunications failure or other similar catastrophic events. Any damage or failure that causes an interruption in our operations could have a material adverse effect on our financial condition and results of operations. In addition, our operations are dependent upon our ability to protect our computer systems and network infrastructure against damage from physical break-ins, security breaches, hackers, viruses and other malware and other disruptive problems. Such computer break-ins, whether physical or electronic, and other disruptions could jeopardize the security of information stored in and transmitted through our computer systems and network infrastructure, which may result in significant liability to us and deter potential clients. Although we, with the help of third-party service providers, have and intend to continue to implement security technology and establish operational procedures to prevent such damage, there can be no assurance that these security measures will be successful. In addition, advances in computer capabilities, new discoveries in the field of cryptography or other developments could result in a compromise or breach of the algorithms we and our third-party service providers use to protect client transaction data. A failure of such security measures could have a material adverse effect on our financial condition and results of operations.
Decreases in trading volumes or prices could harm the business and profitability of Signature Securities.
Declines in the volume of securities trading and in market liquidity generally result in lower revenues from our brokerage and related activities. The profitability of our Signature Securities business would be adversely affected by a decline in revenues because a significant portion of its costs are fixed. For these reasons, decreases in trading volume or securities prices could have a material adverse effect on our business, financial condition and results of operations.
We have not historically paid, and do not presently intend to pay, cash dividends. Furthermore, our ability
to pay cash dividends is restricted.
We have not paid any cash dividends on our common stock to date and do not intend to pay cash dividends on our common stock in the foreseeable future. We intend to retain earnings to finance operations and the expansion of our business. Therefore, any gains from your investment in our common stock must come from an increase in its market price.
In addition, payments of dividends will be subject to the prior approval by the FDIC if, after having paid a dividend, we would be undercapitalized, significantly undercapitalized or critically undercapitalized, and by the New York State Banking Department under certain conditions. Our ability to pay dividends will also depend upon the amount of cash available to us from our subsidiaries. Restrictions on our subsidiaries’ ability to make dividends or advances to us will tend to limit our ability to pay dividends to our shareholders.
We may be responsible for environmental claims.
There is a risk that hazardous or toxic waste could be found on the properties that secure our loans. In such event, we could be held responsible for the cost of cleaning up or removing such waste, and such cost could significantly exceed the value of the underlying properties and adversely affect our profitability. Although we have policies and procedures that require us to perform an environmental review before initiating any foreclosure action on real property, there can be no assurance that this will be sufficient to detect all potential environmental hazards.
We may not be able to raise the additional funding needed for our operations.
If we are unable to generate profits and cash flow on a consistent basis, we may need to arrange for additional financing to support our business. Although we have recently completed a number of successful capital raising transactions, we cannot assure you that, if needed or desired, we would be able to obtain additional capital or financing on commercially reasonable terms or at all, especially in light of current capital and credit market conditions. Our failure to obtain sufficient capital or financing could have a material adverse effect on our growth, on our ability to compete effectively and on our financial condition and results of operations.

29
Risks Related to Our Industry
We are subject to regulatory capital requirements.
As a state-chartered bank, we are subject to various regulatory capital requirements administered by state and federal regulatory agencies. Failure to meet minimum capital requirements can initiate certain mandatory—and possible additional discretionary—actions by regulators that, if undertaken, could have a direct material adverse effect on our financial statements. Under capital adequacy guidelines and the regulatory framework for prompt corrective action, we must meet specific capital guidelines that involve quantitative measures of our assets, liabilities, and certain off-balance sheet items as calculated under regulatory accounting practices. Our capital amounts and classifications are also subject to qualitative judgments by the regulators about components, risk weightings and other factors. We are required by FDIC regulations to maintain a minimum ratio of qualifying total capital to total risk-weighted assets (including off-balance sheet items) of 8.0%, at least one-half of which must be in the form of Tier 1 capital, and a ratio of Tier 1 capital to total risk-weighted assets of 4.0%. We are also required to maintain a minimum leverage capital ratio—the ratio of Tier 1 capital (net of intangibles) to adjusted total assets. Banks that have received the highest rating of five categories used by regulators to rate banks and are not anticipating or experiencing any significant growth must maintain a leverage capital ratio of at least 3.0%. All other institutions must maintain a minimum leverage capital ratio of 4.0%.
In addition, we are subject to the provisions of the Federal Deposit Insurance Corporation Improvement Act of 1991, which imposes a number of mandatory supervisory measures. Among other matters, this Act established five capital categories ranging from “well capitalized” to “critically under capitalized.” Such classifications are used by regulatory agencies to determine a bank’s deposit insurance premium and the approval of applications authorizing institutions to increase their asset size or otherwise expand their business activities or acquire other institutions.
To be categorized as “well capitalized” under the Act and, thus, subject to the fewest restrictions, a bank must have a leverage capital ratio of at least 5.0%, a Tier 1 risk-based capital ratio of at least 6.0%, and a total risk-based capital ratio of at least 10.0%, and must not be subject to any written agreement, order, capital directive or prompt corrective action directive issued by the FDIC to meet and maintain a specific capital level. These capital requirements may limit asset growth opportunities and restrict our ability to increase earnings.
Our failure to comply with our minimum capital requirements would have a material adverse effect on our financial condition and results of operations.
Increases in FDIC insurance premiums may affect our earnings.
The significant amount of bank failures over the past two years has increased resolution costs of the FDIC and caused a significant decrease in the FDIC’s deposit insurance fund. In addition, the FDIC instituted two temporary programs to further insure customer deposits at FDIC-member banks, including fully insuring non-interest bearing transactional accounts.
Our FDIC deposit insurance assessment rate for 2008 was five basis points. Effective January 1, 2009, the FDIC increased assessment rates and, as a result, our initial base assessment rate for 2009 was raised by seven basis points to 12 basis points resulting in an additional FDIC insurance assessment of $4.3 million for 2009. In addition, effective April 1, 2009, the FDIC further modified its risk-based assessment system resulting in higher assessment rates for riskier institutions, which did not have a material impact on our assessment.
The FDIC also established the Temporary Liquidity Guarantee Program, which includes a Transaction Account Guarantee Program to temporarily provide a full guarantee above the existing $250,000 deposit insurance limit for funds held at participating FDIC-insured depository institutions in non-interest-bearing transaction accounts and NOW accounts that pay up to 50 basis points (“guaranteed accounts”). Coverage became effective on October 14, 2008 and has been extended through June 30, 2010. As a participant in the Transaction Account Guarantee Program, during 2009 we were assessed an annualized ten basis point rate on balances in guaranteed accounts that exceed $250,000. Our related assessment for the year ended December 31, 2009 was $1.1 million. The annual assessment rate beginning January 1, 2010 will increase to 15, 20 or 25 basis points, depending on an institution’s assigned Risk Category under the FDIC’s risk-based premium system, and our related assessment would increase between $400,000 and $1.1 million.
Additionally, the FDIC imposed an emergency special assessment on the industry on June 30, 2009, which was collected on September 30, 2009, in the amount of five basis points of total assets less Tier 1 capital, resulting in an additional expense of $3.5 million recorded during 2009.

30
During the fourth quarter of 2009, the FDIC adopted a rule that required FDIC-insured depository institutions to prepay their quarterly risk-based assessments for the fourth quarter of 2009, and for all of 2010, 2011, and 2012, on December 30, 2009. Our prepaid assessment amount for the fourth quarter of 2009 and all of 2010 was based on our total base assessment rate in effect on September 30, 2009. For purposes of calculating the prepayment amount, that rate was increased by three basis points for all of 2011 and 2012, and our third quarter 2009 assessment base was increased quarterly by an estimated five percent annual growth rate through the end of 2012. Our total prepaid assessment was $31.4 million, which we recorded as a prepaid expense (asset) as of December 31, 2009. As of December 31, 2009, we recorded an expense for our regular quarterly assessment for the fourth quarter of 2009 and an offsetting credit to the prepaid expense, which we will continue for each quarter going forward until the prepaid asset is exhausted.
If there are additional bank or financial institution failures or the government or FDIC develop new programs to stimulate the economy and restore investor confidence, we may be required to pay even higher FDIC premiums than the recently increased levels. Any increase in assessment fees could have a materially adverse effect on our results of operations and financial condition.
We are subject to significant government regulation.
We operate in a highly regulated environment and are subject to supervision and regulation by a number of governmental regulatory agencies, including, among others, the FDIC, the New York State Banking Department, the Federal Reserve, the New York State Insurance Department, and FINRA. Regulations adopted by these agencies, which are generally intended to provide protection for depositors and clients rather than shareholders, govern a comprehensive range of matters relating to ownership and control of our shares, our acquisition of other companies and businesses, the activities in which we are permitted to engage, maintenance of adequate capital levels, and other aspects of our operations. These regulatory agencies possess broad authority to prevent or remedy unsafe or unsound practices or violations of law. For example, bank regulators view certain types of clients as “high risk” clients under the Bank Secrecy Act and others laws and regulations and require enhanced due diligence and enhanced monitoring with respect to such clients. While we believe that we adequately perform such enhanced due diligence and monitoring with respect to our clients that fall within this category, if the regulators believe that our efforts are not adequate or that we have failed to identify suspicious transactions in such accounts, they could bring an enforcement action against us, which could result in bad publicity, fines and other penalties, and could have a material adverse effect on our business. In addition, laws and regulations enacted over the last several years have had and are expected to continue to have a significant impact on the financial services industry. Some of these laws and regulations, including the Sarbanes-Oxley Act of 2002 and the USA PATRIOT Act of 2001, have increased and may in the future further increase our costs of doing business, particularly personnel and technology expenses necessary to maintain compliance with the expanded regulatory requirements. Future legislation and government policy could adversely affect the banking industry as a whole, including our results of operations.
The securities markets and the brokerage industry in which Signature Securities operates are also highly regulated. Signature Securities is subject to regulation as a securities broker and investment adviser, and many of the regulations applicable to Signature Securities may have the effect of limiting its activities, including activities that might be profitable. Signature Securities is registered with and subject to supervision by the SEC and FINRA and is also subject to state insurance regulation. As a subsidiary of Signature Bank, Signature Securities is also subject to regulation and supervision by the New York State Banking Department. The securities industry has been subject to several fundamental regulatory changes, including changes in the rules of self-regulatory organizations such as the NYSE and FINRA. In the future, the industry may become subject to new regulations or changes in the interpretation or enforcement of existing regulations. We cannot predict the extent to which any future regulatory changes may adversely affect our business.
In addition, we are subject to periodic examination by the FDIC, the New York State Banking Department, the SEC, self-regulatory organizations, and various state authorities. Our banking operations, sales practice operations, trading operations, record-keeping, supervisory procedures, and financial position may be reviewed during such examinations to determine if they comply with the rules and regulations designed to protect clients and protect the solvency of banks and broker-dealers. Examinations may result in the issuance of a letter to us noting perceived deficiencies and requesting us to take corrective action. Deficiencies could lead to further investigation and the possible institution of administrative proceedings, which may result in the issuance of an order imposing sanctions upon us and/or our personnel, including our investment professionals. Sanctions against us may include a censure, cease and desist order, monetary penalties, or an order suspending us for a period of time from conducting certain or all of our operations. Sanctions against individuals may include a

31
censure, cease and desist order, monetary penalties, or an order restricting the individual’s activities or suspending the individual from association with us. In egregious cases, either we or our personnel or both could be expelled from a self-regulatory organization or barred from the banking industry or the securities industry.
The financial services industry may be subject to new legislation.
The regulatory environment in which we operate is constantly undergoing change. Legislation is pending before Congress that would further increase regulation of the financial services industry and impose restrictions on the ability of firms within the industry to conduct business consistent with historical practices, including aspects such as compensation, consumer protection regulations and mortgage regulation, among others. Federal and state regulatory agencies also propose and adopt changes to their regulations or change the manner in which existing regulations are applied. We cannot predict the substance or impact of pending or future legislation or regulation, or the application thereof, and any such future regulation can adversely affect our business.
Regulatory net capital requirements significantly affect and often constrain our brokerage business.
The SEC, FINRA, and various other regulatory bodies in the United States have rules with respect to net capital requirements for broker-dealers that affect Signature Securities. These rules require that at least a substantial portion of a broker-dealer’s assets be kept in cash or highly liquid investments. Signature Securities must comply with these net capital requirements, which limit operations that require intensive use of capital, such as trading activities. These rules could also restrict our ability to withdraw capital from our broker-dealer subsidiary, even in circumstances where this subsidiary has more than the minimum amount of required capital. This, in turn, could limit our ability to pay dividends, implement our business strategies and pay interest on and repay the principal of our debt. A change in these rules, or the imposition of new rules, affecting the scope, coverage, calculation, or amount of net capital requirements could have material adverse effects. Significant operating losses or any unusually large charge against net capital could also have a material negative impact on our business.
The misconduct of employees or their failure to abide by regulatory requirements are difficult to detect
and deter.
Employee misconduct could subject us to financial losses or regulatory sanctions and seriously harm our reputation. It is not always possible to deter employee misconduct, and the precautions we take to prevent and detect this activity may not be effective in all cases. Misconduct by our employees could include hiding unauthorized activities from us, improper or unauthorized activities on behalf of clients or improper use of confidential information.
Employee errors in recording or executing transactions for clients could cause us to enter into transactions that clients may disavow and refuse to settle. These transactions expose us to risks of loss, which can be material, until we detect the errors in question and unwind or reverse the transactions. As with any unsettled transaction, adverse movements in the prices of the securities involved in these transactions before we unwind or reverse them can increase these risks.
All of our securities professionals are required by law to be licensed with our subsidiary, Signature Securities, a licensed securities broker-dealer. Under these requirements, these securities professionals are subject to our supervision in the area of compliance with federal and applicable state securities laws, rules and regulations, as well as the rules and regulations of self-regulatory organizations such as FINRA. The violation of any regulatory requirements by us or our securities professionals could jeopardize Signature Securities’ broker-dealer license or other licenses and could subject us to liability to clients.
We are subject to losses resulting from fraudulent or negligent acts on the part of our clients or other
third parties.
We rely heavily upon information supplied by our clients and by third parties, including the information included in loan applications, property appraisals, title information, and employment and income documentation, in deciding which loans we will originate, as well as the terms of those loans. If any of the information upon which we rely is misrepresented, either fraudulently or inadvertently, and the misrepresentation is not detected prior to loan funding, the value of the loan may be significantly lower than we had expected, or we may fund a loan that we would not have funded or on terms that we would not have extended. Whether a misrepresentation is made by the loan applicant, a mortgage broker, or another third party, we generally bear the risk of loss associated with the misrepresentation. A loan subject to a material misrepresentation is typically unable to be sold or subject to repurchase if sold prior to the detection of the misrepresentation. The sources of the misrepresentation are often difficult to locate and it is often difficult to recover any of the monetary losses we have suffered. Although we

32
maintain a system of internal controls to mitigate against such occurrences and maintain insurance coverage for such risks that are insurable, we cannot assure you that we have detected or will detect all misrepresented information in our loan originations operations.
The failure of our brokerage clients to meet their margin requirements may cause us to incur significant
liabilities.
The brokerage business of Signature Securities, by its nature, is subject to risks related to potential defaults by our clients in paying for securities they have agreed to purchase and for securities they have agreed to sell and deliver. National Financial Services provides clearing services to our brokerage business, including the confirmation, receipt, execution, settlement, and delivery functions involved in securities transactions, as well as the safekeeping of clients’ securities and assets and certain client record keeping, data processing, and reporting functions. National Financial Services makes margin loans to our clients to purchase securities with funds they borrow from National Financial Services. We must indemnify National Financial Services for, among other things, any loss or expense incurred due to defaults by our clients in failing to repay margin loans or to maintain adequate collateral for those loans. We are subject to risks inherent in extending margin credit, especially during periods of rapidly declining markets.
Our business may be adversely impacted by acts of war or terrorism.
Acts of war or terrorism could have a significant impact on our ability to conduct our business. Such events could affect the ability of our borrowers to repay their loans, could impair the value of the collateral securing our loans, and could cause significant property damage, thus increasing our expenses and/or reducing our revenues. In addition, such events could affect the ability of our depositors to maintain their deposits with the Bank. Although we have established disaster recovery policies and procedures, the occurrence of any such event could have a material adverse effect on our business which, in turn, could have a material adverse effect on our financial condition and results of operations.
ITEM 1B. UNRESOLVED STAFF COMMENTS
None.

33
ITEM 2. PROPERTIES
We conduct business in 23 full-service private client offices, one SBA location and three operations centers. All current offices are leased with term expirations ranging from 2011 to 2024. Lease terms and rates vary by property. Many of the lease contracts include modest annual escalation agreements.
Our offices and lease expiration dates are described below:
Location Type Expiration
84 BroadwayBrooklyn, NY 11242 Private Client Office 2011
3 Quaker Ridge RoadNew Rochelle, NY 10804 Private Client Office 2011
9 Greenway PlazaHouston, TX 77046
SBA & Institutional Trading Center (Signature Securities office) 2011
565 Fifth AvenueNew York, NY 10017
Executive Offices, Bank Administration Center and Private Client Office 2014
26 Court StreetBrooklyn, NY 11242 Private Client Office 2014
279 Sunrise HighwayRockville Centre, NY 11570 Private Client Office 2014
923 BroadwayWoodmere, NY 11598 Private Client Office 2014
300 Park AvenueNew York, NY 10022 Private Client Office 2015
71 BroadwayNew York, NY 10006 Private Client Office 2015
360 Hamilton PlazaWhite Plains, NY 10601 Private Client Office 2015
36-36 33rd StreetLong Island City, NY 11102 Private Client Office 2015
200 Park Avenue SouthNew York, NY 10003 Private Client Office 2015
1020 Madison AvenueNew York, NY 10021 Private Client Office 2015
950 Third AvenueNew York, NY 10022 Private Client Office 2016
78-27 37th AvenueJackson Heights, NY 11372 Private Client Office 2016
1177 Avenue of the AmericasNew York, NY 10019 Bank Operations Center 2016
1225 Franklin AvenueGarden City, NY 11530 Private Client Office 2017

34
Location Type Expiration
40 Cuttermill RoadGreat Neck, NY 11021 Private Client Office 2017
6321 New Utrecht AvenueBrooklyn, NY 10004 Private Client Office 2017
111 BroadwayNew York, NY 10006 Private Client Accommodation Office 2017
261 Madison AvenueNew York, NY 10016 Private Client Office 2015 & 2018
68 South Service RoadMelville, NY 11747 Private Client Office 2018
100 Jericho QuadrangleJericho, NY 11753 Private Client Office 2018
50 West 57th StreetNew York, NY 10019 Private Client Office 2019
29 West 38th StreetNew York, NY 10018 Bank and Brokerage Operations Center 2020
421 Hunts Point AvenueBronx, NY 10474 Private Client Office 2021
2066 Hylan Blvd.Staten Island, NY 10306 Private Client Office 2024
ITEM 3. LEGAL PROCEEDINGS
We are subject to various pending and threatened legal actions relating to the conduct of our normal business activities. In the opinion of management, the ultimate aggregate liability, if any, arising out of any such pending or threatened legal actions will not be material to our Consolidated Financial Statements.
ITEM 4. SUBMISSION OF MATTERS TO A VOTE OF SECURITY HOLDERS
No matter was submitted to a vote of our security holders during the fourth quarter of 2009 through the solicitation of proxies or otherwise.

35
PART II
ITEM 5. MARKET FOR REGISTRANT’S COMMON EQUITY, RELATED STOCKHOLDER
MATTERS AND ISSUER PURCHASES OF EQUITY SECURITIES
Our common stock is listed on the NASDAQ Global Select Market under the symbol “SBNY.” As of December 31, 2009, 40,619,557 shares of our common stock were issued and outstanding. The following table lists, on a quarterly basis, the range of high and low intra-day sale prices per share of our common stock in U.S. dollars:
High Low
30.31$ 19.56 29.96 24.71 31.97 26.14 33.52 27.73
37.30$ 23.07 30.63 24.07 50.70 22.31 36.50 23.85
(1)
Fourth quarter
Common Stock
On September 18, 2008, the Securities and Exchange Commission announced emergency action that temporarily prohibited short sales of shares of certain financial companies, including Signature Bank. Due to the required covering of short positions, our sales price reached an all-time intra-day high on September 19, 2008.
2009
2008
First quarterSecond quarterThird quarterFourth quarter
First quarterSecond quarterThird quarter (1)
On December 31, 2009, the last reported sale price of our common stock was $31.90 and there were 20 holders of record of our common stock, including record holders on behalf of an indeterminate number of beneficial holders.

36
Performance Graph
The following graph compares the performance of our common stock with the performance of the Standard & Poor’s 500 Index and the Nasdaq Bank Stocks Index:
20
40
60
80
100
120
140
160
December 31,2004
December 31,2005
December 31,2006
December 31,2007
December 31,2008
December 31,2009
Signature Bank Standard & Poor's 500 Index Nasdaq Bank Stocks Index
The performance period reflected below assumes that $100 was invested in our common stock and each of the indexes listed below on December 31, 2004. The performance of our common stock reflected below is not indicative of our future performance.
Company Name/Index 2004 2005 2006 2007 2008 2009
Signature Bank 100.00$ 86.74 95.74 104.30 88.66 98.58
Standard & Poor's 500 Index 100.00 103.00 117.03 121.16 74.53 92.01
Nasdaq Bank Stocks Index 100.00 97.69 109.64 86.90 63.36 53.09
December 31,
The Performance Graph does not constitute soliciting material and should not be deemed filed or incorporated by
reference into any Signature Bank filing under the Securities Exchange Act of 1934, except to the extent we specifically
incorporate the Performance Graph therein by reference.
DIVIDEND POLICY
We have never declared or paid any cash dividends on our common stock. For the foreseeable future, we intend to retain any earnings to finance our operations and the expansion of our business and we do not anticipate paying any cash dividends on our common stock. Any future determination to pay dividends will be at the discretion of our Board of Directors and will be dependent upon then existing conditions, including our financial condition and results of operations, capital requirements, contractual restrictions, business prospects and other factors that the Board of Directors considers relevant.
In addition, payments of dividends may be subject to the prior approval of the New York State Banking Department and the FDIC. Under New York law, we are prohibited from declaring a dividend so long as there is any impairment of our capital stock. In addition, we would be required to obtain the approval of the New York State Banking Department if the total of all our dividends declared in any calendar year would exceed the total of our net profits for that year combined with retained net profits of the preceding two years, less any required transfer to surplus or a fund for the retirement of any preferred stock. We would also be required to obtain the approval of the FDIC prior to declaring a dividend if after paying the dividend we would be undercapitalized, significantly undercapitalized or critically undercapitalized. Our ability to pay dividends also depends upon the amount of cash available to us from our subsidiaries. Restrictions on our subsidiaries’ ability to make dividends and advances to us will tend to limit our ability to pay dividends to our shareholders.
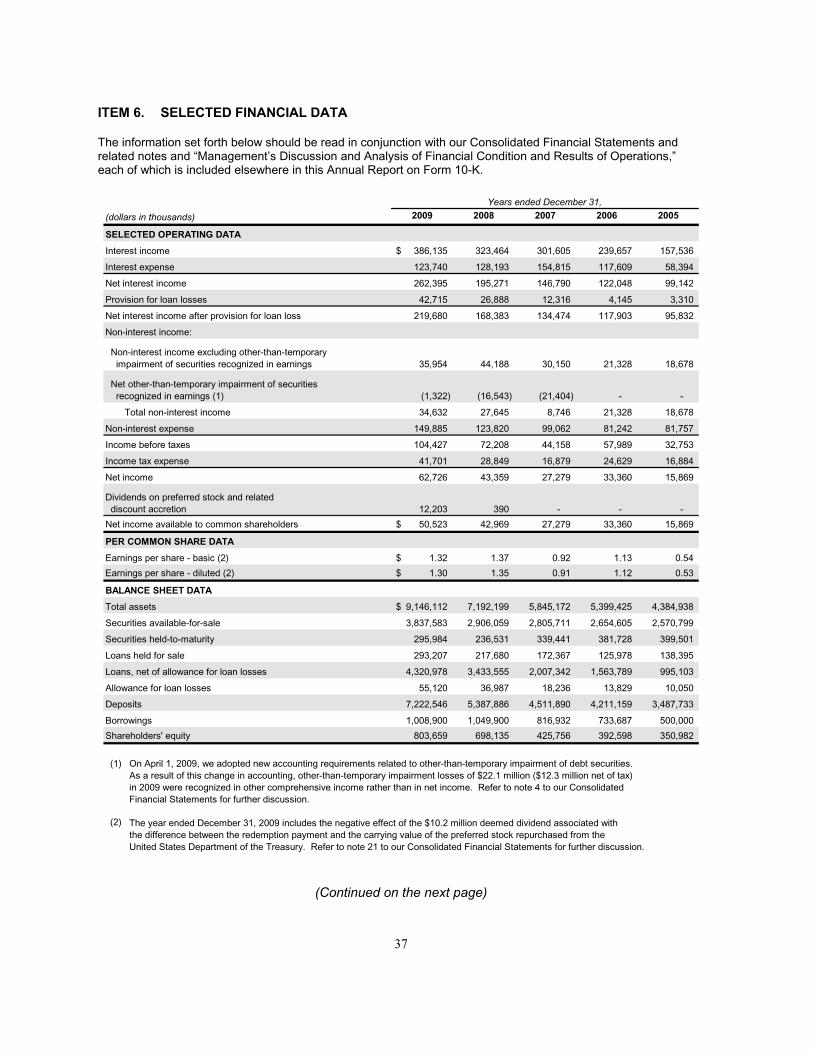
37
ITEM 6. SELECTED FINANCIAL DATA
The information set forth below should be read in conjunction with our Consolidated Financial Statements and related notes and “Management’s Discussion and Analysis of Financial Condition and Results of Operations,” each of which is included elsewhere in this Annual Report on Form 10-K.
2009 2008 2007 2006 2005
SELECTED OPERATING DATA
386,135$ 323,464 301,605 239,657 157,536
123,740 128,193 154,815 117,609 58,394
262,395 195,271 146,790 122,048 99,142
42,715 26,888 12,316 4,145 3,310
219,680 168,383 134,474 117,903 95,832
35,954 44,188 30,150 21,328 18,678
(1,322) (16,543) (21,404) - -
34,632 27,645 8,746 21,328 18,678
149,885 123,820 99,062 81,242 81,757
104,427 72,208 44,158 57,989 32,753
41,701 28,849 16,879 24,629 16,884
62,726 43,359 27,279 33,360 15,869
12,203 390 - - -
50,523$ 42,969 27,279 33,360 15,869
1.32$ 1.37 0.92 1.13 0.54
1.30$ 1.35 0.91 1.12 0.53
9,146,112$ 7,192,199 5,845,172 5,399,425 4,384,938
3,837,583 2,906,059 2,805,711 2,654,605 2,570,799
295,984 236,531 339,441 381,728 399,501
293,207 217,680 172,367 125,978 138,395
4,320,978 3,433,555 2,007,342 1,563,789 995,103
55,120 36,987 18,236 13,829 10,050
7,222,546 5,387,886 4,511,890 4,211,159 3,487,733
1,008,900 1,049,900 816,932 733,687 500,000
803,659 698,135 425,756 392,598 350,982
(1)
(2)
Years ended December 31,
Interest income
Non-interest income excluding other-than-temporary impairment of securities recognized in earnings
Non-interest income:
Net interest income after provision for loan loss
Provision for loan losses
Net interest income
Interest expense
Income tax expense
Net income
Dividends on preferred stock and related discount accretion
Net income available to common shareholders
Net other-than-temporary impairment of securities recognized in earnings (1)
Total non-interest income
Non-interest expense
Income before taxes
PER COMMON SHARE DATA
Earnings per share - basic (2)
Earnings per share - diluted (2)
BALANCE SHEET DATA
Total assets
Securities available-for-sale
Loans, net of allowance for loan losses
Allowance for loan losses
Deposits
Borrowings
Securities held-to-maturity
Loans held for sale
Shareholders' equity
(dollars in thousands)
The year ended December 31, 2009 includes the negative effect of the $10.2 million deemed dividend associated withthe difference between the redemption payment and the carrying value of the preferred stock repurchased from theUnited States Department of the Treasury. Refer to note 21 to our Consolidated Financial Statements for further discussion.
On April 1, 2009, we adopted new accounting requirements related to other-than-temporary impairment of debt securities.As a result of this change in accounting, other-than-temporary impairment losses of $22.1 million ($12.3 million net of tax)in 2009 were recognized in other comprehensive income rather than in net income. Refer to note 4 to our ConsolidatedFinancial Statements for further discussion.
(Continued on the next page)

38
2009 2008 2007 2006 2005
1,911,811$ 2,716,556$ 2,849,541$ 3,625,023$ 1,391,597$
7,692,249$ 6,016,680$ 5,119,208$ 4,358,457$ 3,569,984$
614 553 501 416 347
23 22 20 18 15
0.79% 0.68% 0.50% 0.72% 0.42%
8.35% 7.72% 6.67% 9.25% 4.63%
7.26% 8.56% 6.67% 9.25% 4.63%
5.02% 5.38% 5.89% 5.50% 4.41%
5.02% 5.38% 5.90% 5.50% 4.41%
1.71% 2.20% 3.12% 2.79% 1.71%
3.41% 3.25% 2.87% 2.80% 2.78%
3.41% 3.25% 2.88% 2.80% 2.78%
50.46% 55.55% 63.69% 56.66% 69.39%
50.24% 51.71% 55.99% 56.66% 69.39%
0.64% 0.30% 0.44% 0.03% 0.12%
1.26% 1.07% 0.90% 0.88% 1.00%
118.27% 116.00% 98.26% 157.94% 113.62%
1.07% 0.92% 0.92% 0.56% 0.88%
0.61% 0.46% 0.32% 0.16% 0.20%
9.39% 10.61% 7.75% 8.41% 8.67%
13.57% 17.00% 14.82% 16.18% 19.55%
14.47% 17.83% 15.43% 16.73% 20.08%
9.40% 8.81% 7.55% 7.83% 9.09%
9.40% 8.81% 7.55% 7.83% 9.09%
38,306 31,390 29,672 29,480 29,349
19.79$ 16.71$ 14.34$ 13.26$ 11.95$
(1)
(2)
(3)
Presented using a 35 percent federal tax rate.
On April 1, 2009, we adopted new accounting requirements related to other-than-temporary impairment of debt securities.As a result of this change in accounting, other-than-temporary impairment losses of $22.1 million ($12.3 million net of tax)in 2009 were recognized in other comprehensive income rather than in net income. Refer to note 4 to our ConsolidatedFinancial Statements for further discussion.
Average interest-earning assets
Assets under management
OTHER DATA
(dollars in thousands, except per share amounts)
Performance Ratios:
SELECTED FINANCIAL RATIOS
The efficiency ratio is calculated by dividing non-interest expense by the sum of net interest income before provision for loan losses and other non-interest income.
Private client offices
Full-time employee equivalents
Net charge-offs to average loans
Asset Quality Ratios:
Efficiency ratio excluding net other-than-temporary impairment of securities recognized in earnings (1) (3)
Efficiency ratio (1)
Yield on average interest-earning assets
Return on average common shareholders' equity
Return on average shareholders' equity
Return on average assets
Book value per common share
Number of weighted average common shares outstanding
Per common share data:
Average tangible equity to average assets
Average equity to average assets
Net interest margin, tax equivalent (2)
Net interest margin
Average rate on deposits and borrowings
Yield on average interest-earning assets, tax- equivalent (2)
Non-performing assets to total assets
Non-performing loans to total loans
Allowance for loan losses to non-performing loans
Allowance for loan losses to total loans
Total Risk-Based Capital Ratio
Tier One Risk-Based Capital Ratio
Tier One Leverage Capital Ratio
Capital and Liquidity Ratios:
Years ended December 31,

39
ITEM 7. MANAGEMENT’S DISCUSSION AND ANALYSIS OF FINANCIAL CONDITION AND
RESULTS OF OPERATIONS
You should read the following discussion in conjunction with “Selected Financial Data” and our Consolidated Financial Statements and related notes, each of which is included elsewhere in this Annual Report on Form 10-K. Some of the statements in the following discussion are forward-looking statements. See “Cautionary Note Regarding Forward-Looking Statements.”
Overview
We have grown to $9.15 billion in assets, $7.22 billion in deposits, $4.32 billion in loans, $803.7 million in equity capital and approximately $1.91 billion in other assets under management as of December 31, 2009.
We believe the growth in our profitability is based on several key factors, including:
� the significant growth of our interest-earning asset base each year;
� our ability to maintain and grow core deposits, a funding source at a cost that has been consistently below industry average, which has resulted in increased net interest income from 2001 onward; and
� our ability to control non-interest expense, which has contributed to a substantial improvement of our efficiency ratio to 50.5% for the year ended December 31, 2009, our lowest efficiency ratio since we opened the Bank.
An important aspect of our growth strategy is the ability to provide personalized, high quality service and effectively manage a large number of client relationships throughout the New York metropolitan area. Since the commencement of our operations, we have successfully recruited and retained more than 260 experienced private client group professionals. We believe that our existing operations infrastructure will allow us to grow our business over the next few years both geographically within the New York metropolitan area and with respect to the size and number of client relationships without substantial additional capital expenditures.
Critical Accounting Policies
We follow financial accounting and reporting policies that are in accordance with GAAP. Some of these significant accounting policies require management to make difficult, subjective or complex judgments. The policies noted below are deemed to be our “critical accounting policies” under the definition given to this term by the Securities and Exchange Commission (“SEC”) - those policies that are most important to the presentation of a company’s financial condition and results of operations and require management’s most difficult, subjective or complex judgments, often as a result of the need to make estimates about the effect of matters that are inherently uncertain.
We consider our policies related to the allowance for loan losses as critical to our financial statement presentation. The allowance for loan losses is established through a provision for loan losses charged to current earnings. The amount maintained in the allowance reflects management’s continuing evaluation of the probable losses inherent in the loan portfolio. The allowance for loan losses is comprised of two components: specific allowances assigned to certain classified loans individually evaluated for impairment and allowances calculated based on formulas for pools of loans. Factors contributing to the determination of specific allowances include the creditworthiness of the borrower and, more specifically, changes in the expected future receipt of principal and interest payments and/or in the value of pledged collateral. An allowance is recorded when the carrying amount of the loan exceeds the discounted estimated cash flows using the loan’s initial effective interest rate or the fair value of the collateral for certain collateral dependent loans. For purposes of determining formulas for pools of loans, the portfolio is segregated by product types in order to recognize differing risk profiles among categories, and then further segregated by credit grades. See “Asset Quality” for further discussion of the risk factors considered by management in establishing the allowance for loan losses.
We consider our policies related to the evaluation of investments for other-than-temporary impairment to be critical to our financial statement presentation. Investments are reviewed quarterly for indicators of other-than-temporary

40
impairment – a determination which requires significant judgment. In making this judgment, we employ a methodology that considers available quantitative and qualitative evidence in evaluating potential impairment of our investments. If the cost of an investment exceeds its fair value, we evaluate, among other factors, general market conditions, the duration and extent to which the fair value is less than cost, the probability of a near-term recovery in value and our intent to sell the security and whether it is more likely than not that we will be required to sell the security before full recovery of our investment or maturity. We also consider specific adverse conditions related to the financial health of, projected cash flow and business outlook for the investee, including industry and sector performance, operational and financing cash flow factors and rating agency actions. Once a decline in fair value is determined to be other-than-temporary, (i) for equity securities, an impairment charge is recorded through current earnings based upon the estimated fair value of the security at time of impairment and a new cost basis in the investment is established, and (ii) for debt investment securities, the investment is written down through current earnings by the impairment related to the estimated credit loss and the noncredit related impairment is recognized in other comprehensive income. A significant amount of judgment is required to determine the estimated credit loss, which could have a substantial effect on earnings. If market, industry and/or investee conditions deteriorate, we may incur future impairments. Refer to note 4 to our Consolidated Financial Statements for additional information related to the April 1, 2009 adoption of new accounting requirements related to other-than-temporary impairment of debt securities.
The judgments used by management in applying the critical accounting policies discussed above may be affected by a further and prolonged deterioration in the economic environment, which may result in changes to future financial results. Specifically, subsequent evaluations of the loan portfolio, in light of the factors then prevailing, may result in significant changes in the allowance for loan losses in future periods, and the inability to collect on outstanding loans could result in increased loan losses. In addition, the valuation and management’s projected cash flows for certain securities in our investment portfolio could be negatively impacted by illiquidity or dislocation in marketplaces resulting in significantly depressed market prices thus leading to further impairments.
New Accounting Standards
In May 2009, the FASB issued guidance now included in topic 855 (Subsequent Events) that addresses accounting and disclosure requirements related to subsequent events. It requires management to evaluate events and transactions that occur after the balance sheet date through the date the financial statements are either issued or available to be issued, depending on the company's expectation of whether it will widely distribute its financial statements to its shareholders and other financial statement users. Entities are required to disclose the date through which subsequent events have been evaluated. The guidance is effective for interim and annual reporting periods ending after June 15, 2009 and should be applied prospectively. We adopted these requirements on June 30, 2009 with no material impact to our Consolidated Financial Statements.
In June 2009, the FASB issued guidance which amends the derecognition guidance in topic 860 (Transfers and Servicing). Its main provisions are as follows: (1) eliminates the concept of a qualified special purpose entity (“QSPE”); (2) requires a transferor to consider all arrangements made contemporaneously with or in anticipation of a transfer when determining whether derecognition is appropriate; (3) clarifies the requirement that a transferred financial asset be legally isolated from the transferor and any of its consolidated affiliates; (4) introduces the concept of a participating interest which is applied to transfers of portions of financial assets to determine derecognition eligibility; (5) modifies the conditions required for a transfer of financial assets to qualify as a sale; (6) changes the initial measurement guidance for asset transfers that qualify as sales: and (7) stipulates that guaranteed mortgage securitizations (“GMS”) that fail to meet the conditions for sale accounting will result in the continued classification of the securitized mortgage loans as loans and will not enable a transferor to recognize a servicing asset or liability. The guidance is effective for financial asset transfers occurring in fiscal years beginning after November 15, 2009 (January 1, 2010 for calendar-year-end entities). Early adoption is prohibited. We do not expect the adoption of this guidance to have a material impact on our Consolidated Financial Statements.
In July 2009, the FASB issued Accounting Standards Update (“ASU”) 2009-01, topic 105 (Generally Accepted Accounting Principles) which established the ASC as the exclusive authoritative reference for nongovernmental U.S. GAAP for use in financial statements issued for interim and annual reporting periods ending after September 15, 2009, except for SEC rules and interpretive releases, which are also authoritative GAAP for SEC registrants.It divides nongovernmental U.S. GAAP into the authoritative Codification and guidance that is nonauthoritative. The contents of the Codification will carry the same level of authority, eliminating the previous four-level GAAP hierarchy. The Codification will supersede all existing non-SEC accounting and reporting standards. All other
41
non-grandfathered, non-SEC accounting literature not included in the Codification will become nonauthoritative. We adopted the ASU at September 30, 2009.
In August 2009, the FASB issued ASU 2009-05, Measuring Liabilities at Fair Value to provide guidance on measuring the fair value of liabilities under topic 820. The ASU indicates that if an identical liability is traded in an active market, the quoted price of that liability represents a Level 1 fair value measurement. If an active market quote for an identical liability is not available, an entity must use a valuation technique that uses the quoted price of: (1) an identical liability when traded as an asset; (2) a similar liability or a similar liability when traded as an asset; or (3) another valuation technique that is consistent with the principles of topic 820, such as an income approach or a market approach. The ASU is effective for the first interim or annual reporting period after issuance (October 1, 2009 for calendar-year-end entities), with earlier application permitted. We adopted the ASU’s requirements on October 1, 2009 with no material impact on our Consolidated Financial Statements.
In January 2010, the FASB issued ASU 2010-06 which amends ASC 820 (Fair Value Measurements and Disclosures) to add new requirements for disclosures about significant transfers into and out of Levels 1 and 2 and separate disclosures about purchases, sales, issuances and settlements relating to Level 3 measurements. It also clarifies existing fair value disclosures about the level of disaggregation requiring entities to provide such disclosures for each class of assets and liabilities and about inputs and valuation techniques used to measure fair value. The guidance is effective for the first reporting period (including interim periods) beginning after December 15, 2009, except for the requirement to provide Level 3 activity on a gross basis, which will be effective for fiscal years beginning after December 15, 2010 (including interim periods). In the period of initial adoption, entities will not be required to provide the amended disclosures for any previous periods presented for comparative purposes. Early adoption is permitted. We do not expect the adoption of the ASU to have a material impact on our Consolidated Financial Statements.
Lines of Business
We operate two principal lines of business, the Bank and Signature Securities. The Bank offers a wide variety of business and personal banking products and services. Signature Securities offers investment, brokerage, asset management and insurance products and services.
Management’s approach to evaluating the operating performance of each line of business recognizes that these business lines both serve our target market, and a key part of our business strategy is seamless integration of banking and brokerage services for the client. Certain synergies and operational overlap exist between the two lines, where feasible and as allowed within regulatory guidelines. The development of our business and the value of overall client relationships to us, as a whole, are also considered.

42
We measure and report results for both the banking and broker-dealer lines of business. The following tables present certain information regarding our reportable segments:
(in thousands) 2009 2008 2007
The Bank
Interest income 386,113$ 323,339 301,396 Interest expense 123,739 128,193 154,799 Non-interest income 28,104 18,521 4,162 Non-interest expense (1) 186,616 141,802 107,309 Income tax expense 41,649 28,779 16,852
Net income 62,213$ 43,086 26,598 Total assets 9,145,760$ 7,192,357 5,845,566
Signature Securities
Interest income 22$ 125 209 Interest expense 1 - 16 Non-interest income (2) 6,528 9,124 4,584
Fee income from the Bank 5,392 3,099 4,011 Non-interest expense 11,376 12,005 8,080 Income tax expense 52 70 27
Net income 513$ 273 681 Total assets 4,996$ 3,446 4,301
At or for the years ended December 31,
(2) Includes fee and other income from external clients.(1) For purposes of this disclosure, non-interest expense includes the provision for loan losses.
Signature Securities’ assets predominantly consist of cash and short-term investments to support its operational needs. Signature Securities’ assets under management were $1.18 billion, as of December 31, 2009, and represented fixed income securities, equity securities, money market mutual funds, mutual funds and other assets of its clients. See note 22 to our audited Consolidated Financial Statements for further information regarding our lines of business.
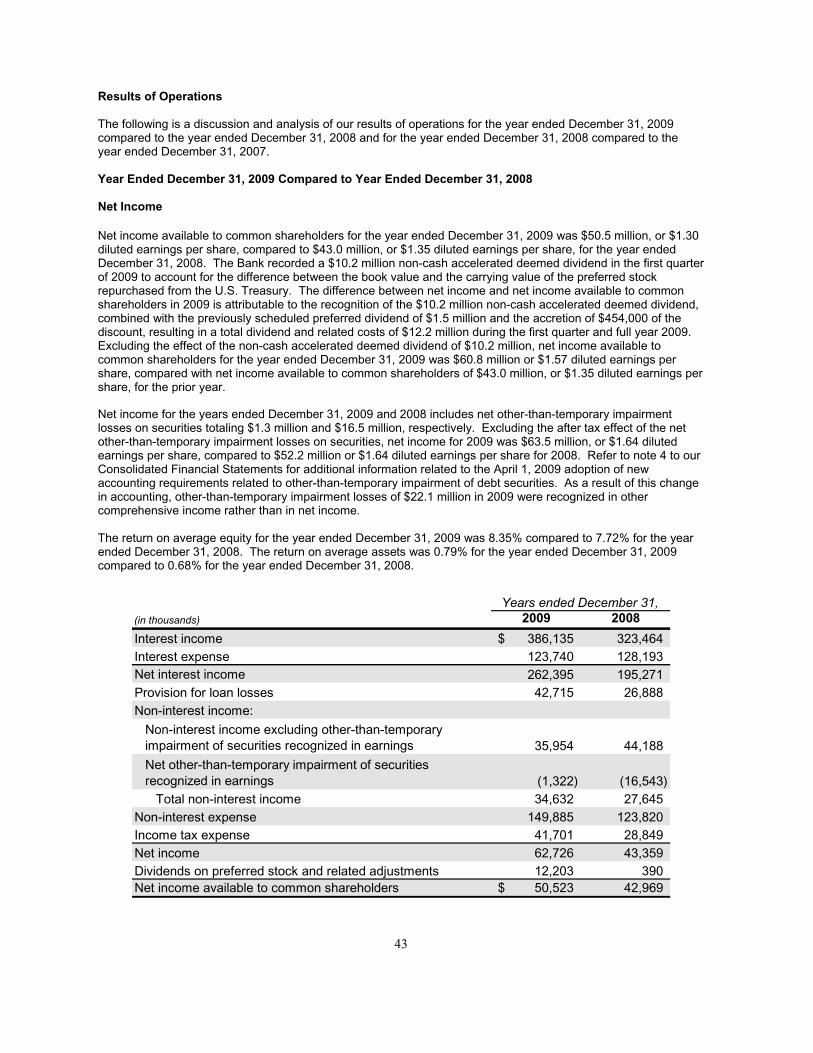
43
Results of Operations
The following is a discussion and analysis of our results of operations for the year ended December 31, 2009 compared to the year ended December 31, 2008 and for the year ended December 31, 2008 compared to the year ended December 31, 2007.
Year Ended December 31, 2009 Compared to Year Ended December 31, 2008
Net Income
Net income available to common shareholders for the year ended December 31, 2009 was $50.5 million, or $1.30 diluted earnings per share, compared to $43.0 million, or $1.35 diluted earnings per share, for the year ended December 31, 2008. The Bank recorded a $10.2 million non-cash accelerated deemed dividend in the first quarter of 2009 to account for the difference between the book value and the carrying value of the preferred stock repurchased from the U.S. Treasury. The difference between net income and net income available to common shareholders in 2009 is attributable to the recognition of the $10.2 million non-cash accelerated deemed dividend, combined with the previously scheduled preferred dividend of $1.5 million and the accretion of $454,000 of the discount, resulting in a total dividend and related costs of $12.2 million during the first quarter and full year 2009. Excluding the effect of the non-cash accelerated deemed dividend of $10.2 million, net income available to common shareholders for the year ended December 31, 2009 was $60.8 million or $1.57 diluted earnings per share, compared with net income available to common shareholders of $43.0 million, or $1.35 diluted earnings per share, for the prior year.
Net income for the years ended December 31, 2009 and 2008 includes net other-than-temporary impairment losses on securities totaling $1.3 million and $16.5 million, respectively. Excluding the after tax effect of the net other-than-temporary impairment losses on securities, net income for 2009 was $63.5 million, or $1.64 diluted earnings per share, compared to $52.2 million or $1.64 diluted earnings per share for 2008. Refer to note 4 to our Consolidated Financial Statements for additional information related to the April 1, 2009 adoption of new accounting requirements related to other-than-temporary impairment of debt securities. As a result of this change in accounting, other-than-temporary impairment losses of $22.1 million in 2009 were recognized in other comprehensive income rather than in net income.
The return on average equity for the year ended December 31, 2009 was 8.35% compared to 7.72% for the year ended December 31, 2008. The return on average assets was 0.79% for the year ended December 31, 2009 compared to 0.68% for the year ended December 31, 2008.
(in thousands) 2009 2008
Interest income 386,135$ 323,464 Interest expense 123,740 128,193 Net interest income 262,395 195,271Provision for loan losses 42,715 26,888 Non-interest income:
Non-interest income excluding other-than-temporaryimpairment of securities recognized in earnings 35,954 44,188
Net other-than-temporary impairment of securitiesrecognized in earnings (1,322) (16,543)
Total non-interest income 34,632 27,645 Non-interest expense 149,885 123,820 Income tax expense 41,701 28,849 Net income 62,726 43,359 Dividends on preferred stock and related adjustments 12,203 390 Net income available to common shareholders 50,523$ 42,969
Years ended December 31,
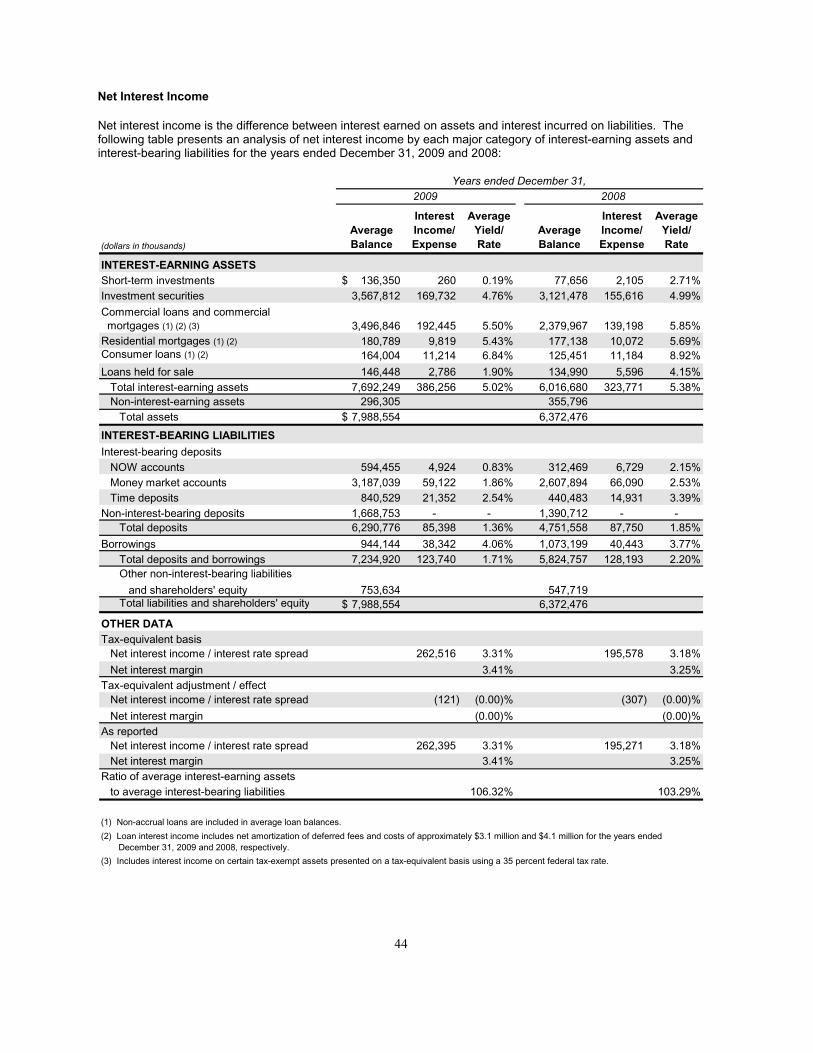
44
Net Interest Income
Net interest income is the difference between interest earned on assets and interest incurred on liabilities. The following table presents an analysis of net interest income by each major category of interest-earning assets and interest-bearing liabilities for the years ended December 31, 2009 and 2008:
(dollars in thousands)
Average
Balance
Interest
Income/
Expense
Average
Yield/
Rate
Average
Balance
Interest
Income/
Expense
Average
Yield/
Rate
INTEREST-EARNING ASSETS
Short-term investments 136,350$ 260 0.19% 77,656 2,105 2.71%Investment securities 3,567,812 169,732 4.76% 3,121,478 155,616 4.99%
Commercial loans and commercial mortgages (1) (2) (3) 3,496,846 192,445 5.50% 2,379,967 139,198 5.85%Residential mortgages (1) (2) 180,789 9,819 5.43% 177,138 10,072 5.69%Consumer loans (1) (2) 164,004 11,214 6.84% 125,451 11,184 8.92%
Loans held for sale 146,448 2,786 1.90% 134,990 5,596 4.15%Total interest-earning assets 7,692,249 386,256 5.02% 6,016,680 323,771 5.38%Non-interest-earning assets 296,305 355,796
Total assets 7,988,554$ 6,372,476
INTEREST-BEARING LIABILITIES
Interest-bearing depositsNOW accounts 594,455 4,924 0.83% 312,469 6,729 2.15%Money market accounts 3,187,039 59,122 1.86% 2,607,894 66,090 2.53%Time deposits 840,529 21,352 2.54% 440,483 14,931 3.39%
Non-interest-bearing deposits 1,668,753 - - 1,390,712 - -Total deposits 6,290,776 85,398 1.36% 4,751,558 87,750 1.85%
Borrowings 944,144 38,342 4.06% 1,073,199 40,443 3.77%Total deposits and borrowings 7,234,920 123,740 1.71% 5,824,757 128,193 2.20%Other non-interest-bearing liabilities
and shareholders' equity 753,634 547,719Total liabilities and shareholders' equity 7,988,554$ 6,372,476
OTHER DATA
Tax-equivalent basisNet interest income / interest rate spread 262,516 3.31% 195,578 3.18%
Net interest margin 3.41% 3.25%Tax-equivalent adjustment / effect
Net interest income / interest rate spread (121) (0.00)% (307) (0.00)%
Net interest margin (0.00)% (0.00)%As reported
Net interest income / interest rate spread 262,395 3.31% 195,271 3.18%Net interest margin 3.41% 3.25%
Ratio of average interest-earning assetsto average interest-bearing liabilities 106.32% 103.29%
2009 2008Years ended December 31,
(1) Non-accrual loans are included in average loan balances.
(2) Loan interest income includes net amortization of deferred fees and costs of approximately $3.1 million and $4.1 million for the years ended December 31, 2009 and 2008, respectively.
(3) Includes interest income on certain tax-exempt assets presented on a tax-equivalent basis using a 35 percent federal tax rate.

45
Interest income and interest expense are affected both by changes in the volume of interest-earning assets and interest-bearing liabilities and by changes in yields and interest rates. The tables below analyze the impact of changes in volume (changes in average outstanding balances multiplied by the prior period’s rate) and changes in interest rate (changes in interest rates multiplied by the current period’s average balance). Changes that are caused by a combination of interest rate and volume changes are allocated proportionately to both changes in volume and changes in interest rate. For purposes of calculating the changes in our net interest income, non-performing assets are included in the appropriate balance and shown as a change due to rate.
(in thousands)
Change
Due to Rate
Change
Due to
Volume
Total
Change
INTEREST INCOME
Short-term investments (3,436)$ 1,591 (1,845) Investment securities (8,135) 22,251 14,116 Commercial loans and commercial mortgages (12,076) 65,323 53,247 Residential mortgages (461) 208 (253) Consumer loans (3,407) 3,437 30 Loans held for sale (3,285) 475 (2,810)
Total interest income (30,800) 93,285 62,485
INTEREST EXPENSE
NOW accounts (7,878) 6,073 (1,805) Money market accounts (21,645) 14,677 (6,968)
Time deposits (7,139) 13,560 6,421 Total deposits (36,662) 34,310 (2,352)
Borrowings 2,762 (4,863) (2,101) Total interest expense (33,900) 29,447 (4,453)
Net interest income 3,100$ 63,838 66,938
Year ended December 31,2009 vs. 2008
Net interest income for the year ended December 31, 2009 was $262.4 million, an increase of $67.1 million, or 34.4%, over the year ended December 31, 2008. The increase in net interest income over the twelve month period was largely driven by increases in average earnings assets and average deposits of $1.68 billion and $1.54 billion, respectively, as well as an increase in net interest margin on a tax-equivalent basis of 16 basis points to 3.41% primarily due to lower rates paid on deposits. Additionally, for the year ended December 31, 2009, we recognized $377,000 in interest income from the accretion of discounts on previously impaired securities compared to $1.7 million recognized during the prior year. As a result of the adoption of new FASB requirements effective April 1, 2009, noncredit losses of $8.1 million on previously other-than-temporarily impaired securities that were recorded in earnings were transferred from retained earnings to accumulated other comprehensive loss, thereby increasing the amortized cost of the securities by the same amount. As a result, we expect the future accretion of discounts into interest income will not be material.
Total average investment securities for the year ended December 31, 2009 were $3.57 billion compared to $3.12 billion for the year ended December 31, 2008. The overall yield on the securities portfolio for the year ended December 31, 2009 was 4.76%, down 23 basis points from the comparable period a year ago. The decline in yield was predominantly due to the reinvestment of principal pay-downs from higher-yielding securities in a low interest rate environment. Our portfolio primarily consists of high quality mortgage-backed securities, collateralized debt obligations, and collateralized mortgage obligations issued by government agencies, government-sponsored enterprises, and private issuers. We mitigate extension risk through our overall strategy of purchasing relatively short duration securities that, by their nature, have lower yields. At December 31, 2009, the

46
baseline average duration of our investment securities portfolio was approximately 2.25 years, compared to 1.83 years at December 31, 2008.
Total commercial loans and commercial mortgages averaged $3.50 billion for the year ended December 31, 2009, an increase of $1.12 billion or 46.9% over the year ended December 31, 2008. The average yield on this portfolio decreased to 5.50%, down 35 basis points from the prior last year. The decrease in average yield is primarily due to the unusually low interest rate environment that prevailed throughout 2009, as well as an increase in non-accrual loans. The lower market interest rates led to an immediate rate reset on most of our variable rate loans. In order to assist in monitoring and controlling credit risk, we primarily lend to existing clients of our Bank with whom we have or expect to have deposit and/or brokerage relationships. We target our lending to privately-owned businesses, their owners and senior managers who are generally high net worth individuals who meet our credit standards.
We are an active participant in the SBA loan and SBA pool secondary market by purchasing, securitizing, and selling the guaranteed portions of SBA Section 7(a) loans, most of which have adjustable rates and float at a spread to the prime rate. Once purchased, we typically warehouse the guaranteed loan for approximately 30 to 180 days and classify them as loans held for sale. From this warehouse we aggregate like SBA loans by similar characteristics into pools for securitization to the secondary market. The timing of the purchase and sale of such loan pools drives the quarter-to-quarter fluctuations in average balances of loans held for sale, which averaged $146.4 million and $135.0 million for the years ended December 31, 2009 and 2008, respectively. Due to the continued dislocation in the credit markets, we were able to use our strong capital position to acquire SBA loans at advantageous prices. The increased inventory has been used to fill the demand for the product on the investor side; that has been fueled by the Federal Reserve’s Term Asset-Backed Securities Loan Facility initiative.
Average total deposits and borrowings grew $1.41 billion, or 24.2%, to $7.23 billion during the year ended December 31, 2009 from $5.82 billion for the year ended December 31, 2008. Overall cost of funding was 1.71% during 2009, decreasing 49 basis points from 2.20% in 2008. The decrease in overall cost of funding primarily resulted from a decrease in prevailing market rates, including the Federal Funds rate and LIBOR.
For the year ended December 31, 2009, average non-interest-bearing demand deposits were $1.67 billion as compared to $1.39 billion for the year ended December 31, 2008, an increase of $278.0 million, or 20.0%. Non-interest-bearing demand deposits continue to comprise a significant component of our deposit mix, representing 27.3% of all deposits at December 31, 2009. Additionally, average NOW and interest-bearing checking and money market accounts totaled $3.78 billion for the year ended December 31, 2009, an increase of $861.1 million, or 29.5%, over the year ended December 31, 2008. Core deposits have provided us with a source of stable, low cost funding, which has positively affected our net interest margin and income. Additionally, short-term escrow deposits have provided us with low cost funding and have assisted in net interest margin expansion. As a result of lower short-term interest rates as well as a significant decrease in competitive pricing, our funding cost for NOW accounts decreased to 0.83% for the year ended December 31, 2009 compared to 2.15% for the prior year, and our funding cost for money market accounts decreased to 1.86% for the year ended December 31, 2009 compared to 2.53% for the prior year.
Average time deposits, which are relatively short-term in nature and totaled $840.5 million for the year ended December 31, 2009, carried an average cost of 2.54% in 2009, down 85 basis points from 3.39% in 2008. Time deposits are offered to supplement our core deposit operations for existing or new client relationships, and are not marketed through retail channels.
For the year ended December 31, 2009, average total borrowings were $944.1 million compared to $1.07 billion for the previous year, a decrease of $129.1 million or 12.0%. The average cost of total borrowings was 4.06% and 3.77% for the years ended December 31, 2009 and 2008, respectively. At December 31, 2009, total borrowings represent approximately 12.3% of all funding compared to 16.3% at December 31, 2008. The decrease in average borrowings was driven by the increase in average deposits, while the increase in the average cost of total borrowings reflects the repayment of lower cost short-term borrowing positions.
Provision and Allowance for Loan Losses
Our allowance for loan losses increased $18.1 million to $55.1 million at December 31, 2009 from $37.0 million at December 31, 2008. This increase was primarily driven by growth in the loan portfolio, combined with increases in

47
non-performing loans and charge-offs, along with the continued effect of the weakened economic environment on our portfolio.
The following lending table allocates the allowance for loan losses based on our judgment of inherent losses in each respective area according to our methodology for allocating reserves.
(dollars in thousands)
Loan
Amount
Allowance
Amount
Allowance
as a % of
Loan Amount
Loan
Amount
Allowance
Amount
Allowance
as a % of
Loan Amount
Loans secured by real estate:Commercial property 1,492,877$ 10,778 0.72% 1,156,315 8,689 0.75%Multi-family residential property 1,153,610 5,088 0.44% 721,166 4,136 0.57%1-4 family residential property 260,986 1,576 0.60% 245,892 828 0.34%Construction and land 178,740 4,027 2.25% 168,890 2,116 1.25%Home equity lines of credit 170,891 631 0.37% 129,202 194 0.15%
Commercial & Industrial Loans 1,067,457 32,216 3.02% 996,224 20,606 2.07%Consumer loans 54,601 804 1.47% 55,399 418 0.75%
Total 4,379,162$ 55,120 1.26% 3,473,088 36,987 1.07%
December 31, 2009 2008
The provision for loan losses was $42.7 million for the year ended December 31, 2009 compared to $26.9 million for the prior year, an increase of $15.8 million, or 58.9%. The increase was predominantly driven by loan portfolio growth, an increase in non-performing loans, an increase in charge-offs during 2009 and an increase in provisions to recognize the effect of the weakened economic environment on our portfolio.
In determining the allowance for loan losses, management considers the imprecision inherent in the process of estimating credit losses. A portion of the allowance is based on management’s review of factors affecting the determination of probable losses inherent in the portfolio that are not necessarily captured by the application of historical loss experience factors, such as the current regional economic environment.
Commercial loans (including commercial and industrial loans and loans secured by commercial real estate) and multi-family mortgage loans constitute a substantial portion of our loan activity and loan portfolio. Substantially all of the real estate collateral for the loans in our portfolio is located within the New York metropolitan area. As a result, our financial condition and results of operations may be affected by changes in the economy and the real estate market of the New York metropolitan area. A prolonged period of economic recession or other adverse economic conditions in the New York metropolitan area, such as the one we are facing now, may result in an increase in nonpayment of loans, a decrease in collateral value, and an increase in our allowance for loan losses.
Non-Interest Income
For the year ended December 31, 2009, non-interest income was $34.6 million, an increase of $7.0 million, or 25.3%, when compared with 2008. The increase for the year was driven by a reduction in the amount of net impairment losses on securities recognized in earnings. On April 1, 2009, we adopted new accounting requirements related to other-than-temporary impairment of debt securities, whereby impairment losses attributable to credit are recorded in current earnings and losses attributable to noncredit factors are recorded in accumulated other comprehensive income. During 2009, we recognized other-than-temporary impairment losses on securities totaling $23.4 million, of which, $1.3 million was recognized through earnings and $22.1 million was recognized in other comprehensive income rather than in net income as a result of the accounting change. During 2008, we recognized, through earnings, $16.5 million of other-than-temporary impairment losses.
During 2009, ten securities were determined to be other-than-temporarily impaired, including three bank-collateralized pooled trust preferred securities and seven private collateralized mortgage obligations. During 2008, seven securities were written down to their estimated fair values, including three asset-backed securities (“ABSs”) issued principally in 2003-2004, one collateralized debt obligation (“CDO”) issued in 2005, one Lehman Brothers senior debenture, and two bank-collateralized pooled trust preferred securities. The securities were determined to be other-than-temporarily impaired based on the extent and duration of the decline in fair value below amortized

48
cost, giving consideration to the current illiquid conditions, the uncertainty of a near-term recovery in value and the decline in expected cash flows of certain ABS and CDO securities. For further discussion of our other-than-temporary impairment losses, see note 4 to our Consolidated Financial Statements.
Additionally, for the year ended December 31, 2009, net gains on sales of investment securities and loans increased by $1.8 million and $2.2 million, respectively, when compared to the prior year.
Non-interest income for 2009 was also impacted by a decrease in commissions and trading income. When compared to the prior year, commissions that we earned on off-balance sheet money market funds decreased by $10.4 million to $9.6 million. Given the unusually low interest rate environment, commissions on off-balance sheet money market funds have been reduced and, for some funds, eliminated in order to maintain positive yields on those funds. Should the unusually low interest rate environment continue for an extended period of time, we may experience a further decline in our commission income. Additionally, trading losses increased by $955,000, when compared to the prior year, due primarily to realized losses of $600,000 on credit default swaps used to economically hedge credit risks associated with bank corporate debt securities and $395,000 in the unrealized mark-to-market losses on credit default swaps.
Non-Interest Expense
Non-interest expense increased $26.1 million, or 21.1%, to $149.9 million for the year ended December 31, 2009 from $123.8 million for the year ended December 31, 2008. This increase was driven by a $12.9 million increase in salaries and benefits primarily attributable to the addition of 13 private client banking teams during the year. Additionally, other general and administrative expenses increased $12.4 million, primarily due to a $5.5 million increase in FDIC deposit insurance costs and an additional expense of $3.5 million for the FDIC special assessment as further described below. We also experienced a $781,000 increase in data processing expenses primarily due to additional client activity.
Our FDIC deposit insurance assessment rate for 2008 was five basis points. Effective January 1, 2009, the FDIC increased assessment rates and, as a result, our initial base assessment rate for 2009 was raised by seven basis points to 12 basis points resulting in an additional FDIC insurance assessment of $4.3 million for 2009. In addition, effective April 1, 2009, the FDIC further modified its risk-based assessment system resulting in higher assessment rates for riskier institutions, which did not have a material impact on our assessment.
The FDIC also established the Temporary Liquidity Guarantee Program, which includes a Transaction Account Guarantee Program to temporarily provide a full guarantee above the existing $250,000 deposit insurance limit for funds held at participating FDIC-insured depository institutions in non-interest-bearing transaction accounts and NOW accounts that pay up to 50 basis points (“guaranteed accounts”). Coverage became effective on October 14, 2008 and has been extended through June 30, 2010. As a participant in the Transaction Account Guarantee Program, during 2009 we were assessed an annualized ten basis point rate on balances in guaranteed accounts that exceed $250,000. Our related assessment for the year ended December 31, 2009 was $1.1 million. The annual assessment rate beginning January 1, 2010 will increase to 15, 20 or 25 basis points, depending on an institution’s assigned Risk Category under the FDIC’s risk-based premium system, and our related assessment would increase between $400,000 and $1.1 million.
Additionally, the FDIC imposed an emergency special assessment on the industry on June 30, 2009, which was collected on September 30, 2009, in the amount of five basis points of total assets less Tier 1 capital, resulting in an additional expense of $3.5 million recorded during 2009.
During the fourth quarter of 2009, the FDIC adopted a rule that required FDIC-insured depository institutions to prepay their quarterly risk-based assessments for the fourth quarter of 2009, and for all of 2010, 2011, and 2012, on December 30, 2009. Our prepaid assessment amount for the fourth quarter of 2009 and all of 2010 was based on our total base assessment rate in effect on September 30, 2009. For purposes of calculating the prepayment amount, that rate was increased by three basis points for all of 2011 and 2012, and our third quarter 2009 assessment base was increased quarterly by an estimated five percent annual growth rate through the end of 2012. Our total prepaid assessment was $31.4 million, which we recorded as a prepaid expense (asset) as of December 31, 2009. As of December 31, 2009, we recorded an expense for our regular quarterly assessment for the fourth quarter of 2009 and an offsetting credit to the prepaid expense, which we will continue for each quarter going forward until the prepaid asset is exhausted.
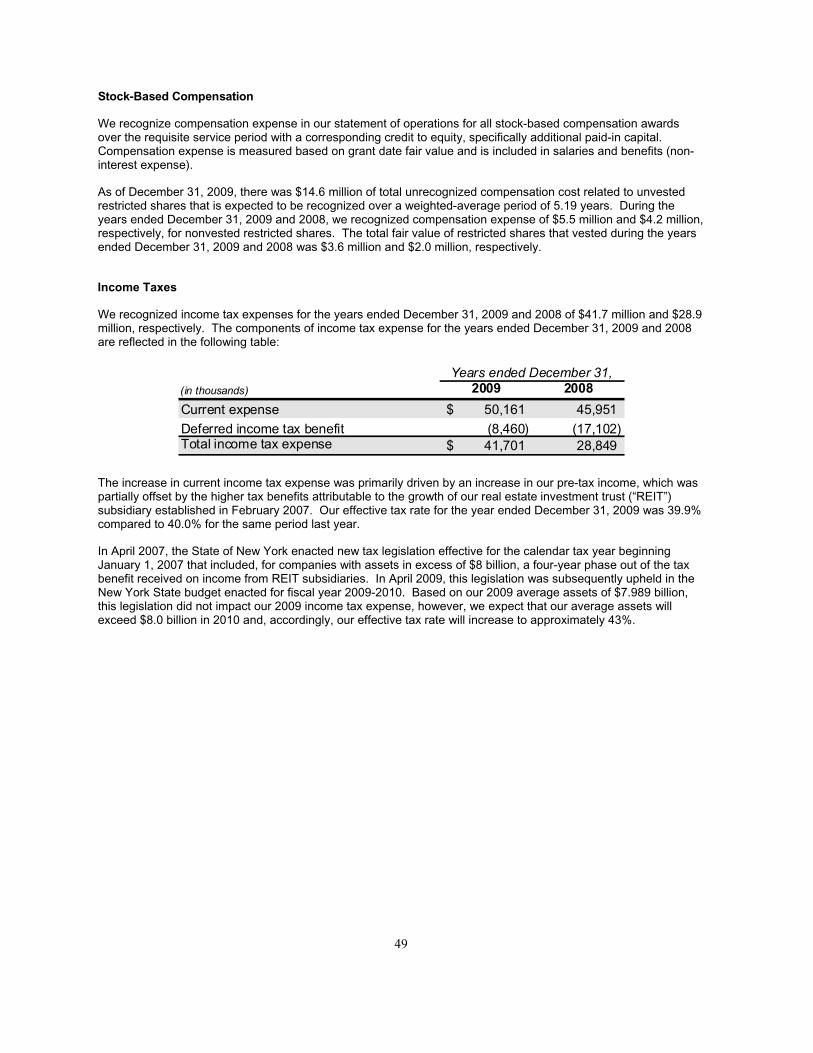
49
Stock-Based Compensation
We recognize compensation expense in our statement of operations for all stock-based compensation awards over the requisite service period with a corresponding credit to equity, specifically additional paid-in capital. Compensation expense is measured based on grant date fair value and is included in salaries and benefits (non-interest expense).
As of December 31, 2009, there was $14.6 million of total unrecognized compensation cost related to unvested restricted shares that is expected to be recognized over a weighted-average period of 5.19 years. During the years ended December 31, 2009 and 2008, we recognized compensation expense of $5.5 million and $4.2 million, respectively, for nonvested restricted shares. The total fair value of restricted shares that vested during the years ended December 31, 2009 and 2008 was $3.6 million and $2.0 million, respectively.
Income Taxes
We recognized income tax expenses for the years ended December 31, 2009 and 2008 of $41.7 million and $28.9 million, respectively. The components of income tax expense for the years ended December 31, 2009 and 2008 are reflected in the following table:
(in thousands) 2009 2008
Current expense 50,161$ 45,951 Deferred income tax benefit (8,460) (17,102) Total income tax expense 41,701$ 28,849
Years ended December 31,
The increase in current income tax expense was primarily driven by an increase in our pre-tax income, which was partially offset by the higher tax benefits attributable to the growth of our real estate investment trust (“REIT”) subsidiary established in February 2007. Our effective tax rate for the year ended December 31, 2009 was 39.9% compared to 40.0% for the same period last year.
In April 2007, the State of New York enacted new tax legislation effective for the calendar tax year beginning January 1, 2007 that included, for companies with assets in excess of $8 billion, a four-year phase out of the tax benefit received on income from REIT subsidiaries. In April 2009, this legislation was subsequently upheld in the New York State budget enacted for fiscal year 2009-2010. Based on our 2009 average assets of $7.989 billion, this legislation did not impact our 2009 income tax expense, however, we expect that our average assets will exceed $8.0 billion in 2010 and, accordingly, our effective tax rate will increase to approximately 43%.

50
Year Ended December 31, 2008 Compared to Year Ended December 31, 2007
Net Income
Net income available to common shareholders (“net income”) for the year ended December 31, 2008 was $43.0 million, or $1.35 diluted earnings per share, compared to $27.3 million, or $0.91 diluted earnings per share, for the year ended December 31, 2007. Net income for the years ended December 31, 2008 and 2007 includes other-than-temporary impairment losses on securities totaling $16.5 million and $21.4 million, respectively. Excluding the after tax effect of the other-than-temporary impairment losses on securities, net income for 2008 was $52.2 million, or $1.64 diluted earnings per share, compared to $39.2 million or $1.30 diluted earnings per share for 2007.
The return on average equity for the year ended December 31, 2008 was 7.72% compared to 6.67% for the year ended December 31, 2007. The return on average assets was 0.68% for the year ended December 31, 2008 compared to 0.50% for the year ended December 31, 2007.
(in thousands) 2008 2007
Interest income 323,464$ 301,605Interest expense 128,193 154,815Net interest income 195,271 146,790Provision for loan losses 26,888 12,316 Non-interest income:
Non-interest income excluding other-than-temporaryimpairment of securities recognized in earnings 44,188 30,150
Other-than-temporary impairment of securitiesrecognized in earnings (16,543) (21,404)
Total non-interest income 27,645 8,746 Non-interest expense 123,820 99,062 Income tax expense 28,849 16,879 Net income 43,359$ 27,279 Dividends on preferred stock and related adjustments 390 - Net income available to common shareholders 42,969$ 27,279
Years ended December 31,

51
Net Interest Income
Net interest income is the difference between interest earned on assets and interest incurred on liabilities. The following table presents an analysis of net interest income by each major category of interest-earning assets and interest-bearing liabilities for the years ended December 31, 2008 and December 31, 2007:
(dollars in thousands)
Average
Balance
Interest
Income/
Expense
Average
Yield/
Rate
Average
Balance
Interest
Income/
Expense
Average
Yield/
Rate
INTEREST-EARNING ASSETS
Short-term investments 77,656$ 2,105 2.71% 67,695 3,435 5.07%Investment securities 3,121,478 155,616 4.99% 3,166,886 158,589 5.01%
Commercial loans and commercial mortgages (1) (2) (3) 2,379,967 139,198 5.85% 1,508,236 111,693 7.41%Residential mortgages (1) (2) 177,138 10,072 5.69% 171,193 9,705 5.67%Consumer loans (1) (2) 125,451 11,184 8.92% 120,537 13,109 10.88%
Loans held for sale 134,990 5,596 4.15% 84,661 5,341 6.31%Total interest-earning assets 6,016,680 323,771 5.38% 5,119,208 301,872 5.90%Non-interest-earning assets 355,796 299,907
Total assets 6,372,476$ 5,419,115
INTEREST-BEARING LIABILITIES
Interest-bearing depositsNOW accounts 312,469 6,729 2.15% 292,305 6,460 2.21%Money market accounts 2,607,894 66,090 2.53% 2,245,086 92,322 4.11%Time deposits 440,483 14,931 3.39% 352,869 17,177 4.87%
Non-interest-bearing deposits 1,390,712 - - 1,241,491 - -Total deposits 4,751,558 87,750 1.85% 4,131,751 115,959 2.81%
Borrowings 1,073,199 40,443 3.77% 831,364 38,856 4.67%Total deposits and borrowings 5,824,757 128,193 2.20% 4,963,115 154,815 3.12%Other non-interest-bearing liabilities
and shareholders' equity 547,719 456,000Total liabilities and shareholders' equity 6,372,476$ 5,419,115
OTHER DATA
Tax-equivalent basisNet interest income / interest rate spread 195,578 3.18% 147,057 2.78%
Net interest margin 3.25% 2.88%Tax-equivalent adjustment / effect
Net interest income / interest rate spread (307) (0.00)% (267) (0.01)%
Net interest margin (0.00)% (0.01)%As reported
Net interest income / interest rate spread 195,271 3.18% 146,790 2.77%Net interest margin 3.25% 2.87%
Ratio of average interest-earning assetsto average interest-bearing liabilities 103.29% 103.15%
(1) Non-accrual loans are included in average loan balances.(2) Loan interest income includes net amortization of deferred fees and costs of approximately $4.1 million and $3.2 million for the years ended December 31, 2008 and 2007, respectively.
(3) Includes interest income on certain tax-exempt assets presented on a tax-equivalent basis using a 35 percent federal tax rate.
2008 2007Years ended December 31,

52
Interest income and interest expense are affected both by changes in the volume of interest-earning assets and interest-bearing liabilities and by changes in yields and interest rates. The tables below analyze the impact of changes in volume (changes in average outstanding balances multiplied by the prior period’s rate) and changes in interest rate (changes in interest rates multiplied by the current period’s average balance). Changes that are caused by a combination of interest rate and volume are allocated proportionately to both changes in volume and changes in interest rate. For purposes of calculating the changes in our net interest income, non-performing assets are included in the appropriate balance and shown as a change due to rate.
(in thousands)
Change
Due to Rate
Change
Due to
Volume
Total
Change
INTEREST INCOME
Short-term investments (1,835)$ 505 (1,330) Investment securities (699) (2,274) (2,973) Commercial loans and commercial mortgages (37,051) 64,556 27,505 Residential mortgages 30 337 367 Consumer loans (2,459) 534 (1,925) Loans held for sale (2,920) 3,175 255
Total interest income (44,934) 66,833 21,899
INTEREST EXPENSE
NOW accounts (177) 446 269 Money market accounts (41,151) 14,919 (26,232)
Time deposits (6,511) 4,265 (2,246) Total deposits (47,839) 19,630 (28,209)
Borrowings (9,716) 11,303 1,587 Total interest expense (57,555) 30,933 (26,622)
Net interest income 12,621$ 35,900 48,521
2008 vs. 2007Year ended December 31,
Net interest income for the year ended December 31, 2008 was $195.3 million, an increase of $48.5 million, or 33.0%, over the year ended December 31, 2007. The increase in net interest income over the twelve month period was largely driven by increases in average earnings assets and average deposits of $897.5 million and $619.8 million, respectively, as well as an increase in net interest margin on a tax-equivalent basis of 37 basis points to 3.25% primarily due to an increase in loans as a percentage of assets and lower rates paid on deposits and borrowings. Additionally, during the fourth quarter of 2008, we recognized $1.7 million in interest income from the accretion of discounts on securities previously impaired.
Total average investment securities for the year ended December 31, 2008 were $3.12 billion compared to $3.17 billion for the year ended December 31, 2007. The overall yield on the securities portfolio for the year ended December 31, 2007 was 4.99%, down two basis points from the comparable period a year ago. Our portfolio primarily consists of high quality mortgage-backed securities, collateralized debt obligations, and collateralized mortgage obligations issued by government agencies, government-sponsored enterprises, and private issuers. We continue to mitigate extension risk through our overall strategy of purchasing relatively short duration securities that, by their nature, have lower yields. At December 31, 2008, the baseline average duration of our investment securities portfolio was approximately 1.83 years, compared to 2.01 years at December 31, 2007.
Total commercial loans and commercial mortgages averaged $2.38 billion for the year ended December 31, 2008, an increase of $871.7 million or 57.8% over the year ended December 31, 2007. The average yield on this portfolio decreased to 5.85%, down 156 basis points from the same period last year. The decrease in average

53
yield is primarily due to the decreases in the U.S. prime rate and LIBOR that began in the latter half of 2007 and continued in 2008, as well as an increase in non-performing loans. The lower market interest rates led to an immediate rate reset on most of our variable rate loans. In order to assist in monitoring and controlling credit risk, we primarily lend to existing clients of our bankers with whom we have or expect to have deposit and/or brokerage relationships. We target our lending to privately-owned businesses, their owners and senior managers who are generally high net worth individuals who meet our credit standards.
We are an active participant in the SBA loan and SBA pool secondary market by purchasing, securitizing, and selling the guaranteed portions of SBA Section 7(a) loans, most of which have adjustable rates and float at a spread to the prime rate. Once purchased, we typically warehouse the guaranteed loan for approximately 30 to 180 days and classify them as loans held for sale. From this warehouse we aggregate like SBA loans by similar characteristics into pools for securitization to the secondary market. The timing of the purchase and sale of such loan pools drives the quarter-to-quarter fluctuations in average balances of loans held for sale, which averaged $134.9 million and $84.7 million for the years ended December 31, 2008 and 2007, respectively. Due to the dislocation in the credit markets, trading in U.S. government guaranteed SBA loans significantly slowed in the latter half of 2008, resulting in a corresponding increase in our SBA guaranteed loans portfolio. However, in February 2009, we sold $95.0 million in SBA loans at a gain.
Average total deposits and borrowings grew $861.6 million, or 17.4%, to $5.82 billion during the year ended December 31, 2008 from $4.96 billion for the year ended December 31, 2007. Overall cost of funding was 2.20% during 2008, decreasing 92 basis points from 3.12% in 2007. The decrease in overall cost of funding primarily resulted from a decrease in prevailing market rates, including the Federal Funds rate and LIBOR.
For the year ended December 31, 2008, average non-interest-bearing demand deposits were $1.39 billion as compared to $1.24 billion for the year ended December 31, 2007, an increase of $149.2 million, or 12.0%. Non-interest-bearing demand deposits continue to represent a significant component of our deposit mix, representing 29.0% of all deposits at December 31, 2008. Additionally, average NOW and interest-bearing checking and money market accounts totaled $2.92 billion for the year ended December 31, 2008, an increase of $383.0 million, or 15.1%, over the year ended December 31, 2007. These core deposits have provided us with a source of stable, low cost funding, which has positively affected our net interest margin and income. Additionally, short-term escrow deposits have provided us with low cost funding and have assisted in net interest margin expansion.
Average time deposits, which were relatively short-term in nature and totaled $440.5 million for the year ended December 31, 2008, carried an average cost of 3.39%. Time deposits are offered to supplement our core deposit operations for existing or new client relationships, and are not marketed through retail channels. Given the significant recent reduction in short-term interest rates, during the fourth quarter of 2008 we implemented the use of brokered certificates of deposits to capitalize on the low market rates and expand our liquidity alternatives.
For the year ended December 31, 2008, average total borrowings were $1.07 billion compared to $831.4 million for the year ended December 31, 2007, an increase of $241.8 million or 29.1%. The average cost of total borrowings was 3.77% and 4.67% for the years ended December 31, 2008 and 2007, respectively. At December 31, 2008, total borrowings represent approximately 16.3% of all funding compared to 15.3% at December 31, 2007. The increase in average borrowings was driven by the increase in average loans, while the decrease in the average cost of total borrowings is attributable to decreases in prevailing short-term market interest rates.

54
Provision and Allowance for Loan Losses
Our allowance for loan losses increased $18.8 million to $37.0 million for the year ended December 31, 2008 from $18.2 million for the year ended December 31, 2007. This increase is primarily driven by growth in the loan portfolio, combined with an increase in provisions for the deteriorating economic environment. The following table allocates the allowance for loan losses based on our judgment of inherent losses in each respective area according to our methodology for allocating reserves.
(dollars in thousands)
Loan
Amount
Allowance
Amount
Allowance
as a % of
Loan Amount
Loan
Amount
Allowance
Amount
Allowance
as a % of
Loan Amount
Loans secured by real estate:Commercial property 1,156,315$ 8,689 0.75% 441,759 3,347 0.76%Multi-family residential property 721,166 4,136 0.57% 135,834 873 0.64%1-4 family residential property 245,892 828 0.34% 209,489 447 0.21%Construction and land 168,890 2,116 1.25% 116,040 851 0.73%Home equity lines of credit 129,202 194 0.15% 90,023 117 0.13%
Commercial & Industrial Loans 996,224 20,606 2.07% 968,155 12,236 1.26%Consumer loans 55,399 418 0.75% 66,211 365 0.55%
Total 3,473,088$ 36,987 1.07% 2,027,511$ 18,236 0.90%
December 31, 2008 2007
The provision for loan losses was $26.9 million for the year ended December 31, 2008 compared to $12.3 million for the same period last year, an increase of $14.6 million, or 118.3%. The increase was predominantly driven by the growth in the loan portfolio, the increase in non-performing loans, and an increase in provisions for the weakening economic environment.
In determining the allowance for loan losses, management considers the imprecision inherent in the process of estimating credit losses. A portion of the allowance is based on management’s review of factors affecting the determination of probable losses inherent in the portfolio that are not necessarily captured by the application of historical loss experience factors, such as the current regional economic environment.
Substantially all of the real estate collateral for the loans in our portfolio is located within the New York metropolitan area. As a result, our financial condition and results of operations may be affected by changes in the economy and the real estate market of the New York metropolitan area. A prolonged period of economic recession or other adverse economic conditions in the New York metropolitan area, such as the one we are facing now, may result in an increase in nonpayment of loans, a decrease in collateral value, and an increase in our allowance for loan losses.
Non-Interest Income
For the year ended December 31, 2008, non-interest income was $27.7 million, an increase of $18.9 million or 216.1% when compared with 2007. The increase for the year reflects several components, including an increase of $7.2 million in commissions associated with off balance-sheet deposits and increased brokerage activities, as well as an increase of $1.5 million in fees and service charges related to client expansion. Furthermore, net gains on sales of securities and loans increased $5.5 million predominantly attributable to gains on sales of investment securities.
Additionally, non-interest income for the year ended December 31, 2008, includes other-than-temporary impairment losses on securities totaling $16.5 million, compared to $21.4 million for the year ended December 31, 2007. During 2008, seven securities were written down to their estimated fair values, including three asset-backed securities (“ABSs”) issued principally in 2003-2004, one collateralized debt obligation (“CDO”) issued in 2005, one Lehman Brothers senior debenture, and two bank-collateralized pooled trust preferred securities. During 2007, 12 securities were written down to their estimated fair values, including six CDOs issued in 2004-2005 and six ABSs issued principally in 2004-2005. With the exception of the Lehman Brothers senior debenture, the securities have performed in accordance with their terms. The securities were determined to be other-than-temporarily impaired,
55
however, based on the extent and duration of the decline in fair value below amortized cost, giving consideration to the current illiquid conditions, the uncertainty of a near-term recovery in value and the decline in expected cash flows of certain ABS and CDO securities.
Non-Interest Expense
Non-interest expense increased $24.8 million, or 25.0%, to $123.8 million for the year ended December 31, 2008 from $99.1 million for the year ended December 31, 2007. This increase was driven by a $14.4 million increase in salaries and benefits primarily attributable to the addition of six private client banking teams including two large teams during the year, along with a $2.9 million increase in occupancy and equipment expenses resulting from the opening of two new offices and the expansion of established offices. Additionally, other general and administrative expenses increased $7.5 million, reflecting a $2.4 million increase in legal fees predominantly related to non-performing loans, along with a $1.4 million increase in data processing expenses due to additional client activity and an $821,000 increase in FDIC deposit insurance costs. Our FDIC deposit insurance assessment rate for 2008 was five basis points, resulting in an expense of $3.3 million for the year ended December 31, 2008..
The FDIC has also established the Temporary Liquidity Guarantee Program, which includes a Transaction Account Guarantee Program to temporarily provide a full guarantee above the existing $250,000 deposit insurance limit for funds held at participating FDIC-insured depository institutions in non-interest-bearing transaction accounts and NOW accounts that pay less than 50 basis points (“guaranteed accounts”). Coverage became effective on October 14, 2008. Under the Transaction Account Guarantee Program, we are assessed an annualized ten basis point assessment on a quarterly basis based on balances in guaranteed accounts that exceed $250,000.
Stock-Based Compensation
We recognize compensation expense in our statement of operations for all stock-based compensation awards over the requisite service period with a corresponding credit to equity, specifically additional paid-in capital. Compensation expense is measured based on grant date fair value and is included in salaries and benefits (non-interest expense).
As of December 31, 2008, all outstanding options, including those granted to our independent directors in March 2005, were fully vested and exercisable. Accordingly, no additional compensation cost will be expensed for these options. During the years ended December 31, 2008 and 2007, we recognized compensation expense of $2,000 and $11,000, respectively, for stock options.
As of December 31, 2008, there was $15.3 million of total unrecognized compensation cost related to unvested restricted shares that is expected to be recognized over a weighted-average period of 6.11 years. During the years ended December 31, 2008 and 2007, we recognized compensation expense of $4.2 million and $1.9 million, respectively, for nonvested restricted shares. The total fair value of restricted shares that vested during the years ended December 31, 2008 and 2007 was $2.0 million and $1.2 million, respectively.

56
Income Taxes
Our income tax expenses for the years ended December 31, 2008 and 2007 were $28.9 million and $16.9 million, respectively. The components of income tax expense for the years ended December 31, 2008 and 2007 are reflected in the following table:
(in thousands) 2008 2007
Current expense 45,951$ 28,704 Deferred income tax benefit (17,102) (11,825) Total income tax expense 28,849$ 16,879
Years ended December 31,
The increase in current income tax expense was primarily driven by an increase in our pre-tax income, which was partially offset by the higher tax benefits attributable to the growth of our real estate investment trust (“REIT”) subsidiary established in February 2007. Our effective tax rate for the year ended December 31, 2008 was 40.0% compared to 38.2% for the prior year.

57
Financial Condition
Securities Portfolio
Securities in our investment portfolio are designated as either held-to-maturity (“HTM”) or available-for-sale (“AFS”) based upon various factors, including asset/liability management strategies, liquidity and profitability objectives and regulatory requirements. HTM securities are carried at cost and adjusted for amortization of premiums or accretion of discounts. AFS securities may be sold prior to maturity, based upon asset/liability management decisions and are carried at fair value. Unrealized gains or losses on AFS are recorded in accumulated other comprehensive income (loss), net of tax, in shareholders’ equity. In accordance with FASB requirements that we adopted as of April 1, 2009, net impairment losses on AFS and HTM debt securities attributable to credit losses are recorded in current earnings, while losses attributable to noncredit factors are recorded in accumulated other comprehensive income. Amortization of premiums and accretion of discounts on mortgage-backed securities are periodically adjusted for estimated prepayments.
At December 31, 2009, our total securities portfolio was $4.13 billion compared to $3.14 billion at December 31, 2008. Our portfolio primarily consists of mortgage-backed securities (“MBSs”) and collateralized mortgage obligations (“CMOs”) issued by U.S. Government agencies ($198.5 million), government-sponsored enterprises ($2.59 billion), and private issuers ($792.9 million). Overall, our securities portfolio had a weighted average duration of 2.25 years and a weighted average life of 3.27 years as of December 31, 2009. 89.4% of our securities portfolio had a AAA credit rating and 93.8% had a credit rating of A or better as of December 31, 2009. At December 31, 2009, 95.2% of our securities portfolio was rated investment grade or better, compared to 98.7% at December 31, 2008. The decline in the level of investment grade securities was due to actions by various credit rating agencies based upon general declines in underlying collateral values for certain of our securities. We have not purchased any securities that were rated below investment grade at the time of purchase. For further discussion of our investment securities and the related determination of fair value, see notes 3 and 4 to our Consolidated Financial Statements.
The agency MBS portfolio primarily consists of adjustable hybrid securities, fixed rate balloon, and seasoned 15-year structures. The agency CMO portion of our portfolio primarily consists of short duration planned amortization and sequential structures, collateralized by conforming first lien residential mortgages. The private CMO portfolio consists of Prime borrowers with seasoned underlying mortgages and supportive credit enhancement. The weighted average age of the underlying collateral is approximately 66 months with a weighted average loan to value ratio of approximately 56% based on original appraised values. The weighted average FICO score of the borrowers was approximately 730 at origination of the loan. The Private CMO sector is diversified with an average holding of $3.2 million per issue. Our asset-backed portfolio primarily consists of intermediate term fixed rate AAA and floating rate AA/A rated credit card, auto and home equity collateralized securities and collateralized debt obligations.
At December 31, 2009, we owned bank-collateralized pooled trust preferred securities with a current book value of $32.5 million and a fair value of $11.1 million. We continue to closely monitor these securities and, other than five bank-collateralized pooled trust preferred securities in our portfolio with a fair value of $5.8 million for which we have previously recorded other-than-temporary impairment, we believe the declines in fair value are temporary. We have no intent to sell these securities and we believe it is not more likely than not that we will be required to sell these investments before recovery of their amortized cost basis. In the event these securities demonstrate an adverse change in expected cash flows, we will recognize other-than-temporary impairment charges in net income.
Unrealized depreciation on AFS securities, net of tax effect, decreased from $62.7 million at December 31, 2008 to $36.7 million at December 31, 2009, as reflected in accumulated other comprehensive loss. The value of our AFS securities is affected by several factors including, credit spreads, interest rate environment, unemployment rates, delinquencies and defaults on the mortgages underlying such obligations, changes in interest rates resulting from expiration of the fixed rate portion of adjustable rate mortgages (“ARMs”), changing home prices, market liquidity for such obligations, and uncertainties in respect of government-sponsored enterprises such as Fannie Mae and Freddie Mac, which guarantee many of our obligations. The estimated effect of possible changes in interest rates on our earnings and equity is discussed in “Item 7A. Quantitative and Qualitative Disclosures About Market Risk.”

58
The following table summarizes the components of our AFS and HTM securities portfolios at the dates indicated:
Amortized Fair Amortized Fair Amortized Fair
(in thousands) Cost Value Cost Value Cost Value
AVAILABLE-FOR-SALE
US Treasuries -$ - - - 7,984 8,058 FHLB, FNMA, and FHLMC Debentures - - 15,000 15,001 106,752 106,895 Residential mortgage-backed securities:
U.S. Government Agency 39,392 40,467 58,224 58,538 46,590 46,863 Government-sponsored enterprises 848,967 875,552 781,621 789,151 506,900 510,083
Collateralized mortgage obligations:
U.S. Government Agency 126,064 127,326 98,049 97,052 89,704 89,402 Government-sponsored enterprises 1,508,496 1,532,955 1,069,379 1,080,195 944,670 948,520 Private 833,446 778,702 618,086 548,851 669,774 666,985
Other debt securities 531,009 468,296 365,410 305,109 453,680 417,174 Equity securities (1) 14,757 14,285 12,684 12,162 12,125 11,731
Total available-for-sale 3,902,131$ 3,837,583 3,018,453 2,906,059 2,838,179 2,805,711
HELD-TO-MATURITY
FHLB, FNMA, and FHLMC Debentures -$ - 20,435 20,458 117,560 117,634 Residential mortgage-backed securities:
U.S. Government Agency 4,954 5,015 7,516 7,412 5,026 4,994 Government-sponsored enterprises 12,657 13,159 16,888 17,206 17,174 17,054
Collateralized mortgage obligations:
U.S. Government Agency 25,706 25,732 6,662 6,663 - - Government-sponsored enterprises 169,806 174,024 88,365 89,355 61,854 61,350 Private 14,213 11,315 17,552 15,584 34,679 33,833
Other debt securities 68,648 61,363 79,113 73,861 103,148 101,040 Total held-to-maturity 295,984$ 290,608 236,531 230,539 339,441 335,905
(1) Equity securities represent Community Reinvestment Act (“CRA”) qualifying closed-end bond fund investments.
2007December 31,
2009 2008
The following table sets forth the credit rating distribution of our securities portfolio at December 31, 2009:
Percentage of
Credit Rating Portfolio
89.37%2.41%2.05%
BBB 1.39%4.78%
100.00%
AAAAA A
Below BBBTotal
The following table provides an estimated fair value change in our investment portfolio for various interest rate shocks at December 31, 2009:
Interest Rate Shock
+100 basis points
Estimated Fair
Value Change
+300 basis points (7.66%)+200 basis points
(2.46%)(5.23%)

59
The following table shows the contractual maturity distribution and the weighted average yields of our combined available-for-sale and held-to-maturity securities portfolio as of December 31, 2009. Due to prepayments of collateral underlying the securities, actual maturity may differ from contractual maturity.
(dollars in thousands) Amortized Cost Average Yield
Less than one yearMortgage-backed securities -$ - 0.00%Collateralized mortgage obligations - - 0.00%Other securities (1) 169,816 171,211 4.23%
Total 169,816$ 171,211 4.23%
One year to less than five yearsMortgage-backed securities 5,844$ 6,031 4.81%Collateralized mortgage obligations 2,626 2,672 4.11%Other securities 20,710 20,221 1.74%
Total 29,180$ 28,924 2.57%
Five years to less than 10 yearsMortgage-backed securities 38,510$ 40,005 3.92%Collateralized mortgage obligations 381,657 384,692 4.92%Other securities 38,930 37,033 3.94%
Total 459,097$ 461,730 4.76%
10 years and longerMortgage-backed securities 861,616$ 888,157 4.53%Collateralized mortgage obligations 2,293,448 2,262,690 4.63%Other securities 370,201 301,195 4.28%
Total 3,525,265$ 3,452,042 4.57%
All maturitiesMortgage-backed securities 905,970$ 934,193 4.50%Collateralized mortgage obligations 2,677,731 2,650,054 4.67%Other securities 599,657 529,660 4.16%
Total 4,183,358$ 4,113,907 4.56%
(1) Excludes equity securities, which have indefinite maturities.
Fair Value
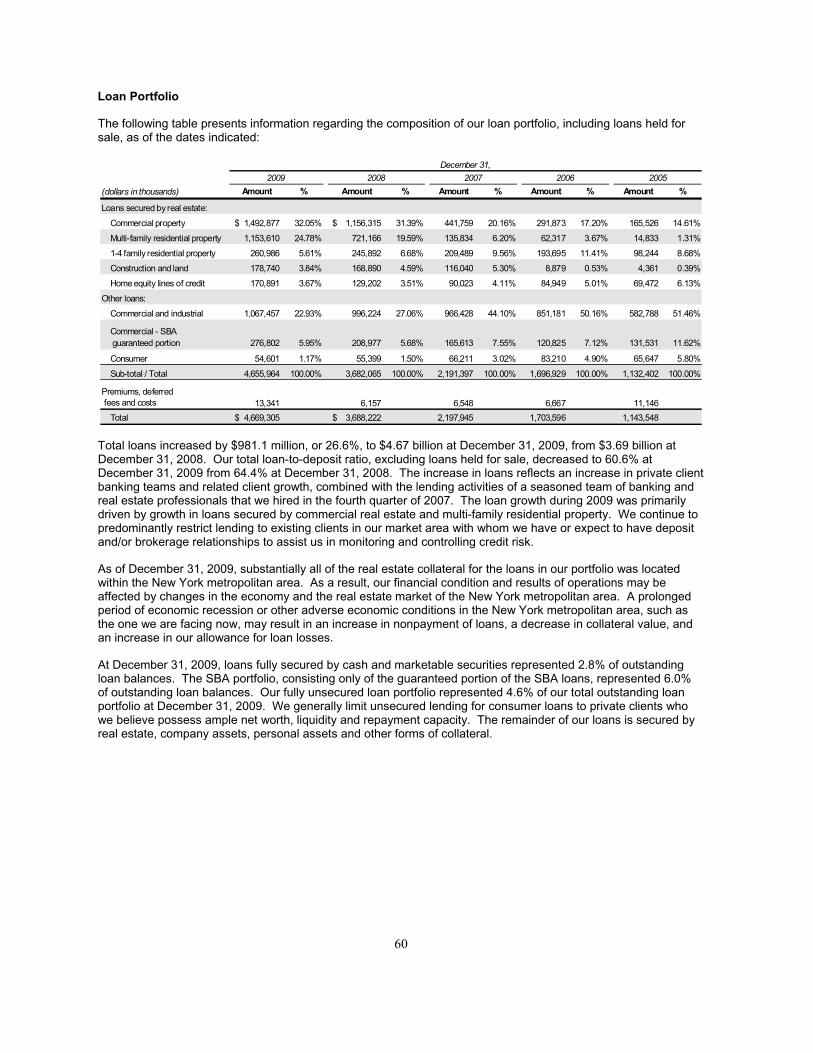
60
Loan Portfolio
The following table presents information regarding the composition of our loan portfolio, including loans held for sale, as of the dates indicated:
(dollars in thousands) Amount % Amount % Amount % Amount % Amount %
Loans secured by real estate:
Commercial property 1,492,877$ 32.05% 1,156,315$ 31.39% 441,759 20.16% 291,873 17.20% 165,526 14.61%
Multi-family residential property 1,153,610 24.78% 721,166 19.59% 135,834 6.20% 62,317 3.67% 14,833 1.31%
1-4 family residential property 260,986 5.61% 245,892 6.68% 209,489 9.56% 193,695 11.41% 98,244 8.68%
Construction and land 178,740 3.84% 168,890 4.59% 116,040 5.30% 8,879 0.53% 4,361 0.39%
Home equity lines of credit 170,891 3.67% 129,202 3.51% 90,023 4.11% 84,949 5.01% 69,472 6.13%
Other loans:
Commercial and industrial 1,067,457 22.93% 996,224 27.06% 966,428 44.10% 851,181 50.16% 582,788 51.46%
Commercial - SBA guaranteed portion 276,802 5.95% 208,977 5.68% 165,613 7.55% 120,825 7.12% 131,531 11.62%
Consumer 54,601 1.17% 55,399 1.50% 66,211 3.02% 83,210 4.90% 65,647 5.80%
Sub-total / Total 4,655,964 100.00% 3,682,065 100.00% 2,191,397 100.00% 1,696,929 100.00% 1,132,402 100.00%
Premiums, deferred fees and costs 13,341 6,157 6,548 6,667 11,146
Total 4,669,305$ 3,688,222$ 2,197,945 1,703,596 1,143,548
December 31,2007 2006 20052009 2008
Total loans increased by $981.1 million, or 26.6%, to $4.67 billion at December 31, 2009, from $3.69 billion at December 31, 2008. Our total loan-to-deposit ratio, excluding loans held for sale, decreased to 60.6% at December 31, 2009 from 64.4% at December 31, 2008. The increase in loans reflects an increase in private client banking teams and related client growth, combined with the lending activities of a seasoned team of banking and real estate professionals that we hired in the fourth quarter of 2007. The loan growth during 2009 was primarily driven by growth in loans secured by commercial real estate and multi-family residential property. We continue to predominantly restrict lending to existing clients in our market area with whom we have or expect to have deposit and/or brokerage relationships to assist us in monitoring and controlling credit risk.
As of December 31, 2009, substantially all of the real estate collateral for the loans in our portfolio was located within the New York metropolitan area. As a result, our financial condition and results of operations may be affected by changes in the economy and the real estate market of the New York metropolitan area. A prolonged period of economic recession or other adverse economic conditions in the New York metropolitan area, such as the one we are facing now, may result in an increase in nonpayment of loans, a decrease in collateral value, and an increase in our allowance for loan losses.
At December 31, 2009, loans fully secured by cash and marketable securities represented 2.8% of outstanding loan balances. The SBA portfolio, consisting only of the guaranteed portion of the SBA loans, represented 6.0% of outstanding loan balances. Our fully unsecured loan portfolio represented 4.6% of our total outstanding loan portfolio at December 31, 2009. We generally limit unsecured lending for consumer loans to private clients who we believe possess ample net worth, liquidity and repayment capacity. The remainder of our loans is secured by real estate, company assets, personal assets and other forms of collateral.

61
The following table presents commercial and industrial loans and construction and land loans at fixed and variable rates, by maturity for the periods indicated:
(in thousands)Within One
Year
One to Five
Years
After Five
Years Total
Loan TypeCommercial and Industrial 567,309$ 453,299 46,849 1,067,457 Construction and Land 165,700 7,350 5,690 178,740 Total 733,009$ 460,649 52,539 1,246,197
Loans at fixed interest rates 314,530 37,334 Loans at variable interest rates 146,119 15,205
Total 460,649 52,539
As of December 31, 2009
Deferred Tax Asset/Liability
At December 31, 2009, after considering all available positive and negative evidence, management concluded that a valuation allowance for deferred tax assets was not necessary because it is more likely than not that these tax benefits will be fully realized. We will continue to monitor the need for a valuation allowance going forward; however, we do not expect to need one based upon projected profitability and taxable income in the carry-back period. Net deferred tax assets are included in Other Assets in our Consolidated Statements of Financial Condition.
The components of the net deferred tax asset at December 31, 2009 and 2008 are set forth in the following table:
(in thousands) 2009 2008
DEFERRED TAX ASSETS
Allowance for loan losses 23,155 15,774 Depreciation 421 1,153 Unearned compensation - restricted shares 2,439 1,611 Non-accrual interest 1,278 700 Write-down for other-than-temporary impairment of securities 13,799 16,780 Other 1,512 1,721 Total deferred tax assets recognized in earnings 42,604 37,739
Net unrealized depreciation on securities available-for-sale 29,170 49,698 Total deferred tax assets 71,774 87,437
DEFERRED TAX LIABILITY
Prepaid expenses 296 295 Total deferred tax liability recognized in earnings 296 295
Net deferred tax asset 71,478$ 87,142
December 31,
Deferred tax assets arise from expected future tax benefits attributable to temporary differences and carry-forwards. Deferred tax liabilities arise from expected future tax expense attributable to temporary differences. Temporary differences are defined as differences between the tax basis of an asset or liability and its reported amount in the financial statements that will result in taxable or deductible amounts in future years. Carry-forwards are defined as deductions or credits that cannot be currently utilized for tax purposes that may be carried forward to reduce taxable income or taxes payable in a future year.

62
Deposits
At December 31, 2009, we maintained approximately 61,500 deposit accounts, representing approximately $7.21 billion in client deposits, excluding brokered deposits, compared to approximately 49,500 accounts and $5.24 billion in total deposits, excluding brokered deposits, at December 31, 2008.
Included in deposits at December 31, 2009 and 2008 were approximately $379.4 million and $228.9 million, respectively, of short-term escrow deposits. We have developed a core competency in catering to the needs of law firms, accounting firms, claims administrators and title companies, which allows us to obtain from our clients short-term escrow deposits that banks of our size typically do not attract. The majority of short-term escrows outstanding at December 31, 2009, due to their nature, are expected to be released during the first quarter of 2010.
Excluding the short-term escrow deposits and brokered deposits, our total core deposits increased approximately $1.82 billion during 2009 primarily as a result of deposit gathering efforts by our established private client teams.
The following table presents information regarding the composition of our deposits and deposit products as of December 31, 2009 and 2008:
(in thousands) 2008
1,563,407 455,900
2,674,930
42,173 508,279
Brokered time deposits 143,197 5,387,886
1,969,734$ 687,396
3,799,423
7,222,546$
638,628 10,064
117,301
December 31,
Demand - non-interest-bearingNOWMoney market and other
Time deposits less than $100,000Time deposits equal to or greater than $100,000
Total deposits
2009
The following table presents a summary of our average deposits and average interest rates accrued for the periods indicated:
(dollars in thousands)
Average
Rate
Average
Balance
Average
Rate
NOW and interest-bearing checking accounts 0.83% 312,469 2.15%Money market accounts 1.86% 2,607,894 2.53%Time deposits 2.51% 421,325 3.41%Brokered time deposits 103,159 2.79% 19,158 2.87%Non-interest-bearing deposits - 1,390,712 -
Total deposits 1.36% 4,751,558 1.85%
2009
594,455$
2008
737,370
1,668,753 6,290,776$
3,187,039
Average
Balance
Years ended December 31,

63
The following table presents time deposits of $100,000 or more by their maturity as of December 31, 2009:
(dollars in thousands)
104,141
Three months or lessOver three months through six monthsOver six months through one yearOver one year
208,065$ 118,793 207,629
December 31, 2009
The following table presents the mix of our deposits and deposit products as of December 31, 2009 and 2008:
(dollars in thousands) Amount Percentage Amount Percentage
Personal demand deposit accounts (1) 203,204$ 2.81% 210,293 3.90%Business demand deposit accounts (1) 1,766,530 24.46% 1,353,114 25.12%Rent security 37,707 0.52% 22,338 0.41%Personal NOW 115,476 1.60% 72,674 1.35%Business NOW 571,920 7.92% 383,226 7.11%Personal money market accounts 1,085,782 15.03% 565,950 10.50%Business money market accounts 2,675,934 37.05% 2,086,642 38.73%Personal time deposits 481,555 6.67% 159,521 2.96%Business time deposits 274,374 3.80% 390,931 7.26%Brokered time deposits 10,064 0.14% 143,197 2.66%
Total 7,222,546$ 100.00% 5,387,886 100.00%Demand deposit accounts (1) 1,969,734$ 27.27% 1,563,407 29.02%NOW 687,396 9.52% 455,900 8.46%
Money market accounts 3,799,423 52.60% 2,674,930 49.64%Time deposits 755,929 10.47% 550,452 10.22%
Brokered time deposits 10,064 0.14% 143,197 2.66%Total 7,222,546$ 100.00% 5,387,886 100.00%
Personal 1,886,017$ 26.11% 1,008,438 18.71%Business 5,326,465 73.75% 4,236,251 78.63%Brokered time deposits 10,064 0.14% 143,197 2.66%
Total 7,222,546$ 100.00% 5,387,886 100.00%
(1) Non-interest bearing.
December 31,2009 2008
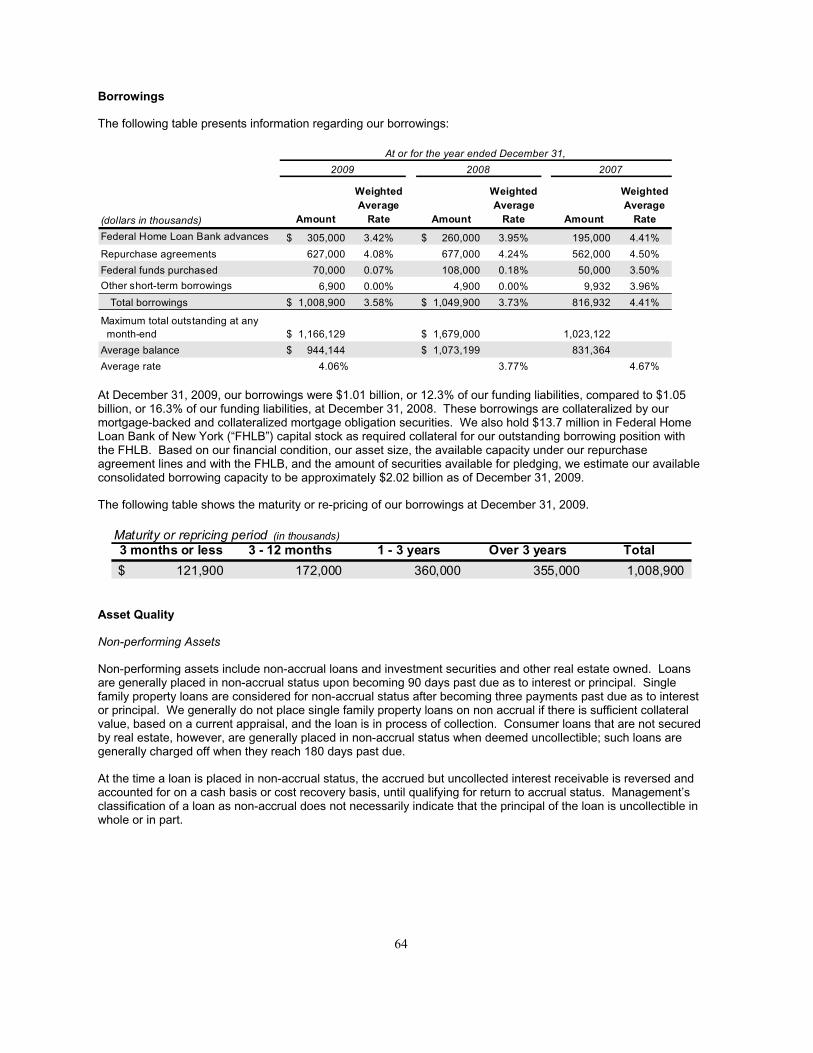
64
Borrowings
The following table presents information regarding our borrowings:
(dollars in thousands) Amount
Weighted
Average
Rate Amount
Weighted
Average
Rate Amount
Weighted
Average
Rate
Federal Home Loan Bank advances 305,000$ 3.42% 260,000$ 3.95% 195,000 4.41%
Repurchase agreements 627,000 4.08% 677,000 4.24% 562,000 4.50%
Federal funds purchased 70,000 0.07% 108,000 0.18% 50,000 3.50%
Other short-term borrowings 6,900 0.00% 4,900 0.00% 9,932 3.96%
Total borrowings 1,008,900$ 3.58% 1,049,900$ 3.73% 816,932 4.41%
Maximum total outstanding at any month-end 1,166,129$ 1,679,000$ 1,023,122
Average balance 944,144$ 1,073,199$ 831,364
Average rate 4.06% 3.77% 4.67%
At or for the year ended December 31,
2008 20072009
At December 31, 2009, our borrowings were $1.01 billion, or 12.3% of our funding liabilities, compared to $1.05 billion, or 16.3% of our funding liabilities, at December 31, 2008. These borrowings are collateralized by our mortgage-backed and collateralized mortgage obligation securities. We also hold $13.7 million in Federal Home Loan Bank of New York (“FHLB”) capital stock as required collateral for our outstanding borrowing position with the FHLB. Based on our financial condition, our asset size, the available capacity under our repurchase agreement lines and with the FHLB, and the amount of securities available for pledging, we estimate our available consolidated borrowing capacity to be approximately $2.02 billion as of December 31, 2009.
The following table shows the maturity or re-pricing of our borrowings at December 31, 2009.
3 months or less 3 - 12 months 1 - 3 years Over 3 years Total
121,900$ 172,000 360,000 355,000 1,008,900
Maturity or repricing period (in thousands)
Asset Quality
Non-performing Assets
Non-performing assets include non-accrual loans and investment securities and other real estate owned. Loans are generally placed in non-accrual status upon becoming 90 days past due as to interest or principal. Single family property loans are considered for non-accrual status after becoming three payments past due as to interest or principal. We generally do not place single family property loans on non accrual if there is sufficient collateral value, based on a current appraisal, and the loan is in process of collection. Consumer loans that are not secured by real estate, however, are generally placed in non-accrual status when deemed uncollectible; such loans are generally charged off when they reach 180 days past due.
At the time a loan is placed in non-accrual status, the accrued but uncollected interest receivable is reversed and accounted for on a cash basis or cost recovery basis, until qualifying for return to accrual status. Management’s classification of a loan as non-accrual does not necessarily indicate that the principal of the loan is uncollectible in whole or in part.

65
The following table summarizes our non-performing assets, accruing loans that were 90 days past due as to principal or interest, and certain asset quality indicators as of the dates indicated:
(dollars in thousands) 2009 2008 2007 2006 2005
Non-accrual loans 46,606$ 31,885 18,559 8,756 8,845
Investment securities 8,216 975 - - -
Other real estate owned 700 - - - -
Total non-performing assets 55,522$ 32,860 18,559 8,756 8,845
Troubled debt restructured loans -$ 9,698 - 3,652 -
Accruing loans past due 90 days or more 16,377$ 6,085 3,991 4,000 2,218
Asset Quality Ratios:
Total non-performing loans to total loans 1.07% 0.92% 0.92% 0.56% 0.88%
Total non-performing assets to total assets 0.61% 0.46% 0.32% 0.16% 0.20%
Allowance for loan losses to non-performing loans 118.27% 116.00% 98.26% 157.94% 113.62%
December 31,
Included in the non-accrual loan balance at December 31, 2009 were two construction loans totaling $12.7 million, two commercial real estate loans totaling $7.9 million, and three commercial and industrial loans totaling $10.0 million. Each of these non-performing loans is being actively managed by the Bank and the allowance for loan losses includes a specific allocation for each of them.
If all non-accrual loans outstanding at December 31, 2009, 2008, and 2007 had been performing in accordance with their original terms, we would have recorded interest income, with respect to such loans, of approximately $3.8 million, $3.7 million, and $1.4 million for the years then ended, respectively. This compares to actual payments recorded as interest income realized, with respect to such loans, of $603,000, $1.1 million, and $580,000 for the years ended December 31, 2009, 2008, and 2007, respectively.
Non-performing investment securities of $8.2 million at December 31, 2009, consisted of six bank-collateralized pooled trust preferred securities totaling $6.3 million, which are classified as non-performing given their deferral of interest payments, and one Lehman Brothers senior debenture classified as non-performing based on the issuer’s default. The non-performing investment securities of $975,000 at December 31, 2008 consisted solely of the Lehman Brothers senior debenture.
Accruing loans past due 90 days or more, which are not included in the non-performing category, are presented in the above table. These loans include U.S. Government guaranteed SBA loans, which totaled $3.9 million and $4.2 million as of December 31, 2009 and 2008, along with matured performing loans in the normal process of renewal, which totaled $990,000 and $750,000 as of December 31, 2009 and 2008. Additionally, as of December 31, 2009, this category includes $8.8 million in 1-4 family mortgages and $1.7 million in home equity lines of credit that are in process of collection and well secured, based on a current appraisal.
Troubled debt restructured loans, which have modified terms and are not included in the non-performing category or as accruing loans past due 90 days or more, are presented in the above table. At December 31, 2008, we had two loans that were restructured as troubled debt, which would have been non-performing had their terms not been renegotiated. One loan with a principal balance of $16.5 million was restructured with the Bank receiving a pay-down of $12.3 million and a fully-secured note for $3.7 million. We incurred a charge-off of approximately $524,000. The second loan with a principal balance of $5.9 million was restructured with the Bank obtaining additional collateral to further support the loan. Both of the loans restructured during 2008 are currently performing in accordance with the restructured terms. At December 31, 2006, there was one $3.7 million loan restructured as troubled debt. This loan was partially paid-off in January 2007, resulting in a charge to earnings of $807,000. This charge-off amount had been reserved for at December 31, 2006.
Included in our total commercial and industrial loans outstanding at December 31, 2009 were $25.0 million of overdrafts caused by the failure of checks drawn on Canadian banking institutions to clear, which resulted in an overdraft position for our deposit client. We subsequently entered into two loan agreements, one to our deposit client and the other to the party on which the Canadian checks were drawn, for the repayment of the $25.0 million

66
overdraft. These loans, which are secured by receivables, inventory, and property of the borrowers, are performing assets.
Summary of Loan Loss Experience
The provision for loan losses is a charge to earnings to maintain the allowance for loan losses at a level consistent with management’s assessment of the loan portfolio in light of current economic conditions and market trends. We recorded a provision of $42.7 million for the year ended December 31, 2009, $26.9 million for the year ended December 31, 2008 and $12.3 million for the year ended December 31, 2007. These provisions were made to reflect management’s assessment of the inherent and specific risk of loan losses relative to the growth of the portfolio.
The allowance for loan losses is comprised of specific reserves for impaired loans and a pooled formula estimate of losses inherent in the portfolio at the balance sheet date. We regularly evaluate our allowance for loan losses to maintain an allowance that we believe is appropriate based on estimated inherent and specific losses. Factors contributing to the determination of specific reserves include the creditworthiness of the borrower and, more specifically, changes in the expected future receipt of principal and interest payments and/or in the value of pledged collateral. All loans considered for our watch list are specifically reviewed for impairment as appropriate. A reserve is recorded on impaired loans when the carrying amount of the loan exceeds the discounted cash flows using the loan’s initial effective interest rate or the fair value of the collateral for certain collateral-dependent loans. We consider all loans on our watch list (generally rated substandard or worse) to be potential problem loans. For purposes of determining the pooled formula reserve, the portfolio is segregated by product types to recognize differing risk profiles among categories, and then further segregated by credit grades. Credit grades are assigned to all loans greater than $250,000. Each credit grade is assigned a risk factor or reserve allocation percentage. These risk factors are multiplied by the outstanding principal balance and risk-weighted by product type to calculate the reserve amount.
The risk factor or reserve allocation percentages assigned to each credit grade have been developed based on an analysis of our historical loss rates and loss rates at selected peer banks and industry data, adjusted for certain qualitative factors and our management’s experience. Qualitative adjustments for such factors as national and local economic conditions, market interest rates, changes in credit policies and lending standards, and changes in the trend and severity of problem loans can cause the estimation of inherent losses to differ from past experience. In addition, the reserve considers the results of credit reviews performed by our risk manager as reflected in the confirmation of assigned credit grades within the portfolio.
The methodology used in the periodic review of reserve adequacy, which is performed at least quarterly, is designed to be dynamic and responsive to changes in portfolio credit quality and inherent credit losses. The changes are reflected in both the pooled formula reserve and in specific reserves as the collectability of larger classified loans is regularly recalculated with new information as it becomes available. As our portfolio matures, historical loss ratios are closely monitored. Currently, the review of reserve adequacy is performed by our senior management, assessed by a credit review function, and presented to our Board of Directors for their review and consideration on a quarterly basis.
Our allowance for loan losses totaled $55.1 million at December 31, 2009, $37.0 million at December 31, 2008, and $18.2 million at December 31, 2007, representing 1.26%, 1.07%, and 0.90% of total loans (excluding loans held for sale) at December 31, 2009, 2008, and 2007, respectively.
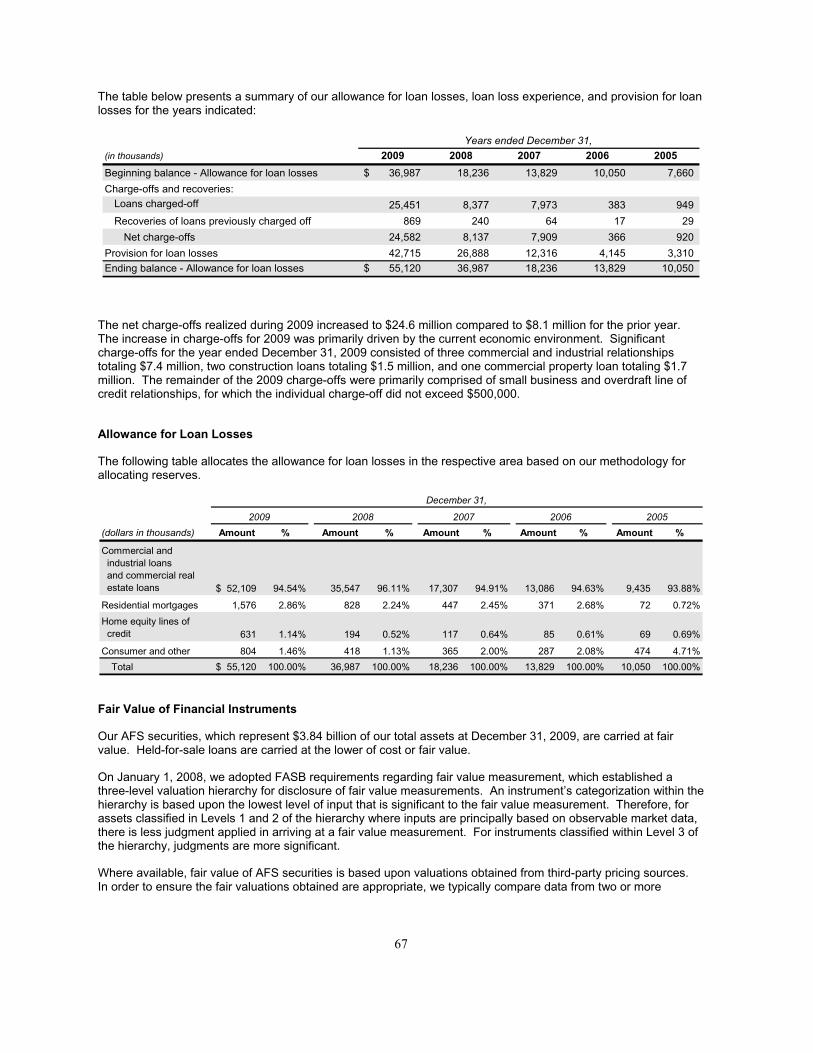
67
The table below presents a summary of our allowance for loan losses, loan loss experience, and provision for loan losses for the years indicated:
(in thousands) 2009 2008 2007 2006 2005
Beginning balance - Allowance for loan losses 36,987$ 18,236 13,829 10,050 7,660
Charge-offs and recoveries:Loans charged-off 25,451 8,377 7,973 383 949
Recoveries of loans previously charged off 869 240 64 17 29
Net charge-offs 24,582 8,137 7,909 366 920
Provision for loan losses 42,715 26,888 12,316 4,145 3,310 Ending balance - Allowance for loan losses 55,120$ 36,987 18,236 13,829 10,050
Years ended December 31,
The net charge-offs realized during 2009 increased to $24.6 million compared to $8.1 million for the prior year. The increase in charge-offs for 2009 was primarily driven by the current economic environment. Significant charge-offs for the year ended December 31, 2009 consisted of three commercial and industrial relationships totaling $7.4 million, two construction loans totaling $1.5 million, and one commercial property loan totaling $1.7 million. The remainder of the 2009 charge-offs were primarily comprised of small business and overdraft line of credit relationships, for which the individual charge-off did not exceed $500,000.
Allowance for Loan Losses
The following table allocates the allowance for loan losses in the respective area based on our methodology for allocating reserves.
(dollars in thousands) Amount % Amount % Amount % Amount % Amount %
Commercial and industrial loans and commercial real estate loans 52,109$ 94.54% 35,547 96.11% 17,307 94.91% 13,086 94.63% 9,435 93.88%
Residential mortgages 1,576 2.86% 828 2.24% 447 2.45% 371 2.68% 72 0.72%
Home equity lines of credit 631 1.14% 194 0.52% 117 0.64% 85 0.61% 69 0.69%
Consumer and other 804 1.46% 418 1.13% 365 2.00% 287 2.08% 474 4.71%
Total 55,120$ 100.00% 36,987 100.00% 18,236 100.00% 13,829 100.00% 10,050 100.00%
2009
December 31,
20052008 2007 2006
Fair Value of Financial Instruments
Our AFS securities, which represent $3.84 billion of our total assets at December 31, 2009, are carried at fair value. Held-for-sale loans are carried at the lower of cost or fair value.
On January 1, 2008, we adopted FASB requirements regarding fair value measurement, which established a three-level valuation hierarchy for disclosure of fair value measurements. An instrument’s categorization within the hierarchy is based upon the lowest level of input that is significant to the fair value measurement. Therefore, for assets classified in Levels 1 and 2 of the hierarchy where inputs are principally based on observable market data, there is less judgment applied in arriving at a fair value measurement. For instruments classified within Level 3 of the hierarchy, judgments are more significant.
Where available, fair value of AFS securities is based upon valuations obtained from third-party pricing sources. In order to ensure the fair valuations obtained are appropriate, we typically compare data from two or more

68
independent third-party pricing sources. If there is a large price discrepancy between the two pricing sources for an individual security, we utilize industry market spread data to assist in determining the most appropriate valuation.
The valuations provided by the pricing services are derived from quoted market prices or using matrix pricing. Matrix pricing is a valuation technique consistent with the market approach of determining fair value. The market approach uses prices and other relevant information generated by market transactions involving identical or comparable assets. Matrix pricing is a mathematical technique used principally to value debt securities without relying exclusively on quoted prices of specific securities, but rather on the securities’ relationship to other benchmark quoted securities. Most of our securities portfolio is priced using this method.
Securities are classified within Level 3 of the valuation hierarchy in cases where there is limited activity or less transparency around inputs to the valuation. In these cases, we determine fair value based upon in-depth analysis of the cash flow structure and credit analysis for each position. Relative market spreads are utilized to discount the cash flow to determine current market values, as well as analysis of relative coverage ratios, credit enhancements, and collateral characteristics.
Our held-for-sale loans predominantly consist of variable rate SBA loans, which are fully guaranteed by the U.S. Government. Accordingly, the cost of these loans typically approximates fair value. We validate the fair value of these loans through our active market participation in the SBA secondary market, where we are one of the top market makers in the industry.
We believe our valuation methods are appropriate and consistent with other market participants; however, the use of different methodologies or assumptions to determine the fair value of certain financial instruments could result in a different estimate of fair value at the reporting date. For further discussion of the determination of fair value, see notes 3 and 24 to our Consolidated Financial Statements.
Contractual Obligations
The following table presents our significant contractual obligations as of December 31, 2009:
(in thousands)
Less than
1 year
1 - 3
years
3 - 5
years
More than
5 years Total
Information technology contract 3,378$ 7,169 1,902 - 12,449 Borrowings 293,900 360,000 175,000 180,000 1,008,900Operating leases 10,633 21,840 21,966 24,824 79,263
Total contractual cash obligations 307,911$ 389,009 198,868 204,824 1,100,612
Payments due by period
Off-Balance Sheet Arrangements
In the normal course of business, we have various outstanding commitments and contingent liabilities that are not reflected in the accompanying Consolidated Financial Statements.
We enter into transactions that involve financial instruments with off-balance sheet risks in the ordinary course of business to meet the financing needs of our clients. Such financial instruments include commitments to extend credit, standby letters of credit, and unused balances under confirmed letters of credit, all of which are primarily variable rate. Such instruments involve, to varying degrees, elements of credit and interest rate risk.
Our exposure to credit loss in the event of nonperformance by the other party with regard to financial instruments is represented by the contractual notional amount of those instruments. Financial instrument transactions are subject to our normal credit policies and approvals, financial controls and risk limiting and monitoring procedures. We generally require collateral or other security to support financial instruments with credit risk.

69
A summary of commitments and contingent liabilities as of December 31, 2009 and 2008 is as follows:
(in thousands) 2009 2008
Unused commitments to extend credit 519,102$ 554,627 Financial standby letters of credit 193,342 214,862 Commercial and similar letters of credit 15,808 10,605 Other 732 677
Total 728,984$ 780,771
December 31,
Commitments to extend credit consist of agreements having fixed expiration or other termination clauses and may require payment of a fee. Total commitment amounts may not necessarily represent future cash requirements. We evaluate each client's creditworthiness on a case-by-case basis. Upon the extension of credit, we will obtain collateral, if necessary, based on our credit evaluation of the counterparty. Collateral held varies but may include deposits held in financial institutions, commercial properties, residential properties, accounts receivable, property, plant and equipment and inventory.
We recognize a liability at the inception of the guarantee that is equivalent to the fee received from the guarantor. This liability is amortized to income over the term of the guarantee on a straight-line basis. At December 31, 2009 and December 31, 2008, we had deferred revenue for commitment fees paid for the issuance of standby letters of credit in the amounts of $639,000 and $618,000, respectively.
Standby letters of credit are conditional commitments issued by us to guarantee the performance of a client’s obligation to a third party. Standby letters of credit are primarily used to support clients' business trade transactions and may require payment of a fee. The credit risk involved in issuing letters of credit is essentially the same as that involved in extending loan facilities to clients. During 2009, based on a review of relevant factors, we established a liability for credit losses on standby letters of credit, which as of December 31, 2009, was $326,000. There was no such liability at December 31, 2008.
At December 31, 2009 and 2008, we had commitments to sell residential mortgage loans and the U.S. government-guaranteed portion of SBA loans of $1.3 million and $2.3 million, respectively.
Capital Resources
As a New York state-chartered bank, we are required to maintain minimum levels of regulatory capital. These standards generally are as stringent as the comparable capital requirements imposed on national banks. The FDIC is also authorized to impose capital requirements in excess of these standards on individual banks on a case-by-case basis.
We are required by FDIC regulations to maintain a minimum ratio of qualifying total capital to total risk-weighted assets (including off-balance sheet items) of 8%, at least one-half of which must be in the form of Tier 1 capital, and a ratio of Tier 1 capital to total risk-weighted assets of 4%. Tier 1 capital is generally defined as the sum of core capital elements less goodwill and certain other deductions. Core capital includes common shareholders’ equity, non-cumulative perpetual preferred stock and minority interests in equity accounts of consolidated subsidiaries. Supplementary capital, which qualifies as Tier 2 capital and counts towards total capital subject to certain limits, includes allowances for loan losses, perpetual preferred stock, subordinated debt and certain hybrid instruments.
We are also required to maintain a certain leverage capital ratio - the ratio of Tier 1 capital (net of intangibles) to adjusted total assets. Banks that have received the highest rating of five categories used by regulators to rate banks and are not anticipating or experiencing any significant growth must maintain a leverage capital ratio of at least 3.0%. All other institutions must maintain a minimum leverage capital ratio of 4.0%.
For an institution to be considered “well capitalized” by the FDIC, it must maintain a minimum leverage capital ratio of 5.0% and a minimum risk-based capital ratio of 10.0%, of which at least 6.0% must be Tier 1 capital.
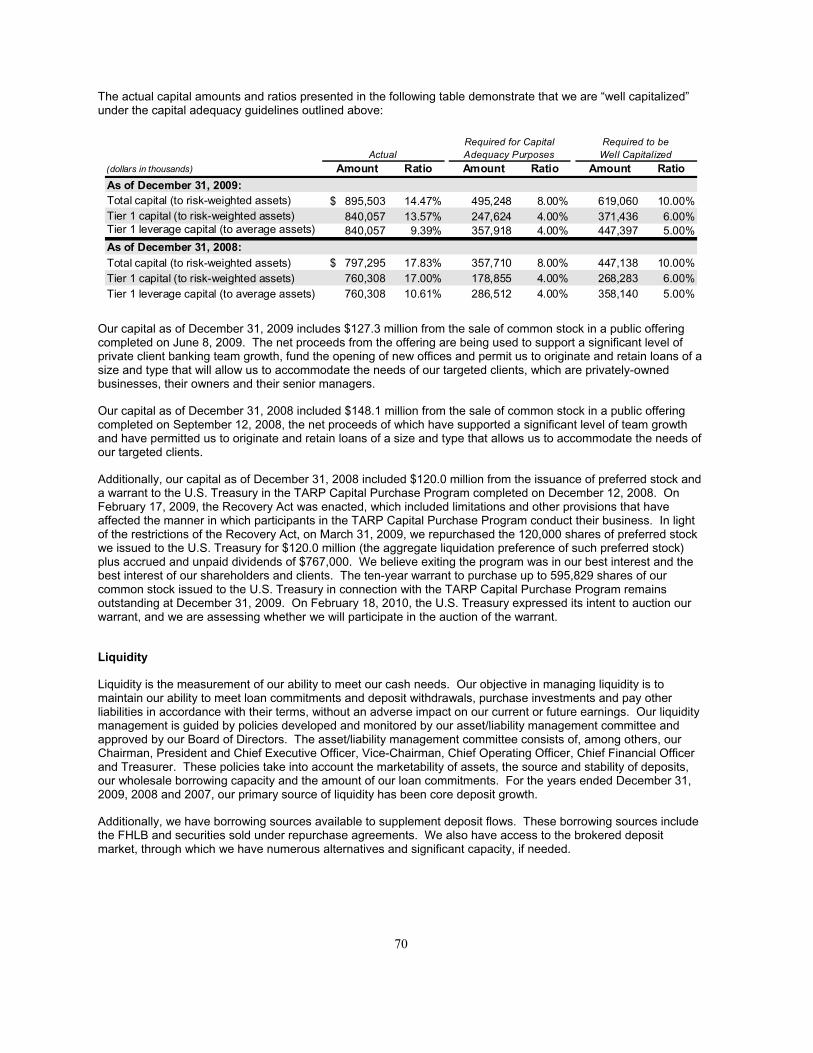
70
The actual capital amounts and ratios presented in the following table demonstrate that we are “well capitalized” under the capital adequacy guidelines outlined above:
(dollars in thousands) Amount Ratio Amount Ratio Amount Ratio
As of December 31, 2009:
Total capital (to risk-weighted assets) 895,503$ 14.47% 495,248 8.00% 619,060 10.00%Tier 1 capital (to risk-weighted assets) 840,057 13.57% 247,624 4.00% 371,436 6.00%Tier 1 leverage capital (to average assets) 840,057 9.39% 357,918 4.00% 447,397 5.00%
As of December 31, 2008:
Total capital (to risk-weighted assets) 797,295$ 17.83% 357,710 8.00% 447,138 10.00%Tier 1 capital (to risk-weighted assets) 760,308 17.00% 178,855 4.00% 268,283 6.00%Tier 1 leverage capital (to average assets) 760,308 10.61% 286,512 4.00% 358,140 5.00%
ActualRequired for Capital Adequacy Purposes
Required to beWell Capitalized
Our capital as of December 31, 2009 includes $127.3 million from the sale of common stock in a public offering completed on June 8, 2009. The net proceeds from the offering are being used to support a significant level of private client banking team growth, fund the opening of new offices and permit us to originate and retain loans of a size and type that will allow us to accommodate the needs of our targeted clients, which are privately-owned businesses, their owners and their senior managers.
Our capital as of December 31, 2008 included $148.1 million from the sale of common stock in a public offering completed on September 12, 2008, the net proceeds of which have supported a significant level of team growth and have permitted us to originate and retain loans of a size and type that allows us to accommodate the needs of our targeted clients.
Additionally, our capital as of December 31, 2008 included $120.0 million from the issuance of preferred stock and a warrant to the U.S. Treasury in the TARP Capital Purchase Program completed on December 12, 2008. On February 17, 2009, the Recovery Act was enacted, which included limitations and other provisions that have affected the manner in which participants in the TARP Capital Purchase Program conduct their business. In light of the restrictions of the Recovery Act, on March 31, 2009, we repurchased the 120,000 shares of preferred stock we issued to the U.S. Treasury for $120.0 million (the aggregate liquidation preference of such preferred stock) plus accrued and unpaid dividends of $767,000. We believe exiting the program was in our best interest and the best interest of our shareholders and clients. The ten-year warrant to purchase up to 595,829 shares of our common stock issued to the U.S. Treasury in connection with the TARP Capital Purchase Program remains outstanding at December 31, 2009. On February 18, 2010, the U.S. Treasury expressed its intent to auction our warrant, and we are assessing whether we will participate in the auction of the warrant.
Liquidity
Liquidity is the measurement of our ability to meet our cash needs. Our objective in managing liquidity is to maintain our ability to meet loan commitments and deposit withdrawals, purchase investments and pay other liabilities in accordance with their terms, without an adverse impact on our current or future earnings. Our liquidity management is guided by policies developed and monitored by our asset/liability management committee and approved by our Board of Directors. The asset/liability management committee consists of, among others, our Chairman, President and Chief Executive Officer, Vice-Chairman, Chief Operating Officer, Chief Financial Officer and Treasurer. These policies take into account the marketability of assets, the source and stability of deposits, our wholesale borrowing capacity and the amount of our loan commitments. For the years ended December 31, 2009, 2008 and 2007, our primary source of liquidity has been core deposit growth.
Additionally, we have borrowing sources available to supplement deposit flows. These borrowing sources include the FHLB and securities sold under repurchase agreements. We also have access to the brokered deposit market, through which we have numerous alternatives and significant capacity, if needed.

71
Credit availability at the FHLB is based on our financial condition, asset size, and the amount of collateral we hold at the FHLB. At December 31, 2009, our FHLB borrowings included $305.0 million in advances with an average rate of 3.42% that mature by September 1, 2017.
Also, we have repurchase agreement lines with several leading financial institutions totaling $1.46 billion. At December 31, 2009, we had $627.0 million of securities sold under repurchase agreements to five of these institutions.
Based on our financial condition, our asset size, the available capacity under our repurchase agreement lines and with the FHLB, and the amount of securities available for pledging, we estimate our available consolidated capacity for additional borrowings to be approximately $2.02 billion at December 31, 2009.

72
ITEM 7A. QUANTITATIVE AND QUALITATIVE DISCLOSURES ABOUT MARKET RISK
Market risk is defined as the sensitivity of income, fair values and capital to changes in interest rates, foreign currency exchange rates, commodity prices and other relevant market prices and rates. The primary risk to which we are exposed is interest rate movement inherent in our lending, investment management, deposit taking and borrowing activities. Substantially all of our interest rate risk arises from these activities, which are entered into for purposes other than trading.
The principal objective of asset/liability management is to manage the sensitivity of net income to changes in interest rates. Asset/liability management is governed by policies approved by our Board of Directors. Our Board of Directors has delegated the day-to-day oversight of this function to our asset/liability management committee. Senior management and our Board of Directors, on an ongoing basis, review our overall interest rate risk position and strategies.
Interest Rate Risk Management
Our asset/liability management committee seeks to manage our interest rate risk by structuring our balance sheet to maximize net interest income while maintaining an acceptable level of risk exposure to changes in market interest rates. The achievement of this goal requires a balance among liquidity, interest rate risk, and profitability considerations. The committee meets regularly to review the sensitivity of assets and liabilities to interest rate changes, deposit rates and trends, the book and market values of assets and liabilities, unrealized gains and losses, purchase and sales activities, and the maturities of investments and borrowings.
We use various asset/liability strategies to manage and control the interest rate sensitivity of our assets and liabilities. These strategies include pricing of loans and deposit products, adjusting the terms of loans and borrowings and managing the deployment of our securities and short-term assets to reduce or increase the mismatches in interest rate re-pricing.
To effectively measure and manage interest rate risk, we use simulation analysis to determine the impact on net interest income under various interest rate scenarios. Based on these simulations, we quantify interest rate risk and develop and implement appropriate strategies. At December 31, 2009, we used a simulation model to analyze net interest income sensitivity to a parallel and sustained shift in interest rates derived from the current treasury and LIBOR yield curves, in which the base market interest rate forecast was increased by 100, 200, and 300 basis points. Given the current low interest rate environment, including the Federal Funds rate and other short-term interest rates, we did not analyze net interest income sensitivity to a downward market interest rate forecast.
The following table indicates the sensitivity of projected annualized net interest income to the interest rate movements described above at December 31, 2009:
(dollars in thousands)
Adjusted Net
Interest Income
Percentage
Change from Base
Interest Rate Scenario:
Up 300 basis points 324,144$ 3.48Up 200 basis points 323,505 3.27Up 100 basis points 325,656 3.96Base 313,256 -
We also use a simulation model to measure the impact that market interest rate changes will have on the net present value of assets and liabilities, which is defined as market value of equity. At December 31, 2009, we used a simulation model to analyze the market value of equity sensitivity to a parallel and sustained shift in interest rates derived from the current treasury and LIBOR yield curves. For rising interest rate scenarios, the base market interest rate forecast was increased by 100, 200, and 300 basis points. Given the current low interest rate environment, including the Federal Funds rate and other short-term interest rates, we did not analyze the market value of equity sensitivity to a downward market interest rate forecast.

73
The following table indicates the sensitivity of market value of equity to the interest rate movements described above:
(dollars in thousands) Sensitivity
Percentage Change
from Base
Interest Rate Scenario:
Up 300 basis points (292,551)$ (29.03)Up 200 basis points (197,782) (19.62)Up 100 basis points (89,328) (8.86)Base - -
The market value of equity sensitivity analysis assumes an immediate parallel shift in interest rates and yield curves. All results are within parameters approved by our Board of Directors. When compared to prior years, the higher percentage changes from base seen in the rising interest rate scenarios at December 31, 2009 reflect the absolute change in rates to the current low interest rate environment.
The computation of prospective effects of hypothetical interest rate changes is based on numerous assumptions, including relative levels of interest rates, asset prepayments, deposit decay and changes in re-pricing levels of deposits to general market rates, and should not be relied upon as indicative of actual results. Further, the computations do not take into account any actions that we may undertake in response to future changes in interest rates.
ITEM 8. FINANCIAL STATEMENTS AND SUPPLEMENTARY DATA
For our Consolidated Financial Statements, see index on page F-1.
ITEM 9. CHANGES IN AND DISAGREEMENTS WITH ACCOUNTANTS ON ACCOUNTING AND
FINANCIAL DISCLOSURE
None.
ITEM 9A. CONTROLS AND PROCEDURES
The Company’s management, with the participation of the Company’s Chief Executive Officer and Chief Financial Officer, has evaluated the effectiveness of the Company’s disclosure controls and procedures (as such term is defined in Rules 13a-15(e) and 15d-15(e) under the Securities Exchange Act of 1934, as amended (the ‘‘Exchange Act’’)) as of the end of the period covered by this report. Based on such evaluation, the Company’s Chief Executive Officer and Chief Financial Officer have concluded that, as of the end of such period, the Company’s disclosure controls and procedures are effective in recording, processing, summarizing and reporting, on a timely basis, information required to be disclosed by the Company in the reports that it files or submits under the Exchange Act, including this report.

74
a) Management’s Report on Internal Control over Financial Reporting
The management of Signature Bank (the “Company”) is responsible for establishing and maintaining effective internal control over financial reporting. Our system of internal control is a process designed to provide reasonable assurance regarding the reliability of financial reporting and the preparation of the Company’s consolidated financial statements for external reporting purposes in accordance with U.S. generally accepted accounting principles.
Internal control over financial reporting includes procedures that pertain to the maintenance of records that, in reasonable detail, accurately reflect transactions and dispositions of assets; provide reasonable assurances that transactions are recorded to permit preparation of financial statements in accordance with U.S. generally accepted accounting principles, and that receipts and expenditures are made only in accordance with the authorization of management and the Board of Directors; and provide reasonable assurance regarding prevention or timely detection of unauthorized acquisition, use, or disposition of the Company’s assets that could have a material effect on our consolidated financial statements.
All internal control systems, no matter how well designed, have inherent limitations, including the possibility of human error and the circumvention of controls. Furthermore, because of changes in conditions, the effectiveness of internal control may vary over time. Accordingly, internal control over financial reporting may not prevent or detect misstatements on a timely basis. Since these limitations are known features of the financial reporting process, however, it is possible to design into the process safeguards to reduce, though not eliminate, this risk.
As of December 31, 2009, management evaluated the effectiveness of internal control over financial reporting based on the framework in Internal Control—Integrated Framework issued by the Committee of Sponsoring Organizations of the Treadway Commission (COSO). Based on this evaluation, management believes that the Company’s internal control over financial reporting as of December 31, 2009 is effective using these criteria.
Management’s evaluation of the effectiveness of internal control over financial reporting as of December 31, 2009 has been audited by KPMG LLP, an independent registered public accounting firm that has also audited the Company’s consolidated financial statements as of and for the year ended December 31, 2009.

75
b) Report of Independent Registered Public Accounting Firm
The Board of Directors and Stockholders Signature Bank and subsidiaries:
We have audited Signature Bank and subsidiaries’ internal control over financial reporting as of December 31, 2009, based on criteria established in Internal Control – Integrated Framework issued by the Committee of Sponsoring Organizations of the Treadway Commission (COSO). Signature Bank and subsidiaries’ management is responsible for maintaining effective internal control over financial reporting and for its assessment of the effectiveness of internal control over financial reporting, included in the accompanying Management’s Report on Internal Control over Financial Reporting. Our responsibility is to express an opinion on the Signature Bank and subsidiaries’ internal control over financial reporting based on our audit.
We conducted our audit in accordance with the standards of the Public Company Accounting Oversight Board (United States). Those standards require that we plan and perform the audit to obtain reasonable assurance about whether effective internal control over financial reporting was maintained in all material respects. Our audit included obtaining an understanding of internal control over financial reporting, assessing the risk that a material weakness exists, and testing and evaluating the design and operating effectiveness of internal control based on the assessed risk. Our audit also included performing such other procedures as we considered necessary in the circumstances. We believe that our audit provides a reasonable basis for our opinion.
A company’s internal control over financial reporting is a process designed to provide reasonable assurance regarding the reliability of financial reporting and the preparation of financial statements for external purposes in accordance with generally accepted accounting principles. A company’s internal control over financial reporting includes those policies and procedures that (1) pertain to the maintenance of records that, in reasonable detail, accurately and fairly reflect the transactions and dispositions of the assets of the company; (2) provide reasonable assurance that transactions are recorded as necessary to permit preparation of financial statements in accordance with generally accepted accounting principles, and that receipts and expenditures of the company are being made only in accordance with authorizations of management and directors of the company; and (3) provide reasonable assurance regarding prevention or timely detection of unauthorized acquisition, use, or disposition of the company’s assets that could have a material effect on the financial statements.
Because of its inherent limitations, internal control over financial reporting may not prevent or detect misstatements. Also, projections of any evaluation of effectiveness to future periods are subject to the risk that controls may become inadequate because of changes in conditions, or that the degree of compliance with the policies or procedures may deteriorate.
In our opinion, Signature Bank and subsidiaries maintained, in all material respects, effective internal control over financial reporting as of December 31, 2009, based on criteria established in Internal Control – Integrated Framework issued by the Committee of Sponsoring Organizations of the Treadway Commission.
We also have audited, in accordance with the standards of the Public Company Accounting Oversight Board (United States), the consolidated statements of financial condition of Signature Bank and subsidiaries as of December 31, 2009 and 2008, and the related consolidated statements of operations, changes in shareholders’ equity, and cash flows for each of the years in the three-year period ended December 31, 2009, and our report dated February 26, 2010 expressed an unqualified opinion on those consolidated financial statements.
(signed) KPMG LLP
New York, New York February 26, 2010

76
ITEM 9B. OTHER INFORMATION
None.
PART III
ITEM 10. DIRECTORS, EXECUTIVE OFFICERS AND CORPORATE GOVERNANCE
Incorporated by reference to Signature Bank’s Proxy Statement for the Annual Meeting of Stockholders to be held April 21, 2010.
ITEM 11. EXECUTIVE COMPENSATION
Incorporated by reference to Signature Bank’s Proxy Statement for the Annual Meeting of Stockholders to be held April 21, 2010.
ITEM 12. SECURITY OWNERSHIP OF CERTAIN BENEFICIAL OWNERS AND MANAGEMENT
AND RELATED STOCKHOLDER MATTERS
Incorporated by reference to Signature Bank’s Proxy Statement for the Annual Meeting of Stockholders to be held April 21, 2010.
ITEM 13. CERTAIN RELATIONSHIPS AND RELATED TRANSACTIONS, AND DIRECTOR
INDEPENDENCE
Incorporated by reference to Signature Bank’s Proxy Statement for the Annual Meeting of Stockholders to be held April 21, 2010.
ITEM 14. PRINCIPAL ACCOUNTING FEES AND SERVICES
Incorporated by reference to Signature Bank’s Proxy Statement for the Annual Meeting of Stockholders to be held April 21, 2010.

77
PART IV
ITEM 15. EXHIBITS, FINANCIAL STATEMENT SCHEDULES
A. Financial Statements and Financial Statement Schedules
(1) The Consolidated Financial Statements of the Registrant are listed and filed as part of this report on pages F-1 to F-40. The Index to the Consolidated Financial Statements appears on page F-1.
(2) Financial Statement Schedules: All schedule information is included in the notes to the Audited Consolidated Financial Statements or is omitted because it is either not required or not applicable.
B. Exhibit Listing
Exhibit No. Exhibit
3.1 Restated Organization Certificate. (Incorporated by reference to Signature Bank’s Quarterly Report on Form 10-Q for the period ended June 30, 2005.)
3.2 Certificate of Amendment, dated December 5, 2008, to the Bank's Restated Organization Certificate with respect to Signature Bank’s Fixed Rate Non-Cumulative Perpetual Preferred Stock, Series A, par value $0.01 per share. (Incorporated by reference to Signature Bank’s Current Report on Form 8-K filed on December 17, 2008.)
3.3 Amended and Restated By-laws of the Registrant. (Incorporated by reference to Signature Bank’s Current Report on Form 8-K filed on October 17, 2007.)
4.1 Specimen Common Stock Certificate. (Incorporated by reference to Signature Bank’s Registration Statement on Form 10 or amendments thereto, filed with the Federal Deposit Insurance Corporation on March 17, 2004.)
4.2 Form of Warrant to Purchase Common Stock. (Incorporated by reference to Signature Bank’s Current Report on Form 8-K filed on December 17, 2008.)
10.1 Signature Bank Amended and Restated 2004 Long-Term Incentive Plan. (Incorporated by reference from Appendix A to the 2008 Definitive Proxy Statement on Schedule 14A, filed with the Federal Deposit Insurance Corporation on March 19, 2008.)
10.2 Amended and Restated Signature Bank Change of Control Plan. (Incorporated by reference to Signature Bank’s Current Report on Form 8-K, filed with the Federal Deposit Insurance Corporation on September 19, 2007.)
10.3 Outsourcing Agreement, dated January 1, 2004, by and between Bank Hapoalim, Signature Bank and Signature Securities. (Incorporated by reference to Signature Bank’s Registration Statement on Form 10 or amendments thereto, filed with the Federal Deposit Insurance Corporation on March 17, 2004.)
10.4 Networking Agreement, effective as of April 18, 2001, between Signature Securities and Signature Bank. (Incorporated by reference to Signature Bank’s Registration Statement on Form 10 or amendments thereto, filed with the Federal Deposit Insurance Corporation on March 17, 2004.)
10.5 Signature Securities Group Corporation Customer Agreement, effective as of May 31, 2003, between Bank Hapoalim and Signature Securities. (Incorporated by reference to Signature Bank’s Registration Statement on Form 10 or amendments thereto, filed with the Federal Deposit Insurance Corporation on March 17, 2004.)
10.6 Signature Securities Group Corporation Customer Agreement, dated April 25, 2003, between Bank Hapoalim and Signature Securities. (Incorporated by reference to Signature Bank’s Registration Statement on Form 10 or amendments thereto, filed with the Federal Deposit Insurance Corporation on March 17, 2004.)
10.7 Brokerage and Consulting Agreement, dated August 6, 2001, by and between Signature Bank and Signature Securities. (Incorporated by reference to Signature Bank’s Registration Statement on Form 10 or amendments thereto, filed with the Federal Deposit Insurance Corporation on March 17, 2004.)

78
Exhibit No. Exhibit
10.10 Lease for 1225 Franklin Avenue, dated April 5, 2002, between Franklin Avenue Plaza LLC and Signature Bank. (Incorporated by reference to Signature Bank’s Registration Statement on Form 10 or amendments thereto, filed with the Federal Deposit Insurance Corporation on March 17, 2004.)
10.11 Sublease for 1177 Avenue of the Americas, dated as of April 4, 2001, by and between Bank Hapoalim and Signature Bank. (Incorporated by reference to Signature Bank’s Registration Statement on Form 10 or amendments thereto, filed with the Federal Deposit Insurance Corporation on March 17, 2004.)
10.13 Employment Agreement, dated March 22, 2004, between Signature Bank and Joseph J. DePaolo. (Incorporated by reference to Signature Bank’s Registration Statement on Form 10 or amendments thereto, filed with the Federal Deposit Insurance Corporation on March 17, 2004.)
10.14 Master Agreement for the provision of Hardware Software and/or Services, dated as of September 9, 2005, between Fidelity Information Services, Inc. and Signature Bank. (Incorporated by reference to Signature Bank’s Quarterly Report on Form 10-Q for the period ended September 30, 2005.)
10.15 Letter Agreement, dated December 12, 2008, including Securities Purchase Agreement—Standard Terms incorporated by reference therein, between the Signature Bank and the United States Department of the Treasury. (Incorporated by reference to Signature Bank’s Current Report on Form 8-K filed on December 17, 2008.)
10.16 Side Letter, dated December 12, 2008, between the Signature Bank and the United States Department of the Treasury. (Incorporated by reference to Signature Bank’s Current Report on Form 8-K filed on December 17, 2008.)
10.17 Form of Senior Executive Officer Letter Agreement between the Signature Bank and the Senior Executive Officer. (Incorporated by reference to Signature Bank’s Current Report on Form 8-K filed on December 17, 2008.)
10.18 Form of Waiver from the Senior Executive Officer named therein. (Incorporated by reference to Signature Bank’s Current Report on Form 8-K filed on December 17, 2008.)
14.1 Code of Ethics (Incorporated by reference from Signature Bank’s 2004 Form 10-K, filed with the Federal Deposit Insurance Corporation on March 16, 2005.)
21.1 Subsidiaries of Signature Bank.
31.1 Certification of the Chief Executive Officer pursuant to Section 302 of the Sarbanes-Oxley Act of 2002.
31.2 Certification of the Chief Financial Officer pursuant to Section 302 of the Sarbanes-Oxley Act of 2002.
32.1 Certification of the Chief Executive Officer and Chief Financial Officer pursuant to Section 906 of the Sarbanes-Oxley Act of 2002.

79
SIGNATURES
Pursuant to the requirements of Section 13 or 15(d) of the Securities Exchange Act of 1934, the registrant has duly caused this report to be signed on its behalf by the undersigned, thereunto duly authorized.
SIGNATURE BANK
By: /s/ JOSEPH J. DEPAOLOJoseph J. DePaolo President, Chief Executive Officer and Director
Date: February 26, 2010
Pursuant to the requirements of the Securities Exchange Act of 1934, this report has been signed below on February 26, 2010 by the following persons on behalf of the registrant in the capacities indicated.
Signature Title
/s/ SCOTT A. SHAY Chairman of the Board of Directors (Scott A. Shay)
/s/ JOHN TAMBERLANE Vice Chairman, Director (John Tamberlane)
/s/ ERIC R. HOWELL Executive Vice President and Chief Financial Officer (Eric R. Howell) (Principal Accounting and Financial Officer)
/s/ KATHRYN A. BYRNE Director(Kathryn A. Byrne)
/s/ ALFONSE M. D’AMATO Director (Alfonse M. D’Amato)
/s/ ALFRED B. DELBELLO Director(Alfred B. DelBello)
/s/ YACOV LEVY Director(Yacov Levy)
/s/ JEFFREY W. MESHEL Director(Jeffrey W. Meshel)
/s/ FRANK SELVAGGI Director(Frank Selvaggi)

(This page has been left blank intentionally.)

F-1
INDEX TO CONSOLIDATED FINANCIAL STATEMENTS
Report of Independent Registered Public Accounting Firm . . . . . . . . . . . . . . . . . . . . . . . . . . . . . . . . . . . . . . . F-2
Consolidated Statements of Financial Condition as of December 31, 2009 and 2008 . . . . . . . . . . . . . . . . . . F-3
Consolidated Statements of Operations for the years ended December 31, 2009, 2008, and 2007. . . . . . . F-4
Consolidated Statements of Changes in Shareholders’ Equity for the years ended December 31, 2009, 2008, and 2007 . . . . . . . . . . . . . . . . . . . . . . . . . . . . . . . . . . . . . . . . . . . . . . . . . . . . . . . . . . . . . . . . . . . . . . . . F-5
Consolidated Statements of Cash Flows for the years ended December 31, 2009, 2008, and 2007 . . . . . . F-6
Notes to Consolidated Financial Statements . . . . . . . . . . . . . . . . . . . . . . . . . . . . . . . . . . . . . . . . . . . . . . . . . . . F-7

F-2
Report of Independent Registered Public Accounting Firm
The Board of Directors and Stockholders Signature Bank:
We have audited the accompanying consolidated statements of financial condition of Signature Bank and subsidiaries (Signature Bank) as of December 31, 2009 and 2008, and the related consolidated statements of operations, changes in shareholders’ equity, and cash flows for each of the years in the three-year period ended December 31, 2009. These consolidated financial statements are the responsibility of the Signature Bank’s management. Our responsibility is to express an opinion on these consolidated financial statements based on our audits.
We conducted our audits in accordance with the standards of the Public Company Accounting Oversight Board (United States). Those standards require that we plan and perform the audit to obtain reasonable assurance about whether the financial statements are free of material misstatement. An audit includes examining, on a test basis, evidence supporting the amounts and disclosures in the financial statements. An audit also includes assessing the accounting principles used and significant estimates made by management, as well as evaluating the overall financial statement presentation. We believe that our audits provide a reasonable basis for our opinion.
In our opinion, the consolidated financial statements referred to above present fairly, in all material respects, the financial position of Signature Bank and subsidiaries as of December 31, 2009 and 2008, and the results of their operations and their cash flows for each of the years in the three-year period ended December 31, 2009, in conformity with U.S. generally accepted accounting principles.
As discussed in note 4 to the consolidated financial statements, Signature Bank changed its method of evaluating other-than-temporary impairments of debt securities due to the adoption of new accounting requirements issued by the FASB, as of April 1, 2009.
We also have audited, in accordance with the standards of the Public Company Accounting Oversight Board (United States), Signature Bank’s internal control over financial reporting as of December 31, 2009, based on criteria established in Internal Control - Integrated Framework issued by the Committee of Sponsoring Organizations of the Treadway Commission (COSO), and our report dated February 26, 2010 expressed an unqualified opinion on the effectiveness of the Company’s internal control over financial reporting.
(signed) KPMG LLP
New York, New York February 26, 2010

See accompanying notes to Consolidated Financial Statements.
F-3
SIGNATURE BANK
CONSOLIDATED STATEMENTS OF FINANCIAL CONDITION
(dollars in thousands, except per share amounts) 2009 2008
ASSETS
Cash and due from banks 95,746$ 111,927 Short-term investments 12,603 4,330
Total cash and cash equivalents 108,349 116,257Securities available-for-sale (pledged $1,584,371 and $1,812,790 at
December 31, 2009 and 2008) 3,837,583 2,906,059Securities held-to-maturity (fair value $290,608 and $230,539 at
December 31, 2009 and 2008; pledged $194,336 and $147,392 atDecember 31, 2009 and 2008) 295,984 236,531
Federal Home Loan Bank stock 23,906 18,411Loans held for sale 293,207 217,680Loans, net 4,320,978 3,433,555Premises and equipment, net 31,802 33,221Accrued interest and dividends receivable 43,193 36,326Other assets 191,110 194,159
Total assets 9,146,112$ 7,192,199
LIABILITIES AND SHAREHOLDERS' EQUITY
DepositsNon-interest-bearing 1,969,734 1,563,407Interest-bearing 5,252,812 3,824,479
Total deposits 7,222,546 5,387,886Federal funds purchased and securities sold under agreements
to repurchase 697,000 785,000Federal Home Loan Bank advances 305,000 260,000Other short-term borrowings 6,900 4,900Accrued expenses and other liabilities 111,007 56,278
Total liabilities 8,342,453 6,494,064Shareholders’ equityPreferred stock, par value $.01 per share; 61,000,000 shares authorized; none
issued at December 31, 2009; 120,000 shares with $1,000 liquidation valueissued and outstanding at December 31, 2008, net of discount - 109,314
Common stock, par value $.01; 64,000,000 shares authorized;40,619,557 and 35,244,946 shares issued and outstanding at December 31, 2009 and 2008 406 352
Additional paid-in capital 668,441 534,458Retained earnings 171,464 116,707 Net unrealized depreciation on securities available-for-sale, net of tax (36,652) (62,696)
Total shareholders' equity 803,659 698,135Total liabilities and shareholders' equity 9,146,112$ 7,192,199
December 31,

See accompanying notes to Consolidated Financial Statements.
F-4
SIGNATURE BANK
CONSOLIDATED STATEMENTS OF OPERATIONS
(dollars in thousands, except per share amounts) 2009 2008 2007
INTEREST AND DIVIDEND INCOME
Loans held for sale 2,786$ 5,596 5,341Loans, net 213,357 160,147 134,240Securities available-for-sale 157,228 141,441 141,710Securities held-to-maturity 11,401 13,153 15,624Other short-term investments 1,363 3,127 4,690
Total interest income 386,135 323,464 301,605
INTEREST EXPENSE
Deposits 85,398 87,750 115,959Federal funds purchased and securities sold under
agreements to repurchase 27,921 28,867 27,543
Federal Home Loan Bank advances 10,420 11,384 10,215Other short-term borrowings 1 192 1,098
Total interest expense 123,740 128,193 154,815Net interest income before provision for loan losses 262,395 195,271 146,790Provision for loan losses 42,715 26,888 12,316Net interest income after provision for loan losses 219,680 168,383 134,474
NON-INTEREST INCOME
Commissions 9,572 19,941 12,699Fees and service charges 13,280 13,749 12,288Net gains on sales of securities 8,683 6,876 168
Net gains on sales of loans 3,648 1,439 2,599Other-than-temporary impairment losses on securities (23,396) (16,543) (21,404)
Portion of loss recognized in other comprehensive income (before taxes) 22,074 - -
Net impairment losses on securities recognized in earnings (1,322) (16,543) (21,404)Trading loss (1,009) (54) - Other income 1,780 2,237 2,396
Total non-interest income 34,632 27,645 8,746
NON-INTEREST EXPENSE
Salaries and benefits 86,836 73,888 59,464Occupancy and equipment 14,042 13,304 10,452Other general and administrative 49,007 36,628 29,146
Total non-interest expense 149,885 123,820 99,062
Income before income taxes 104,427 72,208 44,158Income tax expense 41,701 28,849 16,879Net income 62,726 43,359 27,279Dividends on preferred stock and related discount accretion (1) 12,203 390 - Net income available to common shareholders 50,523$ 42,969 27,279
PER COMMON SHARE DATA
Earnings per share – basic (1) 1.32$ 1.37 0.92Earnings per share – diluted (1) 1.30$ 1.35 0.91
(1)
Years ended December 31,
The year ended December 31, 2009 includes the negative effect of the $10.2 million deemed dividend associated withthe difference between the redemption payment and the carrying value of the preferred stock repurchased from theUnited States Department of the Treasury. See note 21 for further discussion.

See accompanying notes to Consolidated Financial Statements.
F-5
SIGNATURE BANK
CONSOLIDATED STATEMENTS OF CHANGES IN SHAREHOLDERS' EQUITY
(in thousands)
Preferred
stock Common stock
Additional
paid-in
capital
Retained
earnings
Accumulated
other
comprehensive
loss
Total
shareholders'
equity
Balance at December 31, 2006 -$ 296 366,715 46,163 (20,576) 392,598
Stock options activity, net - 1 1,475 - - 1,476
Restricted stock activity, net - - 1,949 - - 1,949
Comprehensive income:
Net income - - - 27,279 - 27,279 Net change in unrealized depreciation on securities available-for-sale, net of tax - - - - 2,454 2,454
Total comprehensive income 29,733
Balance at December 31, 2007 -$ 297 370,139 73,442 (18,122) 425,756
109,314 - 10,516 (90) - 119,740
Common stock issued - 54 148,022 - - 148,076
Stock options activity, net - - 1,692 - - 1,692
Restricted stock activity, net - 1 4,089 - - 4,090
Other - - - (4) - (4)
Comprehensive loss:
Net income - - - 43,359 - 43,359 Net change in unrealized depreciation on securities available-for-sale, net of tax - - - - (44,574) (44,574)
Total comprehensive loss (1,215)
Balance at December 31, 2008 109,314$ 352 534,458 116,707 (62,696) 698,135
- - - 4,539 (4,539) -
Redemption of preferred stock (TARP) (120,000) - (95) - - (120,095)
10,232 - - (10,232) - -
- - - (1,817) - (1,817)
454 - - (454) - -
Common stock issued - 52 127,278 - - 127,330
Stock options activity, net - - 1,465 - - 1,465
Restricted stock activity, net - 2 5,335 - 5,337
Other - - - (5) - (5)
Comprehensive income:
Net income - - - 62,726 - 62,726 Net change in unrealized depreciation on securities, net of tax - - - - 42,875 42,875
Other-than-temporary losses on securities available-for-sale related to noncredit factors, net of tax - - - - (12,292) (12,292)
Total comprehensive income 93,309
Balance at December 31, 2009 -$ 406 668,441 171,464 (36,652) 803,659
Amortization of discount on preferred stock (TARP)
Issuance of preferred stock and warrant and related discount accretion (TARP)
Deemed dividend on preferred stock (TARP)
Dividends on preferred stock (TARP)
Cumulative effect of change in accounting for securities impairment, net of tax

See accompanying notes to Consolidated Financial Statements.
F-6
SIGNATURE BANK
CONSOLIDATED STATEMENTS OF CASH FLOWS
(in thousands) 2009 2008 2007
CASH FLOWS FROM OPERATING ACTIVITIES
Net income 62,726$ 43,359 27,279
Depreciation and amortization 5,395 4,578 3,934
Provision for loan losses 42,715 26,888 12,316
Net impairment losses on securities recognized in earnings 1,322 16,543 21,404
Net amortization/accretion of premium/(discount) 36,318 29,282 20,324
Stock-based compensation expense 5,455 4,229 1,908
Net gains on sales of securities and loans (12,331) (8,315) (2,767)
Purchases and originations of loans held for sale (803,775) (533,102) (789,401)
Proceeds from sales and principal repayments of loans held for sale 636,980 464,760 703,787
Net increase in accrued interest and dividends receivable (6,529) (3,530) (3,458)
Deferred income tax benefit (8,460) (17,102) (11,825)
Net (increase) decrease in other assets (12,612) 64,986 (62,918)
Net increase (decrease) in accrued expenses and other liabilities 54,326 (34,783) 28,126
Net cash provided by (used in) operating activities 1,530 57,793 (51,291)
CASH FLOWS FROM INVESTING ACTIVITIES
Purchase of securities available-for-sale ("AFS") (2,112,128) (1,393,427) (922,356)
Proceeds from sales of securities AFS 378,442 599,587 139,257
923,271 599,886 629,324
Purchase of securities held-to-maturity ("HTM") (119,465) (73,652) (56,683)
59,227 175,761 106,392
(Purchase) redemption of Federal Home Loan Bank stock (5,495) (3,724) 2,274
Net increase in loans (930,138) (1,453,101) (455,869)
Net purchases of premises and equipment (3,976) (10,692) (8,820)
Net cash used in investing activities (1,810,262) (1,559,362) (566,481)
CASH FLOWS FROM FINANCING ACTIVITIES
Net increase (decrease) in non-interest-bearing deposits 406,327 264,839 (287,872)Net increase in interest-bearing deposits 1,428,333 611,157 588,603
Net increase in secured short-term borrowings 9,000 52,968 53,245
Proceeds from the issuance of long-term borrowings 95,000 190,000 440,000
Repayment of long-term borrowings (145,000) (10,000) (410,000)
Tax benefit from stock-based compensation 403 468 487
Issuance of common stock and exercise of options 128,677 149,629 1,517
Issuance of preferred stock and related warrant (TARP) - 119,740 -
Redemption of preferred stock (TARP) (120,095) - -
Dividends paid on preferred stock (TARP) (1,817) - -
Other (4) (4) -
Net cash provided by financing activities 1,800,824 1,378,797 385,980
Net decrease in cash and cash equivalents (7,908) (122,772) (231,792)Cash and cash equivalents at beginning of year 116,257 239,029 470,821
Cash and cash equivalents at end of year 108,349$ 116,257 239,029
Supplemental disclosures of cash flow information:Interest paid during the year 125,100$ 127,273 154,218
Income taxes paid during the year 47,326 41,251 28,401
Non-cash investing activities:
Transfer of securities from available-for-sale to held-to-maturity, at fair value -$ - 8,248 Transfer to other real estate owned from loans, at fair value 700 - -
Maturities, redemptions, calls and principal repayments on securities HTM
Years ended December 31,
Adjustments to reconcile net income to net cash provided (used in) by operating activities:
Maturities, redemptions, calls and principal repayments on securities AFS

F-7
SIGNATURE BANK
Notes to Consolidated Financial Statements
(1) Organization
Signature Bank and subsidiaries (“we,” “us” or the “Bank”) is a New York State chartered bank, which received its charter from the New York State Banking Department on April 5, 2001. The Bank commenced business on May 1, 2001.
Signature Securities Group Corporation (“SSG” or “Signature Securities”), a wholly owned subsidiary of Signature Bank, was incorporated on May 26, 2000 in the State of New York and is a registered broker and dealer in securities under the Securities Exchange Act of 1934 and a member of the National Association of Securities Dealers, Inc.
(2) Summary of Significant Accounting Policies
(a) Basis of Presentation and Consolidation
The accompanying consolidated financial statements of the Bank have been prepared in accordance with U.S. generally accepted accounting principles (“GAAP”) and practices within the banking industry. In the opinion of management, these financial statements have been prepared to reflect all adjustments necessary to present fairly the financial position and results of operations as of the dates and for the periods shown. All significant intercompany accounts and transactions have been eliminated in consolidation.
(b) General Accounting Policy
The accompanying Consolidated Financial Statements are presented on the accrual basis of accounting.
(c) Management’s Use of Estimates
The preparation of consolidated financial statements in conformity with GAAP requires management to make estimates and assumptions that affect the reported amounts of assets and liabilities and disclosure of contingent assets and liabilities at the date of the consolidated financial statements and the reported amounts of revenues and expenses during the reporting period. Actual results may differ from those estimates.
The most significant estimates include the adequacy of the allowance for loan losses, valuation of securities, and the evaluation of other-than-temporary impairment of securities. Current market conditions increase the risk and complexity of the judgments involved in these estimates.
(d) Cash and Cash Equivalents
For the purpose of presentation in the Consolidated Statements of Cash Flows, we have defined cash and cash equivalents to include cash and due from banks and short-term investments with original maturities of 90 days or less. Short-term investments consist of Federal funds sold, interest-bearing deposits with banks and money market mutual funds.
Cash and cash equivalents at December 31, 2009 consisted of cash and due from banks of $95.7 million, interest-bearing deposits with banks of $9.0 million and money market mutual funds of $3.6 million. Cash and cash equivalents at December 31, 2008 consisted of cash and due from banks of $111.9 million, interest-bearing deposits with banks of $1.6 million and money market mutual funds of $2.7 million.
We are required by the Federal Reserve System to maintain non-interest bearing cash reserves equal to a percentage of certain deposits. The reserve requirement amounted to $66.0 million and $49.3 million at December 31, 2009 and 2008, respectively.

F-8
(e) Securities Available-for-Sale and Securities Held-to-Maturity
The designation of a security as available-for-sale (“AFS”) is made at the time of acquisition. The AFS classification includes debt and equity securities that are carried at estimated fair value. Unrealized gains or losses on securities available-for-sale are included as a separate component of shareholders’ equity, net of tax effect. Amortization of premiums and accretion of discounts are recognized using the level yield method. Realized gains and losses on sales of securities are computed using the specific identification method and are reported in non-interest income.
The designation of a security as held-to-maturity (“HTM”) is made at the time of acquisition. Securities that we have the positive intent and ability to hold to maturity are classified as HTM and carried at amortized cost. Amortization of premiums and accretion of discounts are recognized using the level yield method.
One of the significant estimates related to securities is the evaluation of securities for other-than-temporary impairment. We regularly evaluate our securities to identify declines in fair value that are considered other-than-temporary. Our evaluation of securities for impairments is a quantitative and qualitative process, which is subject to risks and uncertainties. If the cost of an investment exceeds its fair value, we evaluate, among other factors, general market conditions, the duration and extent to which the fair value is less than cost, the probability of a near-term recovery in value and our intent to sell the security and whether it is more likely than not that we will be required to sell the security before full recovery of our investment or maturity. We also consider specific adverse conditions related to the financial health of, projected cash flow and business outlook for the investee, including industry and sector performance, operational and financing cash flow factors and rating agency actions. Once a decline in fair value is determined to be other-than-temporary, for equity securities, an impairment charge is recorded through current earnings based upon the estimated fair value of the security at time of impairment and a new cost basis in the investment is established. For debt investment securities deemed to be other-than-temporarily impaired on or after April 1, 2009, the investment is written down through current earnings by the impairment related to the estimated credit loss and the noncredit-related impairment is recognized in other comprehensive income. Prior to April 1, 2009, the full amount of other-than-temporary impairment on debt securities was charged to current earnings. We changed our accounting policy in 2009 in order to adopt new accounting requirements issued by the Financial Accounting Standards Board (“FASB”) as discussed in note 4. If market, industry and/or investee conditions deteriorate, we may incur future impairments.
Securities other than securitized financial assets that are in an unrealized loss position, are reviewed at least quarterly to determine if an other-than-temporary impairment is present based on certain quantitative and qualitative factors. The primary factors considered in evaluating whether a decline in value for these securities is other-than-temporary include: (a) the length of time and extent to which the fair value has been less than cost or amortized cost and the expected recovery period of the security, (b) the financial condition, credit rating, and future prospects of the issuer, (c) whether the debtor is current on contractually-obligated interest and principal payments, and (d) the intent of the Bank to sell or whether we will be required to sell these instruments before recovery of their cost basis.
In performing our other-than-temporary impairment analysis for securitized financial assets with contractual cash flows (asset-backed securities, collateralized debt obligations, commercial mortgage-backed securities and mortgage-backed securities), we estimate future cash flows for each security based upon our best estimate of future delinquencies, estimated defaults, loss severity, and prepayments. We review the estimated cash flows to determine whether we expect to receive all originally scheduled cash flows. Projected credit losses are compared to the current level of credit enhancement to assess whether the security is expected to incur losses in any future period and therefore would be deemed other-than-temporarily impaired.
Based on the adoption of the new accounting requirements as discussed in note 4, the noncredit losses on previously other-than-temporarily impaired securities that were recorded in earnings were transferred from retained earnings to accumulated other comprehensive income. As a result, effective April 1, 2009, the accretion of discounts into interest income was, and is expected to remain, insignificant.
Equity securities, including FHLB stock, that are not quoted on an exchange and not considered to have a readily-determinable fair value are recorded at cost, less impairment (if any).

F-9
(f) Loans Held for Sale
Loans originated and intended for sale in the secondary market are carried at the lower of cost or estimated fair value in the aggregate. Net unrealized losses, if any, are recognized through a valuation allowance by charges to current earnings. Gains or losses resulting from sales of loans held for sale, net of unamortized deferred fees and costs, are recognized at the time of sale and are included under the caption “Net gains on sales of loans” in the Consolidated Statements of Operations.
(g) Loans, Net
Loans are carried at the principal amount outstanding, less unearned discounts, net of deferred loan origination fees and costs and the allowance for loan losses. Unearned income and net deferred loan fees and costs are accreted into interest income over the loan term on a basis that approximates the level yield method.
The accrual of interest on mortgage and commercial loans is discontinued at the time the loan is 90 days delinquent unless the credit is well-secured or in process of collection. Other personal loans are typically charged-off no later than when 180 days past due. In all cases, loans are placed on non-accrual or charged-off at an earlier date if collection of principal or interest is considered doubtful.
All interest previously accrued but not collected for loans that are placed on non-accrual or charged-off is reversed against interest income. The interest on these loans is accounted for on the cash-basis or cost-recovery method, until qualifying for return to accrual status. Loans are returned to accrual status when all the principal and interest amounts contractually due are brought current and future payments are reasonably assured.
Impaired loans include loans that have been categorized as non-accrual because collection of interest is doubtful and troubled debt restructured loans. Loans classified as troubled debt restructurings include those loans where a borrower experiences financial difficulty and the Bank makes certain concessionary modifications to contractual terms, such as a reduction of the stated interest rate or face amount of the loan, a reduction of accrued interest, or an extension of the maturity date(s) at a stated interest rate lower than the current market rate for a new loan with similar risk.
(h) Allowance for Loan Losses
The allowance for loan losses is established through a provision for loan losses charged to current earnings. The amount maintained in the allowance reflects management’s continuing evaluation of the probable losses inherent in the loan portfolio. The allowance for loan losses is comprised of two components: specific allowances assigned to certain classified loans individually evaluated for impairment and allowances calculated based on formulas for pools of loans. Factors contributing to the determination of specific reserves include the creditworthiness of the borrower and, more specifically, changes in the expected future receipt of principal and interest payments and/or in the value of pledged collateral. An allowance is recorded when the carrying amount of the loan exceeds the discounted estimated cash flows using the loan’s initial effective interest rate or the fair value of the collateral for collateral dependent loans. For purposes of determining formulas for pools of loans, the portfolio is segregated by product types in order to recognize differing risk profiles among categories, and then further segregated by credit grades.
The allowance for loan losses is evaluated on a regular basis by management and is based upon management’s periodic review of the collectability of the loans in light of historical experience, the nature and volume of the loan portfolio, adverse situations that may affect the borrower’s ability to repay, estimated value of any underlying collateral, prevailing economic conditions and industry data. This evaluation is inherently subjective as it requires estimates that are susceptible to significant revision as more information becomes available.
In addition, bank regulators, as an integral part of their supervisory functions, periodically review our allowance for loan losses. These regulatory agencies may require us to increase our provision for loan losses or to recognize further loan charge-offs based upon their judgments, which may be different from ours. Any increase in the allowance for loan losses required by these regulatory agencies could materially adversely affect our financial condition and results of operations.

F-10
(i) Loan Origination and Commitment Fees
Loan origination and commitment fees are deferred and amortized into interest income on a basis that approximates the level yield method. Net revolving lines of credit commitment fees are recognized in income on the straight-line method over the period the revolving line is active. Any fees that are unamortized at the time a loan is paid off or a commitment is closed are recognized into income immediately.
(j) Securitizations
The Bank purchases, securitizes and sells the government-guaranteed portions of U.S. Small Business Administration (“SBA”) loans. When the Bank securitizes assets, we may retain interest-only strips, which are generally considered residual interests in the securitized assets. Gains and losses upon sale of the assets depend, in part, on our allocation of the previous carrying amount of the assets to the retained interests. Previous carrying amounts are allocated in proportion to the relative fair values of the assets sold and interests retained. The Bank uses an internal valuation model to determine the value of its SBA interest-only strip securities.
The excess cash flows expected to be received over the amortized costs of the retained interest is recognized as interest income using the effective yield method. If the fair value of the retained interest has declined below its carrying amount and there has been an adverse change in estimated cash flows of the underlying assets, then such decline is determined to be other-than-temporary and the retained interest is written down to fair value with a corresponding adjustment to earnings.
(k) Premises and Equipment
Premises and equipment are stated at cost less accumulated depreciation and amortization. Depreciation of furniture, fixtures, and equipment is computed by the straight-line method over the estimated useful lives of the related assets. Furniture and fixtures are normally amortized over seven years and equipment; computer hardware and computer software are normally amortized over five years. Amortization of leasehold improvements is computed by the straight-line method over their estimated useful lives or the terms of the leases, whichever is shorter.
(l) Bank-owned Life Insurance
The Bank has purchased life insurance policies on certain employees. These Bank-owned life insurance (“BOLI”) policies are carried at the amount that could be realized under our BOLI policies as of the date of the Consolidated Statements of Financial Condition and are classified as an “Other Asset.” Increases in the carrying value are recorded as “Other Income” in the Consolidated Statements of Operations and insurance proceeds received are generally recorded as a reduction of the carrying value. The carrying value consists of cash surrender value of $59.9 million at December 31, 2009, and $58.0 million at December 31, 2008, and deferred acquisition costs of $684,000 at December 31, 2009, and $810,000 at December 31, 2008. Our investment in BOLI generated income of $2.3 million, $2.8 million, and $3.0 million for the years ended December 31, 2009, 2008, and 2007, respectively.
(m) Other Real Estate Owned
Other real estate (“ORE”) owned represents real estate acquired through foreclosure on loans secured by real estate and is carried at the lower of cost or fair value, less estimated selling costs. ORE is included in other assets. As of December 31, 2009 and 2008, our ORE totaled $700,000 and zero. Any write-downs at the date of foreclosure are charged to the allowance for loan losses. Expenses incurred to maintain ORE, unrealized losses resulting from write-downs after the date of foreclosure, and realized gains and losses upon sale of the properties are included in other non-interest expense and other non-interest income, as appropriate.
(n) Securities Sold Under Agreements to Repurchase
Qualifying securities sold under agreements to repurchase are accounted for as financings and the obligations to repurchase securities sold are reflected as liabilities in the Consolidated Statements of Financial Condition at the amounts at which the securities will be subsequently repurchased. The dollar amount of securities underlying the agreements remains in the asset accounts, although the securities underlying the agreements are delivered to the counterparties who arranged the transactions. In certain instances, the counterparties may have sold, loaned, or

F-11
disposed of the securities to other parties in the normal course of their operations, and have agreed to resell to us substantially similar securities at the maturity of the agreements.
(o) Income Taxes
Signature Bank files consolidated Federal and combined New York State and New York City income tax returns with its subsidiaries, with the exception of Signature Preferred Capital, Inc. which files separately as a real estate investment trust. Additionally, SSG files other state and local returns on a separate basis.
Income tax expense consists of current and deferred income tax expense (benefit). Deferred income tax expense (benefit) is determined by recognizing deferred tax assets and liabilities for future tax consequences attributable to differences between the financial statement carrying amounts of existing assets and liabilities and their respective tax bases and certain unused carry-forward deductions and credits. The realization of deferred tax assets is assessed and a valuation allowance provided for that portion of the asset for which it is more likely than not that it will not be realized. Deferred tax assets and liabilities are measured using enacted tax rates expected to apply to taxable income in the year in which those temporary differences are expected to be recovered or settled and carry-forward deductions and credits are utilized. The effect on deferred tax assets and liabilities of a change in tax laws or rates is recognized in income tax expense in the period that includes the enactment date of the change.
(p) Stock-Based Compensation
In March 2004, we adopted the Signature Bank 2004 Long-Term Incentive Plan (the “2004 equity incentive plan” or “the Plan”) for grants to be made to participants, including our officers, employees and consultants. The 2004 equity incentive plan was subsequently amended and restated upon receiving required shareholder approval at the 2008 Annual Shareholders Meeting held on April 17, 2008. The purpose of our 2004 equity incentive plan is to give us a competitive advantage in attracting, retaining and motivating officers, employees, directors and/or consultants and to provide us and our subsidiaries with a stock plan providing incentives directly related to increases in our shareholder value.
We recognize compensation expense in our Consolidated Statement of Operations for all stock-based compensation awards over the requisite service period with a corresponding credit to equity, specifically additional paid-in capital. Compensation expense is measured based on grant date fair value and is included in salaries and benefits (non-interest expense). The fair value of each option grant is estimated on the date of grant using the Black-Scholes option pricing model. The fair value of restricted stock grants is measured based on the market price of the shares at the date of grant.
(q) Earnings Per Common Share
Basic earnings per common share is computed by dividing net income available to common shareholders by the weighted-average common shares outstanding during the year.
Diluted earnings per common share is computed using the same method as basic earnings per share, but includes the potential dilutive effect of stock options outstanding and the unvested portions of restricted stock awards. The dilutive effect is calculated using the treasury stock method.
(r) Segment Reporting
Public companies are required to report certain financial information about operating segments for which such information is available and utilized by the chief operating decision maker in deciding how to allocate resources and in assessing performance. Specific information to be reported for individual operating segments includes a measure of segment profit and loss, certain specific revenue and expense items and segment assets. As presented in note 22, we have identified two operating segments, the Bank and Signature Securities.
(s) Derivatives
The Bank accounts for credit default swap and interest rate cap derivatives on the Consolidated Statements of Financial Condition at their respective fair values. As of December 31, 2009, the Bank has no derivatives
F-12
designated in any hedging relationship that qualify for hedge accounting. Changes in the fair value of derivatives are recognized as trading income or loss in the Consolidated Statements of Operations.
(t) New Accounting Standards
In May 2009, the FASB issued guidance now included in topic 855 (Subsequent Events) that addresses accounting and disclosure requirements related to subsequent events. It requires management to evaluate events and transactions that occur after the balance sheet date through the date the financial statements are either issued or available to be issued, depending on the company's expectation of whether it will widely distribute its financial statements to its shareholders and other financial statement users. Entities are required to disclose the date through which subsequent events have been evaluated. The guidance is effective for interim and annual reporting periods ending after June 15, 2009 and should be applied prospectively. We adopted these requirements on June 30, 2009 with no material impact to our Consolidated Financial Statements.
In June 2009, the FASB issued guidance which amends the derecognition guidance in topic 860 (Transfers and Servicing). Its main provisions are as follows: (1) eliminates the concept of a qualified special purpose entity (“QSPE”); (2) requires a transferor to consider all arrangements made contemporaneously with or in anticipation of a transfer when determining whether derecognition is appropriate; (3) clarifies the requirement that a transferred financial asset be legally isolated from the transferor and any of its consolidated affiliates; (4) introduces the concept of a participating interest which is applied to transfers of portions of financial assets to determine derecognition eligibility; (5) modifies the conditions required for a transfer of financial assets to qualify as a sale; (6) changes the initial measurement guidance for asset transfers that qualify as sales: and (7) stipulates that guaranteed mortgage securitizations (“GMS”) that fail to meet the conditions for sale accounting will result in the continued classification of the securitized mortgage loans as loans and will not enable a transferor to recognize a servicing asset or liability. The guidance is effective for financial asset transfers occurring in fiscal years beginning after November 15, 2009 (January 1, 2010 for calendar-year-end entities). Early adoption is prohibited. We do not expect the adoption of this guidance to have a material impact on our Consolidated Financial Statements.
In July 2009, the FASB issued Accounting Standards Update (“ASU”) 2009-01, topic 105 (Generally Accepted Accounting Principles) which established the ASC as the exclusive authoritative reference for nongovernmental U.S. GAAP for use in financial statements issued for interim and annual reporting periods ending after September 15, 2009, except for SEC rules and interpretive releases, which are also authoritative GAAP for SEC registrants.It divides nongovernmental U.S. GAAP into the authoritative Codification and guidance that is nonauthoritative. The contents of the Codification will carry the same level of authority, eliminating the previous four-level GAAP hierarchy. The Codification will supersede all existing non-SEC accounting and reporting standards. All other non-grandfathered, non-SEC accounting literature not included in the Codification will become nonauthoritative. We adopted the ASU at September 30, 2009.
In August 2009, the FASB issued ASU 2009-05, Measuring Liabilities at Fair Value to provide guidance on measuring the fair value of liabilities under topic 820. The ASU indicates that if an identical liability is traded in an active market, the quoted price of that liability represents a Level 1 fair value measurement. If an active market quote for an identical liability is not available, an entity must use a valuation technique that uses the quoted price of: (1) an identical liability when traded as an asset; (2) a similar liability or a similar liability when traded as an asset; or (3) another valuation technique that is consistent with the principles of topic 820, such as an income approach or a market approach. The ASU is effective for the first interim or annual reporting period after issuance (October 1, 2009 for calendar-year-end entities), with earlier application permitted. We adopted the ASU’s requirements on October 1, 2009 with no material impact on our Consolidated Financial Statements.
In January 2010, the FASB issued ASU 2010-06 which amends ASC 820 (Fair Value Measurements and Disclosures) to add new requirements for disclosures about significant transfers into and out of Levels 1 and 2 and separate disclosures about purchases, sales, issuances and settlements relating to Level 3 measurements. It also clarifies existing fair value disclosures about the level of disaggregation requiring entities to provide such disclosures for each class of assets and liabilities and about inputs and valuation techniques used to measure fair value. The guidance is effective for the first reporting period (including interim periods) beginning after December 15, 2009, except for the requirement to provide Level 3 activity on a gross basis, which will be effective for fiscal years beginning after December 15, 2010 (including interim periods). In the period of initial adoption, entities will not be required to provide the amended disclosures for any previous periods presented for comparative purposes. Early adoption is permitted. We do not expect the adoption of the ASU to have a material impact on our Consolidated Financial Statements.

F-13
(3) Fair Value Measurements
On January 1, 2008, we adopted FASB requirements regarding fair value measurements, which:
� Defines fair value as the price that would be received to sell an asset or paid to transfer a liability in an orderly transaction between market participants at the measurement date;
� Establishes a framework for measuring fair value;
� Expands disclosures about instruments measured at fair value; and
� Establishes a three-level hierarchy for fair value measurements based on the inputs used in the valuation. The hierarchy provides the basis for certain of the new disclosure requirements which are dependent upon the frequency of an item’s measurement at fair value (recurring versus nonrecurring).
The three-level hierarchy prioritizes techniques used to measure the fair value of assets and liabilities, based on the transparency and reliability of inputs to valuation methodologies. The three levels are defined as follows:
� Level 1 – Valuations are based on quoted prices in active markets for identical assets or liabilities. Accordingly, valuation of these assets and liabilities does not entail a significant degree of judgment. Examples include most U.S. Government securities and exchange-traded equity securities.
� Level 2 – Valuations are based on either quoted prices in markets that are not considered to be active or significant inputs to the methodology that are observable, either directly or indirectly. Examples include U.S. Agency securities, municipal bonds, corporate bonds, certain residential and commercial mortgage-backed securities, deposits, and most structured notes.
� Level 3 – Valuations are based on inputs to the methodology that are unobservable and significant to the fair value measurement. These inputs reflect management’s own judgments about the assumptions that market participants would use in pricing the assets and liabilities. Examples include certain commercial loans, certain residential and commercial mortgage-backed securities, private equity investments, and complex over-the-counter derivatives.
Valuation Methodology
The Bank has an established and well documented process for determining fair values. The Bank uses quoted market prices, when available, to determine fair value and classifies such items as Level 1. In many cases, the Bank utilizes valuation techniques, such as matrix pricing, to determine fair value, in which case the items are classified as Level 2. Fair value estimates may also be based upon internally-developed valuation techniques that use current market-based inputs such as discount rates, credit spreads, default and delinquency rates, and prepayment speeds. Items valued using internal valuation techniques are classified according to the lowest level input that is significant to the valuation, and are typically classified as Level 3.
We utilize independent third-party pricing sources to value most of our investment securities. Two independent third-party pricing sources are employed to value positions and validate market values. If there is a large price discrepancy between the two pricing services for an individual security, we utilize industry market spread data to assist in determining the most appropriate fair value.
The valuations provided by the pricing services are derived from quoted market prices or using matrix pricing. Matrix pricing is a valuation technique consistent with the market approach of determining fair value. The market approach uses prices and other relevant information generated by market transactions involving identical or comparable assets. Matrix pricing is a mathematical technique used principally to value debt securities without relying exclusively on quoted prices of specific securities, but rather on the securities’ relationship to other benchmark quoted securities. Most of our securities portfolio is priced using this method.
Securities are classified within Level 3 of the valuation hierarchy in cases where there is limited activity or less transparency around inputs to the valuation. In these cases, the valuations are determined based upon in-depth analysis of the cash flow structure and credit analysis for each position. Relative market spreads are utilized to discount the cash flow to determine current market values, as well as analysis of relative coverage ratios, credit enhancements, and collateral characteristics. Our Level 3 classifications at December 31, 2009 consist of asset-

F-14
backed securities, bank-collateralized pooled trust preferred securities, other collateralized debt obligations, private collateralized mortgage obligations and SBA interest-only strip securities.
The Bank determined that the SBA interest-only strip securities markets are currently inactive, as very limited secondary market activity is observed in the market based on consultation with brokers. Observable transactions on these securities are rare. The Bank used an internal valuation model to determine the value of its SBA interest-only strip securities. Since the cash flows of the SBA interest-only strip securities are guaranteed by the U.S. Government, there is virtually no risk involved in the cash flows. Therefore, the primary assumptions built into the pricing model to generate the projected cash flows used to compute the market values of the SBA interest-only strip securities are the discount yield and prepayment speeds. The Bank determined the inputs to the model based on historical performance and information provided by brokers.
Financials Instruments Measured at Fair Value on a Recurring Basis
The following tables present the assets and liabilities carried at fair value as of December 31, 2009 and 2008, classified according to the three-level valuation hierarchy:
(in thousands)
Quoted Prices in
Active Markets
(Level 1)
Significant Other
Observable Inputs
(Level 2)
Significant
Unobservable Inputs
(Level 3)
Total Carrying
Value
ASSETS
Securities available-for-sale -$ 3,714,138 123,445 3,837,583
Derivatives - 225 - 225 Total assets -$ 3,714,363 123,445 3,837,808
LIABILITIES
Derivatives -$ 682 - 682 Total liabilities -$ 682 - 682
(in thousands)
Quoted Prices in
Active Markets
(Level 1)
Significant Other
Observable Inputs
(Level 2)
Significant
Unobservable Inputs
(Level 3)
Total Carrying
Value
ASSETS
Securities available-for-sale -$ 2,779,123 126,936 2,906,059 Total assets -$ 2,779,123 126,936 2,906,059
LIABILITIES
Derivatives -$ 22 - 22 Total liabilities -$ 22 - 22
December 31, 2009
December 31, 2008
Changes in Level 3 Fair Value Measurements
The following table presents information for recurring assets classified by the Bank within Level 3 of the valuation hierarchy for the years ended December 31, 2009 and 2008:
(in thousands) 2009 2008
Beginning balance 126,936$ -Transfers into Level 3 10,586 129,424Total gains or losses (realized/unrealized):
Included in earnings (702) (1,839)Included in accumulated other comprehensive income (11,745) (649)
Transfers out of Level 3 (1,630) -Ending balance 123,445$ 126,936
Securities Available-for-sale

F-15
Assets Measured at Fair Value on a Non-recurring Basis
Certain assets are measured at fair value on a non-recurring basis. These instruments are not measured at fair value on an on-going basis but are subject to fair value adjustments only in certain circumstances, such as when there is evidence of impairment or when an adjustment is required to reduce the carrying value to the lower of cost or fair value. These assets include collateral-dependent impaired loans, securities held-to-maturity, loans held-for-sale, other real estate owned, and certain long-lived assets.
The following tables present the assets measured at fair value on a non-recurring basis as of December 31, 2009 and 2008, classified according to the three-level valuation hierarchy:
(in thousands)
Quoted Prices in
Active Markets
(Level 1)
Significant Other
Observable Inputs
(Level 2)
Significant
Unobservable Inputs
(Level 3)
Total Carrying
Value
Securities held-to-maturity -$ 9,826 - 9,826
Collateral-dependent loans - - 25,310 25,310
Other real estate owned - - 700 700 Total assets -$ 9,826 26,010 35,836
(in thousands)
Quoted Prices in
Active Markets
(Level 1)
Significant Other
Observable Inputs
(Level 2)
Significant
Unobservable Inputs
(Level 3)
Total Carrying
Value
Securities held-to-maturity -$ - 5,551 5,551
Collateral-dependent loans - - 12,587 12,587 Total assets -$ - 18,138 18,138
December 31, 2009
December 31, 2008
For the year ended December 31, 2009, the effects of non-recurring fair value adjustments were limited to (i) a $180,000 net other-than-temporary impairment loss recognized in earnings on an HTM security with a carrying value of $9.8 million and (ii) a $6.4 million provision- for losses on collateral-dependent impaired loans with a total carrying value of $25.3 million. For the year ended December 31, 2008, the effects of non-recurring fair value adjustments were limited to (i) a $635,000 other-than-temporary impairment loss recognized in earnings on an HTM security with a carrying value of $5.6 million and (ii) a $2.9 million provision for losses on collateral-dependent impaired loans with a total carrying value of $12.6 million.
Other real estate owned represents real estate acquired as a result of foreclosure and is carried, net of an allowance for losses, at the lower of cost or fair value, less estimated selling costs. Fair value is generally estimated through current appraisals. As of December 31, 2009 and 2008, other real estate owned, which is classified as Level 3, amounted to $700,000 and zero, respectively.
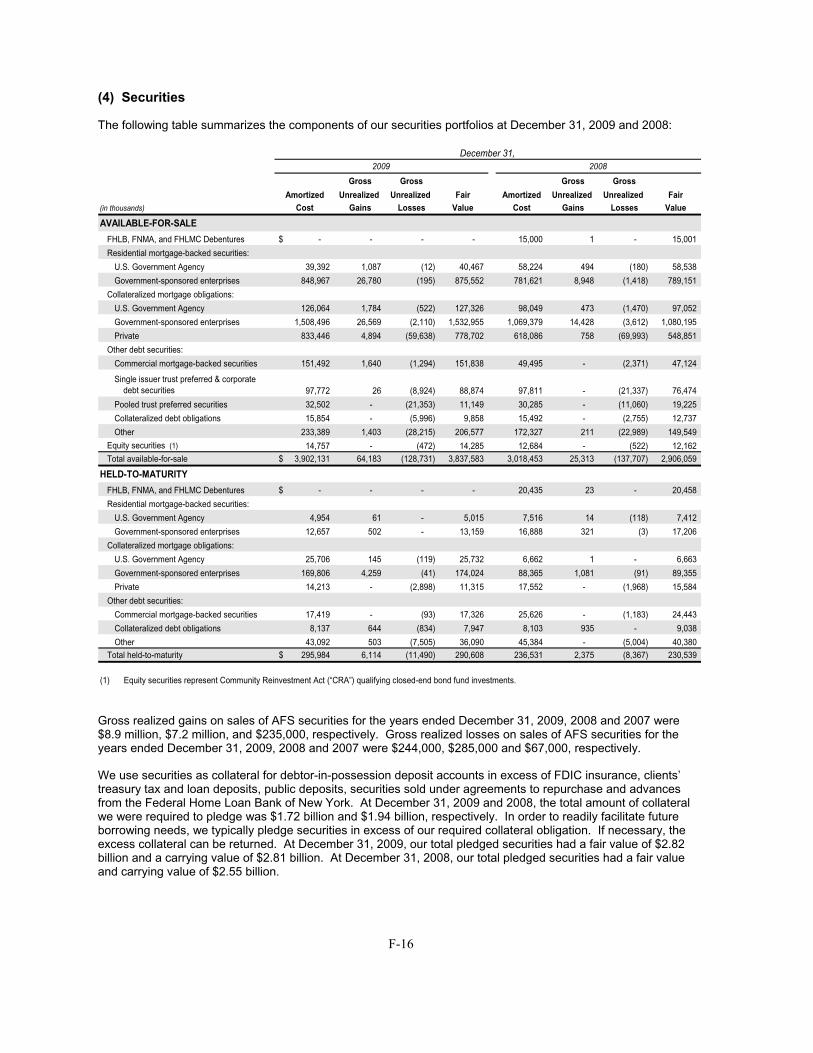
F-16
(4) Securities
The following table summarizes the components of our securities portfolios at December 31, 2009 and 2008:
Gross Gross Gross Gross
Amortized Unrealized Unrealized Fair Amortized Unrealized Unrealized Fair
(in thousands) Cost Gains Losses Value Cost Gains Losses Value
AVAILABLE-FOR-SALE
FHLB, FNMA, and FHLMC Debentures -$ - - - 15,000 1 - 15,001
Residential mortgage-backed securities:
U.S. Government Agency 39,392 1,087 (12) 40,467 58,224 494 (180) 58,538
Government-sponsored enterprises 848,967 26,780 (195) 875,552 781,621 8,948 (1,418) 789,151
Collateralized mortgage obligations:
U.S. Government Agency 126,064 1,784 (522) 127,326 98,049 473 (1,470) 97,052
Government-sponsored enterprises 1,508,496 26,569 (2,110) 1,532,955 1,069,379 14,428 (3,612) 1,080,195
Private 833,446 4,894 (59,638) 778,702 618,086 758 (69,993) 548,851
Other debt securities:
Commercial mortgage-backed securities 151,492 1,640 (1,294) 151,838 49,495 - (2,371) 47,124
Single issuer trust preferred & corporate debt securities 97,772 26 (8,924) 88,874 97,811 - (21,337) 76,474
Pooled trust preferred securities 32,502 - (21,353) 11,149 30,285 - (11,060) 19,225
Collateralized debt obligations 15,854 - (5,996) 9,858 15,492 - (2,755) 12,737
Other 233,389 1,403 (28,215) 206,577 172,327 211 (22,989) 149,549
Equity securities (1) 14,757 - (472) 14,285 12,684 - (522) 12,162 Total available-for-sale 3,902,131$ 64,183 (128,731) 3,837,583 3,018,453 25,313 (137,707) 2,906,059
HELD-TO-MATURITY
FHLB, FNMA, and FHLMC Debentures -$ - - - 20,435 23 - 20,458
Residential mortgage-backed securities:
U.S. Government Agency 4,954 61 - 5,015 7,516 14 (118) 7,412
Government-sponsored enterprises 12,657 502 - 13,159 16,888 321 (3) 17,206
Collateralized mortgage obligations:
U.S. Government Agency 25,706 145 (119) 25,732 6,662 1 - 6,663
Government-sponsored enterprises 169,806 4,259 (41) 174,024 88,365 1,081 (91) 89,355
Private 14,213 - (2,898) 11,315 17,552 - (1,968) 15,584
Other debt securities:
Commercial mortgage-backed securities 17,419 - (93) 17,326 25,626 - (1,183) 24,443
Collateralized debt obligations 8,137 644 (834) 7,947 8,103 935 - 9,038
Other 43,092 503 (7,505) 36,090 45,384 - (5,004) 40,380 Total held-to-maturity 295,984$ 6,114 (11,490) 290,608 236,531 2,375 (8,367) 230,539
(1) Equity securities represent Community Reinvestment Act (“CRA”) qualifying closed-end bond fund investments.
December 31,2009 2008
Gross realized gains on sales of AFS securities for the years ended December 31, 2009, 2008 and 2007 were $8.9 million, $7.2 million, and $235,000, respectively. Gross realized losses on sales of AFS securities for the years ended December 31, 2009, 2008 and 2007 were $244,000, $285,000 and $67,000, respectively.
We use securities as collateral for debtor-in-possession deposit accounts in excess of FDIC insurance, clients’ treasury tax and loan deposits, public deposits, securities sold under agreements to repurchase and advances from the Federal Home Loan Bank of New York. At December 31, 2009 and 2008, the total amount of collateral we were required to pledge was $1.72 billion and $1.94 billion, respectively. In order to readily facilitate future borrowing needs, we typically pledge securities in excess of our required collateral obligation. If necessary, the excess collateral can be returned. At December 31, 2009, our total pledged securities had a fair value of $2.82 billion and a carrying value of $2.81 billion. At December 31, 2008, our total pledged securities had a fair value and carrying value of $2.55 billion.

F-17
Trade date security purchases totaling $5.2 million and $14.1 million were included in accrued expenses and other liabilities at December 31, 2009 and 2008, respectively.
During the year-ended December 31, 2009, we recognized other-than-temporary impairment totaling $23.4 million on ten debt securities, which we do not intend to sell and for which it is not more likely than not that we will be required to sell the security prior to recovery. In accordance with FASB requirements that we adopted as of April 1, 2009, we recognized the credit component of the other-than-temporary impairment in earnings ($1.3 million) and the noncredit component in OCI ($22.1 million) for impairments recognized after that date.
During the second quarter of 2009, we recognized a $6.1 million net-of-tax cumulative-effect adjustment upon the adoption of new FASB other-than-temporary impairment requirements. The adjustment reclassified the noncredit component of other-than-temporary impairment losses previously recorded through earnings to accumulated other comprehensive income with an offsetting credit to retained earnings. The amount of the adjustment was incorrect, however, due to an error in the cash flow analysis performed on two AFS bank-collateralized pooled trust preferred securities. As a result, accumulated other comprehensive income was understated and retained earnings was overstated by $1.5 million net-of-tax. The error was corrected during the fourth quarter of 2009 and its impact was not deemed material to the period of correction. The appropriate adjustment for the interim periods ended June 30, 2009 and September 30, 2009 will also be reflected in our quarterly reports filed on Form 10-Q in 2010.
During the year ended December 31, 2009, we recorded other-than-temporary impairment on debt securities as follows:
Held-to-Maturity
(in thousands)Private
CMO
Pooled Trust
Preferred
Securities
Private
CMO Total
Total other-than-temporary impairment losses (9,507)$ (11,074) (2,815) (23,396)
Less: Other-than-temporary impairment losses recognized in OCI (1) 9,067 10,372 2,635 22,074
Net impairment losses recognized in earnings (2) (440)$ (702) (180) (1,322)
Available-for-sale
(1) Represents the noncredit component impact of the other-than-temporary impairment on debt securities.
(2) Represents the credit component impact of the other-than-temporary impairment on debt securities.
Activity related to the credit component recognized in pre-tax earnings on debt securities for which a portion of other-than-temporary impairment was recognized in OCI for the year ended December 31, 2009 is as follows:
(in thousands)
Year ended
December 31, 2009
Credit component of all prior other-than-temporary impairment not reclassified to OCI in conjunction with the cumulative effect transition adjustment as of April 1, 2009 (1) 27,769$ Activity after April 1, 2009:
Additions for the credit component on debt securities for which other-than-temporary impairment was not previously recognized 1,322
Cumulative pre-tax credit losses, December 31, 2009 29,091$
(1) As of April 1, 2009, we had securities with $35.9 million of other-than-temporary impairment previously recognized in earnings, of which $27.8 million represented the credit component and $8.1 million represented the noncredit component that was reclassified back to OCI through a cumulative-effect type adjustment ($4.5 million, net of tax effect).
As of December 31, 2009, those securities with other-than-temporary impairment for which a portion of the loss was specifically related to credit consisted of collateral debt obligations, bank-collateralized pooled trust preferred securities, asset-backed securities, and non-agency mortgage-backed securities. We estimate the portion of loss attributable to credit using a discounted cash flow model that considers credit enhancement and structural
F-18
protection. The estimation of cash flow incorporates numerous assumptions including default rates, severity estimates, recovery rates, prepayment speeds and structural enhancement characteristics. Assumptions will vary based upon the specific underlying characteristics and collateral profiles of the underlying securities. Specifically, assumptions will be determined based upon collateral vintage, borrower characteristic, geographical data and payment performance. Market data and third-party inputs are utilized to validate assumptions.
In our evaluation of bank-collateralized pooled trust preferred securities for other-than-temporary impairment, we assumed all current and future deferrals of interest by issuers in the pool will result in defaults, with various annual default scenarios. Additionally, the collateral was reviewed to determine if additional bank issuers should be assumed to be an immediate default or would cure (resume paying interest) based on Fitch credit scoring, TARP participation, ratio of non-performing assets to tangible common equity and loan loss reserves, and FDIC quarterly trends. Based on this review, we assumed that certain bank issuers on our watch list will default and others will cure in the future. Utilizing our assumptions, we then discount the cash flows to assess the amount of credit loss. During the year ended December 31, 2009, three bank-collateralized pooled trust preferred securities classified as AFS, with an amortized cost of $14.2 million, were deemed to have other-than-temporary impairment totaling $11.1 million, of which $702,000 was due to estimated credit loss and was charged to earnings and $10.4 million was recognized in other comprehensive income.
In our evaluation of non-agency mortgage-backed securities for other-than-temporary impairment, management applied security-specific, as well as general market, assumptions based on the credit characteristics of the security. The securities for which an other-than-temporary impairment charge was recorded had, at origination, underlying loans to borrowers with an average FICO score of 728 and a weighted average loan-to-value ratio of 71%. At December 31, 2009, the underlying mortgages have an average seasoning of 43 months, with the structure providing 5.1% average credit enhancements. The securities’ cash flows were discounted at the securities’ effective interest rate. We utilized assumptions including a 3.9% default rate, a 52% loss severity, and a 12.1% prepayment rate, and we discounted the cash flows utilizing the projected coupon during the duration of the estimated life. During year ended December 31, 2009, six private collateralized mortgage obligations classified as AFS, with an amortized cost of $41.8 million, were deemed to have other-than-temporary impairment totaling $9.5 million, of which $440,000 was due to estimated credit loss and was charged to earnings and $9.1 million was recognized in other comprehensive income. Additionally, during 2009 one private collateralized mortgage obligation classified as HTM, with an amortized cost of $9.8 million, was deemed to have other-than-temporary impairment totaling $2.8 million, of which $180,000 was due to estimated credit loss and was charged to earnings and $2.6 million was recognized in other comprehensive income.
During the year ended December 31, 2008, we recognized other-than-temporary impairment losses on securities totaling $16.5 million. Seven securities were written down to their estimated fair values during the year, including three asset-backed securities (“ABSs”) issued principally in 2003-2004, one collateralized debt obligation (“CDO”) issued in 2005, one Lehman Brothers senior debenture, and two bank-collateralized pooled trust preferred securities. During the year ended December 31, 2007, we recognized other-than-temporary impairment losses on 12 securities totaling $21.4 million, including six CDOs issued in 2004-2005 and six ABSs issued principally in 2004-2005. The securities were determined to be other-than-temporarily impaired based on the extent and duration of the decline in fair value below amortized cost, giving consideration to the current illiquid conditions, the uncertainty of a near-term recovery in value and the decline in expected cash flows of certain ABS and CDO securities. During the fourth quarter of 2008, we recognized $1.7 million in interest income from the accretion of discounts on securities previously impaired during 2007 and 2008.
We generally invest in U.S. Treasuries, U.S. Government agency obligations, U.S. Government-sponsored enterprises, and other investment grade securities. The fair value of these investments fluctuates based on several factors, including general interest rate changes. For collateralized mortgage obligations and certain other debt securities, fair value fluctuates based on credit quality, changes in credit spreads, and the degree of market liquidity, among other factors.

F-19
The following table presents information regarding AFS securities, categorized by type of security and length of time that individual securities have been in a continuous unrealized loss position at the dates indicated. Unrealized losses on other-than-temporarily impaired securities at December 31, 2009 include noncredit impairments recorded in OCI.
Fair Unrealized Fair Unrealized Fair Unrealized
(in thousands) Value Losses Value Losses Value Losses
December 31, 2009
Temporarily-impaired securities
Residential mortgage-backed securities:
U.S. Government Agency 3,053$ (8) 190 (4) 3,243 (12)
Government-sponsored enterprises 24,585 (190) 329 (5) 24,914 (195)
Collateralized mortgage obligations:
U.S. Government Agency 8,995 (17) 18,025 (505) 27,020 (522)
Government-sponsored enterprises 191,605 (1,578) 35,013 (532) 226,618 (2,110)
Private 191,869 (6,419) 213,319 (44,152) 405,188 (50,571)
Other debt securities:
Commercial mortgage-backed securities 60,153 (1,246) 1,256 (48) 61,409 (1,294)
Single issuer trust preferred & corporate debt securities 5,068 (37) 72,812 (8,836) 77,880 (8,873)
Pooled trust preferred securities - - 5,336 (6,558) 5,336 (6,558)
Other - - 26,610 (14,635) 26,610 (14,635)
Equity securities (1) 7,611 (321) 6,674 (151) 14,285 (472)
Total temporarily-impaired securities 492,939 (9,816) 379,564 (75,426) 872,503 (85,242)
Other-than-temporarily impaired securities
Collateralized mortgage obligations - private 905 (1,983) 31,860 (7,084) 32,765 (9,067)
Other debt securities:
Corporate debt securities - - 1,950 (51) 1,950 (51)
Pooled trust preferred securities 1,989 (4,423) 3,824 (10,372) 5,813 (14,795)
Collateralized debt obligations - - 9,859 (5,996) 9,859 (5,996)
Other 4,377 (5,874) 4,371 (7,706) 8,748 (13,580)
Total other-than-temporarily impaired securities 7,271 (12,280) 51,864 (31,209) 59,135 (43,489)
Total temporarily-impaired and other-than- temporarily impaired securities 500,210$ (22,096) 431,428 (106,635) 931,638 (128,731)
December 31, 2008
Temporarily-impaired securities
Residential mortgage-backed securities:
U.S. Government Agency 11,348$ (167) 186 (13) 11,534 (180)
Government-sponsored enterprises 71,502 (832) 23,719 (586) 95,221 (1,418)
Collateralized mortgage obligations:
U.S. Government Agency 10,710 (277) 19,528 (1,193) 30,238 (1,470)
Government-sponsored enterprises 181,727 (1,717) 83,352 (1,895) 265,079 (3,612)
Private 406,975 (49,126) 100,691 (20,867) 507,666 (69,993)
Other debt securities:
Commercial mortgage-backed securities 15,138 (74) 31,987 (2,297) 47,125 (2,371)
Single issuer trust preferred & corporate debt securities 49,529 (13,347) 25,971 (6,965) 75,500 (20,312)
Pooled trust preferred securities - - 15,859 (11,060) 15,859 (11,060)
Other 3,954 (50) 130,794 (17,420) 134,748 (17,470)
Equity securities (1) - - 12,162 (522) 12,162 (522)
Total temporarily-impaired securities 750,883 (65,590) 444,249 (62,818) 1,195,132 (128,408)
Other-than-temporarily impaired securities
Other debt securities:
Corporate debt securities 975 (1,025) - - 975 (1,025)
Collateralized debt obligations 9,350 (1,765) 3,386 (990) 12,736 (2,755)
Other 7,835 (5,337) 2,224 (182) 10,059 (5,519)
Total other-than-temporarily impaired securities 18,160 (8,127) 5,610 (1,172) 23,770 (9,299)
Total temporarily-impaired and other-than- temporarily impaired securities 769,043$ (73,717) 449,859 (63,990) 1,218,902 (137,707)
(1) Equity securities represent Community Reinvestment Act (“CRA”) qualifying closed-end bond fund investments.
TotalLess than 12 months 12 months or longer

F-20
The following table presents information regarding HTM securities, categorized by type of security and length of time that individual securities have been in a continuous unrealized loss position at the dates indicated. Unrealized losses on other-than-temporarily impaired securities at December 31, 2009 include noncredit impairments recorded in OCI.
Fair Unrealized Fair Unrealized Fair Unrealized
(in thousands) Value Losses Value Losses Value Losses
December 31, 2009
Temporarily-impaired securities
Collateralized mortgage obligations:
U.S. Government Agency 19,483$ (119) - - 19,483 (119)
Government-sponsored enterprises 17,030 (41) - - 17,030 (41)
Private - - 4,124 (263) 4,124 (263)
Other debt securities:
Commercial mortgage-backed securities - - 17,326 (93) 17,326 (93)
Other - - 25,491 (7,505) 25,491 (7,505)
Total temporarily-impaired securities 36,513 (160) 46,941 (7,861) 83,454 (8,021)
Other-than-temporarily impaired securities
Collateralized mortgage obligations - private - - 7,191 (2,635) 7,191 (2,635)
Collateralized debt obligations 4,733 (834) - - 4,733 (834)
Total other-than-temporarily impaired securities 4,733 (834) 7,191 (2,635) 11,924 (3,469)
Total temporarily-impaired and other-than- temporarily impaired securities 41,246$ (994) 54,132 (10,496) 95,378 (11,490)
December 31, 2008
Temporarily-impaired securities
Residential mortgage-backed securities:
U.S. Government Agency -$ - 3,867 (118) 3,867 (118)
Government-sponsored enterprises 2,999 (3) - - 2,999 (3)
Collateralized mortgage obligations:
Government-sponsored enterprises 14,767 (91) 109 - 14,876 (91)
Private - - 15,584 (1,968) 15,584 (1,968)
Other debt securities:
Commercial mortgage-backed securities - - 24,444 (1,183) 24,444 (1,183)
Other 25,288 (3,633) 15,091 (1,371) 40,379 (5,004)
Total temporarily-impaired securities 43,054 (3,727) 59,095 (4,640) 102,149 (8,367)
Other-than-temporarily impaired securities (1) - - - - - -
Total temporarily-impaired and other-than- temporarily impaired securities 43,054$ (3,727) 59,095 (4,640) 102,149 (8,367)
(1) As of December 31, 2008, the were no other-than-temporarily impaired HTM securites with unrealized losses.
TotalLess than 12 months 12 months or longer

F-21
The contractual maturities of investments in AFS and HTM debt securities are summarized in the following table. Expected maturities will differ from contractual maturities since borrowers may have the right to call or prepay obligations with or without call or prepayment penalties.
(in thousands) Amortized Cost Fair ValueAVAILABLE-FOR-SALE
Due in one year or less 169,816$ 171,211
Due after one year through five years 26,680 26,377
Due after five years through ten years 427,525 429,241
Due after ten years 3,263,353 3,196,470 Total available-for-sale debt securities 3,887,374$ 3,823,299
HELD-TO-MATURITY
Due after one year through five years 2,500$ 2,547
Due after five years through ten years 31,572 32,489
Due after ten years 261,912 255,572 Total held-to-maturity debt securities 295,984$ 290,608
December 31, 2009
The unrealized losses in our securities portfolio are primarily due to the prevailing interest rate environment, wider credit spreads on securities, and reduced levels of liquidity in the mortgage and credit markets. Sharp declines in residential home values, increased unemployment, a slowdown in consumer spending, and contraction in the credit markets, among other factors, led to decreased market liquidity for certain assets, increased credit risk for certain securities in our portfolio, and the corresponding widening of credit spreads.
In performing our other-than-temporary impairment analysis for private collateralized mortgage obligations and other debt securities, which had a total temporary unrealized loss position of $89.8 million at December 31, 2009, we estimated future cash flows for each security based upon our best estimate of future delinquencies, estimated defaults, loss severity, and prepayments. We reviewed the estimated cash flows to determine whether we expect to receive all originally scheduled cash flows. Projected credit losses were compared to the current level of credit enhancement to assess whether the security is expected to incur losses in any future period and therefore would be deemed other-than-temporarily impaired at December 31, 2009. Based on our review, we have determined that the estimated future cash flows were not less than amortized cost; therefore, the decline in fair value of these securities is attributable to a substantial widening of interest rate spreads across market sectors related to the continued illiquidity and uncertainty of the securities markets. Since we have no intent to sell and we believe it is not more likely than not that we will be required to sell these investments before recovery of their amortized cost basis, we do not consider these securities to be other-than-temporarily impaired as of December 31, 2009.
Continued deterioration in general market conditions could have a negative effect on the projected cash flows and ultimate recoverability of our securities. As a result of the adoption of new FASB requirements effective April 1, 2009, losses on securities that become other-than-temporarily impaired (where we do not intend to sell the security and it is not more likely than not that we will be required to sell the security prior to recovery of the security’s amortized cost) are bifurcated with the credit portion of the loss recognized in earnings and the noncredit loss portion of the impairment recognized in other comprehensive income, net of tax. The private collateralized mortgage obligations and other debt securities, with total unrealized losses of $50.8 million and $39.0 million, respectively, at December 31, 2009, are the securities in our portfolio that are the most exposed to impairment losses.
It is reasonably possible that the underlying collateral of these securities may perform at a level below our current expectations, which may result in adverse changes in cash flows for these securities and potential other-than-temporary impairment write-downs in the future. Events that may cause material declines in fair values for these securities include, but are not limited to, the deterioration of credit metrics, higher default levels, further illiquidity, or increased levels of losses in underlying collateral.

F-22
(5) Federal Home Loan Bank Stock
As a member of the Federal Home Loan Bank (“FHLB”) of New York, Signature Bank is required to maintain a specified minimum investment in the FHLB’s Class B capital stock. The minimum stock investment requirement is the sum of the membership stock purchase requirement, determined on an annual basis at the end of each calendar year, and the activity-based stock purchase requirement, determined on a daily basis.
At December 31, 2009 and 2008, Signature Bank was in compliance with the FHLB’s minimum investment requirement with stock investments of $23.9 million and $18.4 million, respectively, carried at cost on the Consolidated Statements of Financial Condition. Outstanding FHLB borrowings at December 31, 2009 and 2008 were collateralized by $13.7 million and $11.7 million, respectively, of FHLB capital stock.
In performing our other-than-temporary impairment analysis of FHLB stock, we evaluated, among other things, (i) its earnings performance, including the significance of any decline in net assets of the FHLB as compared to the regulatory capital amount of the FHLB, (ii) the commitment by the FHLB to make required dividend payments, and (iii) the liquidity position of the FHLB. We do not consider this security to be other-than-temporarily impaired at December 31, 2009.
(6) Loans Held for Sale
Loans held for sale at December 31, 2009 and 2008 were $293.2 million and $217.7 million, respectively. Gains on sales associated with the securitization of pooled loans and sale of mortgage loans for the years ended December 31, 2009, 2008 and 2007 amounted to $3.6 million, $1.4 million and $2.6 million, respectively.
We are an active participant in the Small Business Administration (“SBA”) loan and SBA pool secondary market by purchasing, securitizing, and selling the guaranteed portions of SBA 7(a) loans. Most SBA 7(a) loans have adjustable rates and float at a spread over prime and reset monthly or quarterly. The guaranteed portions of SBA loans are backed by the full faith and credit of the U.S. Government and therefore carry a 0% risk weight for regulatory capital purposes.
We utilize the services of SSG to act as agent for and consultant to the Bank on the purchase, assembly, and sale of SBA loans and pools.
We warehouse loans for generally up to 180 days until there are sufficient loans with similar characteristics to securitize the pool. We may strip excess servicing from loans with different coupons to create a pool at a common rate. This results in the creation of two assets: a par pool, which is sold to accredited investors, and an interest-only strip, which we retain as an available-for-sale security. The interest-only strip represents the portion of the coupon stripped from a loan.
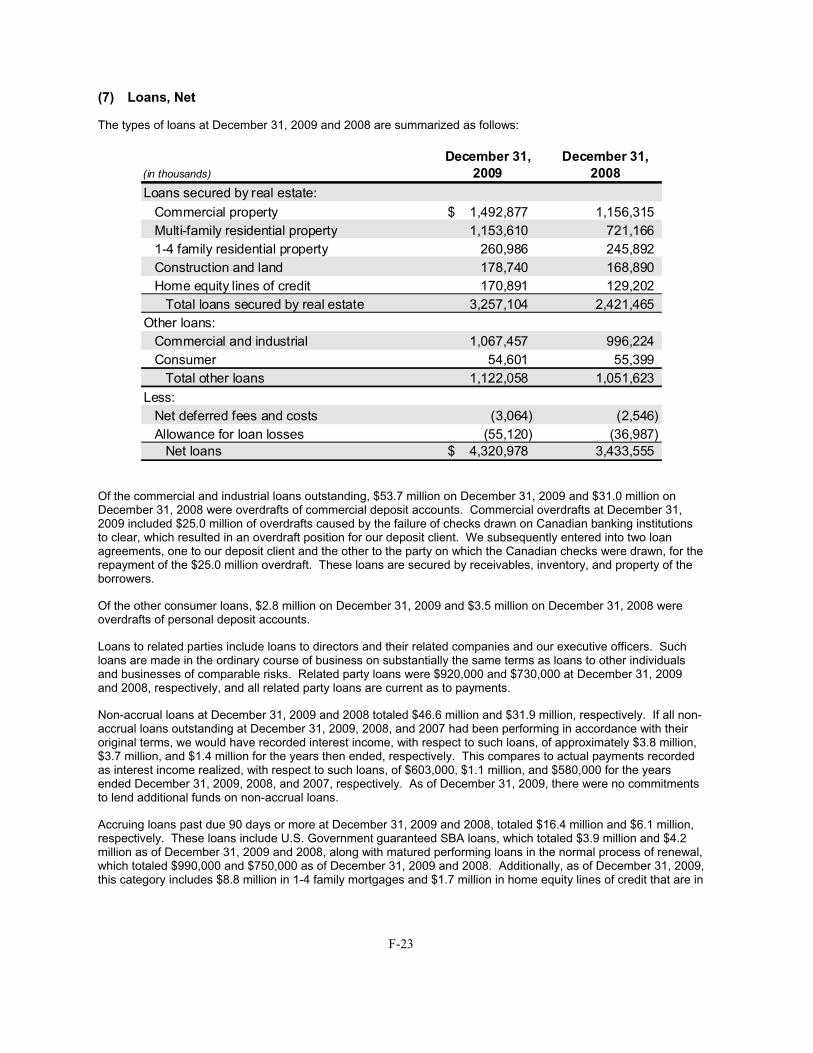
F-23
(7) Loans, Net
The types of loans at December 31, 2009 and 2008 are summarized as follows:
December 31, December 31,
(in thousands) 2009 2008
Loans secured by real estate:Commercial property 1,492,877$ 1,156,315 Multi-family residential property 1,153,610 721,166 1-4 family residential property 260,986 245,892 Construction and land 178,740 168,890 Home equity lines of credit 170,891 129,202
Total loans secured by real estate 3,257,104 2,421,465 Other loans:
Commercial and industrial 1,067,457 996,224 Consumer 54,601 55,399
Total other loans 1,122,058 1,051,623 Less:
Net deferred fees and costs (3,064) (2,546) Allowance for loan losses (55,120) (36,987)
Net loans 4,320,978$ 3,433,555
Of the commercial and industrial loans outstanding, $53.7 million on December 31, 2009 and $31.0 million on December 31, 2008 were overdrafts of commercial deposit accounts. Commercial overdrafts at December 31, 2009 included $25.0 million of overdrafts caused by the failure of checks drawn on Canadian banking institutions to clear, which resulted in an overdraft position for our deposit client. We subsequently entered into two loan agreements, one to our deposit client and the other to the party on which the Canadian checks were drawn, for the repayment of the $25.0 million overdraft. These loans are secured by receivables, inventory, and property of the borrowers.
Of the other consumer loans, $2.8 million on December 31, 2009 and $3.5 million on December 31, 2008 were overdrafts of personal deposit accounts.
Loans to related parties include loans to directors and their related companies and our executive officers. Such loans are made in the ordinary course of business on substantially the same terms as loans to other individuals and businesses of comparable risks. Related party loans were $920,000 and $730,000 at December 31, 2009 and 2008, respectively, and all related party loans are current as to payments.
Non-accrual loans at December 31, 2009 and 2008 totaled $46.6 million and $31.9 million, respectively. If all non-accrual loans outstanding at December 31, 2009, 2008, and 2007 had been performing in accordance with their original terms, we would have recorded interest income, with respect to such loans, of approximately $3.8 million, $3.7 million, and $1.4 million for the years then ended, respectively. This compares to actual payments recorded as interest income realized, with respect to such loans, of $603,000, $1.1 million, and $580,000 for the years ended December 31, 2009, 2008, and 2007, respectively. As of December 31, 2009, there were no commitments to lend additional funds on non-accrual loans.
Accruing loans past due 90 days or more at December 31, 2009 and 2008, totaled $16.4 million and $6.1 million, respectively. These loans include U.S. Government guaranteed SBA loans, which totaled $3.9 million and $4.2 million as of December 31, 2009 and 2008, along with matured performing loans in the normal process of renewal, which totaled $990,000 and $750,000 as of December 31, 2009 and 2008. Additionally, as of December 31, 2009, this category includes $8.8 million in 1-4 family mortgages and $1.7 million in home equity lines of credit that are in

F-24
process of collection and well secured, based on a current appraisal. At December 31, 2008, this category included $356,000 in 1-4 family mortgages.
Commercial loans (including commercial and industrial loans and loans secured by commercial real estate) and multi-family mortgage loans constitute a substantial portion of our loan activity and loan portfolio. Substantially all of the real estate collateral for the loans in our portfolio is located within the New York metropolitan area. As a result, our financial condition and results of operations may be affected by changes in the economy and the real estate market of the New York metropolitan area. A prolonged period of economic recession or other adverse economic conditions in the New York metropolitan area, such as the one we are facing now, may result in an increase in nonpayment of loans, a decrease in collateral value, and an increase in our allowance for loan losses.
(8) Allowance for Loan Losses
Changes in the allowance for loan losses for the years ended December 31, 2009, 2008 and 2007 are as follows:
(in thousands) 2009 2008 2007
Balance at beginning of year 36,987$ 18,236 13,829 Provision for loan losses 42,715 26,888 12,316 Loans charged off (25,451) (8,377) (7,973) Recoveries of loans previously charged off 869 240 64
Balance at end of year 55,120$ 36,987 18,236
December 31,
We had impaired loans in the amount of $46.6 million, $41.6 million, and $18.6 million with related allowances for loan losses of $13.0 million, $8.6 million, and $4.9 million at December 31, 2009, 2008, and 2007, respectively, which are included in the overall allowance for loan losses.
The amount of impaired loans at December 31, 2009, 2008, and 2007 includes all non-accrual loans. In addition, impaired loans at December 31, 2008, includes a total of $9.6 million for two loans that were restructured in 2008 as troubled debt, which would have been non-performing had their terms not been renegotiated. One loan with a principal balance of $16.5 million was restructured with the Bank receiving a pay-down of $12.3 million and a fully-secured note for $3.7 million. We incurred a charge-off of approximately $524,000. The second loan with a principal balance of $5.9 million was restructured with the Bank obtaining additional collateral to further support the loan. Both of the loans restructured during 2008 are currently performing in accordance with the restructured terms. There were no troubled debt restructurings at December 31, 2009 and 2007.
Interest income recorded on impaired loans for the years ended December 31, 2009, 2008, and 2007 was $603,000, $1.4 million, and $580,000, respectively. If all impaired loans had been performing in accordance with their original terms, we would have recorded interest income, with respect to such loans, of approximately $3.8 million, $4.0 million, and $1.4 million for the years ended December 31, 2009, 2008, and 2007, respectively. Average impaired loans for the years ended December 31, 2009, 2008 and 2007 totaled $44.5 million, $32.0 million, and $7.6 million, respectively.
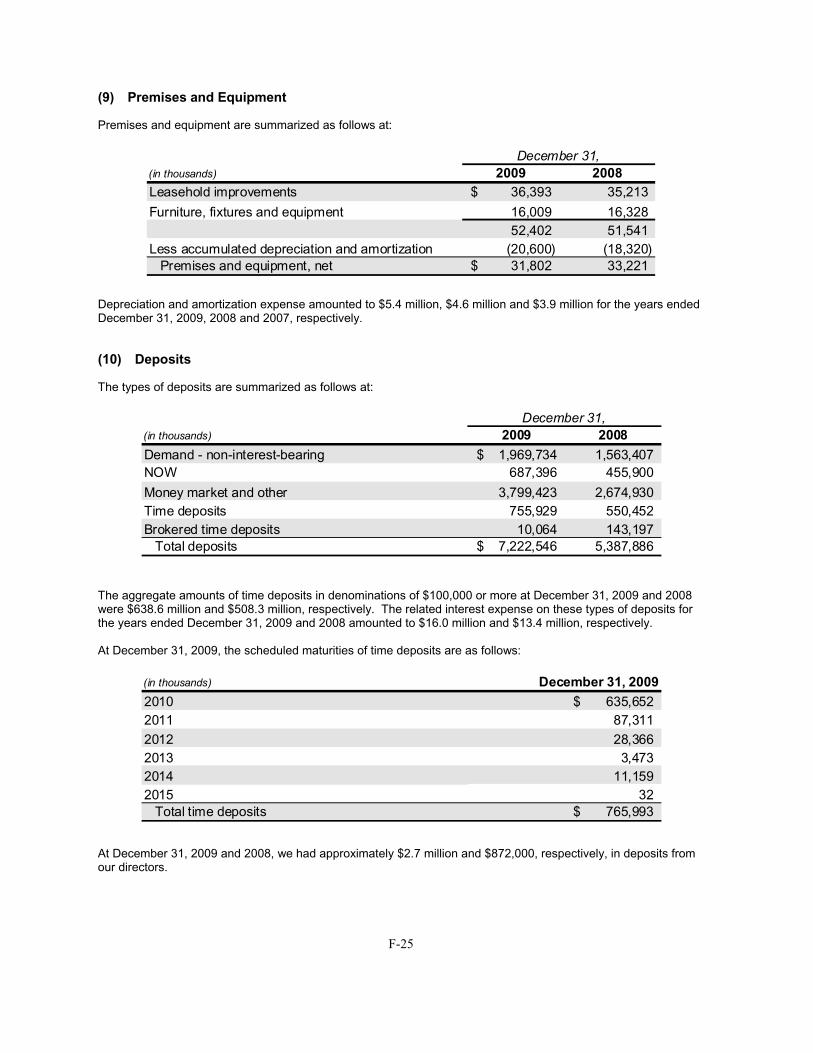
F-25
(9) Premises and Equipment
Premises and equipment are summarized as follows at:
(in thousands) 2009 2008
Leasehold improvements 36,393$ 35,213
Furniture, fixtures and equipment 16,009 16,328 52,402 51,541
Less accumulated depreciation and amortization (20,600) (18,320) Premises and equipment, net 31,802$ 33,221
December 31,
Depreciation and amortization expense amounted to $5.4 million, $4.6 million and $3.9 million for the years ended December 31, 2009, 2008 and 2007, respectively.
(10) Deposits
The types of deposits are summarized as follows at:
(in thousands) 2009 2008
Demand - non-interest-bearing 1,969,734$ 1,563,407 NOW 687,396 455,900
Money market and other 3,799,423 2,674,930 Time deposits 755,929 550,452 Brokered time deposits 10,064 143,197
Total deposits 7,222,546$ 5,387,886
December 31,
The aggregate amounts of time deposits in denominations of $100,000 or more at December 31, 2009 and 2008 were $638.6 million and $508.3 million, respectively. The related interest expense on these types of deposits for the years ended December 31, 2009 and 2008 amounted to $16.0 million and $13.4 million, respectively.
At December 31, 2009, the scheduled maturities of time deposits are as follows:
(in thousands)
2010 635,652$ 2011 87,311 2012 28,366 2013 3,473 2014 11,159 2015 32
Total time deposits 765,993$
December 31, 2009
At December 31, 2009 and 2008, we had approximately $2.7 million and $872,000, respectively, in deposits from our directors.

F-26
(11) Incentive Savings Plan
We have a 401(k) program under which employees may make personal contributions of up to 60% of their pretax earnings by means of payroll deductions. We match 100% of the first 3% of compensation contributed to the plan and 50% of the next 4% of compensation contributed. Our contributions, included in salaries and benefits expense, were $2.1 million, $1.8 million and $1.5 million, respectively, for the years ended December 31, 2009, 2008 and 2007.
(12) Federal Funds Purchased and Securities Sold Under Agreements to Repurchase
The following is a summary of Federal funds purchased at or for the years ended:
(dollars in thousands) 2009 2008
Year-end balance 70,000$ 108,000$ Maximum amount outstanding at any month-end 224,000$ 370,000$ Average outstanding balance 23,175$ 142,620$ Weighted-average interest rate paid 0.24% 1.53%Weighted-average interest rate at year-end 0.07% 0.18%
December 31,
The following is a summary of securities sold under agreements to repurchase at or for the years ended:
(dollars in thousands) 2009 2008
Year-end balance 627,000$ 677,000$ Maximum amount outstanding at any month-end 677,000$ 677,000$ Average outstanding balance 655,356$ 595,197$ Weighted-average interest rate paid 4.25% 4.48%Weighted-average interest rate at year-end 4.08% 4.24%
December 31,
During the years ended December 31, 2009, 2008, and 2007, interest expense recorded on Federal funds purchased and securities sold under agreements to repurchase totaled $27.9 million, $28.9 million, and $27.5 million, respectively.
At December 31, 2009, securities with a fair value of $767.0 million and a carrying value of $765.3 million were pledged to meet our collateral requirement of $658.4 million on repurchase agreements. At December 31, 2008, securities with a fair value of $831.6 million and a carrying value of $831.2 million were pledged to meet our collateral requirement of $710.9 million on repurchase agreements.

F-27
The Federal funds purchased at December 31, 2009 were overnight transactions, while the securities sold under repurchase agreements at December 31, 2009 have contractual maturities as follows:
(in thousands) Amount
2010 112,000$
2011 70,000 2012 155,000 2013 50,000 2014 95,000 Thereafter 145,000
Total advances 627,000$
(13) Federal Home Loan Bank Advances
As a member of the FHLB of New York, we are required to acquire and hold shares of capital stock in the FHLB in an amount at least equal to 1% of the aggregate principal amount of our unpaid residential mortgage loans and similar obligations at the beginning of each year, 4.5% of our borrowings from the Federal Home Loan Bank, or 0.3% of assets, whichever is greater. As of December 31, 2009, we were in compliance with this requirement.
The following is a summary of Federal Home Loan Bank (“FHLB”) advances at or for the years ended:
(dollars in thousands) 2009 2008
Year-end balance 305,000$ 260,000$ Maximum amount outstanding at any month-end 305,000$ 707,000$ Average outstanding balance 260,192$ 324,074$ Weighted-average interest rate paid 4.00% 3.51%Weighted-average interest rate at year-end 3.42% 3.95%
December 31,
During the years ended December 31, 2009, 2008, and 2007, interest expense recorded on FHLB advances totaled $10.4 million, $11.4 million, and $10.2 million, respectively.
At December 31, 2009, securities with a fair value of $891.9 million and a carrying value of $892.1 million were pledged to meet our collateral requirement of $320.3 million on FHLB advances. At December 31, 2008, securities with a fair value of $588.9 million and a carrying value of $589.3 million were pledged to meet our collateral requirement of $273.0 million on FHLB advances.
FHLB advances at December 31, 2009 have contractual maturities as follows:
(in thousands) Amount
2010 105,000$ 2011 105,000 2012 30,000 2013 15,000 2014 15,000 Thereafter 35,000
Total advances 305,000$
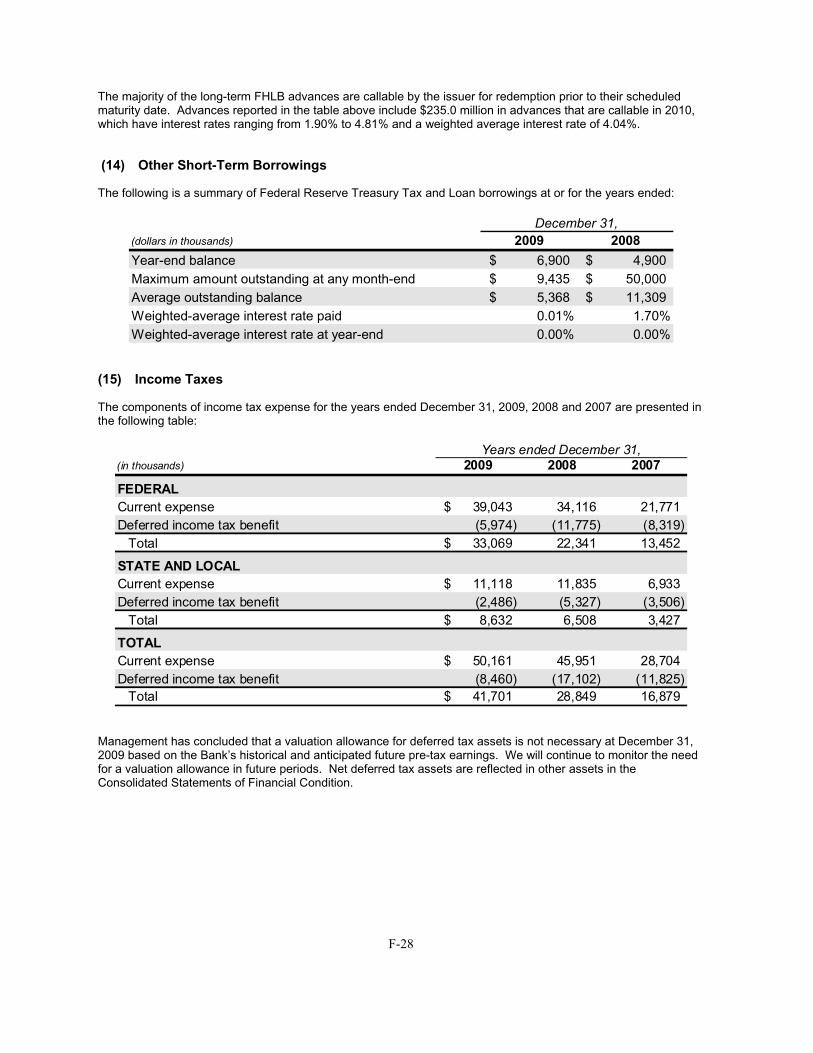
F-28
The majority of the long-term FHLB advances are callable by the issuer for redemption prior to their scheduled maturity date. Advances reported in the table above include $235.0 million in advances that are callable in 2010, which have interest rates ranging from 1.90% to 4.81% and a weighted average interest rate of 4.04%.
(14) Other Short-Term Borrowings
The following is a summary of Federal Reserve Treasury Tax and Loan borrowings at or for the years ended:
(dollars in thousands) 2009 2008
Year-end balance 6,900$ 4,900$ Maximum amount outstanding at any month-end 9,435$ 50,000$ Average outstanding balance 5,368$ 11,309$ Weighted-average interest rate paid 0.01% 1.70%Weighted-average interest rate at year-end 0.00% 0.00%
December 31,
(15) Income Taxes
The components of income tax expense for the years ended December 31, 2009, 2008 and 2007 are presented in the following table:
(in thousands) 2009 2008 2007
FEDERAL
Current expense 39,043$ 34,116 21,771 Deferred income tax benefit (5,974) (11,775) (8,319)
Total 33,069$ 22,341 13,452
STATE AND LOCAL
Current expense 11,118$ 11,835 6,933 Deferred income tax benefit (2,486) (5,327) (3,506)
Total 8,632$ 6,508 3,427
TOTAL
Current expense 50,161$ 45,951 28,704 Deferred income tax benefit (8,460) (17,102) (11,825)
Total 41,701$ 28,849 16,879
Years ended December 31,
Management has concluded that a valuation allowance for deferred tax assets is not necessary at December 31, 2009 based on the Bank’s historical and anticipated future pre-tax earnings. We will continue to monitor the need for a valuation allowance in future periods. Net deferred tax assets are reflected in other assets in the Consolidated Statements of Financial Condition.

F-29
The components of the net deferred tax asset at December 31, 2009 and 2008 are presented in the following table:
(in thousands) 2009 2008
23,155$ 15,774 421 1,153
2,439 1,611 1,278 700
Write-down for other-than-temporary impairment of securities 13,799 16,780 1,512 1,721
42,604 37,739 29,170 49,698 71,774 87,437
296 295 296 295
71,478$ 87,142
Non-accrual interest
OtherTotal deferred tax assets recognized in earnings
Total deferred tax liability recognized in earningsNet deferred tax asset
Net unrealized depreciation on securities available-for-saleTotal deferred tax assets
DEFERRED TAX LIABILITY
Prepaid expenses
Unearned compensation - restricted shares
DEFERRED TAX ASSETS
Allowance for loan lossesDepreciation
December 31,
In April 2007, the State of New York enacted new tax legislation effective for the calendar tax year beginning January 1, 2007 that included, for companies with assets in excess of $8 billion, a four-year phase out of the tax benefit received on income from REIT subsidiaries. In April 2009, this legislation was subsequently upheld in the New York State budget enacted for fiscal year 2009-2010. Based on our 2009 average assets of $7.989 billion, this legislation did not impact our 2009 income tax expense, however, we expect that our average assets will exceed $8.0 billion in 2010 and, accordingly, our effective tax rate will increase to approximately 43%.
The following table presents a reconciliation of statutory federal income tax expense to combined effective income tax expense for the years ended December 31, 2009, 2008 and 2007:
(in thousands)Expense
(Benefit) Rate
Expense
(Benefit) Rate
Expense
(Benefit) Rate
Statutory federal income tax expense 36,546$ 35% 25,248 35% 15,446 35%
State and local income taxes, net of federal income tax benefit 5,610 6% 4,230 6% 2,227 5%
Tax exempt income (674) (1%) (907) (1%) (966) (2%)
Other items, net 219 * 278 * 172 *Effective income tax expense 41,701$ 40% 28,849 40% 16,879 38%
* - Less than 1%.
20082009 2007
Years ended December 31,
We have not recognized any liabilities for unrecognized tax benefits related to uncertain tax positions. Our policy is to recognize interest and penalties on income taxes in income tax expense. We remain subject to examination for income tax returns for the years ending after December 31, 2005.

F-30
(16) Equity Incentive Plan
We have an equity incentive plan designed to assist in attracting, retaining and motivating officers, employees, directors and/or consultants and to provide us and our subsidiaries and affiliates with a stock plan providing incentives directly related to increases in our shareholder value.
Activity related to the equity incentive plan for the years ended December 31, 2009 and 2008 is summarized as follows:
2009 2008
Shares available for future awards at beginning of the year 1,414,137 718,865 Additional shares approved at the 2008 Annual Meeting of Shareholders - 1,213,550 Options
Granted - - Forfeited or expired 667 - Shares sold to cover tax withholding and/or option price upon exercise 51,504 56,613
Restricted stock Granted (184,358) (596,867)Forfeited 8,422 3,224 Shares sold to cover tax withholding upon vesting 69,188 18,752
Shares available for future awards at end of the year 1,359,560 1,414,137
Years ended December 31,
Stock Options
As of December 31, 2009, all outstanding options were fully vested and exercisable. Accordingly, no additional compensation cost will be expensed for these options. During the years ended December 31, 2009 and 2008, we recognized compensation expense of zero and $2,000, respectively, for stock options. All options granted under the equity incentive plan expire ten years from the date of grant. At the time of grant, all options vested in whole or in part over three years from the date of issuance.
The following table summarizes information regarding the stock option component of the 2004 equity incentive plan for the years ended December 31, 2009 and 2008:
Shares
Underlying
Options
Weighted
Average
Exercise
Price
Shares
Underlying
Options
Weighted
Average
Exercise
Price
Outstanding at beginning of year 1,142,167 $ 16.85 1,219,117 $ 16.80
Granted - - - - Exercised (71,000) 15.65 (76,950) 16.01 Forfeited or expired (667) 15.50 - - Outstanding at end of year 1,070,500 $ 16.93 1,142,167 $ 16.85
Years ended December 31,
2009 2008
The total intrinsic values of options exercised during the years ended December 31, 2009 and 2008 were $873,000 and $1.0 million, respectively. Cash received from stock options exercised during the years ended December 31, 2009 and 2008 was $1.1 million and $1.2 million, respectively. Available authorized common shares are issued for stock options exercised.

F-31
The following is a summary of outstanding and exercisable stock options as of December 31, 2009:
Exercise Price
At
December 31, 2009
Weighted Average Remaining
Contractual Life
$ 15.50 925,250 4.22 years24.09 7,500 5.38 years24.98 1,750 5.80 years26.11 125,500 5.22 years26.87 9,100 5.55 years28.97 1,400 5.89 years
1,070,500 4.36 years
As of December 31, 2009, the intrinsic value of options outstanding and exercisable was $16.0 million.
Restricted Stock
The following table summarizes information regarding the restricted stock component of the 2004 equity incentive plan for the years ended December 31, 2009 and 2008:
Shares
Weighted
Average
Grant Price Shares
Weighted
Average
Grant Price
Outstanding at beginning of year 679,883 $ 27.71 158,024 $ 32.88 Granted 184,358 27.45 596,867 26.87 Vested (128,611) 30.07 (71,784) 31.99 Forfeited (8,422) 27.95 (3,224) 30.95 Outstanding at end of year 727,208 $ 27.22 679,883 $ 27.71
2009 2008
Years ended December 31,
As of December 31, 2009, there was $14.6 million of total unrecognized compensation cost related to unvested restricted shares that is expected to be recognized over a weighted-average period of 5.19 years. During the years ended December 31, 2009 and 2008, we recognized compensation expense of $5.5 million and $4.2 million, respectively, for unvested restricted shares. The total fair value of restricted shares that vested during the years ended December 31, 2009 and 2008 was $3.6 million and $2.0 million, respectively.

F-32
(17) Earnings Per Share
The following table shows the computation of basic and diluted earnings per common and common equivalent share for the years ended December 31, 2009, 2008 and 2007:
(in thousands, except per share amounts) 2009 2008 2007
Net income available to common shareholders 50,523$ 42,969 27,279 Common and common equivalent shares:
Weighted average common shares outstanding 38,306 31,390 29,672 Weighted average common equivalent shares 421 378 420 Weighted average common and common equivalent shares 38,727 31,768 30,092
Basic earnings per share 1.32$ 1.37 0.92 Diluted earnings per share 1.30$ 1.35 0.91
Years ended December 31,
Outstanding as of December 31, 2009, 2008 and 2007, were options to purchase approximately 597,000 shares, 596,000 shares and zero shares of the Bank’s common stock at a weighted average price of $30.21, $30.21, and zero, respectively, that were excluded from the computation of diluted earnings per share for the respective years because the exercise prices of the stock options exceeded the average market prices of the Company’s common shares during these years.
(18) Commitments and Contingent Liabilities
In the normal course of business, we have various outstanding commitments and contingent liabilities that are not reflected in the accompanying Consolidated Financial Statements.
(a) Lease Commitments
We have entered into noncancelable operating lease agreements for premises and equipment with expiration dates through the year 2024. Our premises are used principally for private client offices and administrative operations.
Rental expense for our premises for the years ended December 31, 2009, 2008, and 2007 amounted to $11.5 million, $10.7 million and $8.2 million, respectively.
The required minimum rental payments under the terms of the noncancelable leases at December 31, 2009 (in thousands) are summarized as follows:
(in thousands) December 31, 2009
2010 10,633$ 2011 10,838 2012 11,002 2013 11,304 2014 10,662 Thereafter 24,824
Total 79,263$
(b) Information Technology Services Contract
On September 9, 2005, we entered into a Master Agreement for the Provision of Hardware, Software and/or Services (the “Agreement”) with Fidelity Information Services, Inc. (“Fidelity”). Under the terms of the agreement,

F-33
Fidelity provides us with hardware, software and account processing services related to our core banking applications. Particularly, Fidelity is providing us with enterprise banking services, core data processing services and managed operations services. Additionally, Fidelity also provides us with implementation and training services for the software and hardware provided under the Agreement.
The term of the Agreement is 84 months from the date of execution and terminates in June 2013. We began making monthly payments on July 1, 2006 and incurred contractual costs of $3.1 million in 2008 and $3.2 million in 2009. We have the right to terminate the Agreement upon a change of control of us, or a failure by Fidelity to meet the terms of the Agreement, subject to certain penalties.
(c) Financial Instruments with Off-Balance Sheet Risks
In the normal course of business, we have various outstanding commitments and contingent liabilities that are not reflected in the accompanying Consolidated Financial Statements.
We enter into transactions that involve financial instruments with off-balance sheet risks in the ordinary course of business to meet the financing needs of our clients. Such financial instruments include commitments to extend credit, standby letters of credit, and unused balances under confirmed letters of credit, all of which are primarily variable rate. Such instruments involve, to varying degrees, elements of credit and interest rate risk.
Our exposure to credit loss in the event of nonperformance by the other party with regard to financial instruments is represented by the contractual notional amount of those instruments. Financial instrument transactions are subject to our normal credit policies and approvals, financial controls and risk limiting and monitoring procedures. We generally require collateral or other security to support financial instruments with credit risk.
A summary of our commitments and contingent liabilities is as follows:
(in thousands) 2009 2008
Unused commitments to extend credit 519,102$ 554,627 Financial standby letters of credit 193,342 214,862 Commercial and similar letters of credit 15,808 10,605 Other 732 677
Total 728,984$ 780,771
December 31,
Commitments to extend credit consist of agreements having fixed expiration or other termination clauses and may require payment of a fee. Total commitment amounts may not necessarily represent future cash requirements. We evaluate each client's creditworthiness on a case-by-case basis. Upon the extension of credit, we will obtain collateral, if necessary, based on our credit evaluation of the counterparty. Collateral held varies but may include deposits held in financial institutions, commercial properties, residential properties, accounts receivable, property, plant and equipment and inventory.
We recognize a liability at the inception of the guarantee that is equivalent to the fee received from the guarantor. This liability is amortized to income over the term of the guarantee on a straight-line basis. At December 31, 2009 and December 31, 2008, we had deferred revenue for commitment fees paid for the issuance of standby letters of credit in the amounts of $639,000 and $618,000, respectively.
Standby letters of credit are conditional commitments issued by us to guarantee the performance of a client’s obligation to a third party. Standby letters of credit are primarily used to support clients' business trade transactions and may require payment of a fee. The credit risk involved in issuing letters of credit is essentially the same as that involved in extending loan facilities to clients During 2009, based on a review of relevant factors, we established a liability for credit losses on standby letters of credit, which as of December 31, 2009, was $326,000. There was no such liability at December 31, 2008. During the year ended December 31, 2009, there were no charge-offs recorded on standby letters of credit and the provision for losses was $326,000, reported in Other General and Administrative Expenses in our Consolidated Statements of Operations. During the years ended

F-34
December 31, 2008 and 2007, no charge-offs and no provisions for losses were recorded on standby letters of credit.
At December 31, 2009 and 2008, we had commitments to sell residential mortgage loans and SBA loans of $1.3 million and $2.3 million, respectively. Related fair values were insignificant at December 31, 2009 and 2008.
(d) Litigation
In the normal course of business, the Bank has been named as a defendant in various legal actions. In the opinion of management, after reviewing such claims with legal counsel, resolution of these matters will not have a material adverse impact on our financial condition and results of operations.
(19) Derivative Instruments
Credit Default Swaps
We use credit default swaps as part of a program intended to economically hedge credit risk associated with certain corporate debt securities in our investment securities portfolio. We do not apply hedge accounting to any of our credit default swaps. At December 31, 2009, we had two swaps with a total notional amount of $8.0 million. At December 31, 2008, we had one swap with a total notional amount of $3.0 million. The fair value of our credit default swaps totaled ($438,000) and ($22,000) at December 31, 2009 and 2008, respectively, and was included in Accrued Expenses and Other Liabilities in our Consolidated Statements of Financial Condition. During the years ended December 31, 2009, 2008, and 2007, our credit default swaps resulted in trading losses of $1.0 million, $54,000, and zero, respectively, reported in our Consolidated Statements of Operations.
Interest Rate Caps
In April 2009, we entered into two back-to-back $10.0 million notional amount interest rate caps to facilitate a client need. We do not apply hedge accounting to any of our interest rate caps. At December 31, 2009, the net fair value of the interest caps was ($18,000), of which $225,000 was included in Other Assets and ($243,000) was included in Accrued Expenses and Other Liabilities in our Consolidated Statements of Financial Condition. During the year ended December 31, 2009, the interest rate caps resulted in a trading gain of $8,000 reported as net Trading Loss in our Consolidated Statements of Operations.
(20) Regulatory Matters
We are subject to various regulatory capital requirements administered by state and Federal regulatory agencies. Failure to meet minimum capital requirements can initiate certain mandatory—and possible additional discretionary—actions by regulators that, if undertaken, could have a direct material adverse effect on our financial statements. Under capital adequacy guidelines and the regulatory framework for prompt corrective action, we must meet specific capital guidelines that involve quantitative measures of our assets, liabilities, and certain off-balance sheet items as calculated under regulatory accounting practices. Our capital amounts and classifications are also subject to qualitative judgments by the regulators about components, risk weightings, and other factors.
In addition, we are subject to the provisions of the Federal Deposit Insurance Corporation Improvement Act of 1991 (“FDICIA”) which imposes a number of mandatory supervisory measures. Among other matters, FDICIA established five capital categories ranging from “well capitalized” to “critically under capitalized.” Such classifications are used by regulatory agencies to determine a bank’s deposit insurance premium, approval of applications authorizing institutions to increase their asset size or otherwise expand business activities or acquire other institutions. Under the provisions of FDICIA, a “well capitalized” bank must maintain minimum leverage, Tier 1 and Total Capital ratios of 5%, 6% and 10%, respectively.
Quantitative measures established by regulation to ensure capital adequacy require us to maintain minimum amounts and ratios of total and Tier I capital to risk-weighted assets (as defined), and of Tier I capital (as defined) to average assets (as defined). As of December 31, 2009 and 2008, we met all capital adequacy requirements to which we were subject.

F-35
The most recent notification from the Federal Deposit Insurance Corporation categorized us as well capitalized under the regulatory framework for prompt corrective action. To be categorized as well capitalized, we must maintain minimum total risk-based, Tier I risk-based, and Tier I leverage ratios as set forth in the table. There are no conditions or events since that notification that management believes have changed the Bank’s category.
Our actual capital amounts and ratios are presented in the table below.
(dollars in thousands) Amount Ratio Amount Ratio Amount Ratio
As of December 31, 2009:
Total capital (to risk-weighted assets) 895,503$ 14.47% 495,248 8.00% 619,060 10.00%Tier 1 capital (to risk-weighted assets) 840,057 13.57% 247,624 4.00% 371,436 6.00%Tier 1 leverage capital (to average assets) 840,057 9.39% 357,918 4.00% 447,397 5.00%
As of December 31, 2008:
Total capital (to risk-weighted assets) 797,295$ 17.83% 357,710 8.00% 447,138 10.00%Tier 1 capital (to risk-weighted assets) 760,308 17.00% 178,855 4.00% 268,283 6.00%Tier 1 leverage capital (to average assets) 760,308 10.61% 286,512 4.00% 358,140 5.00%
ActualRequired for Capital Adequacy Purposes
Required to beWell Capitalized
A depository institution, under federal law, is prohibited from paying a dividend if such dividend would cause the depository institution to be “undercapitalized” as determined by federal bank regulatory agencies. The relevant federal regulatory agencies and the state regulatory agency, the New York State Banking Department, also have the authority to prohibit a bank from engaging in what, in the opinion of such regulatory body, constitutes an unsafe or unsound practice in conducting its business. We would require the approval of the Superintendent of the New York State Banking Department if the dividends we declared in any calendar year were to exceed net profit for that year combined with retained net profits of the preceding two calendar years, less any required transfer to paid-in capital. The term “net profit” is defined as the remainder of all earnings from current operations plus actual recoveries on loan and investment and other assets, after deducting from the total thereof all current operating expenses, actual losses, if any, and all federal and local taxes. The payment of dividends could, depending upon our financial condition, be deemed to constitute such an unsafe or unsound practice.
(21) Issuances of Common Stock, Preferred Stock and Warrant
U.S Treasury Program Participation
On December 12, 2008, we completed the issuance of 120,000 shares senior preferred stock (with an aggregate liquidation preference of $120.0 million) and a warrant to purchase 595,829 common shares to the U.S. Treasury through the Troubled Asset Relief Program Capital Purchase Program (the “TARP Offering”). We began to use the proceeds from the TARP Offering to fund our continued loan growth, and we believe our active lending to credit-worthy borrowers during our participation in the program supported the U.S. Treasury’s stated goal of increasing the flow of credit to both consumers and businesses.
On February 17, 2009, the American Recovery and Reinvestment Act of 2009 (the “Recovery Act”) was enacted. The Recovery Act included limitations and other provisions that have affected the manner in which participants in the TARP Capital Purchase Program conduct their business. In light of the restrictions of the Recovery Act, on March 31, 2009, we repurchased the 120,000 shares of preferred stock we issued to the U.S. Treasury for $120.0 million (the aggregate liquidation preference of such preferred stock) plus accrued and unpaid dividends of $767,000. We believe exiting the program was in our best interest and the best interest of our shareholders and clients, and we remain “well capitalized” as defined for regulatory purposes. The ten-year warrant to purchase up to 595,829 shares of our common stock that was also issued to the U.S. Treasury on December 12, 2008 in connection with the TARP Capital Purchase Program remains outstanding at December 31, 2009. On February 18, 2010, the U.S. Treasury expressed its intent to auction our warrant, and we are assessing whether we will participate in the auction of the warrant.

F-36
Common Stock Offerings
On September 12, 2008, we completed a public offering of 5,400,000 shares of our common stock, and on June 8, 2009, we completed a public offering of 5,175,000 shares of our common stock. Our net proceeds from these offerings amounted to approximately $148.1 million and $127.3 million, respectively, and such amounts were added to our capital. The net proceeds from these offerings have supported a significant level of growth and have permitted us to originate and retain loans of a size and type that allows us to accommodate the needs of our targeted clients, which are privately owned businesses, their owners and their senior managers.
(22) Segment Reporting
We operate two principal lines of business, the Bank and Signature Securities. The Bank offers a wide variety of business and personal banking products and services. Signature Securities offers investment, brokerage, asset management, and insurance products and services.
The following tables present certain information regarding our reportable segments:
(in thousands) 2009 2008 2007
The Bank
Interest income 386,113$ 323,339 301,396 Interest expense 123,739 128,193 154,799 Non-interest income 28,104 18,521 4,162 Non-interest expense (1) 186,616 141,802 107,309 Income tax expense 41,649 28,779 16,852
Net income 62,213$ 43,086 26,598 Total assets 9,145,760$ 7,192,357 5,845,566
Signature Securities
Interest income 22$ 125 209 Interest expense 1 - 16 Non-interest income (2) 6,528 9,124 4,584
Fee income from the Bank 5,392 3,099 4,011 Non-interest expense 11,376 12,005 8,080 Income tax expense 52 70 27
Net income 513$ 273 681 Total assets 4,996$ 3,446 4,301
At or for the years ended December 31,
(2) Includes fee and other income from external clients.(1) For purposes of this disclosure, non-interest expense includes the provision for loan losses.

F-37
The following table sets forth reconciliations of net interest income, non-interest income, non-interest expense, net income, and total assets for reportable segments to the Consolidated Financial Statement totals:
(in thousands) 2009 2008 2007
Net interest income:
Bank 262,374$ 195,146 146,597
Signature Securities 21 125 193 Consolidated 262,395$ 195,271 146,790
Non-interest income:
Bank 28,104$ 18,521 4,162 Signature Securities 11,920 12,223 8,595
Eliminations (5,392) (3,099) (4,011) Consolidated 34,632$ 27,645 8,746
Non-interest expense (1):
Bank 186,616$ 141,802 107,309 Signature Securities 11,376 12,005 8,080 Eliminations (5,392) (3,099) (4,011) Consolidated 192,600$ 150,708 111,378
Net income:
Bank 62,213$ 43,086 26,598 Signature Securities 513 273 681 Consolidated 62,726$ 43,359 27,279
Total assets:
Bank 9,145,760$ 7,192,357 5,845,566 Signature Securities 4,996 3,446 4,301 Eliminations (4,644) (3,604) (4,695) Consolidated 9,146,112$ 7,192,199 5,845,172
(1) For purposes of this disclosure, non-interest expense includes the provision for loan losses.
At or for the years ended December 31,

F-38
(23) Accumulated Other Comprehensive Income (Loss)
The following table presents changes in the accumulated other comprehensive loss for the periods indicated:
(in thousands) 2009 2008 2007
Accumulated other comprehensive loss at beginning of period, net of tax (62,696)$ (18,122) (20,576)Cumulative adjustment for accounting change (1) (8,133) - - Net change in unrealized gains and losses on securities (2) 62,065 (89,592) (14,697)Net realized (gains) losses reclassified into earnings (3) (7,361) 9,667 19,187Tax effect (20,527) 35,351 (2,036)
Accumulated other comprehensive loss at end of period, net of tax (36,652)$ (62,696) (18,122)
December 31,
(1) Effective April 1, 2009, we adopted a new accounting pronouncement related to the recognition of other-than-temporary impairment losses on debt securities. See note 4 - Securities.
(2) For the year ended December 31, 2009, includes the $22.1 million noncredit component of other-than-temporary impairment losses recognized on available-for-sale debt securities. For additional information on these impairments, see note 4 - Securities.
(3) This line item includes (gains) losses on securities available-for-sale and impairment charges. These amounts are reclassified into earnings upon sale of the related security or upon recognition of an other-than-temporary impairment.
(24) Disclosures About Fair Value of Financial Instruments
Fair value estimates for our financial instruments are made at a specific point in time, based on relevant market information and information about the financial instrument, and have no effect on the financial position or results of operations in the current year or any future period. Fair value estimates are not necessarily representative of our total enterprise value. Fair value estimates, methods and assumptions are set forth below.
The carrying amounts for cash and cash equivalents are reasonable estimates of fair value.
The fair value for most of our securities is estimated based on valuations provided by independent third-party pricing sources, which are derived from quoted market prices or using matrix pricing. In cases where there is a lack of observable data and absence of market transactions driven by highly illiquid markets, our valuations are determined based upon in-depth analysis of the cash flow structure and credit analysis for each position.
Federal Home Loan Bank stock is carried at cost, which equals its redemption (par).
Loans, net, had a carrying value of $4.32 billion and an estimated fair value of $4.37 billion at December 31, 2009. The estimated fair value was based on the discounted value of contractual cash flows using interest rates that approximated those offered for loans with similar maturities and collateral requirements to borrowers of comparable credit worthiness. Since this method of estimating fair value is based on a comparison to current market rates for similar loans, it does not fully incorporate an exit-value approach to estimating fair value.
Deposits are mostly non-interest-bearing or NOW and money market deposits that bear floating interest rates that are re-priced based on market considerations and the Bank’s strategy. Therefore, the carrying value equals fair value. The carrying and fair values do not include the intangible fair value of core deposit relationships, which comprise a significant portion of our deposit base. Management believes that its core deposit relationships represent a relatively stable, low-cost source of funding that has a substantial intangible value separate from the deposit balances. Time deposits, 83.0% of which mature within one year, had a carrying value of $766.0 million and an estimated fair value of $767.7 million at December 31, 2009. The estimated fair value is based on the discounted value of contractual cash flows using interest rates that approximated those offered for time deposits with similar maturities and terms.

F-39
The estimated fair value of borrowings is based on the discounted value of contractual cash flows using interest rates that approximate those offered for borrowings with similar maturities and collateral requirements.
Our derivatives are comprised of credit default swaps and interest rate derivatives. The fair value of our credit default swaps is determined by using externally-developed pricing models based on market observable inputs. The fair value of our interest rate derivatives is provided by a third party and validated using third-party inputs such as LIBOR, Swap and Treasury curves.
The following table summarizes the carrying amounts and estimated fair values of our financial assets and liabilities:
(in thousands)
Carrying
Amount
Estimated
Fair Value
Carrying
Amount
Estimated
Fair Value
Financial assetsCash and cash equivalents 108,349$ 108,349 116,257 116,257Securities available-for-sale 3,837,583 3,837,583 2,906,059 2,906,059Securities held-to-maturity 295,984 290,608 236,531 230,539Federal Home Loan Bank stock 23,906 23,906 18,411 18,411 Loans held for sale 293,207 293,207 217,680 217,680 Loans, net 4,320,978 4,374,495 3,433,555 3,604,615Derivatives 225 225 - - Total financial assets 8,880,232$ 8,928,373 6,928,493 7,093,561
Financial liabilitiesDeposits (1) 7,222,546 7,224,274 5,387,886 5,394,929Repurchase agreements 627,000 658,044 677,000 732,109Federal funds purchased 70,000 70,000 108,000 108,000Federal Home Loan Bank advances 305,000 315,954 260,000 277,931 Other short-term borrowings 6,900 6,899 4,900 4,896 Derivatives 682 682 22 22 Total financial liabilities 8,232,128$ 8,275,853 6,437,808 6,517,887
(1) The carrying and fair values of deposits do not include the intangible fair value of core deposit relationships.
December 31,2009 2008
(25) Subsequent Events
Management has evaluated events and transactions which transpired after the December 31, 2009 date of our Consolidated Financial Statements to determine whether financial statement recognition or disclosure was necessary. Based on our review of all available information, no additional recognition or disclosure was deemed necessary.

F-40
(26) Quarterly Data (unaudited)
(dollars in thousands, except per share amounts) March 31 June 30 September 30 December 31
2009 QUARTER
Interest income 88,215$ 90,906 100,238 106,776
Interest expense 30,713 30,360 31,625 31,042
Net interest income 57,502 60,546 68,613 75,734
Provision for loan losses 9,595 9,402 11,881 11,837
Net interest income after provision for loan losses 47,907 51,144 56,732 63,897
Non-interest income 10,395 7,317 7,305 9,615
Other-than-temporary impairment losses on securities - (177) (623) (522)
Non-interest income excluding other-than- temporary impairment losses on securities 10,395 7,494 7,928 10,137
Non-interest expense 33,991 38,919 38,565 38,410
Income before taxes 24,311 19,542 25,472 35,102
Income tax expense 9,699 7,565 10,307 14,130
Net income 14,612$ 11,977 15,165 20,972
Dividends on preferred stock and related adjustments 12,203 - - -
Net income available to common shareholders 2,409$ 11,977 15,165 20,972
Basic earnings per common share 0.07$ 0.33 0.37 0.52 Diluted earnings per common share 0.07$ 0.32 0.37 0.51
2008 QUARTER
Interest income 75,137$ 74,828 81,853 91,646
Interest expense 33,919 29,775 31,755 32,744
Net interest income 41,218 45,053 50,098 58,902
Provision for loan losses 6,403 6,035 5,781 8,669
Net interest income after provision for loan losses 34,815 39,018 44,317 50,233
Non-interest income 9,858 9,768 3,708 4,311
Other-than-temporary impairment losses on securities (703) (937) (7,973) (6,930)
Non-interest income excluding other-than- temporary impairment losses on securities 10,561 10,705 11,681 11,241
Non-interest expense 28,563 30,715 32,760 31,782
Income before taxes 16,110 18,071 15,265 22,762
Income tax expense 6,260 7,219 6,070 9,300
Net income 9,850$ 10,852 9,195 13,462
Dividends on preferred stock and related adjustments - - - 390
Net income available to common shareholders 9,850$ 10,852 9,195 13,072
Basic earnings per common share 0.33$ 0.36 0.30 0.37 Diluted earnings per common share 0.33$ 0.36 0.29 0.37

(This page has been left blank intentionally.)

Exhibit Index
Exhibit No. Exhibit
3.1 Restated Organization Certificate. (Incorporated by reference to Signature Bank’s Quarterly Report on Form 10-Q for the period ended June 30, 2005.)
3.2 Certificate of Amendment, dated December 5, 2008, to the Bank's Restated Organization Certificate with respect to Signature Bank’s Fixed Rate Non-Cumulative Perpetual Preferred Stock, Series A, par value $0.01 per share. (Incorporated by reference to Signature Bank’s Current Report on Form 8-K filed on December 17, 2008.)
3.3 Amended and Restated By-laws of the Registrant. (Incorporated by reference to Signature Bank’s Current Report on Form 8-K filed on October 17, 2007.)
4.1 Specimen Common Stock Certificate. (Incorporated by reference to Signature Bank’s Registration Statement on Form 10 or amendments thereto, filed with the Federal Deposit Insurance Corporation on March 17, 2004.)
4.2 Form of Warrant to Purchase Common Stock. (Incorporated by reference to Signature Bank’s Current Report on Form 8-K filed on December 17, 2008.)
10.1 Signature Bank Amended and Restated 2004 Long-Term Incentive Plan. (Incorporated by reference from Appendix A to the 2008 Definitive Proxy Statement on Schedule 14A, filed with the Federal Deposit Insurance Corporation on March 19, 2008.)
10.2 Amended and Restated Signature Bank Change of Control Plan. (Incorporated by reference to Signature Bank’s Current Report on Form 8-K, filed with the Federal Deposit Insurance Corporation on September 19, 2007.)
10.3 Outsourcing Agreement, dated January 1, 2004, by and between Bank Hapoalim, Signature Bank and Signature Securities. (Incorporated by reference to Signature Bank’s Registration Statement on Form 10 or amendments thereto, filed with the Federal Deposit Insurance Corporation on March 17, 2004.)
10.4 Networking Agreement, effective as of April 18, 2001, between Signature Securities and Signature Bank. (Incorporated by reference to Signature Bank’s Registration Statement on Form 10 or amendments thereto, filed with the Federal Deposit Insurance Corporation on March 17, 2004.)
10.5 Signature Securities Group Corporation Customer Agreement, effective as of May 31, 2003, between Bank Hapoalim and Signature Securities. (Incorporated by reference to Signature Bank’s Registration Statement on Form 10 or amendments thereto, filed with the Federal Deposit Insurance Corporation on March 17, 2004.)
10.6 Signature Securities Group Corporation Customer Agreement, dated April 25, 2003, between Bank Hapoalim and Signature Securities. (Incorporated by reference to Signature Bank’s Registration Statement on Form 10 or amendments thereto, filed with the Federal Deposit Insurance Corporation on March 17, 2004.)
10.7 Brokerage and Consulting Agreement, dated August 6, 2001, by and between Signature Bank and Signature Securities. (Incorporated by reference to Signature Bank’s Registration Statement on Form 10 or amendments thereto, filed with the Federal Deposit Insurance Corporation on March 17, 2004.)
10.10 Lease for 1225 Franklin Avenue, dated April 5, 2002, between Franklin Avenue Plaza LLC and Signature Bank. (Incorporated by reference to Signature Bank’s Registration Statement on Form 10 or amendments thereto, filed with the Federal Deposit Insurance Corporation on March 17, 2004.)
10.11 Sublease for 1177 Avenue of the Americas, dated as of April 4, 2001, by and between Bank Hapoalim and Signature Bank. (Incorporated by reference to Signature Bank’s Registration Statement on Form 10 or amendments thereto, filed with the Federal Deposit Insurance Corporation on March 17, 2004.)

Exhibit No. Exhibit
10.13 Employment Agreement, dated March 22, 2004, between Signature Bank and Joseph J. DePaolo. (Incorporated by reference to Signature Bank’s Registration Statement on Form 10 or amendments thereto, filed with the Federal Deposit Insurance Corporation on March 17, 2004.)
10.14 Master Agreement for the provision of Hardware Software and/or Services, dated as of September 9, 2005, between Fidelity Information Services, Inc. and Signature Bank. (Incorporated by reference to Signature Bank’s Quarterly Report on Form 10-Q for the period ended September 30, 2005.)
10.15 Letter Agreement, dated December 12, 2008, including Securities Purchase Agreement—Standard Terms incorporated by reference therein, between the Signature Bank and the United States Department of the Treasury. (Incorporated by reference to Signature Bank’s Current Report on Form 8-K filed on December 17, 2008.)
10.16 Side Letter, dated December 12, 2008, between the Signature Bank and the United States Department of the Treasury. (Incorporated by reference to Signature Bank’s Current Report on Form 8-K filed on December 17, 2008.)
10.17 Form of Senior Executive Officer Letter Agreement between the Signature Bank and the Senior Executive Officer. (Incorporated by reference to Signature Bank’s Current Report on Form 8-K filed on December 17, 2008.)
10.18 Form of Waiver from the Senior Executive Officer named therein. (Incorporated by reference to Signature Bank’s Current Report on Form 8-K filed on December 17, 2008.)
14.1 Code of Ethics (Incorporated by reference from Signature Bank’s 2004 Form 10-K, filed with the Federal Deposit Insurance Corporation on March 16, 2005.)
21.1 Subsidiaries of Signature Bank.
31.1 Certification of the Chief Executive Officer pursuant to Section 302 of the Sarbanes-Oxley Act of 2002.
31.2 Certification of the Chief Financial Officer pursuant to Section 302 of the Sarbanes-Oxley Act of 2002.
32.1 Certification of the Chief Executive Officer and Chief Financial Officer pursuant to Section 906 of the Sarbanes-Oxley Act of 2002.

EXHIBIT 21.1
SIGNATURE BANK
LIST OF SUBSIDIARIES AS OF FEBRUARY 26, 2010
(all subsidiaries are 100% owned by Signature Bank, except as indicated)
Subsidiary
State or Jurisdication
Under Which Organized
SB Insurance Agency, Inc. New YorkSignature Securities Group Corporation New YorkSignature Preferred Capital, Inc. (1) New YorkTandem CDE, Inc. New YorkSignature SP, LLC New YorkLG-6C Holdings, LLC New York
(1) Signature Bank owns 100% of Signature Preferred Capital, Inc. ("SPC") common shares and 88% of SPC preferred shares issued and outstanding as of February 26, 2010.

EXHIBIT 31.1
CERTIFICATION
I, Joseph J. DePaolo, certify that:
1. I have reviewed this annual report on Form 10-K of Signature Bank for the fiscal year ended December 31, 2009;
2. Based on my knowledge, this report does not contain any untrue statement of a material fact or omit to state a material fact necessary to make the statements made, in light of the circumstances under which such statements were made, not misleading with respect to the period covered by this report;
3. Based on my knowledge, the financial statements, and other financial information included in this report, fairly present in all material respects the financial condition, results of operations and cash flows of the registrant as of, and for, the periods presented in this report;
4. The registrant’s other certifying officer and I are responsible for establishing and maintaining disclosure controls and procedures (as defined in Exchange Act Rules 13a-15(e) and 15d-15(e)) and internal control over financial reporting (as defined in Exchange Act Rules 13a-15(f) and 15d-15(f)) for the registrant and have:
a) Designed such disclosure controls and procedures, or caused such disclosure controls and procedures to be designed under our supervision, to ensure that material information relating to the registrant, including its consolidated subsidiaries, is made known to us by others within those entities, particularly during the period in which this report is being prepared;
b) Designed such internal control over financial reporting, or caused such internal control over financial reporting to be designed under our supervision, to provide reasonable assurance regarding the reliability of financial reporting and the preparation of financial statements for external purposes in accordance with generally accepted accounting principles;
c) Evaluated the effectiveness of the registrant's disclosure controls and procedures and presented in this report our conclusions about the effectiveness of the disclosure controls and procedures, as of the end of the period covered by this report based on such evaluation; and
d) Disclosed in this report any change in the registrant's internal control over financial reporting that occurred during the registrant's most recent fiscal quarter (the registrant's fourth fiscal quarter in the case of an annual report) that has materially affected, or is reasonably likely to materially affect, the registrant's internal control over financial reporting; and
5. The registrant's other certifying officer and I have disclosed, based on our most recent evaluation of internal control over financial reporting, to the registrant's auditors and the Examining Committee of the registrant's Board of Directors (or persons performing the equivalent functions):
a) All significant deficiencies and material weaknesses in the design or operation of internal control over financial reporting which are reasonably likely to adversely affect the registrant's ability to record, process, summarize and report financial information; and
b) Any fraud, whether or not material, that involves management or other employees who have a significant role in the registrant's internal control over financial reporting.
Date: February 26, 2010
/s/ JOSEPH J. DEPAOLO
Joseph J. DePaolo
President, Chief Executive Officer and Director

EXHIBIT 31.2
CERTIFICATION
I, Eric R. Howell, certify that:
1. I have reviewed this annual report on Form 10-K of Signature Bank for the fiscal year ended December 31, 2009;
2. Based on my knowledge, this report does not contain any untrue statement of a material fact or omit to state a material fact necessary to make the statements made, in light of the circumstances under which such statements were made, not misleading with respect to the period covered by this report;
3. Based on my knowledge, the financial statements, and other financial information included in this report, fairly present in all material respects the financial condition, results of operations and cash flows of the registrant as of, and for, the periods presented in this report;
4. The registrant’s other certifying officer and I are responsible for establishing and maintaining disclosure controls and procedures (as defined in Exchange Act Rules 13a-15(e) and 15d-15(e)) and internal control over financial reporting (as defined in Exchange Act Rules 13a-15(f) and 15d-15(f)) for the registrant and have:
a) Designed such disclosure controls and procedures, or caused such disclosure controls and procedures to be designed under our supervision, to ensure that material information relating to the registrant, including its consolidated subsidiaries, is made known to us by others within those entities, particularly during the period in which this report is being prepared;
b) Designed such internal control over financial reporting, or caused such internal control over financial reporting to be designed under our supervision, to provide reasonable assurance regarding the reliability of financial reporting and the preparation of financial statements for external purposes in accordance with generally accepted accounting principles;
c) Evaluated the effectiveness of the registrant's disclosure controls and procedures and presented in this report our conclusions about the effectiveness of the disclosure controls and procedures, as of the end of the period covered by this report based on such evaluation; and
d) Disclosed in this report any change in the registrant's internal control over financial reporting that occurred during the registrant's most recent fiscal quarter (the registrant's fourth fiscal quarter in the case of an annual report) that has materially affected, or is reasonably likely to materially affect, the registrant's internal control over financial reporting; and
5. The registrant's other certifying officer and I have disclosed, based on our most recent evaluation of internal control over financial reporting, to the registrant's auditors and the Examining Committee of the registrant's Board of Directors (or persons performing the equivalent functions):
a) All significant deficiencies and material weaknesses in the design or operation of internal control over financial reporting which are reasonably likely to adversely affect the registrant's ability to record, process, summarize and report financial information; and
b) Any fraud, whether or not material, that involves management or other employees who have a significant role in the registrant's internal control over financial reporting.
Date: February 26, 2010 /s/ ERIC R. HOWELL
Eric R. Howell
Executive Vice President and Chief Financial Officer

EXHIBIT 32.1
Certification
Pursuant to 18 U.S.C. Section 1350
As Adopted Pursuant to
Section 906 of the Sarbanes-Oxley Act of 2002
Pursuant to section 906 of the Sarbanes-Oxley Act of 2002 (subsections (a) and (b) of section 1350, chapter 63 of title 18, United States Code), each of the undersigned officers of Signature Bank, a New York bank (the "Company"), does hereby certify, to the best of such officer's knowledge, that:
The Annual Report on Form 10-K for the year ended December 31, 2009 (the "Form 10-K") of the Company fully complies with the requirements of section 13(a) or 15(d) of the Securities Exchange Act of 1934 and information contained in the Form 10-K fairly presents, in all material respects, the financial condition and results of operations of the Company.
Dated: February 26, 2010
/s/ JOSEPH J. DEPAOLO
Joseph J. DePaolo
President, Chief Executive Officer and Director
Dated: February 26, 2010
/s/ ERIC R. HOWELL
Eric R. Howell
Executive Vice President and Chief Financial Officer
The foregoing certification is being furnished solely pursuant to section 906 of the Sarbanes-Oxley Act of 2002 (subsections (a) and (b) of section 1350, chapter 63 of title 18, United States Code) and is not being filed as part of the Form 10-K or as a separate disclosure document.

(This page has been left blank intentionally.)

Corporate Inform ation
BoardofDirectors
Scott A. ShayChairman of the Board Signature Bank
Kathryn A. ByrnePartner Weiser, LLP
Alfonse M. D’AmatoManaging Director Park Strategies, LLC Former U.S. Senator
Alfred B. DelBelloPartner DelBello Donnellan Weingarten Wise & Wiederkehr, LLP Former New York State Lieutenant Governor
Joseph J. DePaoloPresident & Chief Executive Officer Signature Bank
Yacov LevyManaging Partner KerenTwo, LLC
Jeffrey W. MeshelChairman & Founder Bintro
Frank R. Selvaggi, CPAFounding Partner Altman, Greenfield & Selvaggi, LLP
John TamberlaneVice Chairman Signature Bank
SeniorManagement
Scott A. ShayChairman of the Board of Directors
Joseph J. DePaoloPresident & Chief Executive Officer
John TamberlaneVice Chairman
Mark T. SigonaExecutive Vice President & Chief Operating Officer
Michael J. MerloExecutive Vice President & Chief Credit Officer
Eric R. HowellExecutive Vice President & Chief Financial Officer
Michael SharkeySenior Vice President & Chief Technology Officer
Peter S. QuinlanSenior Vice President & Treasurer
AdvisoryBoard
Stanley KreitmanDirector, Arbinet Corp. Director, Medallion Financial Corp. Director, Cap Lease Funding, Inc. Director, KSW Corp. Director, CCA Industries, Inc.
Lewis S. RanieriFounder & Managing Partner Hyperion Partners & Ranieri Partners
Michael SteinhardtRetired Hedge Fund Manager Philanthropist Founding Member, Steinhardt Partners
John P. SullivanManaging Director CapGen Financial
Locations
Manhattan261 Madison Avenue 300 Park Avenue 71 Broadway 565 Fifth Avenue 950 Third Avenue200 Park Avenue South 1020 Madison Avenue 50 West 57th Street111 Broadway (Accommodation Office)
Brooklyn 26 Court Street84 Broadway 6321 New Utrecht Avenue
Queens36-36 33rd Street, Long Island City 78-27 37th Avenue, Jackson Heights
Bronx 421 Hunts Point Avenue
Staten Island2066 Hylan Boulevard
Westchester 1C Quaker Ridge Road, New Rochelle 360 Hamilton Avenue, White Plains
Long Island 1225 Franklin Avenue, Garden City279 Sunrise Highway, Rockville Centre68 South Service Road, Melville923 Broadway, Woodmere40 Cuttermill Road, Great Neck 100 Jericho Quadrangle, Jericho
Signature Securities Group Institutional Trading(Services limited to institutional clients)
9 Greenway Plaza, Houston, TX 77046
CorporateHeadquarters
Signature Bank565 Fifth Avenue New York, NY 10017 646-822-1500 866-SIG-LINE (866-744-5463) www.signatureny.com
CounselPaul, Weiss, Rifkind, Wharton & Garrison LLP1285 Avenue of the Americas New York, NY 10019 212-373-3000
Independent AuditorsKPMG LLP 345 Park Avenue New York, NY 10154-0102 212-758-9700
Stock Transfer Agent & RegistrarAmerican Stock Transfer 59 Maiden Lane New York, NY 10038 212-936-5100
Stock Trading InformationThe Bank’s common stock is traded on the NASDAQ National Market under the symbol SBNY.
Annual MeetingThe annual meeting of stockholders will be held on Wednesday, April 21, 2010, 10:00 AM at:
The Roosevelt Hotel 45 East 45th Street New York, NY 10017 212-661-9600
Form 10-K A copy of Signature Bank’s Annual Report on Form 10-K filed with the FDIC is available without charge by download from www.signatureny.com, or by written request to:
Signature Bank Attention: Investor Relations 565 Fifth Avenue New York, NY 10017
Certain statements in this Annual Report that are not historical facts constitute “forward-looking statements” within the meaning of the Private Securities Litigation Reform Act of 1995. Such forward-looking statements are based on the Bank’s current expectations, speak only as of the date of this Annual Report and are susceptible to a number of risks, uncertainties and other factors. The Bank’s actual results, performance and achievements may differ materially from any future results, performance or achievements expressed or implied by such forward-looking statements. For those state-ments, the Bank claims the protection of the safe harbor for forward-looking statements con-tained in the Reform Act. See “Private Securities Litigation Reform Act Safe Harbor Statement” and “Item 1A. Business−Risk Factors,” appear-ing in the Bank’s Annual Report on Form 10-K for the fiscal year ended December 31, 2009, included herein.

565 Fifth Avenue
New York, NY 10017
866-SIG-LINE (866-744-5463) www.signatureny.com